Embed Size (px)
Citation preview

a costly and sometimes problematical interconnec-
Pacific Gas
control
to cer-
that it has
ces and
power
and that
its re-
usage con-
at the
house, a
plants
canal system, and at three district-owned natural
resources are supplemented through contracts
and geothermal sources, as well as short-term pur-
The Walnut Energy Center was erected
r
trial
ser
2005
ing 8
year,
unpr
grown
grew
fourth quarter of 2004 and the present day.
power plant technicians and others required
Walnut Energy Center. The District also had
Message from the General Manager
As this annual report reveals, 2005 was an especially meaningful year for
the Turlock Irrigation District for several significant reasons, not the least of
which was its certification and commencement of operations as an indepen
dent control area within the nation’s Western power grid.
On December 1, 2005, the District assumed full responibility for gen
erating, securing, scheduling and delivering all of its customers’ electrical
energy. Previously, the California Independent System Operator provided
scheduling services under
tion agreement with the
& Electric Co.
To achieve independent
area status, the District had
tify among other things
adequate generation resour
reserves to supply the total
demand of its customers
it has the ability to balance
sources with customer
tinuously. This is accomplished
with electricity generated
Don Pedro Dam & Power
string of small hydroelectric
on its extensive irrigation
gas-fired power plants. These
with hydroelectric, coal
chases from other wholesale suppliers.
Independent control area operations will save the District a substantial
amount of money over the years by eliminating certain charges that had been
imposed directly or indirectly by the statewide system operator for providing
the services the District is now performing for itself. Those charges were in
excess of $2 million per year and were subject to unpredictable increases.
Construction of TID’s third and largest natural gas-fired power plant, the
250-megawatt Walnut Energy Center, progressed steadily throughout 2005.
The project culminated in late February 2006 when the $200 million three
unit combined-cycle, combustion and condensing turbine generating plant
commenced commercial operations. The new plant virtually doubled the
amount of power the District was capable of generating for itself and further
cemented its self-sufficiency.
to accommodate the steady
esidential, commercial and indus
growth occurring within the
District’s 662-square-mile electric
vice area. Impressive figures for
showed energy sales increas
percent over the preceding
while the number of electric
accounts swelled by approximately
4,000 to more than 95,000.
In order to keep up with this
ecedented growth, TID has
organizationally as well. The
number of allocated staff positions
from 418 to 464 between the
Many of the jobs went to new
to maintain and operate the
to train and certify power con
trol center operators as required by the North American Electric Reliability
Council. In other areas, the District was successful in drawing highly quali
fied employees from within its service area to fill job vacancies created to
better serve our customers.
In April, the District resolved its long-standing dispute with the San
Francisco Public Utilities Commission (SFPUC) over the latter’s attempt to
�

� ©2006 Ron Niebrugge, Photographer
Steadfast and Sure

terminate a contract requiring it to deliver firm power to TID. In 2001, the
SFPUC moved to cancel a 1987 agreement that provided TID with low-cost
power year-round, even during months when San Francisco’s Hetch Hetchy
hydroelectric dams were not producing.
A settlement agreement reduced the financial risks for the SFPUC – which
took substantial losses during the 2001-2002 California energy crisis – while
continuing to provide TID with low-cost Hetch Hetchy system hydropower
for its agricultural pumping and municipal power needs as required under
a 1913 act of Congress. The SFPUC also agreed to continue making excess
Hetch Hetchy hydropower available to TID at attractive pricing. With the is
sue resolved, the parties have been able to move forward and resume a stable
and cordial business relationship.
The District also resolved a question raised by environmentalists over the
use of herbicides to control aquatic weed growth in unlined canals and later
als. The issue surfaced in February 2004 when environmentalists challenged
the use of chemical herbicides by TID and four other local irrigation districts
to control moss and algae that would choke canals and clog pipelines.
TID was able to show through a focused environmental impact study
that the chemical treatment of 37 miles of its unlined canals posed no prob
lem to the underlying groundwater, a major question raised by the environ
mental groups. In May 2006, a Sacramento Superior Court judge accepted
the findings of the environmental impact report and cleared the way for the
District to resume using chemical means to eliminate weeds.
In the intervening months, however, aquatic weed infestations became
particularly troublesome in the unlined canals where removal was limited to
labor intensive mechanical means including rakes that scoop the weeds up to
the side and deposit them on the bank to a large chain that is dragged by two
trucks astride the canal to dislodge weeds clinging to the sides and bottom.
While those measures kept the water flowing, the canals’ capacity was
reduced and weeds knocked loose during the processes were getting caught
on gates and valves, hindering efficient irrigation of fields.
Accumulated precipitation in the Tuolumne River watershed where the
District secures its irrigation water totaled 53 inches, or 148 percent of the
average as of July 2006, thus guaranteeing a full reservoir going into the sum
mer growing season. A full reservoir not only assures regular water allotments
to irrigators, it also allows the District to maximize hydroelectric generation
at Don Pedro’s hydroelectric project.
While the 2005-2006 water year is one of the more bountiful in TID
history, much of the precipitation arrived well after the usual end of the rainy
season, drenching fields and orchards and generally impeding growers’ abil
ity to get into their fields to plant. Instead of carrying water for irrigation
purposes, many of TID’s canals and laterals remained in service as they do
much of the winter for urban storm drainage.
In 2005 the District renewed its commitment to adding environmentally
friendly, renewable energy resources and encouraging customers to partici
pate in energy efficiency programs. As we looked to the future of both the
District and the energy industry, we acknowledge that the continued empha
sis on efficient and responsible use of all of our resources suits not just our
customers but also our region and our state.
All in all, 2005 was a vibrant year for the Turlock Irrigation District.
Throughout, TID reaffirmed its commitment to its diverse set of customers
to provide efficient, reliable and high quality services at the most competitive
rates possible. In so doing, the District’s contribution to a strong, stable and
growing local economy was immense.
Larry Weis, General Manager
�

�
On Course

As years go, 2005 was momentous for the Turlock Irrigation District as
actions and projects initiated months and even years earlier culminated to
buttress its autonomy and self-sufficiency as an independent retail electric
provider in one of the fastest growing regions of Central California.
The two most significant events that transpired during 2005 were the
approaching commissioning of a new 250-megawatt natural gas-fired power
coxswains carry out the captain’s instructions. They direct the activities of a
team of highly trained crewmembers responsible for everything from main
taining the vessel and its rigging at peak performance and seeing to the ship’s
stores and the needs of the many passengers.
A league from shore, the captain orders a leeward course correction to
steer clear of a violent squall brewing on the horizon. After several unevent
plant and becoming an autonomous electric service ful weeks at sea, the ship arrives safely at its destina
control area within the expansive Western Intercon- The two most tion and the captain deftly maneuvers it up to the pier
nection territory governed by the Western Electricity where the crew makes it fast with spring lines. As the
Coordinating Council. significant events that
passengers disembark and new ones come aboard, the
With one, the District’s portfolio of internal pow transpired during 2005 crew commences the routine tasks of making ready for
er production resources would nearly double, while
the other afforded more control over directing its enwere the approaching
another voyage.
This brief scenario is analogous to TID’s emergence
ergy resources. Both held the promise of improved commissioning of a new as a stand-alone, self-reliant public power utility that is
cost controls and further protection for District retail
electric customers from the volatility of an erratic and 250-megawatt natural
for the most part shielded from the capricious dictates
and interference from outside forces that threaten to
unpredictable energy marketplace. gas-fired power plant and undercut its long-standing strategic objectives of main-
In nautical terms, one might say the District becoming an taining strong local control and financial stability by
has attained the status of a “privileged ship” where owning and controlling adequate energy resources to
it no longer must “give way” to other vessels plying autonomous electric service serve the demands of its retail electric customers.
the high seas of the competitive energy market. Like control area. At TID, energy independence has always been an
a sleek three-masted staysail schooner of yesteryear, important strategic objective. And customers continue
TID is fully capable of casting off the life-support lines to reap the benefits of far-sighted policies and decisions
that made it dependent on others and setting sail on an extended passage
unfettered by outside constraints and demands.
As the schooner quietly clears the harbor, the captain shouts the com
mand to hoist the sails and shapes a flexible course that assures the passen
gers and crewmembers of a safe and successful voyage. No fewer than seven
that have come to exemplify the collective wisdom and commitment of the
District’s paid and elected leaders.
In achieving independent control area status, TID was able to sever its
operational and financial commitments to the California Independent System
Operator (Cal-ISO), which had provided those services for the District at a
�

�
Full Speed Ahead
©2003 Wojtek (Voytec) Wacowski | VOYTEC.COM

cost of approximately $2 million annually. Operating its own control area
also allowed the District to schedule surplus electric capacity on the power
grid and earn wholesale revenues in markets that had been closed to it while
Cal-ISO provided control area services. Of equal importance, TID is no lon
ger subject to power curtailment mandates as experienced during the energy
crisis of 2001 and 2002.
out the Western Electricity Coordinating Council’s 1.8 million square-mile
service territory.
The single largest expenditure was $750,000 for a new energy manage
ment system that generates the required calculations and performance sta
tistics required by the WECC and the North American Electric Reliability
Council (NERC). In addition, the newly installed program automatically con-
To have its own control area, the District had to trols the output of the District’s generating resources to
prove among other things that it possessed adequate accommodate customers’ energy demand at any given
resources to supply the total power demand of its cus moment – a requirement for all certified control areas.
tomers. Today, this is accomplished with power the Created in 1887, TID In the process of seeking certification, the District
District generates for itself at three natural gas-fired became a generator and created a second power control center as a back up to
power plants, its hydroelectric facilities at Don Pedro its existing control center located in central Turlock. The
Dam on the Tuolumne River and a string of small hy distributor of electricity in backup center is available in the event the District has
dro installations sited on its extensive irrigation canal to abandon the existing center in case of an emergency.
system. Additional energy is secured on the wholesale 1923 and today is among All of the District’s 12 power control center operators
market from outside providers under short- and long the fifty largest Public achieved NERC certification necessary to accommodate
term contracts. the demands required of Control Area members.
Created in 1887, TID became a generator and Power Electric systems in For the time being, the District is providing control
distributor of electricity in 1923 and today is among area services only within its existing electric service area
the fifty largest Public Power Electric systems in the the nation. but is open to opportunities that may arise in the future
nation. The District provides safe, affordable and reli to provide scheduling and other services to additional
able electric service to a customer base that currently utilities.
numbers in excess of 95,000 homes, farms and busi- While control area certification gave the District its
nesses in a 662-square-mile service area encompassing portions of Stanislaus,
Merced and Tuolumne counties.
In gearing up to operate its own control area, the District budgeted $1.4
million to pay for computer upgrades, salaries for additional employees,
training and myriad other things required of Control Area operators through
autonomy, the new Walnut Energy Center substantially increased its energy
self sufficiency and reduced its growing reliance on outside sources for elec
tricity to accommodate the energy needs of a swelling service area.
The three-unit combined-cycle, combustion and condensing turbine
generation plant was built at a cost of $200 million to accommodate the rapid
�

residential, commercial and industrial growth occurring inside the District, as
well as replace power being purchased under favorably priced long-term con
tracts that are beginning to expire. During its initial years of operation, the
plant will produce surplus power that the District can sell on the wholesale
market to help pay for the facility.
It is anticipated that the plant will save the District approximately
$350 million in power purchases from outside suppliers between 2006 and
2025. The exact amount will
depend on several variables, in
cluding the availability and price
variations of wholesale energy
and natural gas.
The Walnut Energy Center
is rated as among the cleanest
power generating facilities of
comparable size in the nation.
Its air emissions are as much as
85 percent lower than those of
older generating facilities cur
rently operating in California.
The plant is designed to use
treated effluent (recycled water)
from the City of Turlock’s Wastewater Treatment Plant for cooling and process
water needs.
This
©2006 Jeff Broome Photography
The new plant complements TID’s existing power generating portfolio
that includes hydroelectric facilities producing 154 megawatts at Don Pedro
Dam on the Tuolumne River and a string of small scale hydroelectric plants
on the District’s extensive irrigation canal system, as wll as two existing 49-
megawatt natural gas–fired plants – a base load plant and a peaking facility
– all located within the District’s 662-square-mile electric service area.
The District is continually on the lookout for other energy opportuni
ties. Among other things, it has an interest in a geothermal power plant in
Lake County and an entitlement to power generated at a coal-fired plant in
southeastern Oregon. In 2005, the District acquired an interest in a produc
ing natural gas field in Wyoming. The Pinedale purchase is expected to pro
vide the District between 1,200 to
4,600 MMBtu/day over 25 years.
represents on average 17
percent of the District’s estimated
natural gas needs to serve retail
electric load and 9 percent of the
Walnut Energy Center’s estimated
total natural gas needs within the
next 20 years. Based on current
information and market condi
tions, the Pinedale purchase could
save the District $18 million on a
net present value basis.
By carefully managing its own
resources and balancing them
with other existing and prospective new resources, the District is confident
it can continue to meet its customers’ growing energy demands for many
years to come.
Photo: Walnut Energy Center
�

�
General Manager
Robert Nees
Assistant General Manager
Assistant General Manager
Energy Resources
Casey Hashimoto
Assistant General Manager
Engineering & Operations
Martin Purdy
Assistant General Manager
Human Resources
Randy Baysinger
Assistant General Manager
Power Generation
Joe Malaski
Assistant General Manager
Financial Services
Steve Boyd
Assistant General Manager
Consumer Services & Government Relations
Management Team
Larry Weis
Water Resources & Regulatory Affairs
Ken Weisel

�0
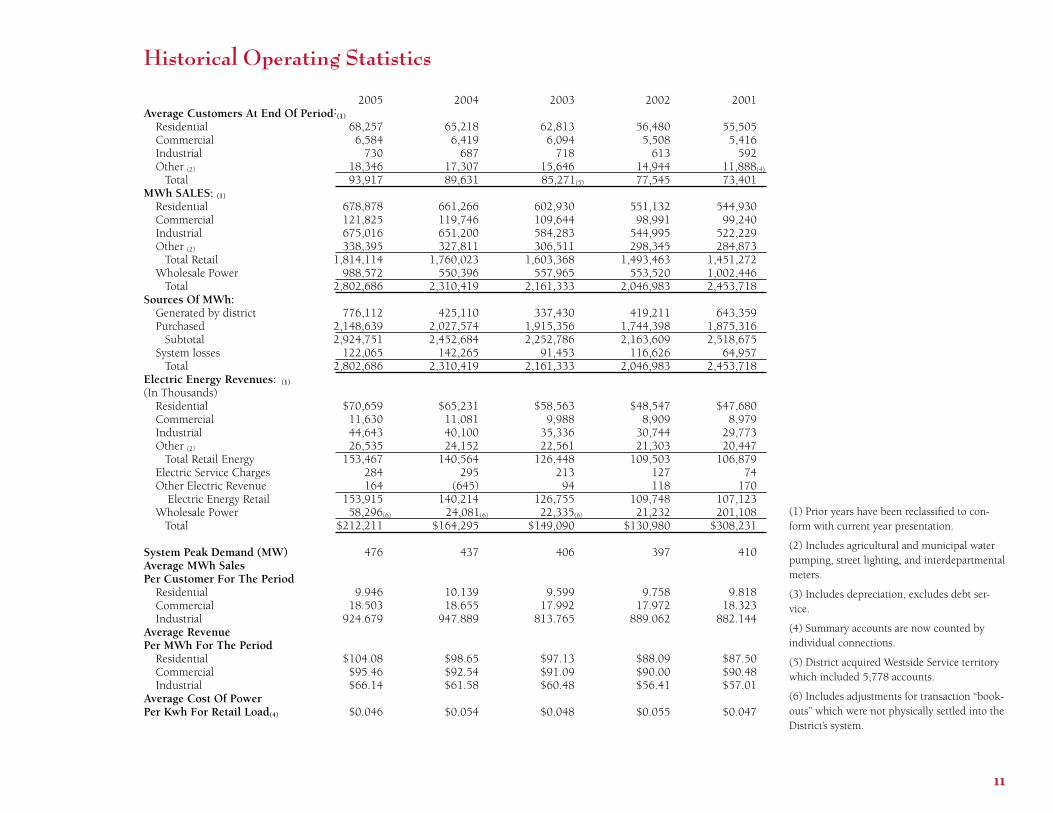
Historical Operating Statistics
2005 2004 2003 2002 2001 Average Customers At End Of Period:
(1)
Residential 68,257 65,218 62,813 56,480 55,505 Commercial 6,584 6,419 6,094 5,508 5,416 Industrial 730 687 718 613 592 Other (2) 18,346 17,307 15,646 14,944 11,888(4)
Total 93,917 89,631 85,271(5) 77,545 73,401 MWh SALES: (1)
Residential 678,878 661,266 602,930 551,132 544,930 Commercial 121,825 119,746 109,644 98,991 99,240 Industrial 675,016 651,200 584,283 544,995 522,229 Other (2) 338,395 327,811 306,511 298,345 284,873 Total Retail 1,814,114 1,760,023 1,603,368 1,493,463 1,451,272
Wholesale Power 988,572 550,396 557,965 553,520 1,002,446 Total 2,802,686 2,310,419 2,161,333 2,046,983 2,453,718
Sources Of MWh: Generated by district 776,112 425,110 337,430 419,211 643,359 Purchased 2,148,639 2,027,574 1,915,356 1,744,398 1,875,316 Subtotal 2,924,751 2,452,684 2,252,786 2,163,609 2,518,675
System losses 122,065 142,265 91,453 116,626 64,957 Total 2,802,686 2,310,419 2,161,333 2,046,983 2,453,718
Electric Energy Revenues: (1)
(In Thousands) Residential $70,659 $65,231 $58,563 $48,547 $47,680 Commercial 11,630 11,081 9,988 8,909 8,979 Industrial 44,643 40,100 35,336 30,744 29,773 Other (2) 26,535 24,152 22,561 21,303 20,447 Total Retail Energy 153,467 140,564 126,448 109,503 106,879
Electric Service Charges 284 295 213 127 74 Other Electric Revenue 164 (645) 94 118 170
Electric Energy Retail 153,915 140,214 126,755 109,748 107,123 Wholesale Power 58,296(6) 24,081(6) 22,335(6) 21,232 201,108 Total $212,211 $164,295 $149,090 $130,980 $308,231
System Peak Demand (MW) 476 437 406 397 410 Average MWh Sales Per Customer For The Period
Residential 9.946 10.139 9.599 9.758 9.818 Commercial 18.503 18.655 17.992 17.972 18.323 Industrial 924.679 947.889 813.765 889.062 882.144
Average Revenue Per MWh For The Period
Residential $104.08 $98.65 $97.13 $88.09 $87.50 Commercial $95.46 $92.54 $91.09 $90.00 $90.48 Industrial $66.14 $61.58 $60.48 $56.41 $57.01
Average Cost Of Power Per Kwh For Retail Load(4) $0.046 $0.054 $0.048 $0.055 $0.047
(1) Prior years have been reclassified to conform with current year presentation.
(2) Includes agricultural and municipal water pumping, street lighting, and interdepartmental meters.
(3) Includes depreciation, excludes debt service.
(4) Summary accounts are now counted by individual connections.
(5) District acquired Westside Service territory which included 5,778 accounts.
(6) Includes adjustments for transaction “bookouts” which were not physically settled into the District’s system.
����

Historical Results of Operations
(in thousands) 2005 2004 2003 2002 2001 Operating Revenues:
Electric energy - Retail $153,915 $140,214 $126,755 $109,748 $107,123 Electric energy - Wholesale 58,296(2) 24,081(2) 22,335(2) 21,232 201,108 Small Hydropower Other Electric Irrigation 6,105 5,603 5,191 5,392 5,172 Other 4,911 3,449 343(3) 103 16 Total Operating Revenue 223,227 173,347 154,624 136,475 313,419
Operating Expenses: Power Supply: Purchased Power 120,184(2) 103,074(2) 89,108(2) 72,766 215,010 Generation and Fuel 14,164 11,847 8,064 22,174(1) 44,686
Total Power Supply 134,348 114,921 97,172 94,940 259,696 Other Electric O&M 12,593 14,459 10,823 10,301(1) 10,099 Irrigation O&M 8,302 8,032 8,490 8,369 7,159 Public Benefits 3,133 2,855 2,102 1,677(1)
Administration and General 14,915 15,208 14,191 12,469 11,820 Depreciation and amortization 15,936 14,360 13,121 12,316 12,252 Total Operating Expenses 189,227 169,835 145,899 140,072 301,026
Operating Income (Loss) 34,000 3,512 8,725 (3,597) 12,393
Other Income (Expense): Interest 3,409 2,901 5,292(3) 7,423 10,164 Unrealized (Loss) Gain on Investments Miscellaneous 6,571 5,955 6,117(3) 4,094 3,506 Total Other Income 9,980 8,856 11,409 11,517 13,670
Interest Expense Long Term Debt 10,902 9,194 9,920 10,644 11,642 NCPA Obligation
Transfer (To) From Deferred Regulatory Credits 0 0 0(3) (1,220) (5,820)
Net Income (Loss) 33,078 3,174 10,214 (3,944) 8,601
Retained Earnings: Beginning of Year 272,225 269.051 258,837 262,781 254,180
(1) Revised 2002 to reflect Public Benefits End of Year $305,303 $272,225 $269,051 $258,837 $262,781 (2) Includes adjustments for transaction “book-
Debt Service Coverage Revenue Bonds/COP’s 2.71x 1.64x(4) 1.83x 1.36x 1.31x
outs” which were not physically settled into the District’s system.
(3) Revised 2004 to reflect changes in reporting format.
(4) Rate Stabilization transfer of $7,240.
��

Report of Independent Auditors
To the Board of Directors of
Turlock Irrigation District
In our opinion, the accompanying consolidated balance sheets and the related consolidated statements of revenues, expenses and changes in net assets and of cash flows present fairly, in all material aspects, the financial position of Turlock Irrigation District and its blended component unit (the “District”) at December 31, 2005 and 2004, and the results of their operations and their cash flows for the years then ended in conformity with accounting principles generally accepted in the United States of America. These financial statements are the responsibility of the District’s management. Our responsibility is to express an opinion on these financial statements based on our audits. We conducted our audits of these statements in accordance with auditing standards generally accepted in the United States of America. Those standards require that we plan and perform the audit to obtain reasonable assurance about whether the financial statements are free of material misstatement. An audit includes examining, on a test basis, evidence supporting the amounts and disclosures in the financial statements, assessing the accounting principles used and significant estimates made by management, and evaluating the overall financial statement presentation. We believe that our audits provide a reasonable basis for our opinions.
The management’s discussion and analysis included on pages 13 through 16 is not a required part of the basic financial statements but is supplementary information required by the Governmental Accounting Standards Board. We have applied certain limited procedures, which consisted principally of inquiries of management regarding the methods of measurement and presentation of the required supplementary information. However, we did not audit the information and express no opinion on it.
May 19, 2006
Management’s Discussion & AnalysisThe following management’s discussion and analysis of the Turlock Irrigation District (the “District”) and its financial performance provides an overview of the District’s financial activities for the years ended December 31, 2005 and 2004. This management’s discussion and analysis should be read in conjunction with the District’s financial statements and accompanying notes, which follow this section.
Background The District is an irrigation district organized under the provisions of the Irrigation District Act and has the powers provided therein. Organized in 1887, the District was the first of 65 irrigation districts to be formed in the State of California. The Board of Directors (the “Board”) governs the District. The five members of the Board are elected from geographic divisions of the District for staggered four-year terms. The Board appoints a general manager and certain other senior managers who are responsible for the operations of the District.
Since 1923, the District has provided all the electric service within its 425 square-mile service area, which includes portions of Stanislaus, Merced and Tuolumne counties. The District’s service area includes the cities of Turlock, Ceres, Hughson and a part of Modesto and the unincorporated communities of Keyes, Denair, Hickman, Delhi and Hilmar.
In December 2003, the District and completed the acquisition of PG&E’s electric distribution facilities in a portion of the west side of Stanislaus County, including the City of Patterson, the community of Crows Landing and certain adjacent rural areas (collectively, the “Westside”). The Westside covers approximately 237 square miles and includes 7,713 electric customer accounts.
To provide electric service within its service area, the District owns and operates an electric system, which includes generation, transmission and distribution facilities. Its generating facilities include hydroelectric units and oil and gas-fired facilities. The District also purchases power and transmission service from other sources and participates in other utility arrangements.
The District also supplies water for irrigation use within 308 square miles of its service area, comprising approximately 5,800 parcels of land and 250 miles of gravity flow canals and laterals. The District’s electric and irrigation systems are operated and accounted for as a single entity, hence, revenues from both systems are available to pay the obligations of the District.
Rates and Charges The District’s Board has full and independent authority to establish revenue levels and rate schedules for all electric service provided by the District. The District is not subject to retail rate regulation by any State or federal regulatory body, and is empowered to set retail rates effective at any time. The District has maintained rates for electric service that have been sufficient to provide for all operating and maintenance costs and expenses, debt service, repairs, replacements and renewals and to provide for base capital additions to the system. The Board fixes rates and charges of the District based on a cost of service methodology.
The District increased electric rates by an average of 5.00% effective February 1, 2005.
The District has a credit requirement for all new service connections, which requires new customers to verify their good credit standing with their former electric utility provider or to place a deposit with the District if an acceptable credit standing cannot be verified.
��

Financial Reporting The District maintains its accounts in accordance with generally accepted accounting principles for proprietary funds as prescribed by the Governmental Accounting Standards Board (GASB), and where not in conflict with GASB pronouncements, accounting principles prescribed by the Financial Accounting Standards Board (FASB). The District’s accounting records generally follow the Uniform System of accounts for public utilities and licensees prescribed by the Federal Energy Regulatory Commission (FERC), except as it relates to the accounting for contributed property.
In accordance with Statement of Financial Accounting Standards (SFAS) No. 71, Accounting for the Effects of Certain Types of Regulation, the Board has taken various regulatory actions for ratemaking purposes that result in the deferral of revenue or expense recognition. At December 31, 2005 and 2004, the District had a regulatory asset of $1.9 million and $2.9 million, respectively, in connection with costs incurred in the District’s acquisition of the Westside facilities from PG&E. At December 31, 2005 and 2004, the District had total regulatory credits of $24.7 million and $23.6 million, respectively, consisting primarily of electric rate stabilization of $21.1 and $21.1 million for 2005 and 2004, respectively. The regulatory assets and credits will be recognized in the statement of revenues, expenses and changes in net assets when determined by the Board for ratemaking purposes.
Investment Policies and Procedures The Board reviews the investment policy on an annual basis. The District also has an Investment Committee, comprised of the Treasurer, Deputy Treasurer, General Manager and two members of the Board. This committee meets on an as-needed basis to review issues related to the District’s investments. The District has contracted with Public Financial Management, Inc. (PFM), a leading investment manager of public entity funds, to invest its cash. PFM only purchases investments on behalf of the District which are permitted by the District’s investment policy. The Bank of New York Western Trust Company holds these investments in custody.
Debt Management Program The District regularly reviews its debt structure, which includes the issuance of refunding bonds to achieve debt service savings. From 1986 through 2003, the District has undergone six refundings comprising a major portion of its debt to achieve debt service savings. In July 2003, the District refunded $35.2 million of its debt to achieve debt service savings of $11.1 million.
Using This Financial Report This annual financial report consists of management’s discussion and analysis and the financial statements, including notes to the financial statements. The annual financial report reflects the activities of the District primarily funded through the sale of energy, transmission, and distribution services to its retail and wholesale customers, as well as irrigation services.
Component Unit The Walnut Energy Center Authority (the “Authority”) was formed in 2004 for the purposes of developing and operating a 250 MW natural gas fueled generation facility located in the District’s service territory. Although the Authority is a separate legal entity from the District, it is blended into and reported as part of the District because of the extent of its operational and financial relationship with the District. Accordingly, all operations of the Authority are consolidated into the District’s financial statements.
Consolidated Balance Sheets, Consolidated Statements of Revenues, Expenses and Changes in Net Assets, and Consolidated Statements of Cash Flows The consolidated balance sheets include all of the District’s assets and liabilities, using the accrual basis of accounting, as well as information about which assets can be utilized for general purposes, and which assets are restricted as a result of bond covenants and other commitments. The consolidated statements of revenues, expenses, and changes in net assets report all of the revenues and expenses during the time periods indicated. The consolidated statements of cash flows report the cash provided and used by operating activities, as well as cash payments for debt service and capital expenditures and cash proceeds or uses from investment activities.
Summary of Financial Position and Changes in Net Assets (dollars in thousands)
2005 2004 2003 Assets Utility plant, net Cash and investments Other non-current assets Other current assets
$632,441 $510,100 $398,345 170,789 222,920 119,379
8,953 11,754 9,046 45,016 29,479 28,975
$857,199 $774,253 $555,745 Liabilities and Net Assets Long-term debt $412,107 $420,659 $220,339 Other non-current liabilities
and deferred credits 33,230 30,747 33,003 Other current liabilities 106,559 50,622 33,352
Total liabilities 551,896 502,028 286,694 Net assets:
Invested in capital assets, net of related debt 214,875 209,498 222,551 Restricted 9,020 16,043 6,450 Unrestricted 81,408 46,684 40,050 Total net assets 305,303 272,225 269,051
$857,199 $774,253 $555,745
Revenue, Expenses and Changes in Net Assets Operating revenues $223,227 $173,347 $154,624 Operating expenses (189,227) (169,835) (145,899)
Operating income 34,000 3,512 8,725
Investment income 3,409 2,901 5,292 Other income, net 6,571 5,955 6,117 Interest expense (10,902) (9,194) (9,920)
Net increase in net assets 33,078 3,174 10,214
Net assets, beginning of year 272,225 269,051 258,837 Net assets, end of year $305,303 $272,225 $269,051
��

Management’s Discussion and Analysis as of and for the Year Ended December 31, 2005 Assets Utility Plant The District has invested approximately $632.4 million in utility plant assets and construction in progress, net of accumulated depreciation at December 31, 2005. Net utility plant makes up 74% of the District’s assets at December 31, 2005, compared to 66% in the prior year. The following chart shows the breakdown of net utility plant by major plant category at December 31, 2005 - generation, transmission,
Natural Gas Other 6% distribution, natural gas supply, unamortized fu- Supply 5%
Generation54%
ture power rights, irrigation and other: Irrigation 6%
During 2005, the District capitalized $138.5 mil- Unamortized Future Power
lion of additions to utility plant, including addi- Rights 2%
tions to construction work in progress. The primary increase was in generation plant and reflects the Distribution
21% costs of approximately $74.4 million for the 250 megawatt (MW), gas-fired Walnut Energy Center Transmission 6% project (the “Project”). The Project achieved commercial operation on February 28, 2006 with a total cost of $215.2 million, including capitalized interest. The District invested $34.6 million in natural gas fields in order to hedge the cost of fuel supply for the project. The District also invested $1.8 million for communication lines and $6.0 million to upgrade certain transmission and distribution assets, $4.8 million for substation construction and $9.7 million for routine expansion which consists of transformers, T&D lines, meters, lights, and new services.
Cash and Investments The District’s cash and investments decreased $52.1 during 2005. This was primarily due to the construction of the Walnut Energy Center.
Other Non-current Assets Other non-current assets decreased $2.8 million. This increase was primarily due to amortization of District assets totaling $1.3 million, change in regulatory assets of $.9 million and the collection of a long term receivable totaling $.6 million.
Other Current Assets Other current assets in 2005 increased $15.5 million when compared to 2004. This was primarily due to an increase of wholesale energy receivables of $6.6 million due to an increase in wholesale revenues, an increase in re-
Interest Principallated financial derivative instrument, primarily 30000
gas related, of approximately $6.9 million, a $1.5 million increase in prepaid expenses and 25000
a $.4 million increase in accrued interest due to higher interest rates. 20000
Liabilities And Changes In Net Assets 15000
Long-term Debt Long-term debt decreased $8.6 million in 2005. 10000
This was primarily the result of scheduled principal payments of $8.6 million. 5000
The following table shows the District’s future 0
2006 2007 2008 2009 2010debt service requirements from 2006 through
2010 at December 31, 2005 (dollars in thousands):
At December 31, 2005, the District’s bond ratings are A1 from Moody’s, A+ from Fitch and A+ from Standard and Poor’s.
Other Non-current Liabilities and Deferred Credits Other non-current liabilities and deferred credits increased $2.5 million in 2005. The increase was primarily due to the District recording a long-term financial derivative investment of $1.1 million primarily relating to the value of an electric related contract entered into in September 2005, a $1.1 million increase in public benefits deferred credit and an increase in the District’s share of the Transmission Agency of Northern California obligation of $.3 million.
Other Current Liabilities Other current liabilities increased $55.9 million in 2005. This was primarily the result of the District issuing taxable commercial paper of $32.8 million for investment in gas fields and tax exempt commercial paper of $20.0 million for completion of the Project and an increase in related financial derivative instruments, both gas related and electricity related, of approximately $3.2 million
Changes In Net Assets Operating Revenues Operating revenues increased $49.8 million from $173.3 million in 2004 to $223.2 million in 2005. Wholesale revenues increased $34.2 million from $24.0 million in 2004 to $58.2 million in 2005 as a result of an approximate 80.6% increase in volumes sold, an increase in the average sales price of approximately 9.1% from an average of approximately $67/MWh in 2004 to$73/MWh in 2005. Retail power revenues were up $13.7 million due to a 5.0% rate increase and a 3% increase in consumption as a result of customer growth from 89,631 in 2004 to 93,917 in 2005. The District had wholesale gas revenues of approximately $3.5 million in 2005 as a result of their investment in a natural gas field compared to $0 wholesale gas revenues in 2004.
Operating Expenses Purchased power, generation and fuel expenses were $134.3 million in 2005 compared to $114.9 million in 2004. Purchased power costs increased by approximately 18.3% due to higher prices during 2005 and higher volumes of power purchases required as a result of increased retail consumption (see operating revenues above). The District’s generation increased approximately 82.6% from 425,111 MWh in 2004 to 776,112 MWh in 2005 due to improved hydro conditions and the relatively high price for power relative to the price of gas, which made it more economical for the District to generate with its thermal plants, rather than purchase from the electric market, during certain periods. The District’s other operating expenses remained relatively unchanged.
Investment Income Investment income in 2005 was $.5 million higher than in 2004, primarily as a result of higher interest rates in 2005.
Other Income Other income is up $.6 million in 2005 when compared to 2004. This increase is the result of $.6 million increase in contribution in aid of construction.
Interest Expense Interest expense in 2005 was $1.7 million higher than in 2004, primarily due to higher variable interest rates and the addition of $52.6 million in commercial paper.
��

Management’s Discussion and Analysis as of and for the Year Ended December 31, 2004 Assets Utility Plant The District has invested approximately $510.1 million in utility plant assets and construction work in progress, net of accumulated depreciation at December 31 2004. Net utility plant makes up 66% of the District’s assets at December 31, 2004, compared to 72% in the prior year. The following chart shows the breakdown of net utility plant by major plant category at December 31, 2004 - generation, transmission, distribution, unamortized future power rights, irrigation and other: Other 8%
During 2004, the District capitalized $126.7 Irrigation
Generation52%
7% million of additions to utility plant, including Unamortized
Future Power additions to construction work in progress. The Rights 3%primary increase was in generation plant and reflects the costs of approximately $96.2 million Distribution for the 250 megawatt (MW), gas-fired Walnut 23%
Energy Center project (the “Project”). The District also invested $1.0 million for communi- Transmission 7%
cation lines and $9.9 million to upgrade certain transmission and distribution assets, $3.6 million for substation construction and $5.7 million for construction of a 115 kilovolt transmission line.
Cash and Investments The District’s cash and investments increased $103.5 million during 2004. This was due primarily to the 2004 revenue bond financing of $201.1 million for the Project.
Other Non-current Assets Other non-current assets increased $2.7 million. This was primarily due to the issue costs related to the 2004 revenue bond financing of $3.7 million. Amortization of District assets, Westside deferred regulatory asset and refunding losses totaled $1.1 million.
Other Current Assets Other current assets in 2004 remained generally consistent with 2003.
Liabilities And Changes In Net Assets Long-term Debt Long-term debt increased $200.3 million in 2004. This was the result of the $201.1 Interest Principal
30000million revenue bond financing. The District recorded a $7.2 million premium related to
25000 the 2004 financing. There were scheduled principal payments of $8.1 million.
20000
The following table shows the District’s future debt service requirements from 2005 through 15000
2009 at December 31, 2004 (dollars in thousands): 10000
At December 31, 2004, the District’s bond rat5000
ings are A1 from Moody’s, A+ from Fitch and A+ from Standard and Poor’s. 0
2005 2006 2007 2008 2009
Other Non-current Liabilities and Deferred Credits Other non-current liabilities and deferred credits decreased $2.3 million in 2004. The District’s share of the Transmission Agency of Northern California obligation decreased $0.9 million in 2004. There was a $1.2 million decrease due to the FAS 133 valuation regarding forward energy/gas contracts at December 31, 2004, and $0.2 million in other minor changes.
Other Current Liabilities Other current liabilities increased $17.3 million in 2004. Purchase Power Accounts Payable increased $1.0 million over 2003. Accounts payable and accrued expenses are up $9.8 million due to general operating expenses and Walnut Energy construction costs. Customer advances are up $1.7 million due to change in deposit policy and customer growth. Accrued Interest Payable is up $4.7 million due to 2004 revenue bond financing. The current portion of derivative financial instruments decreased $0.2 million.
Changes In Net Assets Operating Revenues Operating revenues increased $18.7 million from $154.6 million in 2003 to $173.3 million in 2004. Wholesale revenues increased $1.8 million from $22.3 million in 2003 to $24.1 million in 2004 as a result of an approximate 1.5% increase in volumes sold, and more importantly, an increase in the average sales price of approximately 7.5% from an average of approximately $54/MWh in 2003 to $58/MWh in 2004. Retail power revenues were up $16.6 due primarily to an 11.6% increase in consumption as a result of customer growth from 85,271 in 2003 to 89,631 in 2004 and the addition of the Westside acquisition in December 2003. Average rates were slightly higher in 2004 since the 2003 rate increase did not impact rates for all of 2003.
Operating Expenses Purchased power, generation and fuel expenses were $114.9 million in 2004 compared to $97.2 million in 2003. Purchased power costs increased by approximately 15.7% due to slightly higher prices during 2004 and higher volumes of power purchases required as a result of increased retail consumption (see Operating Revenues above). The District’s generation increased approximately 26% from 337,430 MWh in 2003 to 425,111 MWh in 2004 due to improved hydro conditions and the relatively high price for power relative to the price for gas, which made it more economical for the District to generate with its thermal plants, rather than purchase from the electric market, during certain periods. The District’s other operating expenses are up $6.1 million due to a $0.8 million increase in public benefits expenditures, an increase of $3.6 million in other electric expenses, an increase of $1.2 million in depreciation expenses, a $1.0 million increase in general and administrative expenses, offset by a decrease in irrigation expenses of $0.5 million.
Investment Income Investment income in 2004 was $2.4 million lower than in 2003 as a result of less cash and reserve funds, lower investment yields and a realized gain on the sale of investments of $1.1 million in 2003.
Interest Expense Interest expense in 2004 was $0.7 million lower than in 2003, primarily due to capitalization of interest related to the Project and other District assets during construction.
Other Income Other income in 2004 was $0.2 million lower than 2003, primarily due to a decrease in property tax revenue.
��

Balance Sheets December 31, 2005 and 2004 (dollars in thousands)
Assets Utility plant, net Investments and other long-term assets:
Long-term investments, including restricted amounts Debt issuance costs and other assets Deferred regulatory asset
Current assets: Cash and cash equivalents, including restricted amounts Short-term investments, including restricted amounts Retail accounts receivable, net Wholesale accounts receivable, net Accrued interest and other receivables Materials and supplies Prepaid expenses and other current assets Derivative financial instruments
Total assets Capitalization and Liabilities Capitalization:
Net assets:Invested in capital assets, net of related debtRestrictedUnrestricted
Total net assetsLong-term debt, net of current portion
Total capitalizationLiabilities and deferred credits:
Deferred regulatory credits Derivative financial intruments, net of current portion Affiliate obligation
Current liabilities:Commercial paper notesCurrent portion of long-term debtPower purchases payableAccounts payable and accrued expensesAccrued salaries, wages and related benefitsCustomer deposits and advancesAccrued interest payableCurrent portion of derivative financial instruments
Commitments and contingencies (Notes 4, 11, 12, and 13) Total net assets and liabilities
The accompanying notes are an integral part of these financial statements.
2005 2004
$632,441 $510,100
76,470 67,210 7,022 8,863 1,931 2,891
85,423 78,964
80,581 106,843 13,738 48,867 11,511 11,223 11,887 5,458
2,413 2,032 2,793 2,676 7,155 5,653 9,257 2,437
139,335 185,189 $857,199 $774,253
$214,875 $209,498 9,020 16,043
81,408 46,684 305,303 272,225 404,747 412,059 710,050 684,284
24,690 23,604 1,138 -7,402 7,143
33,230 30,747
52,569 -7,360 8,600
14,280 11,005 13,485 15,956
5,822 5,589 7,721 7,088 7,867 9,388 4,815 1,596
113,919 59,222
$857,199 $774,253
����

Statements of Revenues, Expenses & Changes in Net Assets
For the years ended December 31, 2005 and 2004 (dollars in thousands)
2005 2004 Operating revenues:
Electric: Retail $153,915 $140,214 Wholesale 58,296 24,081
Irrigation 6,105 5,603 Wholesale Gas 3,519 -Other 1,392 3,449
223,227 173,347
Operating expenses: Purchased power 120,184 103,074 Generation and fuel 14,164 11,847 Other electric 12,593 14,459 Irrigation 8,302 8,032 Public benefits 3,133 2,855 Administration and general 14,915 15,208 Depreciation and amortization 15,936 14,360
189,227 169,835 Operating income 34,000 3,512
Nonoperating revenues and expenses: Investment income 3,409 2,901 Other income, net 6,571 5,955 Interest expense (10,902) (9,194)
(922) (338)
Net increase in net assets 33,078 3,174
Net assets - beginning of year 272,225 269,051 Net assets - end of year $305,303 $272,225
The accompanying notes are an integral part of these financial statements.
��

Statements of Cash Flows For the years ended December 31, 2005 and 2004 (dollars in thousands)
2005 2004 2005 2004 Cash flows from operating activities: Supplemental schedule of cash flows from
Receipts from electric customers $153,168 $143,843 operating activities: Receipts from wholesale power sales 56,611 32,606 Operating income $34,000 $3,512 Receipts from irrigation customers 7,476 9,722 Adjustments to reconcile operating income to Receipts from sales of gas 1,366 - net cash provided by operating activities: Payments to vendors for purchased power Depreciation and amortization 15,936 14,360
and fuel (125,916) (114,857) Derivative financial instruments (2,463) (3,841) Payments to employees and vendors for Other 1,976 1,922
generation and other electric (25,157) (25,981) Changes in operating assets and liabilities: Payments to employees and vendors for irrigation (8,373) (7,929) Accounts receivable (6,952) 2,877 Payments to employees and vendors for Materials and supplies (117) (683)
administration and general (13,803) (13,130) Prepaid expenses and other current assets (1,502) (560) Other receipts, net 671 5,409 Other assets 1,190 494
Net cash provided by operating activities 46,043 29,683 Regulatory assets and credits 2,046 (182) Power purchases payable 3,275 942
Cash flows from capital and related financing activities: Accounts payable and accrued expenses (2,471) 8,967 Acquisition and construction of capital assets (130,979) (120,287) Accrued salaries, wages and related benefits 233 1,166 Proceeds from contributions in aid of construction 4,595 4,033 Customer deposits and advances 633 1,660 Repayment of long-term debt (8,600) (8,135) Affiliate obligation 259 (951) Proceeds from issuance of long-term debt - 204,422 Net cash provided by operating activities $46,043 $29,683 Proceeds from issuance of commercial paper 52,569 -Interest payments on long-term debt (19,022) (9,376)
Net cash (used in) provided by capital and related financing activities (101,437) 70,657
Cash flows from investing activities: Investment income 3,263 3,201 Sales (purchases) of investments, net 25,869 (42,985)
Net cash provided by (used in) investing activities 29,132 (39,784)
Net (decrease) increase in cash and cash equivalents (26,262) 60,556 Cash and cash equivalents, beginning of year 106,843 46,287 Cash and cash equivalents, end of year $80,581 $106,843
The accompanying notes are an integral part of these financial statements.
��

Notes to Consolidated Financial Statements (dollars in thousands)
1. Organization and Description of Business The Turlock Irrigation District (the “District”) was organized under the Wright Act in 1887 and operates under the provisions of the California Water Code as a special district of the State of California. As a public power utility, the District is not subject to regulation or oversight by the California Public Utilities Commission (CPUC). The District provides electric power and irrigation water to its customers.
The District’s Board of Directors (the “Board”) determines its rates and charges for its commodities and services. The District levies ad valorem property taxes on property located in the counties of Stanislaus and Merced. The District may also incur indebtedness, including issuing bonds, and is exempt from payment of federal and state income taxes.
2. Summary of Significant Accounting Policies Method of Accounting The District maintains its accounts in accordance with generally accepted accounting principles for proprietary funds as prescribed by the Governmental Accounting Standards Board (GASB), and where not in conflict with GASB pronouncements, accounting principles prescribed by the Financial Accounting Standards Board (FASB). The District’s accounting records generally follow the Uniform System of accounts for public utilities and licensees prescribed by the Federal Energy Regulatory Commission (FERC), except as it relates to the accounting for contributions in aid of construction (CIAC).
Component Unit The Walnut Energy Center Authority (the “Authority”), is a 250 MW natural gas fueled generation facility, which achieved commercial operations on February 28, 2006. Although the Authority is a separate legal entity from the District, it is blended into and reported as part of the District because of the extent of its operational and financial relationship with the District. Accordingly, all operations of the Authority are consolidated into the District’s financial statements.
Use of Estimates The preparation of financial statements in conformity with accounting principles generally accepted in the United States of America requires management to make estimates and assumptions that affect the reported amounts of assets and liabilities and disclosure of contingent assets and liabilities at the date of the financial statements and the reported amounts of revenues and expenses during the reporting period. Actual results could differ from those estimates.
Utility Plant Utility plant is recorded at cost. The cost of additions, renewals and betterments are capitalized; repairs and minor replacements are charged to operating expenses as incurred. Interest and related financing costs are capitalized as a component of major utility plant development projects. The District capitalized $7,298 and $5,829 of interest during 2005 and 2004, respectively.
Depreciation is computed using the straight-line method over the estimated useful lives, which generally range from 20 to 40 years and 40 to 150 years for electric and irrigation related assets, respectively. The estimated useful lives of furniture, fixtures, equipment and other assets range from 5 to 25 years. Upon retirement, the cost of depreciable utility plant, plus removal costs, less salvage, is charged to accumulated depreciation.
Future power rights are costs incurred by the District in development of hydroelectric facilities owned by others who provide power to the District. Such costs are recorded as a component of utility plant and are being amortized on a straight-line basis over the 49-year periods to which these rights apply.
Investments in Gas Properties In July 2005, the District acquired an approximate 10.6 percent non-operating ownership interest in gas producing properties located near Pinedale, Wyoming for $34.6 million. The District uses the successful efforts method of accounting for its investment in gas producing properties. Costs to drill and equipment development wells are capitalized as a component of property, plant, and equipment on the balance sheet. Costs to drill wells that do not find economically recoverable reserves are expensed. The capitalized costs of producing gas properties, after considering estimated residual salvage values, are depleted by the unit-of-production method based on the estimated future production of proved and probable reserves through the year 2034.
Gas production from the District’s share of these properties is sold to wholesale buyers as an economic hedge to offset the net cost of the District’s gas supply costs. Sales in 2005 totaled $3.5 million.
Cash, Cash Equivalents and Investments Cash equivalents include all debt instruments with original maturity dates of three months or less from the date of purchase and all investments in the Local Agency Investment Fund (LAIF). The debt instruments are reported at amortized cost and the LAIF is reported at the value of its pool shares.
All investments are carried at their fair market value, generally based on market prices quoted by dealers for those or similar investments. Investment income includes both realized gains and losses and unrealized changes in the fair market value of investments, unless deferred as a regulatory asset or credit.
In accordance with provisions of the credit agreements relating to the District’s long-term debt obligations, restricted funds held by trustees have been established to provide for certain debt service and project funding requirements. The restricted funds held by trustees are invested primarily in United States (U.S.) government securities and related instruments with maturities no later than the expected date of the use of such funds.
Participation in Joint Power Authorities The District’s ownership investments in joint power authorities (JPAs) represent less than 20% ownership interests, and therefore, are accounted for using the cost method.
Debt Issuance Costs Costs incurred in connection with the issuance of debt obligations, principally underwriters’ and legal fees, are capitalized as debt issuance costs and are amortized, as a component of interest expense, over the terms of the related obligations using the effective interest method.
Accounts Receivable and Allowance for Doubtful Accounts Accounts receivable arise from billings to customers for the sale of power and water, and certain improvements made to customers’ properties. Accounts receivable also includes an estimate for unbilled revenues related to power delivered between the last billing and the last day of the reporting period, which amounted to $5,911 and $5,540 at December 31, 2005 and 2004, respectively.
�0

The District recognizes an estimate of uncollectible accounts for its retail and wholesale receivables based upon its historical experience with collections and current market conditions. At December 31, 2005 and 2004, the allowance for doubtful accounts relating to retail electric receivables totaled $150 and $574, respectively. At December 31, 2005 and 2004, the allowance on the wholesale receivables of $3,820 relates primarily to collectibility issues resulting from the uncertain California wholesale energy markets. The District records bad debt expense related to electric service and wholesale activities as administration and general in the statements of revenues, expenses and changes in net assets. In 2005 and 2004, bad debt expense relating to uncollectible accounts receivable was $32 and $287, respectively.
Materials and Supplies Materials and supplies are used in the District’s operations and are recorded at average cost.
Long-term Debt Long-term debt is recorded at the principal amounts of the obligations adjusted for original issue discounts and premiums. The premiums and discounts on bonds issued are amortized over the terms of the bonds using the effective interest method as a component of interest expense.
Debt defeasance charges result from debt refunding transactions and comprise the difference between the reacquisition costs and the net outstanding debt balances including deferred costs of the defeased debt at the date of the defeasance transaction. Such charges are included as a component of long-term debt and amortized as a component of interest expense over the shorter of the life of the refunded debt or the new debt, using the effective interest method.
Deferred Regulatory Asset and Credits The District’s Board has the authority to establish the level of rates charged for all District services. As a regulated entity, the District’s financial statements are prepared in accordance with Statement of Financial Accounting Standards (SFAS) No. 71, Accounting for the Effects of Certain Types of Regulation, which requires the effects of the rate making process be recorded in the financial statements. Accordingly, certain expenses and income, normally reflected in operations as incurred, are recognized when included in rates and recovered from or refunded to customers as set forth in rate actions taken by the Board.
Self-insurance Liability Substantially all of the District’s assets are insured against possible losses from fire and other risks. The District carries insurance coverage to cover general claims in excess of $1,000 per occurrence, worker’s compensation claims in excess of $500 per occurrence and medical, dental and vision claims collectively in excess of $125 per employee. The District also has liability insurance for general claims in excess of $35,000. The District records liabilities for unpaid claims when they are probable of occurrence and the amount can be reasonably estimated. The accompanying financial statements include accrued expenses for general liability, workers’ compensation and medical, dental and vision claims based on the District’s best estimates of the ultimate cost of settling outstanding claims and claims incurred, but not reported. At December 31, 2005 and 2004, the District’s estimated self-insurance liability totaled $1,149 and $1,209, respectively, and is reported as a component of accounts payable and accrued expenses in the consolidated balance sheets.
Gas Price Swap and Option Agreements The District uses forward purchase agreements, swaps and option agreements to hedge the impact of market volatility on gas prices for its gas fueled power plants. Expenses under the contracts, net of the payments received, are reported as a component of generation and fuel
expense, in the period in which the underlying gas and power deliveries occur.
Derivative Financial Instruments The District records derivative financial instruments, consisting of gas swap price agreements, option agreements, and gas and electricity purchase and sales agreements that are not treated as normal purchases and normal sales, at fair value on its balance sheets with the corresponding entry recorded in the consolidated statements of revenues, expenses and changes in net assets. The fair values of gas price swap and option agreements are based on forward prices from established indexes for the applicable regions. The fair values of gas and electricity purchase and sales agreements are based on forward prices from established indexes from applicable regions and discounted using established interest rate indexes. While the District does not enter into agreements for trading purposes, it does not apply hedging accounting to these agreements. Therefore, the changes in derivative financial instruments are recorded as a component of generation and fuel expense.
The District reports derivative financial instruments with remaining maturities of one year or less and the portion of long-term contracts with scheduled transactions over the next twelve months as current on the consolidated balance sheets. The District is exposed to risk of nonperformance if the counterparties default or if the agreements are terminated. The District monitors these risks, and does not anticipate nonperformance.
Net Assets The District classifies its net assets into three components - invested in capital assets, net of related debt; restricted; and unrestricted. These classifications are defined as follows:
Invested in capital assets, net of related debt - This component of net assets consists of capital assets, net of accumulated depreciation reduced by the outstanding debt balances, net of unamortized debt expenses and unspent debt proceeds.
Restricted - This component consists of net assets with constraints placed on their use, either externally or internally. Constraints include those imposed by debt indentures, grants or laws and regulations of other governments, by law through constitutional provisions or enabling legislation or by the Board.
Unrestricted - This component of net assets consists of net assets that do not meet the definition of “restricted” or “invested in capital, net of related debt.”
Board Designated Net Assets Net assets include amounts that the District’s Board designates as reserves for debt service, capital improvements and rate stabilization. The rate stabilization fund represents amounts reserved for the purpose of stabilizing electric utility rates in future periods. The Board determines the annual transfers into and out of these reserves. While the Board designates these funds as reserve funds, they are not restricted and the Board can utilize such funds for any purpose.
In 2004, upon issuance of the 2004 revenue bonds, the Board transferred $20,000 and $12,791 into the rate stabilization and capital improvements funds, respectively. Additionally in 2004, the Board transferred $7,240 out of the rate stabilization fund.
The designated funds included in net assets were as follows at December 31:
2005 2004 Rate stabilization $34,076 $34,076 Debt service 16,661 26,543 Capital improvements 12,791 12,791
$63,528 $73,410
��
Purchased Power Expenses A portion of the District’s power needs are provided by power purchase agreements. Expenses from such agreements, along with associated transmission costs paid to other utilities, are charged to purchased power expense in the period the power was received. Adjustments to prior billings are included in purchased power expense once the payments or adjustments can be reasonably estimated. Gains or losses on power purchase and sale transactions that are settled without physical delivery are recorded as net additions or reductions to purchase power expense.
Contributions in Aid of Construction and Grants The District receives CIAC for customer contributions relating to expansions to the District’s distribution facilities. The District also receives grant proceeds from federal and state assisted programs for its River Restoration programs and other programs. The contributions and grant proceeds are included in other income in the accompanying financial statements. When applicable, these programs may be subject to financial and compliance audits pursuant to regulatory requirements, although the District considers the possibility of any material grant disallowances to be remote.
Asset Retirement Obligations The District accounts for potential asset retirement obligations in accordance with Statement of Financial Accounting Standards No 143 (SFAS 143), Accounting for Asset Retirement Obligations, which sets forth accounting requirements for the recognition and measurement of liabilities for legal obligations associated with the retirement of tangible long-lived assets. Under SFAS 143, an obligation is recorded only when legally binding retirement obligations exist under enacted laws, statutes, written contracts or oral contracts, including obligations arising under the doctrine of promissory estoppel. Under this statement, asset retirement obligations (AROs) are recognized at fair value as incurred and capitalized as a component of the cost of the related tangible long-lived assets.
The District has identified potential retirement obligations related to certain generation, transmission and distribution facilities located on properties that do not have perpetual lease. The District’s nonperpetual leased land rights generally are renewed continuously because the District intends to utilize these facilities indefinitely. Since the timing and extent of any potential asset retirements are unknown, the fair value of any obligations associated with these facilities cannot be reasonably estimated. Accordingly, no liability has been recorded at December 31, 2005.
Implementation of GASB Statement No. 40 In 2005, the District implemented SGAS No. 40 (GASB 40), Deposit and Investment Risk Disclosures - an amendment of GASB Statement No.3 SGAS No. 40 requires disclosure of credit risk, concentration of credit risk, interest rate risk, and foreign currency risk and modifies previous custodial credit risk disclosure requirements. Deposit and investment risk disclosures relating to 2004 balances presented in Note 5 have been modified to conform to the new standard.
Recent Accounting Pronouncement In June 2004, GASB issued SGAS No. 45, Accounting and Financial Reporting by Employers for Post Employment Benefits other than Pensions (OPEB), which establishes standards of accounting and financial reporting for OPEB expense and related OPEB liabilities or assets. OPEB arises from an exchange of salaries and benefits for employee services rendered. It refers to post employment benefits other than pension benefits such as post employment healthcare benefits. The Statement is effective for the District beginning in 2007. The District is currently assessing the new statement and has not determined the specific impact of
adoption. However, as described in note 11, the District’s estimate of its accumulated pension benefit obligation related to its OPEB obligations is $6,400 at December 31, 2005.
Reclassifications Certain amounts in the 2004 financial statements have been reclassified in conformity with the 2005 presentation.
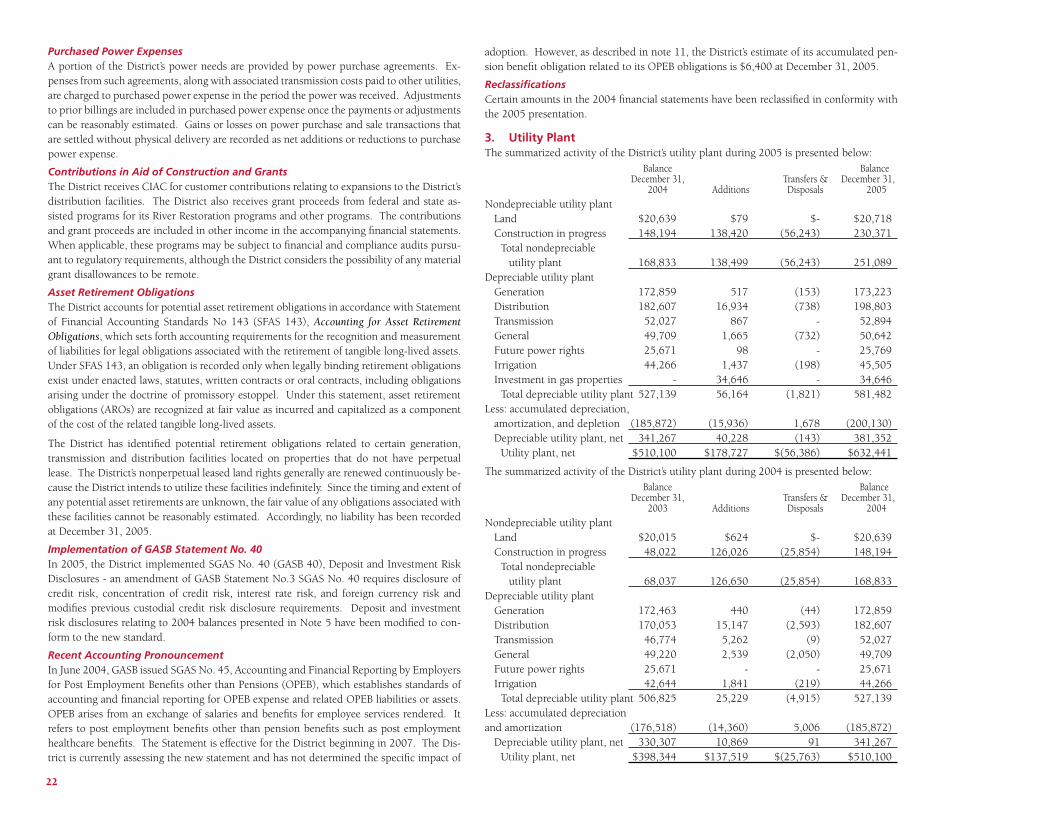
3. Utility Plant The summarized activity of the District’s utility plant during 2005 is presented below:
Balance Balance December 31, Transfers & December 31,
2004 Additions Disposals 2005
Nondepreciable utility plant Land $20,639 $79 $- $20,718 Construction in progress 148,194 138,420 (56,243) 230,371
Total nondepreciable utility plant 168,833 138,499 (56,243) 251,089
Depreciable utility plant Generation 172,859 517 (153) 173,223 Distribution 182,607 16,934 (738) 198,803 Transmission 52,027 867 - 52,894 General 49,709 1,665 (732) 50,642 Future power rights 25,671 98 - 25,769 Irrigation 44,266 1,437 (198) 45,505 Investment in gas properties - 34,646 - 34,646
Total depreciable utility plant 527,139 56,164 (1,821) 581,482 Less: accumulated depreciation,
amortization, and depletion (185,872) (15,936) 1,678 (200,130) Depreciable utility plant, net 341,267 40,228 (143) 381,352
Utility plant, net $510,100 $178,727 $(56,386) $632,441
The summarized activity of the District’s utility plant during 2004 is presented below: Balance Balance
December 31, Transfers & December 31, 2003 Additions Disposals 2004
Nondepreciable utility plant Land $20,015 $624 $- $20,639 Construction in progress 48,022 126,026 (25,854) 148,194
Total nondepreciable utility plant 68,037 126,650 (25,854) 168,833
Depreciable utility plant Generation 172,463 440 (44) 172,859 Distribution 170,053 15,147 (2,593) 182,607 Transmission 46,774 5,262 (9) 52,027 General 49,220 2,539 (2,050) 49,709 Future power rights 25,671 - - 25,671 Irrigation 42,644 1,841 (219) 44,266
Total depreciable utility plant 506,825 25,229 (4,915) 527,139 Less: accumulated depreciation and amortization (176,518) (14,360) 5,006 (185,872)
Depreciable utility plant, net 330,307 10,869 91 341,267 Utility plant, net $398,344 $137,519 $(25,763) $510,100
��

Development project In 2002, the District began active development of the Walnut Energy Center power plant (the “Project”), a 250 MW natural gas fueled generation facility. The Project achieved commercial operation on February 28, 2006. At December 31, 2005 and 2004, the District’s cumulative construction and development costs related to the Project totaled $207,024 and $135,693, respectively. These amounts are included in Construction in Progress in the above tables.
4. Participation in Joint Powers Agencies Transmission Agency of Northern California The District is a member of the Transmission Agency of Northern California (TANC), a JPA consisting of fifteen municipal utilities. TANC is a participant, with a 79.3% share of the California- Oregon Transmission Project (COTP) and other facilities for electric power transmission. TANC develops, operates and manages these projects. The COTP provides electric transmission between the Pacific Northwest and California. The District has a 12.4% entitlement share of TANC’s portion of the COTP and other facilities, which provide the District with 154 megawatts (MW) of transmission during normal operating conditions. The District also has a 6.3% entitlement share of TANC’s transmission under the South of Tesla transmission agreements, which provide the District with 19 MW of transmission during normal operating conditions between Tesla and Midway.
Under the TANC agreements, the District is responsible for TANC’s development, operating and debt service costs on a take-or-pay basis proportionate to its entitlement share. During 2005 and 2004, the District’s total expenses in connection with its TANC agreements, included in purchased power expense, totaled $4,744 and $4,935, respectively. At December 31, 2005 and 2004, the District has an affiliate obligation payable to TANC of $7,402 and $7,143, respectively, relating to certain non-cash expenses and other cumulative differences between expenses recognized for accounting purposes and cash payments made to the Agency.
Northern California Power Agency The District is a member of the NCPA, a JPA consisting of fifteen member agencies. NCPA develops and operates projects for the generation and transmission of electric power.
The District has a 6.3% entitlement share in the capacity and energy from NCPA Geothermal Plants l and 2 (the “Geothermal Project”). The District is responsible for development, operating and debt service costs on a take-or-pay basis in proportion to its entitlement share. The District’s expenses relating to the Geothermal Project, included in purchased power expense, were $4,902 and $5,504 in 2005 and 2004, respectively. At December 31, 2005 and 2004, the District has prepaid expenses related to the Geothermal Project to NCPA of $4,711 and $4,528, respectively, which is included in prepaid expenses and other current assets on the balance sheets.
The Geothermal Project continues to experience lower than expected steam production from the geothermal wells on its leasehold properties. Therefore, NCPA operates the facility at lower output levels than originally planned, which increases the cost of power per unit. Although the cost of power from the Geothermal Project is higher than that supplied from most other sources, the District is obligated to pay its contractual take-or-pay obligations under its agreement with NCPA until they are fully satisfied, regardless of resulting cost or availability of energy. Management plans to continue to include the Geothermal Project in its long-term resource plan and, as such, its related costs are fully recoverable in the District’s rates.
Financial Summary of NCPA and TANC The combined summarized financial information of NCPA and TANC is as follows at December 31:
2005 2004 (unaudited) (unaudited)
Total assets $1,374,473 $1,415,860 Total liabilities $1,351,752 $1,400,031 Total net assets 22,721 15,829
$1,374,473 $1,415,860 Excess of revenues over
expenses for the year $15,591 $12,328
The long-term debt of TANC and NCPA is collateralized by a pledge and assignment of net revenues of each JPA, supported by the take-or-pay commitments of the District and other members. As such, the District is contingently obligated for its proportionate share of TANC’s liabilities of $481 and NCPA’s debt related to the Geothermal Project of $143 at December 31, 2005. Should other members of TANC and NCPA default on their obligations to these JPAs, the District would be required to make “step up” payments, up to 25% of its proportionate share, to cover a portion of the defaulted payments and would be entitled to the same proportion of additional power production or transmission.
Walnut Energy Center Authority The Authority is a 250 MW natural gas fueled generation facility that is blended into and reported as a component unit of the District. Through December 31, 2005, all of the Au-thority’s activities have related to the development and construction of the generating facility. Copies of Authority’s annual financial reports may be obtained from its Controller at P.O. Box 381017, Turlock, CA 95381. The Authority’s financial information is summarized as follows:
2005 2004 Current assets $12,535 $83,154 Non-current assets 258,464 149,850 Total assets $270,999 $233,004
Current liabilities $63,337 $24,988 Long-term debt 207,662 208,016 Total liabilities $270,999 $233,004
5. Cash, Cash Equivalents and Investments The District’s investment policies are governed by the California Government Codes and its Bond Indenture, which restricts the District’s investment securities to obligations which are unconditionally guaranteed by the U.S. Government or its agencies or instrumentalities; direct and general obligations of the State of California (State) or any local agency within the State; bankers’ acceptances; commercial paper; certificates of deposit; time certificates of deposit; repurchase agreements; medium-term corporate notes; shares of beneficial interest; mortgage pass-through securities; and deposits with the Local Agency Investment Fund (LAIF). Investments in LAIF are unregistered, pooled funds. LAIF is a component of the Pooled Money Investment Account Portfolio (PMIA) managed by the State Treasurer, in accordance with Government Code Sections 16430 and 16480. PMIA funds are on deposit
��

with the State’s Centralized Treasury System and are managed in compliance with the California Government Code, according to a statement of investment policy which sets forth permitted investment vehicles, liquidity parameters and maximum maturity of investments. The District’s deposits with LAIF comprise demand deposits up to $40.0 million maximum and amounts above $40.0 million are able to be withdrawn after a thirty day period. The fair value of the District’s investments in LAIF approximates the value of its pool shares.
The District’s investment policy includes restrictions for investments relating to maximum amounts invested as a percentage of total portfolio and with a single issuer, maximum maturities, and minimum credit ratings.
Credit Risk To mitigate the risk that an issuer of an investment will not fulfill its obligation to the holder of the investment, the District limits investments to those rated, at a minimum, “A1” or equivalent for medium-term notes and “A” for commercial paper by a nationally recognized rating agency.
Custodial credit risk This is the risk that in the event of the failure of a depository financial institution or counterparty to a transaction, the District’s deposits may not be returned or the District will not be able to recover the value of its deposits, investments or collateral securities that are in the possession of another party. The District does not have a deposit policy for custodial credit risk. At December 31, 2005 and 2004, deposits totaling $787 and $744, respectively, are insured by the Federal Deposit Insurance Corporation; cash, cash equivalents and investments, excluding the LAIF, totaling $143,222 and $151,189, respectively, are collateralized with securities held by the pledging bank’s trust department in the District’s name; and investments in the LAIF at December 31, 2005 and 2004, of $26,781 and $70,987, respectively, were uninsured and uncollateralized.
Concentration of credit risk This is the risk of loss attributed to the magnitude of an entity’s investment in a single issuer. The District places no limit on the amounts invested in any one issuer for federal agency securities, except for mortgage pass through securities which may not exceed 20% of the District’s surplus money. The following are the concentrations of risk representing 5% or greater in either year:
Investment type 2005 2004 Cash 17% 13% LAIF 15% 31% Fannie Mae 40% 34% Repurchase Agreements 5% 2% T-Notes 14% 13%
Interest rate risk Though the District has restrictions as to the maturities of some of the investments, it does not have a formal policy that limits investment maturities as a means of managing its exposure to fair value losses arising from increases in interest rates. Of the District’s total portfolio at December 31, 2005 and 2004, all of the District’s cash and cash equivalents have maturities of 90 days or less. The remaining investments mature between one to three years. The following schedules present the credit risk at December 31, 2005 and 2004. The credit ratings listed are from Standard and Poor’s. NR means not rated.
Credit Rating 2005 2004 Cash and cash equivalents:
Deposits NR $30,659 $30,701 Commercial Paper NR 2,269 -Treasury Notes TSY 6,175 -Fannie Mae AAA 5,154 5,155 Repurchase Agreements NR 9,543 -Local Agency Investment Fund NR 26,781 70,987
80,581 106,843 Short-term investments:
Fannie Mae AAA 12,119 34,200 Corporate notes AAA, AA-, A+ 1,619 2,064 Treasury Bills TSY - 6,209 Other Corporate Obligations NR - 6,394
13,738 48,867 Long-term investments:
Fannie Mae AAA 51,978 38,440 Treasury Notes TSY 17,845 23,333 Corporate notes AAA, AA-, A+ 6,647 5,437
76,470 67,210 $170,789 $222,920
General operating funds: Operating accounts $45,517 $9,367 Funds designated for rate stabilization 55,200 62,440 Funds designated for capital improvements 12,791 12,791
113,508 84,598 Restricted funds:
Construction funds 2,269 64,341 Reserve funds 34,665 26,325 Debt service fund 16,662 36,151 COP reserve funds 3,460 11,235 Other 225 270
57,281 138,322 $170,789 $222,920
The District maintains a rate stabilization fund to protect District customers from extreme rate increases that would otherwise be necessitated by dramatic short-term changes in purchased power or other operating costs. Annual transfers into and out of the fund are determined by the District’s Board of Directors (Board), which may utilize these unrestricted funds for any lawful purpose. The rate stabilization fund consists of an undivided portion of the District’s general operating funds. In 2004 the Board transferred $7,240 out of the rate stabilization fund.
In accordance with provisions of the credit agreements relating to certain of the District’s long-term debt obligations, restricted funds are maintained at levels set forth in the agreements to provide for debt service reserve and project funding requirements. These funds are held by trustees and are invested in U.S. Government securities and related instruments with maturities no later than the expected date of the use of the funds.
��

900
6. Long-term Debt Long-term debt consists of the following at December 31:
2005 2004 Revenue bonds, fixed interest rates of 4.0%
to 7.3%, maturing through 2034 $277,245 $282,810 Revenue bonds, variable interest rates,
maturing through 2034 67,115 67,760 Certificates of participation, fixed interest
rates of 4.5% to 5.0%, maturing through 2033 26,785 26,785 Certificates of participation, variable interest
rates, maturing through 2031 37,400 38,300 General obligation bonds, fixed interest
rates of 3.5% to 5.5%, paid in full during 2005 - 1,490 Total long-term debt outstanding 408,545 417,145
Less: Current portion (7,360) (8,600) Unamortized premiums and discounts, net 8,872 9,507 Deferred losses on bond refundings, net (5,310) (5,993)
Total long-term debt, net $404,747 $412,059
Debt Issuance and Refunding In April 2004, the District issued 2004 Series A, B and C revenue bonds totaling $201,085, for the purpose of financing the construction of the Walnut Energy Center facility. The summarized activity of the District’s long-term debt during 2005 and 2004 are presented below:
Payments Amounts December 31, amortization December 31, Due Within
2004 Additions and refundings 2005 One Year
Revenue bonds $350,570 $(6,210) $344,360 $6,460 Certificates of participation 65,085 - (900) $64,185 900 General obligation bonds 1,490 - (1,490) $- -
Total 417,145 - (8,600) 408,545 $7,360 Less:
Unamortized premiums and (discounts), net 9,507 - (635) 8,872 Deferred losses on bond refundings, net (5,993) - 683 (5,310)
Total long-term debt, net $420,659 $- $(8,552) $412,107
Payments Amounts December 31, amortization December 31, Due Within
2003 Additions and refundings 2004 One Year
Revenue bonds $155,290 $201,085 $(5,805) $350,570 $6,210 Certificates of participation 65,985 - (900) 65,085 General obligation bonds 2,920 - (1,430) 1,490 1,490
Total 224,195 201,085 (8,135) 417,145 $8,600 Less:
Unamortized premiums and (discounts), net 2,863 7,168 (524) 9,507 Deferred losses on bond refundings, net (6,719) - 726 (5,993)
Total long-term debt, net $220,339 $208,253 $(7,933) $420,659
Variable Rate Debt The District’s variable rate debt bears interest at daily, weekly and monthly rates, ranging from 1.4% to 3.55% at December 31, 2005. The District can elect to change the interest rate period or fix the interest rate, with certain limitations. The variable rate bondholders have the right to tender the bonds to the tender agent.
The District has two letters of credit totaling $46,215 with a bank, which expire in April 2011. These facilities provide liquidity support for a portion of the District’s variable rate revenue bonds and all of the District’s variable rate Certificates of Participation (COPs). The remaining variable rate revenue bonds (issued in 2004) can be put only to the tender agent and do not require liquidity support. Principal draws on the letters of credit would be payable in accordance with the maturities schedules of the related revenue bonds and COPs. Accordingly, the District has recorded such bonds as long-term debt, less amounts scheduled to mature within one year of the balance sheet dates. No amounts have been drawn on these letters of credit to date.
General The COPs and revenue bonds are collateralized by a pledge of, and a lien on, the revenues of the electric system after deducting maintenance and operation costs, as defined in the bond resolutions, subject to prior liens relating to the general obligation bonds. The District’s bond resolutions contain various covenants that include requirements to maintain minimum debt service coverage ratios, certain financial ratios, stipulated minimum funding of revenue bond reserves, and various other requirements.
The District has a surety bond of $4,102 with a bank, in lieu of funding reserve fund requirements for certain revenue bonds, as allowed by the bond resolution. The surety bond expires concurrent with the related revenue bonds. No amounts have been drawn on the surety bond to date.
Variable rate bonds totaling $46,215 may be subject to redemption at any interest date without a premium or discount. Fixed rate revenue bonds totaling $56,370 may be subject to redemption by the District in 2008 at a premium of 2%. Additionally, fixed rate revenue bonds totaling $58,300, $50,490 and $109,280 may be subject to redemption at any interest date, 2013, and 2014 respectively, by the District without premium or discount.
��

The District’s scheduled future annual principal maturities and estimated interest are as follows at December 31, 2005:
Estimated Principal Interest Total
2006 $7,360 $18,623 $25,983 2007 10,040 18,199 28,239 2008 10,775 17,629 28,404 2009 11,215 17,007 28,222 2010 12,480 16,334 28,814 2011-2015 70,895 72,718 143,613 2016-2020 74,170 57,322 131,492 2021-2025 78,715 39,690 118,405 2026-2030 73,825 22,536 96,361 2031-2034 59,070 6,478 65,548
$408,545 $286,536 $695,081
The District used the interest rates in effect as of December 31, 2005, to estimate the future interest requirements for its variable rate debt, included in the table above.
At December 31, 2005 and 2004, the estimated fair values of the District’s long-term debt, calculated by determining the net present value using appropriate maturity dates of future debt service payments discounted at the bond buyer’s revenue bond index rate, are as follows:
2005 2004 Carrying amount $412,107 $420,659 Fair value $414,318 $431,532
7. Commercial Paper In 2005, the District issued commercial paper notes to finance capital expenditures. The effective interest rate for the notes outstanding at December 31, 2005 was 4.1% and the average term was 30 days. The District maintains a $64.5 million letter of credit to support the sale of these outstanding notes and incurs an annual fee for this service. There has not been a term advance under the letter of credit.
The summarized activity of the District’s Notes during 2005 is presented below:
Balance at Balance at beginning of end of
Year Additions Reductions Year December 31, 2005 $ - $52,569 - $52,569
8. Regulatory Deferrals The District’s Board has taken various regulatory actions that result in differences between recognition of revenues and expenses for rate-making purposes as reflected in these consolidated financial statements, and as incurred. These actions result in regulatory assets and credits.
Deferred Regulatory Assets Deferred regulatory assets consist of the following at December 31, 2005:
2005 2004 Westside facility costs $611 $1,902 Unrealized loss on investments 1,320 989
$1,931 $2,891 Westside facility costs
Certain costs incurred in connection with the Westside facilities acquisition from PG&E in December 2003 are being recovered as part of a surcharge the District includes in the rates collected from the Westside retail customers. The balance is amortized through collections.
Unrealized Losses on Investments
The District defers unrealized holding gains and losses on its investments until such investments mature or are sold which is consistent with the District’s rate setting process.
Deferred Regulatory Credits Deferred regulatory credits consist of the following at December 31:
2005 2004 Electric rate stabilization $21,124 $21,124 Public benefit 3,566 2,480
$24,690 $23,604 Electric Rate Stabilization
Prior to 2003, the District deferred interest earnings on net assets designated for electric rate stabilization. These amounts will be amortized as increases in retail revenues in future periods based on a rate program approved by the Board of Directors which releases rate stabilization amounts under identified circumstances when power supply costs are significantly higher than the cost estimates included in rates.
Public Benefit
In February 2003, the District’s Board identified a specific component of its rates, 2.85%, to be committed to public benefit expenditures. During 2005 and 2004, the District’s public benefit expenditures were less than the amount collected in rates. As a result, the District has deferred the unexpended revenues of $3,566 and $2,480 at December 31, 2005, and 2004, respectively.
Public benefit expenses consist of non-capital expenditures for energy efficiency programs and renewable energy resources.
9. Derivative Financial Instruments The District enters into contracts for the purchase of electricity to meet the expected needs of its retail customers and for the purchase, transportation and storage of natural gas to meet its generation needs. The District also enters into hedging transactions to reduce the price volatility of some of these agreements. Certain of these contracts are classified as derivative financial instruments.
��

The fair value of the District’s derivative financial instruments are as follows: December 31,
2005 2004 Derivative Financial Instrument Assets:
Gas related contracts $9,257 $1,462 Electric related contracts - 975
Total current derivative financial instruments $9,257 $2,437 Derivative Financial Instrument Liabilities:
Gas related contracts $3,554 $1,414 Electric related contracts 2,399 182
Total derivative financial instruments 5,953 1,596 Less: current portion 4,815 1,596
$1,138 $-
10. Pension Plan The District has a single-employer group defined benefit pension plan (the “Plan”) which provides retirement benefits covering substantially all its employees who have completed one year of continuous service. Employees may retire after age 55 with benefits based on compensation and years of service to actual retirement date. The Plan also provides death benefits for those employees having reached age 55.
The District is the administrator of the Plan and through the action of its Board, may amend or establish Plan provisions. The Board has appointed a third party to carry out certain administrative responsibilities. The Plan is a governmental plan under section 414(d) of the Internal Revenue Code (IRC). Copies of the Plan’s annual financial report may be obtained from the District’s executive office at 333 East Canal Drive, Turlock, California 95381.
Funding Policy To participate in the plan, employees who are not members of a bargaining unit are required to contribute 1.25% of their earnings and employees who are members of a bargaining unit are required to contribute 2.25% of their earnings. Under the Plan provisions established by the Board, the Plan is to be funded in amounts equal to the normal costs of the Plan plus an amortization of the past service liability. Contributions made by the employees’ vest immediately. Contributions made by the District are fully vested after five years of participation.
Annual Pension Cost The annual required contributions for 2005 and 2004 were determined by actuarial valuations using the frozen entry age actuarial cost method. The actuarial assumptions included the following for 2005 and 2004:
• Investment rate of return applied to assets of 8.5% per year;
• Discount rate applied to the pension benefit obligation of 8.5% per year;
• Salary increases of 4.5% per year; and
• Cost of living adjustment of 3.5% per year.
Realized and unrealized gains are phased in to the actuarial value of Plan assets over a three year period, and may be adjusted so that the assets are not less than 80% or more than 120% of the fair market value of the Plan’s assets as of the current valuation date. The unfunded actuarial accrued liability is being amortized as a portion of annual pension cost.
The District’s annual pension cost and net pension obligation or prepaid for 2005 and 2004, based on valuations as of December 31, 2005 and 2004, respectively, were as follows:
2005 2004 Annual required contribution $5,335 $4,557 Interest on net pension obligation 106 -Adjustment to annual required contribution (142) -
Annual pension cost 5,299 4,557 Contributions made 5,654 3,314
Increase (decrease) in net pension (obligation) prepaid 355 (1,243) Net pension (obligation) prepaid, beginning of period (1,240) 3
Net pension obligation, end of period $(885) $(1,240)
Summarized Historical Trend Information Three year trend information is presented below:
Net Fiscal Annual Percentage Pension Period Pension of APC (Obligation) Ending Cost (APC) Contributed Prepaid 12/31/05 $5,299 107% $(885) 12/31/04 $4,557 73% $(1,240) 12/31/03 $3,387 79% $3
The supplemental schedule of funding progress is presented below: Actuarial Actuarial Accrued Unfunded UAAL as a
Actuarial Value of Liability (AAL) AAL Funded Covered Percentage of Valuation Assets Entry Age (UAAL) Ratio Payroll Covered Payroll
Date (a) (b) (b-a) (a/b) (c) ([b-a]/c)
12/31/05 $102,136 $132,592 $30,456 77.0% $25,508 119.4% 12/31/04 $95,190 $123,498 $28,308 77.1% $23,863 118.6% 12/31/03 $94,299 $116,216 $21,917 81.1% $23,130 94.8%
11. Other Post Employment Benefits The District provides post-retirement health care benefits in accordance with District policy to qualified retirees and their spouses. The qualification requirements for these benefits are the same as those under the District’s Plan. The District contributes the full cost of coverage for retirees; however, retirees contribute the estimated health care cost for dependents. Covered retirees are also responsible for personal deductibles and co-payments. Currently, 80 retirees and surviving spouses are receiving benefits. The District pays for post-retirement health care benefits on a pay-as-you-go basis. During 2005 and 2004, the District’s post-re-tirement health care benefit expenditures were $331 and $467. At December 31, 2005, the District estimates the accumulated post-employment benefit obligation for the health care benefits plan is approximately $6,400.
In addition, the District offers its employees a deferred compensation plan (the “Deferred Plan”), which provides employees the option to defer part of their compensation until termination, retirement, death, or unforeseeable emergency. The District has the duty of reasonable care in the selection of investment alternatives, but neither the District nor its directors or officers have any liability for losses under the Deferred Plan. The District holds all deferred compensation assets in the name of the Deferred Plan, and accordingly, the Deferred Plan assets and corresponding liability are not recorded in the accounts of the District.
��

12. Commitments Power Sales Agreement The District has a power sales agreement with Merced Irrigation District (MEID) to sell ten MW of electricity on a take-or-pay basis. The District receives an energy payment based on a formula, as defined in the agreement, based in part on a California natural gas price index. The District also receives a capacity payment based on a formula, as defined in the agreement. MEID is also required to purchase electricity for its supplemental power requirements, based on current market rates as set forth in the agreement. Sales under this agreement totaled $23,184 and $18,480 in 2005 and 2004, respectively. The agreement expired at the end of 2005 and was replaced with a new agreement with similar terms for 2006 and 2007 with a one time option to extend the agreement through April 30, 2008 at the sole discretion of MEID
Power Purchase Agreements The District has four long-term power purchase agreements with other power producers to purchase capacity and associated energy to meet its load requirements, which expire through December 2018. Capacity and certain energy is purchased on a take-or-pay basis. Power purchased under these agreements totaled $52,695 and $49,153 in 2005 and 2004, respectively.
City and County of San Francisco The District and the City and County of San Francisco (CCSF) have a power sales agreement (PSA) which allocates a share of excess Hetch Hetchy Project capacity and energy to the District, through 2015. The District purchased $9,091 and $5,364 of power in 2005 and 2004, respectively, under the CCSF agreement.
CCSF submitted a notice of contract termination to the District effective February 2004, at which time CCSF ceased making power deliveries under the PSA. Negotiations to enter into a new agreement were completed in April 2005. This agreement ended firm sales at the end of 2005, but provides the District with energy, as available, for its eligible loads and additional excess energy when available. The new Power Purchase expires in 2015.
Gas Purchase Agreements The District has two long-term natural gas supply agreements with two companies to meet the consumption need of its natural gas fired power plants. The District can purchase up to 27,000 million British Thermal Units (MMBtu) per date from one counterparty, the other contract allows for the purchase of all required natural gas for the Walnut Energy Center not to exceed 55,000 MMBtu per day. Pricing for both contracts are indexed to certain natural gas indexes, as defined in the gas purchase agreements. Fuel purchased under both agreements totaled $10,488 and $2,375 in 2005 and 2004, respectively.
Gas Transportation Capacity and Storage Agreements The District has nine long-term gas transportation capacity agreements and one long-term gas storage agreement with Canadian and U.S. companies to transport natural gas to the District’s natural gas fired power plants from gas supply basins in Alberta, Canada. The gas transportation capacity agreements complement the District’s gas purchase agreements, described above, and expire in years 2006 through 2033.
The approximate future minimum obligations for the above described power purchase, gas supply, and gas transportation and storage contracts are as follows at December 31, 2005:
Amount 2006 $19,972 2007 20,228 2008 20,492 2009 20,546 2010 20,892 Thereafter 182,462
$284,592
13. Contingencies California Energy Market Refund Proceedings In July 2001, FERC issued an order establishing evidentiary hearings for the purpose of determining the amount of refunds, if any, due to customers of the California ISO and PX organized spot markets from market participants selling into those markets for the period October 2, 2000 through June 20, 2001 (the refund period). During this time period, the District was both a seller and a buyer in the markets. The Administrative Law Judge (ALJ) assigned to the proceedings adopted hearing procedures for a three-phase hearing. Phase 1 of the hearing, held in March 2002, addressed the calculation of the price to be applied to sales into the California ISO and PX market retroactively. Phases 2 and 3 addressed the calculation of refunds and identification of the amount currently owed to each supplier (with separate quantities due from each entity) by the California ISO, the investor owned utilities, and the State of California. Hearings on Phases 2 and 3 concluded in August 2002.
In December 2002, the ALJ issued his Certification of Proposed Findings (the “Findings”) for all three phases and found that the District owes $1,243 in refunds for these sales. The District has appealed to FERC to overturn the Findings regarding lack of jurisdiction over the refunds owed by the District. In addition, the California parties have appealed the Findings to FERC and are requesting that FERC significantly increase all sellers refund liabilities.
In March 2003, FERC revised its ruling to include the impact of gas price mitigation to be applied to sales into the California ISO and PX market retroactively. In July 2004, the California ISO completed the calculation of revised Mitigated Market Clearing Prices (MMCPs) for the refund period using the methodology that had been developed by the administrative process at FERC, including mitigated gas pricing. The District’s refund liability under the new MMCPs increased to approximately $3,600.
On September 6, 2005 the Ninth Circuit Court of Appeals issued its decision regarding FERC’s authority regarding the imposing of refunds on non public utilities. The Court concluded that FERC does not have authority over non public authorities making sales in wholesales energy markets.
In any event, the District does not expect to be liable for any refunds because the District’s final refund liability, if any, would likely not require a cash payment; rather it would probably be fully set off against amounts owed by the California ISO to the District of $4,340. The District has recorded an allowance of $3,820 against the amount owed by the California ISO related to the uncertainty of the ultimate amount that it will collect. The District believes such allowance is sufficient to cover its refund obligation, if any, and accordingly, no liability has been recorded.
��

California Parties vs. Government Entities Complaint for Damages for 2000 and 2001 Power Sales Following the 9th Circuit Court of Appeals ruling that FERC could not order refunds in the California Refund proceeding, the District and other publicly owned utilities were sued in US District Court on March 16, 2006, by Pacific Gas and Electric Company, California Edison Company and California Electricity Oversight Board and on March 21, 2006, by San Diego Gas & Electric (collectively the “California Parties”). The claims are for damages arising from sales of wholesale power and ancillary services from May 1, 2000 through June 20, 2001. No actual dollar damage amounts were cited in the complaints. The complaints state they are based upon the same facts as were included in the FERC and 9th Circuit Court cases. However, unlike the California Refund proceeding, the complaints extend the period in dispute back five months making the starting date May 1, 2000, instead of October 2, 2000. During the May 1, 2000 through October 1, 2000 the District made no sales to the California ISO. Thus, the transactions in dispute in the California Parties’ Complaints are believed to be the same transactions in dispute in the California Refund proceeding before FERC. District management believes it is reasonably possible, but not probable, that the District will ultimately incur a liability in this matter due to the strength of its legal defenses and because these complaints are a result of the California parties defeat in the 9th Circuit Court of Appeals and addresses the same issues raised in those proceedings. As such, no liability has been recorded.
Potential dispute over Calpine Energy Services contract On December 22, 2000, the District entered into an 83-month Power Purchase Agreement (“Calpine PPA”) with Calpine Energy Services, LP (“Calpine”) to purchase up to 50 MW of Non-California ISO electricity beginning July 1, 2001. The Calpine PPA was originally to expire on May 31, 2008.
The Calpine PPA provided for discounts to the District when California ISO energy replaced Non-California ISO energy in excess of specified amounts. Between the execution of the Calpine PPA and the start of service, Calpine executed a Participating Generator Agreement with the California ISO and began scheduling all energy deliveries to the District with and through the California ISO.
As provided in the Calpine PPA and as permitted by applicable law, the District terminated the Calpine PPA for default as a result of Calpine’s bankruptcy filing, effective January 24, 2006. In connection with the termination of the Calpine PPA, the District netted payments due the District under the Calpine PPA against pending invoices from Calpine, as provided in the Calpine PPA and a separate netting agreement between the parties. Specifically, the District did not pay Calpine’s invoices for energy delivered in December 2005 of $3,289 and January 2006 of $2,132 under the Calpine PPA after netting them against larger sums owed by Calpine to the District under the Calpine PPA. Calpine is disputing the District’s right to terminate the Calpine PPA and has expressed its disagreement that payments made by the District should be refunded. In response, the District has asserted its position in writing to Calpine. The District has not recorded a liability for this disputed amount since management believes it will prevail in asserting its contractual rights to offset any amounts due in accordance with applicable law and the netting provisions of the various agreements between the parties.
Scheduling Coordinator Services Tariff Dispute In November 1999, PG&E filed its proposed Scheduling Coordinator Services (SCS) Tariff with FERC. The proposed SCS Tariff is designed to charge the District and other existing wholesale contract customers for the various scheduling services that PG&E purports to
provide. PG&E claims that such services were new services that were due to the advent of industry restructuring in California and the California ISO. Although PG&E’s Tariff filing was made in November 1999, PG&E was seeking to have the proposed SCS Tariff charges apply retroactively from April 1998 when the operations of the California ISO commenced and PG&E began incurring the ISO-related costs it is attempting to recover. In January 2000, FERC accepted for filing PG&E’s proposed SCS Tariff and set the matter for hearing. Since that time there have been several judicial proceedings on specific elements of the proposed SCS Tariff.
In June 2004, based on an order issued by FERC affirming PG&E’s SCS tariff, PG&E issued the District an invoice in the amount of $4,510. During 2004, the District paid the amounts in full, however, in 2005, PG&E and the District agreed on terms to settle the SCS Tariff charges dispute. The settlement agreement sets the District’s net obligation to be $3,700. As a result, a receivable from PG&E in the amount of $810 was recorded in the consolidated balance sheet at December 31, 2004, which was subsequently collected in 2005. The District included the total net obligation under the settlement agreement as purchased power expense in the consolidated statements of revenues, expenses and changes in net assets in 2004.
In July 2005, the District of Columbia (D.C.) Circuit Court of Appeals issued a decision finding that the ISO Tariff required PG&E to recover the above-referenced cost differentials under either PG&E’s Transmission Owner Tariff (TO Tariff) or through bilateral negotiations to reform the existing contracts. On December 20, 2005, in light of the D.C. Court of Appeals decision, the FERC issued a remand order terminating the SCS Tariff proceeding. While the December 2005 FERC decision terminated the SCS Tariff proceeding, the District does not believe that this affects the settlement agreement.
General Contingencies In the normal course of operations, the District is party to various claims, legal actions and complaints, including possible liability for environmental matters. Although the ultimate outcome of these matters is not presently determinable, the District’s management believes the resolution of all such pending matters will not have a material adverse effect on the District’s financial position or results of operations.
��

2005 Board of Directors Advisors Michael C. Berryhill Griffith & Masuda
President General Counsel
Michael V. Crowell PricewaterhouseCoopers LLP
Vice President Independent Accountants
Charles Fernandes Public Financial Management, Inc.
Member Financial Advisor
Randy Fiorini R.W. Beck, Inc.
Member Consulting Engineers
Phillip N. Short
Member Revenue Bond Ratings
2005 Management Team Moody’s A1
Fitch A+
Larry W. Weis Standard & Poor’s A+
General Manager
Randy C. Baysinger
Assistant General Manager, Power Generation
Casey J. Hashimoto For additional information, contact:
Assistant General Manager, Engineering & Operations Turlock Irrigation District
Joseph E. Malaski Public Information Office
Assistant General Manager, Financial Services & Treasurer P.O. Box 949
Martin J. Purdy Turlock CA 95381-0949
Assistant General Manager, Human Resources (209) 883-8448
Robert M. Nees www.tid.com
Assistant General Manager, Water Resources & Regulatory Affairs
Steven E. Boyd
Assistant General Manager, Consumer Services & Government Relations
Design: Martino Graphic Design, Inc. / Modesto, CA • Printing: Parks Printing / Modesto, CA
�0

����
GM Admin. General Manager
Executive Secretary to the General Mgr Carolyn Mendonca
ning Manager
Consumer Services &
Admin. AGM, Steve Boyd Adminstrative Asst. - General Mgr
Dept. Asst. Janice French
Manager Jennifer Stone Area Manager
Kate Schulenberg Public Information Officer
Public Benefits Program Analyst Nancy Folly Education Specialist
Customer Service Dept.
Dennis Swisher Customer Service Systems Analyst
Manager Rick Roe Field Service Rep.
James Mitchell Steve Lancaster Paul Cooper Dave Pontes Kirk Fink Arvery Shelton Meter Reader James Riley
Hershell Phillips Jim Carlson
Jacob Martinez Garrett Lucas Jason Heckman Edward Miller Darren Merenda Consumer Services & Government Relations Admin. Customer Service Dept.
Heidi Collins Rep. I-II
Deborah McCurdy Kim Rice Lisa Ladd
Sandra DeCasso Sergio Aguilar
Maria Paniagua Nobelia Howard Amber Patterson Dana Ortolan Candice Johnson Bety Rea
AGM, Martin Purdy Dept. Asst. Susan Carmichael Human Resources Analyst I - II
Adam Bolanos Benefits Coordinator Maureen Kramer Human Resources
Charlotte Dutra
Coordinator Mary Collum Financial Services Admin. AGM, Joe Malaski Administrative Asst.
Accounting Dept. Manager Martin Qualle Risk Investment Analyst Don Swanson
Diana Garcia Senior Accountant Inger Satterfield Irene Azevedo Christina Drumonde Payroll Accountant
Debbie Fisher Debra Larson
Kary Hansen
- Cashier Dana Dunkirk Customer Service Rep. I-II - Cashier Bobbi Babb
Rachel Partida Jenifer Miller Renee Cardona Erica Mapes Carlos Araujo Financial Services Admin. Information Services Dept. Information Services
Dept. Asst. Debra Azevedo
David Cummerow
Database & Network Administrator Andrew Postma
Software Engineer Keith Skelly Andrew Souza
Debra Knoll Ashish Raje Systems Analyst David Espos Mari Blanco David Arounsack
Kathy Jackson Jenny Martin
Help Desk Analyst I-II Jason Fox Bryan Blair
Materials Management Dept. Materials Management Dept. Mgr Alison Bryson Dept. Asst.
Senior Buyer Donna Ford David Barr Michael Hubble Buyer Robin Sanders Raymond Perez
Diane Rowley
Alan Adams
Brian Nord
Steve Mello
Administrative Asst. Diane Sawyer
Dept.
James Farrar Principal Energy Scheduler William Bacca Energy Scheduler I-II Gretna Soza Goretti Brown Jessie Garcia Jon Satterfield Mark Corbett James Norwood
cian I-II Leslie Bucheli Utility Analyst I-II Mike Brommer Amy Petersen Michelle Gonzales Joayne Miranda Resource Planning Dept.
Willie Manuel Utility Analyst I-II Chris Poley Thomas King
tions Admin. AGM, Casey Hashimoto Administrative Asst. Patsy Ormonde Administrative Asst. Sheila Mayo
Dept. Asst. Diane Pickering
neering Dept. Electrical Engineering
Brian LaFollette Senior Electrical Engineer
Senior - Electrical Engineering
Mark Selby Supervising Engineering
Engineering Pablo Rodriguez Les Barrigar
- Elec. I-II Judy Silva Steven Chambers
Aaron Donahue David Porath
Senior Energy Specialist Steve Hibbard Environmental Health &
Manager Rich Eastman Environment Health & Safety Specialist Richard Reece
tions Admin. Power & Communications Engineering Dept. Electrical Engineering
Larry Gilbertson Senior Electrical Engineer Rhett Calkins Esteban Martinez Randy Erickson Howard Shapiro Asst. Electrical Engineer Karl Kobrock
Senior - Electrical Engineering Mario Zavala Chris Miller Gordon Morimoto
- Elec. I-II Edward Jobe
Fleet & Plant Services
Rick Myers Fleet & Plant Services Analyst Jason Hicks Fleet & Plant Services Supervisor Mike Lucas
cian Michael Hardin Matt Lopes David Delco James Whitaker Adam McKinstry
Daniel Kenyon James Johnson
Daniel Lino
Loren Peterson Clyde Rodrigues
tions Admin. Line Dept. Line Dept. Manager
Dennis Moon Dept. Asst.
Kenneth Olson
Line Supervisor Michael Green
Brian Skonovd Dennis Larsson Stephen Brazil Ken Gross Ken Gibson Rick Brenes Electrical Lineworker Steve Stout Stephen Pinkney Ross Phillips Glenn Kaiser John Nelson Richard Lane Pete Bougoukalos Dennis Mattos Dave Boyer Alfred Borges Ron Duncan Robert Moore Bill Stavrianoudakis Gregg Campodonico Heath Schab Jan Backstrom
tions Admin.
Apprentice Electrical Lineworker Bryan Lovio Mike Nixon Dustin Krieger Aaron Baker Duarte Xavier Dan DeSomma James Small Thejon Baza Steve Johnson Michael Patterson
Derek Gambel Casey Guinn Denver Hodges Layton McDonald Joshua Sears Administrative Clerk I-II
Renee Cargill
Chuck Freeman Robert Chambers Apprentice Meter
Mario Castrejon
Adam Hope
Roger Parks
Gary Dutey
Anthony Lorenzo
Ignacio Alcorcha
Electrical Lineworker Ron Johnson Mark Pickens
Dispatcher Nancy Chambers
tions Admin.
tions Dept
Sam Postma Dept. Asst. Mary Angel
Substation & Comm
Scott Bullard Substation Supervisor Kurt Roberts Don Dunbar
James Butland Randy Wilkey Apprentice Substation
Manuel Thomas
Mike Bradley Jimmy Emmons Roger Moitoso Robert Middleton Electronic Supervisor Mike Fultz
Brad Arnold Ken Mello John Boyles Apprentice Electronic
Daniel Barkhousen Energy Mgmt. System
Energy Management System Supervisor John S. Souza
Paul Rodrigues
tions Admin.
ing Dept.
- Special Projects Ron Butcher
Manager Robert Anderson Power Control Center Operator Kraig Stockard R. Dwayne Nyberg H. Lee Million James Sisco
Karl Morton
James Mapes Appr Power Control Center Operator
Appr Power Control Center Operator Bart Sargenti Appr Power Control Center Operator Edward Sharp Appr Power Control Center Operator
Appr Power Control Center Operator James Strika Power Generation Admin. AGM Randy Baysinger Administrative Asst. Gail Humphrey Power Plant Engineering
Dept.
George Davies Dept. Asst. Momi Souza
bined Cycle Jay Brooks Mike Johnson
John Bales Anthony Chapin Sebastian Lub Johnny Cole Frank Carter
Dru Stewart James Anderson Ruben Castrejon Darryl Cully Instrument & Controls
Apprentice Instrument &
Mike Hines John Dunn
Rick Fortado Almond Power Plant Power Plant Super - Combined Cycle Devin Chapin
Nile Brundage
Paul Kayser
Apprentice Power Plant
Darin Dubel Sam Mettler Ray Newman Instrument & Controls
Ray Thomas Power Generation Admin.
Marty Rojas Power Plant Supervisor - Don Pedro Myron McCoy
Dean Gordin Reggie Knott Chris Martin Carl Stange Power Plant Supervisor - Small Hydro Russell Fox
Ron Lema Mark Brennecke Don Andersen Apprentice Power Plant
Lorenzo Sanchez
AGM Robert Nees Administrative Asst. Maria Faria
Manager Debbie Liebersbach
Keith Larson
Dist I-II Paul Posson Aquatic Biologist I-II
Civil Engineering Dept. Mgr Wilton Fryer Dept. Asst. Joyce Machado Senior Civil Engineer Brent Harrison Associate Civil Engineer
- Civil
Alejandro Buenrostro
- Civil I-II Marina Cummerow
Rudy Brunsvold Frank Leandro
- Civil I Carla Couto
Manager David Falkenberg
John McGowan
Don Pedro Recreation Agency
Carol Russell Dept. Asst. - DPRA
Customer Service Rep. I-II - Cashier Linda Shepherd
David Jigour Richard Martin Chief Ranger Roy Kroeze James McCoy Ranger I Marsha Fontana Steven Brown Kelly Gobel Brannon Gomes Peter Becchetti Robin Whitson
Manager Bill Flanagan
Claude Haugen Park Maintenance
Joseph Brooks
nance Dept.
Keith Cargill Dept. Asst. Stephanie Martinez Improvement District
Craig Clark
Robert Caetano Pest Control/ Facilities Manager Steve Marklund
Dwayne Nordell Pump Repair Supervisor Rick Wisdom
Louie Pombo Equipment Operator Donald Smith Ramon Martinez Brian Dias Frank Rice John Damas Crew Supervisor Kennard Schroeder Larry Prada Gene Mendoza Dale McElhaney
Gary Manson Larry Cabral
Glen Joslin
James Simpson Russell Silva Jerry Russell
Jose Colon Daniel Alexander
nance Dept.
John Phillips Kevin Greener
Christian Hooper
Alberto Gonzalez Micah Kaiser Luis Murillo
Joseph Oliveira Jacob Johnson Zachary Azevedo Gary Cordell Adam Alstadt Custodian Larry Crawford Robert Hayes Joshua Overman
Jerry Emig Dept. Asst.
Manager Charles Blocher
Mike Kavarian - La
Grange Mario Jones Ben Blazzard Customer Svc Rep I-II
Stella Lorenzo Emily Padilla
Operator John Hacker Bill Beets Joe Sequeira Kimberly Studley Bill Caudle Antone Perry Renaldo Winzey Joe English Ronald Beebe Allen Babbitt James Bollinger John Gregory Dan White Ray Mendonca Darrell Monroe Scott Burch Dennis Sego
Larry Smith
Sam Pierce
Operator
Bill Reichle Scott Cole Robert Alberti Marvin Medeiros Keith Nydam
Jim Griffin Mike Shaver Frank Cardoso Gary Doerksen Mark Jones Brian Fitzgerald
Larry Weis
Strategic Issues & Plan
Wes Monier
Government Relations
Tami Wallenburg
Governmental Affairs
Mary Jo Talbot
Tony Walker
Tom Munoz
Dept. Mgr.
Lauretta Ayers Customer Service Div. Mgr. Tena Falkenberg Field Services Div.
Ted Mensonides
Ray Valenzuela
Colby Torres
Sr. Rep. Tracy Jones Tina Zamaroni
Sylvia Van Hook Sandra Woodward Rosemary Tobin
Tara Martinez Yuri Herrera
Human Resources Admin.
Lynn Clay
Technician
Workers’ Compensation
Rosemary Vierra
Accounting Div. Manager
Sr. Accounting Technician
Accounting Technician
Sr. Customer Service Rep.
Lynn Hallum
Dept. Mgr. Wayne Turnbow
I S Applications Mgr.
I S Operations Mgr. Bill Worsham
Jeffrey Leal
Information Svcs Operations Tech. I-II
Venessa Roberts
John Waayers
Tracy Pombo
Purchasing Technician
Warehouse Supervisor
Warehouseperson Grady Weston Gary Youngdale Jeff Rocha
Utility Worker
Energy Resources Admin. AGM, Ken Weisel
Trading & Schelduling
Trading & Scheduling Dept. Mgr.
Energy Resources Techni
Mgr.
Engineering & Opera
Standards & Line Engi
Dept Mgr.
Greg Tucker Engineering Technician
Kirk Tabar Warren Graham
Technician - Electrical
Engineering Technician
Jeff Sahlstrom
Jeffrey Anderson
Safety Div.
Engineering & Opera
Dept Mgr.
Engineering Technician
Engineering Technician
Fleet & Plant Services Div.
Div. Mgr.
Fleet Equipment Techni
Tim Unruh
Fleet Service Worker
Journey Layout & Fabrication Welder
Engineering & Opera
Wade Cockrell
Heidi Topete Job Scheduling Supervisor
Line Div.
Ron Vasconcellos
Troy Borges Engineering & Opera
Line Div.
Michael Van Egmond
Donna Taylor Service Div. Service Div. Supervisor
Meter Technician
Technician
Randy Watts
Transformer Technician
Electrical Troubleshooter
Gerald Weese
Stephen Verschelden
Jeffrey Sturm
Electrical Trouble
Engineering & Opera
Maintenance & Opera
Maintenance & Operations Dept. Mgr.
Substation & Communications Div.
Div. Mgr.
Substation Technician
Technician
Guillermo Avalos
Electronic Technician
Technician
Support Div.
Electronic Technician
Engineering & Opera
Special Projects Engineer
Elec. Eng. Dept. Mgr.
Power Control Center Div. Control Center Div.
Gerald Avila
Tom Souza
Gary Weimer
Scott Ward
Dept. Mgr. Jeff Barton Combustion Turbine
Combustion Turbine Dept. Mgr.
Walnut Energy Center Power Plant Supr - Com
Power Plant Tech - Gas Turbine
Michael Worley Apprentice PPT-GT Zachary Woody
Technician Jeffrey Warner
Controls Tech
Warehouseperson
Power Plant Tech - Gas Turbine
Rick Walters
Neil Taylor Joel Toledo
Tech - G.T. Kevin Woodhead
Technician
Hydro Div. Hydro Div. Manager
Power Plant Technician
Power Plant Technician
Technician
Water Resources & Regulatory Affairs Admin.
Water Planning Dept.
Water Resources Analyst
Engineering Tech. - Water
Tim Ford
Tou B. Her Super. Engineering Tech
Todd Troglin Engineering Technician Sr. - Civil
Engineering Technician
Arie Vander Pol
Engineering Technician
Survey/Right of Way
Surveying Technician II Merle Wagner Surveying Technician I
Water Resources & Regulatory Affairs Admin.
Recreation Dept. Mgr.
Susan Vanderschans
Recreation Div. Mgr.
Park Maintenance Div.
Sewer/Water Treatment Technician
Worker II
Water Resources & Regulatory Affairs Admin. Construction & Mainte
Mgr.
Trouble Shooter
Equip. Operation Div. Mgr.
Gunite & Pipeline Mgr.
Heavy Equipment Oper. Terry Autrey
Richard Taylor
Tim Isley
Maintenance Worker II
Chano Tovar
Water Resources & Regulatory Affairs Admin. Construction & Mainte
Maintenance Worker II Lew Wall
Tim Van Fleet Maintenance Worker I
Andrew Webb
Water Resources & Regulatory Affairs Admin. Water Distribution Dept. Mgr.
Pam Yettman Water Operation
Aaron Turney Water Records Manager
Engineering Tech. Sr.
- Water Resources
Water Distribution
Gustavo Villarreal
Tony Harrewyn
Water Resources & Regulatory Affairs Admin. Water Distribution Dept. Water Distribution
Wes Miller
Thomas Bagdanoff Terry Small Chris Yialouris
Kenny Virden
2005 TID Valued Employees

![WELCOME [] · ISSUE FONSI IDENTIFY CONCERNS. ENVIRONMENTAL SURVEYS ... Project’s interconnec on request in accordance with the SPP Tari ff and the Federal Power Act](https://img.pdfslide.us/doc/110x75/5cb26c5088c99342708bd798/welcome-issue-fonsi-identify-concerns-environmental-surveys-projects.jpg)