Embed Size (px)
Citation preview
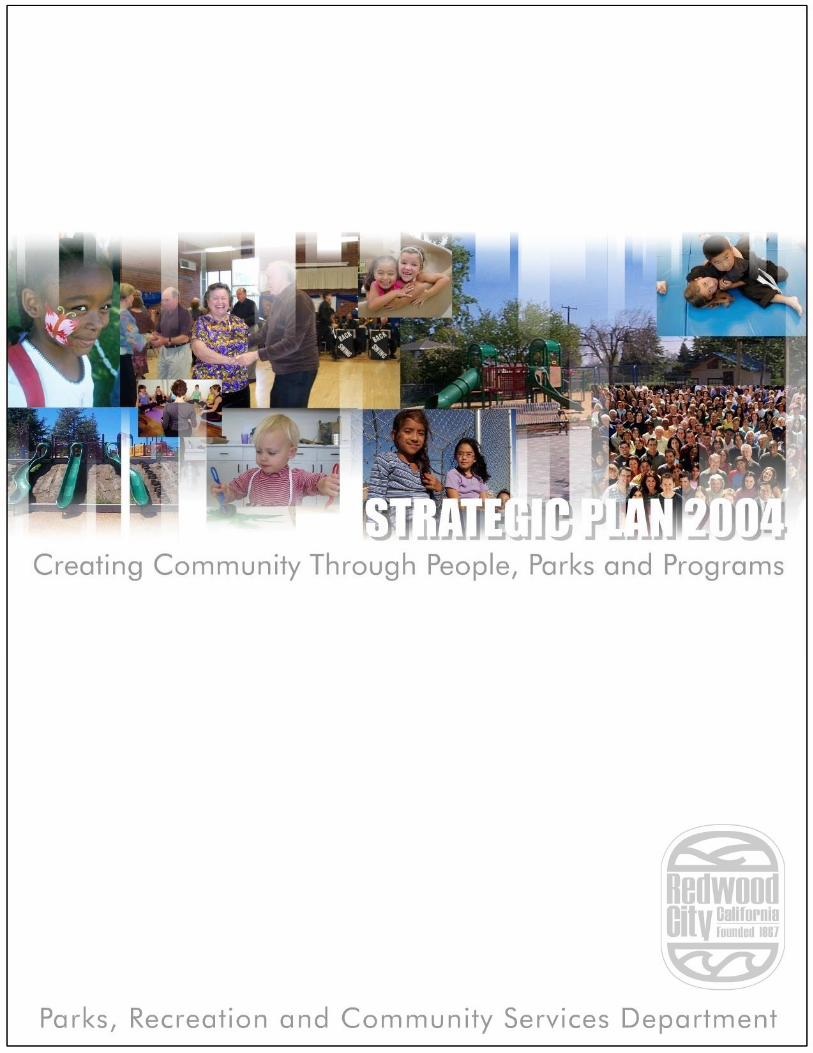
Message from the Director May 12, 2004
On behalf of all the Parks and Recreation Board and Commission Members, Volunteers, Residents and Staff that helped with its creation, I am pleased to present the Parks, Recreation and Community Services Department’s Strategic Plan for 2004 and beyond. There has been a Parks and Recreation Department in Redwood City since 1937. As it says in Fifty Years in the Making, The Story of Redwood City’s Parks 1937-1987, “Like all good stories, … Redwood City’s Parks and Recreation Department started simply with the Department’s first director, Alfred “Red” Morton, lining the fields and turning on the lights for softball at Hawes”. While there have been a lot of changes since July of 1937, our core purpose remains as simple as our beginnings. We exist to build community through people, parks and programs. This strategic plan has been developed to make sure that we focus our actions, efforts and resources so future generations will reap the “simple” benefits of: beautiful public places, quality recreation programs and facilities, excellent community services and opportunities to interact with the larger community that we provide. The Plan is divided into four chapters: Introduction, Strategic Plan Overview, Strategic Actions and Plan Implementation and Updates.
The introduction describes why we chose to develop a plan, our process for collecting information, and our desire to make this a living document. The overview sections set the context by describing the core purpose, values, and outcomes we hope to achieve. We were very clear that we wanted a plan rooted in factual vs. anecdotal data. Much of the data that formed our strategies is contained in this section and includes:
Reviews of the 2000 Census data for Redwood City. Issues identified by City Council as high priorities. Feedback from the City’s Neighborhood Survey. Results of our own outreach visits to service clubs, youth organizations, and neighborhood
groups. Trends identified by the Parks and Recreation profession.
We also took this opportunity to look inward and benchmark wherever possible, our parks, programs and services as they compare to other cities on the Peninsula. In addition, the City’s recent discussions regarding future water availability were considered as our vision for future parks and landscape areas was being developed.
The recommended action strategies are grouped into the five categories of Parks, Recreation Programs, Community Service Programs, Community Facilities, and our Organizational Development. The specific goals and actions are summarized in our Executive Summary. The report concludes with our plans for tracking and updating the document.
The late president of the United States Dwight D. Eisenhower said, “In preparing for battle I have always found that plans are useless, but planning is indispensable”. Those who created this strategic plan would probably agree with our former President. We believe that the planning has been indispensable to the future of our organization. I am very proud of the fact that many people had a hand in putting together this vision for the Department’s Future. Their listing in our acknowledgement page is a small token of our appreciation. I look forward to your support in making this plan a reality for Redwood City. Corinne Centeno Parks, Recreation and Community Services Director

R e d w o o d C i t y P a r k s , R e c r e a t i o n , a n d C o m m u n i t y S e r v i c e s | 2004 Strategic Plan
A C K N O W L E D G E M E N T S City Council Jeff Ira, Mayor Barbara Pierce, Vice Mayor Jim Hartnett Diane Howard Ira Ruskin Rosanne Foust Ian Bain
Past City Council Richard Claire Colleen Jordan
Parks, Recreation and Community Services Department
Corinne Centeno, Director
Gary Hover, Superintendent Christopher Beth, Superintendent Peter Griffiths, Director (retired)
Boards and Commissions Parks and Recreation Commission Robert Yapp Scott Morton Jeri Joseph Susan Swope Don Davis Pauline Truscelli Matthew Walsh Victor Morton (retired) Peter LaBerge (retired) Civic Cultural Commission Danielle del Carlo (retired)
Historic Advisory Committee Jean Cloud
Senior Affairs Commission
Janet Borgens
Fair Oaks Community Center Advisory Board
Child Care Advisory Committee
Youth Advisory Committee
Teen Advisory Committee
Planning Support Moore Iacofano Goltsman, Inc.,(MIG), Berkeley, CA
R e d w o o d C i t y P a r k s , R e c r e a t i o n , a n d C o m m u n i t y S e r v i c e s | 2004 Strategic Plan
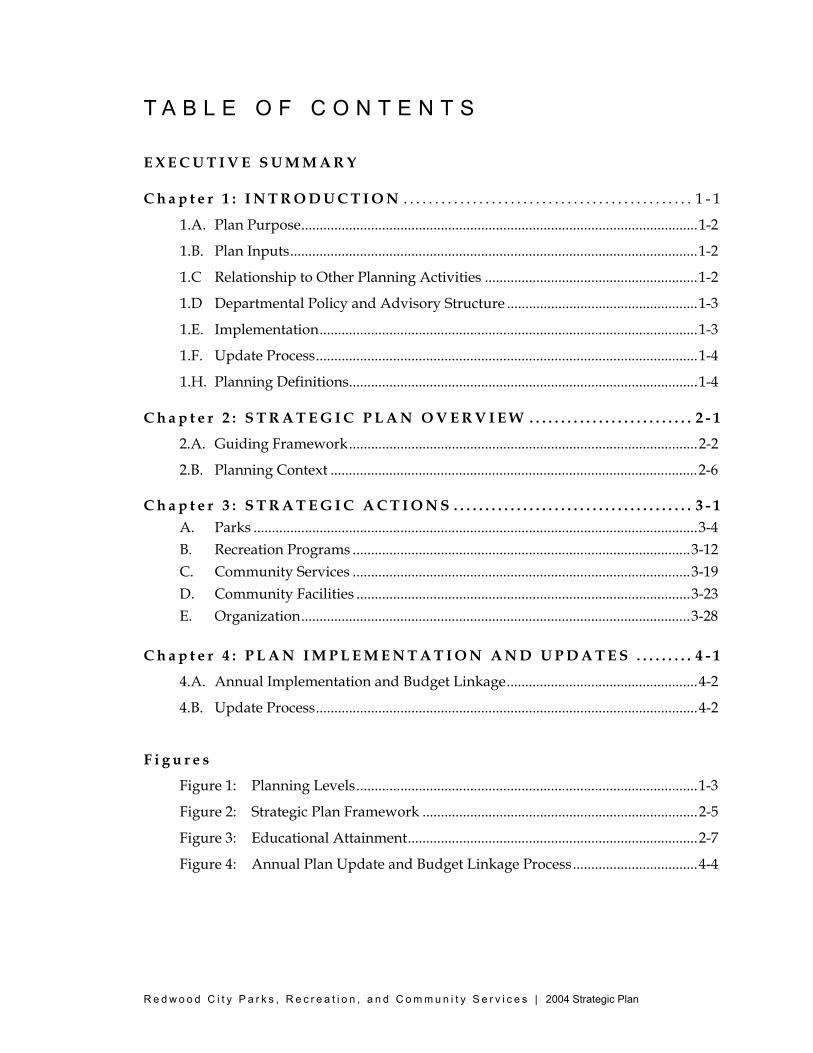
T A B L E O F C O N T E N T S E X E C U T I V E S U M M A R Y C h a p t e r 1 : I N T R O D U C T I O N . . . . . . . . . . . . . . . . . . . . . . . . . . . . . . . . . . . . . . . . . . . . . . 1 - 1
1.A. Plan Purpose............................................................................................................1-2
1.B. Plan Inputs...............................................................................................................1-2
1.C Relationship to Other Planning Activities ..........................................................1-2
1.D Departmental Policy and Advisory Structure ....................................................1-3
1.E. Implementation.......................................................................................................1-3
1.F. Update Process........................................................................................................1-4
1.H. Planning Definitions...............................................................................................1-4 C h a p t e r 2 : S T R A T E G I C P L A N O V E R V I E W . . . . . . . . . . . . . . . . . . . . . . . . . . 2 - 1
2.A. Guiding Framework...............................................................................................2-2
2.B. Planning Context ....................................................................................................2-6 C h a p t e r 3 : S T R A T E G I C A C T I O N S . . . . . . . . . . . . . . . . . . . . . . . . . . . . . . . . . . . . . . 3 - 1
A. Parks .........................................................................................................................3-4 B. Recreation Programs ............................................................................................3-12 C. Community Services ............................................................................................3-19 D. Community Facilities ...........................................................................................3-23 E. Organization..........................................................................................................3-28
C h a p t e r 4 : P L A N I M P L E M E N T A T I O N A N D U P D A T E S . . . . . . . . . 4 - 1
4.A. Annual Implementation and Budget Linkage....................................................4-2
4.B. Update Process........................................................................................................4-2
F i g u r e s
Figure 1: Planning Levels.............................................................................................1-3
Figure 2: Strategic Plan Framework ...........................................................................2-5
Figure 3: Educational Attainment...............................................................................2-7
Figure 4: Annual Plan Update and Budget Linkage Process..................................4-4
R e d w o o d C i t y P a r k s , R e c r e a t i o n , a n d C o m m u n i t y S e r v i c e s | 2004 Strategic Plan
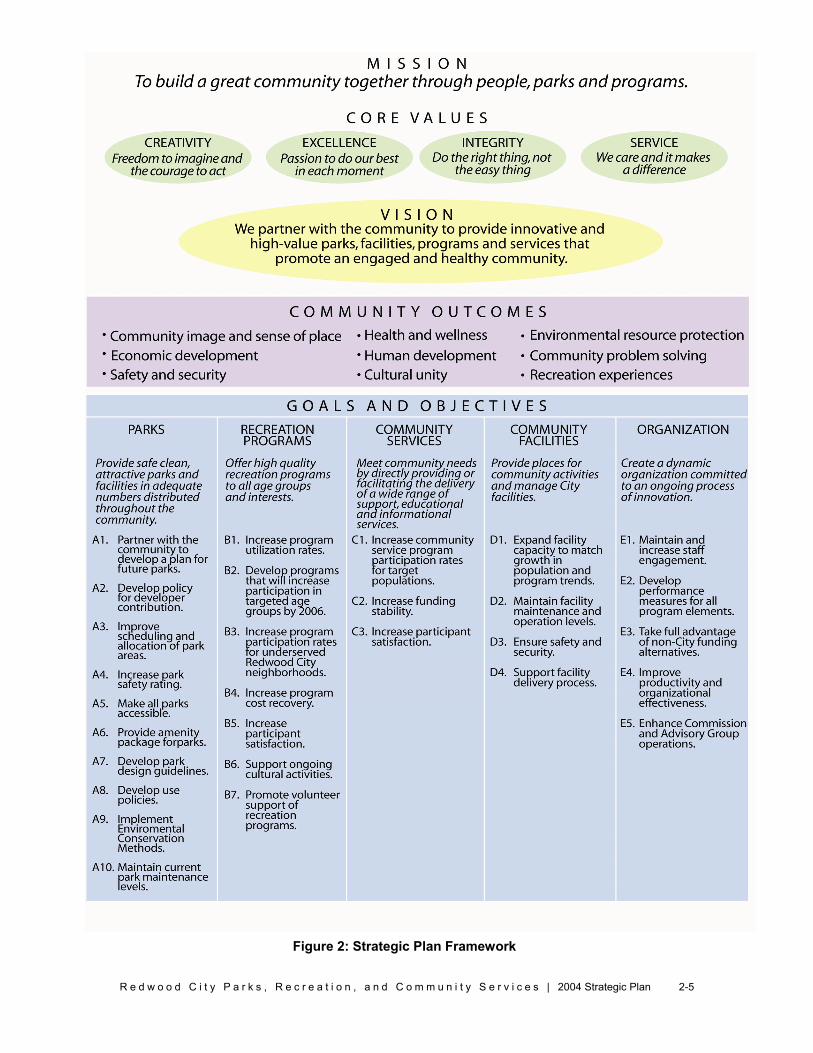
E x e c u t i v e S u m m a r y The strategic plan provides a guiding framework of principles and policy directions. The framework includes the Department’s purpose, vision, and values, as well as the goals and objectives the Department will achieve in implementing the plan. The process of implementing the Strategic Plan benefits the community as a whole, by focusing the City’s commitment to the Parks, Recreation and Community Services program.
P u r p o s e Our mission is to build a great community together through people, parks, and programs.
V i s i o n We partner with the community to provide innovative and high-value parks, facilities, programs and services that promote an engaged and healthy community.
V a l u e s
Creativity – Freedom to imagine and the courage to act
Excellence – Passion to do our best in each moment
Integrity – Do the right thing not the easy thing
Service – We care and it makes a difference
G o a l s Parks - Ensure equitable access to safe and attractive parks and facilities that meet community needs. We found that Redwood City is below the average acreage of parkland for Peninsula Cities, and our community told us that we need more acreage, particularly in the area of sports fields. This situation will only be exacerbated as the population of our City continues to grow. Our strategies in this area are threefold.
1. We need to identify locations and new funding sources for the creation of new parks. 2. We need to get the most out of our existing facilities by improving scheduling, space
allocation along with park safety and amenities found in each park. 3. We need to focus energy on creating beautiful public spaces based on sound
environmental protection and water conservation premises.
Recreation Programs—Offer high quality recreation programs to all age groups, diverse interests and all neighborhoods. Our goal for the Recreation Division is to offer high quality programs to all ages, interests and geographic areas of the City. However, information collected from the Census, the City’s Neighborhood Survey and our own outreach, indicated that our programs are less used in the Redwood Village and Friendly Acres neighborhoods, and that there are opportunities to expand programming for preschoolers, baby boomers and those over the age of 80. Internally, recreation division staffers wish to focus on improving our cost recovery ability while providing for those who cannot afford our services and improve our ability to collect information on customer satisfaction.
R e d w o o d C i t y P a r k s , R e c r e a t i o n , a n d C o m m u n i t y S e r v i c e s | 2004 Strategic Plan
Community Services—Meet community needs by directly providing or facilitating the delivery of a wide range of support, educational and informational services Community Service programs are designed to provide or facilitate a wide range of support and education services to residents. Redwood City has developed two senior service facilities, maintains accessible recreation programs, and offers human services programs in partnership with non-profit organizations at the Fair Oaks Community Center. In this area our data told us that there is still a need to support those groups with fewer resources and access to traditional support. One focus of our attention will be to reach out to the community to increase participation rates of seniors, the disabled, and those facing economic, social and emotional problems. This focus is based on the fact that the number one response from community members in the Neighborhood Survey focus group and our own outreach meetings was, “You need to get the word out to people…I didn’t know you did that”. Homelessness and the need to coordinate services for Redwood City with the County of San Mateo Human Services Agency and non-profit shelter providers will also remain a focus. Lastly, we want to establish baselines and targets for service delivery improvements.
Facilities—Provide and manage outstanding places for community activities We consider our facilities to be the Community’s public living rooms and backyards. We found that our facilities are well used with the Community Activities Building providing space to more than 200 community groups, and the Veterans Memorial Senior Center averaging 12,000 visits per month to provide just two examples. In this area our strategies are two pronged.
1. We need to provide adequate resources to maintain our existing facilities in a safe, clean and attractive manner.
2. As with parkland, our goal is to identify the type and location of new community facilities that will be needed as our population grows.
3. We also found that our facilities are concentrated in Red Morton Park.
Organization—Create a dynamic organization committed to an ongoing process of innovation In order to make our vision a reality, our organization needs to:
Provide training and support to its Boards and Commissioners, Volunteers and Staff on how to facilitate rather than solve community issues.
Expand and develop new partnerships in the community. Further expand non-general fund resources available to the Department. Develop accountability standards for each work unit. Insure that volunteer and staff efforts are recognized and appreciated.
C o m m u n i t y B e n e f i t s The plan will help Redwood City realize important community outcomes, including: community image and sense of place, economic development, safety and security, health and wellness, human development, cultural unity, environmental resource protection, community problem solving, and recreational experiences.
This information is presented graphically on the following page.
R e d w o o d C i t y P a r k s , R e c r e a t i o n , a n d C o m m u n i t y S e r v i c e s | 2004 Strategic Plan
Figure 1: Strategic Plan Framework
R e d w o o d C i t y P a r k s , R e c r e a t i o n , a n d C o m m u n i t y S e r v i c e s | 2004 Strategic Plan
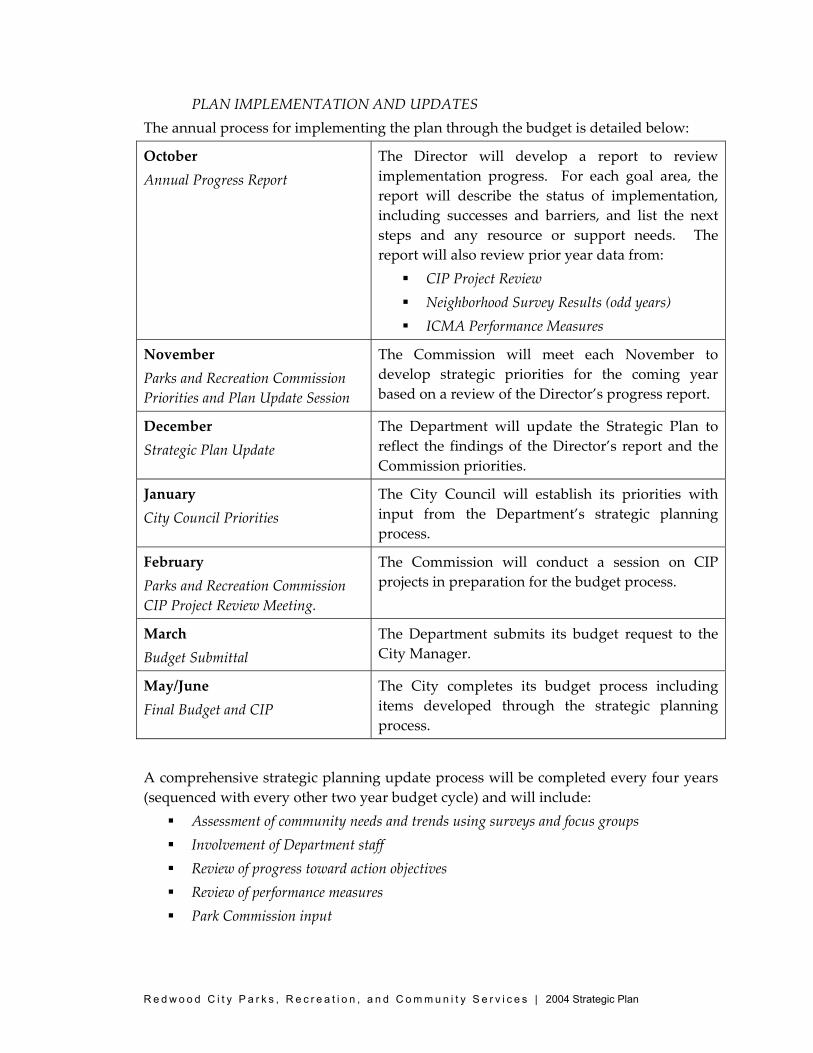
PLAN IMPLEMENTATION AND UPDATES The annual process for implementing the plan through the budget is detailed below:
October Annual Progress Report
The Director will develop a report to review implementation progress. For each goal area, the report will describe the status of implementation, including successes and barriers, and list the next steps and any resource or support needs. The report will also review prior year data from:
CIP Project Review Neighborhood Survey Results (odd years) ICMA Performance Measures
November Parks and Recreation Commission Priorities and Plan Update Session
The Commission will meet each November to develop strategic priorities for the coming year based on a review of the Director’s progress report.
December Strategic Plan Update
The Department will update the Strategic Plan to reflect the findings of the Director’s report and the Commission priorities.
January City Council Priorities
The City Council will establish its priorities with input from the Department’s strategic planning process.
February Parks and Recreation Commission CIP Project Review Meeting.
The Commission will conduct a session on CIP projects in preparation for the budget process.
March Budget Submittal
The Department submits its budget request to the City Manager.
May/June Final Budget and CIP
The City completes its budget process including items developed through the strategic planning process.
A comprehensive strategic planning update process will be completed every four years (sequenced with every other two year budget cycle) and will include:
Assessment of community needs and trends using surveys and focus groups Involvement of Department staff Review of progress toward action objectives Review of performance measures Park Commission input
C h a p t e r 1 : I N T R O D U C T I O N

R e d w o o d C i t y P a r k s , R e c r e a t i o n , a n d C o m m u n i t y S e r v i c e s | 2004 Strategic Plan 1- 2
C h a p t e r 1 : I N T R O D U C T I O N The development of the Redwood City Parks, Recreation and Community Services Strategic Plan 2004 was guided by a Steering Committee representative of a broad cross section of the Redwood City Community. One of their first work products was a list of the desired outcomes for a Strategic Plan. These expectations included: reflecting needs expressed by the community; using hard data on community demographics; developing unifying principles for decision making; identifying priorities, goals, timelines and resources needs for recommended work; and providing a vehicle to communicate the needs and proposed work to policymakers, the general public and staff. The last department plan was completed in November of 1989 (see Appendix 1 for an annotated copy).
1 . A . P L A N P U R P O S E The plan has three major purposes:
Present a long-term vision of success to inform planning and management; Create a list of Departmental priorities to provide the flexibility to adjust the plan
to the department’s budget environment; and Develop a process for managing the Department’s commitments so that new
requests and initiatives are considered in light of existing commitments.
1 . B . I N F O R M A T I O N U S E D T O D E V E L O P T H E P L A N The Department and Steering Committee reviewed several sources of information to identify strategic issues and objectives. A biennial citywide community survey, completed in 2003, was a key source of input. The survey included a set of questions on parks, recreation and community services. The planning committee also reviewed the results of meetings with 18 community groups and sports leagues, which provided a qualitative assessment of user needs and goals. The plan also reflects quantitative data, including an assessment of data from the 2000 Census and from the Department’s operational statistics. Finally, the City Council priorities and citywide strategic planning principles were reviewed to ensure that the strategic plan supports the City’s overall efforts to provide excellence in service to the community of Redwood City.
1 . C . R E L A T I O N S H I P T O O T H E R P L A N N I N G A C T I V I T I E S Figure 1 illustrates the relationship between the strategic plan and other planning and management activities. The strategic plan is comprehensive: it provides guidance and priorities for all areas of the Department. As it moves forward into implementation, the Department will conduct detailed implementation planning to achieve its strategic priorities. For example, objectives A1, B1, C1, and D1 describe analyses of population growth and usage patterns that will determine when and where additional facilities, parkland, and programs will be needed to meet projected community needs. Finally, specific implementation actions will be funded and scheduled through project plans and the budget process. The Capital Improvement Program will be used to implement major facility improvements. Collectively, the Department’s planning and analysis tools will inform development of the parks and recreation element of the Redwood City General Plan Update, and General Plan goals and policies will inform updates of the Strategic Plan.

R e d w o o d C i t y P a r k s , R e c r e a t i o n , a n d C o m m u n i t y S e r v i c e s | 2004 Strategic Plan 1- 3
1 . D . D E P A R T M E N T A L P O L I C Y A N D A D V I S O R Y S T R U C T U R E The Department receives policy direction and guidance from the City Council and their appointed advisory bodies including the Parks and Recreation Commission, the Senior Affairs Commission and the Civic Cultural Commission. In addition, community input and guidance is received from the Youth and Teen Advisory Boards and the Fair Oaks Community Center Advisory Board.
1 . E . I M P L E M E N T A T I O N The Plan includes implementation responsibilities, timelines, and resource implications for each objective to facilitate effective implementation, which the Department will use to link the plan to the budget process. The Director will develop an annual progress report to review implementation progress. For each goal area, the report will describe the status of implementation, including successes and barriers, and list next steps and any resource or support needs. The report will provide an overall assessment of the effectiveness of the implementation, and identify opportunities to improve the linkage between planning and implementation.
Detailed analysis of projected program and facilities needs.
Specific project plans, budgets and schedules.
Overall guidance and priorities for organizational management.
Strategic Plan
Implementation Planning
Project Planning and Budgeting
(Capital Improvement Program)
Figure 1: Planning Levels
General Plan
Park and Recreation
Element
R e d w o o d C i t y P a r k s , R e c r e a t i o n , a n d C o m m u n i t y S e r v i c e s | 2004 Strategic Plan 1- 4
1 . F . U P D A T E P R O C E S S The plan will be revised as needed to reflect lessons learned during implementation and to reflect changing community needs. Comprehensive updates will take place every three years, drawing on community feedback, assessment of performance measures, internal staff input, and Parks and Recreation Commission or Council priorities.
1 . G . P L A N N I N G D E F I N I T I O N S The strategic plan uses a number of key terms: Core Purpose: The essential reason for the organization’s existence. Values: The norms and qualities organizational member’s value. Vision: The desired future state of the organization; the vision of success the organization strives to achieve. Mission: A description of why an organization exists—the key programs and services the organization provides. Goal Areas: The broad areas for improvement aligned to match the programs and service provided by the Department. Strategies: The approaches to be used to achieve the Department’s goals.

C h a p t e r 2 : S T R AT E G I C P L A N O V E R V I E W

R e d w o o d C i t y P a r k s , R e c r e a t i o n , a n d C o m m u n i t y S e r v i c e s | 2004 Strategic Plan
2-2
C h a p t e r 2 : S T R AT E G I C P L A N O V E R V I E W This section presents the core elements of the Strategic Plan in the following sections:
Guiding Framework Planning Context
2 . A . G U I D I N G F R A M E W O R K The Department’s mission, vision, values and goals form the foundation for the Strategic Plan and create a guiding framework for planning and decision-making. A description of community outcomes describes the results the plan will help bring about. Figure 2 illustrates the plan’s framework. M i s s i o n
Our mission is to build a great community together through people, parks, and programs. Our mission reflects two overarching principles. First, the community is the owner of the Department’s programs and facilities, providing program development and management and volunteer support. The mission also includes a commitment to managing and expanding the community’s resources, including conservation of natural resources and support for the City’s economic vitality. The result is the Department’s consistent efforts to create a great community—one that is vibrant, healthy, and strong. The Department fulfills its mission by carrying out six key functions:
Provide high-quality parks and recreational facilities. Provide high-quality recreational programs. Deliver effective support, education, and information services. Manage all City buildings and facilities. Create and maintain effective organizational processes. Recruit, support, retain and challenge great employees.
R e d w o o d C i t y P a r k s , R e c r e a t i o n , a n d C o m m u n i t y S e r v i c e s | 2004 Strategic Plan
2-3
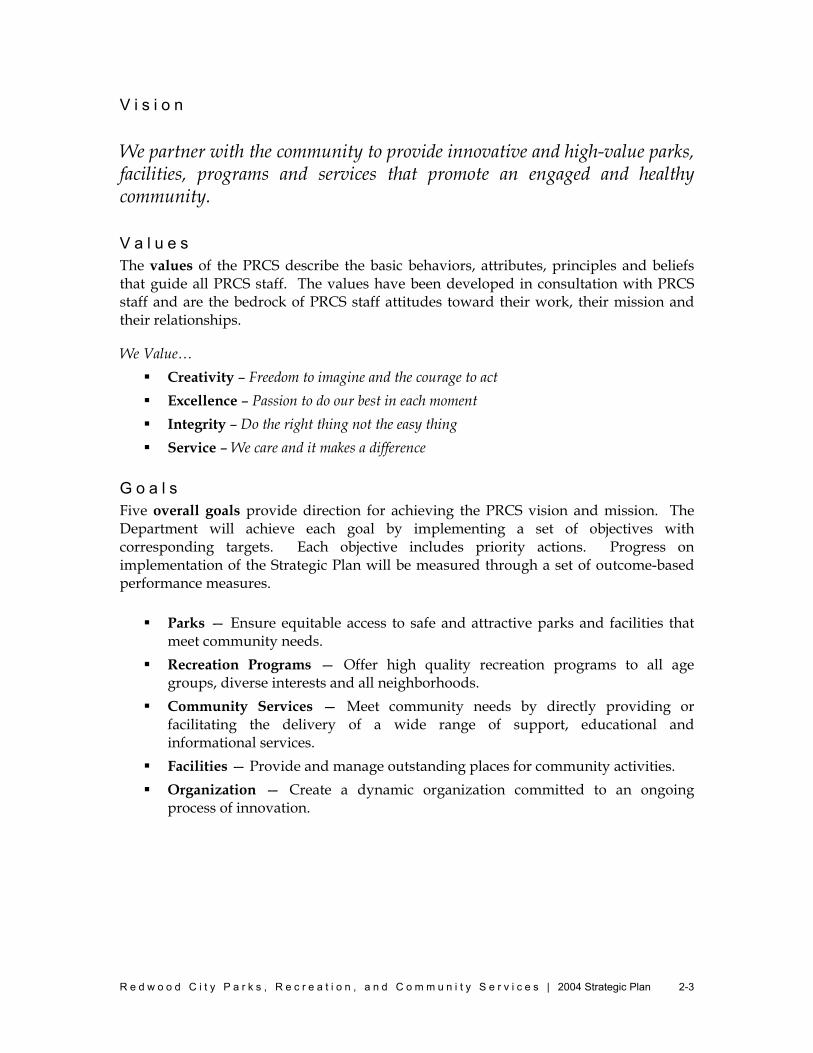
V i s i o n We partner with the community to provide innovative and high-value parks, facilities, programs and services that promote an engaged and healthy community. V a l u e s The values of the PRCS describe the basic behaviors, attributes, principles and beliefs that guide all PRCS staff. The values have been developed in consultation with PRCS staff and are the bedrock of PRCS staff attitudes toward their work, their mission and their relationships.
We Value… Creativity – Freedom to imagine and the courage to act Excellence – Passion to do our best in each moment Integrity – Do the right thing not the easy thing Service – We care and it makes a difference
G o a l s Five overall goals provide direction for achieving the PRCS vision and mission. The Department will achieve each goal by implementing a set of objectives with corresponding targets. Each objective includes priority actions. Progress on implementation of the Strategic Plan will be measured through a set of outcome-based performance measures.
Parks — Ensure equitable access to safe and attractive parks and facilities that meet community needs.
Recreation Programs — Offer high quality recreation programs to all age groups, diverse interests and all neighborhoods.
Community Services — Meet community needs by directly providing or facilitating the delivery of a wide range of support, educational and informational services.
Facilities — Provide and manage outstanding places for community activities. Organization — Create a dynamic organization committed to an ongoing
process of innovation.
R e d w o o d C i t y P a r k s , R e c r e a t i o n , a n d C o m m u n i t y S e r v i c e s | 2004 Strategic Plan
2-4
C o m m u n i t y B e n e f i t s In addition to delivering specific programs and services, the Department also has a broader role in supporting a healthy and strong community. In implementing the strategic plan, the Department will help provide many benefits to the community. The department’s efforts will complement those of citizens, community groups and other City departments to improve Redwood City. The list of community outcomes below, drawn from the California Parks and Recreation Society’s Vision Insight Planning document, illustrate the ways in which the Department will benefit the community.
Community image and sense of place Economic development Safety and security Health and wellness Human development Cultural unity Environmental resource protection Community problem solving Recreational experiences
R e d w o o d C i t y P a r k s , R e c r e a t i o n , a n d C o m m u n i t y S e r v i c e s | 2004 Strategic Plan
2-5
Figure 2: Strategic Plan Framework
R e d w o o d C i t y P a r k s , R e c r e a t i o n , a n d C o m m u n i t y S e r v i c e s | 2004 Strategic Plan
2-6
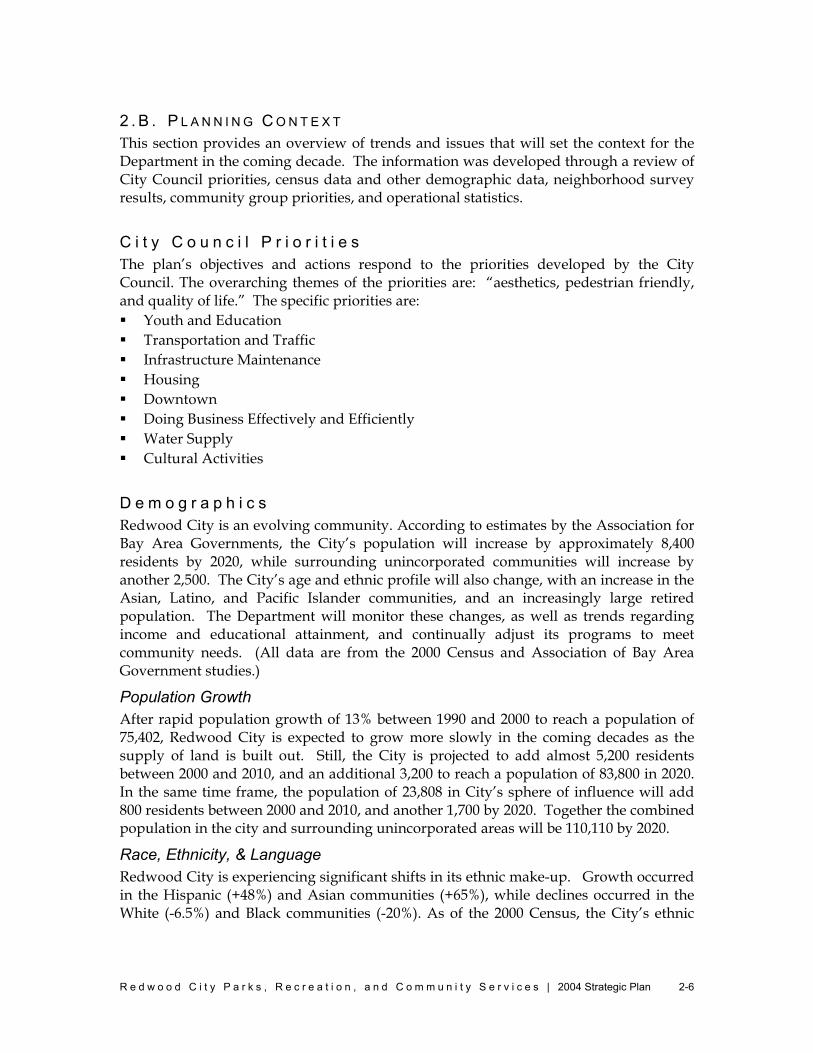
2 . B . P L A N N I N G C O N T E X T This section provides an overview of trends and issues that will set the context for the Department in the coming decade. The information was developed through a review of City Council priorities, census data and other demographic data, neighborhood survey results, community group priorities, and operational statistics. C i t y C o u n c i l P r i o r i t i e s The plan’s objectives and actions respond to the priorities developed by the City Council. The overarching themes of the priorities are: “aesthetics, pedestrian friendly, and quality of life.” The specific priorities are: Youth and Education Transportation and Traffic Infrastructure Maintenance Housing Downtown Doing Business Effectively and Efficiently Water Supply Cultural Activities
D e m o g r a p h i c s Redwood City is an evolving community. According to estimates by the Association for Bay Area Governments, the City’s population will increase by approximately 8,400 residents by 2020, while surrounding unincorporated communities will increase by another 2,500. The City’s age and ethnic profile will also change, with an increase in the Asian, Latino, and Pacific Islander communities, and an increasingly large retired population. The Department will monitor these changes, as well as trends regarding income and educational attainment, and continually adjust its programs to meet community needs. (All data are from the 2000 Census and Association of Bay Area Government studies.)
Population Growth After rapid population growth of 13% between 1990 and 2000 to reach a population of 75,402, Redwood City is expected to grow more slowly in the coming decades as the supply of land is built out. Still, the City is projected to add almost 5,200 residents between 2000 and 2010, and an additional 3,200 to reach a population of 83,800 in 2020. In the same time frame, the population of 23,808 in City’s sphere of influence will add 800 residents between 2000 and 2010, and another 1,700 by 2020. Together the combined population in the city and surrounding unincorporated areas will be 110,110 by 2020.
Race, Ethnicity, & Language Redwood City is experiencing significant shifts in its ethnic make-up. Growth occurred in the Hispanic (+48%) and Asian communities (+65%), while declines occurred in the White (-6.5%) and Black communities (-20%). As of the 2000 Census, the City’s ethnic
R e d w o o d C i t y P a r k s , R e c r e a t i o n , a n d C o m m u n i t y S e r v i c e s | 2004 Strategic Plan
2-7
make-up was White 53.9%, Hispanic 31.2%, Asian 8.9%, African American 2.5%, Native American 0.5%, Hawaiian/Other Pacific Islander 0.9%, and Other 2.1%.
Age From 1990-2000 three age groups experienced significant growth. The recent “baby boom echo” in the 5-14 group grew by 27%, while the 35-64 group grew by 32%. The 75+ age group also grew by 32%, with the 85+ group growing by 60%. These shifts suggest the need to continually reassess the quantity and design of programs, services and facilities to meet changing age-related needs.
Income In Redwood City the median household income rose 55% from $42,962 to $66,748 from 1990 to 2000. However, the regional economic slow down has eroded some of these income gains. Also, 14.3% of households earn less than $25,000 per year; 3.9% of families (709) are below the poverty line; and 9.1% of families with female householders and with no husband present are below the poverty line.
Households Redwood City is currently home to 28,060 households. Families with children comprise 34.1% of households, with 24.6% of these being married couple households and 9.5% being single-parent households. Single-parent female-headed households, which generally have lower incomes than single-parent male-headed or married couple households, constitute 6.4% of the households. Almost 69% of households do not have children present.
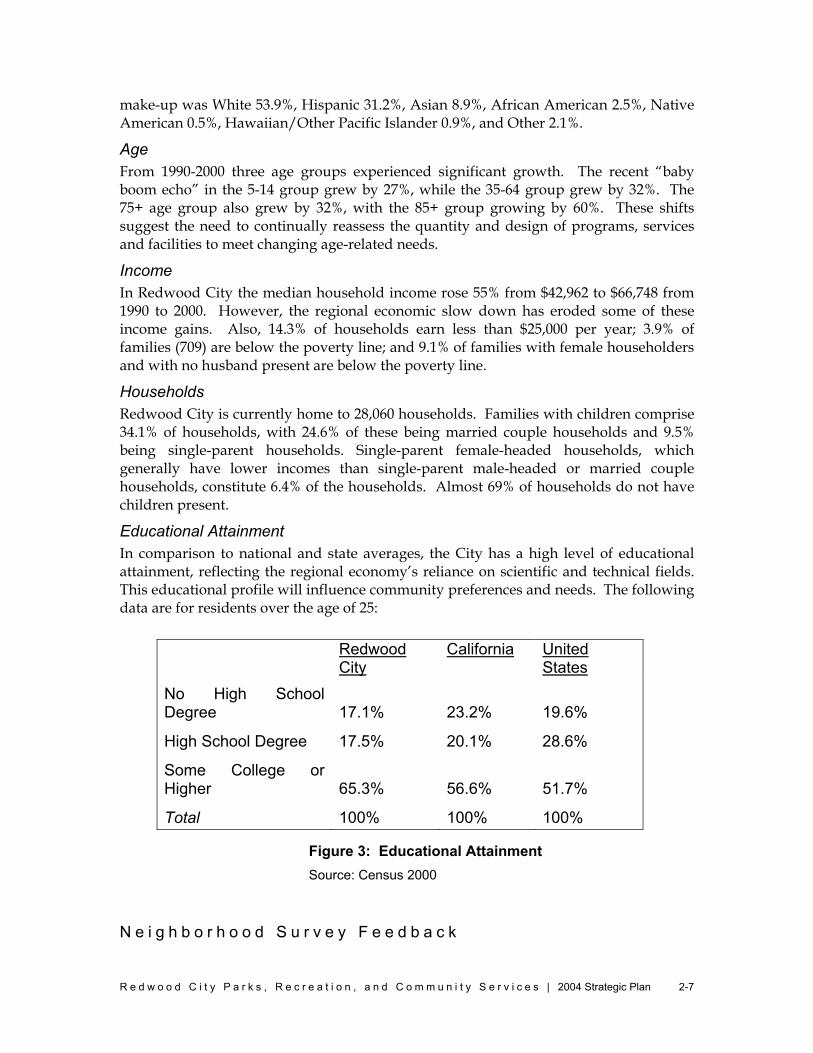
Educational Attainment In comparison to national and state averages, the City has a high level of educational attainment, reflecting the regional economy’s reliance on scientific and technical fields. This educational profile will influence community preferences and needs. The following data are for residents over the age of 25:
Redwood City
California United States
No High School Degree 17.1% 23.2% 19.6%
High School Degree 17.5% 20.1% 28.6%
Some College or Higher 65.3% 56.6% 51.7%
Total 100% 100% 100% N e i g h b o r h o o d S u r v e y F e e d b a c k
Figure 3: Educational Attainment Source: Census 2000
R e d w o o d C i t y P a r k s , R e c r e a t i o n , a n d C o m m u n i t y S e r v i c e s | 2004 Strategic Plan
2-8
The City’s biennial neighborhood survey highlights both areas of success and areas in need of improvement. The 2001 survey included a special focus on parks and recreation. Overall, the survey showed that Department’s programs, services and facilities are well used. The survey also shows a high rate of satisfaction with services in the general community and higher rates of satisfaction among those who had used a park, recreation facility, or recreation program in the 12 months prior to the survey. According to the survey:
High Rate of Use — Sixty-five percent (69%) of the residents indicated that they or someone in their household had used a Redwood City park, recreation facility, or recreation program in the 12 months prior to the survey.
High Rate of Satisfaction — According to the survey 77% of the residents surveyed rated recreation opportunities, services, and programs as excellent or good recreation opportunities (29% gave a rating of ‘Excellent’, and 48 % thought the were ‘Good’). Respondents who had used a park, recreation facility, or program had a much higher satisfaction rating (88%) than non-users (58%).
Areas for Improvement — Of those ranked the department’s offerings as fair or poor, sixteen percent (16%) of respondents indicating that they felt there were ‘Not enough suitable parks’, 12 percent said ‘Poor quality/dirty/poorly maintained’, and 11 percent felt there were ‘Not enough recreation/family activities’.
Park and Recreation Maintenance — Respondents were also asked to rate the quality of the maintenance of Department’s park and recreation opportunities. Similarly to the ratings of the recreation facilities, an 81% majority of respondents felt that the maintenance was either ‘Excellent’ or ‘Good.
C o m m u n i t y O u t r e a c h F e e d b a c k The Plan Steering Committee identified representative groups, developed a presentation detailing the Department’s facilities, programs and services and created a tool to collect participant input in a standard. Committee members made presentations to 18 community groups in teams of two (one department staff person and one commissioner). These groups included neighborhood associations, senior and youth organizations, sports associations, service clubs and groups representing various ethnic groups within the City. Approximately 250 survey responses were received. U s a g e P a t t e r n s The Department monitors program use patterns to identify areas of growing community need and interest. The following trends illustrate the changing demand for services and will be assessed in developing new programs and adjusting existing programs to most effectively meet community need. (See Appendix 6: Facility Usage Statistics.)
Field Use — Community groups who participated in focus groups during the strategic planning process reported that athletic fields were overused or unavailable. Department statistics confirm this perception, with athletic field use increasing an average of 11% each year from 1998 to 2003, for a total increase of 64%. (See Appendix 5: Field Use Statistics.)
R e d w o o d C i t y P a r k s , R e c r e a t i o n , a n d C o m m u n i t y S e r v i c e s | 2004 Strategic Plan
2-9
Recreational Programs — Participation in the Department’s recreational programs has increased in recent years. Recent annual participation levels have increased in adult team sports (10%), youth swim (10%), special interest classes (5%), after school learning programs (7 sites). Similarly, referrals at the Fair Oaks Community Center experienced a 10% annual growth rate. (See Appendix 6: Facilities Usage Statistics.)
Facilities Use — Visits to the Department’s nine community facilities and pools increased 8% from fiscal year 2001/2002 to fiscal year 2002/2003. Over the prior year, i.e., fiscal year 2000/2001 to 2001/2002 visits had declined by 5%. (See Appendix 6: Facilities Usage Statistics.)
Park Visits — The Department will develop methods for collecting park attendance information.
E n v i r o n m e n t a l a n d C o n s e r v a t i o n I s s u e s Conservation of natural resources is an increasingly important issue for the Department. Several City and Departmental mandates and programs are currently in place, but additional measures are needed. Key issues include:
Water Conservation — The City as a whole is using more than its allotment from the SFPUC system and must conserve 1,946 acre-feet of water. When the SFPUC next declares a water shortage, Redwood City will be required to make relatively large water use cutbacks. If San Francisco declares a 10% system shortage, for example, Redwood City will be required to reduce water use by 17.5%. The Recycled Water Task Force has prepared recommendations that city staff are implementing. (See Appendix 7: Recycled Water Task Force Report Executive Summary.)
Energy Conservation — The changing regulatory framework for electricity has contributed to unpredictable energy prices over the last two years. This uncertainty and California energy costs that are historically the highest in the country place an ongoing emphasis on energy conservation.
Integrated Pest Management — Proven technologies are available and new approaches are being developed for controlling pests with minimal use of toxic chemicals. These options can be cost-effective while imposing less downstream impacts on the environment and waste management systems.
Recycling — The state has developed recycling targets for California cities. Redwood City has met its official target and continues to conserve materials as an ongoing goal.
Wetlands — Redwood City has a large amount of land along the Bay Shore, which includes wetlands. The City and Department work in close partnership with the Department of Fish and Game and the Bay Conservation and Development Commission to manage this important resource.
Green Buildings — An emerging field in environmental management focuses on the sustainability and health effects of building materials, passive solar energy and conservation, and the use of landscaping to reduce environmental impacts. The Department seeks opportunities to cost-effectively implement “green building” principles.
C h a p t e r 3 : STRATEGIC A C T I O N S
R e d w o o d C i t y P a r k s , R e c r e a t i o n , a n d C o m m u n i t y S e r v i c e s | 2004 Strategic Plan
3-2
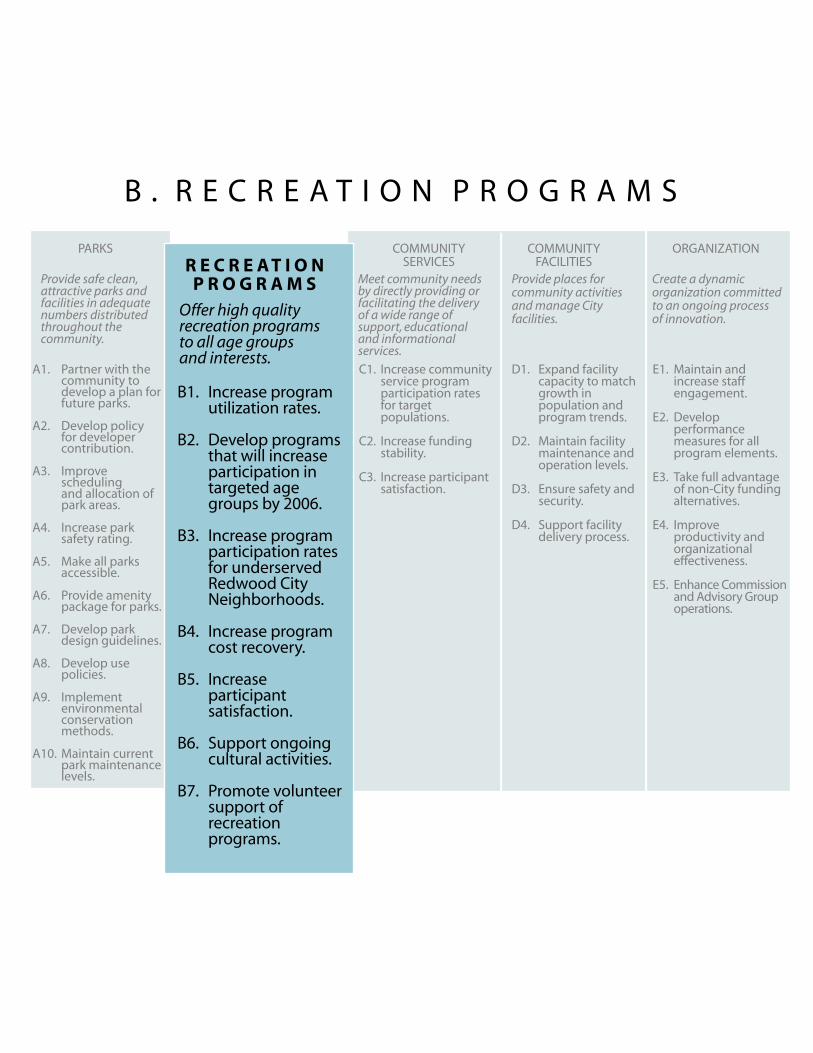
C h a p t e r 3 : S T R AT E G I C A C T I O N S The following pages document the range of strategies and objectives developed through the strategic planning process for each of the five goal areas. The results will be used to help guide implementation of Redwood City Parks, Recreation and Community Services Strategic Plan. The five goal areas are:
A. Parks B. Recreation Programs C. Community Services D. Community Facilities E. Organization
Each section includes the following elements:
Goal Statement: The overall result that the Department is committed to achieving.
Objectives: Measurable outcomes that create manageable milestones for planning.
Targets: Specific indicators for measuring achievement of objectives.
Actions: The steps the Department will take to achieve the objectives.
R E F I N I N G T H E P L A N The material in this section will be refined during the update process. Some of the quantitative targets are preliminary estimates of how much improvement the department can achieve. For example, Objective A4 currently reads: “Increase neighborhood satisfaction rating from 83% to 90%.” The department will assess how quickly or slowly this statistic and the other statistics change based on several years of data. Based on this assessment, the Department will adjust the targets to reflect benchmarks that are achievable and yet “stretch” the organization to continually improve its performance. In other cases, there is no existing measurement and the first task of the department will be to establish a baseline measurement.
Measurement will occur in some cases through the use of existing operational data. In other cases, new data collection methods will be needed. As the system is built over time, the measures will be used both to ensure Departmental accountability to plan goals and to identify additional strategic issues. Ultimately, performance measures in the development of departmental budgets.
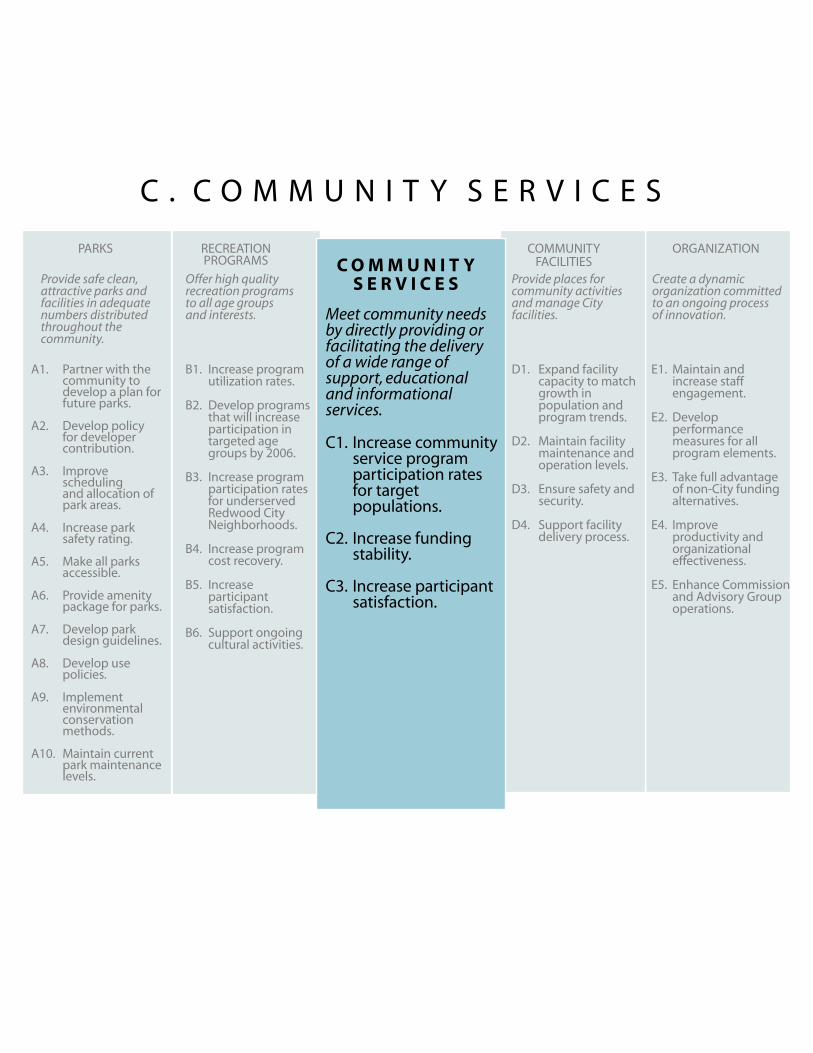
P A R K SCOMMUNITY
FACILITIESORGANIZATION
Maintain and increase staff engagement.
Develop performance measures for all program elements.
Take full advantageof non-City fundingalternatives.
Improve productivity and organizationaleffectiveness.
Enhance Commissionand Advisory Groupoperations.
E1.
E2.
E3.
E4.
E5.
Increase programutilization rates.
Develop programsthat will increaseparticipation intargeted age groups by 2006.
Increase program participation ratesfor underserved Redwood City Neighborhoods.
Increase programcost recovery.
Increase participantsatisfaction.
Support ongoingcultural activities.
Promote volunteersupport of recreation programs.
B1.
B2.
B3.
B4.
B5.
B6.
B7.
A1.
A2.
A3.
A4.
A5.
A6.
A7.
A8.
A9.
A10.
Partner with thecommunity to develop a plan for future parks.
Develop policyfor developercontribution.
Improve scheduling and allocation of park areas.
Increase park safety rating.
Make all parksaccessible.
Provide amenitypackage for parks.
Develop parkdesign guidelines.
Develop use policies.
Implement environmentalconservation methods.
Maintain current park maintenance levels.
RECREATIONPROGRAMS
COMMUNITYSERVICES
Expand facilitycapacity to matchgrowth in population and program trends.
Maintain facilitymaintenance andoperation levels. Ensure safety andsecurity.
Support facilitydelivery process.
D1.
D2.
D3.
D4.
Increase communityservice programparticipation rates for target populations.
Increase funding stability.
Increase participantsatisfaction.
C1.
C2.
C3.
Provide safe clean, attractive parks andfacilities in adequatenumbers distributedthroughout the community.
Offer high quality recreation programs to all age groups and interests.
Meet community needs by directly providing or facilitating the delivery of a wide range ofsupport, educational and informational services.
Provide places for community activities and manage Cityfacilities.
Create a dynamic organization committed to an ongoing processof innovation.
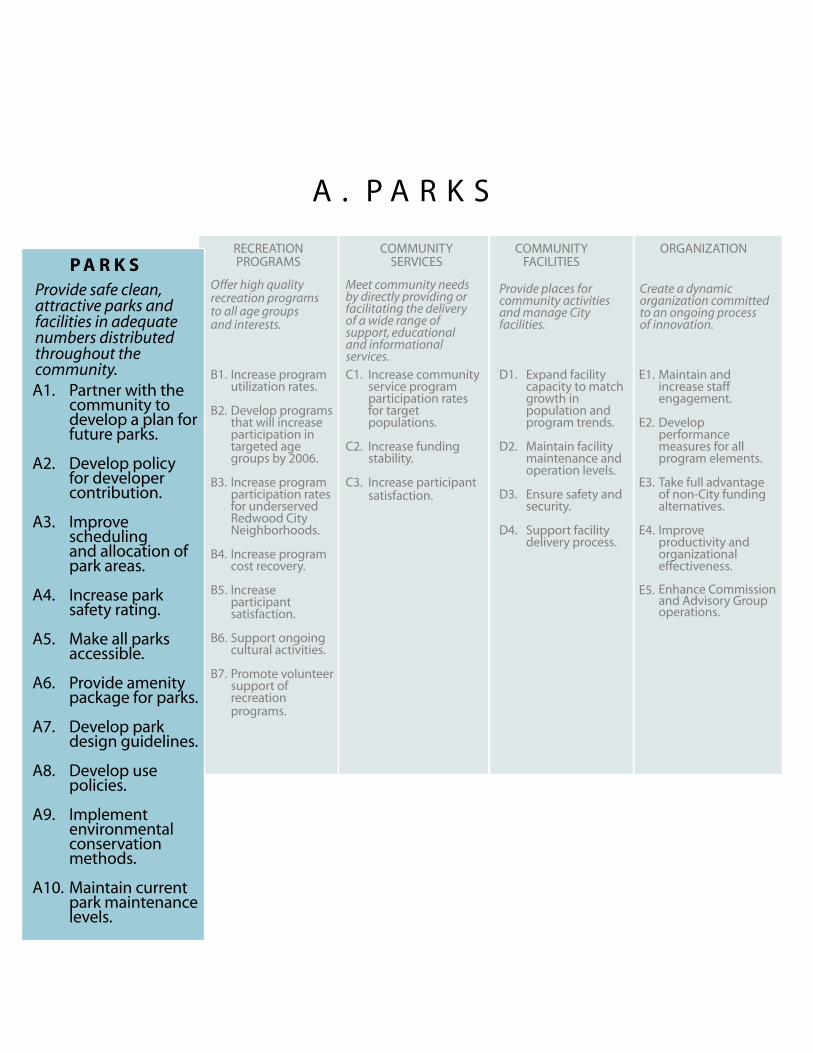
A . P A R K S

R e d w o o d C i t y P a r k s , R e c r e a t i o n , a n d C o m m u n i t y S e r v i c e s | 2004 Strategic Plan
3-4
A . PA R K S GOAL: Ensure equitable access to safe and
attractive parks and facilities that meet community needs.
Our goal is to ensure we respond to community needs by providing equitable access to safe and attractive parks. We found that Redwood City is below the average acreage of parkland for Peninsula Cities, and our community told us that we need more acreage, particularly in the area of sports fields. This situation will only be exacerbated as the population of our City continues to grow. Our strategies in this area are threefold. First, we need to identify locations and new funding sources for the creation of new parks. Second, we need to get the most out of our existing facilities by improving scheduling, space allocation along with park safety and amenities found in each park. Lastly, we need to focus energy on creating beautiful public spaces based on sound environmental protection and water conservation premises.
O B J E C T I V E S A N D T A R G E T S A1 Partner with the Community to develop a plan for type, location and size for
future Community parks.
Target: To develop the Community supported plan by 2005.
Rationale: The amount of park acreage maintained by the City per 1000 residents is below the average for Peninsula cities (see Appendix 3). This deficit will grow as the city’s population grows. The Department will develop a plan to meet the need for additional parkland. The plan will develop a focus for the future and establish a management plan to achieve specific facility goals by establishing developer related fees and park land dedication requirements.
A c t i o n s
T i m e F r a m e (Completion Target Year or Implementation Cycle)
L e a d R e s p o n s i b i l i t y
F u n d i n g S o u r c e s
a. Bring together key stakeholders including the Community Development Department to work with a Consultant as a Task Force to develop the plan vision
2005 Parks and Recreation Commission
General Fund

R e d w o o d C i t y P a r k s , R e c r e a t i o n , a n d C o m m u n i t y S e r v i c e s | 2004 Strategic Plan
3-5
b. Identify underserved areas of the City and target potential parkland acquisition or other strategies in those areas
2006 P&R Commission
Prop. 40,CIP, and Other Grant Funding
c. Work with school districts to maximize development of athletic field opportunities 2006 Programs
Superintendent
In-Kind and Re-Programmed Funding
d. Increase amount of public space and use of public environment through design, amenities, plazas, and other innovations
2006 Parks/ Facilities Superintendent
Park Development Fees, Prop 40, CIP
A2 Develop Policy for Developer Contribution to Parkland.
Target: Create developer standards by December 2005.
Rationale: The Department currently lacks standards describing how much land developers will provide for parks and open space. The Department will assess regional and state benchmarks, as well as local conditions, to establish this standard. The goal is to ensure that new development maintains or increases the City’s ability to meet community needs for parks and recreation. The actions here will implement the Quimby Act.
A c t i o n s
T i m e F r a m e (Completion Target Year or Implementation Cycle)
L e a d R e s p o n s i b i l i t y
F u n d i n g S o u r c e s
a. Develop and implement a standard for developer contribution to Redwood City community parkland
2005 Park and Recreation Commission
General Fund
b. Develop a standard for developer contributions to open space not maintained by the City 2005
PRCS with Community Development Department
General Fund PRCS,
Community Development
& Grant Funds
c. Develop a fee that residential and commercial developers would pay in lieu of onsite land dedication
2005
PRCS with Community Development Department
General Fund PRCS,
Community Development
& Grant Funds
R e d w o o d C i t y P a r k s , R e c r e a t i o n , a n d C o m m u n i t y S e r v i c e s | 2004 Strategic Plan
3-6
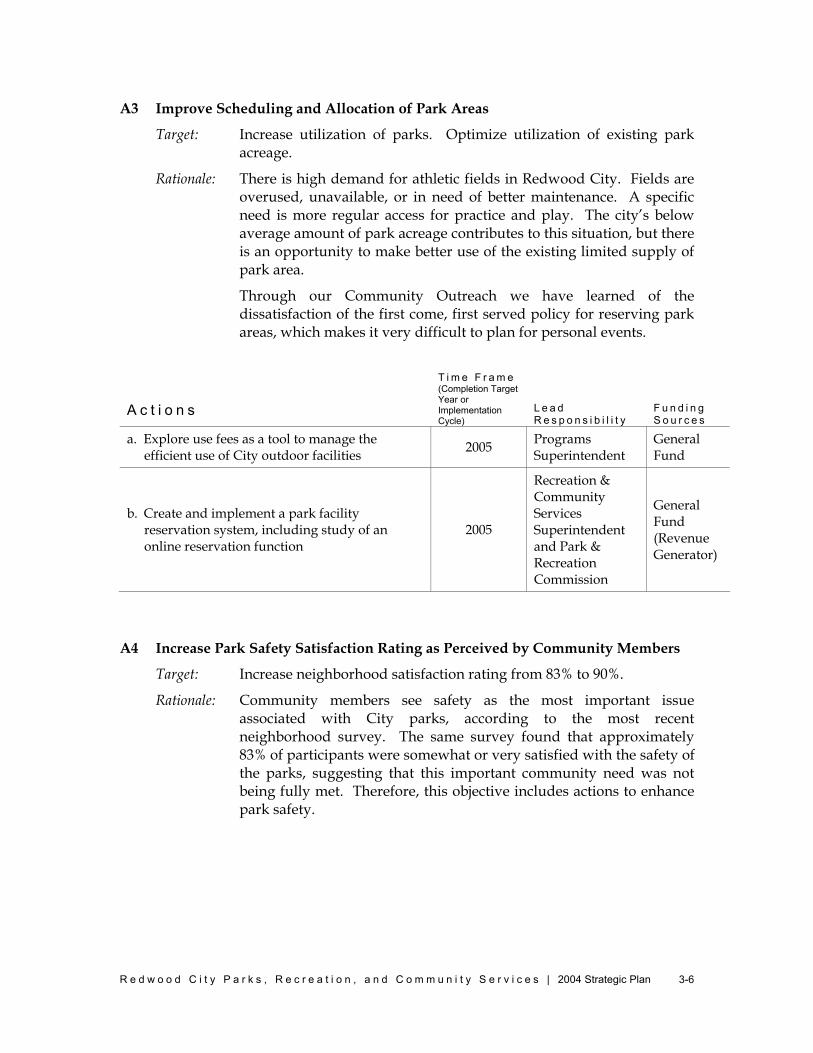
A3 Improve Scheduling and Allocation of Park Areas
Target: Increase utilization of parks. Optimize utilization of existing park acreage.
Rationale: There is high demand for athletic fields in Redwood City. Fields are overused, unavailable, or in need of better maintenance. A specific need is more regular access for practice and play. The city’s below average amount of park acreage contributes to this situation, but there is an opportunity to make better use of the existing limited supply of park area.
Through our Community Outreach we have learned of the dissatisfaction of the first come, first served policy for reserving park areas, which makes it very difficult to plan for personal events.
A c t i o n s
T i m e F r a m e (Completion Target Year or Implementation Cycle)
L e a d R e s p o n s i b i l i t y
F u n d i n g S o u r c e s
a. Explore use fees as a tool to manage the efficient use of City outdoor facilities 2005 Programs
Superintendent General Fund
b. Create and implement a park facility reservation system, including study of an online reservation function
2005
Recreation & Community Services Superintendent and Park & Recreation Commission
General Fund (Revenue Generator)
A4 Increase Park Safety Satisfaction Rating as Perceived by Community Members
Target: Increase neighborhood satisfaction rating from 83% to 90%.
Rationale: Community members see safety as the most important issue associated with City parks, according to the most recent neighborhood survey. The same survey found that approximately 83% of participants were somewhat or very satisfied with the safety of the parks, suggesting that this important community need was not being fully met. Therefore, this objective includes actions to enhance park safety.

R e d w o o d C i t y P a r k s , R e c r e a t i o n , a n d C o m m u n i t y S e r v i c e s | 2004 Strategic Plan
3-7
A c t i o n s
T i m e F r a m e (Completion Target Year or Implementation Cycle)
L e a d R e s p o n s i b i l i t y
F u n d i n g S o u r c e s
a. Assess safety issues in parks 2005 Park & Facilities Superintendent General Fund
b. Improve security lighting at all park and community facilities 2007
Facilities Manager CIP
c. Use design techniques to enhance public safety 2008 Park & Facilities Superintendent CIP
d. Expand use of community volunteer programs to provide a neighborhood-watch function in the parks
2008
Director and Parks &
Recreation Commission
General Fund
e. Coordinate with other city departments to address safety issues, including police, fire, public works, etc.
2008 Director General Fund
A5 Make All Parks Universally Accessible
Target: Maximize the use of “universal design” principles.
Rationale: The City is committed to improving access to its parks for its residents of all ability levels, as is required by the Americans with Disabilities Act and other state and federal laws and regulations. The city will also use “universal design” concepts to the greatest extent possible, defined as “the design of products and environments to be usable by all people, to the greatest extent possible, without adaptation or specialized design.” This approach improves the usability of facilities and environments for everyone. These actions respond to the community’s support of accessibility improvements, as seen in the community survey. (See The Principles of Universal Design, Version 2.0 - 4/1/97, The Center For Universal Design, North Carolina State University.)
A c t i o n s
T i m e F r a m e (Completion Target Year or Implementation Cycle)
L e a d R e s p o n s i b i l i t y
F u n d i n g S o u r c e s
a. Update Park Access Transition Plan 2006 Park & Facilities Superintendents
General Fund
b. Identify and implement necessary improvements
2007 Park & Facilities Superintendents CIP
R e d w o o d C i t y P a r k s , R e c r e a t i o n , a n d C o m m u n i t y S e r v i c e s | 2004 Strategic Plan
3-8
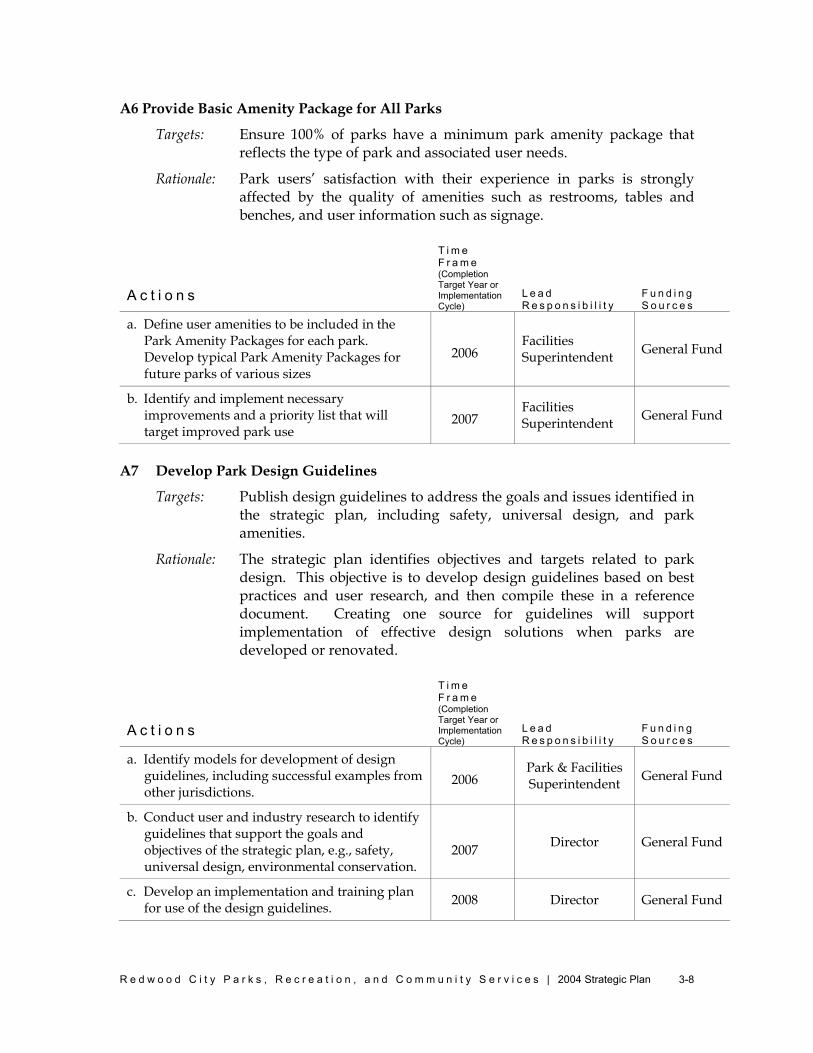
A6 Provide Basic Amenity Package for All Parks
Targets: Ensure 100% of parks have a minimum park amenity package that reflects the type of park and associated user needs.
Rationale: Park users’ satisfaction with their experience in parks is strongly affected by the quality of amenities such as restrooms, tables and benches, and user information such as signage.
A c t i o n s
T i m e F r a m e (Completion Target Year or Implementation Cycle)
L e a d R e s p o n s i b i l i t y
F u n d i n g S o u r c e s
a. Define user amenities to be included in the Park Amenity Packages for each park. Develop typical Park Amenity Packages for future parks of various sizes
2006 Facilities Superintendent General Fund
b. Identify and implement necessary improvements and a priority list that will target improved park use
2007 Facilities Superintendent General Fund
A7 Develop Park Design Guidelines
Targets: Publish design guidelines to address the goals and issues identified in the strategic plan, including safety, universal design, and park amenities.
Rationale: The strategic plan identifies objectives and targets related to park design. This objective is to develop design guidelines based on best practices and user research, and then compile these in a reference document. Creating one source for guidelines will support implementation of effective design solutions when parks are developed or renovated.
A c t i o n s
T i m e F r a m e (Completion Target Year or Implementation Cycle)
L e a d R e s p o n s i b i l i t y
F u n d i n g S o u r c e s
a. Identify models for development of design guidelines, including successful examples from other jurisdictions.
2006 Park & Facilities Superintendent General Fund
b. Conduct user and industry research to identify guidelines that support the goals and objectives of the strategic plan, e.g., safety, universal design, environmental conservation.
2007 Director General Fund
c. Develop an implementation and training plan for use of the design guidelines. 2008 Director General Fund
R e d w o o d C i t y P a r k s , R e c r e a t i o n , a n d C o m m u n i t y S e r v i c e s | 2004 Strategic Plan
3-9
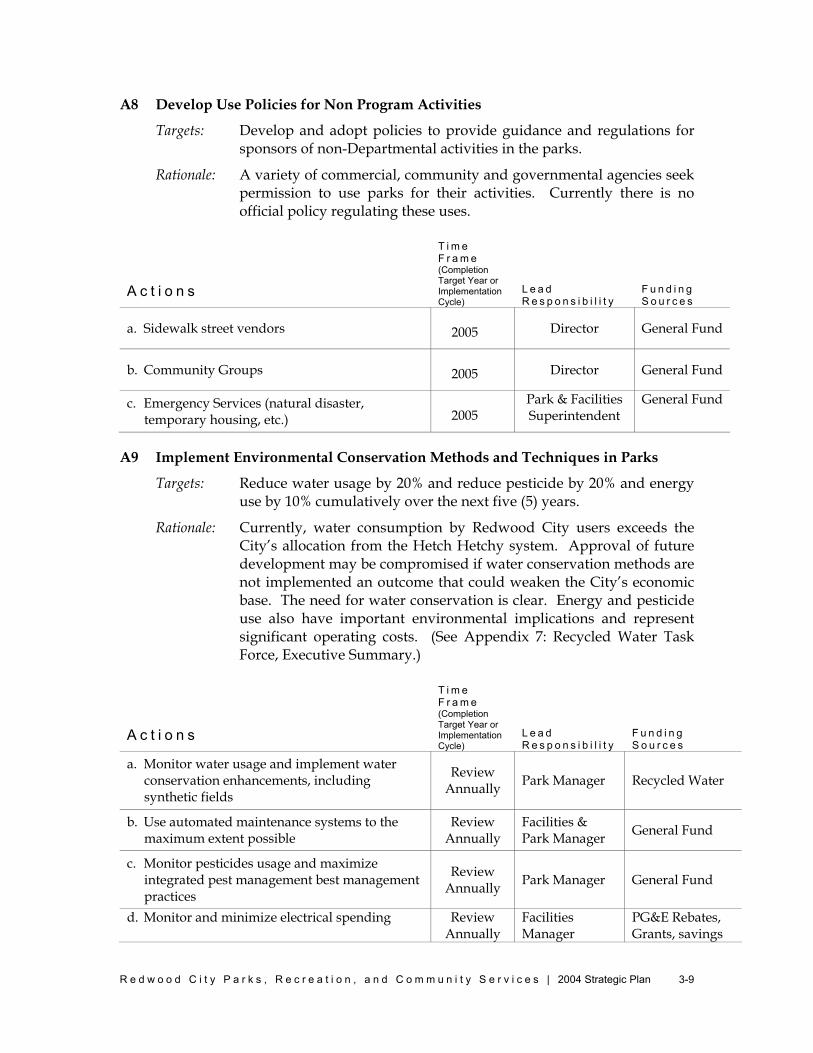
A8 Develop Use Policies for Non Program Activities
Targets: Develop and adopt policies to provide guidance and regulations for sponsors of non-Departmental activities in the parks.
Rationale: A variety of commercial, community and governmental agencies seek permission to use parks for their activities. Currently there is no official policy regulating these uses.
A c t i o n s
T i m e F r a m e (Completion Target Year or Implementation Cycle)
L e a d R e s p o n s i b i l i t y
F u n d i n g S o u r c e s
a. Sidewalk street vendors 2005 Director General Fund
b. Community Groups 2005 Director General Fund
c. Emergency Services (natural disaster, temporary housing, etc.) 2005
Park & Facilities Superintendent
General Fund
A9 Implement Environmental Conservation Methods and Techniques in Parks
Targets: Reduce water usage by 20% and reduce pesticide by 20% and energy use by 10% cumulatively over the next five (5) years.
Rationale: Currently, water consumption by Redwood City users exceeds the City’s allocation from the Hetch Hetchy system. Approval of future development may be compromised if water conservation methods are not implemented an outcome that could weaken the City’s economic base. The need for water conservation is clear. Energy and pesticide use also have important environmental implications and represent significant operating costs. (See Appendix 7: Recycled Water Task Force, Executive Summary.)
A c t i o n s
T i m e F r a m e (Completion Target Year or Implementation Cycle)
L e a d R e s p o n s i b i l i t y
F u n d i n g S o u r c e s
a. Monitor water usage and implement water conservation enhancements, including synthetic fields
Review Annually Park Manager Recycled Water
b. Use automated maintenance systems to the maximum extent possible
Review Annually
Facilities & Park Manager General Fund
c. Monitor pesticides usage and maximize integrated pest management best management practices
Review Annually Park Manager General Fund
d. Monitor and minimize electrical spending Review Annually
Facilities Manager
PG&E Rebates, Grants, savings
R e d w o o d C i t y P a r k s , R e c r e a t i o n , a n d C o m m u n i t y S e r v i c e s | 2004 Strategic Plan
3-10
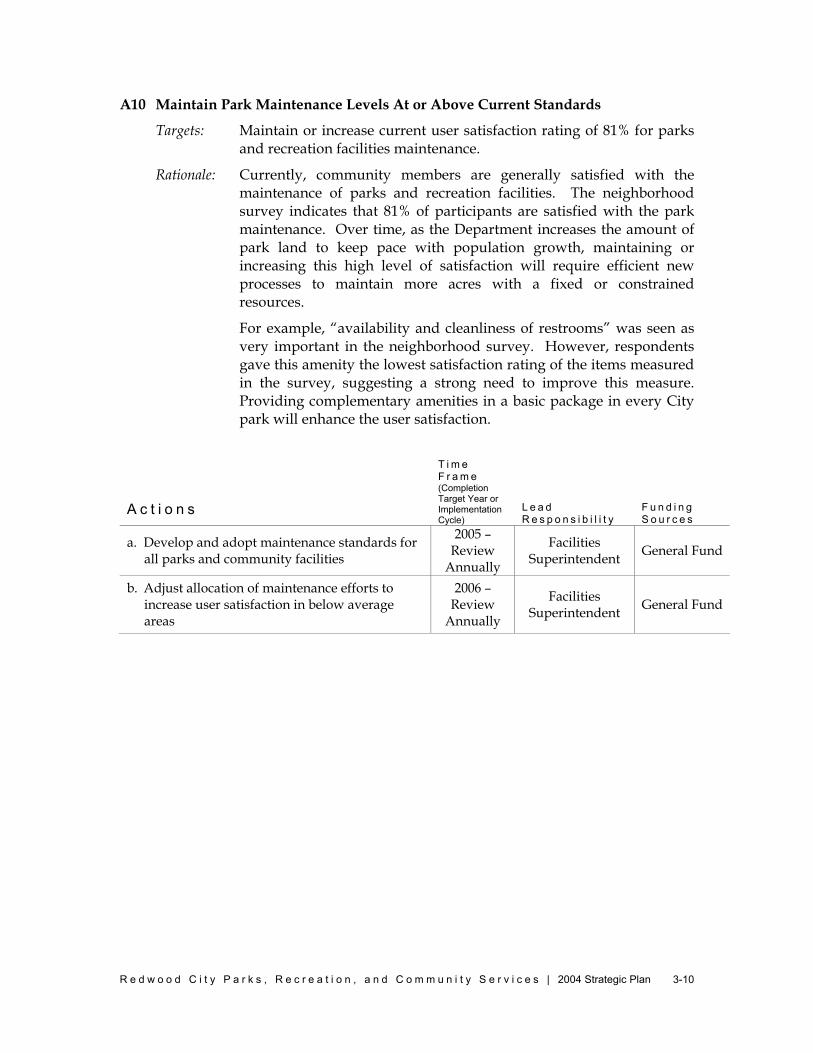
A10 Maintain Park Maintenance Levels At or Above Current Standards
Targets: Maintain or increase current user satisfaction rating of 81% for parks and recreation facilities maintenance.
Rationale: Currently, community members are generally satisfied with the maintenance of parks and recreation facilities. The neighborhood survey indicates that 81% of participants are satisfied with the park maintenance. Over time, as the Department increases the amount of park land to keep pace with population growth, maintaining or increasing this high level of satisfaction will require efficient new processes to maintain more acres with a fixed or constrained resources.
For example, “availability and cleanliness of restrooms” was seen as very important in the neighborhood survey. However, respondents gave this amenity the lowest satisfaction rating of the items measured in the survey, suggesting a strong need to improve this measure. Providing complementary amenities in a basic package in every City park will enhance the user satisfaction.
A c t i o n s
T i m e F r a m e (Completion Target Year or Implementation Cycle)
L e a d R e s p o n s i b i l i t y
F u n d i n g S o u r c e s
a. Develop and adopt maintenance standards for all parks and community facilities
2005 – Review
Annually
Facilities Superintendent General Fund
b. Adjust allocation of maintenance efforts to increase user satisfaction in below average areas
2006 – Review
Annually
Facilities Superintendent General Fund
PARKS COMMUNITYFACILITIES
ORGANIZATION
Maintain and increase staff engagement.
Develop performance measures for all program elements.
Take full advantageof non-City fundingalternatives.
Improve productivity and organizationaleffectiveness.
Enhance Commissionand Advisory Groupoperations.
E1.
E2.
E3.
E4.
E5.
Increase programutilization rates.
Develop programsthat will increaseparticipation intargeted age groups by 2006.
Increase program participation ratesfor underserved Redwood City Neighborhoods.
Increase programcost recovery.
Increase participantsatisfaction.
Support ongoingcultural activities.
Promote volunteersupport of recreation programs.
B1.
B2.
B3.
B4.
B5.
B6.
B7.
A1.
A2.
A3.
A4.
A5.
A6.
A7.
A8.
A9.
A10.
Partner with thecommunity to develop a plan for future parks.
Develop policyfor developercontribution.
Improve scheduling and allocation of park areas.
Increase park safety rating.
Make all parksaccessible.
Provide amenitypackage for parks.
Develop parkdesign guidelines.
Develop use policies.
Implement environmentalconservation methods.
Maintain current park maintenance levels.
R E C R E A T I O NP R O G R A M S
COMMUNITYSERVICES
Expand facilitycapacity to matchgrowth in population and program trends.
Maintain facilitymaintenance andoperation levels. Ensure safety andsecurity.
Support facilitydelivery process.
D1.
D2.
D3.
D4.
Increase communityservice programparticipation rates for target populations.
Increase funding stability.
Increase participantsatisfaction.
C1.
C2.
C3.
Provide safe clean, attractive parks andfacilities in adequatenumbers distributedthroughout the community.
Offer high quality recreation programs to all age groups and interests.
Meet community needs by directly providing or facilitating the delivery of a wide range ofsupport, educational and informational services.
Provide places for community activities and manage Cityfacilities.
Create a dynamic organization committed to an ongoing processof innovation.
B . R E C R E A T I O N P R O G R A M S
R e d w o o d C i t y P a r k s , R e c r e a t i o n , a n d C o m m u n i t y S e r v i c e s | 2004 Strategic Plan
3-12
B . R E C R E A T I O N P R O G R A M S
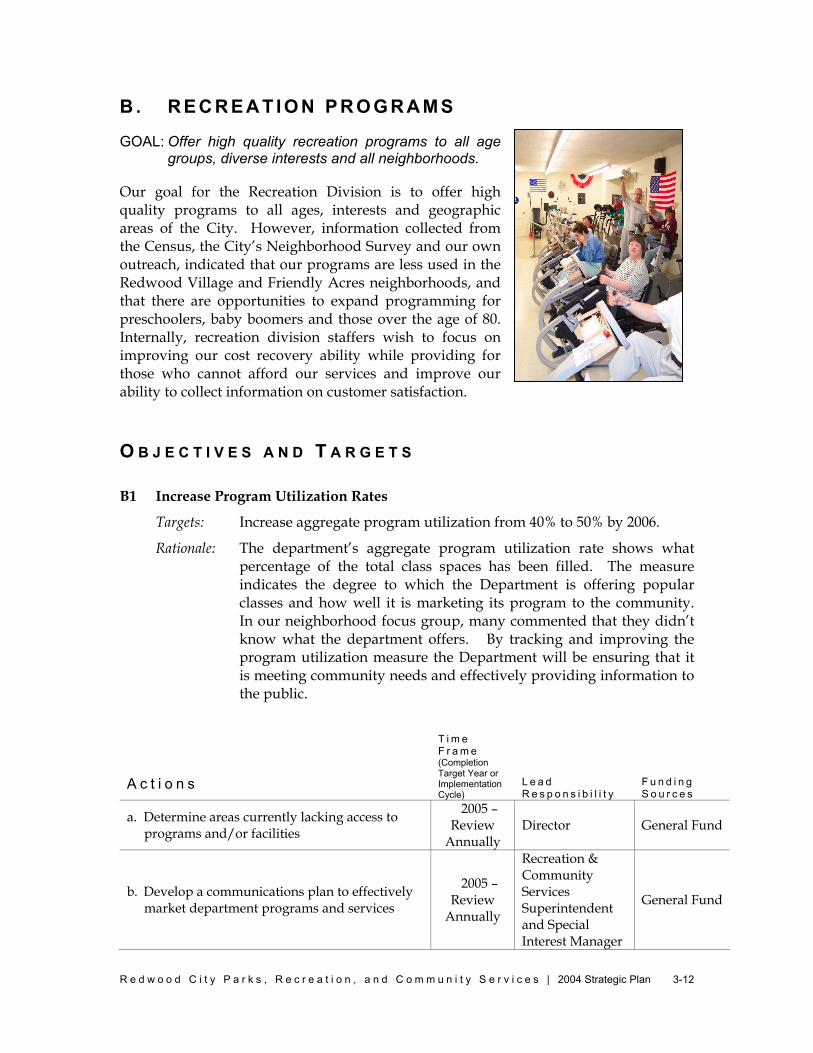
GOAL: Offer high quality recreation programs to all age groups, diverse interests and all neighborhoods.
Our goal for the Recreation Division is to offer high quality programs to all ages, interests and geographic areas of the City. However, information collected from the Census, the City’s Neighborhood Survey and our own outreach, indicated that our programs are less used in the Redwood Village and Friendly Acres neighborhoods, and that there are opportunities to expand programming for preschoolers, baby boomers and those over the age of 80. Internally, recreation division staffers wish to focus on improving our cost recovery ability while providing for those who cannot afford our services and improve our ability to collect information on customer satisfaction.
O B J E C T I V E S A N D T A R G E T S B1 Increase Program Utilization Rates
Targets: Increase aggregate program utilization from 40% to 50% by 2006.
Rationale: The department’s aggregate program utilization rate shows what percentage of the total class spaces has been filled. The measure indicates the degree to which the Department is offering popular classes and how well it is marketing its program to the community. In our neighborhood focus group, many commented that they didn’t know what the department offers. By tracking and improving the program utilization measure the Department will be ensuring that it is meeting community needs and effectively providing information to the public.
A c t i o n s
T i m e F r a m e (Completion Target Year or Implementation Cycle)
L e a d R e s p o n s i b i l i t y
F u n d i n g S o u r c e s
a. Determine areas currently lacking access to programs and/or facilities
2005 – Review
Annually Director General Fund
b. Develop a communications plan to effectively market department programs and services
2005 – Review
Annually
Recreation & Community Services Superintendent and Special Interest Manager
General Fund
R e d w o o d C i t y P a r k s , R e c r e a t i o n , a n d C o m m u n i t y S e r v i c e s | 2004 Strategic Plan
3-13
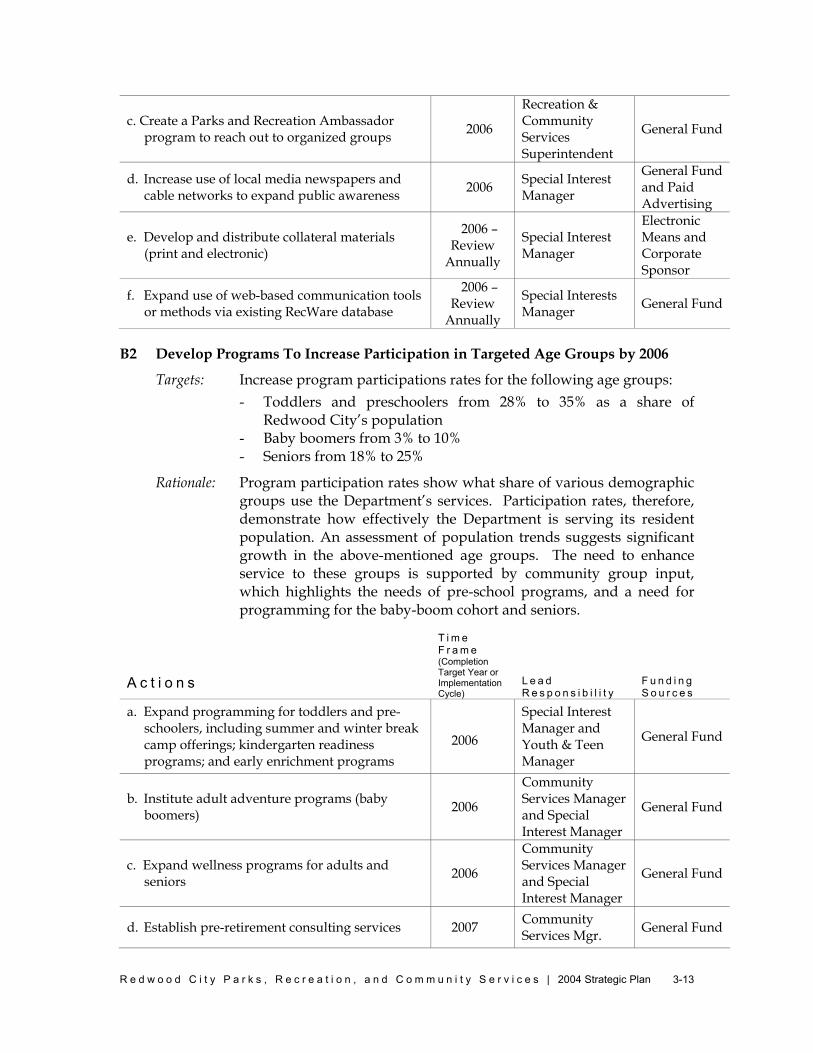
c. Create a Parks and Recreation Ambassador program to reach out to organized groups 2006
Recreation & Community Services Superintendent
General Fund
d. Increase use of local media newspapers and cable networks to expand public awareness 2006 Special Interest
Manager
General Fund and Paid Advertising
e. Develop and distribute collateral materials (print and electronic)
2006 – Review
Annually
Special Interest Manager
Electronic Means and Corporate Sponsor
f. Expand use of web-based communication tools or methods via existing RecWare database
2006 – Review
Annually
Special Interests Manager General Fund
B2 Develop Programs To Increase Participation in Targeted Age Groups by 2006
Targets: Increase program participations rates for the following age groups: - Toddlers and preschoolers from 28% to 35% as a share of
Redwood City’s population - Baby boomers from 3% to 10% - Seniors from 18% to 25%
Rationale: Program participation rates show what share of various demographic groups use the Department’s services. Participation rates, therefore, demonstrate how effectively the Department is serving its resident population. An assessment of population trends suggests significant growth in the above-mentioned age groups. The need to enhance service to these groups is supported by community group input, which highlights the needs of pre-school programs, and a need for programming for the baby-boom cohort and seniors.
A c t i o n s
T i m e F r a m e (Completion Target Year or Implementation Cycle)
L e a d R e s p o n s i b i l i t y
F u n d i n g S o u r c e s
a. Expand programming for toddlers and pre-schoolers, including summer and winter break camp offerings; kindergarten readiness programs; and early enrichment programs
2006
Special Interest Manager and Youth & Teen Manager
General Fund
b. Institute adult adventure programs (baby boomers) 2006
Community Services Manager and Special Interest Manager
General Fund
c. Expand wellness programs for adults and seniors 2006
Community Services Manager and Special Interest Manager
General Fund
d. Establish pre-retirement consulting services 2007 Community Services Mgr. General Fund
R e d w o o d C i t y P a r k s , R e c r e a t i o n , a n d C o m m u n i t y S e r v i c e s | 2004 Strategic Plan
3-14
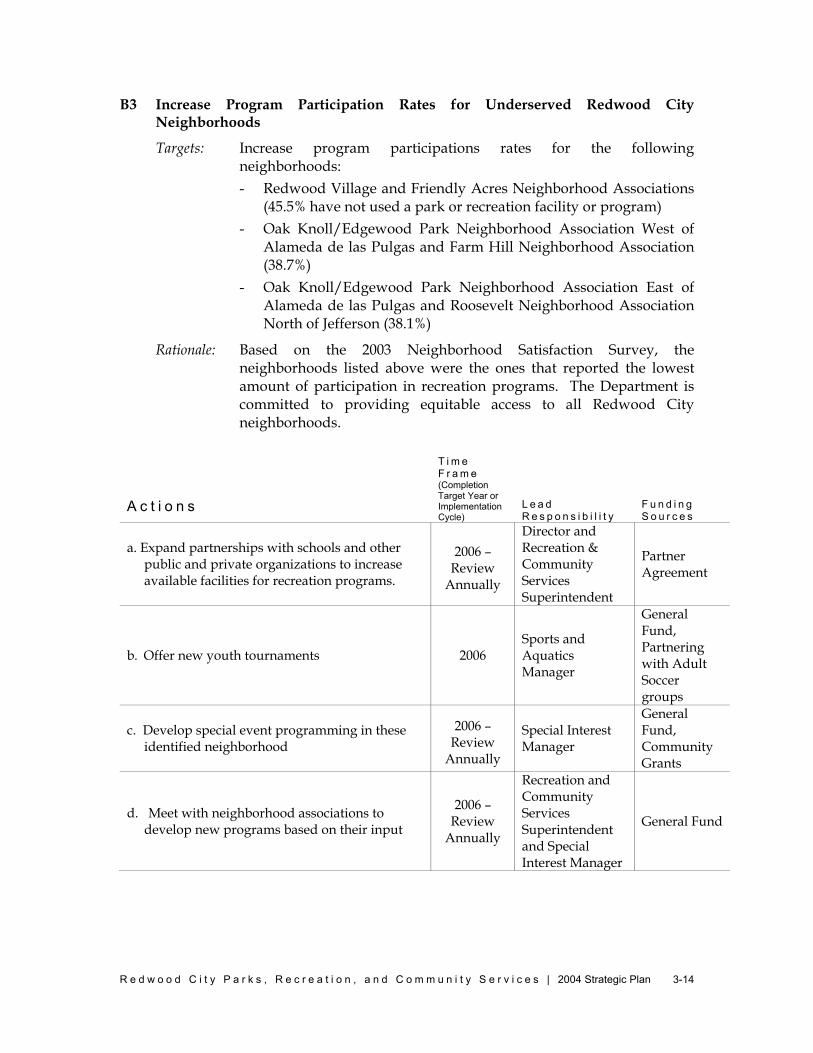
B3 Increase Program Participation Rates for Underserved Redwood City Neighborhoods
Targets: Increase program participations rates for the following neighborhoods: - Redwood Village and Friendly Acres Neighborhood Associations
(45.5% have not used a park or recreation facility or program) - Oak Knoll/Edgewood Park Neighborhood Association West of
Alameda de las Pulgas and Farm Hill Neighborhood Association (38.7%)
- Oak Knoll/Edgewood Park Neighborhood Association East of Alameda de las Pulgas and Roosevelt Neighborhood Association North of Jefferson (38.1%)
Rationale: Based on the 2003 Neighborhood Satisfaction Survey, the neighborhoods listed above were the ones that reported the lowest amount of participation in recreation programs. The Department is committed to providing equitable access to all Redwood City neighborhoods.
A c t i o n s
T i m e F r a m e (Completion Target Year or Implementation Cycle)
L e a d R e s p o n s i b i l i t y
F u n d i n g S o u r c e s
a. Expand partnerships with schools and other public and private organizations to increase available facilities for recreation programs.
2006 – Review
Annually
Director and Recreation & Community Services Superintendent
Partner Agreement
b. Offer new youth tournaments 2006 Sports and Aquatics Manager
General Fund, Partnering with Adult Soccer groups
c. Develop special event programming in these identified neighborhood
2006 – Review
Annually
Special Interest Manager
General Fund, Community Grants
d. Meet with neighborhood associations to develop new programs based on their input
2006 – Review
Annually
Recreation and Community Services Superintendent and Special Interest Manager
General Fund
R e d w o o d C i t y P a r k s , R e c r e a t i o n , a n d C o m m u n i t y S e r v i c e s | 2004 Strategic Plan
3-15
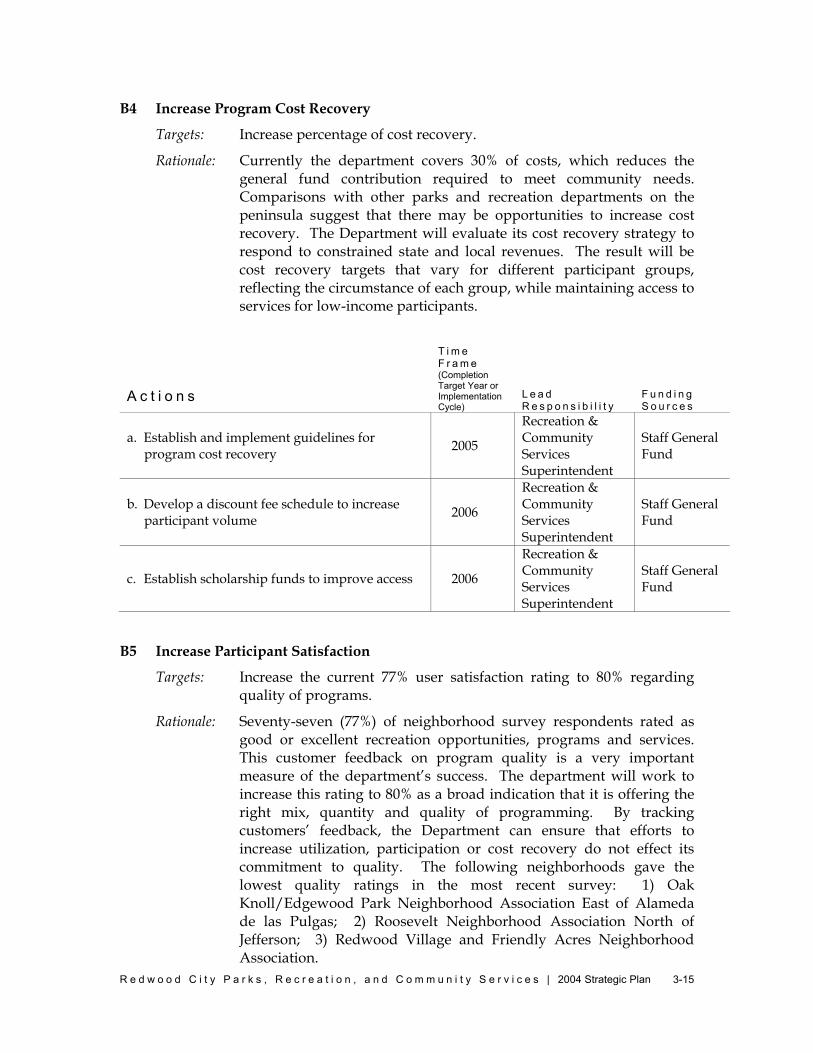
B4 Increase Program Cost Recovery
Targets: Increase percentage of cost recovery.
Rationale: Currently the department covers 30% of costs, which reduces the general fund contribution required to meet community needs. Comparisons with other parks and recreation departments on the peninsula suggest that there may be opportunities to increase cost recovery. The Department will evaluate its cost recovery strategy to respond to constrained state and local revenues. The result will be cost recovery targets that vary for different participant groups, reflecting the circumstance of each group, while maintaining access to services for low-income participants.
A c t i o n s
T i m e F r a m e (Completion Target Year or Implementation Cycle)
L e a d R e s p o n s i b i l i t y
F u n d i n g S o u r c e s
a. Establish and implement guidelines for program cost recovery 2005
Recreation & Community Services Superintendent
Staff General Fund
b. Develop a discount fee schedule to increase participant volume 2006
Recreation & Community Services Superintendent
Staff General Fund
c. Establish scholarship funds to improve access 2006
Recreation & Community Services Superintendent
Staff General Fund
B5 Increase Participant Satisfaction
Targets: Increase the current 77% user satisfaction rating to 80% regarding quality of programs.
Rationale: Seventy-seven (77%) of neighborhood survey respondents rated as good or excellent recreation opportunities, programs and services. This customer feedback on program quality is a very important measure of the department’s success. The department will work to increase this rating to 80% as a broad indication that it is offering the right mix, quantity and quality of programming. By tracking customers’ feedback, the Department can ensure that efforts to increase utilization, participation or cost recovery do not effect its commitment to quality. The following neighborhoods gave the lowest quality ratings in the most recent survey: 1) Oak Knoll/Edgewood Park Neighborhood Association East of Alameda de las Pulgas; 2) Roosevelt Neighborhood Association North of Jefferson; 3) Redwood Village and Friendly Acres Neighborhood Association.

R e d w o o d C i t y P a r k s , R e c r e a t i o n , a n d C o m m u n i t y S e r v i c e s | 2004 Strategic Plan
3-16
A c t i o n s
T i m e F r a m e (Completion Target Year or Implementation Cycle)
L e a d R e s p o n s i b i l i t y
F u n d i n g S o u r c e s
a. Conduct surveys and focus groups to assess users’ perceptions of program quality
2005 – Review Annually
Recreation & Community
Services Superintendent; All Recreation &
Community Services
Managers
General Fund
b. Increase sense of community through special event programming. Identify types of programs and develop over time at least one event or series of events every quarter
2006
Recreation & Community
Services Superintendent
General Fund
c. Improve environment in which community services are delivered, for example, room temperature, appearance, and cleanliness
2006 – Review Annually
All Recreation & Community
Services Managers
General Fund
d. Offer a variety of levels and other options to maintain interest in programs and improve perception of program quality
2006 – Review Annually
Recreation & Community
Services Superintendent, Special Interest
Manager
General Fund
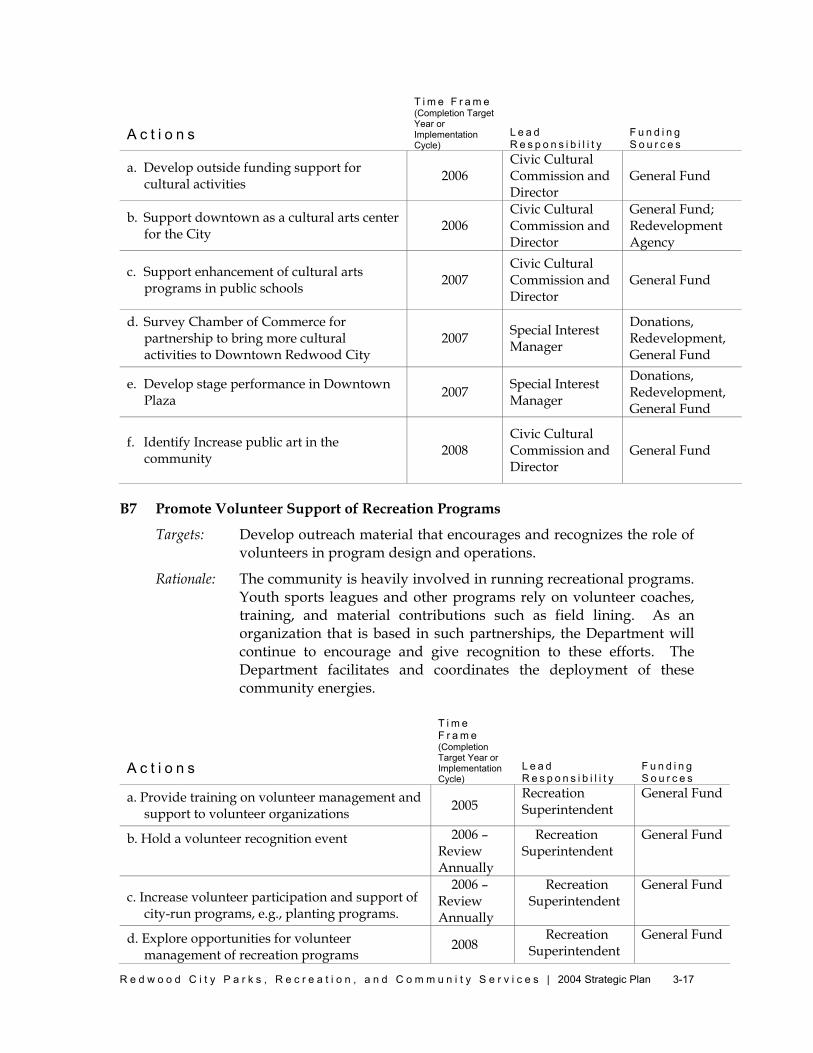
B6 Support Ongoing Cultural Activities
Targets: Support the development of downtown as the City’s cultural center; support of the arts both at the elementary and secondary school levels; community building events that celebrate the diversity of our community; support and partnership with local arts organizations, programs that focus on a senior audience; increased investment in public art; and alternative funding sources for the arts.
Rationale: Participant surveys show that one of the best programs we offer are the Summer and Downtown Concert Series. Building Community can also be achieved through cultural activities. The Cultural Element of the City’s General Plan sets a goal of creating a “vital cultural life in Redwood City”. City Council has identified its support of this concept by identifying Cultural activities as one of its priority areas. The Civic Cultural Commission has further defined the concept in it’s Strategic Plan by indicating efforts should: Celebrate the diversity of the Redwood City Community, promote top quality and excellence in programs, support the City’s core purpose of community building and recognize that art in all forms, be it visual, dramatic, music, dance, film, literature or other artistic expression, is essential to a vital community. Funds allocated by the City for cultural arts currently represent and annual expenditure of about $1/resident.
R e d w o o d C i t y P a r k s , R e c r e a t i o n , a n d C o m m u n i t y S e r v i c e s | 2004 Strategic Plan
3-17
A c t i o n s
T i m e F r a m e (Completion Target Year or Implementation Cycle)
L e a d R e s p o n s i b i l i t y
F u n d i n g S o u r c e s
a. Develop outside funding support for cultural activities 2006
Civic Cultural Commission and Director
General Fund
b. Support downtown as a cultural arts center for the City 2006
Civic Cultural Commission and Director
General Fund; Redevelopment Agency
c. Support enhancement of cultural arts programs in public schools 2007
Civic Cultural Commission and Director
General Fund
d. Survey Chamber of Commerce for partnership to bring more cultural activities to Downtown Redwood City
2007 Special Interest Manager
Donations, Redevelopment, General Fund
e. Develop stage performance in Downtown Plaza 2007 Special Interest
Manager
Donations, Redevelopment, General Fund
f. Identify Increase public art in the community 2008
Civic Cultural Commission and Director
General Fund
B7 Promote Volunteer Support of Recreation Programs
Targets: Develop outreach material that encourages and recognizes the role of volunteers in program design and operations.
Rationale: The community is heavily involved in running recreational programs. Youth sports leagues and other programs rely on volunteer coaches, training, and material contributions such as field lining. As an organization that is based in such partnerships, the Department will continue to encourage and give recognition to these efforts. The Department facilitates and coordinates the deployment of these community energies.
A c t i o n s
T i m e F r a m e (Completion Target Year or Implementation Cycle)
L e a d R e s p o n s i b i l i t y
F u n d i n g S o u r c e s
a. Provide training on volunteer management and support to volunteer organizations 2005
Recreation Superintendent
General Fund
b. Hold a volunteer recognition event 2006 – Review Annually
Recreation Superintendent
General Fund
c. Increase volunteer participation and support of city-run programs, e.g., planting programs.
2006 – Review Annually
Recreation Superintendent
General Fund
d. Explore opportunities for volunteer management of recreation programs
2008 Recreation
Superintendent General Fund
PARKS COMMUNITYFACILITIES
ORGANIZATION
Maintain and increase staff engagement.
Develop performance measures for all program elements.
Take full advantageof non-City fundingalternatives.
Improve productivity and organizationaleffectiveness.
Enhance Commissionand Advisory Groupoperations.
E1.
E2.
E3.
E4.
E5.
Increase programutilization rates.
Develop programsthat will increaseparticipation intargeted age groups by 2006.
Increase program participation ratesfor underserved Redwood City Neighborhoods.
Increase programcost recovery.
Increase participantsatisfaction.
Support ongoingcultural activities.
B1.
B2.
B3.
B4.
B5.
B6.
A1.
A2.
A3.
A4.
A5.
A6.
A7.
A8.
A9.
A10.
Partner with thecommunity to develop a plan for future parks.
Develop policyfor developercontribution.
Improve scheduling and allocation of park areas.
Increase park safety rating.
Make all parksaccessible.
Provide amenitypackage for parks.
Develop parkdesign guidelines.
Develop use policies.
Implement environmentalconservation methods.
Maintain current park maintenance levels.
RECREATIONPROGRAMS C O M M U N I T Y
S E R V I C E S
Expand facilitycapacity to matchgrowth in population and program trends.
Maintain facilitymaintenance andoperation levels. Ensure safety andsecurity.
Support facilitydelivery process.
D1.
D2.
D3.
D4.
Increase communityservice programparticipation rates for target populations.
Increase funding stability.
Increase participantsatisfaction.
C1.
C2.
C3.
Provide safe clean, attractive parks andfacilities in adequatenumbers distributedthroughout the community.
Offer high quality recreation programs to all age groups and interests. Meet community needs
by directly providing or facilitating the delivery of a wide range ofsupport, educational and informational services.
Provide places for community activities and manage Cityfacilities.
Create a dynamic organization committed to an ongoing processof innovation.
C . C O M M U N I T Y S E R V I C E S
R e d w o o d C i t y P a r k s , R e c r e a t i o n , a n d C o m m u n i t y S e r v i c e s | 2004 Strategic Plan
3-19
C . C O M M U N I T Y S E R V I C E S
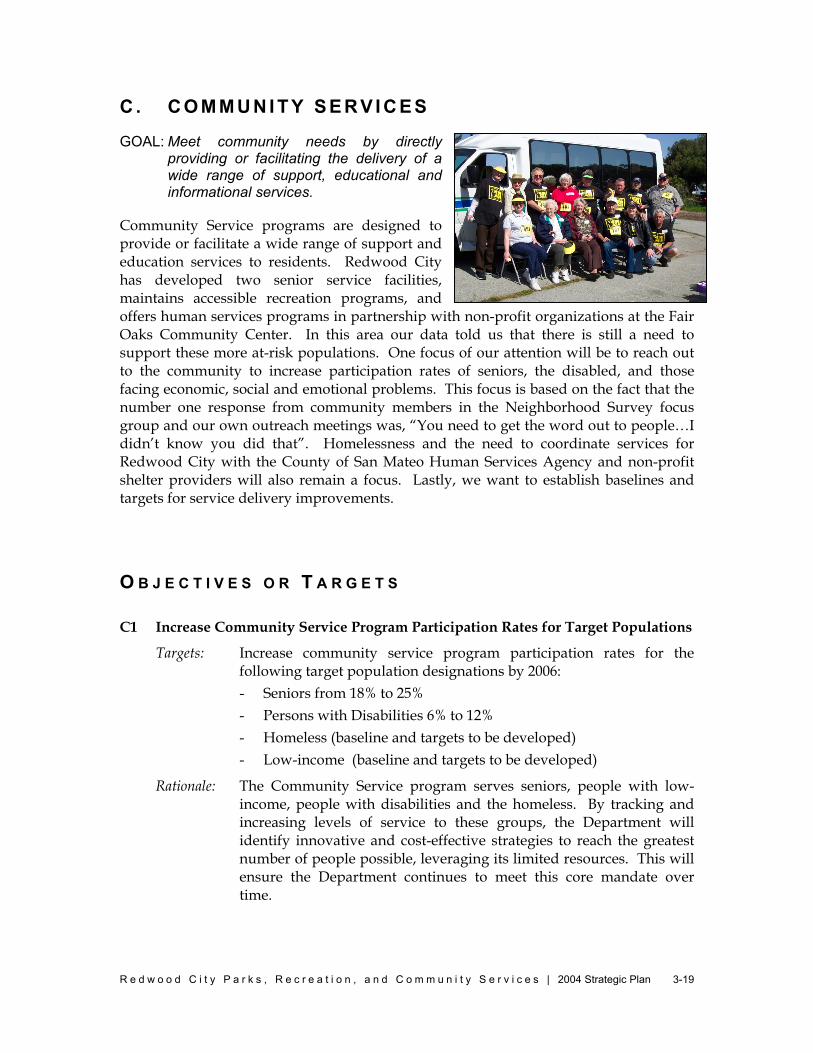
GOAL: Meet community needs by directly providing or facilitating the delivery of a wide range of support, educational and informational services.
Community Service programs are designed to provide or facilitate a wide range of support and education services to residents. Redwood City has developed two senior service facilities, maintains accessible recreation programs, and offers human services programs in partnership with non-profit organizations at the Fair Oaks Community Center. In this area our data told us that there is still a need to support these more at-risk populations. One focus of our attention will be to reach out to the community to increase participation rates of seniors, the disabled, and those facing economic, social and emotional problems. This focus is based on the fact that the number one response from community members in the Neighborhood Survey focus group and our own outreach meetings was, “You need to get the word out to people…I didn’t know you did that”. Homelessness and the need to coordinate services for Redwood City with the County of San Mateo Human Services Agency and non-profit shelter providers will also remain a focus. Lastly, we want to establish baselines and targets for service delivery improvements.
O B J E C T I V E S O R T A R G E T S C1 Increase Community Service Program Participation Rates for Target Populations
Targets: Increase community service program participation rates for the following target population designations by 2006: - Seniors from 18% to 25% - Persons with Disabilities 6% to 12% - Homeless (baseline and targets to be developed) - Low-income (baseline and targets to be developed)
Rationale: The Community Service program serves seniors, people with low-income, people with disabilities and the homeless. By tracking and increasing levels of service to these groups, the Department will identify innovative and cost-effective strategies to reach the greatest number of people possible, leveraging its limited resources. This will ensure the Department continues to meet this core mandate over time.
R e d w o o d C i t y P a r k s , R e c r e a t i o n , a n d C o m m u n i t y S e r v i c e s | 2004 Strategic Plan
3-20
A c t i o n s
T i m e F r a m e (Completion Target Year or Implementation Cycle)
L e a d R e s p o n s i b i l i t y
F u n d i n g S o u r c e s
a. Assess gaps in the provision of community services and identify new delivery places and methods to meet these unmet needs. Assess distribution of services within the community and any transportation barriers or unmet needs; develop transportation program to address needs
2006 – Review
Annually
Human Services and Community Services Manager
General Fund
b. Create outreach plan to targeted populations Short Human Services and Community Services Manager
General Fund
b.1 Work with other service providers (City Staff and Fire and Police Stations) to disseminate program information
2006 – Review
Annually (same as above) General Fund
b.2 Communicate community programs through Chamber of Commerce
2006 (same as above) General Fund
b.3 Develop outreach materials in multiple languages to reflect community demographics
2006 (same as above) General Fund
b.4 Develop broad awareness of services in other service organizations to make information available through face-to-face contact (i.e. offer a service club open house “Adopt a Project Event”)
2007 (same as above) General Fund
c. Encourage participants to use multiple programs and services
2006 – Review Annually
Special Interest Manager, Human
Services Manager, and Community
Services Manager
General Fund
d. Support County’s Continuum of Care on Homelessness 2006
Need Data General Fund
e. Support Social Services Survey provided by the Housing and Human Concerns Committee (support information gathering and act on recommendations)
2006
Need Data
General Fund
C2 Increase Funding Stability
Targets: Develop alternative funding sources.
Rationale: Fluctuations in the funding of community services can have dramatic negative consequences for participants, who sometimes rely on these programs for basic needs. Increasing the number of funding sources and establishing a balance between sources is an important method for avoiding disruption to these critical services.

R e d w o o d C i t y P a r k s , R e c r e a t i o n , a n d C o m m u n i t y S e r v i c e s | 2004 Strategic Plan
3-21
A c t i o n s
T i m e F r a m e (Completion Target Year or Implementation Cycle)
L e a d R e s p o n s i b i l i t y
F u n d i n g S o u r c e s
a. Develop a fundraising program to solicit donations and other forms of giving 2007
Recreation & Community Services Superintendent
General Fund
b. Increase grant seeking to expand access to services 2007 Director General Fund
c. Work with Chamber and local business to host fundraising events (i.e. Department Anniversary)
2007 Special Interest Manager General Fund
C3 Increase Participant Satisfaction
Targets: The department will implement a survey of community service participants to establish a baseline and targets for improving service quality.
Rationale: As with its recreation program, the Department is committed to increasing both the quantity and quality of its community service programs. The Department will survey participants regarding their satisfaction with programs and identify methods for enhancing quality.
A c t i o n s
T i m e F r a m e (Completion Target Year or Implementation Cycle)
L e a d R e s p o n s i b i l i t y
F u n d i n g S o u r c e s
a. Develop participant satisfaction survey and use to assess issues and options for improvements 2006 Director General Fund
b. Complete senior center accreditation process (community teams, on-site peer review, analysis of date, etc.)
2007 Recreation Superintendent General Fund
c. Develop Community Services Task Force to develop action steps to respond to the accreditation results and participant satisfaction findings. This Task Force will explore opportunities to provide shared services that improve integration across traditional service categories
2007 Recreation Superintendent General Fund
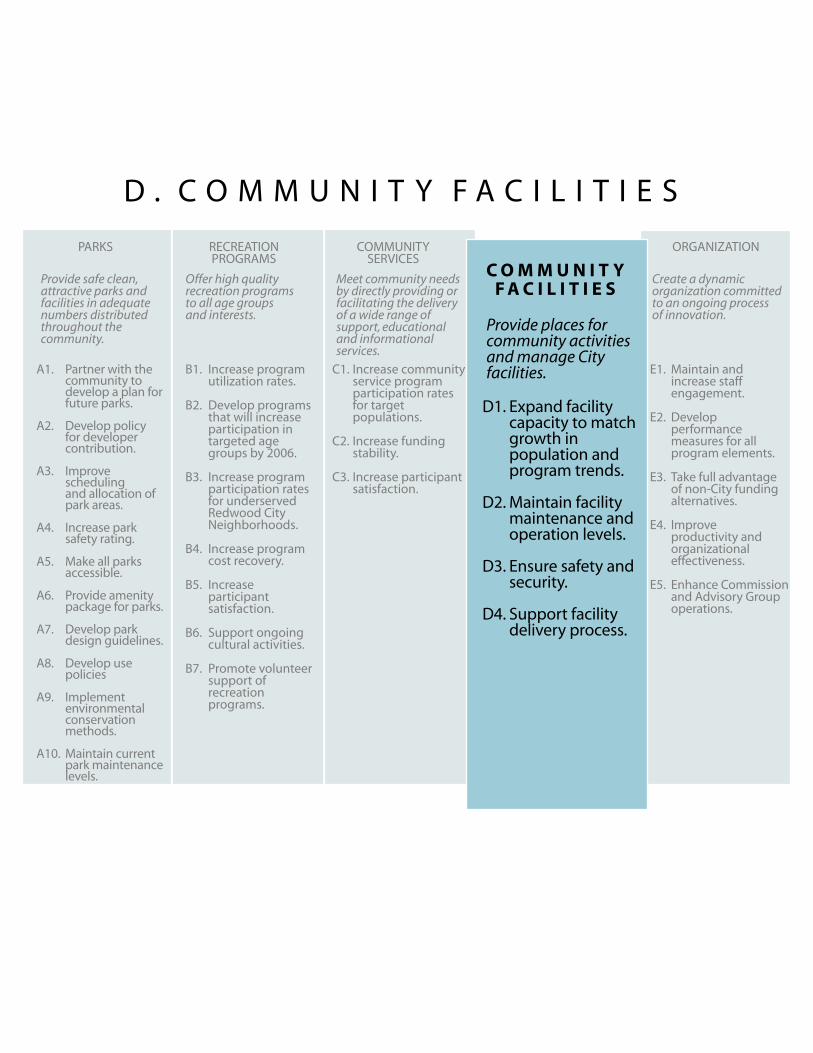
PARKS
C O M M U N I T YF A C I L I T I E S
ORGANIZATION
Maintain and increase staff engagement.
Develop performance measures for all program elements.
Take full advantageof non-City fundingalternatives.
Improve productivity and organizationaleffectiveness.
Enhance Commissionand Advisory Groupoperations.
E1.
E2.
E3.
E4.
E5.
Increase programutilization rates.
Develop programsthat will increaseparticipation intargeted age groups by 2006.
Increase program participation ratesfor underserved Redwood City Neighborhoods.
Increase programcost recovery.
Increase participantsatisfaction.
Support ongoingcultural activities.
Promote volunteersupport of recreation programs.
B1.
B2.
B3.
B4.
B5.
B6.
B7.
A1.
A2.
A3.
A4.
A5.
A6.
A7.
A8.
A9.
A10.
Partner with thecommunity to develop a plan for future parks.
Develop policyfor developercontribution.
Improve scheduling and allocation of park areas.
Increase park safety rating.
Make all parksaccessible.
Provide amenitypackage for parks.
Develop parkdesign guidelines.
Develop use policies
Implement environmentalconservation methods.
Maintain current park maintenance levels.
RECREATIONPROGRAMS
COMMUNITYSERVICES
Expand facilitycapacity to matchgrowth in population and program trends.
Maintain facilitymaintenance andoperation levels. Ensure safety andsecurity.
Support facilitydelivery process.
D1.
D2.
D3.
D4.
Increase communityservice programparticipation rates for target populations.
Increase funding stability.
Increase participantsatisfaction.
C1.
C2.
C3.
Provide safe clean, attractive parks andfacilities in adequatenumbers distributedthroughout the community.
Offer high quality recreation programs to all age groups and interests.
Meet community needs by directly providing or facilitating the delivery of a wide range ofsupport, educational and informational services.
Provide places for community activities and manage Cityfacilities.
Create a dynamic organization committed to an ongoing processof innovation.
D . C O M M U N I T Y F A C I L I T I E S
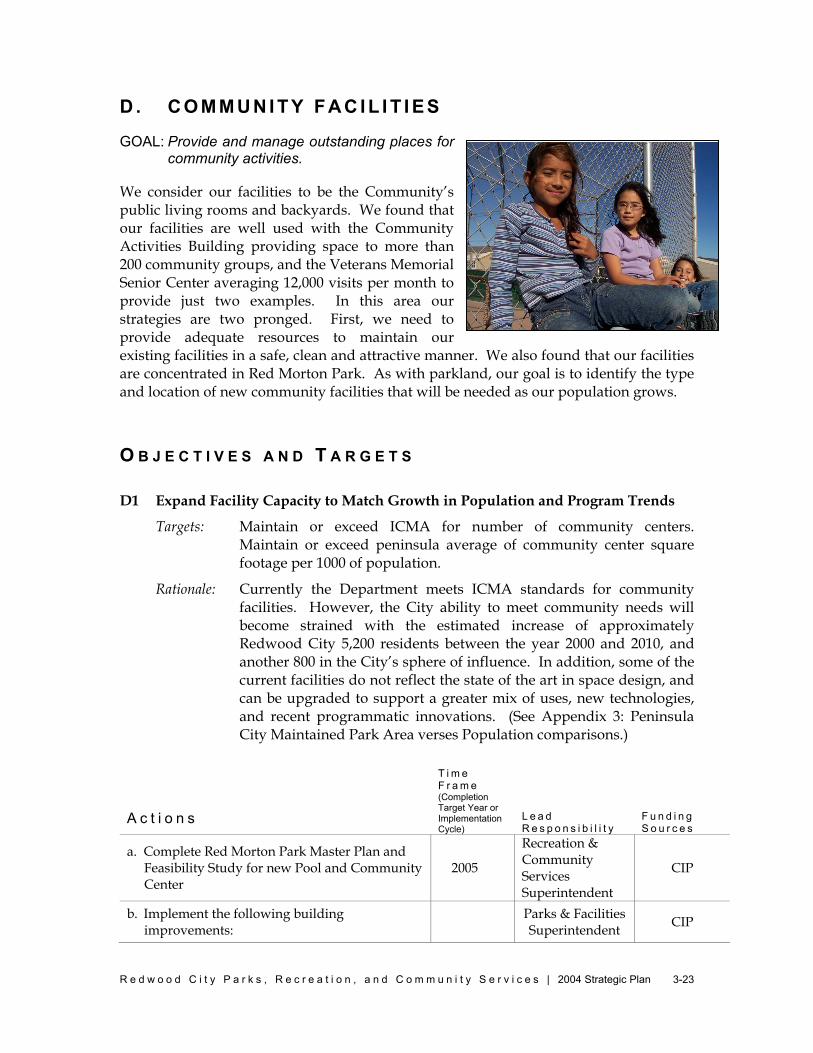
R e d w o o d C i t y P a r k s , R e c r e a t i o n , a n d C o m m u n i t y S e r v i c e s | 2004 Strategic Plan
3-23
D . C O M M U N I T Y F A C I L I T I E S
GOAL: Provide and manage outstanding places for community activities.
We consider our facilities to be the Community’s public living rooms and backyards. We found that our facilities are well used with the Community Activities Building providing space to more than 200 community groups, and the Veterans Memorial Senior Center averaging 12,000 visits per month to provide just two examples. In this area our strategies are two pronged. First, we need to provide adequate resources to maintain our existing facilities in a safe, clean and attractive manner. We also found that our facilities are concentrated in Red Morton Park. As with parkland, our goal is to identify the type and location of new community facilities that will be needed as our population grows.
O B J E C T I V E S A N D T A R G E T S D1 Expand Facility Capacity to Match Growth in Population and Program Trends
Targets: Maintain or exceed ICMA for number of community centers. Maintain or exceed peninsula average of community center square footage per 1000 of population.
Rationale: Currently the Department meets ICMA standards for community facilities. However, the City ability to meet community needs will become strained with the estimated increase of approximately Redwood City 5,200 residents between the year 2000 and 2010, and another 800 in the City’s sphere of influence. In addition, some of the current facilities do not reflect the state of the art in space design, and can be upgraded to support a greater mix of uses, new technologies, and recent programmatic innovations. (See Appendix 3: Peninsula City Maintained Park Area verses Population comparisons.)
A c t i o n s
T i m e F r a m e (Completion Target Year or Implementation Cycle)
L e a d R e s p o n s i b i l i t y
F u n d i n g S o u r c e s
a. Complete Red Morton Park Master Plan and Feasibility Study for new Pool and Community Center
2005
Recreation & Community Services Superintendent
CIP
b. Implement the following building improvements: Parks & Facilities
Superintendent CIP

R e d w o o d C i t y P a r k s , R e c r e a t i o n , a n d C o m m u n i t y S e r v i c e s | 2004 Strategic Plan
3-24
- Update and complete minor renovations to the Community Activities Building 2006
Parks & Facilities Superintendent CIP
- Upgrade Veterans Memorial Senior Center 2007 Director CIP
- Expand Wellness Center and Pool 2009 Director CIP
c. Utilize Capital Improvement Program to support priority projects
Review Annually
Parks & Facilities Superintendent CIP
D2 Maintain Facility Maintenance and Operations Levels
Targets: (1) Maintain or increase the current user satisfaction rating regarding facility maintenance and operations of 81%.
(2) Increase internal customer satisfaction score for facilities management from “B” to “B+”.
Rationale: Currently the City receives high marks for its maintenance of facilities, as evaluated in the neighborhood survey. The Department is committed to maintaining these high service levels, and increasing them if possible. The Department will explore service innovations to serve a growing population in a fiscally constrained environment.
A c t i o n s
T i m e F r a m e (Completion Target Year or Implementation Cycle)
L e a d R e s p o n s i b i l i t y
F u n d i n g S o u r c e s
a. Increase availability of facilities to be used in emergency response 2006 Parks & Facilities
Superintendent General Fund
b. Improve the ability to remotely manage and maintain facilities, e.g. security and environmental controls
2007 – Review
Annually
Facilities Manager General Fund
c. Improve information and other technologies to support service delivery
2008 – Review
Annually
Facilities Manager General Fund
d. Invest resources in the preservation of City resources
Review Annually
Facilities Manager
CIP and Ongoing Programs
R e d w o o d C i t y P a r k s , R e c r e a t i o n , a n d C o m m u n i t y S e r v i c e s | 2004 Strategic Plan
3-25
D3 Ensure Safety and Security
Targets: Measure user perceptions of safety.
Rationale: A sense of personal safety is a key factor in participants’ decisions as to whether to use a community facility to host an event or attend a program. For example, the community survey rated safety in the parks as the most important park attribute. Since several community centers are located at parks, the community survey’s finding that people are generally satisfied with safety in the parks is a partial indicator that participants are comfortable with the safety issue. To obtain a clearer picture of the facilities safety, the Department will begin tracking this measure directly and implement steps to address any issues.
A c t i o n s
T i m e F r a m e (Completion Target Year or Implementation Cycle)
L e a d R e s p o n s i b i l i t y
F u n d i n g S o u r c e s
a. Conduct building user safety survey and identify priority issues
Perform Annually
Facilities Manager General Fund
b. Review accident reports Review Quarterly
Director and Superintendents
General Fund
c. Improve lighting and other operational measures to improve safety
2007 – Review
Annually
Parks & Facilities Superintendent CIP
d. Integrate safety into the design of new or renovated facilities, including easily observable spaces
Review Annually
Parks & Facilities Superintendent General Fund

R e d w o o d C i t y P a r k s , R e c r e a t i o n , a n d C o m m u n i t y S e r v i c e s | 2004 Strategic Plan
3-26
D4 Support Facility Delivery Process
Targets: 100% involvement in all City facility projects.
Rationale: Being involved early in facilities design and improve efforts will allow the Department to ensure that planning includes cost-effective maintenance and management measures at the outset. Facility project sponsors may overlook simple improvements that can generate significant financial savings if addressed during design, including issues such as safety, security, energy use, maintenance and operations.
A c t i o n s
T i m e F r a m e (Completion Target Year or Implementation Cycle)
L e a d R e s p o n s i b i l i t y
F u n d i n g S o u r c e s
a. Participate in building design process to provide input on maintenance and other issues
Ongoing Effort
Park & Facilities Superintendent General Fund
b. Support the Development of Quality Places (Downtown, Broadway)
Ongoing Effort
Director and Superintendents General Fund
c. Maintain involvement with the Community Development Department on future projects
Ongoing Effort
Director and Superintendents General Fund

PARKS COMMUNITYFACILITIES
ORGANIZ ATION
Maintain and increase staff engagement.
Develop performance measures for all program elements.
Take full advantageof non-City fundingalternatives.
Improve productivity and organizationaleffectiveness.
Enhance Commissionand Advisory Groupoperations.
E1.
E2.
E3.
E4.
E5.
Increase programutilization rates.
Develop programsthat will increaseparticipation intargeted age groups by 2006.
Increase program participation ratesfor underserved Redwood City Neighborhoods.
Increase programcost recovery.
Increase participantsatisfaction.
Support ongoingcultural activities.
Promote volunteersupport of recreationprograms.
B1.
B2.
B3.
B4.
B5.
B6.
B7.
A1.
A2.
A3.
A4.
A5.
A6.
A7.
A8.
A9.
A10.
Partner with thecommunity to develop a plan for future parks.
Develop policyfor developercontribution.
Improve scheduling and allocation of park areas.
Increase park safety rating.
Make all parksaccessible.
Provide amenitypackage for parks.
Develop parkdesign guidelines.
Develop usepolicies.
Implement environmentalconservation methods.
Maintain current park maintenance levels.
RECREATIONPROGRAMS
COMMUNITYSERVICES
Expand facilitycapacity to matchgrowth in population and program trends.
Maintain facilitymaintenance andoperation levels. Ensure safety andsecurity.
Support facilitydelivery process.
D1.
D2.
D3.
D4.
Increase communityservice programparticipation rates for target populations.
Increase funding stability.
Increase participantsatisfaction.
C1.
C2.
C3.
Provide safe clean, attractive parks andfacilities in adequatenumbers distributedthroughout the community.
Offer high quality recreation programs to all age groups and interests.
Meet community needs by directly providing or facilitating the delivery of a wide range ofsupport, educational and informational services.
Provide places for community activities and manage Cityfacilities.
Create a dynamic organization committed to an ongoing processof innovation.
E . O R G A N I Z A T I O N
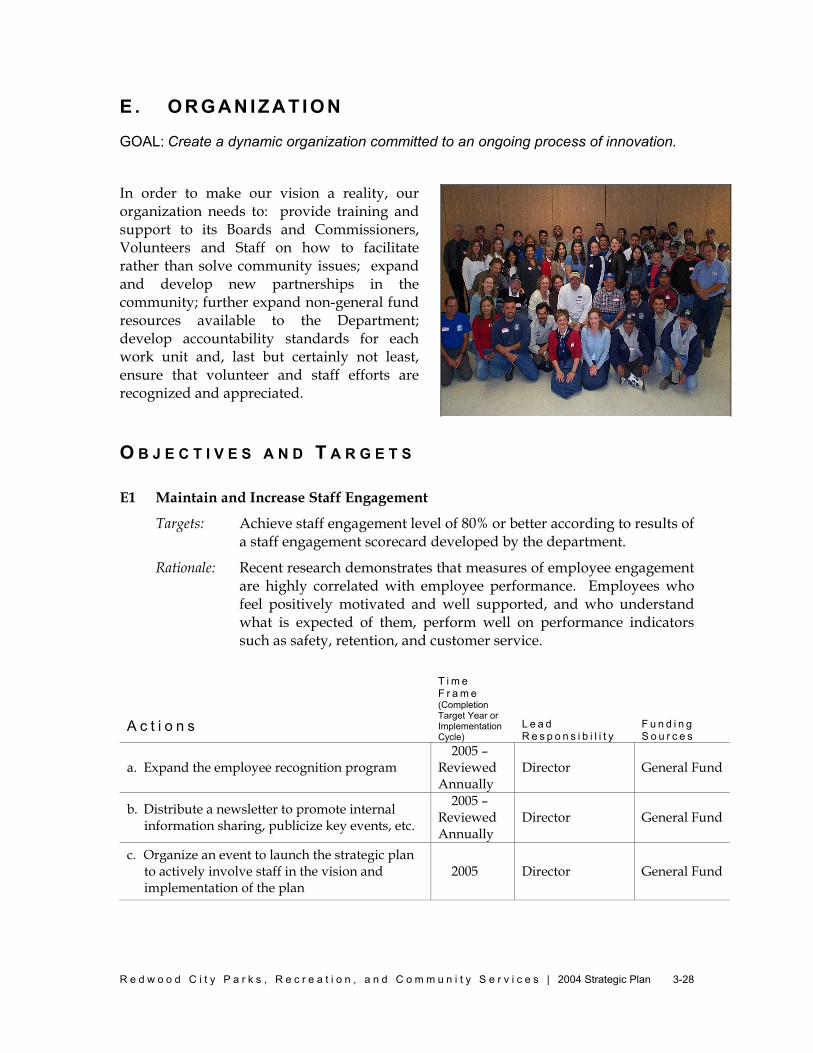
R e d w o o d C i t y P a r k s , R e c r e a t i o n , a n d C o m m u n i t y S e r v i c e s | 2004 Strategic Plan
3-28
E . O R G A N I Z A T I O N
GOAL: Create a dynamic organization committed to an ongoing process of innovation.
In order to make our vision a reality, our organization needs to: provide training and support to its Boards and Commissioners, Volunteers and Staff on how to facilitate rather than solve community issues; expand and develop new partnerships in the community; further expand non-general fund resources available to the Department; develop accountability standards for each work unit and, last but certainly not least, ensure that volunteer and staff efforts are recognized and appreciated.
O B J E C T I V E S A N D T A R G E T S E1 Maintain and Increase Staff Engagement
Targets: Achieve staff engagement level of 80% or better according to results of a staff engagement scorecard developed by the department.
Rationale: Recent research demonstrates that measures of employee engagement are highly correlated with employee performance. Employees who feel positively motivated and well supported, and who understand what is expected of them, perform well on performance indicators such as safety, retention, and customer service.
A c t i o n s
T i m e F r a m e (Completion Target Year or Implementation Cycle)
L e a d R e s p o n s i b i l i t y
F u n d i n g S o u r c e s
a. Expand the employee recognition program 2005 –
Reviewed Annually
Director General Fund
b. Distribute a newsletter to promote internal information sharing, publicize key events, etc.
2005 – Reviewed Annually
Director General Fund
c. Organize an event to launch the strategic plan to actively involve staff in the vision and implementation of the plan
2005 Director General Fund
R e d w o o d C i t y P a r k s , R e c r e a t i o n , a n d C o m m u n i t y S e r v i c e s | 2004 Strategic Plan
3-29
E2 Develop Performance Measures for all Program Elements
Targets: Implement the Strategic Plan and develop developed performance measures from plan.
Rationale: The Department is committed to delivering measurable benefits to the community. Developing performance measures based on the strategic plan will allow the Department to ensure that it is accountable to the public and to its boards, commissions and the City Council.
A c t i o n s
T i m e F r a m e (Completion Target Year or Implementation Cycle)
L e a d R e s p o n s i b i l i t y
F u n d i n g S o u r c e s
a. Implement performance measures (success indicators) that are meaningful to staff. Identify areas where data collection is needed and develop protocols for measuring performance
2005 – Reviewed Annually
Director General Fund
b. Use bench-marking to compare PRCS performance to that of comparable agencies
2005 – Reviewed Annually
Director General Fund
c. Implement on-going strategic plan, budgeting, and program services
2005 – Reviewed Annually
Director General Fund
E3 Take full advantage of non-City funding alternatives
Targets: Increase funding per capita, diversity of funding and the number of partnerships.
Rationale: California’s state budget is predicted to experience several years of uncertainty, heightening the usual unpredictability of state and local funding decisions. Partly as a consequence of the state budget, local municipal funding models have not stabilized to provide predictable funding. Therefore, the Department will seek to diversify its funding to maintain its service to the community, placing a priority on partnership development, grants, volunteers, and charitable giving.
.
A c t i o n s
T i m e F r a m e (Completion Target Year or Implementation Cycle)
L e a d R e s p o n s i b i l i t y
F u n d i n g S o u r c e s
a. Expand partnerships to leverage in kind and financial resources
2005 – Reviewed Annually
Director General Fund
b. Utilize volunteers to expand access to service while building community
2005 – Reviewed Annually
Manager General Fund

R e d w o o d C i t y P a r k s , R e c r e a t i o n , a n d C o m m u n i t y S e r v i c e s | 2004 Strategic Plan
3-30
c. Strengthen the role of boards and commissions in policy-making for the department
2006 – Reviewed Annually
Director and Superintendents General Fund
d. Strengthen Veterans Memorial Senior Center 501(c)(3) through reorganization
2007 – Reviewed Annually
Community Services Manager General Fund
e. Expand grant seeking to identify new sources of resources
2007 – Reviewed Annually
Director and Superintendents General Fund
f. Pursue state park bond fund program Ongoing Effort
Parks & Facilities Superintendent General Fund
g. Explore joint development opportunities with public and private partners to generate revenues
2007 Director and Superintendents General Fund
h. Establish a non-profit organization to allow receipt of donations 2007 Director and
Superintendents General Fund
i. Explore Prop 218 assessment fee approach to fund park maintenance
2007 – Ongoing
Effort
Parks & Facilities Superintendent General Fund
E4 Improve Productivity and Organizational Effectiveness
Targets: Maintain current levels of service with no net increase in staff.
Rationale: Given increasing demands for service in a constrained fiscal environment, the Department will develop new delivery models and efficiencies to maintain its commitment to meeting community needs. With the city’s population growing, innovation and process improvements will be necessary if the department is to maintain its service levels without adding additional staff positions.
A c t i o n s
T i m e F r a m e (Completion Target Year or Implementation Cycle)
L e a d R e s p o n s i b i l i t y
F u n d i n g S o u r c e s
a. Assess GIS needs and utilize GIS tools 2005 –
Review Annually
Facilities & Parks Superintendent General Fund
b. Expand use of new information technology and web-based tools 2006 Superintendents General Fund
c. Base new employee recruitment on City values 2005 – review
Annually
All Department Staff General Fund
d. Benchmark other Agencies to improve productivity
2007 – Review
Annually
All Department Staff General Fund
e. Reduce Worker Compensation and Sick Leave use.
2005 – Review
Annually
All Department Staff General Fund
R e d w o o d C i t y P a r k s , R e c r e a t i o n , a n d C o m m u n i t y S e r v i c e s | 2004 Strategic Plan
3-31
f. Training on how to develop and use accountability standards.
2006 – Review
Annually
Managers and Superintendents General Fund
g. Train: coach versus player or facilitator versus direct provider to solve community demands
2005 – Review
Annually
Director, Managers and Superintendents
General Fund
E5 Enhance Commission and Advisory Group Operations
Targets: Develop Commission/Board Guidelines by 2007.
Rationale: The community members who serve on the city advisory boards and commissions provide an invaluable service to the Department by contributing their insights, experience and energy. To respect the time and efforts of these volunteers, the Department will continually seek new ways to enhance all advisory group processes. The goal is to make the time spent in meetings as productive and valuable as possible.
A c t i o n s
T i m e F r a m e short = 0-2 yrs. medium=2-5 yrs. long = 5+ yrs.
L e a d R e s p o n s i b i l i t y
F u n d i n g S o u r c e s
a. Provide leadership training for Chairs and Co-Chairs on the policy role of the board and meeting management
2005 – Review Bi-annually
Director General Fund
b. Develop a regular calendar of Board policy and planning milestones 2005 Director General Fund
c. Survey commission and board members to identify strengths and weaknesses of current operations
2006 – Review
Annually Director General Fund
d. Develop recommendations for improving advisory group operations. This will address: clarification that board/commission role is to address policy, not detailed operational matters; description of expectations for board/ commission members; expectations for staff support; annual planning and policy advisory milestones calendar; meeting management best practices and principles (facilitation, parliamentary procedure, public comment)
2006 Director General Fund
e. Develop commission and board guidelines to implement the recommendations from (d) above. Use this to supplement or modify the existing Board handbook
2007 Review
Annually Director General Fund

C h a p t e r 4 : PLAN IMPLEMENTATION AND UPDATES
R e d w o o d C i t y P a r k s , R e c r e a t i o n , a n d C o m m u n i t y S e r v i c e s | 2004 Strategic Plan 4-2
C h a p t e r 4 : P L A N I M P L E M E N TAT I O N A N D U P D AT E S
The Department will ensure that the plan is a living document through a regular process of monitoring and updates. The plan will be implemented through a series of activities in which annual priorities are translated into budget items and action plans. This implementation process will be integrated with the long-term plan monitoring and update cycle.
4 . A . A N N U A L I M P L E M E N T A T I O N A N D B U D G E T L I N K A G E The Department will use an ongoing annual process for implementing and updating the plan, including linking plan priorities to the City’s budget and Capital Improvement Program. As illustrated in Figure 4, the process includes the following milestones:
Annual Progress Report October
The Director will develop a report to review implementation progress. For each goal area, the report will describe the status of implementation, including successes and barriers, and list the next steps and any resource or support needs. The report will also review prior year data from the CIP Project Review, the Neighborhood Survey (odd years), and ICMA Performance Measures.
Parks and Recreation Commission Priorities and Plan Update Session November
The Commission will meet each November to develop strategic priorities for the coming year based on a review of the Director’s progress report.
Strategic Plan Update December
The Department will update the Strategic Plan to reflect the findings of the Director’s report and the Commission priorities.
City Council Priorities January
The City Council will establish its priorities with input from the Department’s strategic planning process.
Parks and Recreation Commission CIP Project Review Meeting February
The Commission will conduct a session on CIP projects in preparation for the budget process.
Budget Submittal March
The Department submits its budget request to the City Manager.
Final Budget and CIP May/June
The City completes its budget process including items developed through the strategic planning process.
R e d w o o d C i t y P a r k s , R e c r e a t i o n , a n d C o m m u n i t y S e r v i c e s | 2004 Strategic Plan 4-3
4 . B . U P D A T E P R O C E S S The City will conduct a comprehensive strategic planning update process every three years. This will consist of the following activities:
Assessment of community needs and trends using demographic data, usage statistics, surveys and focus groups
Involvement of Department staff Review of progress toward action objectives Review of performance measures Management workshops Park Commission input
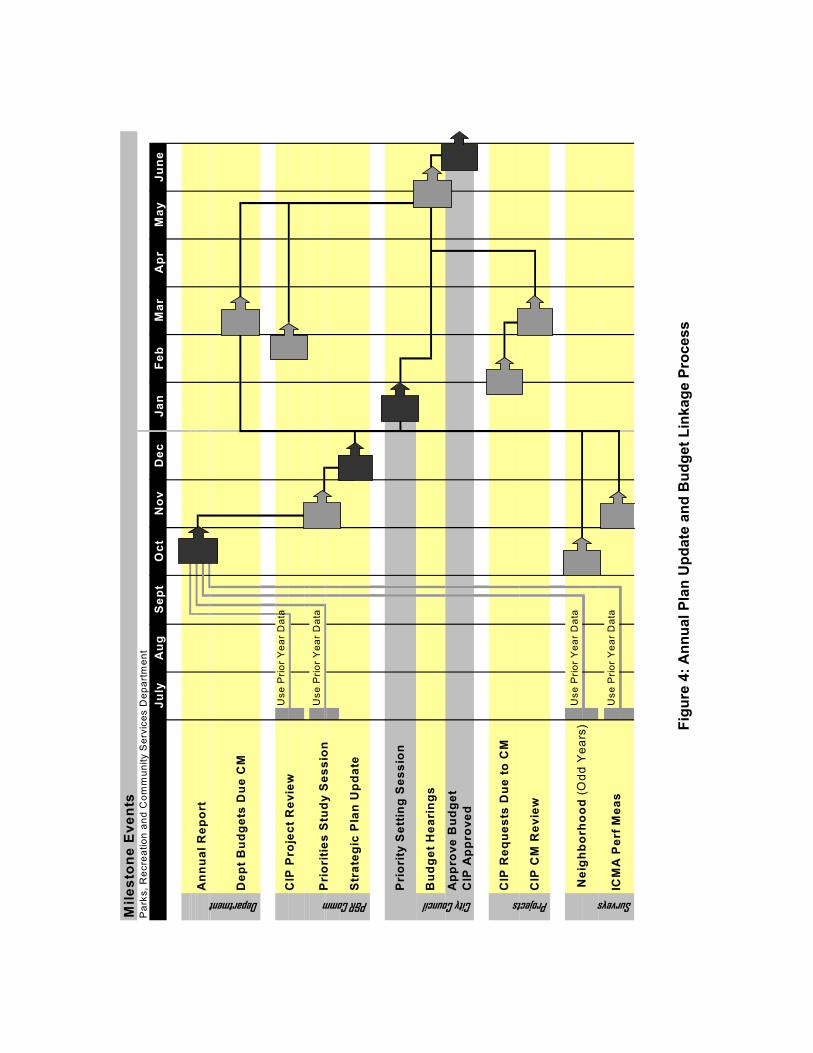
M
ilest
one
Eve
nts
Par
ks, R
ecre
atio
n an
d C
omm
unity
Ser
vice
s D
epar
tmen
t
Use
Prio
r Y
ear
Dat
a
Use
Prio
r Y
ear
Dat
a
Use
Prio
r Y
ear
Dat
a
Use
Prio
r Y
ear
Dat
a
July
Aug
Sep
tO
ctN
ovD
ecJa
nFe
bM
arA
prM
ayJu
ne
Ann
ual R
epor
t
Dep
t Bud
gets
Due
CM
Department Projects
CIP
Req
uest
s D
ue to
CM
CIP
CM
Rev
iew
P&R Comm
CIP
Pro
ject
Rev
iew
Pri
oriti
es S
tudy
Ses
sion
Str
ateg
ic P
lan
Upd
ate
Surveys
Nei
ghbo
rhoo
d (O
dd Y
ears
)
ICM
A P
erf M
eas
City Council
Pri
ority
Set
ting
Ses
sion
Bud
get H
eari
ngs
App
rove
Bud
get
CIP
App
rove
d
Figu
re 4
: Ann
ual P
lan
Upd
ate
and
Bud
get L
inka
ge P
roce
ss
How you can get involved
Our core purpose is to build community through people, parks and programs, so we encourage you to get involved. There are many volunteer opportunities available with the Parks, Recreation and Community Services Department, please contact our office, 1400 Roosevelt Avenue, Redwood City, CA 94061 or by calling (650) 780-7250 for information regarding:
• Adopt – A – Park where neighbors have a hands on involvement with a park of interest where you can plant flowers, groom the landscape or just admire in support of our maintenance and recreation programs. Contact Mike (650) 780-7247.
• Join PACT to learn more about our Department and other departments in a community awareness program by contacting Deanna in the City Manager’s office (650) 780-7300.
• For more about our Youth and Teen programs call Adilah (650) 780-7311 • The many programs at the Senior Center please contact our coordinator (650) 780-7270 • For Fair Oaks Community Center programs, please contact Teri (650) 780-7500
Enjoy some of our many community events: • The Pet Parade will be the happiest day for you and your pet, call Gary (650) 780-7246 • Art Day in the Park for more information contact Chris (650) 780-7253 • July 4th Parade Float see our Park and Recreation Commission float, a theme park on
wheels in each year’s parade. • Summer Concerts in the Park Wednesday evening concerts in Stafford Park • Live in Downtown Friday evening Summer concert series at the City Hall Plaza • Spooktacular and Fair Oaks Community Center’s Horrific Halloween Adventure for kids
If you want to become involved to promote the quality of life in our community try:
• Pride and Beautification Committee meets 1st Wednesday 7:30 am monthly at City Hall, is a non-City Council appointed Committee open to the public that promotes quality of life in Redwood City by creating, participating in, and supporting activities and programs that improve the physical and aesthetic environment of our community.
For the serious minded volunteer become involved with one of the City Council appointed volunteer organizations that work with our Department. The following Commissions, Committees and Boards are appointed by the City Council for terms of four years each. Contact the City Clerk for applications and recruitment information (650) 780-7220.
• Civic Cultural Commission meets 1st Thursday 7:00 pm monthly at Community Activities Building. The duties of this seven member Commission include recommendations to the City Council on the establishment of programs encouraging the development and maintenance of performing and visual arts in the City.
• Parks and Recreation Commission meets 4th Wednesday 7:30 pm monthly at Community Activities Building consists of seven members that acts in an advisory capacity to the City Council in policy matters pertaining to the acquisition and development of parks and the formulation of a recreation program to meet the needs of the citizens.
• Senior Affairs Commission meets 2nd Thursday 1:00 pm monthly at Sr. Center Veterans Building with alternating months at the Fair Oaks Community Center. General objectives of this seven member Commission shall be to encourage, foster, facilitate, establish and maintain programs for the enhancement of all matters relating to the social, economic and personal well being of the City’s senior population.
APPENDIX
Appendix 1 1990 Strategic Plan
Appendix 2 Redwood City Park and School 2004 Inventory Appendix 3 Peninsula City Maintained Park Area verses
Population Appendix 4 Peninsula Area Facilities and Operations
Comparisons Appendix 5 Field Use Statistics
Appendix 6 Facility Usage Statistics Appendix 7 Recycled Water Task Force Report, Executive
Summary Appendix 8 Field Life Cycle Comparisons
Appendix 9 Sports Field Conversion to Synthetic Turf Priority Plan
Appendix 10 6-Year Capital Improvement Program Appendix 11 Community Demographics, Survey Results and
Existing Measures
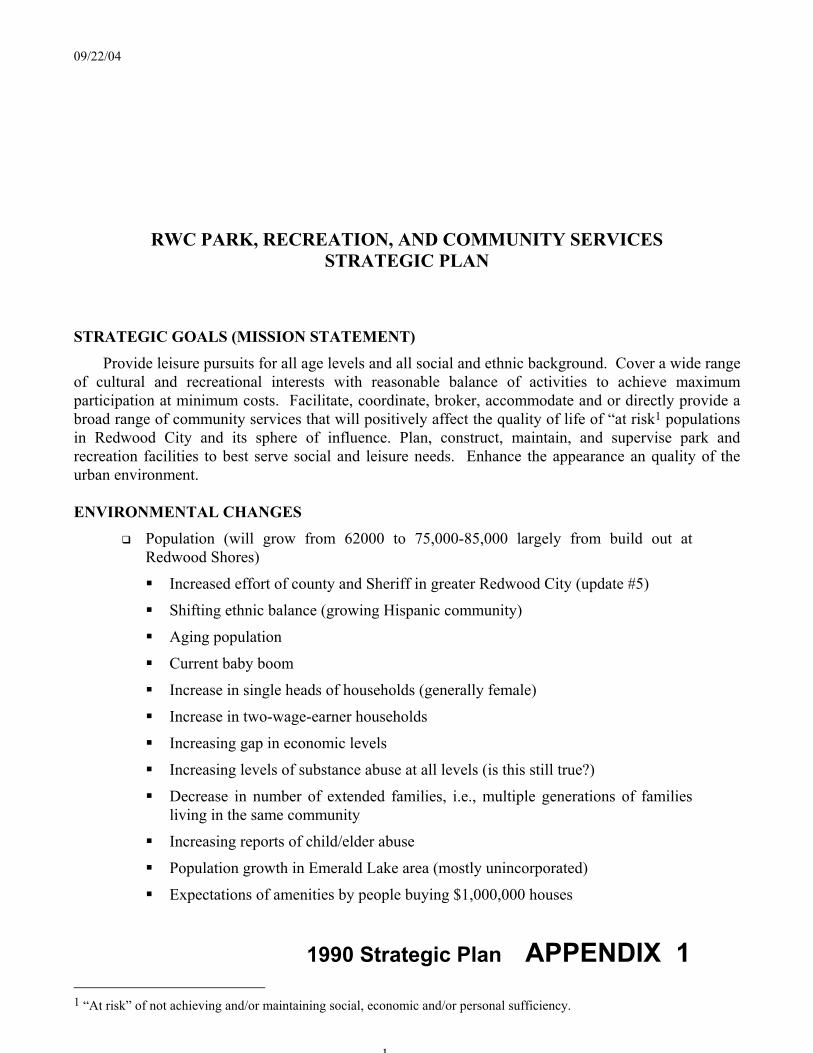
09/22/04
1
RWC PARK, RECREATION, AND COMMUNITY SERVICES STRATEGIC PLAN
STRATEGIC GOALS (MISSION STATEMENT)
Provide leisure pursuits for all age levels and all social and ethnic background. Cover a wide range of cultural and recreational interests with reasonable balance of activities to achieve maximum participation at minimum costs. Facilitate, coordinate, broker, accommodate and or directly provide a broad range of community services that will positively affect the quality of life of “at risk1 populations in Redwood City and its sphere of influence. Plan, construct, maintain, and supervise park and recreation facilities to best serve social and leisure needs. Enhance the appearance an quality of the urban environment.
ENVIRONMENTAL CHANGES
Population (will grow from 62000 to 75,000-85,000 largely from build out at Redwood Shores)
Increased effort of county and Sheriff in greater Redwood City (update #5)
Shifting ethnic balance (growing Hispanic community)
Aging population
Current baby boom
Increase in single heads of households (generally female)
Increase in two-wage-earner households
Increasing gap in economic levels
Increasing levels of substance abuse at all levels (is this still true?)
Decrease in number of extended families, i.e., multiple generations of families living in the same community
Increasing reports of child/elder abuse
Population growth in Emerald Lake area (mostly unincorporated)
Expectations of amenities by people buying $1,000,000 houses
1990 Strategic Plan APPENDIX 1 1 “At risk” of not achieving and/or maintaining social, economic and/or personal sufficiency.

Park and Recreation Commission Workplan
2
Governmental controls
State/Federal legislation—trend at Federal level to shift responsibility and control of human (community services) programs to the local level
Licensing requirements for senior and child day care
State and Federal funding decreasing (e.g., Area Agency on Aging grant has been reduced an average of 4% for each of the last four years (1985-1989) [Do these still exist?]
Other government entities (Army Corps of Engineers, BCDC, ABAG, etc.)
Zoning/land use
Increasing demand for business land use (erodes possible open space
Limited land available
Technology
Aesthetics (trees, plantings, sidewalks, traffic islands)
Funding needs
Weather (temperature, rainfall—drought tolerant plants) Are these changing?
KEY FACTORS
Building in Redwood Shores
Changes in ethnic balance (e.g., growth of Hispanic community)
Commercial development (Port, Redwood Shores)
Availability of funding
Declining open space
Aging housing stock
Changing residential densities
Changes in wages and disposable income
Availability of affordable housing
Transportation infrastructure (public and private)
Standards of maintenance
Citizen expectations
Facilities
Child care
Amenities for upper income residents (the $1million house bunch)
Level of citizen involvement and willingness to participate (volunteerism)
1990 Strategic Plan APPENDIX 1 page 2
Park and Recreation Commission Workplan
3
STRENGTHS AND WEAKNESSES
Community
Growing diversity of ethnic population
Wide variety of ideas, cultures, cultural events
Communication problems
Great and growing economic diversity
Lower income population requires more funded services, provides lower tax base
Greater number of wealthy residents
Volunteerism
Strong (seniors at Fair Oaks where individuals see direct tangible benefits)
Weak (other interests, e.g., arts, fund raising)
Lack of sense of community
Renters less able to protect income form federal and state taxes
Citizens spend proportionately more of their total income, i.e., sales tax
Rental payments subsidize property tax payments of owners
City Government
Staffing
Teambuilding needed among City department heads/management
Increasing need for multilingual, ethnically diverse staff
Current staff are extremely flexible
Ability and willingness to implement change
Lack of automated information systems support
Lack of funds (probable decreases in level of services)
Bad city image (“Deadwood City”)
Downtown Days poor quality vendors, publicity, etc.
Acceptance of shoddiness
Willingness “to settle”
Volunteerism—Parks and Recreation Department Related
Strong, well regarded Parks and Recreation Program
Facilities
Parks (generally good shape) some play structures require replacement (Spinas, Stulsaft, Fleishman)
1990 Strategic Plan APPENDIX 1 page 3
Park and Recreation Commission Workplan
4
Buildings (generally good shape. Some need improvement or replacement, e.g., future need for new facilities—parks, recreation center, child care services, library branch—at Redwood Shores)
Need to be flexible in design to accommodate a variety of uses
Other needs
• Office space adequate (P&R administration)
• Storage space totally inadequate (needs to be proximate to use, secure, e.g., park equipment storage)
Staffing
Overall high quality of staff
Some areas need upgrading
Understaffing in administration (need Community Services Superintendent, Cultural Coordinator)
Limitations on part timer use
Need for park rangers
Training will need to be refocused (gangs, other juvenile problems, child care, homeless)
Maintenance systems need to be computerized (lack of time and money)
Cooperative efforts with the Redwood City Police Department
Maintenance equipment in good shape (need storage space)
Program Participation
Outstanding—high participation, enthusiastic for sports in general, senior activities
Low for cultural, special programs
Programming Visibility (e.g., perceived lack of programs on east side of city)
Transportation
Limited public transportation
Limited special access transportation (seniors, handicapped, youth to afterschool activities where parent or guardian is unavailable to provide it)
Limited parking
Funding—difficulty attracting corporate contributions (funds, in-kind)
Cohesiveness/support groups
Strong (Friends of the Library, seniors)
Weak (other activities)
1990 Strategic Plan APPENDIX 1 page 4
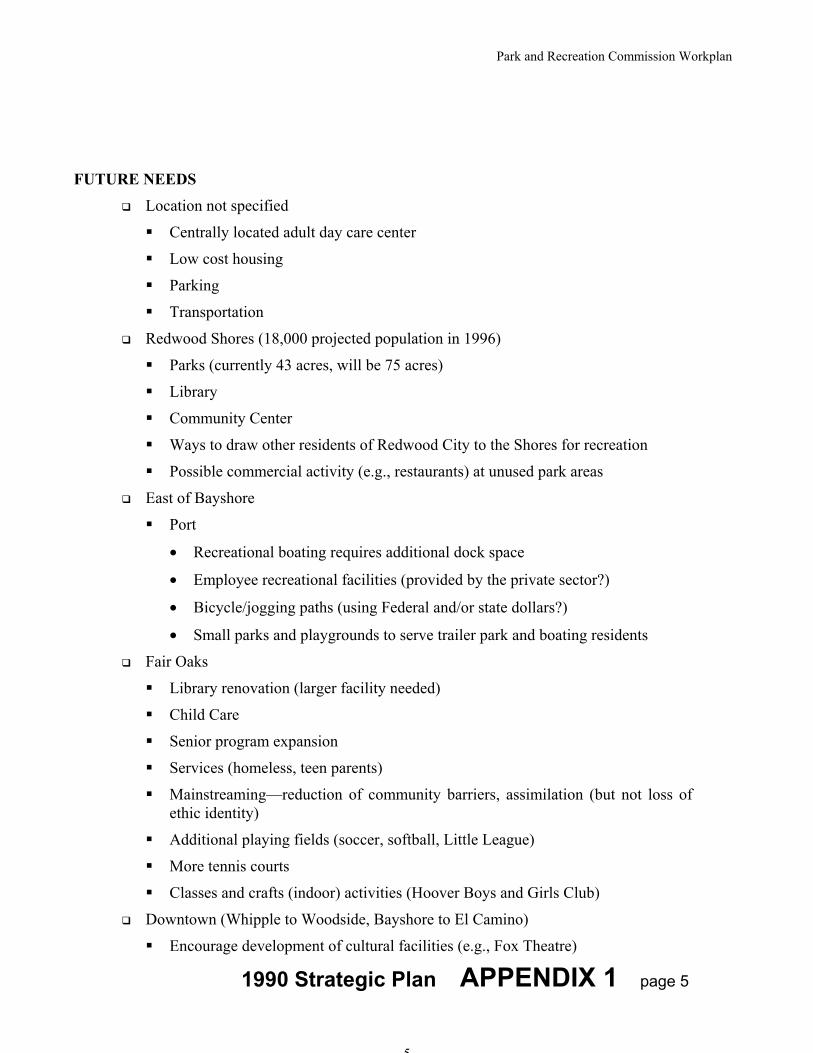
Park and Recreation Commission Workplan
5
FUTURE NEEDS
Location not specified
Centrally located adult day care center
Low cost housing
Parking
Transportation
Redwood Shores (18,000 projected population in 1996)
Parks (currently 43 acres, will be 75 acres)
Library
Community Center
Ways to draw other residents of Redwood City to the Shores for recreation
Possible commercial activity (e.g., restaurants) at unused park areas
East of Bayshore
Port
• Recreational boating requires additional dock space
• Employee recreational facilities (provided by the private sector?)
• Bicycle/jogging paths (using Federal and/or state dollars?)
• Small parks and playgrounds to serve trailer park and boating residents
Fair Oaks
Library renovation (larger facility needed)
Child Care
Senior program expansion
Services (homeless, teen parents)
Mainstreaming—reduction of community barriers, assimilation (but not loss of ethic identity)
Additional playing fields (soccer, softball, Little League)
More tennis courts
Classes and crafts (indoor) activities (Hoover Boys and Girls Club)
Downtown (Whipple to Woodside, Bayshore to El Camino)
Encourage development of cultural facilities (e.g., Fox Theatre)
1990 Strategic Plan APPENDIX 1 page 5
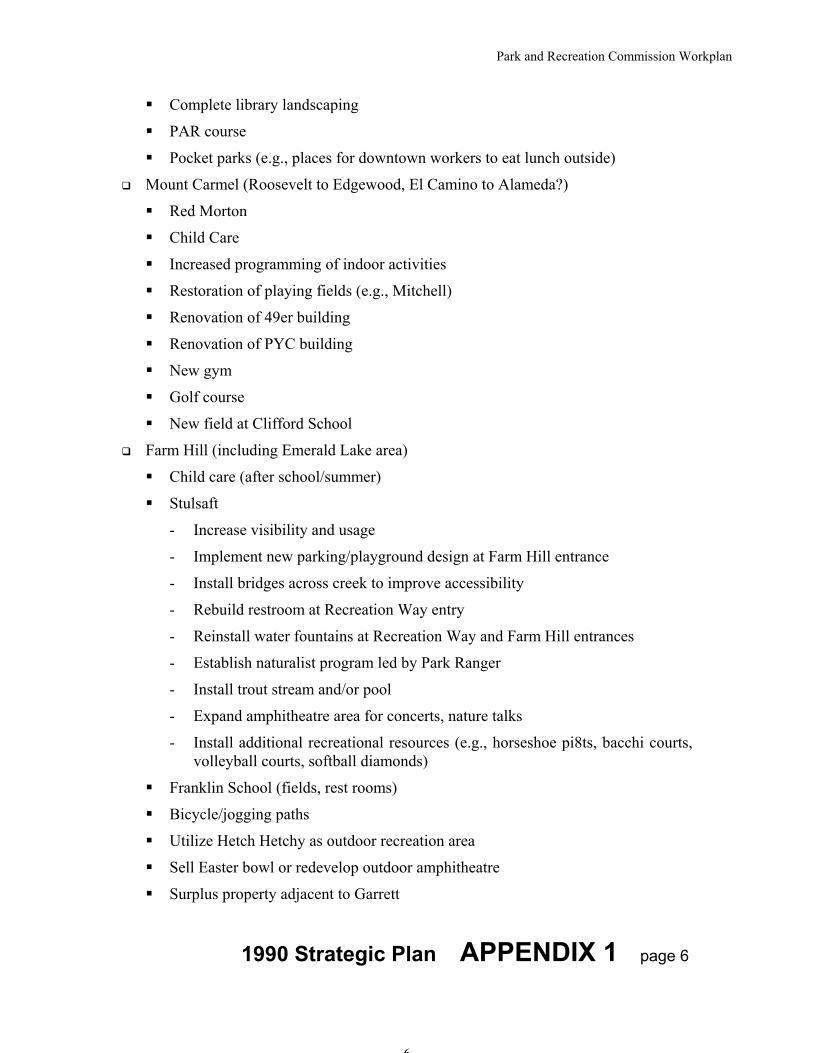
Park and Recreation Commission Workplan
6
Complete library landscaping
PAR course
Pocket parks (e.g., places for downtown workers to eat lunch outside)
Mount Carmel (Roosevelt to Edgewood, El Camino to Alameda?)
Red Morton
Child Care
Increased programming of indoor activities
Restoration of playing fields (e.g., Mitchell)
Renovation of 49er building
Renovation of PYC building
New gym
Golf course
New field at Clifford School
Farm Hill (including Emerald Lake area)
Child care (after school/summer)
Stulsaft
- Increase visibility and usage
- Implement new parking/playground design at Farm Hill entrance
- Install bridges across creek to improve accessibility
- Rebuild restroom at Recreation Way entry
- Reinstall water fountains at Recreation Way and Farm Hill entrances
- Establish naturalist program led by Park Ranger
- Install trout stream and/or pool
- Expand amphitheatre area for concerts, nature talks
- Install additional recreational resources (e.g., horseshoe pi8ts, bacchi courts, volleyball courts, softball diamonds)
Franklin School (fields, rest rooms)
Bicycle/jogging paths
Utilize Hetch Hetchy as outdoor recreation area
Sell Easter bowl or redevelop outdoor amphitheatre
Surplus property adjacent to Garrett
1990 Strategic Plan APPENDIX 1 page 6
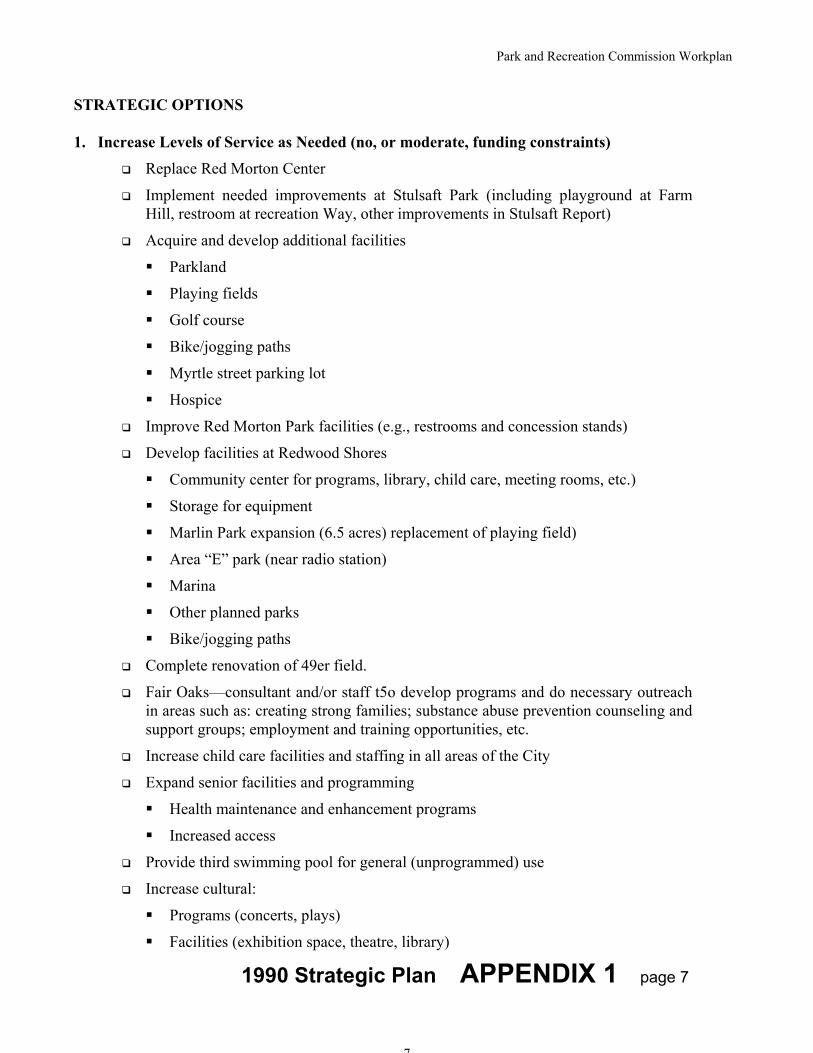
Park and Recreation Commission Workplan
7
STRATEGIC OPTIONS
1. Increase Levels of Service as Needed (no, or moderate, funding constraints)
Replace Red Morton Center
Implement needed improvements at Stulsaft Park (including playground at Farm Hill, restroom at recreation Way, other improvements in Stulsaft Report)
Acquire and develop additional facilities
Parkland
Playing fields
Golf course
Bike/jogging paths
Myrtle street parking lot
Hospice
Improve Red Morton Park facilities (e.g., restrooms and concession stands)
Develop facilities at Redwood Shores
Community center for programs, library, child care, meeting rooms, etc.)
Storage for equipment
Marlin Park expansion (6.5 acres) replacement of playing field)
Area “E” park (near radio station)
Marina
Other planned parks
Bike/jogging paths
Complete renovation of 49er field.
Fair Oaks—consultant and/or staff t5o develop programs and do necessary outreach in areas such as: creating strong families; substance abuse prevention counseling and support groups; employment and training opportunities, etc.
Increase child care facilities and staffing in all areas of the City
Expand senior facilities and programming
Health maintenance and enhancement programs
Increased access
Provide third swimming pool for general (unprogrammed) use
Increase cultural:
Programs (concerts, plays)
Facilities (exhibition space, theatre, library)
1990 Strategic Plan APPENDIX 1 page 7
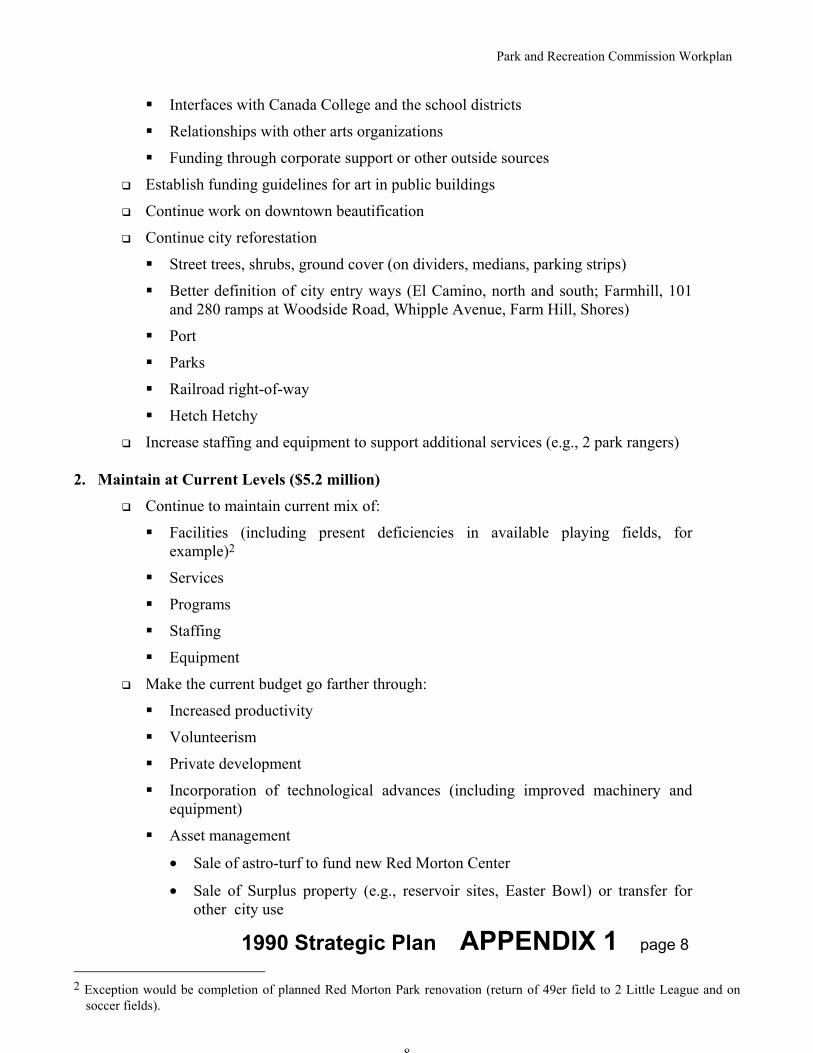
Park and Recreation Commission Workplan
8
Interfaces with Canada College and the school districts
Relationships with other arts organizations
Funding through corporate support or other outside sources
Establish funding guidelines for art in public buildings
Continue work on downtown beautification
Continue city reforestation
Street trees, shrubs, ground cover (on dividers, medians, parking strips)
Better definition of city entry ways (El Camino, north and south; Farmhill, 101 and 280 ramps at Woodside Road, Whipple Avenue, Farm Hill, Shores)
Port
Parks
Railroad right-of-way
Hetch Hetchy
Increase staffing and equipment to support additional services (e.g., 2 park rangers)
2. Maintain at Current Levels ($5.2 million)
Continue to maintain current mix of:
Facilities (including present deficiencies in available playing fields, for example)2
Services
Programs
Staffing
Equipment
Make the current budget go farther through:
Increased productivity
Volunteerism
Private development
Incorporation of technological advances (including improved machinery and equipment)
Asset management
• Sale of astro-turf to fund new Red Morton Center
• Sale of Surplus property (e.g., reservoir sites, Easter Bowl) or transfer for other city use
1990 Strategic Plan APPENDIX 1 page 8 2 Exception would be completion of planned Red Morton Park renovation (return of 49er field to 2 Little League and on
soccer fields).
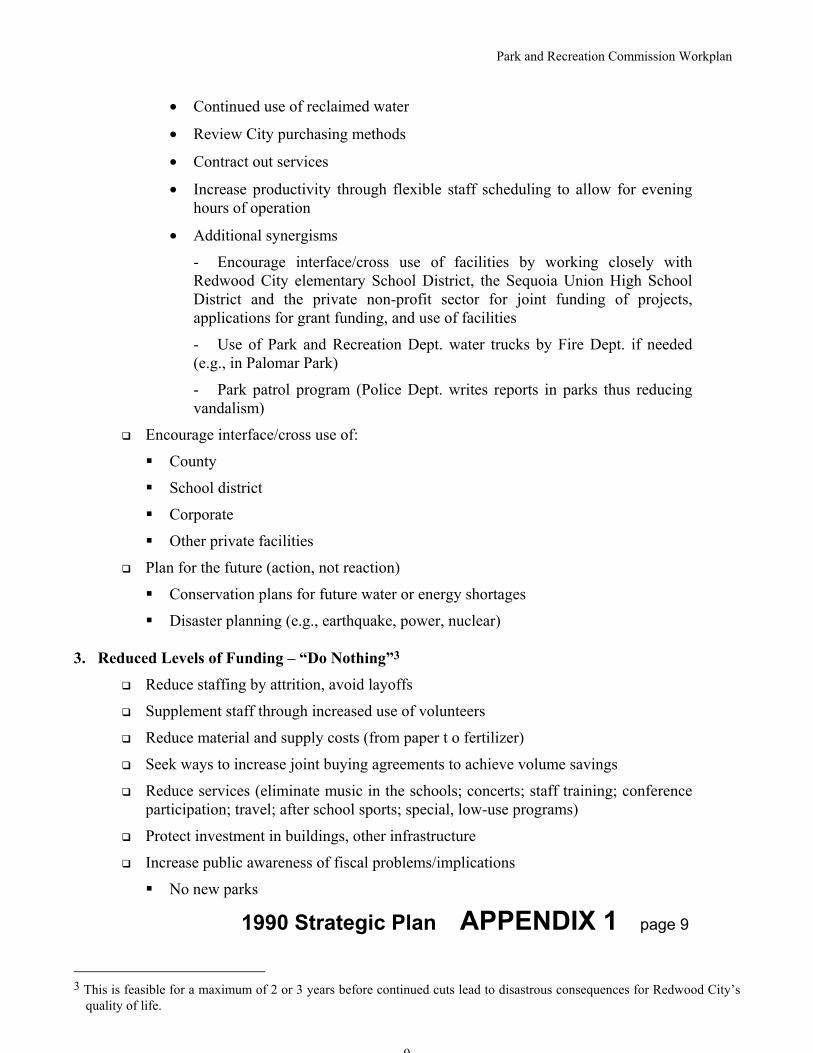
Park and Recreation Commission Workplan
9
• Continued use of reclaimed water
• Review City purchasing methods
• Contract out services
• Increase productivity through flexible staff scheduling to allow for evening hours of operation
• Additional synergisms
- Encourage interface/cross use of facilities by working closely with Redwood City elementary School District, the Sequoia Union High School District and the private non-profit sector for joint funding of projects, applications for grant funding, and use of facilities
- Use of Park and Recreation Dept. water trucks by Fire Dept. if needed (e.g., in Palomar Park)
- Park patrol program (Police Dept. writes reports in parks thus reducing vandalism)
Encourage interface/cross use of:
County
School district
Corporate
Other private facilities
Plan for the future (action, not reaction)
Conservation plans for future water or energy shortages
Disaster planning (e.g., earthquake, power, nuclear)
3. Reduced Levels of Funding – “Do Nothing”3
Reduce staffing by attrition, avoid layoffs
Supplement staff through increased use of volunteers
Reduce material and supply costs (from paper t o fertilizer)
Seek ways to increase joint buying agreements to achieve volume savings
Reduce services (eliminate music in the schools; concerts; staff training; conference participation; travel; after school sports; special, low-use programs)
Protect investment in buildings, other infrastructure
Increase public awareness of fiscal problems/implications
No new parks
1990 Strategic Plan APPENDIX 1 page 9
3 This is feasible for a maximum of 2 or 3 years before continued cuts lead to disastrous consequences for Redwood City’s
quality of life.
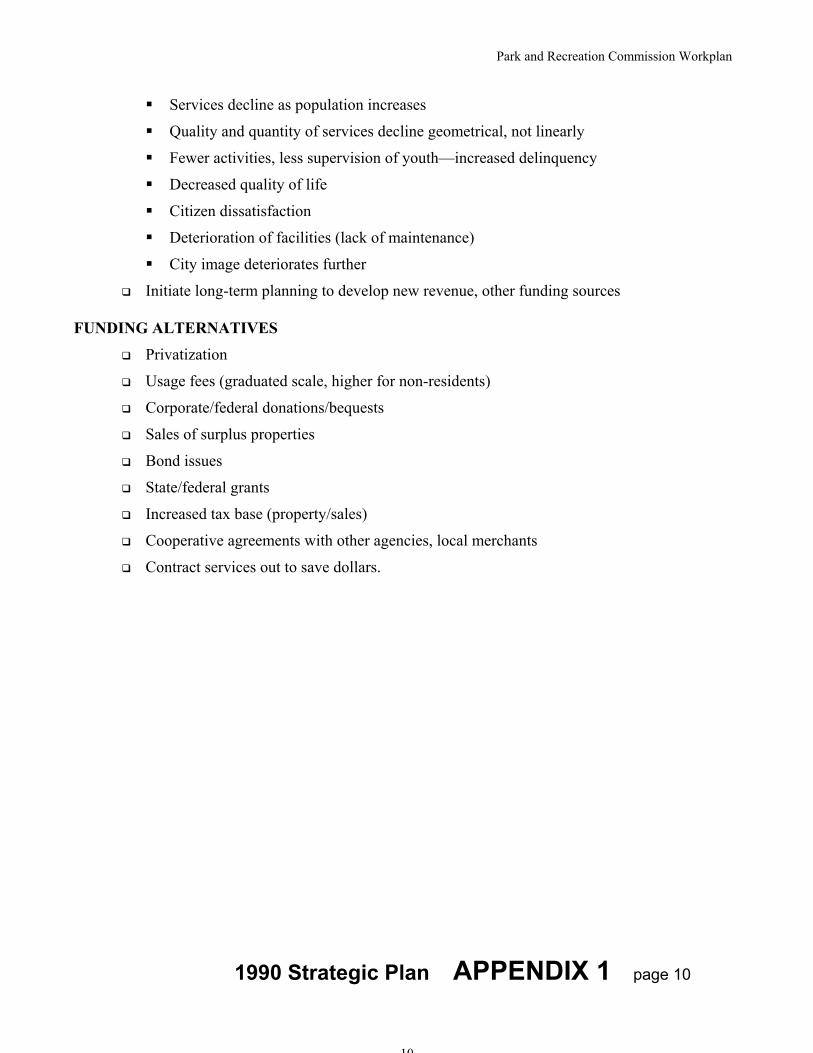
Park and Recreation Commission Workplan
10
Services decline as population increases
Quality and quantity of services decline geometrical, not linearly
Fewer activities, less supervision of youth—increased delinquency
Decreased quality of life
Citizen dissatisfaction
Deterioration of facilities (lack of maintenance)
City image deteriorates further
Initiate long-term planning to develop new revenue, other funding sources
FUNDING ALTERNATIVES
Privatization
Usage fees (graduated scale, higher for non-residents)
Corporate/federal donations/bequests
Sales of surplus properties
Bond issues
State/federal grants
Increased tax base (property/sales)
Cooperative agreements with other agencies, local merchants
Contract services out to save dollars.
1990 Strategic Plan APPENDIX 1 page 10
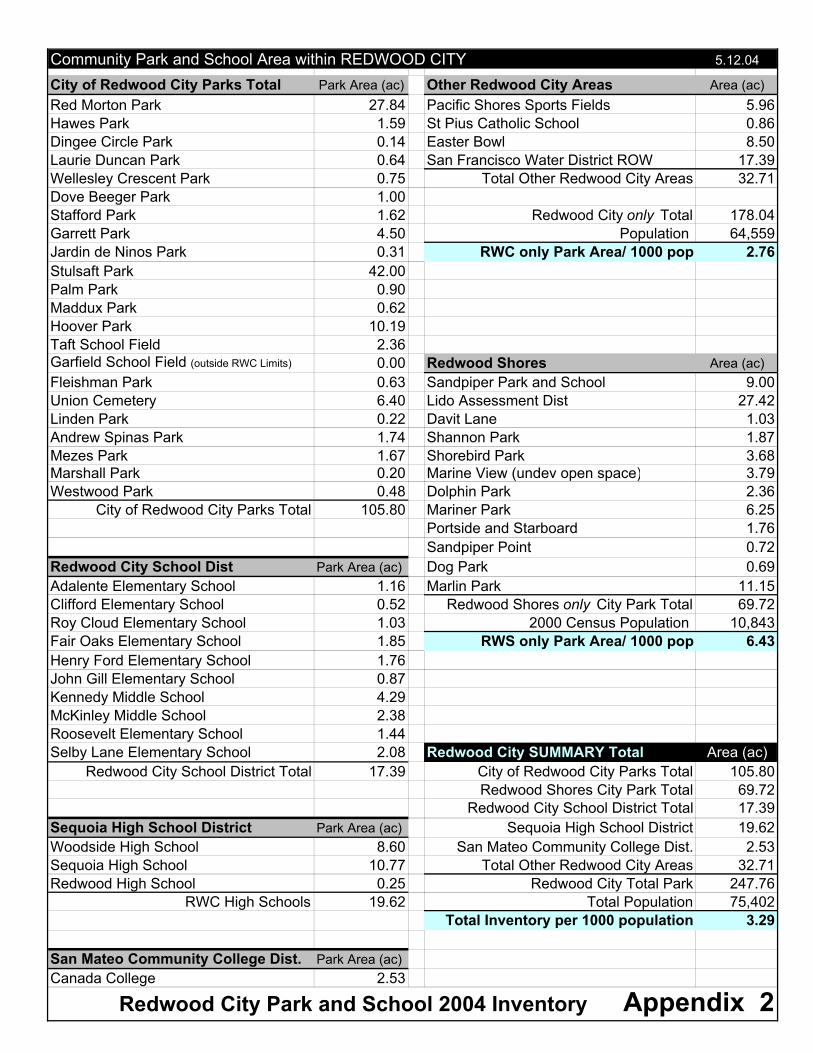
Community Park and School Area within REDWOOD CITY 5.12.04
City of Redwood City Parks Total Park Area (ac) Other Redwood City Areas Area (ac)Red Morton Park 27.84 Pacific Shores Sports Fields 5.96Hawes Park 1.59 St Pius Catholic School 0.86Dingee Circle Park 0.14 Easter Bowl 8.50Laurie Duncan Park 0.64 San Francisco Water District ROW 17.39Wellesley Crescent Park 0.75 Total Other Redwood City Areas 32.71Dove Beeger Park 1.00Stafford Park 1.62 Redwood City only Total 178.04Garrett Park 4.50 Population 64,559Jardin de Ninos Park 0.31 RWC only Park Area/ 1000 pop 2.76Stulsaft Park 42.00Palm Park 0.90Maddux Park 0.62Hoover Park 10.19Taft School Field 2.36Garfield School Field (outside RWC Limits) 0.00 Redwood Shores Area (ac)Fleishman Park 0.63 Sandpiper Park and School 9.00Union Cemetery 6.40 Lido Assessment Dist 27.42Linden Park 0.22 Davit Lane 1.03Andrew Spinas Park 1.74 Shannon Park 1.87Mezes Park 1.67 Shorebird Park 3.68Marshall Park 0.20 Marine View (undev open space) 3.79Westwood Park 0.48 Dolphin Park 2.36
City of Redwood City Parks Total 105.80 Mariner Park 6.25Portside and Starboard 1.76Sandpiper Point 0.72
Redwood City School Dist Park Area (ac) Dog Park 0.69Adalente Elementary School 1.16 Marlin Park 11.15Clifford Elementary School 0.52 Redwood Shores only City Park Total 69.72Roy Cloud Elementary School 1.03 2000 Census Population 10,843Fair Oaks Elementary School 1.85 RWS only Park Area/ 1000 pop 6.43Henry Ford Elementary School 1.76John Gill Elementary School 0.87Kennedy Middle School 4.29McKinley Middle School 2.38Roosevelt Elementary School 1.44Selby Lane Elementary School 2.08 Redwood City SUMMARY Total Area (ac)
Redwood City School District Total 17.39 City of Redwood City Parks Total 105.80Redwood Shores City Park Total 69.72
Redwood City School District Total 17.39Sequoia High School District Park Area (ac) Sequoia High School District 19.62Woodside High School 8.60 San Mateo Community College Dist. 2.53Sequoia High School 10.77 Total Other Redwood City Areas 32.71Redwood High School 0.25 Redwood City Total Park 247.76
RWC High Schools 19.62 Total Population 75,402Total Inventory per 1000 population 3.29
San Mateo Community College Dist. Park Area (ac)Canada College 2.53
Redwood City Park and School 2004 Inventory Appendix 2

Park
Are
a vs
Pop
ulat
ion
revi
sed
4.19
.04
Par
k ar
ea m
aint
aine
d by
eac
h C
ity w
heth
er th
e pr
oper
ty is
ow
ned
by th
e ag
ency
or n
otB
ase
Line
2000
US
C
ensu
s D
ata
Number of Parks
Gen
eral
P
ark
Sch
ool
Site
s
Sub
Tot
al
Par
k A
cres
Par
k A
rea
per 1
000
popu
latio
n le
ss o
pen
spac
e ac
Nat
ural
A
rea
&
Ope
n S
pace
Tota
l Par
k A
rea
Incl
udin
g O
pen
Spa
ce
Tota
l Par
k A
rea
per
1000
pop
. in
clud
ing
Ope
n S
pace
Bel
mon
t25
,100
2042
.37
16.1
158
.48
2.33
302.
1536
0.63
14.3
7B
urlin
gam
e28
,200
1658
.95
58.9
52.
0928
.00
86.9
53.
08D
aly
City
103,
650
3010
0.00
100.
000.
9619
8.00
298.
002.
88Fo
ster
City
28,8
0020
86.0
086
.00
2.99
212.
0029
8.00
10.3
5M
enlo
Par
k30
,800
1252
.36
52.3
61.
7015
.50
67.8
62.
20M
illbr
ae20
,700
1530
.50
11.1
041
.60
2.01
61.9
010
3.50
5.00
Red
wd
City
Tot
al75
,402
3412
0.16
15.1
813
5.34
1.79
42.7
917
8.13
2.36
RW
C T
own
64,5
5922
54.2
215
.18
69.4
01.
0739
.00
108.
401.
68
R
wd
Sho
res
10,8
4312
65.9
465
.94
6.08
3.79
69.7
36.
43S
an B
runo
40,2
0018
71.5
024
.80
96.3
02.
4012
8.25
224.
555.
59S
an C
arlo
s27
,700
1561
.54
61.5
42.
2282
.20
143.
745.
19S
an M
ateo
92,5
0033
231.
6023
1.60
2.50
281.
6051
3.20
5.55
So
San
Fra
ncis
co60
,550
1684
.00
108.
0019
2.00
3.17
126.
0031
8.00
5.25
San
ta C
lara
Cou
nty
Cam
pbel
l38
,138
1057
.90
51.4
010
9.30
2.87
109.
302.
87C
uper
tino
50,5
5016
128.
6429
.88
158.
523.
1415
8.52
3.14
Mou
ntai
n V
iew
70,7
0023
114.
2515
6.67
270.
923.
8375
3.00
1023
.92
14.4
8P
alo
Alto
58,6
0028
150.
9540
.00
190.
953.
2633
40.0
035
30.9
560
.26
Sun
nyva
le13
1,80
019
239.
2610
8.81
348.
072.
6411
7.25
465.
323.
5316
City
Ave
rage
2.48
Ave
rage
Par
k ar
ea le
ss o
pen
spac
e pe
r 100
0 po
pula
tion
for 1
6 C
ities
=2.
48A
rea
requ
ired
to b
ring
Red
woo
d C
ity (t
own
only
)fro
m 1
.07
to 2
.48
acre
s pe
r 100
0 po
p =
90.7
1
Are
a re
quire
d to
brin
g R
edw
ood
City
ave
rage
from
1.7
9 to
2.4
8 ac
res
per 1
000
popu
latio
n =
51.6
6
Par
k Ty
pe
San
Mat
eo C
ount
y
APPENDIX 3Peninsula City Maintained Park Area vs Population
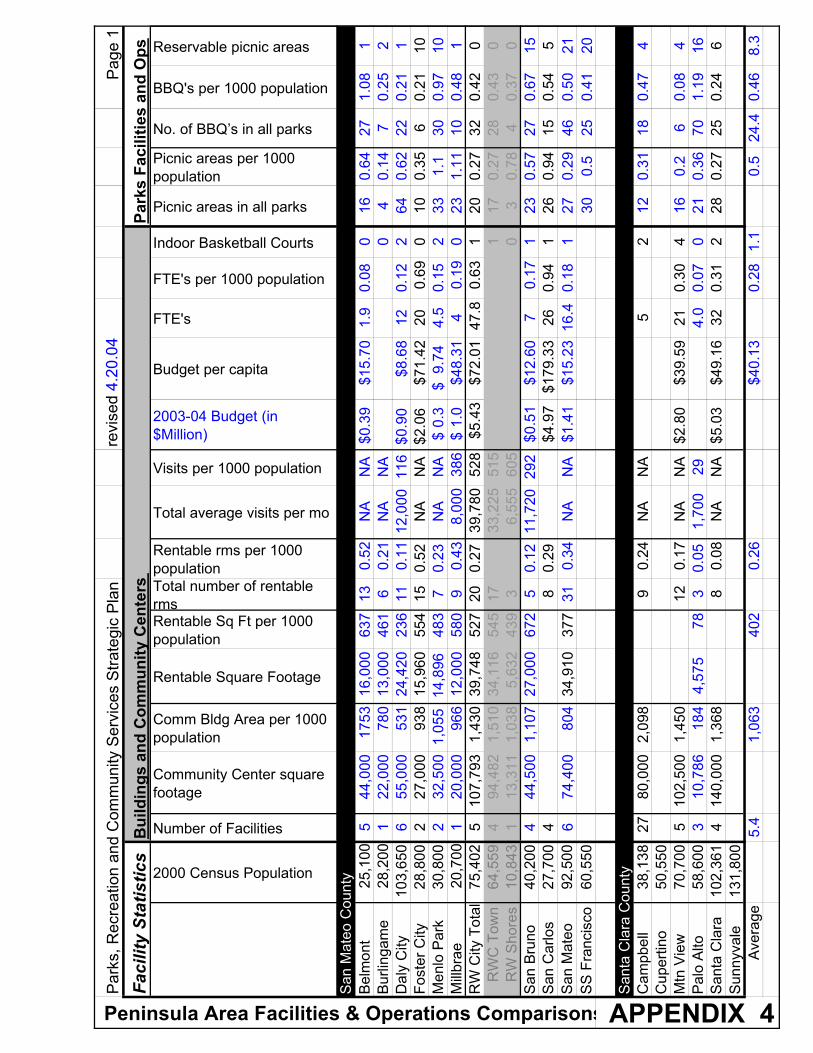
Par
ks, R
ecre
atio
n an
d C
omm
unity
Ser
vice
s S
trate
gic
Pla
nre
vise
d 4.
20.0
4P
age
1
Faci
lity
Stat
istic
sB
uild
ings
and
Com
mun
ity C
ente
rs
Park
s Fa
cilit
ies
and
Ops
2000 Census Population
Number of Facilities
Community Center square footage
Comm Bldg Area per 1000 population
Rentable Square Footage
Rentable Sq Ft per 1000 population
Total number of rentable rms
Rentable rms per 1000 population
Total average visits per mo
Visits per 1000 population
2003-04 Budget (in $Million)
Budget per capita
FTE's
FTE's per 1000 population
Indoor Basketball Courts
Picnic areas in all parks
Picnic areas per 1000 population
No. of BBQ’s in all parks
BBQ's per 1000 population
Reservable picnic areas
Bel
mon
t25
,100
544
,000
1753
16,0
0063
713
0.52
NA
NA
$0.3
9$1
5.70
1.9
0.08
016
0.64
271.
081
Bur
linga
me
28,2
001
22,0
0078
013
,000
461
60.
21N
AN
A0
40.
147
0.25
2D
aly
City
103,
650
655
,000
531
24,4
2023
611
0.11
12,0
0011
6$0
.90
$8.6
812
0.12
264
0.62
220.
211
Fost
er C
ity28
,800
227
,000
938
15,9
6055
415
0.52
NA
NA
$2.0
6$7
1.42
200.
690
100.
356
0.21
10M
enlo
Par
k30
,800
232
,500
1,05
514
,896
483
70.
23N
AN
A0.
3$
9.
74$
4.
50.
152
331.
130
0.97
10M
illbr
ae20
,700
120
,000
966
12,0
0058
09
0.43
8,00
038
61.
0$
$4
8.31
40.
190
231.
1110
0.48
1R
W C
ity T
otal
75,4
025
107,
793
1,43
039
,748
527
200.
2739
,780
528
$5.4
3$7
2.01
47.8
0.63
120
0.27
320.
420
R
WC
Tow
n 64
,559
494
,482
1,51
034
,116
545
1733
,225
515
117
0.27
280.
430
R
W S
hore
s10
,843
113
,311
1,03
85,
632
439
36,
555
605
03
0.78
40.
370
San
Bru
no40
,200
444
,500
1,10
727
,000
672
50.
1211
,720
292
$0.5
1$1
2.60
70.
171
230.
5727
0.67
15S
an C
arlo
s27
,700
48
0.29
$4.9
7$1
79.3
326
0.94
126
0.94
150.
545
San
Mat
eo92
,500
674
,400
804
34,9
1037
731
0.34
NA
NA
$1.4
1$1
5.23
16.4
0.18
127
0.29
460.
5021
SS
Fra
ncis
co60
,550
300.
525
0.41
20
San
ta C
lara
Cou
nty
Cam
pbel
l38
,138
2780
,000
2,09
89
0.24
NA
NA
52
120.
3118
0.47
4C
uper
tino
50,5
50M
tn V
iew
70,7
005
102,
500
1,45
012
0.17
NA
NA
$2.8
0$3
9.59
210.
304
160.
26
0.08
4P
alo
Alto
58,6
003
10,7
8618
44,
575
783
0.05
1,70
029
4.0
0.07
021
0.36
701.
1916
San
ta C
lara
102,
361
414
0,00
01,
368
80.
08N
AN
A$5
.03
$49.
1632
0.31
228
0.27
250.
246
Sun
nyva
le13
1,80
0A
vera
ge5.
41,
063
402
0.26
$40.
130.
281.
10.
524
.40.
468.
3
APPENDIX 4Peninsula Area Facilities & Operations Comparisons
San
Mat
eo C
ount
y
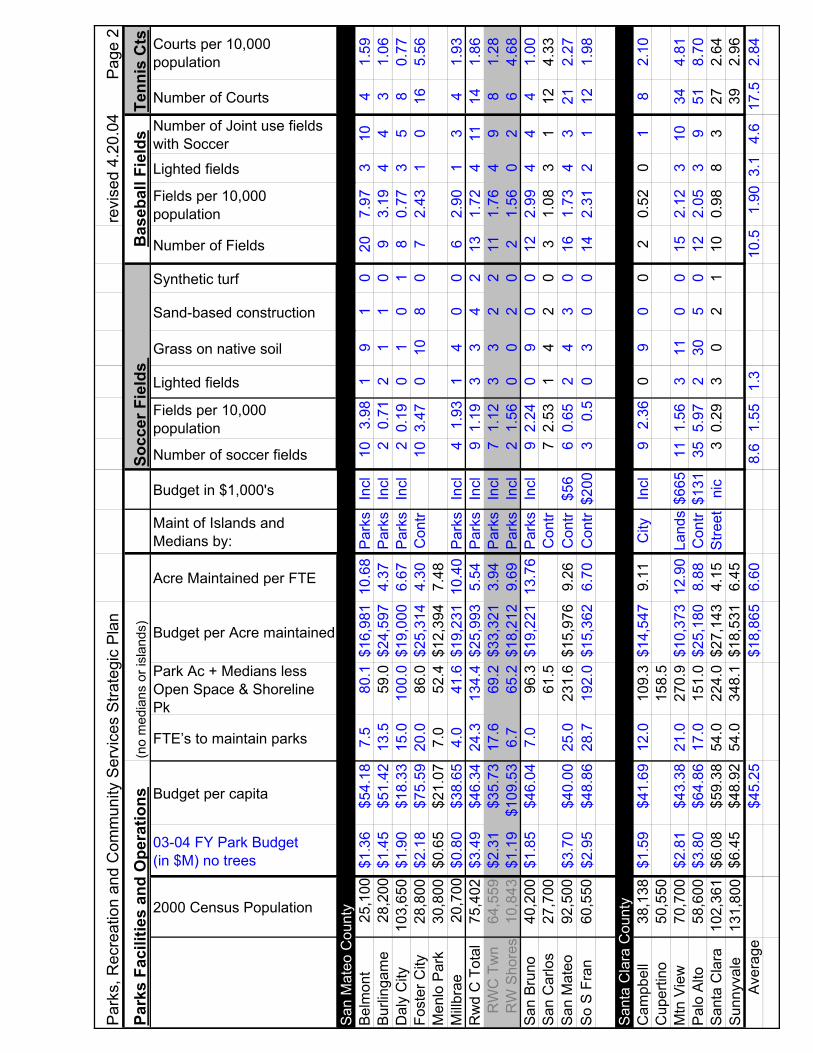
Par
ks, R
ecre
atio
n an
d C
omm
unity
Ser
vice
s S
trate
gic
Pla
nre
vise
d 4.
20.0
4P
age
2
Park
s Fa
cilit
ies
and
Ope
ratio
ns(n
o m
edia
ns o
r isl
ands
)So
ccer
Fie
lds
Tenn
is C
ts
2000 Census Population
03-04 FY Park Budget (in $M) no trees
Budget per capita
FTE’s to maintain parks
Park Ac + Medians less Open Space & Shoreline Pk
Budget per Acre maintained
Acre Maintained per FTE
Maint of Islands and Medians by:
Budget in $1,000's
Number of soccer fields
Fields per 10,000 population
Lighted fields
Grass on native soil
Sand-based construction
Synthetic turf
Number of Fields
Fields per 10,000 population
Lighted fields
Number of Joint use fields with Soccer
Number of Courts
Courts per 10,000 population
San
Mat
eo C
ount
yB
elm
ont
25,1
00$1
.36
$54.
187.
580
.1$1
6,98
110
.68
Par
ksIn
cl10
3.98
19
10
207.
973
104
1.59
Bur
linga
me
28,2
00$1
.45
$51.
4213
.559
.0$2
4,59
74.
37P
arks
Incl
20.
712
11
09
3.19
44
31.
06D
aly
City
103,
650
$1.9
0$1
8.33
15.0
100.
0$1
9,00
06.
67P
arks
Incl
20.
190
10
18
0.77
35
80.
77Fo
ster
City
28,8
00$2
.18
$75.
5920
.086
.0$2
5,31
44.
30C
ontr
103.
470
108
07
2.43
10
165.
56M
enlo
Par
k30
,800
$0.6
5$2
1.07
7.0
52.4
$12,
394
7.48
Mill
brae
20,7
00$0
.80
$38.
654.
041
.6$1
9,23
110
.40
Par
ksIn
cl4
1.93
14
00
62.
901
34
1.93
Rw
d C
Tot
al75
,402
$3.4
9$4
6.34
24.3
134.
4$2
5,99
35.
54P
arks
Incl
91.
193
34
213
1.72
411
141.
86
RW
C T
wn
64,5
59$2
.31
$35.
7317
.669
.2$3
3,32
13.
94P
arks
Incl
71.
123
32
211
1.76
49
81.
28
RW
Sho
res
10,8
43$1
.19
$109
.53
6.7
65.2
$18,
212
9.69
Par
ksIn
cl2
1.56
00
20
21.
560
26
4.68
San
Bru
no40
,200
$1.8
5$4
6.04
7.0
96.3
$19,
221
13.7
6P
arks
Incl
92.
240
90
012
2.99
44
41.
00S
an C
arlo
s27
,700
61.5
Con
tr7
2.53
14
20
31.
083
112
4.33
San
Mat
eo92
,500
$3.7
0$4
0.00
25.0
231.
6$1
5,97
69.
26C
ontr
$56
60.
652
43
016
1.73
43
212.
27S
o S
Fra
n60
,550
$2.9
5$4
8.86
28.7
192.
0$1
5,36
26.
70C
ontr
$200
30.
50
30
014
2.31
21
121.
98
San
ta C
lara
Cou
nty
Cam
pbel
l38
,138
$1.5
9$4
1.69
12.0
109.
3$1
4,54
79.
11C
ityIn
cl9
2.36
09
00
20.
520
18
2.10
Cup
ertin
o50
,550
158.
5M
tn V
iew
70,7
00$2
.81
$43.
3821
.027
0.9
$10,
373
12.9
0La
nds
$665
111.
563
110
015
2.12
310
344.
81P
alo
Alto
58,6
00$3
.80
$64.
8617
.015
1.0
$25,
180
8.88
Con
tr$1
3135
5.97
230
50
122.
053
951
8.70
San
ta C
lara
102,
361
$6.0
8$5
9.38
54.0
224.
0$2
7,14
34.
15S
treet
nic
30.
293
02
110
0.98
83
272.
64S
unny
vale
131,
800
$6.4
5$4
8.92
54.0
348.
1$1
8,53
16.
4539
2.96
Ave
rage
$45.
25$1
8,86
56.
608.
61.
551.
310
.51.
903.
14.
617
.52.
84
Bas
ebal
l Fie
lds
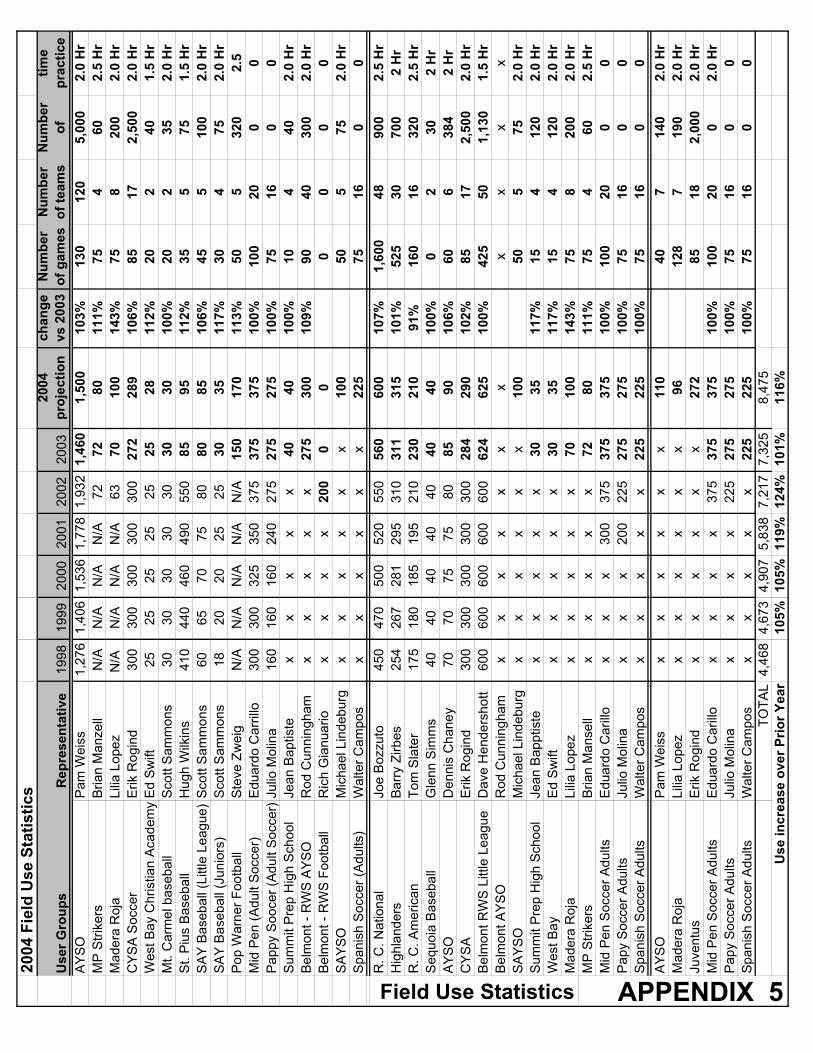
2004
Fie
ld U
se S
tatis
tics
Use
r Gro
ups
Rep
rese
ntat
ive
1998
1999
2000
2001
2002
2003
2004
pr
ojec
tion
chan
ge
vs 2
003
Num
ber
of g
ames
Num
ber
of te
ams
Num
ber
of
time
prac
tice
AY
SO
P
am W
eiss
1,27
61,
406
1,53
61,
778
1,93
21,
460
1,50
010
3%13
012
05,
000
2.0
Hr
MP
Stri
kers
B
rian
Man
zell
N/A
N/A
N/A
N/A
7272
8011
1%75
460
2.5
Hr
Mad
era
Roj
a Li
lia L
opez
N/A
N
/AN
/AN
/A63
7010
014
3%75
820
02.
0 H
rC
YS
A S
occe
rE
rik R
ogin
d30
030
030
030
030
027
228
910
6%85
172,
500
2.0
Hr
Wes
t Bay
Chr
istia
n A
cade
my
Ed
Sw
ift25
2525
2525
2528
112%
202
401.
5 H
rM
t. C
arm
el b
aseb
all
Sco
tt S
amm
ons
3030
3030
3030
3010
0%20
235
2.0
Hr
St.
Piu
s B
aseb
all
Hug
h W
ilkin
s41
044
046
049
055
085
9511
2%35
575
1.5
Hr
SA
Y B
aseb
all (
Littl
e Le
ague
)S
cott
Sam
mon
s60
6570
7580
8085
106%
455
100
2.0
Hr
SA
Y B
aseb
all (
Juni
ors)
Sco
tt S
amm
ons
1820
2025
2530
3511
7%30
475
2.0
Hr
Pop
War
ner F
ootb
all
Ste
ve Z
wei
gN
/AN
/AN
/AN
/AN
/A15
017
011
3%50
532
02.
5M
id P
en (A
dult
Soc
cer)
Edu
ardo
Car
rillo
300
300
325
350
375
375
375
100%
100
200
0P
appy
Soo
cer (
Adu
lt S
occe
r)Ju
lio M
olin
a16
016
016
024
027
527
527
510
0%75
160
0S
umm
it P
rep
Hig
h S
choo
lJe
an B
aptis
tex
xx
xx
4040
100%
104
402.
0 H
rB
elm
ont -
RW
S A
YS
OR
od C
unni
ngha
mx
xx
xx
275
300
109%
9040
300
2.0
Hr
Bel
mon
t - R
WS
Foo
tbal
lR
ich
Gia
nuar
iox
xx
x20
00
00
00
0S
AY
SO
Mic
hael
Lin
debu
rgx
xx
xx
x10
050
575
2.0
Hr
Spa
nish
Soc
cer (
Adu
lts)
Wal
ter C
ampo
sx
xx
xx
x22
575
160
0R
. C. N
atio
nal
Joe
Boz
zuto
450
470
500
520
550
560
600
107%
1,60
048
900
2.5
Hr
Hig
hlan
ders
Bar
ry Z
irbes
254
267
281
295
310
311
315
101%
525
3070
02
Hr
R. C
. Am
eric
anTo
m S
late
r17
518
018
519
521
023
021
091
%16
016
320
2.5
Hr
Seq
uoia
Bas
ebal
lG
lenn
Sim
ms
4040
4040
4040
4010
0%0
230
2 H
rA
YS
OD
enni
s C
hane
y70
7075
7580
8590
106%
606
384
2 H
rC
YS
AE
rik R
ogin
d30
030
030
030
030
028
429
010
2%85
172,
500
2.0
Hr
Bel
mon
t RW
S L
ittle
Lea
gue
Dav
e H
ende
rsho
tt60
060
060
060
060
062
462
510
0%42
550
1,13
01.
5 H
rB
elm
ont A
YS
OR
od C
unni
ngha
mx
xx
xx
xx
xx
xx
SA
YS
OM
icha
el L
inde
burg
xx
xx
xx
100
505
752.
0 H
rS
umm
it P
rep
Hig
h S
choo
lJe
an B
appt
iste
xx
xx
x30
3511
7%15
412
02.
0 H
rW
est B
ay
Ed
Sw
iftx
xx
xx
3035
117%
154
120
2.0
Hr
Mad
era
Roj
aLi
lia L
opez
xx
xx
x70
100
143%
758
200
2.0
Hr
MP
Stri
kers
Bria
n M
anse
llx
xx
xx
7280
111%
754
602.
5 H
rM
id P
en S
occe
r Adu
ltsE
duar
do C
arill
ox
xx
300
375
375
375
100%
100
200
0P
apy
Soc
cer A
dults
Julio
Mol
ina
xx
x20
022
527
527
510
0%75
160
0S
pani
sh S
occe
r Adu
ltsW
alte
r Cam
pos
xx
xx
x22
522
510
0%75
160
0A
YS
OP
am W
eiss
xx
xx
xx
110
407
140
2.0
Hr
Mad
era
Roj
aLi
lia L
opez
xx
xx
xx
9612
87
190
2.0
Hr
Juve
ntus
Erik
Rog
ind
xx
xx
xx
272
8518
2,00
02.
0 H
rM
id P
en S
occe
r Adu
ltsE
duar
do C
arill
ox
xx
x37
537
537
510
0%10
020
02.
0 H
rP
apy
Soc
cer A
dults
Julio
Mol
ina
xx
xx
225
275
275
100%
7516
00
Spa
nish
Soc
cer A
dults
Wal
ter C
ampo
sx
xx
xx
225
225
100%
7516
00
TOTA
L4,
468
4,67
34,
907
5,83
87,
217
7,32
58,
475
Use
incr
ease
ove
r Prio
r Yea
r10
5%10
5%11
9%12
4%10
1%11
6%
APPENDIX 5Field Use Statistics
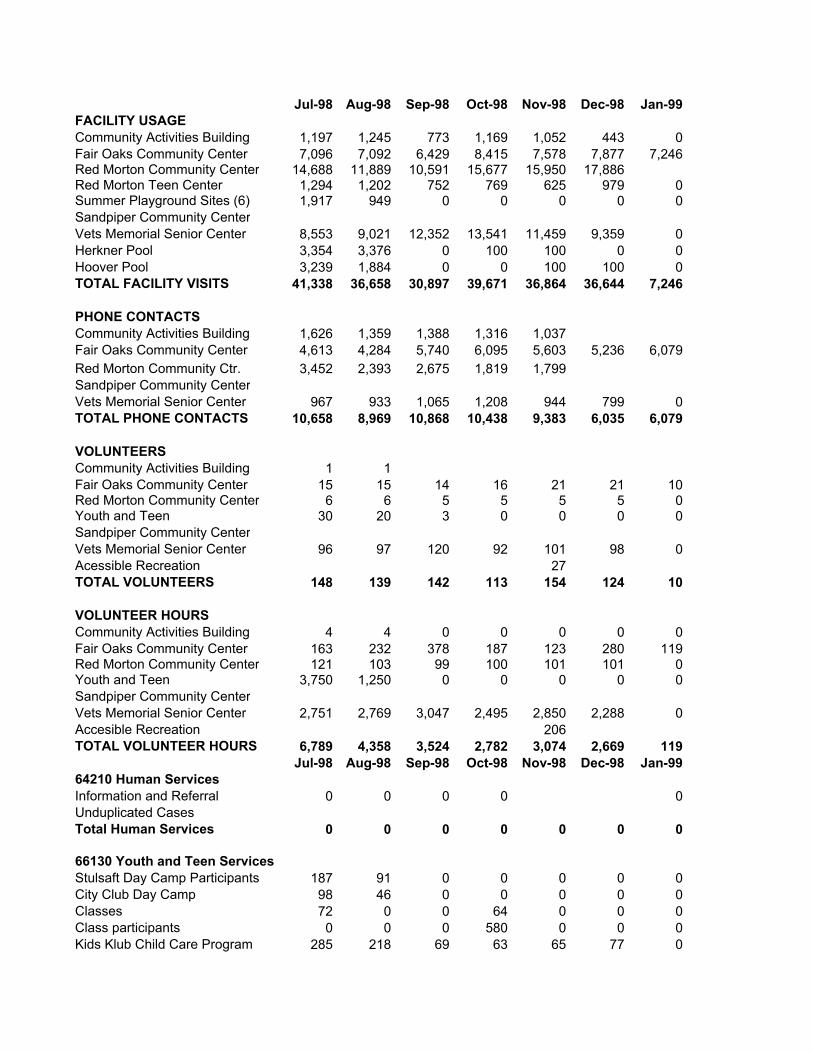
Jul-98 Aug-98 Sep-98 Oct-98 Nov-98 Dec-98 Jan-99FACILITY USAGECommunity Activities Building 1,197 1,245 773 1,169 1,052 443 0Fair Oaks Community Center 7,096 7,092 6,429 8,415 7,578 7,877 7,246Red Morton Community Center 14,688 11,889 10,591 15,677 15,950 17,886Red Morton Teen Center 1,294 1,202 752 769 625 979 0Summer Playground Sites (6) 1,917 949 0 0 0 0 0Sandpiper Community CenterVets Memorial Senior Center 8,553 9,021 12,352 13,541 11,459 9,359 0Herkner Pool 3,354 3,376 0 100 100 0 0Hoover Pool 3,239 1,884 0 0 100 100 0TOTAL FACILITY VISITS 41,338 36,658 30,897 39,671 36,864 36,644 7,246
PHONE CONTACTSCommunity Activities Building 1,626 1,359 1,388 1,316 1,037Fair Oaks Community Center 4,613 4,284 5,740 6,095 5,603 5,236 6,079Red Morton Community Ctr. 3,452 2,393 2,675 1,819 1,799Sandpiper Community CenterVets Memorial Senior Center 967 933 1,065 1,208 944 799 0TOTAL PHONE CONTACTS 10,658 8,969 10,868 10,438 9,383 6,035 6,079
VOLUNTEERSCommunity Activities Building 1 1Fair Oaks Community Center 15 15 14 16 21 21 10Red Morton Community Center 6 6 5 5 5 5 0Youth and Teen 30 20 3 0 0 0 0Sandpiper Community CenterVets Memorial Senior Center 96 97 120 92 101 98 0Acessible Recreation 27TOTAL VOLUNTEERS 148 139 142 113 154 124 10
VOLUNTEER HOURSCommunity Activities Building 4 4 0 0 0 0 0Fair Oaks Community Center 163 232 378 187 123 280 119Red Morton Community Center 121 103 99 100 101 101 0Youth and Teen 3,750 1,250 0 0 0 0 0Sandpiper Community CenterVets Memorial Senior Center 2,751 2,769 3,047 2,495 2,850 2,288 0Accesible Recreation 206TOTAL VOLUNTEER HOURS 6,789 4,358 3,524 2,782 3,074 2,669 119 Jul-98 Aug-98 Sep-98 Oct-98 Nov-98 Dec-98 Jan-9964210 Human ServicesInformation and Referral 0 0 0 0 0Unduplicated CasesTotal Human Services 0 0 0 0 0 0 0
66130 Youth and Teen ServicesStulsaft Day Camp Participants 187 91 0 0 0 0 0City Club Day Camp 98 46 0 0 0 0 0Classes 72 0 0 64 0 0 0Class participants 0 0 0 580 0 0 0Kids Klub Child Care Program 285 218 69 63 65 77 0
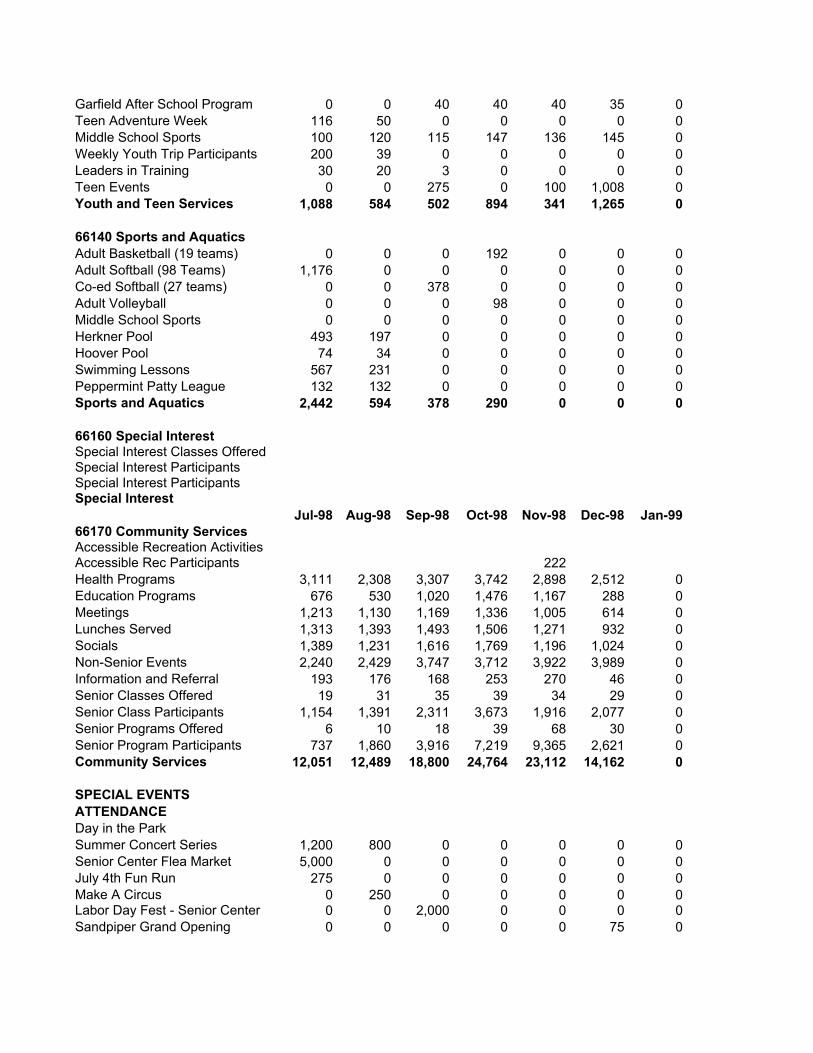
Garfield After School Program 0 0 40 40 40 35 0Teen Adventure Week 116 50 0 0 0 0 0Middle School Sports 100 120 115 147 136 145 0Weekly Youth Trip Participants 200 39 0 0 0 0 0Leaders in Training 30 20 3 0 0 0 0Teen Events 0 0 275 0 100 1,008 0Youth and Teen Services 1,088 584 502 894 341 1,265 0
66140 Sports and AquaticsAdult Basketball (19 teams) 0 0 0 192 0 0 0Adult Softball (98 Teams) 1,176 0 0 0 0 0 0Co-ed Softball (27 teams) 0 0 378 0 0 0 0Adult Volleyball 0 0 0 98 0 0 0Middle School Sports 0 0 0 0 0 0 0Herkner Pool 493 197 0 0 0 0 0Hoover Pool 74 34 0 0 0 0 0Swimming Lessons 567 231 0 0 0 0 0Peppermint Patty League 132 132 0 0 0 0 0Sports and Aquatics 2,442 594 378 290 0 0 0
66160 Special InterestSpecial Interest Classes OfferedSpecial Interest ParticipantsSpecial Interest ParticipantsSpecial Interest Jul-98 Aug-98 Sep-98 Oct-98 Nov-98 Dec-98 Jan-9966170 Community ServicesAccessible Recreation ActivitiesAccessible Rec Participants 222Health Programs 3,111 2,308 3,307 3,742 2,898 2,512 0Education Programs 676 530 1,020 1,476 1,167 288 0Meetings 1,213 1,130 1,169 1,336 1,005 614 0Lunches Served 1,313 1,393 1,493 1,506 1,271 932 0Socials 1,389 1,231 1,616 1,769 1,196 1,024 0Non-Senior Events 2,240 2,429 3,747 3,712 3,922 3,989 0Information and Referral 193 176 168 253 270 46 0Senior Classes Offered 19 31 35 39 34 29 0Senior Class Participants 1,154 1,391 2,311 3,673 1,916 2,077 0Senior Programs Offered 6 10 18 39 68 30 0Senior Program Participants 737 1,860 3,916 7,219 9,365 2,621 0Community Services 12,051 12,489 18,800 24,764 23,112 14,162 0
SPECIAL EVENTS ATTENDANCEDay in the ParkSummer Concert Series 1,200 800 0 0 0 0 0Senior Center Flea Market 5,000 0 0 0 0 0 0July 4th Fun Run 275 0 0 0 0 0 0Make A Circus 0 250 0 0 0 0 0Labor Day Fest - Senior Center 0 0 2,000 0 0 0 0Sandpiper Grand Opening 0 0 0 0 0 75 0
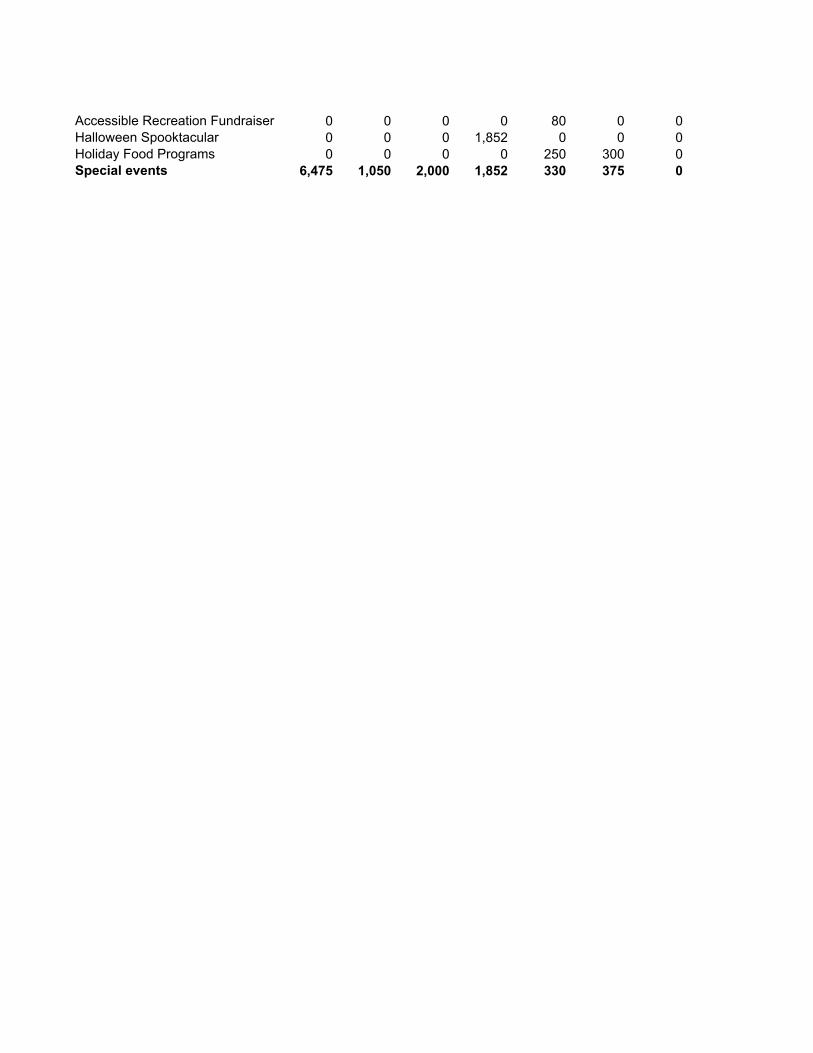
Accessible Recreation Fundraiser 0 0 0 0 80 0 0Halloween Spooktacular 0 0 0 1,852 0 0 0Holiday Food Programs 0 0 0 0 250 300 0Special events 6,475 1,050 2,000 1,852 330 375 0
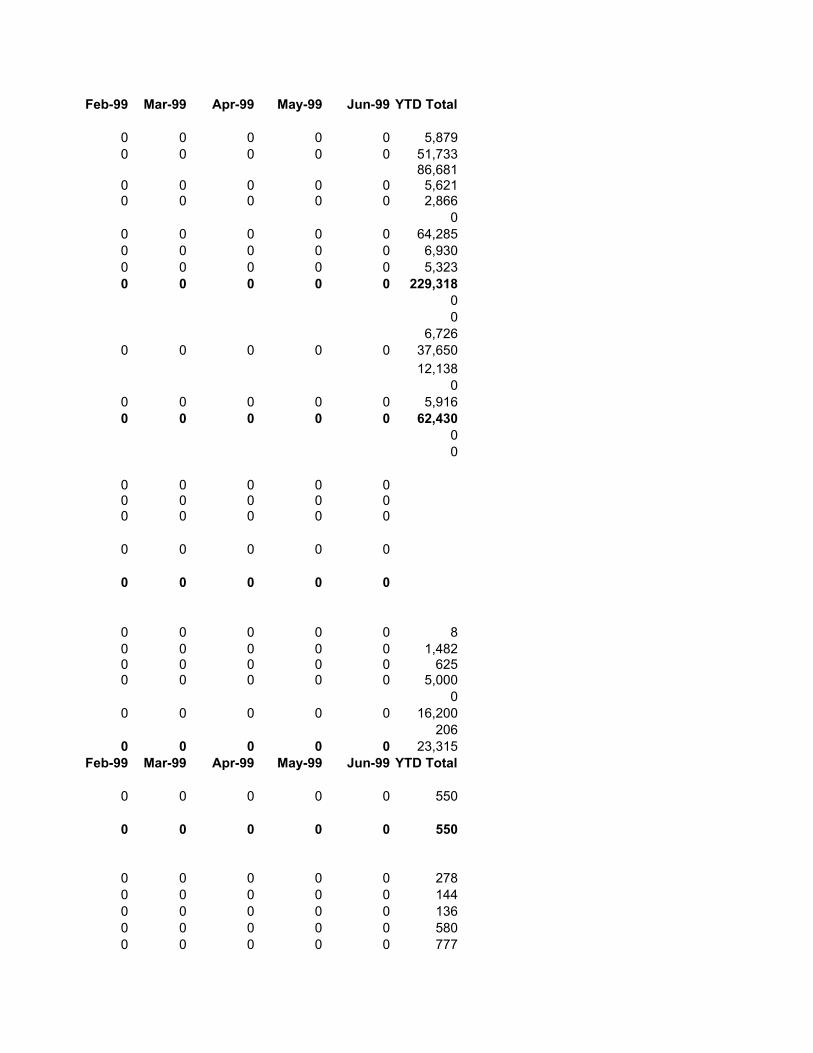
Feb-99 Mar-99 Apr-99 May-99 Jun-99 YTD Total
0 0 0 0 0 5,8790 0 0 0 0 51,733
86,6810 0 0 0 0 5,6210 0 0 0 0 2,866
00 0 0 0 0 64,2850 0 0 0 0 6,9300 0 0 0 0 5,3230 0 0 0 0 229,318
00
6,7260 0 0 0 0 37,650
12,1380
0 0 0 0 0 5,9160 0 0 0 0 62,430
00
0 0 0 0 00 0 0 0 00 0 0 0 0
0 0 0 0 0
0 0 0 0 0
0 0 0 0 0 80 0 0 0 0 1,4820 0 0 0 0 6250 0 0 0 0 5,000
00 0 0 0 0 16,200
2060 0 0 0 0 23,315
Feb-99 Mar-99 Apr-99 May-99 Jun-99 YTD Total
0 0 0 0 0 550
0 0 0 0 0 550
0 0 0 0 0 2780 0 0 0 0 1440 0 0 0 0 1360 0 0 0 0 5800 0 0 0 0 777
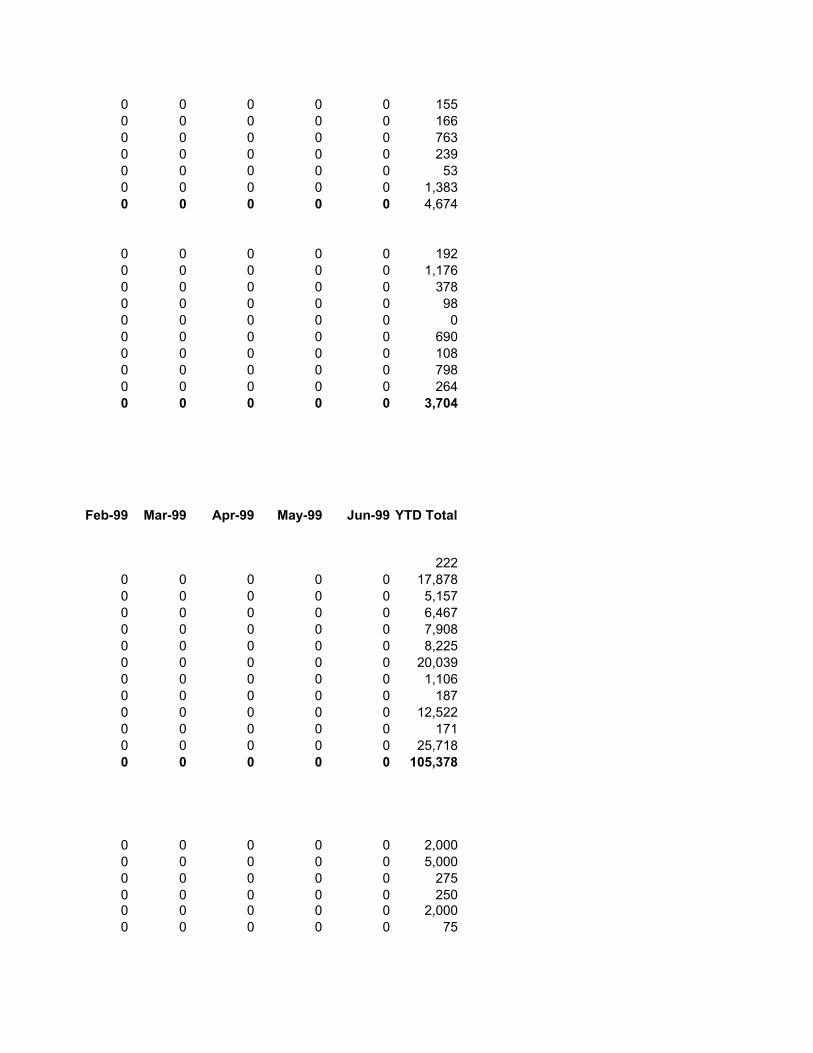
0 0 0 0 0 1550 0 0 0 0 1660 0 0 0 0 7630 0 0 0 0 2390 0 0 0 0 530 0 0 0 0 1,3830 0 0 0 0 4,674
0 0 0 0 0 1920 0 0 0 0 1,1760 0 0 0 0 3780 0 0 0 0 980 0 0 0 0 00 0 0 0 0 6900 0 0 0 0 1080 0 0 0 0 7980 0 0 0 0 2640 0 0 0 0 3,704
Feb-99 Mar-99 Apr-99 May-99 Jun-99 YTD Total
2220 0 0 0 0 17,8780 0 0 0 0 5,1570 0 0 0 0 6,4670 0 0 0 0 7,9080 0 0 0 0 8,2250 0 0 0 0 20,0390 0 0 0 0 1,1060 0 0 0 0 1870 0 0 0 0 12,5220 0 0 0 0 1710 0 0 0 0 25,7180 0 0 0 0 105,378
0 0 0 0 0 2,0000 0 0 0 0 5,0000 0 0 0 0 2750 0 0 0 0 2500 0 0 0 0 2,0000 0 0 0 0 75

0 0 0 0 0 800 0 0 0 0 1,8520 0 0 0 0 5500 0 0 0 0 12,082
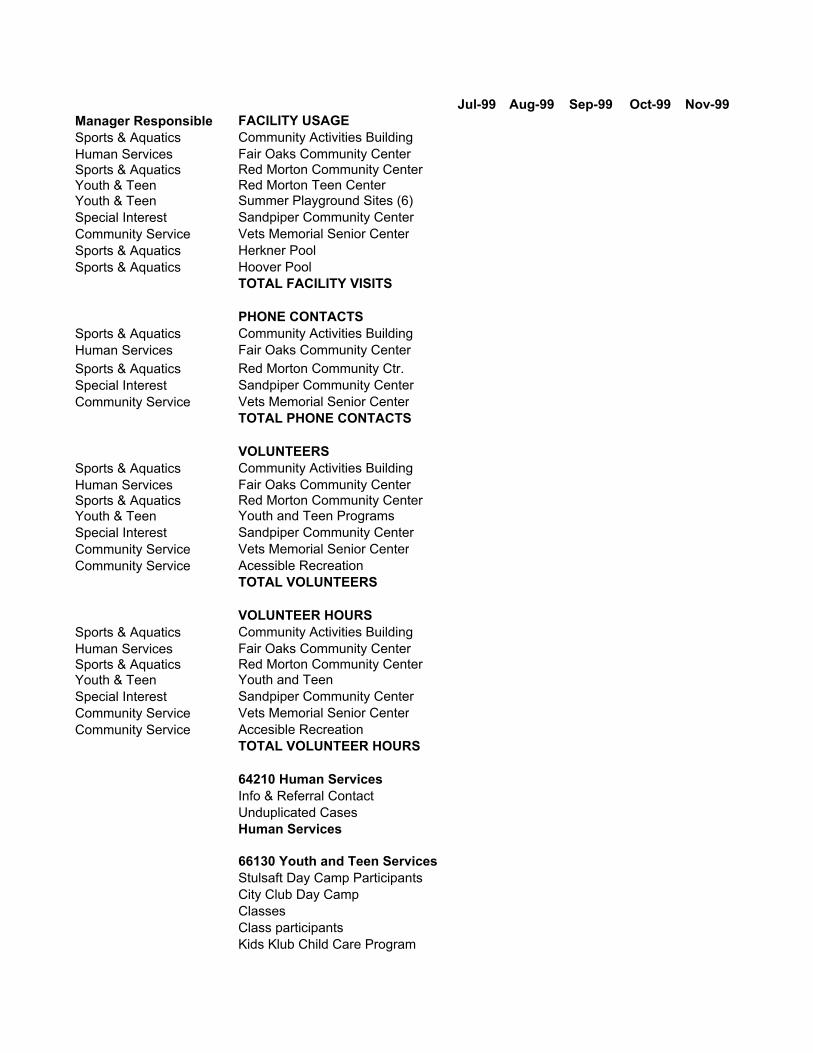
Jul-99 Aug-99 Sep-99 Oct-99 Nov-99Manager Responsible FACILITY USAGESports & Aquatics Community Activities BuildingHuman Services Fair Oaks Community CenterSports & Aquatics Red Morton Community CenterYouth & Teen Red Morton Teen CenterYouth & Teen Summer Playground Sites (6)Special Interest Sandpiper Community CenterCommunity Service Vets Memorial Senior CenterSports & Aquatics Herkner PoolSports & Aquatics Hoover Pool
TOTAL FACILITY VISITS
PHONE CONTACTSSports & Aquatics Community Activities BuildingHuman Services Fair Oaks Community CenterSports & Aquatics Red Morton Community Ctr.Special Interest Sandpiper Community CenterCommunity Service Vets Memorial Senior Center
TOTAL PHONE CONTACTS
VOLUNTEERSSports & Aquatics Community Activities BuildingHuman Services Fair Oaks Community CenterSports & Aquatics Red Morton Community CenterYouth & Teen Youth and Teen ProgramsSpecial Interest Sandpiper Community CenterCommunity Service Vets Memorial Senior CenterCommunity Service Acessible Recreation
TOTAL VOLUNTEERS
VOLUNTEER HOURSSports & Aquatics Community Activities BuildingHuman Services Fair Oaks Community CenterSports & Aquatics Red Morton Community CenterYouth & Teen Youth and TeenSpecial Interest Sandpiper Community CenterCommunity Service Vets Memorial Senior CenterCommunity Service Accesible Recreation
TOTAL VOLUNTEER HOURS 64210 Human ServicesInfo & Referral ContactUnduplicated CasesHuman Services
66130 Youth and Teen ServicesStulsaft Day Camp ParticipantsCity Club Day CampClassesClass participantsKids Klub Child Care Program
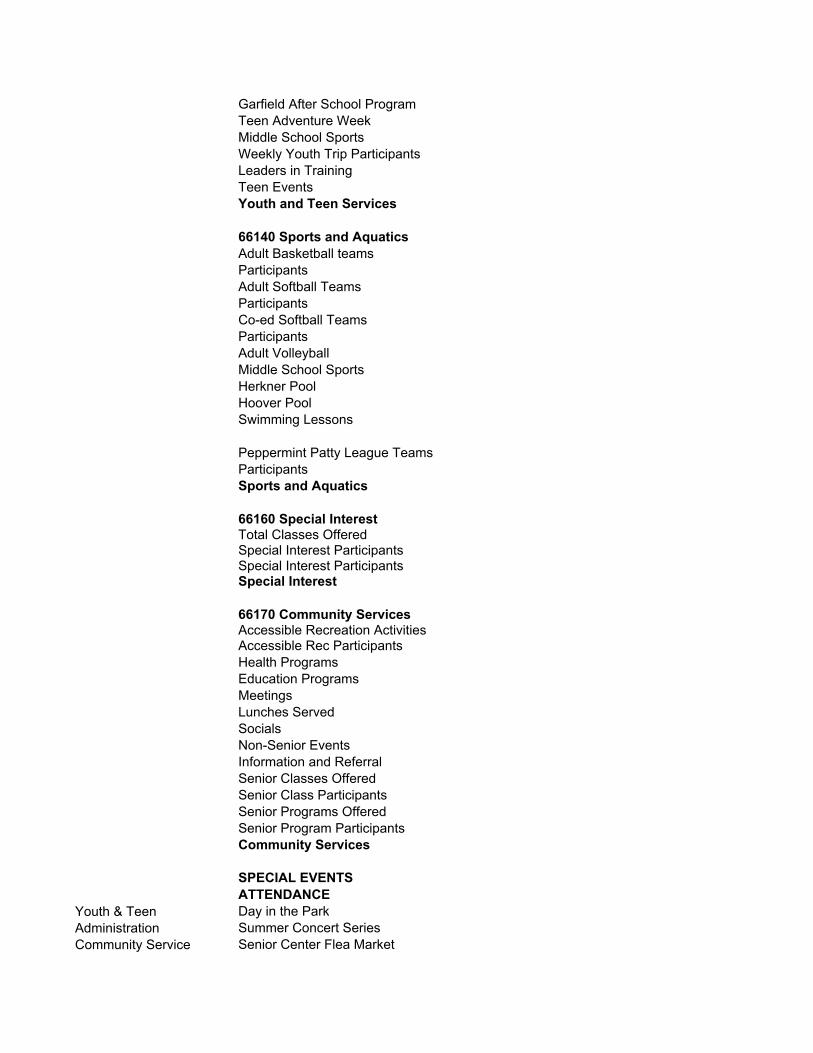
Garfield After School ProgramTeen Adventure Week Middle School SportsWeekly Youth Trip ParticipantsLeaders in TrainingTeen EventsYouth and Teen Services
66140 Sports and AquaticsAdult Basketball teamsParticipantsAdult Softball TeamsParticipantsCo-ed Softball TeamsParticipantsAdult VolleyballMiddle School SportsHerkner PoolHoover PoolSwimming Lessons
Peppermint Patty League TeamsParticipantsSports and Aquatics
66160 Special InterestTotal Classes OfferedSpecial Interest ParticipantsSpecial Interest ParticipantsSpecial Interest 66170 Community ServicesAccessible Recreation ActivitiesAccessible Rec ParticipantsHealth ProgramsEducation ProgramsMeetingsLunches ServedSocialsNon-Senior EventsInformation and ReferralSenior Classes OfferedSenior Class ParticipantsSenior Programs OfferedSenior Program ParticipantsCommunity Services
SPECIAL EVENTS ATTENDANCE
Youth & Teen Day in the ParkAdministration Summer Concert SeriesCommunity Service Senior Center Flea Market
Sports & Aquatics July 4th Fun RunYouth & Teen Make A CircusCommunity Service Labor Day Fest - Senior CenterSpecial Interest Sandpiper Grand Opening
Community Service Accessible Recreation FundraiserYouth & Teen Halloween SpooktacularHuman Service Holiday Food Programs
Special events

Dec-99 Jan-00 Feb-00 Mar-00 Apr-00 May-00 Jun-00 YTD Total
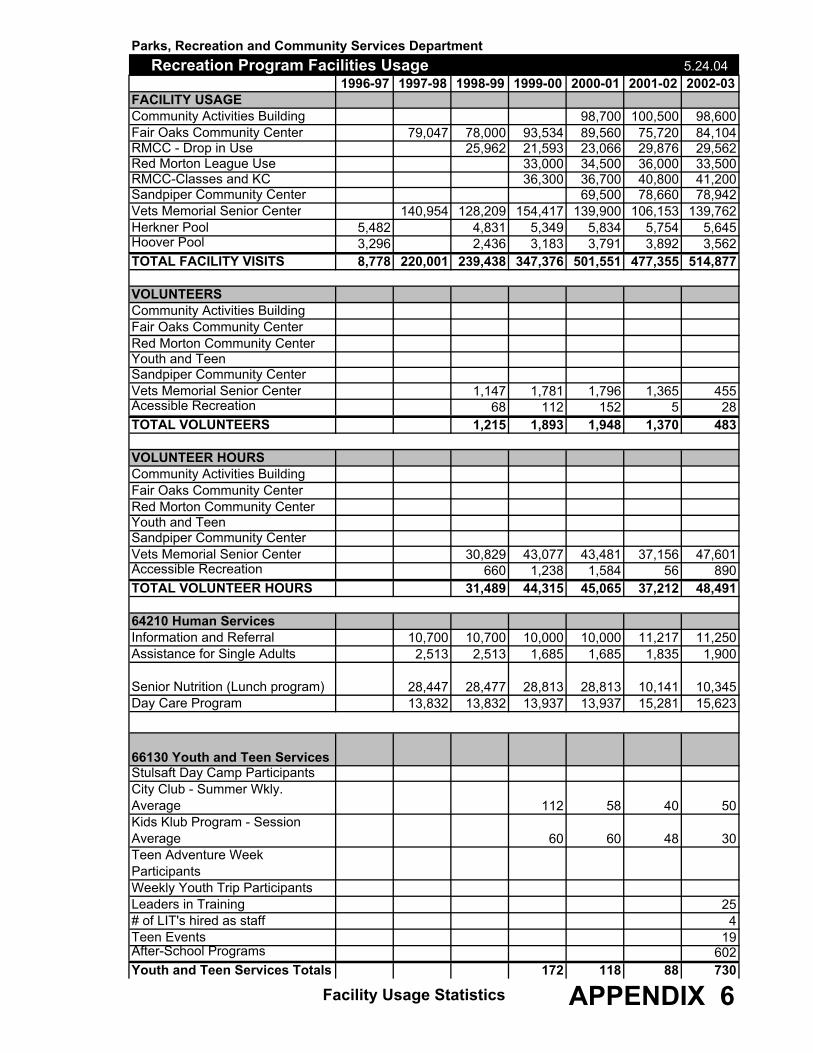
5.24.04 1996-97 1997-98 1998-99 1999-00 2000-01 2001-02 2002-03FACILITY USAGECommunity Activities Building 98,700 100,500 98,600Fair Oaks Community Center 79,047 78,000 93,534 89,560 75,720 84,104RMCC - Drop in Use 25,962 21,593 23,066 29,876 29,562Red Morton League Use 33,000 34,500 36,000 33,500RMCC-Classes and KC 36,300 36,700 40,800 41,200Sandpiper Community Center 69,500 78,660 78,942Vets Memorial Senior Center 140,954 128,209 154,417 139,900 106,153 139,762Herkner Pool 5,482 4,831 5,349 5,834 5,754 5,645Hoover Pool 3,296 2,436 3,183 3,791 3,892 3,562TOTAL FACILITY VISITS 8,778 220,001 239,438 347,376 501,551 477,355 514,877 VOLUNTEERSCommunity Activities BuildingFair Oaks Community CenterRed Morton Community CenterYouth and TeenSandpiper Community CenterVets Memorial Senior Center 1,147 1,781 1,796 1,365 455Acessible Recreation 68 112 152 5 28TOTAL VOLUNTEERS 1,215 1,893 1,948 1,370 483
VOLUNTEER HOURSCommunity Activities BuildingFair Oaks Community CenterRed Morton Community CenterYouth and TeenSandpiper Community CenterVets Memorial Senior Center 30,829 43,077 43,481 37,156 47,601Accessible Recreation 660 1,238 1,584 56 890TOTAL VOLUNTEER HOURS 31,489 44,315 45,065 37,212 48,491
64210 Human ServicesInformation and Referral 10,700 10,700 10,000 10,000 11,217 11,250Assistance for Single Adults 2,513 2,513 1,685 1,685 1,835 1,900
Senior Nutrition (Lunch program) 28,447 28,477 28,813 28,813 10,141 10,345Day Care Program 13,832 13,832 13,937 13,937 15,281 15,623
66130 Youth and Teen ServicesStulsaft Day Camp ParticipantsCity Club - Summer Wkly. Average 112 58 40 50Kids Klub Program - Session Average 60 60 48 30Teen Adventure Week ParticipantsWeekly Youth Trip ParticipantsLeaders in Training 25# of LIT's hired as staff 4Teen Events 19After-School Programs 602Youth and Teen Services Totals 172 118 88 730
Parks, Recreation and Community Services Department
APPENDIX 6Facility Usage Statistics
Recreation Program Facilities Usage
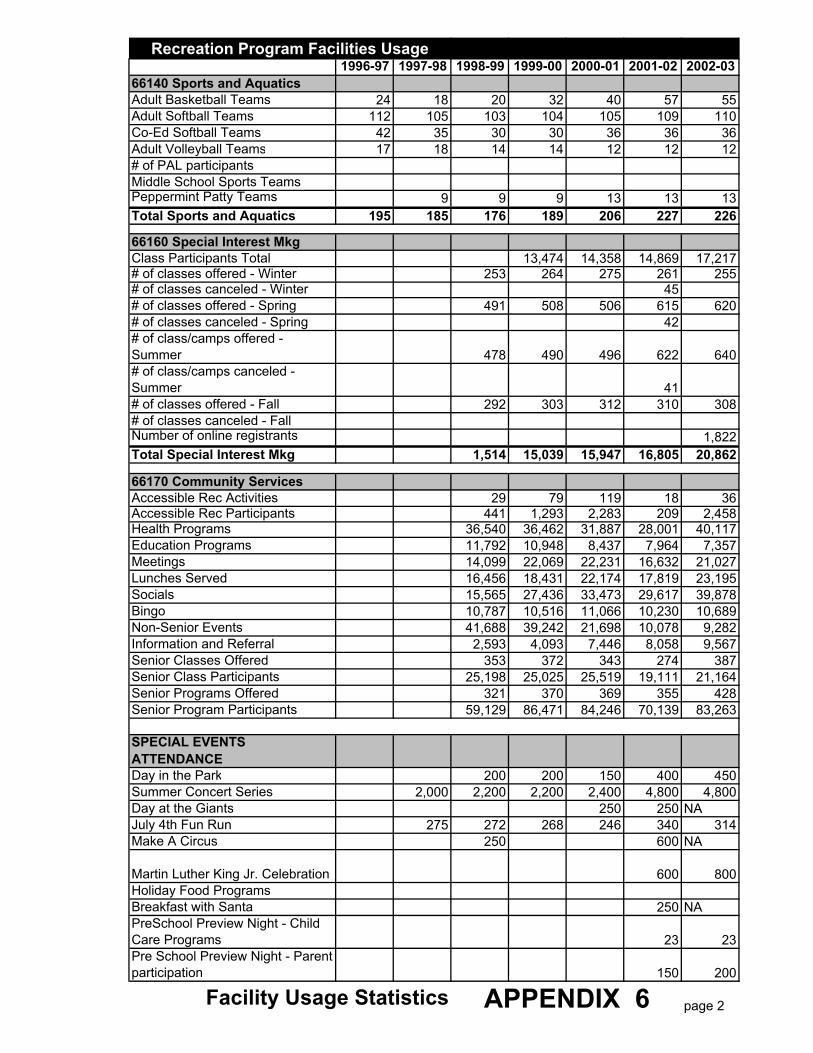
1996-97 1997-98 1998-99 1999-00 2000-01 2001-02 2002-0366140 Sports and AquaticsAdult Basketball Teams 24 18 20 32 40 57 55Adult Softball Teams 112 105 103 104 105 109 110Co-Ed Softball Teams 42 35 30 30 36 36 36Adult Volleyball Teams 17 18 14 14 12 12 12# of PAL participantsMiddle School Sports TeamsPeppermint Patty Teams 9 9 9 13 13 13Total Sports and Aquatics 195 185 176 189 206 227 226
66160 Special Interest MkgClass Participants Total 13,474 14,358 14,869 17,217# of classes offered - Winter 253 264 275 261 255# of classes canceled - Winter 45# of classes offered - Spring 491 508 506 615 620# of classes canceled - Spring 42# of class/camps offered - Summer 478 490 496 622 640# of class/camps canceled - Summer 41# of classes offered - Fall 292 303 312 310 308# of classes canceled - FallNumber of online registrants 1,822Total Special Interest Mkg 1,514 15,039 15,947 16,805 20,862
66170 Community ServicesAccessible Rec Activities 29 79 119 18 36Accessible Rec Participants 441 1,293 2,283 209 2,458Health Programs 36,540 36,462 31,887 28,001 40,117Education Programs 11,792 10,948 8,437 7,964 7,357Meetings 14,099 22,069 22,231 16,632 21,027Lunches Served 16,456 18,431 22,174 17,819 23,195Socials 15,565 27,436 33,473 29,617 39,878Bingo 10,787 10,516 11,066 10,230 10,689Non-Senior Events 41,688 39,242 21,698 10,078 9,282Information and Referral 2,593 4,093 7,446 8,058 9,567Senior Classes Offered 353 372 343 274 387Senior Class Participants 25,198 25,025 25,519 19,111 21,164Senior Programs Offered 321 370 369 355 428Senior Program Participants 59,129 86,471 84,246 70,139 83,263
SPECIAL EVENTS ATTENDANCEDay in the Park 200 200 150 400 450Summer Concert Series 2,000 2,200 2,200 2,400 4,800 4,800Day at the Giants 250 250 NAJuly 4th Fun Run 275 272 268 246 340 314Make A Circus 250 600 NA
Martin Luther King Jr. Celebration 600 800Holiday Food ProgramsBreakfast with Santa 250 NAPreSchool Preview Night - Child Care Programs 23 23Pre School Preview Night - Parent participation 150 200
page 2Facility Usage Statistics APPENDIX 6
Recreation Program Facilities Usage
RECYCLED WATER TASK FORCE REPORT
City of Redwood City
March 3, 2004
APPENDIX 7
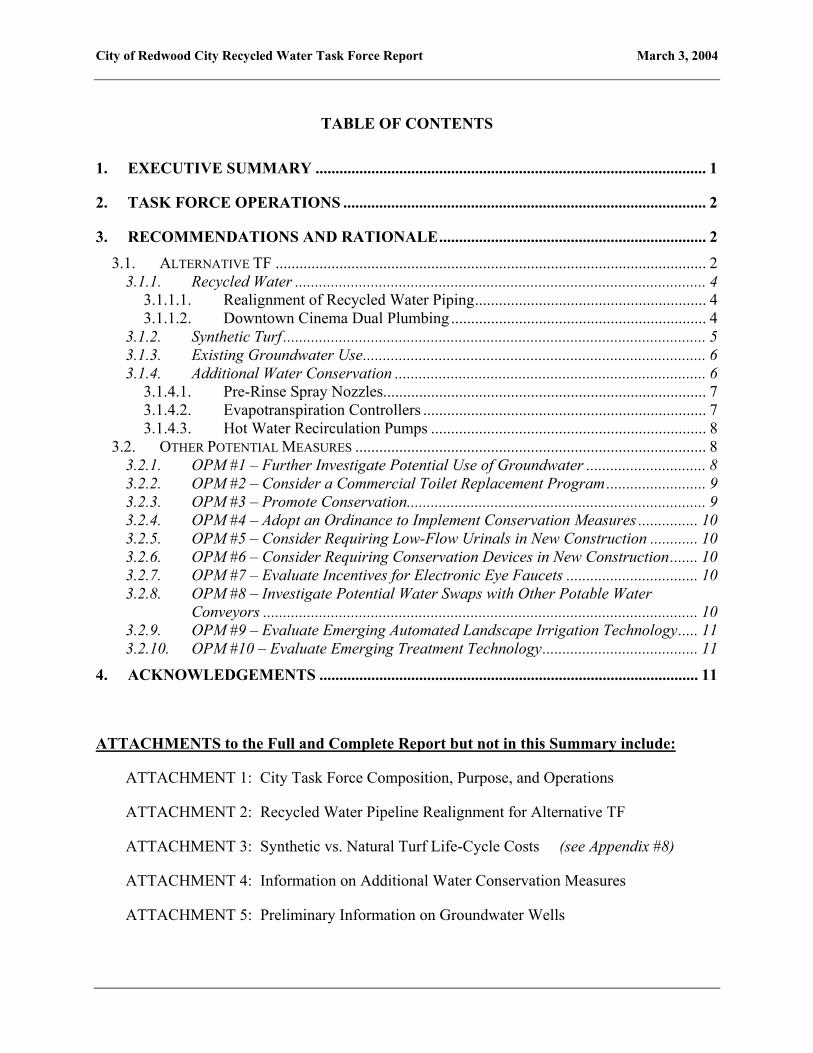
City of Redwood City Recycled Water Task Force Report March 3, 2004
TABLE OF CONTENTS
1. EXECUTIVE SUMMARY .................................................................................................. 1
2. TASK FORCE OPERATIONS ........................................................................................... 2
3. RECOMMENDATIONS AND RATIONALE................................................................... 2 3.1. ALTERNATIVE TF ............................................................................................................ 2
3.1.1. Recycled Water ....................................................................................................... 4 3.1.1.1. Realignment of Recycled Water Piping.......................................................... 4 3.1.1.2. Downtown Cinema Dual Plumbing ................................................................ 4
3.1.2. Synthetic Turf .......................................................................................................... 5 3.1.3. Existing Groundwater Use...................................................................................... 6 3.1.4. Additional Water Conservation .............................................................................. 6
3.1.4.1. Pre-Rinse Spray Nozzles................................................................................. 7 3.1.4.2. Evapotranspiration Controllers ....................................................................... 7 3.1.4.3. Hot Water Recirculation Pumps ..................................................................... 8
3.2. OTHER POTENTIAL MEASURES ........................................................................................ 8 3.2.1. OPM #1 – Further Investigate Potential Use of Groundwater .............................. 8 3.2.2. OPM #2 – Consider a Commercial Toilet Replacement Program......................... 9 3.2.3. OPM #3 – Promote Conservation........................................................................... 9 3.2.4. OPM #4 – Adopt an Ordinance to Implement Conservation Measures ............... 10 3.2.5. OPM #5 – Consider Requiring Low-Flow Urinals in New Construction ............ 10 3.2.6. OPM #6 – Consider Requiring Conservation Devices in New Construction....... 10 3.2.7. OPM #7 – Evaluate Incentives for Electronic Eye Faucets ................................. 10 3.2.8. OPM #8 – Investigate Potential Water Swaps with Other Potable Water
Conveyors ............................................................................................................. 10 3.2.9. OPM #9 – Evaluate Emerging Automated Landscape Irrigation Technology..... 11 3.2.10. OPM #10 – Evaluate Emerging Treatment Technology....................................... 11
4. ACKNOWLEDGEMENTS ............................................................................................... 11
ATTACHMENTS to the Full and Complete Report but not in this Summary include:
ATTACHMENT 1: City Task Force Composition, Purpose, and Operations
ATTACHMENT 2: Recycled Water Pipeline Realignment for Alternative TF
ATTACHMENT 3: Synthetic vs. Natural Turf Life-Cycle Costs (see Appendix #8)
ATTACHMENT 4: Information on Additional Water Conservation Measures
ATTACHMENT 5: Preliminary Information on Groundwater Wells
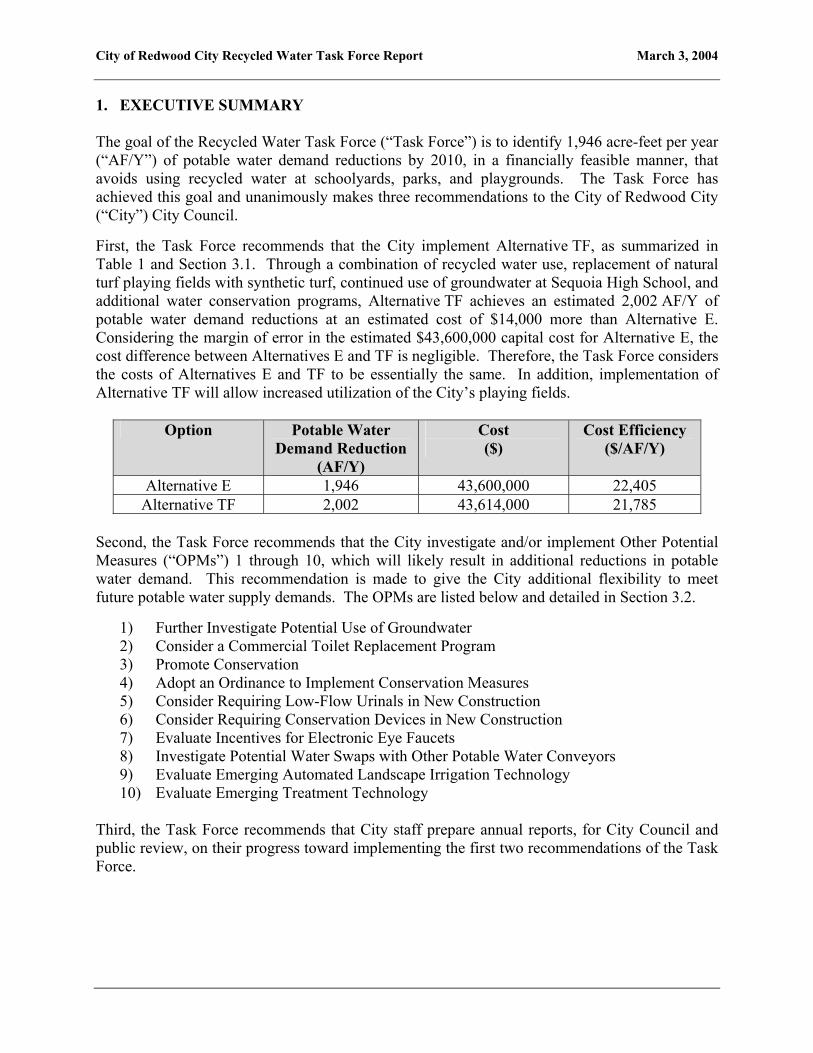
City of Redwood City Recycled Water Task Force Report March 3, 2004
1. EXECUTIVE SUMMARY The goal of the Recycled Water Task Force (“Task Force”) is to identify 1,946 acre-feet per year (“AF/Y”) of potable water demand reductions by 2010, in a financially feasible manner, that avoids using recycled water at schoolyards, parks, and playgrounds. The Task Force has achieved this goal and unanimously makes three recommendations to the City of Redwood City (“City”) City Council. First, the Task Force recommends that the City implement Alternative TF, as summarized in Table 1 and Section 3.1. Through a combination of recycled water use, replacement of natural turf playing fields with synthetic turf, continued use of groundwater at Sequoia High School, and additional water conservation programs, Alternative TF achieves an estimated 2,002 AF/Y of potable water demand reductions at an estimated cost of $14,000 more than Alternative E. Considering the margin of error in the estimated $43,600,000 capital cost for Alternative E, the cost difference between Alternatives E and TF is negligible. Therefore, the Task Force considers the costs of Alternatives E and TF to be essentially the same. In addition, implementation of Alternative TF will allow increased utilization of the City’s playing fields.
Option Potable Water Demand Reduction
(AF/Y)
Cost ($)
Cost Efficiency ($/AF/Y)
Alternative E 1,946 43,600,000 22,405 Alternative TF 2,002 43,614,000 21,785
Second, the Task Force recommends that the City investigate and/or implement Other Potential Measures (“OPMs”) 1 through 10, which will likely result in additional reductions in potable water demand. This recommendation is made to give the City additional flexibility to meet future potable water supply demands. The OPMs are listed below and detailed in Section 3.2.
1) Further Investigate Potential Use of Groundwater 2) Consider a Commercial Toilet Replacement Program 3) Promote Conservation 4) Adopt an Ordinance to Implement Conservation Measures 5) Consider Requiring Low-Flow Urinals in New Construction 6) Consider Requiring Conservation Devices in New Construction 7) Evaluate Incentives for Electronic Eye Faucets 8) Investigate Potential Water Swaps with Other Potable Water Conveyors 9) Evaluate Emerging Automated Landscape Irrigation Technology 10) Evaluate Emerging Treatment Technology
Third, the Task Force recommends that City staff prepare annual reports, for City Council and public review, on their progress toward implementing the first two recommendations of the Task Force.
City of Redwood City Recycled Water Task Force Report March 3, 2004
2. TASK FORCE OPERATIONS Details about the Task Force, including members, quorum and decision-making requirements, and other operational details are provided in Attachment 1. 3. RECOMMENDATIONS AND RATIONALE The goal of the Task Force is to identify 1,946 AF/Y of potable water demand reductions (i.e., the amount provided by Alternative E, as presented in the Refined Project Feasibility Analysis – Alternative E, dated February 21, 2003) by 2010, in a financially feasible manner, that avoids using recycled water at schoolyards, parks, and playgrounds. The Task Force has achieved this goal and unanimously makes three recommendations to the City Council. First, the Task Force recommends that the City implement Alternative TF, which consists of measures that provide quantifiable reductions in potable water demand that achieve the Task Force goal (see Section 3.1). Second, the Task Force recommends that the City investigate and/or implement OPMs 1 through 10 (see Section 3.2), which will likely result in additional reductions in potable water demand. This recommendation is made to give the City additional flexibility to meet future potable water supply demands. Third, the Task Force recommends that City staff prepare annual reports, for City Council and public review, on their progress toward implementing the first two recommendations of the Task Force. 3.1. Alternative TF By implementing Alternative TF, it is estimated that the City can achieve 2,002 AF/Y of potable water demand reductions, which is approximately 56 AF/Y more than the potable water demand reductions estimated for Alternative E. Given the inherent uncertainty in estimating projected water needs and projected reductions in potable water demand, such as those presented in the City’s Urban Water Management Plan (dated June 2, 2003), the Refined Project Feasibility Analysis – Alternative E, and this Task Force Report, the Task Force believes it is prudent to have this “extra” potable water demand reduction. Costs to implement Alternative TF are estimated to be $14,000 more than those for Alternative E. Considering the margin of error in the estimated $43,600,000 capital cost for Alternative E, the cost difference between Alternatives E and TF is negligible. Therefore, the Task Force considers the costs of Alternatives E and TF to be essentially the same. As further discussed in Section 3.1.2, portions of Alternative TF provide other benefits to the City in addition to reductions in potable water demand. Estimates of potable water demand reductions and estimated costs presented herein were developed with the assistance of City staff and the City’s consultants, including Kennedy/Jenks Consultants and Dr. John Whitcomb.
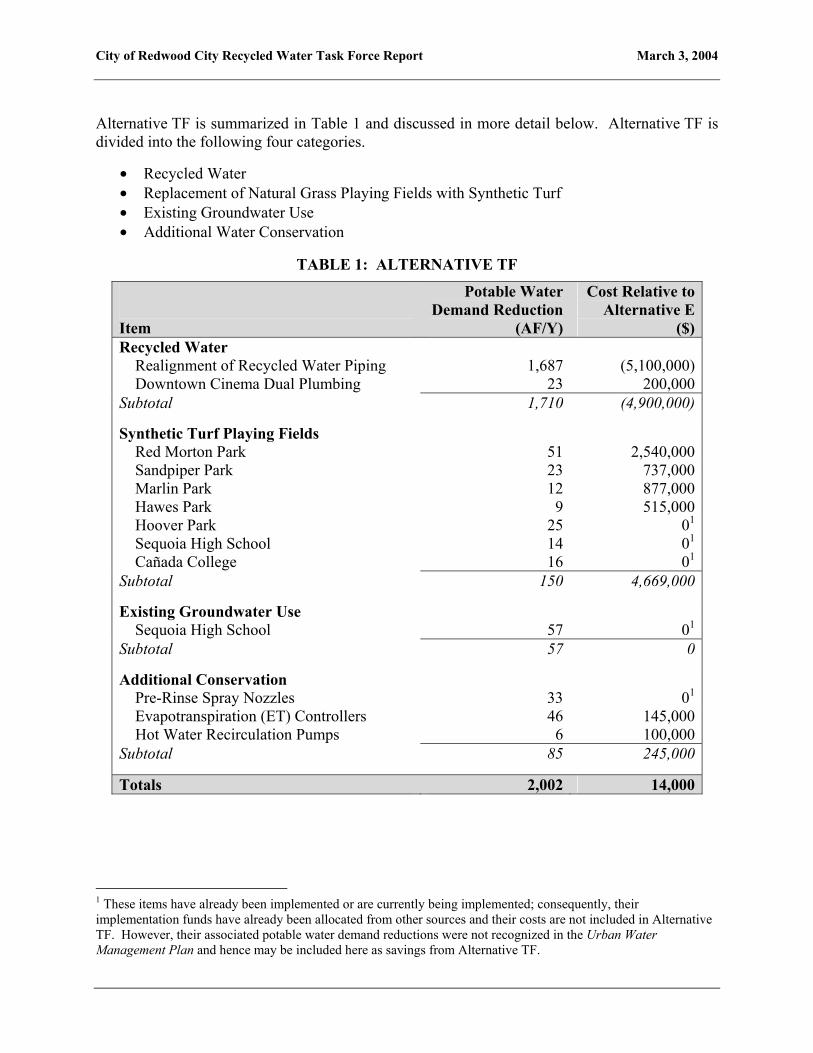
City of Redwood City Recycled Water Task Force Report March 3, 2004
Alternative TF is summarized in Table 1 and discussed in more detail below. Alternative TF is divided into the following four categories.
• Recycled Water • Replacement of Natural Grass Playing Fields with Synthetic Turf • Existing Groundwater Use • Additional Water Conservation
TABLE 1: ALTERNATIVE TF
Item
Potable Water Demand Reduction
(AF/Y)
Cost Relative to Alternative E
($)Recycled Water Realignment of Recycled Water Piping 1,687 (5,100,000) Downtown Cinema Dual Plumbing 23 200,000Subtotal 1,710 (4,900,000) Synthetic Turf Playing Fields Red Morton Park 51 2,540,000 Sandpiper Park 23 737,000 Marlin Park 12 877,000 Hawes Park 9 515,000 Hoover Park 25 01
Sequoia High School 14 01
Cañada College 16 01
Subtotal 150 4,669,000 Existing Groundwater Use Sequoia High School 57 01
Subtotal 57 0
Additional Conservation Pre-Rinse Spray Nozzles 33 01
Evapotranspiration (ET) Controllers 46 145,000 Hot Water Recirculation Pumps 6 100,000Subtotal 85 245,000
Totals 2,002 14,000
1 These items have already been implemented or are currently being implemented; consequently, their implementation funds have already been allocated from other sources and their costs are not included in Alternative TF. However, their associated potable water demand reductions were not recognized in the Urban Water Management Plan and hence may be included here as savings from Alternative TF.
City of Redwood City Recycled Water Task Force Report March 3, 2004
3.1.1. Recycled Water The recycled water category consists of (a) realignment of the recycled water piping proposed under Alternative E and (b) adding dual plumbing to the new Downtown Cinema and providing recycled water to the Downtown Cinema for appropriate indoor and outdoor use. 3.1.1.1. Realignment of Recycled Water Piping Under Alternative TF, the recycled water piping proposed under Alternative E is realigned (a) to remove piping serving schoolyards, parks, and playgrounds and (b) to add piping to serve City Hall, City-owned planters on Broadway, and Kaiser. Information provided by Kennedy/Jenks Consultants regarding the realigned recycled water piping is presented in Attachment 2. Removing schoolyards, parks, and playgrounds from Alternative E results in a loss of approximately 289 AF/Y from the 1,946 AF/Y of recycled water to be delivered under Alternative E. Adding City Hall, City-owned planters, and Kaiser adds approximately 30 AF/Y. Thus, the realigned piping for Alternative TF delivers 1,687 AF/Y of recycled water, which results in an equivalent amount of potable water demand reduction. Removal of the piping serving schoolyards, parks, and playgrounds provides significant cost savings over Alternative E; while the cost of adding pipe to serve City Hall, City-owned planters, and Kaiser is relatively moderate. The new alignment reduces the length of pipe (mostly 24 inches in diameter) in the Central Redwood City area by about 1.25 miles, as compared to Alternative E. The revised alignment also eliminates the need for three jack-and-bore crossings, which further reduces the cost of the pipeline relative to Alternative E. Consequently, the realigned recycled water piping for Alternative TF costs approximately $5,100,000 less than Alternative E. 3.1.1.2. Downtown Cinema Dual Plumbing Under Alternative TF, the Task Force proposes that dual plumbing be installed during construction of the new Downtown Cinema so that recycled water can be used for appropriate indoor and outdoor use at this location. Examples of appropriate use include irrigation and toilet flushing. Based on projections of water use at the Downtown Cinema, it is estimated that 23 AF/Y of recycled water could be used at this location, with a commensurate reduction in potable water demand. City staff has approached the developer of the Downtown Cinema about the possibility of installing dual plumbing at this location. The developer estimates that dual plumbing will cost an additional $100,000 in design and construction costs at this late design stage. The developer would expect to be compensated for these costs if the City were to request the dual plumbing. An estimated additional $100,000 would be required to install recycled water pipe to serve the Downtown Cinema. Thus, the estimated cost of this option is $200,000. The Task Force recognizes that implementing dual plumbing at this stage of the Downtown Cinema project presents challenges to the developer and the City. Nevertheless, the Task Force believes that the potable water demand reduction and the relative cost-effectiveness of this

City of Redwood City Recycled Water Task Force Report March 3, 2004
option justifies the effort required for its implementation. Because construction of the Downtown Cinema has started, the Task Force recommends that the City proceed with dual plumbing at the Downtown Cinema with all deliberate speed. If the City is unable by law to directly compensate the developer for the dual plumbing change, then the Task Force urges the City to develop some other indirect mechanism to compensate the developer for its increased costs. 3.1.2. Synthetic Turf The synthetic turf category consists of replacing natural grass playing fields with synthetic turf at the following locations:
• Red Morton Park • Sandpiper Park • Marlin Park • Hawes Park • Hoover Park • Sequoia High School • Cañada College
Playing fields at Hoover Park and Sequoia High School have already been converted to synthetic turf, and Cañada College is in the process of converting its playing fields to synthetic turf. Consequently, the costs for installing synthetic turf at these playing fields are not considered to be part of the cost of Alternative TF. However, because the City’s water use forecasts assumed these fields would continue to be natural turf, the Task Force includes the resulting reductions in potable water demand in Alternative TF. Estimates of potential demand for recycled water, including irrigation water demands, are provided in the Recycled Water Market Assessment Summary (“Market Assessment”), which is Appendix A of the Water Recycling Feasibility Study for Redwood City, dated August 7, 2002. The Market Assessment was used to estimate irrigation water demands at the schoolyards, parks, and playgrounds listed above. Based on the estimated irrigation water demands and the ratios of playing field areas to the total irrigated areas, the potable water demand reduction from replacing natural grass playing fields at all seven of the above locations with synthetic turf is estimated to be 150 AF/Y. Based on costs for installing synthetic turf at Hoover Park and at another site in Fair Oaks, the capital costs for installing synthetic turf on playing fields at Red Morton Park, Sandpiper Park, Marlin Park, and Hawes Park are estimated to be $4,669,000. An added benefit of synthetic turf playing fields is higher utilization of the City’s playing fields, which is highly desirable given the high demand for playing fields in the City. Synthetic turf can withstand more intense use and can be played on after a rain without damaging the field, unlike natural turf. In addition, natural turf fields must be periodically taken out of service for reseeding. The City Parks and Recreation Department estimates that synthetic turf fields are available for soccer use 14 hours per day (assuming the field is lighted), 360 days per year, while natural turf fields are available for soccer use an average of 5 hours per day, 275 days per year.
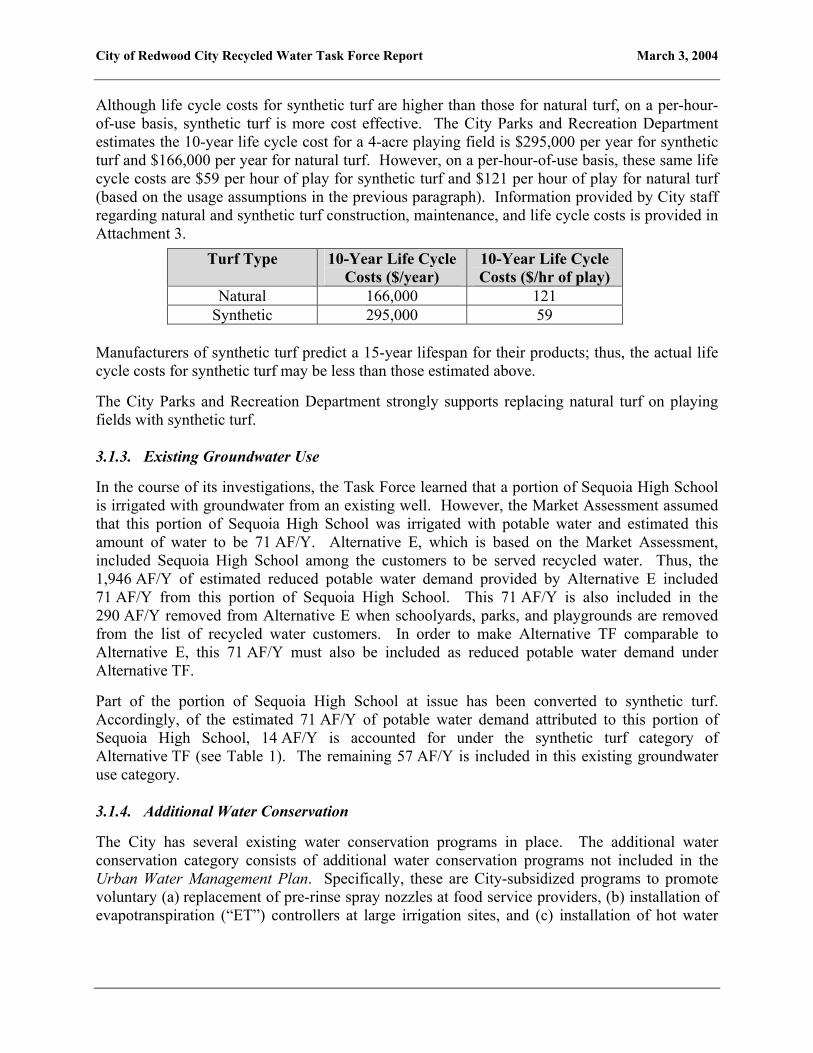
City of Redwood City Recycled Water Task Force Report March 3, 2004
Although life cycle costs for synthetic turf are higher than those for natural turf, on a per-hour-of-use basis, synthetic turf is more cost effective. The City Parks and Recreation Department estimates the 10-year life cycle cost for a 4-acre playing field is $295,000 per year for synthetic turf and $166,000 per year for natural turf. However, on a per-hour-of-use basis, these same life cycle costs are $59 per hour of play for synthetic turf and $121 per hour of play for natural turf (based on the usage assumptions in the previous paragraph). Information provided by City staff regarding natural and synthetic turf construction, maintenance, and life cycle costs is provided in Attachment 3.
Turf Type 10-Year Life Cycle Costs ($/year)
10-Year Life Cycle Costs ($/hr of play)
Natural 166,000 121 Synthetic 295,000 59
Manufacturers of synthetic turf predict a 15-year lifespan for their products; thus, the actual life cycle costs for synthetic turf may be less than those estimated above. The City Parks and Recreation Department strongly supports replacing natural turf on playing fields with synthetic turf. 3.1.3. Existing Groundwater Use In the course of its investigations, the Task Force learned that a portion of Sequoia High School is irrigated with groundwater from an existing well. However, the Market Assessment assumed that this portion of Sequoia High School was irrigated with potable water and estimated this amount of water to be 71 AF/Y. Alternative E, which is based on the Market Assessment, included Sequoia High School among the customers to be served recycled water. Thus, the 1,946 AF/Y of estimated reduced potable water demand provided by Alternative E included 71 AF/Y from this portion of Sequoia High School. This 71 AF/Y is also included in the 290 AF/Y removed from Alternative E when schoolyards, parks, and playgrounds are removed from the list of recycled water customers. In order to make Alternative TF comparable to Alternative E, this 71 AF/Y must also be included as reduced potable water demand under Alternative TF. Part of the portion of Sequoia High School at issue has been converted to synthetic turf. Accordingly, of the estimated 71 AF/Y of potable water demand attributed to this portion of Sequoia High School, 14 AF/Y is accounted for under the synthetic turf category of Alternative TF (see Table 1). The remaining 57 AF/Y is included in this existing groundwater use category. 3.1.4. Additional Water Conservation The City has several existing water conservation programs in place. The additional water conservation category consists of additional water conservation programs not included in the Urban Water Management Plan. Specifically, these are City-subsidized programs to promote voluntary (a) replacement of pre-rinse spray nozzles at food service providers, (b) installation of evapotranspiration (“ET”) controllers at large irrigation sites, and (c) installation of hot water

City of Redwood City Recycled Water Task Force Report March 3, 2004
recirculation pumps in homes. Information regarding these items provided by Dr. John Whitcomb and City staff is included in Attachment 4. Note that once the programs discussed below have achieved their targets, follow-up programs will likely be required to maintain the potable water demand reductions achieved. For example, when a water-saving device reaches the end of its useful life, it would need to be replaced with another water-saving device to maintain the reduction in potable water demand. In addition, the City may want to expand any hugely successful conservation programs to achieve even greater reductions in potable water demand than what is provided by the Alternative TF programs. 3.1.4.1. Pre-Rinse Spray Nozzles Prior to washing, restaurants, cafeterias, and other food service providers typically remove the majority of the food remaining on plates and trays using a pre-rinse water spray. According to Dr. Whitcomb, water-efficient versions of pre-rinse spray nozzles have recently become available. Alternative TF includes a program to replace existing pre-rinse spray nozzles with water-efficient versions. As part of this program, the City would provide and install water-efficient pre-rinse spray nozzles free of charge. The City would also market this service to all restaurants, cafeterias, and other food service providers within the City’s water service area. Based on Dr. Whitcomb’s assessment of potable water demand reduction per restaurant and an expected market penetration rate of 50 percent, this program is expected to reduce potable water demand by approximately 33 AF/Y. Dr. Whitcomb estimates the cost to the City of this program to be $7,000, based on cost-sharing provided by the California Public Utilities Commission, which is sponsoring this program. Although this program is not included as a Best Management Practice (“BMP”) in the Urban Water Management Plan, the City has recently begun implementing it. Since the City has already begun implementing this program with existing funds, the cost of this program is not included in the cost of Alternative TF. However, since it is not included in the Urban Water Management Plan, the resulting water savings are included in Alternative TF. 3.1.4.2. Evapotranspiration Controllers The ET controllers program builds on the existing BMP 5 program in the Urban Water Management Plan. After installation, the ET controllers automatically adjust irrigation schedules based on environmental monitoring data (e.g., rainfall, temperature over the course of the day) transmitted from a local weather station. Since City parks already have similar technology, the ET controller program is targeted at other water users with irrigation-only accounts. As part of the ET controller program, the City would pay the product and installation cost. The water customers would be expected to pay the on-going service fee. The City would market this program to irrigation-only water users served by the City. The program would be offered to potable and recycled water users because ET controllers will help limit run-off of recycled water due to over-watering.

City of Redwood City Recycled Water Task Force Report March 3, 2004
The potable water demand reduction from this program is estimated to be 46 AF/Y. The estimated cost of this program is $145,000. 3.1.4.3. Hot Water Recirculation Pumps A hot water recirculation pump provides nearly instantaneous hot water at showers and faucets, eliminating the waste and inconvenience of waiting for hot water. Pump models typically installed in existing buildings utilize the cold water pipe as the return to the water heater and are installed (a) under the vanity farthest from the water heater or (b) at the water heater, with a temperature-sensitive valve installed under the farthest vanity. The Task Force believes that this program may gain wider acceptance than other conservation programs because it provides a comfort to the customer in addition to saving water. This program complements City programs that encourage installation of low-flow showerheads, which increase wait times for hot water. As part of the hot water recirculation pump program, the City would promote the use of these pumps and offer $100 rebates (pumps cost from $125 to $500 each) to 1,000 water customers that install a pump, for an estimated program cost of $100,000. Based on a reasonably conservative water savings estimate of 5 gallons per household per day, this program is estimated to reduce potable water demand by 6 AF/Y. The pump manufacturers estimate savings of 25 to 44 gallons per household per day, with considerable variation depending on home layout and usage patterns. 3.2. Other Potential Measures Recognizing that future potable water supply and demand may be different than estimated, the Task Force recommends that the City investigate and/or implement OPMs 1 through 10, which are identified as potentially effective ways to further reduce potable water demand. While promising, most of these additional measures either (a) generate savings that are difficult to quantify, (b) require additional research to confirm their viability, or (c) depend upon improvements in existing technology. These OPMs are intended to give the City additional flexibility to meet future potable water supply demands. The OPMs are listed below.
1) Further Investigate Potential Use of Groundwater 2) Consider a Commercial Toilet Replacement Program 3) Promote Conservation 4) Adopt an Ordinance to Implement Conservation Measures 5) Consider Requiring Low-Flow Urinals in New Construction 6) Consider Requiring Conservation Devices in New Construction 7) Evaluate Incentives for Electronic Eye Faucets 8) Investigate Potential Water Swaps with Other Potable Water Conveyors 9) Evaluate Emerging Automated Landscape Irrigation Technology 10) Evaluate Emerging Treatment Technology
3.2.1. OPM #1 – Further Investigate Potential Use of Groundwater Based on the study Feasibility of Supplemental Groundwater Resources Development, Redwood City, California, prepared by Todd Engineers and dated March 2003, use of groundwater appears

City of Redwood City Recycled Water Task Force Report March 3, 2004
to be feasible and cost-effective. However, the City needs to drill one or more test wells in order to verify costs and the amount and quality of water provided. Drilling the test wells and analyzing data would take several months and cost approximately $100,000 per well. Thus, it was not possible to produce a quantifiable proposal for groundwater use by the Task Force deadline. The Todd Engineers study indicated a network of wells could recover between 500 and 1,000 AF/Y of potable water and would cost between $1,000,000 and $2,000,000 per production well, including other required equipment, engineering, and permitting. Data developed by City staff for the Task Force indicated that one production well for irrigation at Red Morton Park would cost approximately $250,000, including other required equipment, engineering, and permitting (see Attachment 5). Not including the playing fields (which will have synthetic turf under Alternative TF), Red Morton Park has an irrigation water demand of approximately 47 AF/Y. The Task Force strongly recommends that the City, at the earliest opportunity, begin exploratory well work, to determine feasibility and costs for using groundwater to irrigate large sites (e.g., Red Morton Park) and possibly as a supplementary source of potable water. The Task Force understands that certain preparatory work, including exploring permitting requirements and conducting an environmental site assessment for potential well sites, needs to be performed prior to implementing an exploratory well program. The Task Force believes it would be highly desirable to know the feasibility of using groundwater prior to the expiration of the existing Master Water Sales Contract with the San Francisco Public Utilities Commission (“SFPUC”) on June 30, 2009. 3.2.2. OPM #2 – Consider a Commercial Toilet Replacement Program The City currently offers financial incentives to replace (a) toilets in single-family units, (b) toilets in multi-family units, (c) clothes washers in single-family units, and (d) multi-family and commercial clothes washers with more water-efficient devices. However, the City does not currently offer financial incentives to replace toilets in commercial buildings with ultra-low flow toilets. Based on information provided by Dr. Whitcomb, a program targeting restaurants and retail/wholesale buildings would reduce potable water demand by approximately 48 AF/Y in 2004. Since all new toilets are required to be ultra-low flow, natural life-cycle replacement of commercial toilets results in a moving baseline for measuring reductions in potable water demand. Thus, the potable water demand reduction achieved from this program declines over time (e.g., 31 AF/Y in 2010 and 0 AF/Y in 2020). The cost of this program is estimated to be $500,000. In the event that additional potable water demand reductions are needed in the future, the Task Force recommends that the City consider implementing a program providing financial incentives to replace toilets in restaurants and retail/wholesale buildings with ultra-low flow toilets. 3.2.3. OPM #3 – Promote Conservation To increase community awareness of the opportunities for water conservation, the Task Force recommends that the City consider implementing the following conservation promotion ideas.
City of Redwood City Recycled Water Task Force Report March 3, 2004
The City should consider creating a new section on its web site that posts information on water conservation, including information about water-saving devices, rebate programs, attractive water-efficient landscaping, alternative water sources such as well water and rainwater harvesting, and water use surveys (see http://www.h2ouse.org/, a site developed by the California Urban Water Conservation Council). A hotline providing similar information could also be established. The City should also consider evaluating and rewarding water efficiency when judging properties for home beautification or business renovation awards. In addition, the City should explore ways to encourage participants in rebate or device replacement programs to consider additional conservation opportunities. For example, the City could routinely provide information regarding water use surveys and toilet replacement incentives to people applying for rebates on water-efficient washers. 3.2.4. OPM #4 – Adopt an Ordinance to Implement Conservation Measures The Task Force recommends that the City adopt an ordinance to implement potable water conservation measures, including dual plumbing in new commercial construction and, possibly, OPM #5, OPM #6, and OPM #7. 3.2.5. OPM #5 – Consider Requiring Low-Flow Urinals in New Construction Urinals normally meet the low-flow toilet requirement of one gallon per flush. However, there are urinals on the market that use only 0.5 gallon per flush. The Task Force recommends that the City consider requiring urinals in new construction to use 0.5 gallon or less per flush. 3.2.6. OPM #6 – Consider Requiring Conservation Devices in New Construction The Task Force recommends that the City consider requiring (a) water-efficient pre-rinse spray nozzles at newly constructed or renovated facilities for food service providers, (b) ET controllers in newly constructed commercial landscape, (c) hot water recirculation systems in newly constructed buildings. Hot water recirculation systems other than the pumps discussed in Alternative TF (e.g., a hot water pipe loop that avoids using the cold water pipe as the return to the hot water heater) may be more cost-effective in new construction. 3.2.7. OPM #7 – Evaluate Incentives for Electronic Eye Faucets The Task Force recommends that the City investigate potential options for promoting the use of electronic eye faucets that only turn on when hands are placed under them. Based on its findings, the City should consider implementing incentive programs for retrofitting existing faucets and requiring electronic eye faucets in new commercial construction. 3.2.8. OPM #8 – Investigate Potential Water Swaps with Other Potable Water Conveyors There appear to be large scale water users located near the recycled water piping alignment that could potentially use recycled water but are currently served by other potable water conveyors. It may be possible to swap recycled water for use at these sites for potable water. This has the potential to be a win-win-win for the parties involved (e.g., the water customer presumably
City of Redwood City Recycled Water Task Force Report March 3, 2004
would pay less for the recycled water than potable water, the other water conveyor would gain some part of the potable water demand reduction achieved, and the City would gain the other part of the potable water demand reduction achieved as well as income from the sale of the recycled water). The water exchange could be easily facilitated and tracked through existing pipeline infrastructure. The Task Force recommends that the City initiate discussions with other water conveyors to gauge interest in swapping the City’s recycled water for potable water. Interest in this swap may increase as the 2009 expiration of water sales contracts with the SFPUC approaches. 3.2.9. OPM #9 – Evaluate Emerging Automated Landscape Irrigation Technology The Task Force recommends that the City continue to evaluate innovations in automated landscape irrigation technology. The City should promote promising water-saving technology. 3.2.10. OPM #10 – Evaluate Emerging Treatment Technology The Task Force recommends that the City keep abreast of advances in wastewater treatment technology. If a treatment technology with the potential to address residents’ safety concerns emerges, the City should initiate public discussions to gauge public acceptance of recycled water treated with this technology. If public reaction is favorable, the City could then broaden the market for recycled water. 4. ACKNOWLEDGEMENTS The Task Force would like to recognize the considerable effort put forth by City staff, including Chu Chang, Tonia Tabucchi, and Javier Sierra, and the City’s consultants, including Mary Trail of Kennedy/Jenks Consultants and Dr. John Whitcomb, in assisting the Task Force with developing and evaluating alternatives. Their efforts were key to the success of this Task Force. The Task Force would also like to recognize our facilitator Dr. Cecil Reeves for his guidance in creating a positive and productive group.
Field Life Cycle ComparisonsAssumes a 4 acre (174,250 sf) site similar to Hoover Field Natural Grass
TurfSand Based
FieldField Turf System
ConstructionUnit Construction Cost (no fence, landscape or electrical) $3.75/sf $6.35/sf $8.20/sfInitial Installation Cost (174,250 sf) $654,375 $1,108,075 $1,430,900Architectural Fees $98,156 $116,348 $128,781Surveying, Testing and Contract Inspect. $49,078 $77,565 $71,545Staff Costs $98,156 $110,808 $114,47215% Contingency on Construction $98,156 $166,211 $214,635
Total Cost of Construction $997,922 $1,579,007 $1,960,333
Annual MaintenanceMowing (assume 2 Ac per hr/wk) $4,500 $4,500 $0Irrigation Repair $1,000 $1,000 $0Irrigation Head Replacement $500 $500 $0Annual Turf Repair and Striping $1,500 $1,500 $500Overseed @ $3000 per application $6,000 $6,000 $0Aeration @ $1000 per session $4,000 $4,000 $0Top Dressing $9,000 $9,000 $0Materials $2,000 $2,000 $200Water Use @ 950 unit/ac/yr RM Park field @ $2.30/unit $8,740 $0 $0Water Use @ 1870 unit/ac/yr….per Taft Field $0 $17,204 $0Fluffing 1 acre / hour …1 x per year $0 $0 $180
Estimated Annual Maintenance Cost $37,240 $45,704 $880
Life Cycle Cost Comparison Year 1 Construction $997,922 $1,579,007 $1,960,333 Maintenance $37,240 $45,704 $880 Year 2 previous year plus 4% $38,730 $47,532 $915 Year 3 previous year plus 4% $40,279 $49,433 $952 Year 4 previous year plus 4% $41,890 $51,411 $990 Year 5 previous year plus 4% $43,566 $53,467 $1,029Minor Renovation at $0.25 / sf for natural and sand turf only $43,625 $43,625 $0 Year 6 previous year plus 4% $45,308 $55,606 $1,071 Year 7 previous year plus 4% $47,120 $57,830 $1,113 Year 8 previous year plus 4% $49,005 $60,143 $1,158 Year 9 previous year plus 4% $50,966 $62,549 $1,204 Year 10 previous year plus 4% $53,004 $65,051 $1,253Field Renovation at $1per sf. for natural and sand turf only $174,500 $174,500 $980,00010 Year life cycle cost $1,663,154 $2,345,859 $2,950,898Annual Water Used (based on 14 yr average use at Hoover). Sand Based use is based on 1 year avg. at Taft 2,802,890 3,887,091 0Acre Feet per year use. 8.60 11.93 0
Days of Use Per Year (365 less maintenance, less rain) 260 320 360Cost per day of availability based 10 yr life cycle cost $640 $733 $820
COST PER HOUR OF AVAILABILITY TO PLAY SPORTSHours / day OK for sustained turf growth with Baseball* 10 10 14Annual hours available 2,600 3,200 5,040Cost per hour of play for Baseball $64 $73 $59Hours / day OK for sustained turf growth with Soccer ** 5.0 5.0 14Annual hours available 1,300 1,600 5,040Cost per hour of play for Soccer $128 $147 $59* Assumes Synthetic field is lighted for an 8:00 AM to 10 PM availability** Per PRZ Consulting 1 hour of Soccer is equivilant to 2 hours of wear on turf…also noted that the synthetic surface is exempt from Field Use Rating
APPENDIX 8
January 22, 2004
Field Life Cycle Comparisons

SYN
THET
IC F
IELD
Prio
rity
List
1.22
.04
Fiel
d
Est
Tur
f A
rea
in
squa
re
feet
Theo
retic
al
Wat
er U
se in
U
nits
of
Wat
er
Cur
rent
A
vera
ge
hour
s of
Use
Est
Day
s A
vaila
ble
per y
ear
Est
imat
ed
Hou
rs o
f A
vaila
bilit
y
New
Fi
eld
Hrs
Est
imat
ed
Day
s of
Use
Est
imat
ed
Hou
rs o
f A
vaila
bilit
y
Net
Incr
ease
in
Ava
ilabl
e U
se H
ours
Per
cent
In
crea
se in
Fi
eld
Use
Bec
het -
Grif
fin12
3,64
94,
065
1426
03,
640
1436
05,
040
1,40
038
.5%
McG
arve
y10
7,54
53,
601
1026
02,
600
1036
03,
600
1,00
038
.5%
Mitc
hell
78,5
777,
480
1026
02,
600
1036
03,
600
1,00
038
.5%
San
dpip
er89
,832
7,66
610
320
3,20
010
360
3,60
040
012
.5%
Mar
lin P
ark
106,
839
8,94
410
320
3,20
010
360
3,60
040
012
.5%
Taft
Sch
ool
70,3
785,
420
5.5
320
1,76
05.
536
01,
980
220
12.5
%
TOTA
L57
6,82
037
,176
17,0
004,
420
26.0
%
37,1
76 u
nits
of w
ater
=27
,809
,507
gallo
ns...
or85
.3ac
re fe
et
Con
stru
ctio
n R
enov
atio
n C
ost
Fiel
d Lo
catio
nA
rea
Uni
t Har
d C
ost
Ext
ende
d H
ard
Cos
tU
nit S
oft
Cos
tE
xten
ded
Sof
t Cos
tEs
timat
ed
Cos
t
Bec
het -
Grif
fin12
3,64
9$8
.20
$1,0
13,9
22$3
.05
$377
,129
$1,3
91,0
51M
cGar
vey
107,
545
$8.2
0$8
81,8
69$3
.05
$328
,012
$1,2
09,8
81M
itche
ll78
,577
$8.2
0$6
44,3
31$3
.05
$239
,660
$883
,991
San
dpip
er89
,832
$6.3
0$5
65,9
42$3
.05
$273
,988
$839
,929
Mar
lin P
ark
106,
839
$6.3
0$6
73,0
86$3
.05
$325
,859
$998
,945
Taft
Sch
ool
70,3
78$6
.30
$443
,381
$3.0
5$2
14,6
53$6
58,0
3 4
TOTA
L57
6,82
0$4
,222
,531
$1,7
59,3
01$5
,981
,832
Cur
rent
Con
ditio
nsW
ith S
ynth
etic
Tur
f
APPENDIX 9Sports Field Conversion to Synthetic Turf Priority Pla
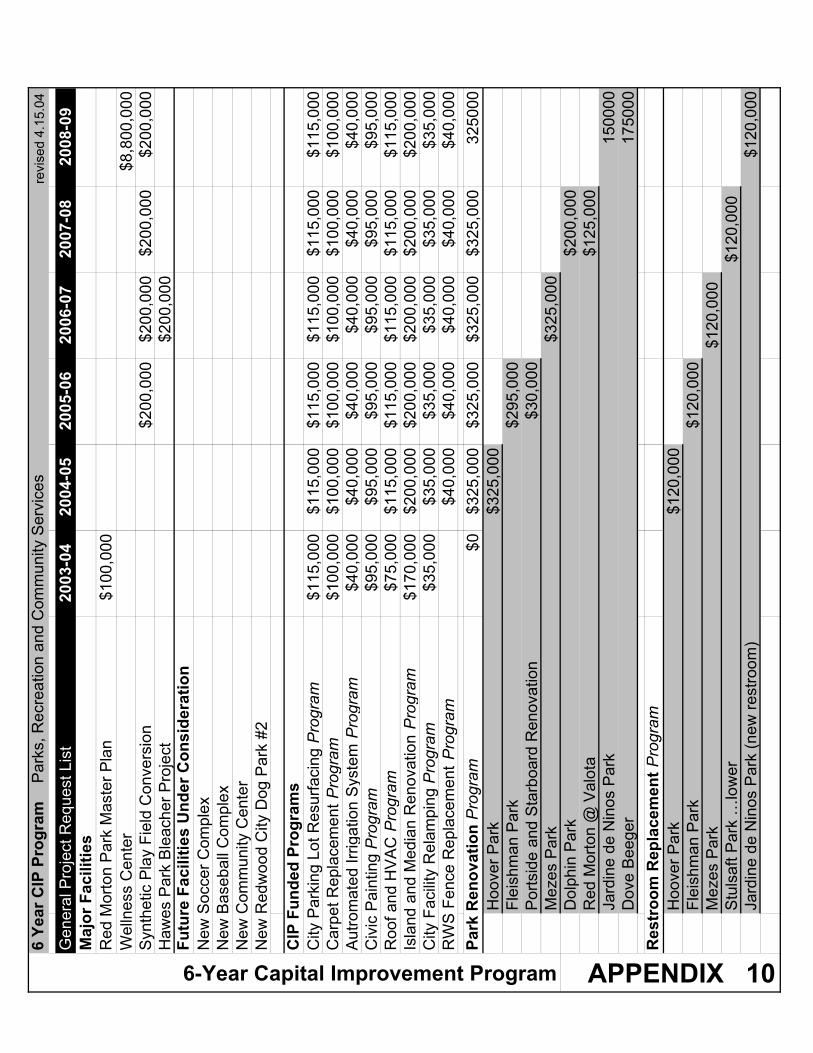
6 Ye
ar C
IP P
rogr
am
Par
ks, R
ecre
atio
n an
d C
omm
unity
Ser
vice
s re
vise
d 4.
15.0
4
Gen
eral
Pro
ject
Req
uest
Lis
t20
03-0
420
04-0
520
05-0
620
06-0
720
07-0
820
08-0
9M
ajor
Fac
ilitie
sR
ed M
orto
n P
ark
Mas
ter P
lan
$100
,000
Wel
lnes
s C
ente
r $8
,800
,000
Syn
thet
ic P
lay
Fiel
d C
onve
rsio
n$2
00,0
00$2
00,0
00$2
00,0
00$2
00,0
00H
awes
Par
k B
leac
her P
roje
ct$2
00,0
00Fu
ture
Fac
ilitie
s U
nder
Con
side
ratio
nN
ew S
occe
r Com
plex
New
Bas
ebal
l Com
plex
New
Com
mun
ity C
ente
rN
ew R
edw
ood
City
Dog
Par
k #2
CIP
Fun
ded
Prog
ram
sC
ity P
arki
ng L
ot R
esur
faci
ng Program
$115
,000
$115
,000
$115
,000
$115
,000
$115
,000
$115
,000
Car
pet R
epla
cem
ent Program
$100
,000
$100
,000
$100
,000
$100
,000
$100
,000
$100
,000
Aut
rom
ated
Irrig
atio
n S
yste
m Program
$40,
000
$40,
000
$40,
000
$40,
000
$40,
000
$40,
000
Civ
ic P
aint
ing Program
$95,
000
$95,
000
$95,
000
$95,
000
$95,
000
$95,
000
Roo
f and
HV
AC
Program
$75,
000
$115
,000
$115
,000
$115
,000
$115
,000
$115
,000
Isla
nd a
nd M
edia
n R
enov
atio
n Program
$170
,000
$200
,000
$200
,000
$200
,000
$200
,000
$200
,000
Cit y
Fac
ility
Rel
ampi
ng Program
$35,
000
$35,
000
$35,
000
$35,
000
$35,
000
$35,
000
RW
S F
ence
Rep
lace
men
t Program
$40,
000
$40,
000
$40,
000
$40,
000
$40,
000
Park
Ren
ovat
ion Program
$0$3
25,0
00$3
25,0
00$3
25,0
00$3
25,0
0032
5000
Hoo
ver P
ark
$325
,000
Flei
shm
an P
ark
$295
,000
Por
tsid
e an
d S
tarb
oard
Ren
ovat
ion
$30,
000
Mez
es P
ark
$325
,000
Dol
phin
Par
k$2
00,0
00R
ed M
orto
n @
Val
ota
$125
,000
Jard
ine
de N
inos
Par
k15
0000
Dov
e B
eege
r17
5000
Res
troo
m R
epla
cem
ent Program
Hoo
ver P
ark
$120
,000
Flei
shm
an P
ark
$120
,000
Mez
es P
ark
$120
,000
Stu
lsaf
t Par
k …
low
er
$120
,000
Jard
ine
de N
inos
Par
k (n
ew re
stro
om)
$120
,000
6-Year Capital Improvement Program APPENDIX 10
Community Demographics, Survey APPENDIX 11 Results and Existing Measures
C O M M U N I T Y D E M O G R A P H I C S , SURVEY RESULTS AND EXISTING MEASURES
The Department has engaged the community in discussions of their needs and preferences. The process reached a cross section of Redwood City residents. The results will enable the Department to develop programs that are responsive to community needs. The community process included:
Input sessions conducted with 18 community groups representing sports organizations, the Latino community, neighborhood associations, the business community, community groups, seniors, and residents with disabilities;
Discussion sessions with PRCS employees and the Parks and Recreation Commission; Review of demographic patterns using census data; and Analysis of the City’s community telephone survey.
This Appendix section identifies some of the challenges and opportunities the Department has evaluated. This section provides an overview of these topics in four sub-sections:
Water Resources
Community Demographics
Neighborhood Survey Feedback
Existing Measures
W a t e r R e s o u r c e s California’s limited water supply is driving a need for significant water conservation
programs and efforts, with implications for landscaping and parks maintenance. The Department will be developing and implementing strategies to address the critical
issue of water conservation. The City as a whole faces two key and interrelated water resource issues. The first is decreasing water reliability and the second is increasing wholesale water costs.
Water Reliability The City has a relatively low level of water supply reliability. The City currently purchases all of its potable water supplies from the San Francisco Public Utilities Commission (SFPUC) via the Hetch Hetchy regional water system. When the SFPUC next declares a water shortage, Redwood City will be required to make
relatively large water use cutbacks. If San Francisco declares a 10% system shortage, for example, Redwood City will be required to reduce water use by 17.5%.
The probability of Redwood City having to reduce water use by 17.5% or more is 10.1%. The City’s water reliability is deteriorating. As total water demands on Hetch Hetchy
grow, water shortages will increase both in frequency and in magnitude. In addition, the system yield has been reduced by about 25% of the total Bay Area storage
capacity in the system.
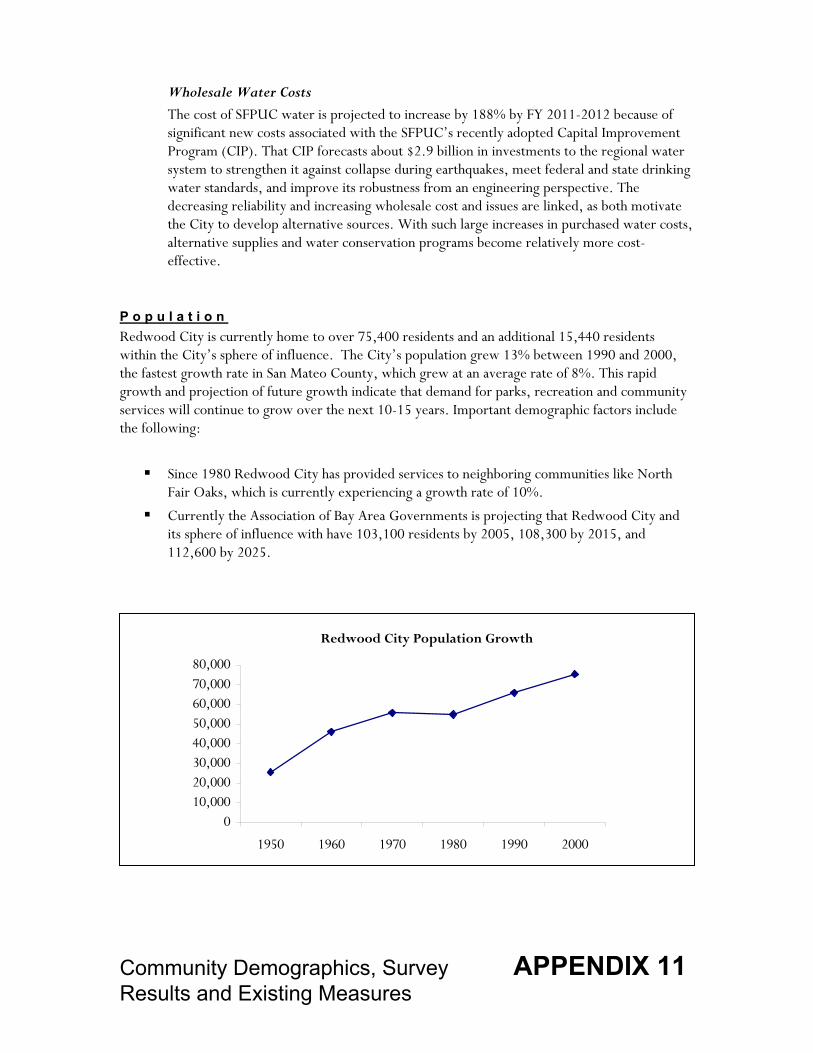
Community Demographics, Survey APPENDIX 11 Results and Existing Measures
010,00020,00030,00040,00050,00060,00070,00080,000
1950 1960 1970 1980 1990 2000
Wholesale Water Costs The cost of SFPUC water is projected to increase by 188% by FY 2011-2012 because of significant new costs associated with the SFPUC’s recently adopted Capital Improvement Program (CIP). That CIP forecasts about $2.9 billion in investments to the regional water system to strengthen it against collapse during earthquakes, meet federal and state drinking water standards, and improve its robustness from an engineering perspective. The decreasing reliability and increasing wholesale cost and issues are linked, as both motivate the City to develop alternative sources. With such large increases in purchased water costs, alternative supplies and water conservation programs become relatively more cost-effective.
P o p u l a t i o n Redwood City is currently home to over 75,400 residents and an additional 15,440 residents within the City’s sphere of influence. The City’s population grew 13% between 1990 and 2000, the fastest growth rate in San Mateo County, which grew at an average rate of 8%. This rapid growth and projection of future growth indicate that demand for parks, recreation and community services will continue to grow over the next 10-15 years. Important demographic factors include the following:
Since 1980 Redwood City has provided services to neighboring communities like North Fair Oaks, which is currently experiencing a growth rate of 10%.
Currently the Association of Bay Area Governments is projecting that Redwood City and its sphere of influence with have 103,100 residents by 2005, 108,300 by 2015, and 112,600 by 2025.
Redwood City Population Growth
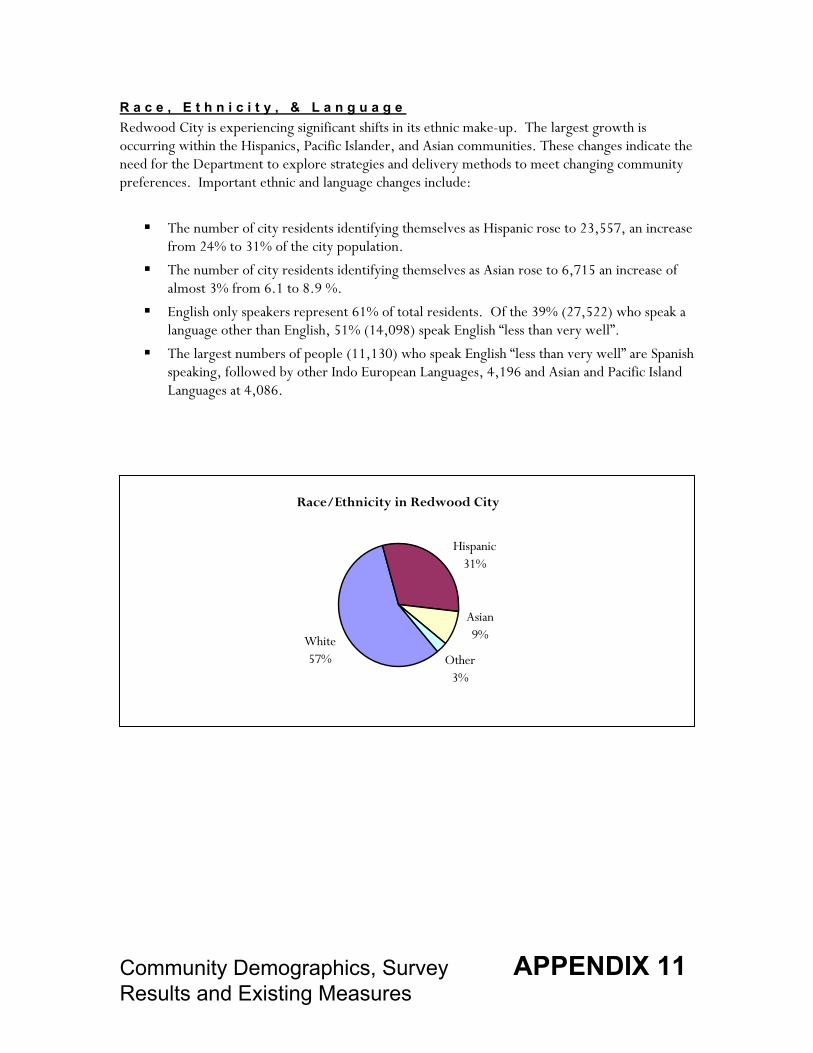
Community Demographics, Survey APPENDIX 11 Results and Existing Measures
Other3%
Hispanic31%
Asian9%White
57%
R a c e , E t h n i c i t y , & L a n g u a g e Redwood City is experiencing significant shifts in its ethnic make-up. The largest growth is occurring within the Hispanics, Pacific Islander, and Asian communities. These changes indicate the need for the Department to explore strategies and delivery methods to meet changing community preferences. Important ethnic and language changes include:
The number of city residents identifying themselves as Hispanic rose to 23,557, an increase from 24% to 31% of the city population.
The number of city residents identifying themselves as Asian rose to 6,715 an increase of almost 3% from 6.1 to 8.9 %.
English only speakers represent 61% of total residents. Of the 39% (27,522) who speak a language other than English, 51% (14,098) speak English “less than very well”.
The largest numbers of people (11,130) who speak English “less than very well” are Spanish speaking, followed by other Indo European Languages, 4,196 and Asian and Pacific Island Languages at 4,086.
Race/Ethnicity in Redwood City
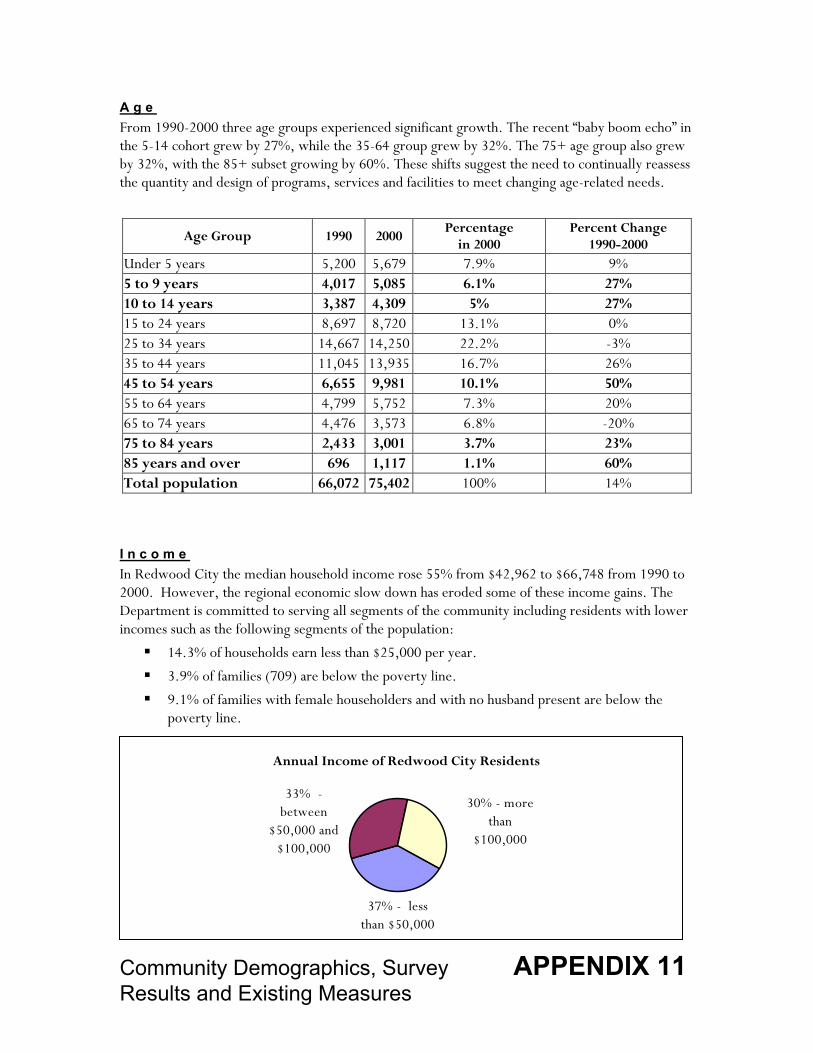
Community Demographics, Survey APPENDIX 11 Results and Existing Measures
37% - less than $50,000
33% - between
$50,000 and $100,000
30% - more than
$100,000
A g e From 1990-2000 three age groups experienced significant growth. The recent “baby boom echo” in the 5-14 cohort grew by 27%, while the 35-64 group grew by 32%. The 75+ age group also grew by 32%, with the 85+ subset growing by 60%. These shifts suggest the need to continually reassess the quantity and design of programs, services and facilities to meet changing age-related needs.
Age Group 1990 2000 Percentage in 2000
Percent Change 1990-2000
Under 5 years 5,200 5,679 7.9% 9% 5 to 9 years 4,017 5,085 6.1% 27% 10 to 14 years 3,387 4,309 5% 27% 15 to 24 years 8,697 8,720 13.1% 0% 25 to 34 years 14,667 14,250 22.2% -3% 35 to 44 years 11,045 13,935 16.7% 26% 45 to 54 years 6,655 9,981 10.1% 50% 55 to 64 years 4,799 5,752 7.3% 20% 65 to 74 years 4,476 3,573 6.8% -20% 75 to 84 years 2,433 3,001 3.7% 23% 85 years and over 696 1,117 1.1% 60% Total population 66,072 75,402 100% 14%
I n c o m e In Redwood City the median household income rose 55% from $42,962 to $66,748 from 1990 to 2000. However, the regional economic slow down has eroded some of these income gains. The Department is committed to serving all segments of the community including residents with lower incomes such as the following segments of the population:
14.3% of households earn less than $25,000 per year. 3.9% of families (709) are below the poverty line. 9.1% of families with female householders and with no husband present are below the
poverty line.
Annual Income of Redwood City Residents

Community Demographics, Survey APPENDIX 11 Results and Existing Measures
Breakdown of Redwood City Households
0
2000
4000
6000
8000
10000
Families withoutchildren at home
Married couplefamily children at
home
Femalehouseholder withchildren at home
Male householderwith children at
home
Non-familyhouseholds under
65 years old
Householderliving alone 65
years old and over
Households with Children Present
30.3%
24.6%
6.4%3.1%
27.6%
8%
17%
H o u s e h o l d s Redwood City is currently home to 28,060 households. Families with children comprise 34.1% of households, with 24.6% of these being married couple households and 9.5% being single-parent households. Single-parent female-headed households, which generally have lower incomes than single-parent male-headed or married couple households, constitute 6.4% of the households. Almost 69% of households do not have children present. The Department will consider this profile of household types in developing its programs, services, and facilities. (The census defines “family households” as all married couples, and single parents with related children present. “Non-family households” include single people and unrelated people living together without children present.)
E d u c a t i o n a l A t t a i n m e n t The following chart presents the level of education attained by Redwood City residents. In comparison to national and state averages, the City has a high level of educational attainment, reflecting the regional economy’s reliance on scientific and technical fields. This educational profile will influence community preferences and needs.
Educational Attainment of Redwood City Residents
0
2 0
4 0
6 0
8 0
1 0 0
L e s s t h a n a h i g hs c h o o l d e g r e e
H i g h s c h o o lg r a d u a t e o r h i g h e r
B a c h e l o r s d e g r e e o rh i g h e r
G r a d u a t e o rp r o f e s s i o n a l d e g r e e
83%
36%
14%
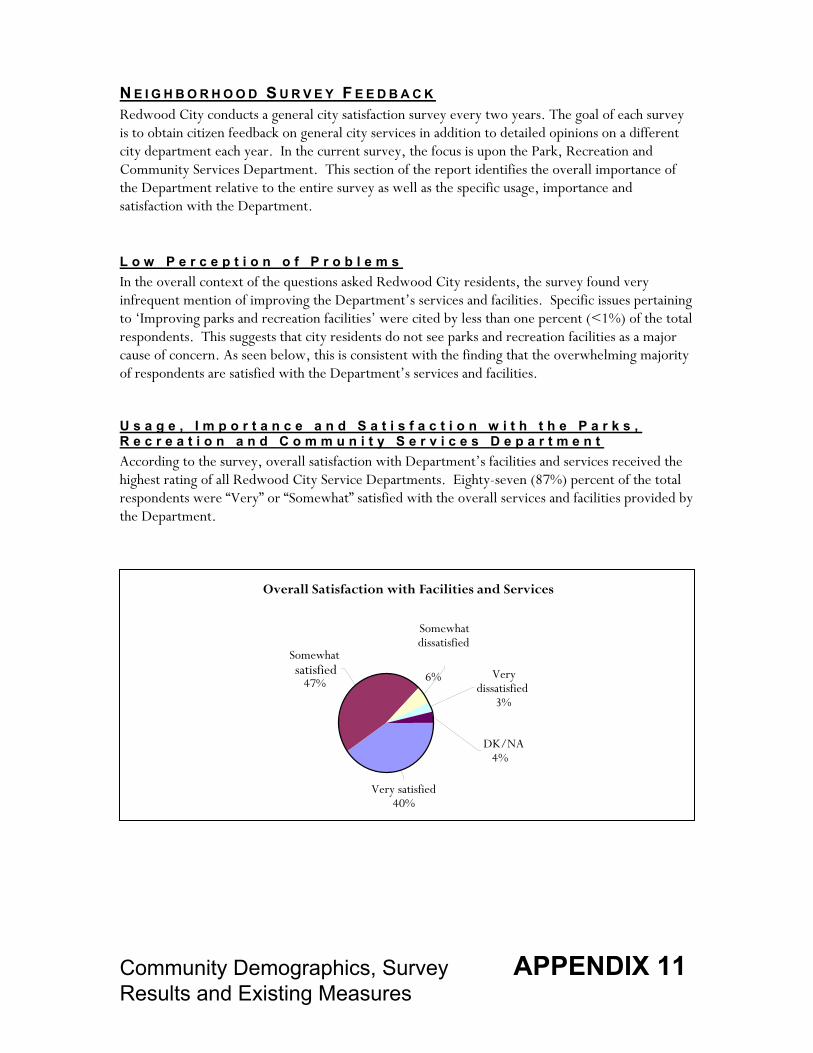
Community Demographics, Survey APPENDIX 11 Results and Existing Measures
N E I G H B O R H O O D S U R V E Y F E E D B A C K Redwood City conducts a general city satisfaction survey every two years. The goal of each survey is to obtain citizen feedback on general city services in addition to detailed opinions on a different city department each year. In the current survey, the focus is upon the Park, Recreation and Community Services Department. This section of the report identifies the overall importance of the Department relative to the entire survey as well as the specific usage, importance and satisfaction with the Department.
L o w P e r c e p t i o n o f P r o b l e m s In the overall context of the questions asked Redwood City residents, the survey found very infrequent mention of improving the Department’s services and facilities. Specific issues pertaining to ‘Improving parks and recreation facilities’ were cited by less than one percent (<1%) of the total respondents. This suggests that city residents do not see parks and recreation facilities as a major cause of concern. As seen below, this is consistent with the finding that the overwhelming majority of respondents are satisfied with the Department’s services and facilities.
U s a g e , I m p o r t a n c e a n d S a t i s f a c t i o n w i t h t h e P a r k s , R e c r e a t i o n a n d C o m m u n i t y S e r v i c e s D e p a r t m e n t According to the survey, overall satisfaction with Department’s facilities and services received the highest rating of all Redwood City Service Departments. Eighty-seven (87%) percent of the total respondents were “Very” or “Somewhat” satisfied with the overall services and facilities provided by the Department.
Overall Satisfaction with Facilities and Services
Somewhat dissatisfied
DK/NA4%
Very dissatisfied
3%
Somewhat satisfied
47%
Very satisfied40%
6%
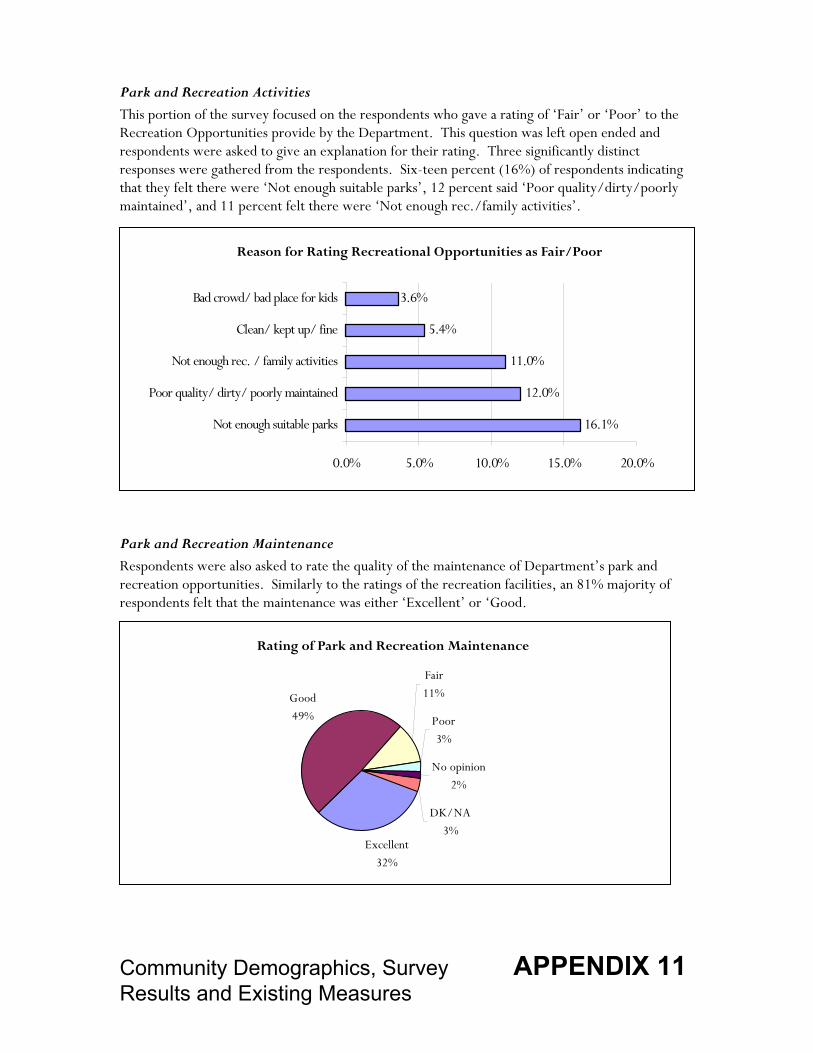
Community Demographics, Survey APPENDIX 11 Results and Existing Measures
Park and Recreation Activities This portion of the survey focused on the respondents who gave a rating of ‘Fair’ or ‘Poor’ to the Recreation Opportunities provide by the Department. This question was left open ended and respondents were asked to give an explanation for their rating. Three significantly distinct responses were gathered from the respondents. Six-teen percent (16%) of respondents indicating that they felt there were ‘Not enough suitable parks’, 12 percent said ‘Poor quality/dirty/poorly maintained’, and 11 percent felt there were ‘Not enough rec./family activities’.
Park and Recreation Maintenance Respondents were also asked to rate the quality of the maintenance of Department’s park and recreation opportunities. Similarly to the ratings of the recreation facilities, an 81% majority of respondents felt that the maintenance was either ‘Excellent’ or ‘Good.
16.1%
12.0%
11.0%
5.4%
3.6%
0.0% 5.0% 10.0% 15.0% 20.0%
Not enough suitable parks
Poor quality/ dirty/ poorly maintained
Not enough rec. / family activities
Clean/ kept up/ fine
Bad crowd/ bad place for kids
Excellent32%
Good49%
Fair11%
Poor3%
No opinion2%
DK/NA3%
Rating of Park and Recreation Maintenance
Reason for Rating Recreational Opportunities as Fair/Poor
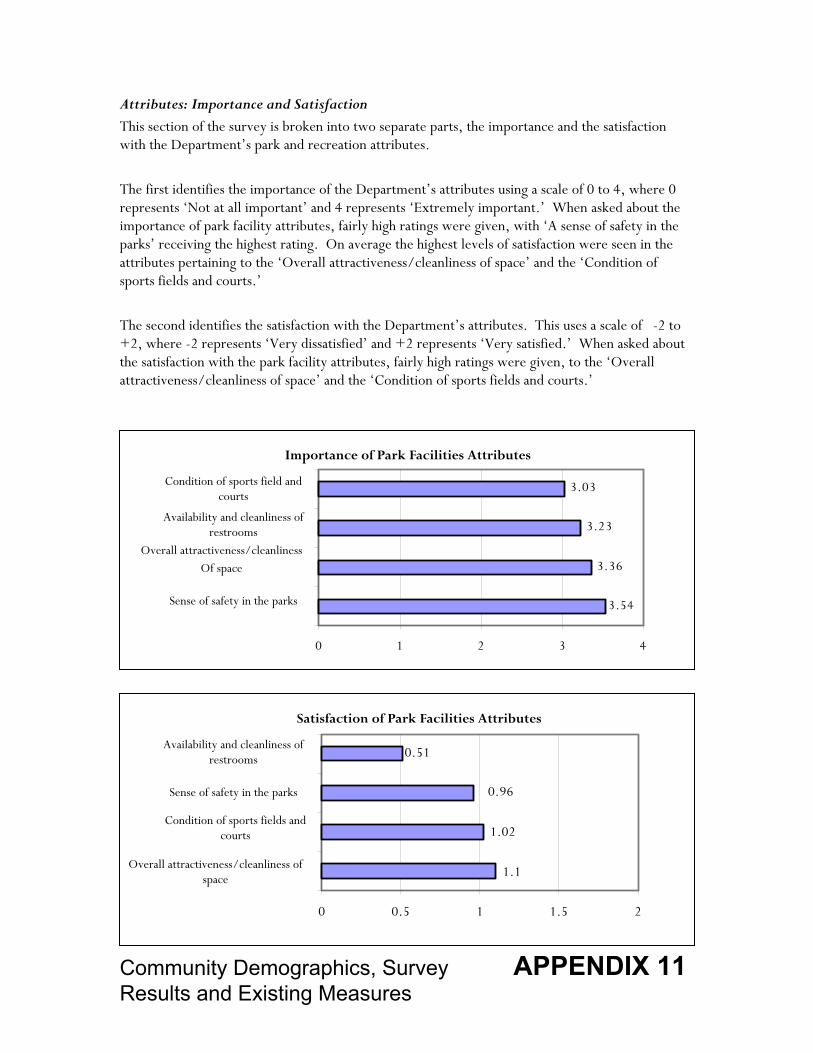
Community Demographics, Survey APPENDIX 11 Results and Existing Measures
Attributes: Importance and Satisfaction This section of the survey is broken into two separate parts, the importance and the satisfaction with the Department’s park and recreation attributes. The first identifies the importance of the Department’s attributes using a scale of 0 to 4, where 0 represents ‘Not at all important’ and 4 represents ‘Extremely important.’ When asked about the importance of park facility attributes, fairly high ratings were given, with ‘A sense of safety in the parks’ receiving the highest rating. On average the highest levels of satisfaction were seen in the attributes pertaining to the ‘Overall attractiveness/cleanliness of space’ and the ‘Condition of sports fields and courts.’ The second identifies the satisfaction with the Department’s attributes. This uses a scale of -2 to +2, where -2 represents ‘Very dissatisfied’ and +2 represents ‘Very satisfied.’ When asked about the satisfaction with the park facility attributes, fairly high ratings were given, to the ‘Overall attractiveness/cleanliness of space’ and the ‘Condition of sports fields and courts.’
3.54
3.36
3.23
3.03
0 1 2 3 4
1.1
1.02
0.96
0.51
0 0.5 1 1.5 2
Condition of sports field and courts
Availability and cleanliness of restrooms
Overall attractiveness/cleanliness Of space
Sense of safety in the parks
Importance of Park Facilities Attributes
Availability and cleanliness of restrooms
Sense of safety in the parks
Condition of sports fields and courts
Overall attractiveness/cleanliness of space
Satisfaction of Park Facilities Attributes
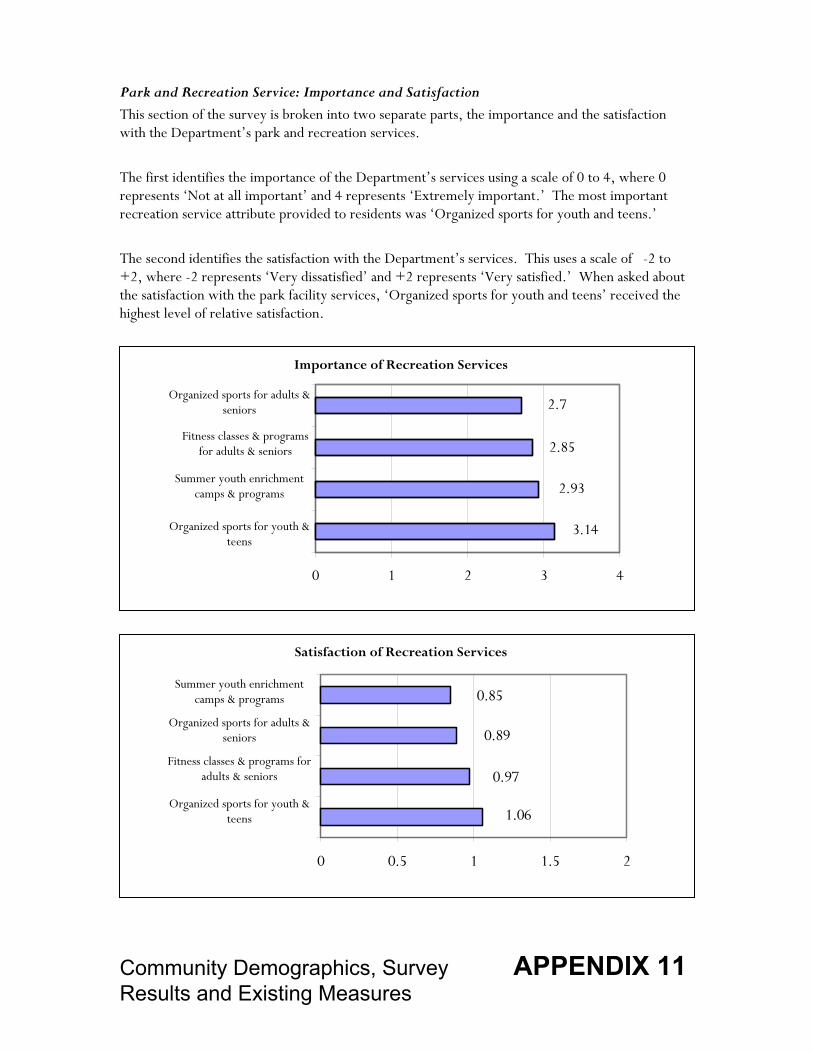
Community Demographics, Survey APPENDIX 11 Results and Existing Measures
Park and Recreation Service: Importance and Satisfaction This section of the survey is broken into two separate parts, the importance and the satisfaction with the Department’s park and recreation services. The first identifies the importance of the Department’s services using a scale of 0 to 4, where 0 represents ‘Not at all important’ and 4 represents ‘Extremely important.’ The most important recreation service attribute provided to residents was ‘Organized sports for youth and teens.’ The second identifies the satisfaction with the Department’s services. This uses a scale of -2 to +2, where -2 represents ‘Very dissatisfied’ and +2 represents ‘Very satisfied.’ When asked about the satisfaction with the park facility services, ‘Organized sports for youth and teens’ received the highest level of relative satisfaction.
2.7
2.85
2.93
3.14
0 1 2 3 4
0.85
0.89
0.97
1.06
0 0.5 1 1.5 2
Organized sports for adults & seniors
Fitness classes & programs for adults & seniors
Summer youth enrichment camps & programs
Organized sports for youth & teens
Importance of Recreation Services
Summer youth enrichment camps & programs
Organized sports for adults & seniors
Fitness classes & programs for adults & seniors
Organized sports for youth & teens
Satisfaction of Recreation Services
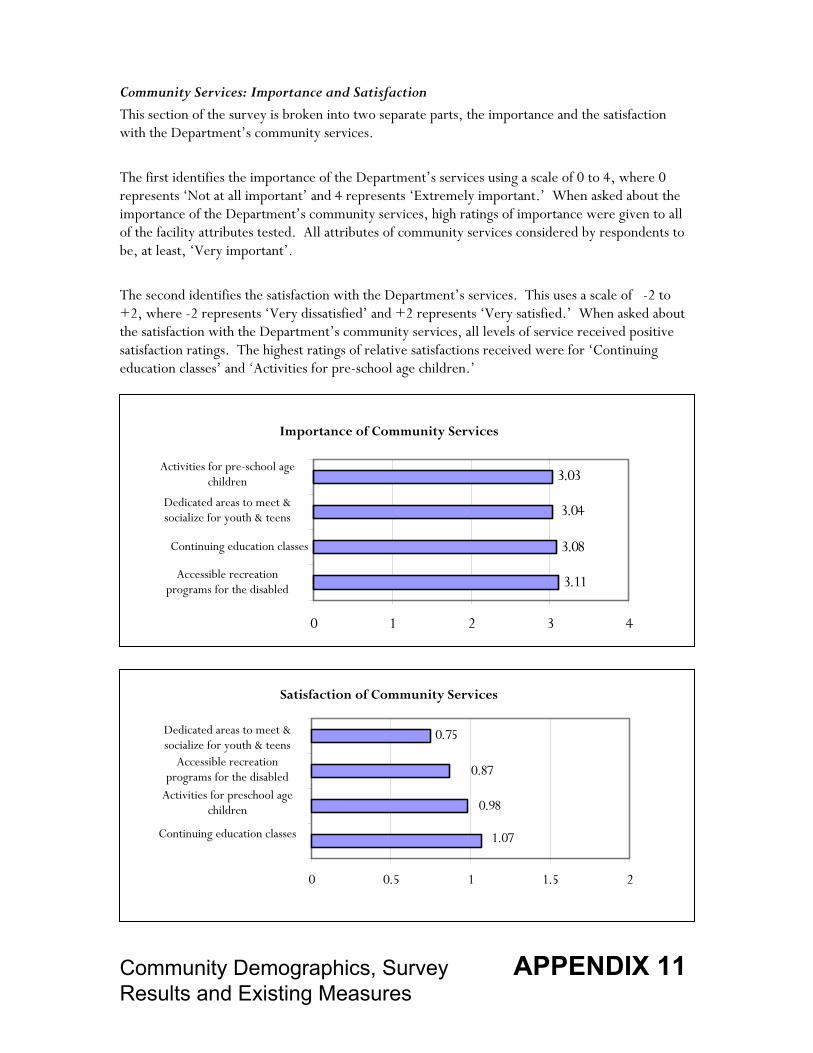
Community Demographics, Survey APPENDIX 11 Results and Existing Measures
Community Services: Importance and Satisfaction This section of the survey is broken into two separate parts, the importance and the satisfaction with the Department’s community services. The first identifies the importance of the Department’s services using a scale of 0 to 4, where 0 represents ‘Not at all important’ and 4 represents ‘Extremely important.’ When asked about the importance of the Department’s community services, high ratings of importance were given to all of the facility attributes tested. All attributes of community services considered by respondents to be, at least, ‘Very important’. The second identifies the satisfaction with the Department’s services. This uses a scale of -2 to +2, where -2 represents ‘Very dissatisfied’ and +2 represents ‘Very satisfied.’ When asked about the satisfaction with the Department’s community services, all levels of service received positive satisfaction ratings. The highest ratings of relative satisfactions received were for ‘Continuing education classes’ and ‘Activities for pre-school age children.’
1.07
0.98
0.87
0.75
0 0.5 1 1.5 2
3.03
3.04
3.08
3.11
0 1 2 3 4
Activities for pre-school age children
Dedicated areas to meet & socialize for youth & teens
Continuing education classes
Accessible recreation programs for the disabled
Importance of Community Services
Dedicated areas to meet & socialize for youth & teens
Accessible recreation programs for the disabled
Activities for preschool age children
Continuing education classes
Satisfaction of Community Services
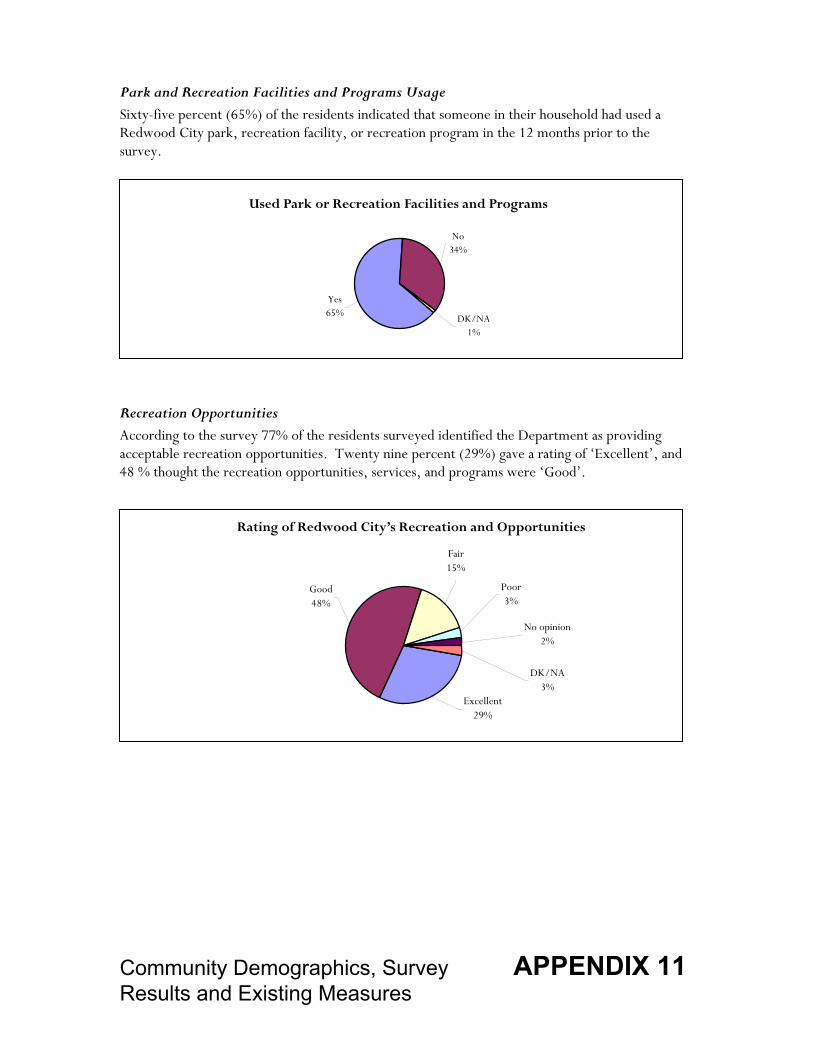
Community Demographics, Survey APPENDIX 11 Results and Existing Measures
Park and Recreation Facilities and Programs Usage
Sixty-five percent (65%) of the residents indicated that someone in their household had used a Redwood City park, recreation facility, or recreation program in the 12 months prior to the survey.
Recreation Opportunities According to the survey 77% of the residents surveyed identified the Department as providing acceptable recreation opportunities. Twenty nine percent (29%) gave a rating of ‘Excellent’, and 48 % thought the recreation opportunities, services, and programs were ‘Good’.
Yes65%
No34%
DK/NA1%
Excellent29%
Good48%
DK/NA3%
No opinion2%
Poor3%
Fair15%
Used Park or Recreation Facilities and Programs
Rating of Redwood City’s Recreation and Opportunities
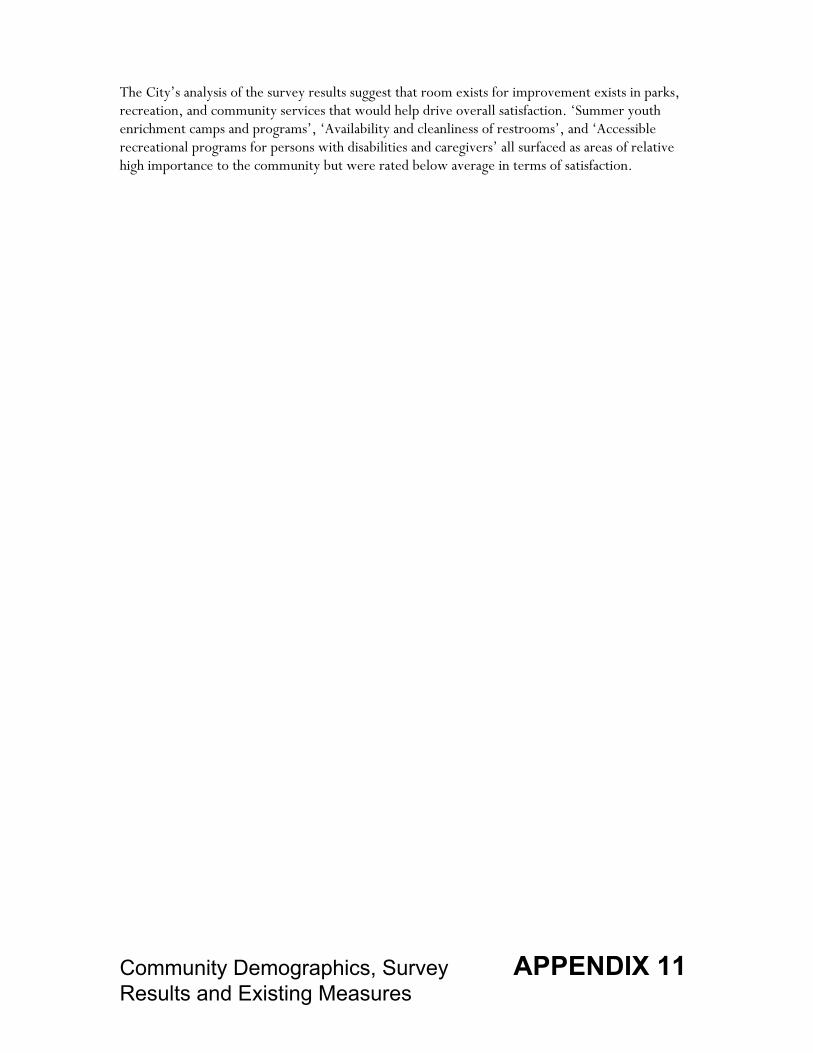
Community Demographics, Survey APPENDIX 11 Results and Existing Measures
The City’s analysis of the survey results suggest that room exists for improvement exists in parks, recreation, and community services that would help drive overall satisfaction. ‘Summer youth enrichment camps and programs’, ‘Availability and cleanliness of restrooms’, and ‘Accessible recreational programs for persons with disabilities and caregivers’ all surfaced as areas of relative high importance to the community but were rated below average in terms of satisfaction.