Embed Size (px)
Citation preview
MANAGEMENT’S REPORT – LIGHT S.A.- 2016
Message from Management
The first year of the new management has significantly changed Light’s business strategy,
already reflected in the positive results of 2016.
Based on a new diagnosis of the causes and areas of energy losses, we intensified combat
initiatives in regions inhabited by middle-income to high-income customers. These regions represent
90% of the load of the Distribution Company and 51% of the volume of energy stolen. As a result, the
volume of recovered energy increased significantly and total losses accounted for 22.54% of the grid
load in the twelve months ended December 31, 2016.
The success of the Company in the execution of this program is even more remarkable when we
take into account Brazil’s current adverse social and economic scenario, particularly in the State of Rio
de Janeiro, where the 31 cities of its concession area are included. We were able not only to decrease
losses, but also to prevent such losses from deteriorating the collection rate, which increased compared
to 2015.
The energy theft combat program is associated with the search for efficiency through an
improvement in the quality of services rendered and a better management of funds used by the
Distribution Company. Throughout the year, approximately R$170 million were invested in the
implementation of measures to improve the quality of services, resulting in a decrease in the electricity
duration of interruption (DEC) indicator to 11.70 hours.
In addition, 2017 begun with great news for the Light Group. Upon the execution of the 5th
amendment to the concession agreement, Light became the first company to voluntarily accede to the
new clauses of quality and economic and financial sustainability, which will translate into better services
rendered to consumers. This new amendment also allows the anticipation of the tariff review process of
the Distribution Company, ensuring the restoration of its economic and financial equilibrium.
The restoration of the economic and financial equilibrium of the Distribution Company
combined with prospects of improvement in Brazil’s economic scenario, with a drop in the base interest
rate, will result in a favorable scenario that will allow the Light Group to decrease indebtedness expenses
and strengthen its cash flow.
It is also fundamental for the Company to optimize its investment program, focusing on its core
business, i.e., distribution of electricity, and reviewing its portfolio of assets based on potential returns
and short-term cash and cash equivalents.
Finally, we reinforce our commitment to the search for efficiency in the management and
implementation of best practices in all different areas of Light. Our operation will focus on sustainable
results, privileging the skills and ethics of our employees and our transparency in our relationships with
shareholders, business partners, customers, and other stakeholders.
Company’s Profile
Light operates in 31 cities of the State of Rio de Janeiro, encompassing a region with
approximately 11 million people, ending 2016 with more than four million customers. Headquartered in
the city of Rio de Janeiro, the Light Group consists of the following companies: Light S.A. (holding
company); Light Serviços de Eletricidade S.A. (Light SESA) (power distribution company); Light
Energia S.A. (Light Energia) (power generation company), Lightger S.A. (Lightger) (the company in
charge of the Paracambi SHPP project); Itaocara Energia Ltda. (Itaocara); Amazônia Energia
Participações S.A. (Amazônia) (a company holding interest in the Belo Monte HPP project); Light Esco

MANAGEMENT’S REPORT – LIGHT S.A.- 2016
Prestação de Serviços S.A. (Light Esco) and Lightcom Comercializadora de Energia S.A. (Lightcom)
(both operating in the commercialization segment); Light Soluções em Eletricidade Ltda. (Light
Soluções); Energia Olímpica S.A. (Olímpica); Axxiom Soluções Tecnológicas S.A. (Axxiom) (service
provider); and Instituto Light (institute).
Operating Scenario
Operating Performance
Tariffs
The tariffs charged by Light S.E.S.A. are set forth pursuant to the Concession Agreement and
the regulations and decisions of the Brazilian Electricity Agency (Agência Nacional de Energia Elétrica)
(ANEEL), which has discretion over the exercise of its regulatory activities. The concession agreements
of distribution companies and Brazilian law set forth a tariff cap mechanism allowing three types of
tariff adjustment: (1) the annual tariff adjustment; (2) tariff reviews every five years; and (3) the
extraordinary tariff review. The Annual Tariff Adjustment took place on November 7, 2016. As of 2017,
upon the execution of the 5th amendment to the concession agreement, the date of the annual tariff
adjustment will be changed to March 15.
Annual Tariff Adjustment
On November 1, 2016, ANEEL approved the tariff adjustment rate for Light Serviços de
Eletricidade S.A., consisting of two items: the structural item (which is now included in the tariff),
adjusted by -1.24%; and the financial item (exclusively applied to the 12 months following the date of
the tariff adjustment), adjusted by -4.23%.
The annual tariff adjustment process consists of the transfer to consumers of non-manageable
concession costs (Parcel A items – purchase of energy, industry charges, and transmission charges) and
the adjustment for inflation of manageable costs (Parcel B items – distribution) based on the General
Market Price (IGP-M) index, less Factor X, which passes on to consumers the concessionaire’s annual
productivity gains.
The Parcel A items adjustment was -3,84%, primarily due to: (i) a decrease in the Energy
Development Account (CDE) by 16%; and (ii) the variation in costs with purchase of electricity by -
6.31%, especially due to the depreciation of the Real against the U.S. dollar, which affected the energy
tariff from Itaipu. The average transfer price under energy purchase agreements (Pmix) was set at
R$173.78/MWh.
The Parcel B items adjustment (which is effectively kept by Light to cover costs and remunerate
investments) reflects the accumulated variation of the IGP-M index from November 2015 to October
2016 (8.78%), less Factor X (1.22%), resulting in a final rate of 7.56%.
The average impact on consumers was a 12.25% decrease, where Parcel A items accounted for
a 13.98% decrease and Parcel B items accounted for a 1.72% increase. The new tariffs became effective
as of November 7, 2016.
Amendment to the Concession Agreement and Fourth Tariff Review
In February 2016, Light SESA filed with ANEEL a formal request to begin the Extraordinary
Tariff Review Process. In August 2016, pursuant to Order (Despacho) No. 2.194, ANEEL determined

MANAGEMENT’S REPORT – LIGHT S.A.- 2016
that distribution companies that were not initially covered by Law No. 12.783 could also accede to the
terms of the new concession agreement and change the date of the Tariff Review. Accordingly, in
October 2016, Light requested from ANEEL the execution of an amendment to the concession
agreement and the anticipation of the Tariff Review from November 2018 to November 2016. As a
result, in December 2016, ANEEL called Public Hearing (Audiência Pública) No. 89 to obtain further
information for the execution of an amendment to the concession agreement and the anticipation of the
Tariff Review of Light to March 2017. On March 15, 2017, the 4th Periodic Tariff Review process was
completed, ratifying an average tariff adjustment of 10.45%.
The execution of an amendment to the concession agreement and the anticipation of the 4th Tariff
Review are of public interest as it benefits:
Light, which will restore the equilibrium of its concession agreement pursuant to Brazilian Law
and the agreements in effect;
consumers, who will rely on a greater commitment of the Company’s shareholders and
management to the sustainability of the concession, in economic and financial terms and also
regarding the quality of services rendered;
the electricity sector because once the financial equilibrium of Light is restored, Light will be
able to meet its intra-sector obligations (charges, purchase and transmission of energy) without
delays; and
the economy of Rio de Janeiro and Brazil because once the financial equilibrium of Light is
restored, Light will be able to make more investments and offer more jobs.
In addition, the Company will also be required to meet new obligations under the new
amendment to the concession agreement, including:
Efficiency in terms of quality – an objective metric to improve the Duration of Interruption
(DEC) and Frequency of Interruption (FEC) indicators in the first five years:
DECi (hours) FECi (interruptions)
2018 2019 2020 2021 2022 2018 2019 2020 2021 2022
9.80 8.23 8.14 8.02 7.84 6.01 5.72 5.43 5.15 4.86
Efficiency in terms of economic parameters – an objective trajectory during the first years
according to which the Distribution Company, by complying with the indicators1 set forth by the
concession agreement, will reach economic and financial sustainability:
2018: {Net Debt / [EBITDA2 (-) QRR23]} ≤ 1 / (0,8 * SELIC4]) 2019 em diante: {Net Debt / [EBITDA (-) QRR]} ≤ 1 / (1,11 * SELIC)
1 Limits less restrictive than the company's current financial covenants 2 Calculated according to ANEEL methodology 3 Reflects Regulatory Depreciation 4 Long-term interest rate

MANAGEMENT’S REPORT – LIGHT S.A.- 2016
Corporate governance and transparency – the Distribution Company undertakes to maintain its
governance and transparency levels in line with best practices and in accordance with its status
of utility services provider.
Commitment of controlling shareholders – the controlling shareholders execute the concession
agreement as intervening parties and guarantors of the obligations and charges set forth
thereunder.
It is also worth mentioning that, upon the execution of the amendment to the concession
agreement, Light SESA’s usual tariff processes will take place every March 15, and the next Periodic
Tariff Review (“PTR”) is scheduled for March 15, 2022. The expiration date of Light SESA’s
concession agreement remains unchanged, i.e., June 4, 2026.
As a result of the 4th PTR, the items associated with energy distribution services included in the
tariffs of Light SESA (allocated to cover efficient operating costs, remuneration and depreciation of
investments, annual payments of non-electrical assets, and irrecoverable revenues, deducted from other
revenues), as ratified by ANEEL, total R$2,911 million.
These same items, included in Parcel B items that were passed on to the last Tariff Adjustment
of Light SESA, on November 7, 2016, totaled R$2,535 million on that date.
As to transfer of energy losses, the percentage of non-technical losses now accounts for 36.06%
of the low voltage market and the percentage of technical losses accounts for 6.34% of the regulatory
Grid Load. Both percentages will remain the same until the next PTR, scheduled to March 2022,
irrespective of the actual level of losses of the concessionaire during the period.
In addition to the recalculation of items associated with energy distribution services and the
redefinition of percentages for regulatory losses, Light SESA’s new tariffs also reflect an adjustment to
Parcel A items (associated with the purchase of energy, industry charges, and transmission costs) and to
financial items.
Average Effect for Consumer
-2.86%
4,26%
1.43%
2,81%
4,81% 10,45 %
Sector Charges
Transmission Costs
Energy Acquisition
Costs
Distribuition & Irrecoverable
Revenues
Financial Components Total

MANAGEMENT’S REPORT – LIGHT S.A.- 2016
Market Evolution
In 2016, Billed Energy decreased by 2.3% compared to 2015, primarily due to milder
temperatures and an unfavorable economic scenario. However, it is important to highlight the energy
recovered in all segments, i.e., 683 GWh in 2016 compared to 256 GWh in 2015, reflecting the
Company’s new strategy to combat energy losses.
The residential segment recorded a 0.8% increase in Billed Energy compared to the previous
year, irrespective of the drop in average temperature, due to increased efforts of the Company to combat
energy losses, resulting in significant billing of the energy recovered from the low voltage market. Of
the 683 GWh recovered in 2016, 600 GWh accounted for the recovery of energy from the residential
segment alone. Excluding the recovery of energy, the residential segment would have recorded a drop
of 6.0% compared to 2015.
The commercial segment recorded a 2.2% decrease compared to 2015, totaling 8,271 GWh at
the end of 2016. This drop is due to the migration of high voltage customers to the free market and the
4.4% decrease in the most significant commercial segment, i.e., the retail segment, reflecting the
economic downturn in terms of energy consumption.
The energy consumption of the industrial segment in Light’s concession area decreased by 6.7%,
in line with the drop recorded by other concessionaires of the southeast region. In 2016, total energy
consumption amounted to 4,901 GWh, representing a decrease of 350 GWh compared to 2015. In 2016,
22 industrial customers migrated to the free market.
MANAGEMENT’S REPORT – LIGHT S.A.- 2016
Energy Losses5
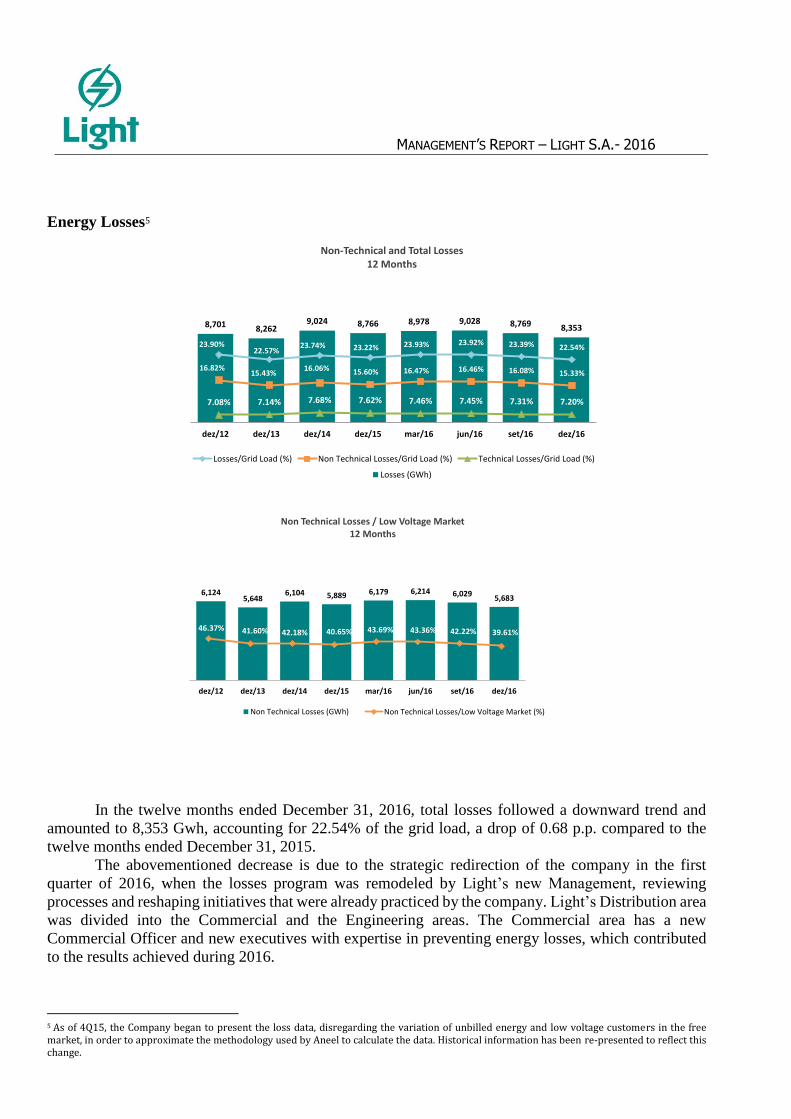
In the twelve months ended December 31, 2016, total losses followed a downward trend and
amounted to 8,353 Gwh, accounting for 22.54% of the grid load, a drop of 0.68 p.p. compared to the
twelve months ended December 31, 2015.
The abovementioned decrease is due to the strategic redirection of the company in the first
quarter of 2016, when the losses program was remodeled by Light’s new Management, reviewing
processes and reshaping initiatives that were already practiced by the company. Light’s Distribution area
was divided into the Commercial and the Engineering areas. The Commercial area has a new
Commercial Officer and new executives with expertise in preventing energy losses, which contributed
to the results achieved during 2016.
5 As of 4Q15, the Company began to present the loss data, disregarding the variation of unbilled energy and low voltage customers in the free market, in order to approximate the methodology used by Aneel to calculate the data. Historical information has been re-presented to reflect this change.
8,701 8,2629,024 8,766 8,978 9,028 8,769 8,353
dez/12 dez/13 dez/14 dez/15 mar/16 jun/16 set/16 dez/16
Non-Technical and Total Losses12 Months
Losses (GWh)
23.90%22.57%
23.74% 23.22% 23.93% 23.92% 23.39% 22.54%
16.82%15.43%
16.06% 15.60% 16.47% 16.46% 16.08% 15.33%
7.08% 7.14% 7.68% 7.62% 7.46% 7.45% 7.31% 7.20%
Losses/Grid Load (%) Non Technical Losses/Grid Load (%) Technical Losses/Grid Load (%)
6,1245,648
6,104 5,889 6,179 6,214 6,0295,683
dez/12 dez/13 dez/14 dez/15 mar/16 jun/16 set/16 dez/16
Non Technical Losses / Low Voltage Market12 Months
Non Technical Losses (GWh)
46.37% 41.60% 42.18% 40.65% 43.69% 43.36% 42.22% 39.61%
Non Technical Losses/Low Voltage Market (%)

MANAGEMENT’S REPORT – LIGHT S.A.- 2016
Other methods were adopted to combat non-technical losses in particular, based on studies and
detection of “theft” and its causes, resulting in new combat initiatives. According to its new strategy, the
Company chose to intensify the combat of energy loss in areas referred to as “possible” areas, i.e., areas
where Light can act, with a higher number of middle- and high-income consumers. We also continued
to combat energy loss in “risk areas,” however, at a less intense pace, including initiatives that require
less investments.
Below are the details of the new initiatives introduced in 2016 and the strategies that are already
in place:
Review of Processes
The review of processes included a reassessment of the procedures regarding losses and the
introduction of new technologies to hinder the access of fraudsters to the electronic meter, such as:
(i) increase in the number of collective shielding in residential buildings; and (ii) training provided to
electronic meter reading agents and relationship agents to help identifying frauds.
Advertisement Actions
The Company launched an advertisement campaign against energy theft directed at the upper,
middle, and lower classes, broadcast on TV, radio and billboards. This initiative gave fraudsters the
opportunity of correcting irregularities, upon the offer of special conditions. Moreover, the internal
channel was reformulated, allowing employees to report irregularities that cause energy losses.
Energy Losses Program
In 2016, the Energy Losses Program prevented the theft of 957.50 GWh, representing a 31.8%
improvement compared to 2015, of which 683.01 GWh refer to recovered energy (REN), 189.55 GWh
refer to incorporated energy (IEN), and 84.94 GWh refer to load reduction. In 4Q16 particularly, the
Energy Losses Program prevented the theft of 497.6 GWh, of which 382.9 GWh refer to recovered
energy (REN), 78.7 GWh refer to incorporated energy (IEN), and 36.0 GWh refer to load reduction,
exceeding additional losses of 151.6 GWh. It is worth mentioning the significant increase in the volume
of recovered energy (+166% vs. 2015) as a result of the new energy loss combat strategy focused on
areas where Light can act (Possible Areas), accounting for 90% of the grid load and 51% of losses. As
of now, as the energy losses program advances, the volume of recovered energy tends to be gradually
replaced by the additional consumption incorporated to the revenue base, i.e., the Incorporated Energy
– IEN.

MANAGEMENT’S REPORT – LIGHT S.A.- 2016
The new theft prevention initiatives in 2016 resulted in the recovery and incorporation of larger
volumes of energy per customer and lower expenses per MWh whose theft has been prevented,
representing an 36.2% decrease compared to 2015. We can also identify a continuing decrease in loss
indicators at “Possible Areas” compared to a slight increase at “Risk Areas” due to the deterioration of
the social and economic scenario in Rio de Janeiro.
The main initiatives in the Non-Technical Energy Losses Combat Program are as follows:
o Operativos
Operativos, also called “blitz,” are concentrated in Possible Areas and target clients selected by
the Light Intelligence Center, taking place more than once a week and involving approximately 700
professionals, including field teams, lawyers, military and civil police, and police stations. Barra da
Tijuca, Vargem Grande, Copacabana, Duque de Caxias, Ilha do Governador, Centro, and Lapa are some
-5.7%
Load Reduction
Dec/16 Losses (12 months)
151.65,683.0
Additional Losses
Energy Incorporation
-36.0
-78.7
Energy Recovery
-382.9
Sep/16 Losses (12 months)
6,029
Losses Combat Program
(GWh)

MANAGEMENT’S REPORT – LIGHT S.A.- 2016
of the neighborhoods where the Company intensified its
operations during the year. This strategy has high detection rates
concerning irregularities, not only in residences of these regions,
but also in restaurants, gyms, and ice cream shops, among
others, which confirms the efficacy of these initiatives as a
market discipline tool. In the event evidence of energy
consumption irregularities is detected, an Occurrence and
Inspection Notice (Termo de Ocorrência e Inspeção – TOI) and
a Police Report (Registro de Ocorrência – RO) are issued,
resulting in the imprisonment of those responsible in certain
cases. The results of these initiatives allow us to calculate and
bill the irregular energy consumption for the relevant period,
ensuring the recovered energy. These Operativos
have had repercussions in the areas where they are
conducted and also in the local media, as part of the
strategy to recover the concession ownership.
o Zero Loss Areas (Área de Perda
Zero – APZ)
Currently, the APZ project encompasses
850 thousand clients, with 39 operational APZs. In
APZs where Light’s activities are regular, average
non-technical losses over the grid load reached
13.7% in 2016, compared to 49.0% before the
beginning of the project.
In addition to these initiatives, Light
continues to invest in regularization procedures (rectifying the supply of electricity by eliminating
irregularities in the consumer unit or in Light’s network) and, at a slower pace, in the installation of
electronic meters.
Collection
In 2016, the collection rate reached 96.3%, representing a 1.6 p.p. increase compared to 2015
(94.7%). At the end of the year, we noted a decrease only in the collection rate of the Retail segment
due to the increase in Recovered Energy billed. This increase in Recovered Energy billed adversely
affects the global collection rate as a large portion of these payments is made in installments; on the
other hand, it increases revenue and global gross collections. Excluding the effect of Recovered Energy,
the collection rate of the Retail segment would reach 99.2% in 2016, 99.1% of Light’s total collection
rate in 2016.
Number of Normalizations 2016 2015 Var. %
= Total 135,375 51,041 165.2%
- High / Medium Voltage 1,135 905 25.4%
- Low Voltage 134,240 50,136 167.8%
Direct low voltage 126,120 40,333 212.7%
Indirect low voltage 2,835 9,803 -71.1%
Large Retail Clients (200A) 5,285 - -
Electronic Meters Installed
(thousand units)
480640 670
142
176218
888+72
+9%
Dec/16Dec/15
816
Dec/14
622
+31%
Outside of CommunitiesCommunities
Public Sector
100.8%
82.3%
98.4% 96.5%
Large ConsumersRetail
98.6% 96.3%94.7%
Total
94.6%96.1% 95.5%101.5%97.8%
201620152014
Collection Rate per SegmentAccumulated
99.1% 99.2%
Without Enery Recovery

MANAGEMENT’S REPORT – LIGHT S.A.- 2016
In 2016, the collection rates of the Public Sector and Large Consumers segments are noteworthy,
increasing by 13.2 p.p. and 2.4 p.p., respectively, compared to 2015, evidencing the collection initiatives
and negotiations conducted with clients of all segments.
Operating Quality
2016 was marked by the completion of the transformation works of Rio de Janeiro and by the
establishment of the structure required for the 2016 Olympic Games in Rio. Notwithstanding this
challenging scenario, Light continued to seek the improvement of its processes and was increasingly
focused on its operating management and assertiveness in the use of funds in networks.
DEC for the twelve months ended December 31,
2016 totaled 11.70 hours, an improvement of 7.2%
compared to 2015. FEC reached 6.48x, in line with 2015.
It is worth mentioning that, as a result of the
assertiveness in the establishment of operating
strategies, together with improved management
initiatives regarding field work, indicators continue to improve, reaffirming the commitment of Light in
achieving the targets of the Results Plan agreed with ANEEL in 2016. The Results Plan is a commitment
assumed by Light with the Regulator to adjust the quality indicators regarding supply, customer service,
and occupational safety.
A DEC of 11.70 hours for 2016 is already below the upper limit agreed with ANEEL under the
Results Plan (11.99 hours), according to which new targets were established for the period between 2018
and 2022, as set forth in the 5th Amendment to the Concession Agreement. This result reinforces our
confidence in the achievement of these targets through an investment plan designed for this challenge,
together with an efficient management of funds and
consistency with the new economic and financial
equilibrium following the tariff review.
Customer Service
In 2016, Light’s customer service channels
received investments of R$2.7 million. The strategy
consisted of reducing the costs of customer service
without affecting customers, increasing their
satisfaction and the quality of services provided. As
the main result, Light was the distribution company
in the southeast region with the highest growth in the ANEEL Customer Satisfaction Index (Índice Aneel
de Satisfação do Consumidor – IASC).
The company further increased the share of virtual customer service channels and ensured they
were fully operational, providing prompt responses to any abnormality, improving processes and
procedures, and focusing on access quality and convenience to contact Light.
The improvement in customer service, initiatives on the streets to prevent losses, and investments
made in the energy network show customers the Company’s efforts to provide quality service.
INDICATOR REGULATORY
TARGET
GLOBAL
AMOUNT
Global DEC 11.99 11.70
Global FEC 6.36 6.48
1.3%
1.0%
1.3%
dec-14 dec-15 dec-16
PDD/Gross Revenue Billed Sales - Quarter
+0,3 p.p.

MANAGEMENT’S REPORT – LIGHT S.A.- 2016
Generation
In 2016, the volume of energy sold totaled 4,227.0 GWh, representing a 3.0% increase compared
to 4,101.9 GWh in 2015. The volume of energy sold in the free market (“ACL”) continued to increase
in 2016 and totaled an amount 8.8% higher compared to that of 2015. This result is primarily due to:
(i) the seasonality strategy combined with the increase in the volume of existing agreements; and (ii) the
sale of the hydrological hedge amount in December, which did not occur in 2015.
Generation Projects
As of date, the Company has generation projects under development in its portfolio, aimed at
supplementing its installed capacity, which currently totals 1,024 MW. Below is a brief summary of
Light’s generation projects:
Lajes Small Hydro Power Plant – The project includes the construction of SHPP Lajes, with a generation
unit of 17 MW of installed capacity, at the same location of former HPP Fontes Velha, which was finally
deactivated in 1989. For the implementation, construction, operation and maintenance of SHPP Lajes,
Lajes Energia S.A., a special purpose entity, was established as a closely-held corporation (sociedade
anônima de capital fechado), wholly-owned by Light Energia S.A. Commencement of operations is
expected for the second semester of 2017.
Guanhães Energia – In February 2012, Light Energia acquired 51% of equity interest in Guanhães
Energia S.A. The remaining 49% is held by Cemig. Guanhães Energia is responsible for the
implementation and operation of SHPPs Dores de Guanhães (14MW), Senhora do Porto (12MW),
Fortuna II (9MW), and Jacaré (9MW), totaling 44MW of installed capacity. These SHPPs are located
in the Guanhães river and Corrente Grande river, in the State of Minas Gerais.
Belo Monte – In October 2011, Amazônia Energia, whose members are Light (25.5%) and Cemig
(74.5%), acquired 9.77% of Norte Energia, a company responsible for the construction and operation of
HPP Belo Monte. Located in the Xingu river, in the State of Pará, HPP Belo Monte is 100% Brazilian,
the fourth largest hydro power plant in the world and the largest in Brazil. Its installed capacity totals
11,233 MW, with an average Physical Guarantee of 4,571 MW, sufficient energy to service
approximately 18 million houses.
Renova Energia – Renova Energia operates in the segment of generation of electricity through renewable
alternative sources, such as small hydro power plants (SHPPs) and wind and solar power plants. Renova
Energia has an installed capacity of 1,979 MW, 683.3 MW of which is in operation. Light holds a 15.68%
equity interest in Renova Energia.
On January 12, 2017, Light Energia S.A., together with Renova Energia, entered into an agreement with
AES Tietê Energia to sell the wind farms that comprise the Alto Sertão II complex, with an installed
capacity of 386 MW. The base price of this transaction is R$650 million and includes the purchase of
Energy Sale (GWh) 2016 2015 Var. %
Free Contracting Environment Sales 4,669.9 4,291.0 8.8%
Spot Sales (CCEE) (442.9) (189.1) -134.2%
Total 4,227.0 4,101.9 3.0%
MANAGEMENT’S REPORT – LIGHT S.A.- 2016
shares issued by Renova Eólica Participações S.A. or Nova Energia Holding S.A., companies that
control all 15 special purpose entities that comprise the Alto Sertão II complex. The price is subject to
adjustments in the event certain conditions of the Transaction are met.
Commercialization
In 2016, the commercialization of energy totaled 5,711 GWh, representing a 10.7% increase
compared to 5,158 GWh sold in 2015 due to the following reasons: (i) new sales, especially to customers
that migrated from the captive market to the free market; (ii) the commencement of commercial
operations under the Light II subsidized energy agreement in 4Q16; and (iii) the sale of conventional
energy (hydrological hedge) in 2016.
EBITD6 A increased by 10.8% due to a higher volume of energy sold.
Investments
In 2016, investments made by Light totaled R$953.2 million. The largest amount of investments
was made in the Distribution segment (R$659.0 million), primarily in network reinforcements and
expansion (including investments related to the Olympic Games, in the amount of R$100.1 million) and
initiatives to combat losses. The decrease in Losses is noteworthy, totaling R$108 million, representing
a 30.1% decrease compared to 2015, due to the new strategy to prevent energy theft, which is more cost
intensive. Investments in the Distribution segment decreased by 14.8% in 2016 compared to 2015.
Accordingly, total investments made by the Company in 2016 (without contributions) decreased
by 13.5% compared to 2015, notwithstanding a significant improvement in quality indicators, losses and
payments.
In 2016, Light Energia made investments in the amount of R$45.2 million, representing a 19.7%
decrease compared to 2015, due to the postponement of the commencement of operations of SHPP
Lajes.
Contributions made in assets in which Light holds equity interest (Belo Monte, Renova,
Guanhães, Itaocara, and the Água Limpa Project) totaled R$180.6 million at the end of 2016.
Financial Comments
Financial Performance Net Revenue
Net revenue, excluding construction revenue, totaled R$8,755.6 million, representing a 12.2%
decrease compared to 2015, due to, among other factors, the decrease in the volume of energy sold by
the Distribution Company in 4Q16, affected by an average tariff adjustment of -12.25%, ratified on
November 7, 2016. The impact of this decrease was mitigated by the recovered energy, which added
R$164 million to this line item in the last quarter of the year.
6 EBITDA is not an acknowledged measure under BRGAAP or IFRS. Despite being used by the Company as an additional measure of its operations’ performance, it should not be
analyzed separately or as an alternative to net income or operating income, as a measure of operating performance, or as a liquidity indicator. CVM EBITDA is calculated in accordance with CVM Instruction 527/2012 and represents net income +income and social contribution tax + net financial expenses + depreciation and amortization.

MANAGEMENT’S REPORT – LIGHT S.A.- 2016
Moreover, we also note other deviations that are related to the activities of the Distribution
Company, including: (i) a decrease in non-billed energy; (ii) Spot Short-Term Revenue of R$91.9
million, which did not occur in 2015; and (iii) a worsening in the “Others” line item, which includes a
negative adjustment of R$155.6 million carried out in 4Q16. This adjustment in the “Others” line item
refers to the difference between the new repositioning value (VNR) ratified by ANEEL and the updated
balance of the concession financial asset due to the new regulatory remuneration base ratified in the
tariff review.
Light Energia helped increasing the net revenue of Light S.A., contributing with a higher number
of free market agreements and the sale of hydrological hedge, which totaled R$59.8 million in 2016.
Light Com also helped increasing the net revenue of Light S.A., as its Net Revenue reached R$951
million, representing a 16.5% increase compared to 2015, primarily due to (i) new clients, largely as a
result of their migration from the captive market to the free market, (ii) the effectiveness of a subsidized
energy sale agreement (average of 33 MW) in 4Q16, and (iii) the sale of hydrological hedge in December
2016.
Costs and Expenses
In 2016, consolidated operating costs and expenses, excluding construction costs, totaled
R$7,823.7 million, representing an 11.3% decrease compared to 2015, due to a decrease in losses,
provisions, and costs with the purchase of energy.
Adjusted EBITDA7
In 2016, Adjusted EBITDA totaled R$1,426.8 million, representing an 11.6% decrease
compared to R$1,614.4 million in 2015. EBITDA margin was 16.3%, representing a 0.1 p.p. decrease
compared to the previous year, primarily due to a decrease in revenue of the Distribution Company.
Net Result
In 2016, Light S.A. had a loss of R$312.9 million, primarily due to a 23.7% decrease in the
Adjusted EBITDA of the Distribution Company (which excludes equity in the results of subsidiaries
and non-operating result), affected by non-recurring effects in 4Q16, including: (i) the reversal of
R$144.8 million in Provisions for Contingencies; and (ii) the adjustment of -R$155.6 million regarding
the difference between the VNR ratified by ANEEL and the updated balance of the concession financial
asset. In addition to these factors, the result was also affected by Equity in the Results of Subsidiaries
by R$ 336.4, due to the impairment of Renova and Guanhães.
7 Adjusted EBITDA is calculated starting in the result before taxes and interest, equity pickup, other operating expenses/revenues (non-operating result), financial result,
depreciations and amortizations.
MANAGEMENT’S REPORT – LIGHT S.A.- 2016
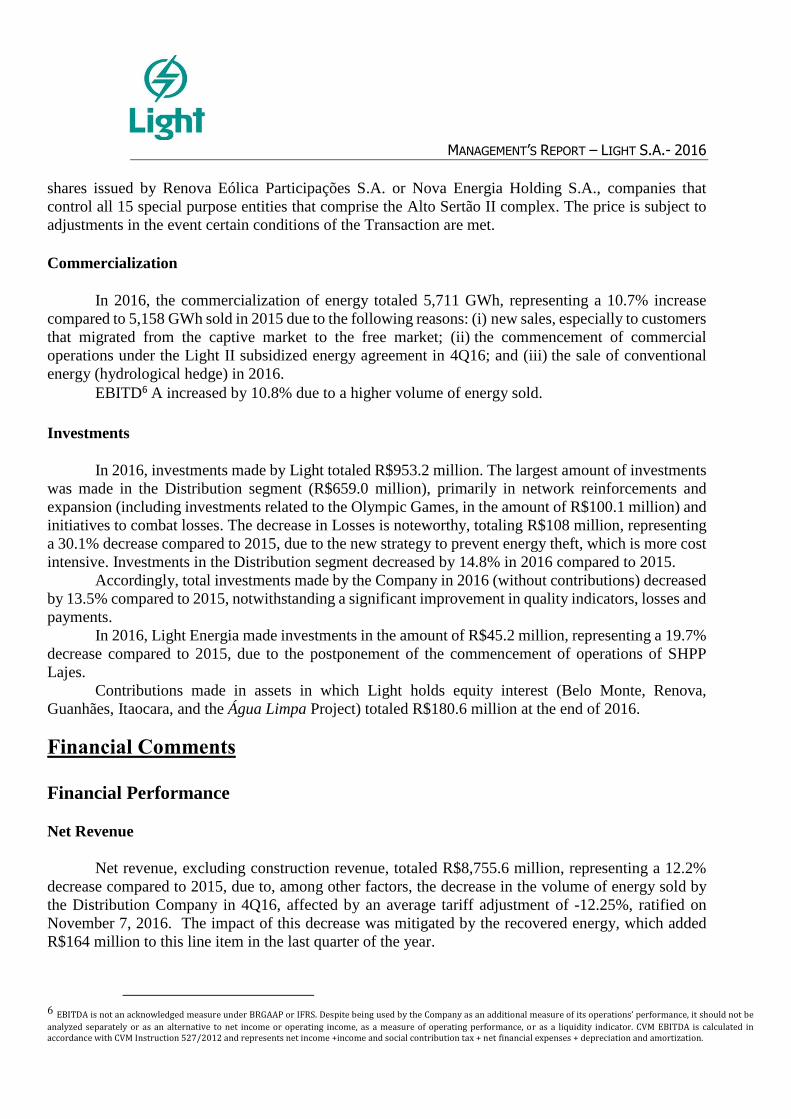
Indebtedness
As of December 31, 2016, the gross
debt of the Company totaled R$6,943.8
million, representing an 8.3% decrease, or
R$630.6 thousand, compared to gross debt
as of December 31, 2015. Net debt totaled
R$6,219.7 million, representing a 4.3%
decrease compared to 2015.
Net debt/EBITDA ratio regarding
covenants 8 was 3.85x in September 2016
and 3.72x in December 2016, below the
upper limit of 3.75x (as of this quarter, this
limit was also set to 3.75x). The
EBITDA/interest expenses ratio regarding covenants in December 2016 was 2.35x, above the lower
limit of 2.0x.
The average maturity term of debt is 2.43 years and the nominal average cost of debt was 15.42%
p.a.
Corporate Governance and Capital Markets
As of December 31, 2016, the capital stock of Light S.A. comprised 203,934,060 common
shares, 78,488,656 of which were outstanding.
The shares issued by Light are listed in the Novo Mercado segment of the BM&F Bovespa since July
2005. The shares issued by the Company are included in the IGC, IEE, IBrX, ISE, ITAG, and IDIV
indices. The shares issued by Light are also traded in the U.S. over-the-counter (OTC) market, through
Level 1 ADRs, under ticker LGSXY.
As to the performance of the shares issued by Light S.A. (LIGT3), they appreciated by 75.4% compared
to 2015. In December 2016, the price per share issued by Light was quoted at R$17.36 compared to
R$9.90 at the end of 2015. The market capitalization (number of shares x price per share) of the
Company was approximately R$3.5 billion at the close of 2016.
The Board of Directors of Light consists of 11 members, two of whom are independent members. Five
committees assist the Board of Directors: Finance Committee, Management Committee, Audit
Committee, Human Resources Committee, and Governance and Sustainability Committee.
Shareholding Structure
As of December 31, 2016, the shareholding structure of Light was comprised as follows: Control
Group (52.13%) and free float (47.87%), of which 9.39% is held by BNDESPar and 38.49% is held by
minority shareholders. The Control Group is, in its turn, comprised of: Companhia Energética de Minas
8 EBITDA for covenants is calculated based on net income (loss) before income tax and social contribution, financial result, depreciation and amortization,
provisions, fair value of the concession's indemnifiable assets
Dec/16 Sep/16 Dec/15
Gross Debt 6,943.8 6,799.9 7,574.4
+ Swap (90.6) (158.1) (582.3)
+ Pension Fund 48.31 47.6 32.0
- Cash 681.8 965.5 522.1
= Net Debt for covenants (a) 6,219.7 5,723.9 6,502.0
EBITDA (12 months) 1,009.4 737.7 1,437.9
- Equity Pickup (336.4) (250.6) (126.4)
+ Provision (223.5) (448.8) (292.1)
- Other Operational Revenues/Expenses (80.9) (50.5) (50.1)
+ Regulatory Assets and Liabilities (CVA) 20.3 0.0 0.0
= EBITDA for covenants (b) 1,670.6 1,487.5 1,906.5
Interests (c) 712.4 720.5 668.0
3.72 3.85 4.16
2.35 2.06 2.85
Covenants Multiple R$ MN
Net Debt / EBITDA (a/b)
EBITDA/Interests (b/c)

MANAGEMENT’S REPORT – LIGHT S.A.- 2016
Gerais (Cemig) (26.06%), Luce Empreendimentos e Participações S.A. (LEPSA) (13.03%), and Rio
Minas Energia S.A. (RME) (13.03%).
Distribution of Dividends
On December 29, 2016, dividends approved by the Shareholders’ Meeting held on April 28,
2016, in the amount of ten million, sixty-eight thousand, seven hundred seven Reais and forty-nine
centavos (R$10,068,707.49) were paid, representing R$0.049372368 per share. The dividend
distribution proposal approved by the Board of Directors on March 28, 2016, for the year ended
December 31, 2015, is compatible with the deleveraging strategy of the Company and cash
reinforcement, in view of the adverse economic scenario and the need to make investments in
distribution.
Commitment to the Future
People Management
In 2016, the company underwent a transition period towards the consolidation of a culture
strongly focused on results, aiming at continuous improvement, cost reduction, optimization of
processes or rethinking of operation models in order to obtain the best return possible. In view of the
crisis, we had to establish strategies to maintain the motivation, commitment, and alignment of
employees to the values of the company.
Accordingly, the company remained focused on its rules of conduct, centered in Safety, Ethics
and Result, i.e., the “Light Way of Being” (“Jeito de SER Light”).
Light started the Performance Management Cycle for Leaderships and Careers Y, whose main
objectives are the alignment between individual performance and business, reinforcement of a culture
of feedback and career self-management, and incentive to meritocracy.
Light maintained its initiatives to ensure quality of life within the company, investing in the
physical and mental health of employees, and contributing to their work motivation and balance between
personal and professional life. The Breastfeeding Support Room was opened, an initiative that, together
with the Healthy Baby (Bebê Saúde) program, the Motherhood Citizenship (Maternidade Cidadã)
program, and the day-care allowance, won Light a certification from the Ministry of Health, as a
company that supports working breastfeeding mothers.
We also highlight the corporate environment, which was assessed in partnership with Great
Place to Work, a world-renowned institute.
Occupational Safety
Light remains focused on the safety of its work force and population, prioritizing investments in
the promotion of health and prevention of accidents through the Vida! Program and communication
campaigns targeting the population about the risks of the energy network.
According to the Vida! Program, we continue to further awareness, training, and process reviews.
We also conduct inspections and audits and manage the performance of occupational health and safety.
These initiatives reduced the accident rate by 4.15% in 2016, from 3.30 to 3.16. The rate of
serious accidents decreased by 66%, from 1,057 to 359. Occupational abstentions decreased by 21%
compared to 2015, from 2.60 to 2.06.

MANAGEMENT’S REPORT – LIGHT S.A.- 2016
It is also worth noting the partnerships between employers’ associations and employees of the
civil construction sector, Senai, technical schools, and government agencies to multiply information on
the safe use of electricity, and further discuss the subject in communities, through lectures, visits, and
service shifts.
Research and Development (R&D)
The purpose of the R&D Program is to support all areas of the company in the development of
methods, software, and systems to improve the company’s activities and offer them to the market for
sale to the electricity sector in general, generating royalties to Light.
Investments in the R&D Program regulated by ANEEL totaled approximately R$8 million, of
which R$6 million was invested in Light SESA and R$2 million in Light Energia, meeting the regulatory
obligation regarding the accounting balance of the R&D account, which is required to total up to twice
the amount of annual mandatory investments.
Environmental Responsibility
The commitment of Light with the rational and adequate use of natural resources, including the
analysis of the company’s vulnerabilities to climate change and the mitigation of impacts, is expressed
in its Environmental Policy and in the Commitments to the Environment and Climate, which cover six
subjects: energy, technology, biodiversity, greenhouse gas emissions (GGE), solid waste, and the quality
of water.
Light’s Environmental Management System (Sistema de Gestão Ambiental – SGA), based on
ISO 14001, assesses and monitors aspects and impacts of its operational complex to ensure compliance
with applicable environmental law. In addition to the ISO 14001 certification, the Company’s power
plants also have ISO 9001 and OHSAS 18001 certifications, concerning quality, occupational health
and safety. This set of certifications comprises the Integrated Management System (Sistema de Gestão
Integrado – SGI), which, in the past 13 years, has been ensuring the excellence of the maintenance and
operation activities of generation of electricity.
Light also stood out in the works of the operations sites related the Olympic Games and in
obtaining environmental licenses for these places. Among others, we highlight the high voltage
distribution line Jacarepaguá-Curicica, responsible for the supply of the entire Olympic Complex. This
line crosses one environmental conservation unit, which required great efforts from Light with
environmental agencies to minimize the impacts generated during construction.
Social Responsibility
In view of the worsening of violence-related issues, Light expanded its partnerships with
Associations of Residents and established a relationship channel that allowed greater communication
with communities and facilitated energy recovery initiatives. Light also started to implement initiatives
in schools located in these communities and vicinities. As a result, meetings with parents, students and
teachers allowed the preparation of additional multiplying agents. These initiatives brought important
information about conscious consumption of energy and the Social Tariff, allowing the rectification of
clients and contributing to a sustainable development.
Under the Energy Efficiency Program (Programa de Eficiência Energética – PEE), Light
invested R$16.8 million in 19 projects and promoted a greater integration of energy efficiency initiatives
to combat energy losses and default. R$8 million was invested in Comunidade Eficiente, a project that

MANAGEMENT’S REPORT – LIGHT S.A.- 2016
involves the exchange of equipment for more efficient equipment and initiatives to foster changes in
habits in favor of a rational and safe consumption of electricity. R$1.5 million was invested in Light
Recicla, which consists of the exchange of recyclable waste for discounts in the energy bill.
As to sponsorships, Light seeks to foster sustainable development and improve the quality of life
of the population of the concession area. The decision to invest in certain projects is related to the
development of the concession area, the generation of income in pacified communities, and the visibility
of the Light brand, which also has an impact on the reduction of losses and default. In 2016, guided by
these criteria, the company raised approximately R$20 million, of which R$3 million was contributed
from Light’s own funds.
Other Information:
Independent Auditors
Pursuant to CVM Instruction No. 381/2003, we inform that Deloitte Touche Tohmatsu Auditores
Independentes provides external audit and quarterly review services to the Light Group and it did not
provide any other service to the Company that was not related to audit services in the year ended
December 31, 2016. The management’s report includes information related to projected investments
and non-financial data that is not part of the audit scope of the financial statements and was not reviewed
by the independent auditors.

MANAGEMENT’S REPORT – LIGHT S.A.- 2016
Balanço Social Anual / 2016Empresa: CONSOLIDADO1 - Base de Cálculo
Receita líquida (RL)
Resultado operacional (RO)
Folha de pagamento bruta (FPB)
2 - Indicadores Sociais Internos Valor (mil R$) % sobre FPB % sobre RL Valor (mil R$) % sobre FPB % sobre RL
Alimentação 31.335 8% 0% 29.139 9% 0%
Encargos sociais compulsórios 72.784 19% 1% 65.518 19% 1%
Previdência privada 9.068 2% 0% 9.261 3% 0%
Saúde 18.324 5% 0% 16.419 5% 0%
Segurança e saúde no trabalho 615 0% 0% 821 0% 0%
Educação 812 0% 0% 828 0% 0%
Cultura 0 0% 0% 0 0% 0%
Capacitação e desenvolvimento profissional 3.033 1% 0% 5.411 2% 0%
Creches ou auxílio-creche 1.311 0% 0% 1.198 0% 0%
Participação nos lucros ou resultados 26.859 7% 0% 25.088 7% 0%
Outros 6.092 2% 0% 4.677 1% 0%
Total - Indicadores sociais internos 170.233 46% 2% 158.360 47% 1%
3 - Indicadores Sociais Externos Valor (mil R$) % sobre RO % sobre RL Valor (mil R$) % sobre RO % sobre RL
Educação 5.402 1% 0% 6.814 1% 0%
Cultura 11.028 1% 0% 21.702 2% 0%
Saúde e saneamento 3.330 0% 0% 0 0% 0%
Esporte 8.924 1% 0% 29.432 3% 0%
Combate à fome e segurança alimentar 0 0% 0% 0 0% 0%
Outros 18.389 2% 0% 61.896 6% 1%
Total das contribuições para a sociedade 47.073 6% 0% 119.844 12% 1%
Tributos (excluídos encargos sociais) 5.446.210 638% 56% 3.816.727 390% 35%
Total - Indicadores sociais externos 5.493.283 644% 57% 3.936.571 402% 36%
4 - Indicadores Ambientais Valor (mil R$) % sobre RO % sobre RL Valor (mil R$) % sobre RO % sobre RL
Investimentos relacionados com a produção/ operação da empresa 51.574 6% 1% 55.374 6% 1%
Investimentos em programas e/ou projetos externos 0 0% 0% 0 0% 0%
Total dos investimentos em meio ambiente 51.574 6% 1% 55.374 6% 1%
Quanto ao estabelecimento de “metas anuais” para minimizar
resíduos, o consumo em geral na produção/ operação e aumentar
a eficácia na utilização de recursos naturais, a empresa5 - Indicadores do Corpo Funcional 2016 2015
Nº de empregados(as) ao f inal do período
Nº de admissões durante o período
Nº de empregados(as) terceirizados(as)
Nº de estagiários(as)
Nº de empregados(as) acima de 45 anos
Nº de mulheres que trabalham na empresa
% de cargos de chefia ocupados por mulheres
Nº de negros(as) que trabalham na empresa
% de cargos de chefia ocupados por negros(as)
Nº de pessoas com deficiência ou necessidades especiais
6 - Informações relevantes quanto ao exercício da
cidadania empresarial
Relação entre a maior e a menor remuneração na empresa
Número total de acidentes de trabalho
Os projetos sociais e ambientais desenvolvidos pela empresa
foram definidos por:
( ) direção ( X ) direção e
gerências
( ) todos(as)
empregados(as)
( ) direção ( X ) direção e
gerências
( ) todos(as)
empregados(as)
Os pradrões de segurança e salubridade no ambiente de trabalho
foram definidos por:
( ) direção e
gerências
( ) todos(as)
empregados(as)
( X ) todos(as) +
Cipa
( ) direção e
gerências
( ) todos(as)
empregados(as)
( X ) todos(as) +
Cipa
Quanto à liberdade sindical, ao direito de negociação coletiva e à
representação interna dos(as) trabalhadores(as), a empresa:
( ) não se envolve ( X ) segue as
normas da OIT
( ) incentiva e
segue a OIT
( ) não se
envolverá
( X ) seguirá as
normas da OIT
( ) incentivará e
seguirá a OIT
A previdência privada contempla:( ) direção ( ) direção e
gerências
( X ) todos(as)
empregados(as)
( ) direção ( ) direção e
gerências
( X ) todos(as)
empregados(as)
A participação dos lucros ou resultados contempla:( ) direção ( ) direção e
gerências
( X ) todos(as)
empregados(as)
( ) direção ( ) direção e
gerências
( X ) todos(as)
empregados(as)
Na seleção dos fornecedores, os mesmos padrões éticos e de
responsabilidade social e ambiental adotados pela empresa:
( ) não são
considerados
( ) são
sugeridos
( X ) são
exigidos
( ) não serão
considerados
( ) serão
sugeridos
( X ) serão
exigidos
Quanto à participação de empregados(as) em programas de
trabalho voluntário, a empresa:
( ) não se envolve ( ) apóia ( x ) organiza e
incentiva
( ) não se
envolverá
( ) apoiará ( X ) organizará e
incentivará
Número total de reclamações e críticas de consumidores(as): na empresa
251.158
no Procon
3.941
na Justiça
42.256
na empresa
Reduzir 10%
no Procon
Reduzir 10%
na Justiça
Reduzir 10%
% de reclamações e críticas atendidas ou solucionadas: na empresa
85%
no Procon
85%
na Justiça
57%
na empresa
100%
no Procon
100%
na Justiça
100%
Valor adicionado total a distribuir (em mil R$):
Distribuição do Valor Adicionado (DVA):
7 - Outras Informações
2016 Valor (mil reais) 2015 Valor (mil reais)
0
0
208
Metas 2017
ND
34
4.327
36,3
10.912.673
978.534
338.246
1.172
138
( ) não possui metas ( ) cumpre de 51 a 75%
( ) cumpre de 0 a 50% (X) cumpre de 76 a 100%
378
8.394
86,55% governo 4,63% colaboradores(as)
0,00% acionistas 11,82% terceiros -3,00% retido
Em 2015: 9.318.582
77,26% governo 3,99% colaboradores(as)
0,11% acionistas 18,35% terceiros 0,30% retido
9.645.237
853.002
373.352
( ) não possui metas ( ) cumpre de 51 a 75%
( ) cumpre de 0 a 50% (X) cumpre de 76 a 100%
1.061
23,60%
1.953
Em 2016: 8.725.810
2016
986
1.008
23,10%
1.910
19,30%
4.085
327
49
183
7.480
19,90%

1
NOTES TO THE PARENT COMPANY AND CONSOLIDATED
FINANCIAL STATEMENTS
FOR THE YEAR ENDED DECEMBER 31, 2016
2
1. OPERATIONS ................................................................................................................................................. 10
2. GROUP’S ENTITIES ........................................................................................................................................ 10
3. APPROVAL AND SUMMARY OF THE MAIN ACCOUNTING PRACTICES ADOPTED IN THE PREPARATION OF
THE FINANCIAL STATEMENTS ................................................................................................................................. 19
4. CASH AND CASH EQUIVALENTS .................................................................................................................... 39
5. MARKETABLE SECURITIES ............................................................................................................................. 39
6. CONSUMERS, CONCESSIONAIRES, PERMISSIONAIRES AND CLIENTS ............................................................ 40
7. RECOVERABLE TAXES .................................................................................................................................... 42
8. DEFERRED TAXES .......................................................................................................................................... 42
9. FINANCIAL ASSETS AND LIABILITIES OF THE SECTOR .................................................................................... 44
10. CONCESSION’S FINANCIAL ASSETS ................................................................................................................ 45
11. OTHER RECEIVABLES ..................................................................................................................................... 46
12. INVESTMENTS ............................................................................................................................................... 47
13. PROPERTY, PLANT AND EQUIPMENT ............................................................................................................ 57
14. INTANGIBLE ASSETS ...................................................................................................................................... 60
15. SUPPLIERS ..................................................................................................................................................... 63
16. TAXES PAYABLE ............................................................................................................................................. 64
17. LOANS AND FINANCING................................................................................................................................ 65
18. DEBENTURES ................................................................................................................................................ 70
19. PROVISIONS .................................................................................................................................................. 73
20. CONTINGENCIES ........................................................................................................................................... 79
21. POST-EMPLOYMENT BENEFITS ..................................................................................................................... 86
22. OTHER PAYABLES .......................................................................................................................................... 92
23. RELATED-PARTY TRANSACTIONS .................................................................................................................. 92
24. SHAREHOLDERS' EQUITY .............................................................................................................................. 95
25. DIVIDENDS .................................................................................................................................................... 96
26. PROFIT SHARING ........................................................................................................................................... 97
27. EARNINGS PER SHARE .................................................................................................................................. 97
28. NET REVENUE ............................................................................................................................................... 98
29. ELECTRIC POWER SUPPLY ............................................................................................................................. 99
30. OPERATING COSTS AND EXPENSES ............................................................................................................. 100
31. ELECTRIC POWER PURCHASED FOR RESALE ............................................................................................... 100
32. FINANCIAL RESULT ...................................................................................................................................... 101
33. RECONCILIATION OF TAXES IN PROFIT OR LOSS ......................................................................................... 101
34. FINANCIAL INSTRUMENTS AND RISK MANAGEMENT................................................................................. 102
35. INSURANCE ................................................................................................................................................. 117
36. SEGMENT REPORTING ................................................................................................................................ 118
37. TARIFF ADJUSTMENT .................................................................................................................................. 120
38. LONG-TERM CONTRACTS ............................................................................................................................ 120
39. NON-CASH TRANSACTIONS ........................................................................................................................ 122
40. SUBSEQUENT EVENTS ................................................................................................................................. 122

3
ASSETS 12.31.2016 12.31.2015 12.31.2016 12.31.2015
Cash and cash equivalents 4 6,332 83,694 668,304 447,441
Marketable securities 5 - - 13,467 74,682
Consumers, concessionaires, permissionaires and clients 6 - - 2,271,871 2,199,230
Inventories - - 38,948 34,960
Taxes and contributions 7 - 86 120,561 90,443
Income tax and social contribution 7 801 561 80,715 86,237
Financial assets of the sector 9 - - - 568,675
Prepaid expenses 8 306 29,493 24,958
Dividends receivable 12 1,317 4,203 819 -
Receivables from services rendered 108 134 89,412 23,597
Receivables from swap transactions 34 - - 87,282 196,145
Other receivables 11 838 1,005 211,605 229,868
TOTAL CURRENT ASSETS 9,404 89,989 3,612,477 3,976,236
Consumers, concessionaires, permissionaires and clients 6 - - 418,068 218,527
Taxes and contributions 7 - - 75,344 85,939
Deferred taxes 8 - - 592,498 496,891
Prepaid expenses - - 148 201
Financial assets of the sector 9 - - - 43,001
Concessions' financial assets 10 - - 3,234,339 2,932,833
Deposits related to litigation 19 410 407 259,698 240,304
Receivables from swap transactions 34 - - 96,970 386,858
Other receivables 11 - - 1,322 2,147
Investments 12 3,345,985 3,628,749 664,440 749,645
Property, plant and equipment 13 672 672 1,638,441 1,709,633
Intangible assets 14 - - 3,736,484 4,059,205
TOTAL NON-CURRENT ASSETS 3,347,067 3,629,828 10,717,752 10,925,184
TOTAL ASSETS 3,356,471 3,719,817 14,330,229 14,901,420
The notes are an integral part of the financial statements.
LIGHT S.A.
(In thousands of reais)
Notes
Consolidated
STATEMENT OF FINANCIAL POSITION
AS AT DECEMBER 31, 2016 AND 2015
Parent Company

4
LIABILITIES 12.31.2016 12.31.2015 12.31.2016 12.31.2015
Trade accounts payable 15 249 526 1,341,800 1,449,642
Taxes and contributions 16 30 143 315,375 356,860
Income tax and social contribution 16 2 3 129,836 15,262
Loans and borrowings 17 - - 1,567,738 1,629,166
Debentures 18 - - 378,589 215,007
Financial liabilities of the sector 9 - - 440,533 -
Payable swap transactions 34 - - 43,312 -
Dividends payable 25 - 51,099 - 51,099
Estimated liabilities 1,563 1,210 60,897 54,478
Post-employment benefits 21 15 12 153 67
Other payables 22 816 860 593,172 627,790
TOTAL CURRENT LIABILITIES 2,675 53,853 4,871,405 4,399,371
Loans and borrowings 17 - - 1,871,001 2,547,976
Debentures 18 - - 3,126,431 3,182,236
Payable swap transactions 34 - - 50,341 720
Taxes and contributions 16 - - 169,789 183,183
Deferred taxes 8 - - 200,125 268,147
Financial liabilities of the sector 9 - - 84,168 -
Provisions 19 - - 417,874 541,434
Unsecured equity interest 12 - - 61,481 -
Post-employment benefits 21 - - 48,308 37,189
Other payables 22 - 901 75,510 76,101
TOTAL NON-CURRENT LIABILITIES - 901 6,105,028 6,836,986
SHAREHOLDERS' EQUITY
Capital stock 24 2,225,822 2,225,822 2,225,822 2,225,822
Profit reserves 24 843,824 1,137,971 843,824 1,137,971
Equity valuation adjustments 24 370,022 390,317 370,022 390,317
Other comprehensive income 24 (85,872) (89,047) (85,872) (89,047)
TOTAL SHAREHOLDERS' EQUITY 3,353,796 3,665,063 3,353,796 3,665,063
TOTAL LIABILITIES AND SHAREHOLDERS' EQUITY 3,356,471 3,719,817 14,330,229 14,901,420
The notes are an integral part of the financial statements.
LIGHT S.A.
Notes
Consolidated
(In thousands of reais)
STATEMENT OF FINANCIAL POSITION
AS AT DECEMBER 31, 2016 AND 2015
Parent Company

5
2016 2015 20162015
Restated
NET REVENUE 28 - - 9,645,237 10,912,673
COST OF OPERATIONS 30 - - (8,042,026) (8,987,319)
Electric power purchased for resale 31 - - (6,167,503) (7,160,923)
Personnel - - (231,420) (191,210)
Material - - (59,647) (17,976)
Outsourced services - - (343,865) (298,388)
Depreciation and amortization - - (452,260) (411,647)
Cost of construction - - (889,632) (936,829)
Other revenues and expenses / costs - - 102,301 29,654
GROSS PROFIT - - 1,603,211 1,925,354
OPERATING EXPENSES (12,565) (11,116) (752,243) (820,420)
General and administrative expenses 30 (10,531) (11,116) (671,321) (770,350)
Other revenues - - 2,126 1,276
Other expenses (2,034) - (83,048) (51,346)
EQUITY IN THE EARNINGS OF SUBSIDIARIES 12 (300,892) 47,078 (336,429) (126,400)
EARNINGS BEFORE THE FINANCIAL RESULT AND TAXES (313,457) 35,962 514,539 978,534
FINANCIAL RESULT 32 520 1,874 (797,514) (854,304)
Revenue 1,000 1,930 147,533 747,591
Expense (480) (56) (945,047) (1,601,895)
RESULT BEFORE INCOME TAX AND SOCIAL CONTRIBUTION (312,937) 37,836 (282,975) 124,230
Current income tax and social contribution 33 - - (190,871) (63,983)
Deferred income tax and social contribution 33 - - 160,909 (22,411)
NET INCOME (LOSS) FOR THE PERIOD (312,937) 37,836 (312,937) 37,836
Attributed to the controlling shareholders (312,937) 37,836 (312,937) 37,836
BASIC AND DILUTED EARNINGS (LOSSES) PER SHARE (R$ / Share) 27 (1.53) 0.19
The notes are an integral part of the financial statements.
Notes
Parent Company Consolidated
LIGHT S.A.
FISCAL YEARS ENDED DECEMBER 31, 2016 AND 2015
(In thousands of reais, except earnings (loss) per share)
STATEMENTS OF OPERATIONS

6
Notes 2016 2015 2016 2015
Profit (Loss) for the year 27 (312,937) 37,836 (312,937) 37,836
Other comprehensive income not reclassified to profit or loss in subsequent periods
Gains (losses) on actuarial liabilities, net of tax effects 21 (3,775) - (3,775) -
Equity accounting on other comprehensive income of jointly-owned subsidiary 12 6,950 8,671 6,950 8,671
TOTAL COMPREHENSIVE INCOME (309,762) 46,507 (309,762) 46,507
Attributed to the controlling shareholders (309,762) 46,507 (309,762) 46,507
The notes are an integral part of the financial statements.
Consolidated
FISCAL YEARS ENDED DECEMBER 31, 2016 AND 2015
STATEMENS OF COMPREHENSIVE INCOME
(In thousands of reais)
LIGHT S.A.
Parent Company

7
NotesCAPITAL
STOCK
LEGAL
RESERVE
RETAINED
EARNINGS
EQUITY
VALUATION
ADJUSTMENTS
OTHER
COMPREHENSIVE
INCOME
RETAINED
EARNINGS
(ACCUMULATED
LOSSES)
TOTAL
BALANCES ON JANUARY 1, 2015 2,225,822 259,516 831,181 409,824 (97,718) - 3,628,625
Total comprehensive income:
Profit for the year 27 - - - - - 37,836 37,836
Other comprehensive income not reclassified to profit or loss in subsequent periods
Equity accounting on other comprehensive income of jointly-owned subsidiary 12 - - - - 8,671 - 8,671
Realization of equity valuation adjustment, net of taxes - - - (19,507) - 19,507 -
Allocation of net income for the year:
Recognition of legal reserve - 2,120 - - - (2,120) -
Minimum mandatory dividends - 25% (R$0.0494 / share) - - - - - (10,069) (10,069)
Recognition of earnings retention reserve - - 45,154 - - (45,154) -
BALANCES ON DECEMBER 31, 2015 2,225,822 261,636 876,335 390,317 (89,047) - 3,665,063
Total comprehensive income:
Profit for the year 27 - - - - - (312,937) (312,937)
Other comprehensive income not reclassified to profit or loss in subsequent periods
Losses on actuarial liabilities, net of tax effects 21 - - - - (3,775) - (3,775)
Equity accounting on other comprehensive income of jointly-owned subsidiary 12 - - - - 6,950 - 6,950
Realization of equity valuation adjustment, net of taxes - - - (20,295) - 18,790 (1,505)
Absorption of loss for the year - - (294,147) - - 294,147 -
BALANCES ON DECEMBER 31, 2016 2,225,822 261,636 582,188 370,022 (85,872) - 3,353,796
The notes are an integral part of the financial statements.
PROFIT RESERVES
LIGHT S.A.
STATEMENTS OF CHANGES IN SHAREHOLDERS' EQUITY - PARENT COMPANY AND CONSOLIDATED
FISCAL YEARS ENDED DECEMBER 31, 2016 AND 2015
(In thousands of reais)
8
Notes 2016 2015 2016 2015
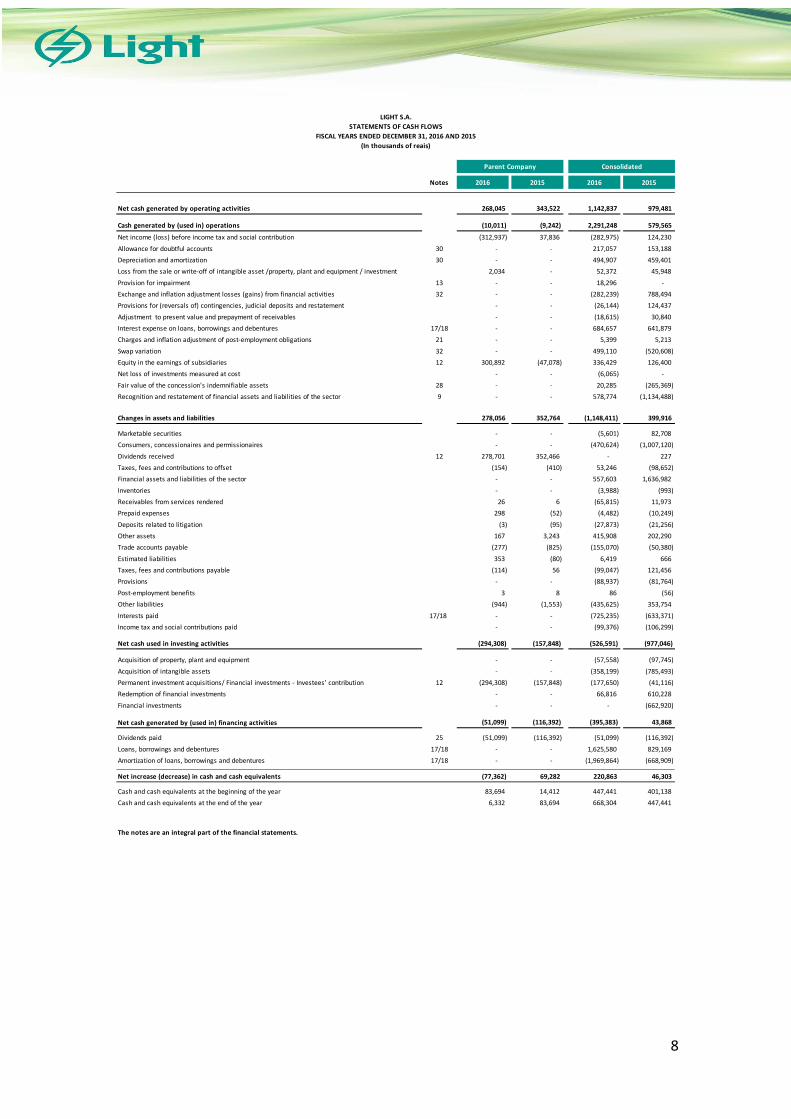
Net cash generated by operating activities 268,045 343,522 1,142,837 979,481
Cash generated by (used in) operations (10,011) (9,242) 2,291,248 579,565
Net income (loss) before income tax and social contribution (312,937) 37,836 (282,975) 124,230
Allowance for doubtful accounts 30 - - 217,057 153,188
Depreciation and amortization 30 - - 494,907 459,401
Loss from the sale or write-off of intangible asset /property, plant and equipment / investment 2,034 - 52,372 45,948
Provision for impairment 13 - - 18,296 -
Exchange and inflation adjustment losses (gains) from financial activities 32 - - (282,239) 788,494
Provisions for (reversals of) contingencies, judicial deposits and restatement - - (26,144) 124,437
Adjustment to present value and prepayment of receivables - - (18,615) 30,840
Interest expense on loans, borrowings and debentures 17/18 - - 684,657 641,879
Charges and inflation adjustment of post-employment obligations 21 - - 5,399 5,213
Swap variation 32 - - 499,110 (520,608)
Equity in the earnings of subsidiaries 12 300,892 (47,078) 336,429 126,400
Net loss of investments measured at cost - - (6,065) -
Fair value of the concession's indemnifiable assets 28 - - 20,285 (265,369)
Recognition and restatement of financial assets and liabilities of the sector 9 - - 578,774 (1,134,488)
Changes in assets and liabilities 278,056 352,764 (1,148,411) 399,916
Marketable securities - - (5,601) 82,708
Consumers, concessionaires and permissionaires - - (470,624) (1,007,120)
Dividends received 12 278,701 352,466 - 227
Taxes, fees and contributions to offset (154) (410) 53,246 (98,652)
Financial assets and liabilities of the sector - - 557,603 1,636,982
Inventories - - (3,988) (993)
Receivables from services rendered 26 6 (65,815) 11,973
Prepaid expenses 298 (52) (4,482) (10,249)
Deposits related to litigation (3) (95) (27,873) (21,256)
Other assets 167 3,243 415,908 202,290
Trade accounts payable (277) (825) (155,070) (50,380)
Estimated liabilities 353 (80) 6,419 666
Taxes, fees and contributions payable (114) 56 (99,047) 121,456
Provisions - - (88,937) (81,764)
Post-employment benefits 3 8 86 (56)
Other liabilities (944) (1,553) (435,625) 353,754
Interests paid 17/18 - - (725,235) (633,371)
Income tax and social contributions paid - - (99,376) (106,299)
Net cash used in investing activities (294,308) (157,848) (526,591) (977,046)
Acquisition of property, plant and equipment - - (57,558) (97,745)
Acquisition of intangible assets - - (358,199) (785,493)
Permanent investment acquisitions/ Financial investments - Investees’ contribution 12 (294,308) (157,848) (177,650) (41,116)
Redemption of financial investments - - 66,816 610,228
Financial investments - - - (662,920)
Net cash generated by (used in) financing activities (51,099) (116,392) (395,383) 43,868
Dividends paid 25 (51,099) (116,392) (51,099) (116,392)
Loans, borrowings and debentures 17/18 - - 1,625,580 829,169
Amortization of loans, borrowings and debentures 17/18 - - (1,969,864) (668,909)
Net increase (decrease) in cash and cash equivalents (77,362) 69,282 220,863 46,303
Cash and cash equivalents at the beginning of the year 83,694 14,412 447,441 401,138
Cash and cash equivalents at the end of the year 6,332 83,694 668,304 447,441
The notes are an integral part of the financial statements.
Parent Company Consolidated
LIGHT S.A.
STATEMENTS OF CASH FLOWS
FISCAL YEARS ENDED DECEMBER 31, 2016 AND 2015
(In thousands of reais)

9
Notes 2016 2015 20162015
Restated
Revenues - - 16,894,444 17,840,549
Sale of goods, products and services - - 16,179,697 17,000,708
Revenue related to the construction of own assets - - 931,804 993,029
Allowance/Reversal of allowance for doubtful accounts 30 - - (217,057) (153,188)
Inputs acquired from third parties (4,961) (4,414) (7,536,297) (8,683,757)
Cost of products, goods and services sold 31 - - (6,167,503) (7,160,923)
Materials, energy, outsourced services and others (4,961) (4,414) (1,368,794) (1,522,834)
Gross value added (4,961) (4,414) 9,358,147 9,156,792
Retentions - - (494,907) (459,401)
Depreciation and amortization 30 - - (494,907) (459,401)
Net value added produced (4,961) (4,414) 8,863,240 8,697,391
Value added received through transfer (299,892) 49,008 (188,896) 621,191
Equity in the earnings of subsidiaries 12 (300,892) 47,078 (336,429) (126,400)
Financial revenues 32 1,000 1,930 147,533 747,591
Total value added to distribute (304,853) 44,594 8,674,344 9,318,582
Distribution of value added (304,853) 44,594 8,674,344 9,318,582
Personnel 7,067 6,191 403,727 371,449
Direct remuneration 6,232 5,732 290,825 281,229
Benefits 261 309 65,909 61,270
Government Severance Fund for Employees (FGTS) 533 150 40,294 23,539
Other 41 - 6,699 5,411
Taxes, fees and contributions 608 609 7,552,438 7,199,286
Federal 608 609 3,600,552 3,505,237
State - - 3,935,841 3,683,047
Local - - 16,045 11,002
Value distributed to providers of capital 409 (42) 1,031,116 1,710,011
Interest 409 (42) 955,798 1,628,193
Rental - - 75,318 66,908
Other - - - 14,910
Value distributed to shareholders (312,937) 37,836 (312,937) 37,836
Dividends - 10,069 - 10,069
Retained earnings (accumulated losses) 27 (312,937) 27,767 (312,937) 27,767
The notes are an integral part of the financial statements.
ConsolidatedParent Company
FISCAL YEARS ENDED DECEMBER 31, 2016 AND 2015
STATEMENTS OF VALUE ADDED
LIGHT S.A.
(In thousands of reais)
10
In thousands of Brazilian reais – R$, unless stated otherwise
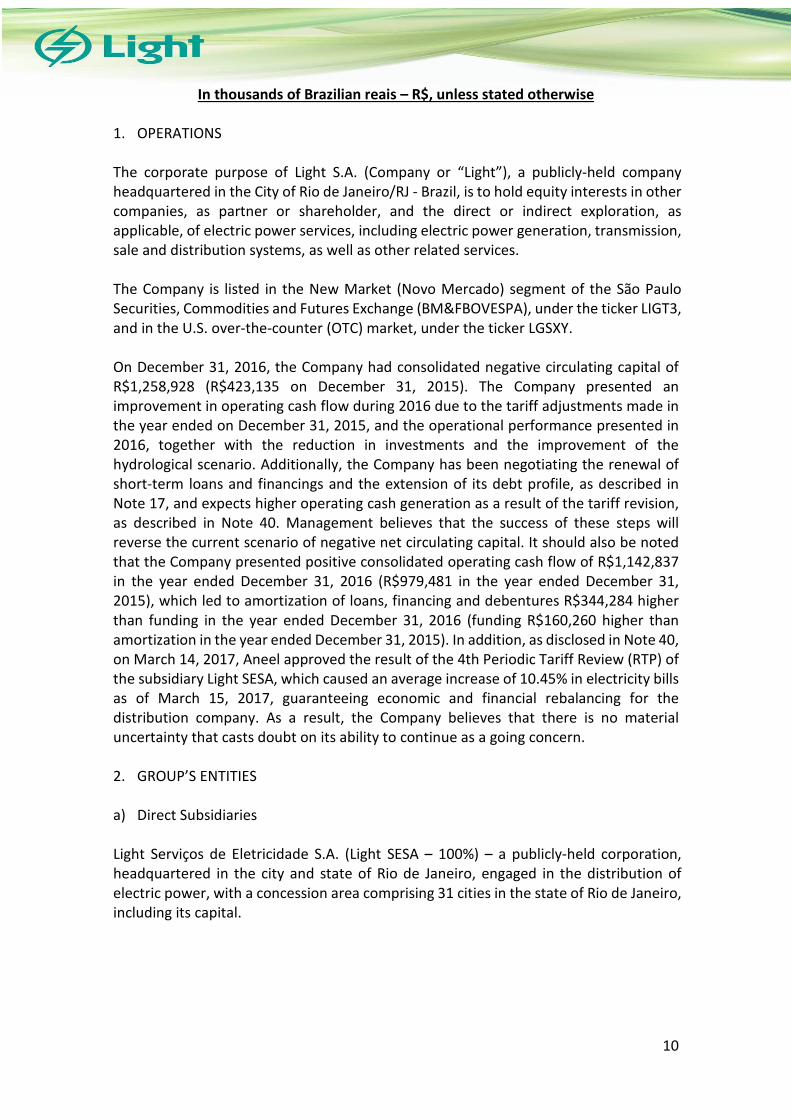
1. OPERATIONS The corporate purpose of Light S.A. (Company or “Light”), a publicly-held company headquartered in the City of Rio de Janeiro/RJ - Brazil, is to hold equity interests in other companies, as partner or shareholder, and the direct or indirect exploration, as applicable, of electric power services, including electric power generation, transmission, sale and distribution systems, as well as other related services. The Company is listed in the New Market (Novo Mercado) segment of the São Paulo Securities, Commodities and Futures Exchange (BM&FBOVESPA), under the ticker LIGT3, and in the U.S. over-the-counter (OTC) market, under the ticker LGSXY. On December 31, 2016, the Company had consolidated negative circulating capital of R$1,258,928 (R$423,135 on December 31, 2015). The Company presented an improvement in operating cash flow during 2016 due to the tariff adjustments made in the year ended on December 31, 2015, and the operational performance presented in 2016, together with the reduction in investments and the improvement of the hydrological scenario. Additionally, the Company has been negotiating the renewal of short-term loans and financings and the extension of its debt profile, as described in Note 17, and expects higher operating cash generation as a result of the tariff revision, as described in Note 40. Management believes that the success of these steps will reverse the current scenario of negative net circulating capital. It should also be noted that the Company presented positive consolidated operating cash flow of R$1,142,837 in the year ended December 31, 2016 (R$979,481 in the year ended December 31, 2015), which led to amortization of loans, financing and debentures R$344,284 higher than funding in the year ended December 31, 2016 (funding R$160,260 higher than amortization in the year ended December 31, 2015). In addition, as disclosed in Note 40, on March 14, 2017, Aneel approved the result of the 4th Periodic Tariff Review (RTP) of the subsidiary Light SESA, which caused an average increase of 10.45% in electricity bills as of March 15, 2017, guaranteeing economic and financial rebalancing for the distribution company. As a result, the Company believes that there is no material uncertainty that casts doubt on its ability to continue as a going concern. 2. GROUP’S ENTITIES a) Direct Subsidiaries
Light Serviços de Eletricidade S.A. (Light SESA – 100%) – a publicly-held corporation, headquartered in the city and state of Rio de Janeiro, engaged in the distribution of electric power, with a concession area comprising 31 cities in the state of Rio de Janeiro, including its capital.

11
Light Energia S.A. (Light Energia – 100%) – a publicly-held corporation, headquartered in the city and State of Rio de Janeiro, whose main activities are to (a) study, plan, construct, operate and explore systems of electric power generation, transmission, sales, and related services that have been legally granted or that may be granted or authorized to it or to companies in which it holds or may come to hold a controlling interest; (b) to hold interests in other companies as a partner, shareholder or quotaholder. It comprises the Pereira Passos, Nilo Peçanha, Ilha dos Pombos, Santa Branca and Fontes Novas plants, with a total installed capacity of 855 MW. Light Energia holds interest in the following subsidiaries and Jointly controlled entity:
• Central Eólica São Judas Tadeu Ltda. (São Judas Tadeu – 100%) - a company at the pre-operational stage whose main activity is the generation and sale of electric power through a wind power plant located in the state of Ceará, with 18 MW nominal power. On December 31, 2016, Management provisioned 100% of this investment because it did not expect future recoverability, considering the Company’s new strategic planning.
• Central Eólica Fontainha Ltda. (Fontainha – 100%) – a company at the pre-operational stage whose main activity is the generation and sale of electric power through a wind power plant located in the state of Ceará, with 16 MW nominal power. On December 31, 2016, Management provisioned 100% of this investment because it did not expect future recoverability, considering the Company’s new strategic planning.
• Lajes Energia S.A. (Lajes Energia – 100%) – a privately-held corporation headquartered in the city of Piraí, in the state of Rio de Janeiro, engaged in the analysis of the technical and economic feasibility, project design, implementation, operation, maintenance and commercial exploration of PCH Lajes, with a nominal capacity of 17 MW. On July 8, 2014, the Authorizing Resolution 4.734/14 was published, transferring the concession of PCH Lajes from Light Energia to Lajes Energia. The construction works of PCH Lajes began in September 2014, and are scheduled to be concluded in the second quarter of 2017(1).
Renova Energia S.A. (Renova Energia – 15.7%, Jointly controlled entity) - a corporation whose main activity is the generation of electric power through renewable alternative sources, such as small hydroelectric power plants (PCHs), and wind and solar power plants. On December 31, 2016, Renova Energia held direct or indirect interests in these sources, totaling 1,979 MW contracted, 683 MW of which in operation or able to operate. Renova Energia is Joinly-controlled by Light Energia (15.7%), RR Participações S.A. (13.7% interest in the controlling interest), which is not a related party, and Cemig Geração e Transmissão S.A. – Cemig GT (34.2%). The main non-controlling shareholders are BNDES Participações S.A. – BNDESPar (7.7%) and Fundo InfraBrasil FIP (9.7%). The companies in which Renova Energia holds interests are listed below:

12
(a) Direct subsidiary of Renova (b) Indirect subsidiary of Renova (c) Renova’s Jointly controlled entity (d) Renova’s direct investee, classified as available for sale by Renova
Guanhães Energia S.A. (Guanhães Energia - 51%, Jointly controlled entity) – a privately-held corporation at the pre-operational stage, headquartered in the city of Ipatinga – MG, was created with the purpose of implementing and exploring four small hydroelectric power plants (PCHs) in the state of Minas Gerais, with total installed capacity of 44 MW. The company is a Jointly controlled entity of Light Energia (51%) and Cemig Geração e Transmissão S.A. – Cemig GT (49%). The project was affected by geological and environmental issues, postponing the estimated date for the PCHs start-up. On August 21, 2015, the PCHs won the Auction A-3, which sold power for a 30-year term for R$205.50/MWh, as of January 2018. On December 15, 2015, the Building Consortium agreement for the PCHs was terminated and the new availability dates for commercial start-up shall only be defined after the recontracting of the remaining scope to continue and conclude the implementation of the project. Guanhães Energia is taking all the necessary measures to conclude the negotiations to recontract the remaining scope. Light Esco Prestação de Serviços S.A. (Light Esco – 100%) – a privately-held corporation, headquartered in the city and state of Rio de Janeiro, whose main activity is the purchase, sale, import, export of electric power, thermal power, gas and industrial utilities, and provision of advisory services in the energy sector.
Enerbras Centrais Elétricas S.A. (a) 100.00% Centrais Eólicas Imburana Macho S.A. (b) 99.99% Centrais Eólicas Umburanas 1 S.A. (a) 99.00%
Energética Serra da Prata S.A. (b) 99.99% Centrais Eólicas Amescla S.A. (b) 99.99% Centrais Eólicas Umburanas 2 S.A. (a) 99.00%
Renova PCH Ltda. (a) 99.00% Centrais Eólicas Umbuzeiro S.A. (b) 99.99% Centrais Eólicas Umburanas 3 S.A. (a) 99.00%
Chipley SP Participações S.A. (a) 99.99% Centrais Eólicas Pau d'Água S.A. (b) 99.99% Centrais Eólicas Umburanas 4 S.A. (a) 99.00%
Renova Eólica Participações S.A. (Holding) (b) 100.00% Centrais Eólicas Manineiro S.A. (b) 99.99% Centrais Eólicas Umburanas 5 S.A. (a) 99.00%
Centrais Eólicas da Prata S.A. (b) 99.99% Centrais Eólicas Anisío Teixeira S.A. (a) 99.00% Centrais Eólicas Umburanas 6 S.A. (a) 99.00%
Centrais Eólicas dos Araçás S.A. (b) 99.99% Centrais Eólicas Cabeça de Frade S.A. (a) 99.00% Centrais Eólicas Umburanas 7 LTDA. (a) 99.00%
Centrais Elétricas Morrão S.A. (b) 99.99% Centrais Eólicas Canjoão S.A. (a) 99.00% Centrais Eólicas Umburanas 8 LTDA. (a) 99.00%
Centrais Elétricas Seraíma S.A. (b) 99.99% Centrais Eólicas Carrancudo S.A. (a) 99.00% Centrais Eólicas Umburanas 9 LTDA. (a) 99.00%
Centrais Elétricas Tanque S.A. (b) 99.99% Centrais Eólicas Ipê Amarelo S.A. (a) 99.00% Centrais Eólicas Umburanas 10 LTDA. (a) 99.00%
Centrais Eólicas Ventos do Nordeste S.A. (b) 99.99% Centrais Eólicas Jequitiba S.A. (a) 99.00% Centrais Eólicas Umburanas 11 LTDA. (a) 99.00%
Centrais Eólicas Ametista S.A. (b) 99.99% Centrais Eólicas Macambira S.A. (a) 99.00% Centrais Eólicas Umburanas 12 LTDA. (a) 99.00%
Centrais Elétricas Borgo S.A. (b) 99.99% Centrais Eólicas Tamboril S.A. (a) 99.00% Centrais Eólicas Umburanas 13 LTDA. (a) 99.00%
Centrais Eólicas Caetité S.A. (b) 99.99% Centrais Eólicas Tingui S.A. (a) 99.00% Centrais Eólicas Umburanas 14 LTDA. (a) 99.00%
Centrais Elétricas Dourados S.A. (b) 99.99% Centrais Eólicas Alcacuz S.A. (a) 99.00% Centrais Eólicas Umburanas 15 LTDA. (a) 99.00%
Centrais Eólicas Espigão S.A. (b) 99.99% Centrais Eólicas Caliandra S.A. (a) 99.99% Centrais Eólicas Umburanas 16 LTDA. (a) 99.00%
Centrais Elétricas Maron S.A. (b) 99.99% Centrais Eólicas Cansação S.A. (a) 99.00% Centrais Eólicas Umburanas 18 LTDA. (a) 99.00%
Centrais Eólicas Pelourinho S.A. (b) 99.99% Centrais Eólicas Embiriçu S.A. (a) 99.00% Renova Comercializadora de Energia S.A. (a) 100.00%
Centrais Eólicas Pilões S.A. (b) 99.99% Centrais Eólicas Ico S.A. (a) 99.99% Centrais Eólicas Bela Vista XV LTDA. (a) 99.00%
Centrais Elétricas Serra do Espinhaço S.A. (b) 99.99% Centrais Eólicas Imburana de Cabão S.A. (a) 99.00% Centrais Eólicas Itapuã IV LTDA. (a) 99.00%
Nova Energia Holding S.A. (a) 99.99% Centrais Eólicas Jataí S.A. (b) 99.99% Centrais Eólicas Itapuã V LTDA. (a) 99.00%
Centrais Eólicas Abil S.A. (b) 99.99% Renovapar S.A. (a) 100.00% Centrais Eólicas Itapuã VII LTDA. (a) 99.00%
Centrais Eólicas Acácia S.A. (b) 99.99% Centrais Eólicas Lençóis S.A. (a) 99.00% Centrais Eólicas Itapuã XV LTDA. (a) 99.00%
Centrais Eólicas Angico S.A. (b) 99.99% Centrais Eólicas Conquista S.A. (a) 99.00% Centrais Eólicas Itapuã XX LTDA. (a) 99.00%
Centrais Eólicas Folha da Serra S.A. (b) 99.99% Centrais Eólicas Coxilha Alta S.A. (a) 99.00% Centrais Eólicas Angelim S.A. (b) 99.99%
Centrais Eólicas Jabuticaba S.A. (b) 99.99% Alto Sertão Participações S.A. (Holding) (a) 99.99% Centrais Eólicas Facheio S.A. (b) 99.99%
Centrais Eólicas Jacarandá do Serrado S.A. (b) 99.99% Diamantina Eólica Participações S.A. (Holding) (b) 99.99% Centrais Elétricas Sabiu S.A. (b) 99.99%
Centrais Eólicas Taboquinha S.A. (b) 99.99% Centrais Eólicas São Salvador S.A. (b) 99.99% Centrais Eólicas Barbatimão S.A. (b) 99.99%
Centrais Eólicas Tabua S.A. (b) 99.99% Centrais Elétricas Botuquara S.A. (a) 99.00% Centrais Eólicas Juazeiro S.A. (b) 99.99%
Centrais Eólicas Vaqueta S.A. (b) 99.99% Centrais Eólicas Cedro S.A. (b) 99.99% Centrais Eólicas Putumuju S.A. (a) 99.00%
Centrais Eólicas Unha d'Anta S.A. (b) 99.99% Centrais Elétricas Itaparica S.A. (a) 99.00% Brasil PCH S.A. (c) 51.00%
Centrais Eólicas Vellozia S.A. (b) 99.99% Centrais Eólicas Bela Vista XIV S.A. (a) 99.00% CMNPAR Fifty Four Participações S.A. (a) 99.99%
Ventos de São Cristóvão Energias Renováveis S.A. (b) 99.00% Parque Eólico Iansã LTDA (a) 99.99% Espra Holding S.A. (a) 99.00%
Bahia Holding S.A. (a) 99.00% Terraform Global Inc (d) 11.66%
Interest - RENOVA ENERGIA

vs vsvsvsvs
13 (1) Information on estimated start-up was not audited by independent auditors.
Lightcom Comercializadora de Energia S.A. (Lightcom – 100%) – a privately-held corporation, headquartered in the city and state of São Paulo, engaged in the purchase, sale, import, export and provision of advisory services in the energy sector. Itaocara Energia Ltda. (Itaocara Energia – 100%) – a company at the pre-operational stage, primarily engaged in the design, construction, installation, operation and exploration of electric power generation plants. It holds interest in the UHE Itaocara Consortium for the exploration of the Itaocara Hydroelectric Power Plant (51%). Cemig GT has a 49% interest. On April 30, 2015, the UHE Itaocara Consortium won the Auction A-5 conducted by ANEEL for the concession of Itaocara I Hydroelectric Power Plant. The project will be constructed at Paraíba do Sul River and will have installed capacity of 150 MW. On October 23, 2015, the concession agreement was signed by UHE Itaocara Consortium. On April 26, 2016, the concession was transferred to Usina Hidrelétrica Itaocara S.A. The power plant is expected to begin operations in 2019(1). Itaocara Energia holds interest in the following jointly-owned entity:
• Usina Hidrelétrica Itaocara S.A. (Hidrelétrica Itaocara – 51%, jointly-owned subsidiary) – a privately held corporation at the pre-operational stage, headquartered in the city of Rio de Janeiro – RJ. Jointly-controlled by Itaocara Energia (51%) and Cemig GT (49%), the Company was created to build the Itaocara Hydroelectric Power Plant and its purpose is the concession to use public assets to explore the Itaocara I Hydroelectric Power Plant, pursuant to the Concession Agreement 01/2015 entered into with the Brazilian Federal Government.
Light Soluções em Eletricidade Ltda. (Light Soluções - 100%) – a limited liability company whose main activity is to provide services to low voltage clients, including the assembly, remodeling and maintenance of facilities in general. Instituto Light para o Desenvolvimento Urbano e Social (Instituto Light - 100%) - a non-profit private company, engaged in participating in social and cultural projects, focused on the cities’ social and economic development, affirming the Company’s ability to be socially responsible. b) Jointly-owned subsidiaries
Lightger S.A. (Lightger) – a privately held corporation whose purpose is to participate in auctions for concessions, authorizations and permissions for new electric power plants. The Paracambi small hydroelectric power plant (PHC) began operating in the third quarter of 2012. The company is jointly controlled by Light S.A. (51%) and Cemig GT (49%). Axxiom Soluções Tecnológicas S.A. (Axxiom) – a privately held corporation, headquartered in the city of Belo Horizonte, state of Minas Gerais, whose purpose is to offer technology solutions and systems for the operational management of public utility

vs vsvsvsvs
14 (1) Information on estimated start-up was not audited by independent auditors.
concessionaires, including electric power, gas, water and sewage companies. It is jointly controlled by Light S.A. (51%) and Companhia Energética de Minas Gerais - CEMIG (49%). Energia Olímpica S.A. (Energia Olímpica) – a privately held corporation, headquartered in the city and state of Rio de Janeiro, whose main activity is to implement the Vila Olímpica substation and two 138 kV underground lines which are connected to the substation. It is jointly controlled by Light S.A. (50.1%) and Furnas Centrais Elétricas S.A. - Furnas (49.9%). The Vila Olímpica substation was concluded, and the Company does not expect any material effects from the Energia Olímpica’s settlement. Amazônia Energia Participações S.A. (Amazônia Energia) – a privately held corporation whose purpose is to hold an interest, as a shareholder, in Norte Energia S.A. (NESA), which holds the concession for the use of public assets to explore the Belo Monte Hydroelectric Power plant, on Xingu River, in the state of Pará. The company is jointly controlled by Light S.A. (25.5%) and Cemig GT (74.5%). Amazônia Energia holds a 9.8% interest in NESA, with significant influence on management, but without joint control. On August 26, 2010, NESA signed the Concession Agreement No. 001/10 with the federal government through the Ministry of Mines and Energy (MME) to explore electric power generation services, with a 35-year term as of the referred agreement’s date of signature. Still according to referred agreement, 70% of the power plant’s assured energy will be destined to the regulated market, 10% to self-producers and 20% to the free market (ACL). NESA will also rely on significant amounts of organization, development and pre-operation costs to complete the plant, which, according to estimates and projections should be absorbed by revenue from future operations. The last Generating Unit is expected to begin its operations in January 2019 (1). Still in relation to NESA, the Eletrobras Group, which holds 49.98% of Norte Energia’s capital stock, hired a law firm specialized in corporate investigation to ascertain possible irregularities in projects in which the Eletrobras Group’s companies corporately participate or hold minority interests. The final reports of the independent internal investigation include certain findings with estimated impacts on the financial statements of Norte Energia. It was concluded that the amount attributed to possible overbilling arising from bribes and / or fraudulent bids and activity considered of illicit nature was R$183,000 in Norte Energia, generating an effect of R$4,559 on the Company. The impact was fully recognized in the results for the year ended December 31, 2015.
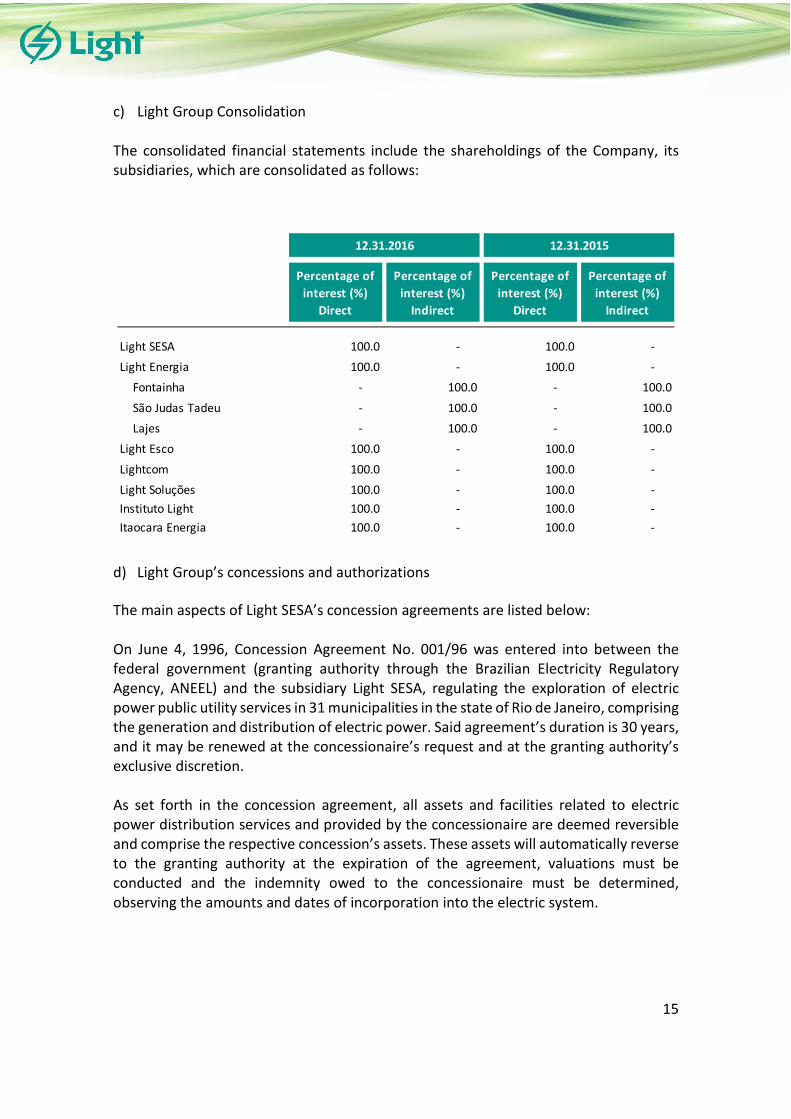
vs vsvsvsvs
15
c) Light Group Consolidation The consolidated financial statements include the shareholdings of the Company, its subsidiaries, which are consolidated as follows:
d) Light Group’s concessions and authorizations The main aspects of Light SESA’s concession agreements are listed below: On June 4, 1996, Concession Agreement No. 001/96 was entered into between the federal government (granting authority through the Brazilian Electricity Regulatory Agency, ANEEL) and the subsidiary Light SESA, regulating the exploration of electric power public utility services in 31 municipalities in the state of Rio de Janeiro, comprising the generation and distribution of electric power. Said agreement’s duration is 30 years, and it may be renewed at the concessionaire’s request and at the granting authority’s exclusive discretion. As set forth in the concession agreement, all assets and facilities related to electric power distribution services and provided by the concessionaire are deemed reversible and comprise the respective concession’s assets. These assets will automatically reverse to the granting authority at the expiration of the agreement, valuations must be conducted and the indemnity owed to the concessionaire must be determined, observing the amounts and dates of incorporation into the electric system.
Percentage of
interest (%)
Direct
Percentage of
interest (%)
Indirect
Percentage of
interest (%)
Direct
Percentage of
interest (%)
Indirect
Light SESA 100.0 - 100.0 -
Light Energia 100.0 - 100.0 -
Fontainha - 100.0 - 100.0
São Judas Tadeu - 100.0 - 100.0
Lajes - 100.0 - 100.0
Light Esco 100.0 - 100.0 -
Lightcom 100.0 - 100.0 -
Light Soluções 100.0 - 100.0 -
Instituto Light 100.0 - 100.0 -
Itaocara Energia 100.0 - 100.0 -
12.31.201512.31.2016
vs vsvsvsvs
16
The concessionaire’s main obligations provided for in the concession agreement are: i. To provide electric power to consumers located within its concession area, according to the tariffs ratified by the granting authority, within the levels of quality and continuity provided for by the legislation; ii. To conduct the works necessary to provide concession services, so as to ensure the continuity, regularity, quality and efficiency of services; iii. To maintain records and inventory of concession-related assets and ensure their integrity. The sale, assignment or pledging as guarantee of real estate properties or essential parts of the facilities depend on the granting authority’s prior and express authorization; iv. To comply with and ensure compliance with legal and regulatory service standards, answering before the granting authority, users and third parties for any damages caused by the exploration of services; v. To meet all the tax, labor and social security liabilities and charges deriving from regulatory rules laid down by the granting authority; vi. To allow the granting authority’s inspectors free access to the works, equipment and facilities used in the provision of services, as well as its accounting records, at any time; vii. To report to the granting authority and users, according to specific legal and regulatory provisions, on the management of concession services; viii. To maintain the electric power and water reserves required to provide the public utility service; ix. To comply with environmental protection laws, being liable for any consequences due to non-compliances; x. To conduct training programs, so as to permanently ensure the improvement of quality and efficiency in the provision of concession services; xi. To participate in planning for the sector and the drafting of the National Electric System expansion plans, implementing and ensuring compliance with technical and administrative recommendations deriving therefrom within its concession area; xii. To adhere to the National System of Electric Power Transmission and ensure free access to its transmission and distribution systems; xiii. To operate its facilities in accordance with the prevailing rules. The concessionaire shall accept and apply any new resolutions, recommendations and
vs vsvsvsvs
17
instructions issued by ANEEL, the National System Operator (ONS) and Energy Research Company (EPE); xiv. To observe, pursuant to the prevailing laws, the limits of maximum and minimum downstream flow control of its hydroelectric developments, and consider in the operational rules the allocation of downtime volume in its power plant reservoirs, so as to minimize adverse effects from floods; xv. When determined by the granting authority, to supply electric power to other concessionaires and interconnections, as required, in accordance with the planning to supply the market. Light SESA is entitled to charge from consumers the tariffs established and ratified by the granting authority for the execution of services. The tariffs will be adjusted yearly and the concessionaire’s revenue will be divided into two portions: Portion A (composed of non-manageable costs) and Portion B (efficient operating costs and costs of capital). The annual tariff adjustment aims at transferring non-manageable costs and monetarily restating manageable costs. The periodic tariff revision is carried out every five years to reestablish the concession’s economic and financial balance. In this process, ANEEL re-calculates the tariffs, taking into account changes in the cost structure and the concessionaire’s market, stimulating efficient and reasonable tariffs. Adjustments and revisions are tariff restatement mechanisms, both provided for in the concession agreement. The concessionaire may also request an extraordinary revision whenever any event causes any relevant economic and financial imbalance at the concession. The concession may be extinguished by the expiration of the agreement, service absorption, forfeiture, termination, irregularities or bankruptcy of the concessionaire. The concessionaire’s majority controlling interest cannot be transferred without the granting authority’s prior consent. In the event shares representing the controlling interest are transferred, the new controlling shareholder shall sign an instrument of consent and submission to the clauses of the concession agreement and the concession’s legal and regulatory rules. In March 2017, the subsidiary Light SESA signed an amendment to the concession agreement whereby it undertook new obligations related to service quality indicators; adhered to clauses related to financial and economic monitoring and Portion A neutrality; and changed the adjustment date to March 2017. This amendment introduces significant changes to the concession agreement, mainly a new breakdown of the tariff calculation, in which the portion that remains with the distribution company - Portion B - is calculated at each Tariff Adjustment through a specific component that is less susceptible to changes in Portion A (which includes

vs vsvsvsvs
18
Sectorial Charges, Transmission Costs and Energy Acquisition). Other important aspects include:
i. Extension of the neutrality concept to all items of Portion A
ii. Inclusion of the cost with Unrecoverable Revenues (annually adjusted) in Portion A
iii. Mitigation of risks with Other Revenues, which are calculated every year
iv. Possibility of considering the projections of Portion A items in the tariff calculation, thus reducing the CVA risk
v. Expansion and flexibilization of the system for the application of the X Factor
It is also worth noting that, with this amendment, the Company undertakes to achieve certain financial and economic sustainability and service quality indicators. These indicators are designed to monitor the distribution company’s economic and financial health, as well as ensure the provision of high-quality services to end consumers. The chart below summarizes the Light Group’s concessions and authorizations effective on December 31, 2016:
Concessions / authorizations Date Maturity Date
Light SESA and Light Energia Jun/1996 Jun/2026
PCH Paracambi - Lightger Feb/2001 Feb/2031
PCH Lajes - Lajes Energia Jul/2014 Jun/2026
Centrais Eólicas - Renova Energia LER 05/2010 Mar/2011 to May/2011 Mar/2046 to May/2046
Centrais Eólicas - Renova Energia LEN 02/2011 (A-3) Mar/2012 and Apr/2012 Mar/2047 and Apr/2047
Centrais Eólicas - Renova Energia LEN 06/2012 (A-5) May/2013 May/2048
Centrais Eólicas - Renova Energia LER 05/2013 Mar/2014 Mar/2049
Centrais Eólicas - Renova Energia LEN 10/2013 (A-5) Nov/2013 to Aug/2014 Nov/2048 to Aug/2049
Centrais Eólicas - Renova Energia LEN 06/2014 (A-5) Jun/2015 to Aug/2015 Jun/2049 to Aug/2049
Centrais Eólicas - Renova Energia LER 08/2014 Jun/2015 Jun/2049
PCH Cachoeira da Lixa - Renova Energia Dec/2003 Dec/2033
PCH Colino 2 - Renova Energia Dec/2003 Dec/2033
PCH Colino 1 - Renova Energia Dec/2003 Dec/2033
Brasil PCH S.A - Renova Energia Dec/1999 to Nov/2003 Dec/2029 to Nov/2033
PCH Dores de Guanhães - Guanhães Energia Nov/2002 Nov/2032
PCH Senhora do Pôrto - Guanhães Energia Oct/2002 Oct/2032
PCH Jacaré - Guanhães Energia Oct/2002 Oct/2032
PCH Fortuna II - Guanhães Energia Dec/2001 Dec/2031
Itaocara HPP Consortium Oct/2015 Oct/2045
vs vsvsvsvs
19
3. APPROVAL AND SUMMARY OF THE MAIN ACCOUNTING PRACTICES ADOPTED IN THE PREPARATION OF THE FINANCIAL STATEMENTS
The authorization for the conclusion of the financial statements was given by the Company’s Management on March 23, 2017. The Company’s financial statements comprise the financial statements of the Parent Company, identified as Parent Company, and the consolidated financial statements, identified as Consolidated, prepared in accordance with the accounting practices adopted in Brazil and the International Financial Reporting Standards (“IFRSs”) issued by the International Accounting Standards Board (IASB). The accounting practices adopted in Brazil comprise those in Brazilian Corporate Law and the pronouncements, guidelines and technical interpretations issued by the Brazilian Accounting Pronouncement Committee and approved by the Federal Accounting Council (CFC) and the Brazilian Securities and Exchange Commission (CVM). As there is no difference between the consolidated equity and consolidated income attributable to the parent company’s shareholders, recorded in the consolidated financial statements and the parent company’s equity and results recorded in the parent company financial statements, both of them prepared in accordance with the accounting practices adopted in Brazil and with the IFRS, the Company has chosen to present the parent company and consolidated financial statements as a single set, side by side. The Company’s Management believes that all relevant information from the financial statements, and only this information, is being highlighted, and that they correspond to the information used by Management. These financial statements are presented in Brazilian Real, which is the functional currency of the Company, its subsidiaries and jointly-owned subsidiaries. All financial information presented in Real was rounded up thousands, except when indicated otherwise. The accounting policies described in detail below have been applied consistently to all fiscal years presented in these financial statements. a) Basis of consolidation
i. Investment in subsidiaries and jointly-owned subsidiaries
Subsidiaries are all the entities (including Special Purpose Entities) in which the Company has the following attributes: (i) power over the investee; (ii) exposure to, or rights over, variable returns resulting from its involvement with the investee; (iii) capacity to use its power over the investee to affect the value of its returns. Joint venture arrangements, which involve the organization of a separate entity in which each owner holds an interest, are
vs vsvsvsvs
20
called jointly-owned subsidiaries. In the consolidated financial statements, interests in joint ventures are recognized as investments and accounted by the equity income method. The financial statements of subsidiaries and jointly-owned subsidiaries are included in the Company’s financial statements from the date when control or shared control begins until the date when control or shared control ceases to exist. The accounting policies adopted by the subsidiaries and jointly-owned subsidiaries are aligned with the policies adopted by the Group.
ii. Jointly-owned operations
A jointly-owned operation is an operation in which owners use their own assets for the purposes of the jointly-owned operations. The consolidated financial statements include the assets the Group controls and the liabilities incurred during the course of the activities of the joint operations, the expenses incurred by the Group and its share of revenues from the joint operations.
iii. Transactions eliminated in the consolidation
Intragroup balances and transactions, and any unrealized revenues or expenses derived from intragroup transactions, are eliminated in the preparation of the consolidated financial statements. Unrealized gains in transactions with investees accounted for by the equity method are eliminated against the relevant investment in proportion to the Group’s interest in the investee.
b) Financial instruments
i. Non-derivative financial assets
The Company initially recognizes financial assets on the inception date. All other financial assets (including assets designated at fair value through profit and loss) are initially recognized on the date of negotiation on which the Company becomes one of the parties to the contractual provisions.
The Company derecognizes a financial asset when the contractual rights to the asset’s cash flows expire, or when the Company transfers the rights to receive contractual cash flows over a financial asset in a transaction in which essentially all risks and benefits inherent in the ownership of the financial asset are transferred. Occasional interest created or held by the Company in financial assets is recorded as individual assets or liabilities. The Company classifies non-derivative financial assets in the following categories: financial assets measured at fair value through profit and loss, loans and receivables and available-for-sale financial assets.
vs vsvsvsvs
21
Financial assets measured at fair value through profit or loss
A financial asset is classified at fair value through profit and loss if it is classified as held for trading or is designated as such at the moment of its initial recognition. Financial assets are designated at fair value through profit and loss if the Company manages such investments and makes purchase and sale decisions based on their fair values, in accordance with its risk management and investment strategy. Transaction costs are recorded in the income statement when incurred. Financial assets recorded at fair value through profit and loss are measured at fair value and changes to the asset’s fair value are recognized in the income statement. Financial assets designated at fair value through profit and loss comprise marketable securities. Loans and receivables
Financial assets with fixed or determinable payments, which are not priced on the active market. These assets are initially recorded at fair value plus any attributable transaction costs. After initial recognition, loans and receivables are measured at amortized cost through the effective interest rate method, less any impairment losses. Loans and receivables comprise cash and cash equivalents, trade accounts receivable, receivables from services provided, financial assets of the sector and other receivables. Available-for-sale financial assets
They are non-derivative financial assets not classified as loans and receivables, held to maturity or at fair value through profit or loss. After initial recognition, the interest calculated by the effective interest rate method and the adjustment of cash flow expectations are recognized in the income statement, while the other changes in the fair value are recognized in other comprehensive income. The result accumulated in other comprehensive income is transferred to the income statement for the fiscal year at the time the asset is realized. Available-for-sale financial assets comprise the concessions’ financial assets. This instrument is classified as available for sale because it cannot be classified in the other categories. As Management believes that indemnification will be based on the current tariff pricing model, it would not be possible to record this instrument as loans and receivables, as the indemnification will not be fixed or determinable and as its recoverable amount is not known on this date, due to reasons other than credit
vs vsvsvsvs
22
deterioration. This is mainly due to the risk of non-recognition of part of these assets by the regulatory agency and their respective replacement prices based on the New Replacement Value (NRV) criterion at the end of the concession. See Note 10.
ii. Non-derivative financial liabilities
The Company initially recognizes debt securities issued and subordinated liabilities on the inception date. All the other financial liabilities are initially recognized on the date of negotiation when the Company becomes a party to the instrument’s contractual provisions. The Company writes-off a financial liability when its contractual obligations are withdrawn or cancelled or extinguished. The Company classifies non-derivative financial liabilities under other financial liabilities. Such financial liabilities are initially recognized at fair value plus any attributable transaction costs. After initial recognition, these financial liabilities are measured at amortized cost through the effective interest rate method. The Company has the following non-derivative financial liabilities: loans and financing, debentures, suppliers, financial liabilities of the sector and other payables.
iii. Derivative financial instruments
The Company operates with derivative financial instruments to hedge against foreign exchange variation and interest rate risks.
Derivatives are initially recognized at fair value and attributable transaction costs are recognized in the income statement as incurred. After initial recognition, derivatives are measured at fair value and changes in the fair value are immediately accounted for in the income statement. Derivatives comprise swap transactions.
c) Cash and cash equivalents
They include cash, bank deposits and highly liquid financial investments, originally due within three months from the contracting date or subject to immaterial risk of change in value, held to meet short-term cash commitments, and not for investment or other purposes.

vs vsvsvsvs
23
d) Concessions' financial assets
The Company recognizes a financial asset deriving from concession agreements when it has an unconditional right to receive cash or another financial asset from the granting authority or a party designated by it at the end of the concession, pursuant to the agreement, as an indemnification for the construction services performed and not received through the provision of services related to the concession. These financial assets are measured at fair value at initial recognition (NRV) and classified as available for sale. The Company adopted the bifurcated model to recognize the financial asset resulting from the indemnification by the granting authority and the right of exploration of the concession, which is classified under intangible assets.
e) Financial assets and liabilities of the sector As of the signature of amendment to the distribution concession agreement in December 2014, which ensured that balances from financial assets and liabilities of the sector not recovered or refunded by tariff will be included in the calculation of indemnity at the end of concession, the Company recognized the amount of these balances which must be included in the next tariff adjustments against revenue. Financial assets and liabilities of the sector are measured at fair value upon initial recognition and classified as loans and receivables and other liabilities. After initial recognition, the restatement of assets or liabilities related to this item is recognized in the financial income. When the amount is billed to consumers, the corresponding amount is amortized from the balance of assets or liabilities against revenue.
f) Judgments and estimates The preparation of the financial statements in accordance with International Financial Reporting Standards (“IFRS”) and the accounting practices adopted in Brazil (“BR GAAP”) requires Management to make certain judgments, estimates and assumptions that affect the application of accounting policies and the reported amounts of assets, liabilities, revenues and expenses. Actual results may differ from such estimates. Estimates and assumptions are continuously reviewed. Reviews regarding accounting estimates are recognized in the fiscal year when the estimates are effectively reviewed and in any affected future years. Information about assumptions and estimates that have a significant risk of resulting in material adjustments in the next financial year are included in the following Notes: Note 06 – Consumers, concessionaires, permissionaires and clients (allowance for doubtful accounts and revenue to be billed) Note 08 – Deferred taxes Note 09 – Financial assets and liabilities of the sector Note 10 – Concessions' financial assets
vs vsvsvsvs
24
Note 19 – Provisions Note 20 – Contingencies Note 21 – Post-employment benefits Note 28 – Net revenue (Unbilled revenue) Note 31 – Electric power purchased for resale
g) Consumers, concessionaires, permissionaires and clients
They include billed and unbilled electric power supply, default charges, interest on late payment and electricity traded with other concessionaries for electricity supply, according to the amounts available in the Electric Energy Commercialization Chamber (CCEE). The allowance for doubtful accounts is recorded based on the Management’s estimates in an amount sufficient to cover probable losses. The main criteria defined by the Company for consumers are: (i) for consumers with significant amounts, an analysis is conducted on the balance receivable taking into account the Company’s recovery track record, negotiations in progress and security interest; (ii) for other consumers, 100% of balance is accrued for debts overdue by more than 90 days for residential consumers, more than 180 days for commercial consumers, or more than 360 days for other consumers. These criteria defined by Management are in line with those defined by ANEEL. The Company calculates the present value for balances with payment terms over 180 days, as detailed in Note 3.u.
h) Inventories
Inventories are recorded at the average acquisition cost, less allowances for losses, when applicable, and do not exceed their replacement costs or realizable values. Materials in inventory are classified in Current Assets (maintenance and administration storeroom) and those allocated to investments, classified in Non-Current Assets – Property, Plant and Equipment or Intangible Assets (warehouse).
i) Investments
The financial information of subsidiaries and jointly-owned subsidiaries are recognized in the individual financial statements of the parent company through the equity method. In the consolidated financial statements, investments in jointly-owned subsidiaries are accounted for by the equity method. The Company’s investments include the surplus value identified in the acquisition of interest, net of any accumulated impairment losses.

vs vsvsvsvs
25
j) Property, plant and equipment i. Recognition and measurement
They are measured at acquisition, formation or construction cost, less accumulated depreciation.
Costs include expenses directly attributable to the acquisition of an asset. The costs of assets built by the Company itself include:
• The cost of materials and direct labor;
• Any other costs and conditions necessary to ensure that the asset is in place and prepared to operate as planned by Management;
• Costs of loans over qualifying assets.
When parts of an item of property, plant and equipment have different useful lives, these are recorded as individual items (main components) of property, plant and equipment.
Gains and losses on the disposal of an item of property, plant and equipment are recognized under other operating revenues/expenses in the income statement.
ii. Subsequent costs
Subsequent costs are capitalized to the extent that it is likely that future benefits associated with them will be earned by the Company. Recurring maintenance and repair costs are recorded in the income statement.
iii. Depreciation
Items of property, plant and equipment are depreciated by the straight-line method against the income statement, based on each component’s estimated economic useful life. For most property, plant and equipment items, the assets’ estimated economic useful lives are in line with those set forth by ANEEL, and land is not depreciated. For property, plant and equipment items without indemnity guarantee, such as the assets from Lightger, Lajes Energia and Renova Energia, the items are depreciated under the straight-line method up to the authorization or concession limit or depreciated by the asset’s useful life, whichever is the shorter, including land.
Items of property, plant and equipment are depreciated as of the date on which they are installed and become available for use, or, in the case of assets built by the Company, on the date when construction is completed and the asset becomes available for use.
vs vsvsvsvs
26
The estimated useful lives for the current and comparative years are shown in Note 13. Any adjustments to the depreciation methods, useful lives or residual values are recognized as a change in accounting estimates.
k) Intangible assets
i. Concession agreements and infrastructure assets linked to the concession
The Company recognizes an intangible asset deriving from a concession agreement when it is entitled to charge for the use of the concession’s infrastructure or explore it. An intangible asset received as consideration for construction services provided in a concession agreement is measured at fair value upon initial recognition. Following initial recognition, the intangible asset is measured at cost, which includes capitalized loans, less accumulated amortization. The estimate of an intangible asset’s useful life in a concession agreement is the period counted when the Company is capable of charging consumers for the use of infrastructure until the end of concession period.
ii. Research and Development
Expenditures in research activities, made with a possibility of gaining knowledge and scientific or technological understanding, are recognized in the income statement as incurred. Development activities involve a plan or project aiming at producing new or substantially enhanced products. Development expenditures are capitalized only if the development costs can be reasonably measured, if the product or process is technically and commercially viable, if future economic benefits are probable, and if the Company has the intention and enough resources to conclude the development and use or sell the asset. Capitalized expenditures include cost of materials, direct labor, manufacturing costs directly attributable to the preparation of the asset for its proposed use and cost of loans. Other development expenditures are recorded in the income statement as they are incurred. Capitalized development expenditures are measured at cost, less accumulated amortization and impairment losses, as applicable.
iii. Other intangible assets
Other intangible assets with definite useful lives are measured at cost, less accumulated amortization and losses from impairment, as applicable.
vs vsvsvsvs
27
iv. Subsequent expenditures
Subsequent expenditures are capitalized only when they increase future economic benefits incorporated into the specific intangible asset they relate to. All other expenditures are recognized in the income statement as incurred.
v. Amortization
Amortization is recognized in the income statement based on the straight-line method in view of estimated useful lives of intangible assets, from the date when they are available for use or for generation of related economic benefits. Estimated useful lives for current year are stated in Note 14. Amortization methods, useful lives and residual values are reviewed at the end of each financial year and are adjusted whenever it is adequate as change of accounting estimates.
l) Impairment
i. Financial assets (including receivables)
A financial asset not measured at fair value is evaluated at each reporting date to assess if there is objective evidence of loss in its recoverable value. An asset has loss in its recoverable value if objective evidence indicates that a loss event occurred after the initial recognition of the asset, and that such loss event has a negative effect on future projected cash flows, which can be reasonably estimated. The objective evidence that the financial assets have lost value might include default or late payment by the debtor, restructuring the amount due to the Company under conditions the Company usually would not consider in other transactions, indications that the debtor or issuer will face bankruptcy, or the disappearance of an active market for a security. Additionally, for an equity instrument, a significant or long decrease in its fair value below its cost is an objective evidence of impairment.
Financial assets measured at amortized cost
The Company considers evidences of impairment of assets measured at amortized cost either individually as collectively. All individually significant assets are assessed for impairment. All individually significant receivables identified as not suffering individual impairment are then collectively assessed regarding any other impairment not yet identified. Receivables that are not individually important are collectively assessed for impairment, by jointly grouping securities with similar risk characteristics.
vs vsvsvsvs
28
When collectively assessing impairment, the Company uses historical trends of probability of default, recovery term and incurred loss amounts, adjusted to reflect the Management’s judgment regarding assumptions, as current economic and credit conditions may be such that actual losses will be probably higher or lower than those suggested by historical trends. An impairment related to a financial asset measured at amortized cost is calculated as the difference between book value and present value of estimated future discounted cash flows at the original effective interest rate of the asset. Losses are recognized in the income statement and reflected in an account of allowance for receivables. Interest on impaired assets remains being recognized. When a subsequent event indicates reversal of the impairment, a decrease on impairment is reversed and recorded in the income statement. Management has not identified any evidence that justifies the need to reduce the financial assets to their recoverable value as of December 31, 2016 and 2015, except for the allowance for doubtful accounts and adjustment to the present value of receivables.
ii. Non-financial assets The book values of the Company’s non-financial assets, rather than inventories and deferred income tax and social contribution are reviewed every reporting date to check for impairment. If impairment occurs, then the asset’s recoverable value is estimated. In case of intangible assets with indefinite useful life, the recoverable value is estimated every year.
The impairment is recognized if the book value of an asset or cash generating unit (CGU) exceeds its recoverable value. The recoverable value of an asset or CGU is the highest amount between the value in use and fair value less selling expenses. When evaluating the value in use, estimated future cash flows are discounted at their present values through discount rate before taxes to reflect market’s current conditions as to recovery period of capital and specific risks of asset or CGU. In order to test for impairment, assets that cannot be individually tested are grouped to the smallest group of assets that generate continued use cash inflow which are mostly independent from cash flows of other assets or groups of assets (CGU). Impairment losses are recognized in the income statement. Impairment losses are only reversed when the asset’s book value does not exceed the book value calculated, net of depreciation or amortization, in case loss of value has not been recognized.
vs vsvsvsvs
29
m) Benefits to employees
i. Defined contribution plans A defined contribution plan is a post-retirement benefit plan under which an entity pays fixed contributions to a separate entity (Pension Fund) and shall not have any legal or constructive obligation to pay for additional amounts. Liabilities for contributions to defined contribution pension plans are recorded as expenses with benefits to employees in the income statement in the periods during which services are rendered by employees. Contributions previously paid are recognized as assets under the condition that there is a cash reimbursement or a reduction in future payments is available.
ii. Defined benefit plans The net liability of the Company regarding defined benefit pension plans is individually calculated for each plan, by estimating the value of the future benefit the employees will earn in return of services rendered in current and previous years; the benefit is discounted to its present value. Any unrecognized past service costs and the fair values of any plan assets are deducted. The discount rate is the gains presented on the date of the financial statements for first line securities which due dates are close to the conditions of the liabilities of the Company and that are denominated in the same currency in which the benefits are expected to be paid. The calculation is made annually by a qualified actuary using the projected unit credit method. When the calculation results in a benefit for the Company, the asset to be recognized is limited to the total of any unrecognized past service costs and the present value of economic benefits available as future reimbursements of the plan or reduction in future contributions to the plan. To calculate the present value of the economic benefits, any minimum cost demands applicable to any plan in the Company are considered. An economic benefit is available to the Company if it is realizable throughout the life of the plan, or in the settlement of the liabilities of the plan. The liability recognized in the balance sheet is equivalent to the highest amount between the debt contracted with Fundação de Seguridade Social Braslight to amortize actuarial liabilities and the present value of net actuarial liabilities, as detailed in Note 21. The sponsorship costs of the pension plan and occasional plan deficits are immediately recognized in shareholders’ equity, in other comprehensive income.
vs vsvsvsvs
30
Actuarial gains and losses arising from adjustments and changes in actuarial premises of pension and retirement benefit plans are immediately recognized in shareholders’ equity, in other comprehensive income, and are not transferred to accumulated losses and retained earnings.
iii. Short-term benefit to employees Short-term benefit liabilities to employees are measured on undiscounted basis and are recorded against expenses as the related service is rendered. The liability is recognized at the amount expected to be paid under the cash bonus or short-term profit sharing plans if the Company has a legal or constructive obligation to pay this amount due to past services rendered by the employee and the liability can be reasonably estimated.
n) Provisions
A provision is recognized when the Company has a presumed or legal liability that can be reliably estimated as the result of a past event, and it is probable that an economic resource is required to settle the liability. Provisions are recorded based on the best estimates of risk involved and expected future cash flows. A provision for risks is recorded by evaluating and quantifying lawsuits, whose probability of loss is deemed as probable, in the opinion of the Management and its legal counsels.
o) Capital stock
Common shares are classified as shareholders’ equity. Additional costs directly attributable to the issue of shares and stock options are recognized as shareholders' equity deductions, net of any tax effects.
Minimum mandatory dividends are recognized as liabilities, as defined in the Company’s Bylaws.
p) Revenue recognition
Revenues are measured at fair value of the receivable or received counterpart, less taxes and discounts inherent to revenues.
i. Electricity sales revenues
These are recognized when there is conclusive evidence that most significant risks and benefits inherent to the assets’ ownership were transferred to the buyer, is probable that the economic benefit associated with transactions will flow to the Company and the amount of revenues can be reasonably measured. Traded electricity is monthly invoiced based on the electricity

vs vsvsvsvs
31
supply, according to amounts disclosed by the Electric Energy Commercialization Chamber (CCEE).
ii. Service Revenues
Revenues from services rendered are recognized in the income statement based on the stage of completion of services on the reporting date of the financial statements. The stage of completion is evaluated by referencing research of works performed.
iii. Construction Revenues
Contractual revenues comprise the initial value agreed upon in the agreement plus variations deriving from additional requests, complaints and payments of contractual incentives, subject to the condition that probably these will result in revenues and that can be reliably measured. As soon as a construction agreement can be reasonably estimated, the agreement’s revenue is recognized in the income statement to the extent of the agreement’s completion phase. Contractual expenses are recognized when incurred, unless they generate an asset related to the forward agreement’s activity. The completion phase is evaluated by referencing works conducted. When results of a construction agreement cannot be reliably measured, the agreement’s revenue is recognized until the limit of costs recognized subject to the condition that costs incurred can be recovered. Agreement’s losses are immediately recognized in the income statement. Revenue related to construction services and improvement of concession agreements is recognized based on the completion phase of work executed, compatible with the Company’s accounting policies for recognition of construction agreements’ revenues. Operation or service revenues are recognized in the year services are provided by the Company. When the Company provides more than one service in the concession agreement, the consideration received is allocated by reference to the fair value of services delivered when values are separately identifiable. For revenues and costs related to construction services or improvement of infrastructure used in electricity distribution services, the construction margin adopted is established as being equal to zero, considering that: (i) the main activity of the subsidiary is electricity distribution; (ii) every construction revenue is related to the construction of infrastructure to reach its main activity; and (iii) the Company outsources the construction of infrastructure with non-related parties. The totality of additions to the concession’s intangible assets in process is monthly recorded in the income statement, as construction cost.

vs vsvsvsvs
32
iv. Financial assets and liabilities of the sector – Unbilled revenue
Revenue from financial assets and liabilities of the sector is recognized in the income statement when costs effectively incurred are different from those included in the energy distribution tariff. For further details, see Note 3.e.
q) Financial revenues and expenses
Financial revenues comprise interest income from financial investments, interest on overdue client payments, variations in the fair value of financial assets measured at fair value through profit and loss and swap variations. Interest income is recognized in the income statement, through the effective interest rate method. Financial expenses comprise interest expenses over loans, present value discount adjustments and changes in the fair value of financial assets measured at fair value through profit and loss. Borrowing costs which are not directly attributable to acquisition, construction or production of a qualifying asset are recorded at profit and loss through the effective interest rate method. Exchange gains and losses are reported on a net basis.
r) Income tax and social contribution
Current and deferred income tax and social contribution of the year are calculated based on 15% rates, plus 10% surcharge over the taxable income exceeding R$240 for income tax and 9% over the taxable income for social contribution on net income and consider social contribution tax loss carryforwards, restricted to 30% of taxable income. Income tax and social contribution expenses comprise current and deferred income taxes. Current and deferred taxes are recognized in the income statement unless these are related to items directly recognized in equity, in other comprehensive income. Current tax is the tax payable on income or recoverable tax in the case of advances exceeding the taxable profit of the year, at tax rates decreed or substantially decreed on the reporting date of the financial statements and any adjustments to payable taxes related to previous years. Deferred tax is recognized regarding temporary differences between book value of assets and liabilities for accounting purposes and the corresponding values for taxation purposes, as well as regarding existing and recoverable balances of tax losses and social contribution tax loss carryforwards.

vs vsvsvsvs
33
Deferred tax is measured by rates to be applied to temporary differences when they reverse, based on the laws that have been enacted or substantially enacted until the reporting date of the financial statements. When calculating current and deferred income tax, the Company takes into account the impact of uncertainties related to tax positions assumed and if additional payment of income tax and interests has been made. The Company believes that the provision for income tax under liabilities is appropriate in relation to all outstanding tax periods based on its assessment of several factors, including tax laws interpretations and past experience. This evaluation is based on estimates and assumptions that may involve a series of judgments on future events. New information may be available, which would lead the Company to change its judgment as to the adequacy of current provision; these changes will impact income tax expense in the year they occur. Current and deferred tax assets and liabilities are offset if there is a legal right to offset current tax assets and liabilities, and they relate to income taxes charged by the same tax authority on the same entity subject to taxation. A deferred income tax and social contribution asset is recognized by tax losses, tax credits and deductible temporary differences, not used when it is probable that future profits subject to taxation will be available and against which they shall be used. Deferred income tax and social contribution assets are reviewed on each closing date and are reduced as their realization is no longer probable.
s) Earnings per Share
Basic earnings per share are calculated through profit or loss for the fiscal year attributable to the Company’s controlling shareholders and the weighted average number of outstanding shares in the respective fiscal year. Diluted earnings per share are calculated through said average number of shares, adjusted by instruments potentially convertible into shares, with a diluting effect in the reported years.
t) Segment information
An operating segment is a component of the Company that develops business activities in which it can obtain revenues and incur in expenses, including revenues and expenses related to transactions with other components of the Company. All results from operating segments are frequently reviewed by the Management, in order to make decisions regarding the resources to be allocated to the segment and to assess their performance, and for this purpose individual financial information is available.

vs vsvsvsvs
34
The segment results reported to the Management include items directly attributable to the segment, as well as those that may be allocated reasonably. The operating segments include distribution, generation, trading and services, among others.
u) Foreign currency
Transactions in foreign currency are converted to the functional currency of the Company at the exchange rates on the transaction dates. Monetary assets and liabilities denominated and calculated in foreign currencies are converted to the functional currency at the exchange rate of the reporting date. Gains and losses resulting from restatement of these assets and liabilities between the exchange rate in force on the transition date or at the year-beginning and year-end dates are recognized as financial revenues or expenses in the income statement.
v) Present value adjustment
The items subject to discount at present value are consumer, concessionaires, permissionaires and clients. The Company calculated the present value for balances with payment terms over 180 days. The discount rate used by Management for the discount at present value of these items is approximately 14.0% p.a., similar to the Company’s average borrowing cost in recent years and the financial charges collected from its clients. Interest rates accumulated in a sales transaction are determined upon initial recording of transaction and are not subsequently adjusted.
w) Statements of value added
The Company prepared individual and consolidated added value statements (DVA), which are presented as an integral part of the financial statements, as required by Brazilian Corporate Law, applicable to publicly-held companies, whilst they represent, for IFRS, additional financial information.
x) Changes to accounting policies and reclassification of comparative balances
In order to improve the presentation of the Company’s equity position and operating and financial performance, Management revised certain practices, changing certain accounting policies and reclassifying some items, based on the guidelines issued by CPC 23 – Accounting Policies, Changes in Accounting Estimates and Errors, as follows: (i) The fair value of the concession’s indemnifiable assets are now recorded as
operating revenue; they used to be recorded as financial result
The Company’s Management revised its accounting practices and decided to change the recognition of the fair value of the concession’s indemnifiable assets. The fair value was previously recorded as financial result. However, since this item has an intrinsic impact on the core activity of the energy distribution business and in order to provide a better presentation of its performance, the
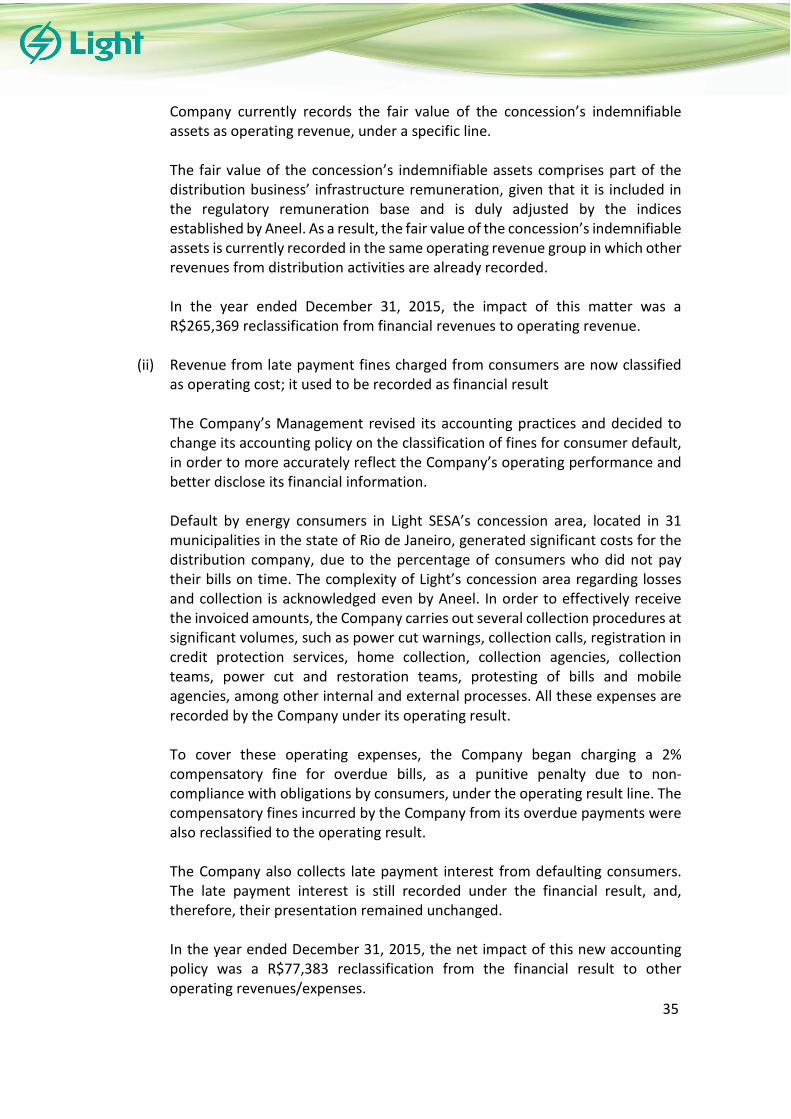
vs vsvsvsvs
35
Company currently records the fair value of the concession’s indemnifiable assets as operating revenue, under a specific line. The fair value of the concession’s indemnifiable assets comprises part of the distribution business’ infrastructure remuneration, given that it is included in the regulatory remuneration base and is duly adjusted by the indices established by Aneel. As a result, the fair value of the concession’s indemnifiable assets is currently recorded in the same operating revenue group in which other revenues from distribution activities are already recorded. In the year ended December 31, 2015, the impact of this matter was a R$265,369 reclassification from financial revenues to operating revenue.
(ii) Revenue from late payment fines charged from consumers are now classified
as operating cost; it used to be recorded as financial result
The Company’s Management revised its accounting practices and decided to change its accounting policy on the classification of fines for consumer default, in order to more accurately reflect the Company’s operating performance and better disclose its financial information. Default by energy consumers in Light SESA’s concession area, located in 31 municipalities in the state of Rio de Janeiro, generated significant costs for the distribution company, due to the percentage of consumers who did not pay their bills on time. The complexity of Light’s concession area regarding losses and collection is acknowledged even by Aneel. In order to effectively receive the invoiced amounts, the Company carries out several collection procedures at significant volumes, such as power cut warnings, collection calls, registration in credit protection services, home collection, collection agencies, collection teams, power cut and restoration teams, protesting of bills and mobile agencies, among other internal and external processes. All these expenses are recorded by the Company under its operating result. To cover these operating expenses, the Company began charging a 2% compensatory fine for overdue bills, as a punitive penalty due to non-compliance with obligations by consumers, under the operating result line. The compensatory fines incurred by the Company from its overdue payments were also reclassified to the operating result. The Company also collects late payment interest from defaulting consumers. The late payment interest is still recorded under the financial result, and, therefore, their presentation remained unchanged. In the year ended December 31, 2015, the net impact of this new accounting policy was a R$77,383 reclassification from the financial result to other operating revenues/expenses.
vs vsvsvsvs
36
For comparison purposes, the consolidated statement of income and the statement of value added for the year ended December 31, 2015 were reclassified. These changes to the practices did not alter the result for the year ended December 31, 2015.
i. Consolidated statement of income for the year ended December 31, 2015.
2015
DisclosedReclassifications
2015
Restated
NET REVENUE 10,647,304 265,369 10,912,673
COST OF OPERATIONS (9,064,702) 77,383 (8,987,319)
Electric power purchased for resale (7,160,923) - (7,160,923)
Personnel (191,210) - (191,210)
Material (17,976) - (17,976)
Outsourced services (298,388) - (298,388)
Depreciation and amortization (411,647) - (411,647)
Cost of construction (936,829) - (936,829)
Other revenues / costs (47,729) 77,383 29,654
GROSS PROFIT 1,582,602 342,752 1,925,354
OPERATING EXPENSES (820,420) - (820,420)
General and administrative expenses (770,350) - (770,350)
Other revenues 1,276 - 1,276
Other expenses (51,346) - (51,346)
EQUITY IN THE EARNINGS OF SUBSIDIARIES (126,400) - (126,400)
EARNINGS BEFORE THE FINANCIAL RESULT AND TAXES 635,782 342,752 978,534
FINANCIAL RESULT (511,552) (342,752) (854,304)
Revenue 1,098,943 (351,352) 747,591
Expense (1,610,495) 8,600 (1,601,895)
RESULT BEFORE INCOME TAX AND SOCIAL CONTRIBUTION 124,230 - 124,230
Current income tax and social contribution (63,983) - (63,983)
Deferred income tax and social contribution (22,411) - (22,411)
NET INCOME FOR THE YEAR 37,836 - 37,836

vs vsvsvsvs
37
ii. Statement of consolidated value added for the year ended December 31, 2015.
2015
DisclosedReclassifications
2015
Restated
Revenues 17,575,180 265,369 17,840,549
Sale of goods, products and services 16,735,339 265,369 17,000,708
Revenue related to the construction of own assets 993,029 - 993,029
Allowance/Reversal of allowance for doubtful accounts (153,188) - (153,188)
Inputs acquired from third parties (8,761,140) 77,383 (8,683,757)
Cost of products, goods and services sold (7,160,923) - (7,160,923)
Material, energy, outsourced services and other (1,600,217) 77,383 (1,522,834)
Gross value added 8,814,040 342,752 9,156,792
Retentions (459,401) - (459,401)
Depreciation and amortization (459,401) - (459,401)
Net value added produced 8,354,639 342,752 8,697,391
Value added received through transfer 972,543 (351,352) 621,191
Equity in the earnings of subsidiaries (126,400) - (126,400)
Financial revenues 1,098,943 (351,352) 747,591
Total value added to distribute 9,327,182 (8,600) 9,318,582
Distribution of value added 9,327,182 (8,600) 9,318,582
Personnel 371,449 - 371,449
Direct remuneration 281,229 - 281,229
Benefits 61,270 - 61,270
Government Severance Fund for Employees (FGTS) 23,539 - 23,539
Other 5,411 - 5,411
Taxes, fees and contributions 7,199,286 - 7,199,286
Federal 3,505,237 - 3,505,237
State 3,683,047 - 3,683,047
Local 11,002 - 11,002
Value distributed to providers of capital 1,718,611 (8,600) 1,710,011
Interest 1,636,793 (8,600) 1,628,193
Rental 66,908 - 66,908
Other 14,910 - 14,910
Value distributed to shareholders 37,836 - 37,836
Dividends and interest on equity 10,069 - 10,069
Retained earnings 27,767 - 27,767
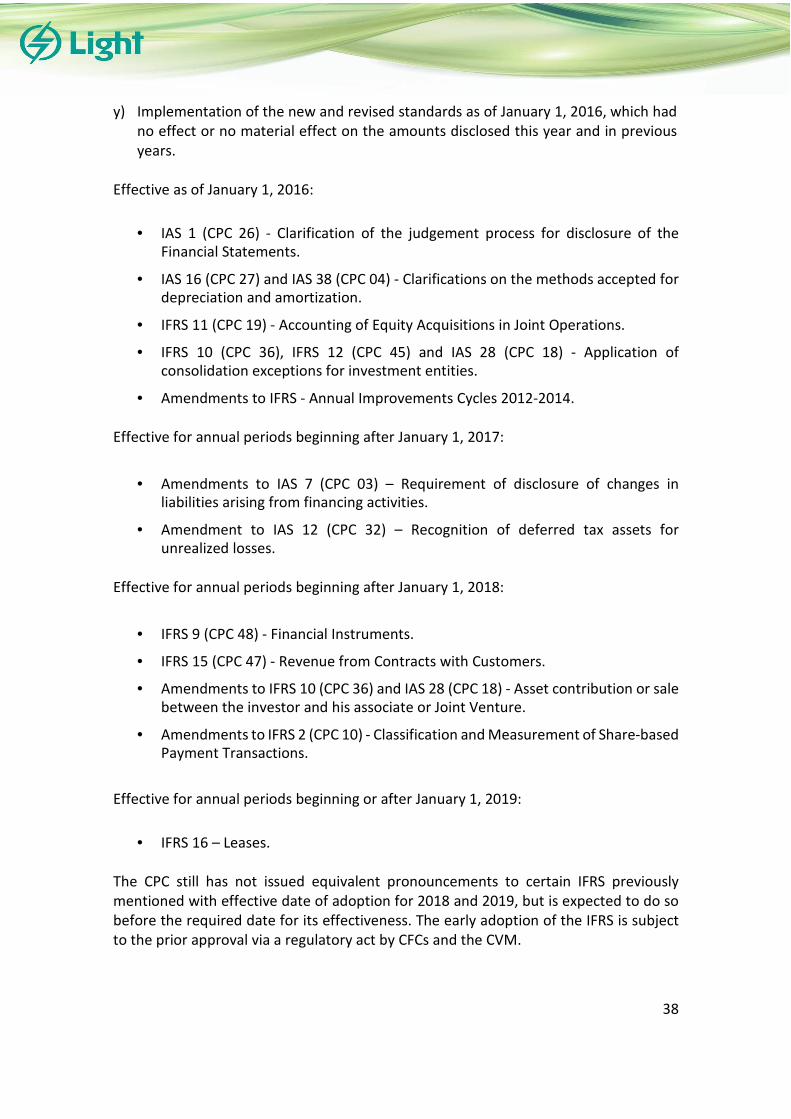
vs vsvsvsvs
38
y) Implementation of the new and revised standards as of January 1, 2016, which had no effect or no material effect on the amounts disclosed this year and in previous years.
Effective as of January 1, 2016:
• IAS 1 (CPC 26) - Clarification of the judgement process for disclosure of the Financial Statements.
• IAS 16 (CPC 27) and IAS 38 (CPC 04) - Clarifications on the methods accepted for depreciation and amortization.
• IFRS 11 (CPC 19) - Accounting of Equity Acquisitions in Joint Operations.
• IFRS 10 (CPC 36), IFRS 12 (CPC 45) and IAS 28 (CPC 18) - Application of consolidation exceptions for investment entities.
• Amendments to IFRS - Annual Improvements Cycles 2012-2014. Effective for annual periods beginning after January 1, 2017:
• Amendments to IAS 7 (CPC 03) – Requirement of disclosure of changes in liabilities arising from financing activities.
• Amendment to IAS 12 (CPC 32) – Recognition of deferred tax assets for unrealized losses.
Effective for annual periods beginning after January 1, 2018:
• IFRS 9 (CPC 48) - Financial Instruments.
• IFRS 15 (CPC 47) - Revenue from Contracts with Customers.
• Amendments to IFRS 10 (CPC 36) and IAS 28 (CPC 18) - Asset contribution or sale between the investor and his associate or Joint Venture.
• Amendments to IFRS 2 (CPC 10) - Classification and Measurement of Share-based Payment Transactions.
Effective for annual periods beginning or after January 1, 2019:
• IFRS 16 – Leases. The CPC still has not issued equivalent pronouncements to certain IFRS previously mentioned with effective date of adoption for 2018 and 2019, but is expected to do so before the required date for its effectiveness. The early adoption of the IFRS is subject to the prior approval via a regulatory act by CFCs and the CVM.

vs vsvsvsvs
39
The Company and its subsidiaries and jointly-owned subsidiaries did not early adopt these changes in their financial statements of December 31, 2016. None of these new standards are expected to have a material impact on the financial statements, except for IFRS 9 and IFRS 16, which may alter the classification and measurement of financial assets and leases, respectively, but which are still being assessed by the Company.
4. CASH AND CASH EQUIVALENTS
The short-term investments are highly liquid and convertible into know amounts cash and are subject to a floating rate represented by transactions purchased from financial institutions trading in the domestic financial market. These short-term investments have a daily repurchase commitment by the counterparty financial institution (the repurchase rate is previously agreed upon by the parties) and yield mostly according to the variation of the interbank deposit rate (CDI), with immaterial loss of income in case of early redemption. The average yield of the investments on a consolidated basis was 52.9% of the CDI on December 31, 2016 (99.0% of the CDI on December 31, 2015). The Company's exposure to interest rate risks and a sensitivity analysis of financial assets and liabilities are reported in Note 34. 5. MARKETABLE SECURITIES
They are represented by: (i) surety bonds pledged in power auctions, (ii) proceeds from the sale of assets that were held for reinvestment in the electric grid system, (iii) investment funds, and (iv) investments to mature within three months or longer of the investment date, with loss of value in case of early redemption. The average yield of
12.31.2016 12.31.2015 12.31.2016 12.31.2015
Money available 150 264 34,113 24,650
Short-term financial investments
Bank deposit certificate (CDB) 6,182 83,430 634,191 422,791
TOTAL 6,332 83,694 668,304 447,441
Parent Company Consolidated
12.31.2016 12.31.2015
Bank deposit certificate (CDB) 10,684 9,124
Investment Fund 2,783 65,558
TOTAL 13,467 74,682
Consolidated
vs vsvsvsvs
40
these investments is 97.3% of the CDI on December 31, 2016 (99.8% of the CDI on December 31, 2015). 6. CONSUMERS, CONCESSIONAIRES, PERMISSIONAIRES AND CLIENTS
An allowance for doubtful accounts was set up based on certain assumptions and in an amount deemed sufficient by Management to meet any asset realization losses. In the year ended December 31, 2016, bad debts were written-off for R$135,163 (R$604 in the year ended December 31, 2015). The write offs were realized against allowance for doubtful accounts already recorded, thus, not impacting the net income for the year. The balances of debt repayment facilities were adjusted to their present value, as applicable. The discount rate used by Management for the discount at present value of these items is approximately 14.0% p.a., similar to the Company’s average borrowing cost in recent years and the financial charges collected from its clients. In 2016, installment agreements were entered into for relevant balances with the Rio de Janeiro state government, several municipal governments and some major customers. In addition, the Company intensified its efforts to recover stolen energy, and a plan was established for the installment payment of debt for most of the customers with irregularities. Outstanding balances and receivables in connection with invoiced electric power sales and also debt repayment programs are summarized as follows:
Current Non-current Total Current Non-current Total
Billed sales 1,720,726 - 1,720,726 1,990,156 - 1,990,156
Unbilled sales 514,118 - 514,118 646,318 - 646,318
Debt payment by installments 616,553 343,904 960,457 100,050 163,942 263,992
Sales in the free market 181,508 - 181,508 138,165 - 138,165
Supply and charges related to use of electric network 23,760 - 23,760 18,796 - 18,796
Other receivables 2,389 74,164 76,553 11,034 54,585 65,619
3,059,054 418,068 3,477,122 2,904,519 218,527 3,123,046
(-) Allowance for doubtful accounts (787,183) - (787,183) (705,289) - (705,289)
TOTAL 2,271,871 418,068 2,689,939 2,199,230 218,527 2,417,757
12.31.2016 12.31.2015
Consolidated

vs vsvsvsvs
41
Regarding outstanding receivables from January 2015 to April 2016, related to the State Government, in the amount of R$153,140, a decree was published on July 1, 2016, which was duly regulated by the Rio de Janeiro State Revenue Office. This decree enabled the full amortization of the above balance with ICMS payables in up to 29 installments. The compensation began in the calculation of the ICMS for the month of August 2016. In Public Sector segment, part of the outstanding bills of a major client was assumed by the State Government through the offsetting of ICMS, in the amount of R$38,979, in 12 months. The decree that regulates this law was published on June 30, 2016 and guided the execution of a “Term of Agreement”, which was signed on September 29, 2016 and allowed the beginning of offsetting the tax. This client’s remaining debt, in the amount of R$48,661, was divided into 36 installments, from June 2016. The balance of the installment payments is distributed according to the original maturity of the bills and there is no Allowance for Doubtful Accounts - PCLD for those installments that are not overdue by more than 90 days. Changes in consolidated Allowance for Doubtful Accounts - PCLD regarding the billed electricity supply and the debt payment installment plan for the years ended December 31, 2016 and 2015:
The Company’s exposure to credit risks related to consumers, concessionaires, permissionaires and clients is reported in Note 34.
BILLED SALES AND INSTALLMENT PAYMENTUp to 90
days
Between 90
and 180
days
Between
180 and 360
days
Overdue
over 360
days
12.31.2016 12.31.2015 12.31.2016 12.31.2015
Residential 443,396 418,606 100,644 102,467 103,262 1,168,375 790,655 (305,500) (274,940)
Industrial 70,384 10,191 1,777 3,919 63,935 150,206 130,986 (59,372) (84,411)
Commercial 97,179 63,483 19,747 33,334 289,632 503,375 591,963 (312,843) (274,128)
Rural 1,503 1,284 300 179 1,627 4,893 4,601 (1,627) (581)
Federal public sector 103,939 24,599 732 2,518 1,787 133,575 102,959 (1,632) (251)
State public sector 198,260 29,614 27,089 1,400 41,471 297,834 228,001 (41,809) (45,387)
Municipal public sector 49,799 36,676 15,908 27,850 44,576 174,809 147,001 (43,851) (14,133)
Public lighting 24,470 12,280 9,071 30,146 14,970 90,937 97,378 (14,559) (6,218)
Public utility 106,190 24,113 9,165 5,582 12,129 157,179 160,604 (5,990) (5,240)
TOTAL 1,095,120 620,846 184,433 207,395 573,389 2,681,183 2,254,148 (787,183) (705,289)
Allowance for doubtful accounts
Maturing
balance
TOTALOverdue balances
BALANCE ON 01.01.2015 (555,144)
(Additions)/Reversals (Note 30) (150,749)
Write-offs 604
BALANCE ON 12.31.2015 (705,289)
(Additions)/Reversals (Note 30) (217,057)
Write-offs 135,163
BALANCE ON 12.31.2016 (787,183)

vs vsvsvsvs
42
7. RECOVERABLE TAXES
(a) Refers to PIS and COFINS deriving from unbilled revenue of financial assets and liabilities of the sector (see Note 9).
On December 31, 2016, the Parent Company’s recoverable taxes totaled R$801 (R$647 on December 31, 2015). 8. DEFERRED TAXES
Current Non-current Total Current Non-current Total
TAXES AND CONTRIBUTIONS 120,561 75,344 195,905 90,443 85,939 176,382
ICMS to offset 63,367 67,155 130,522 66,218 84,876 151,094
PIS and COFINS to offset 76 - 76 1,983 - 1,983
Deferred PIS and COFINS (a) 37,299 7,126 44,425 - - -
INSS 1,568 1,063 2,631 4,430 1,063 5,493
Other 18,251 - 18,251 17,812 - 17,812 -
INCOME TAX AND SOCIAL CONTRIBUTION 80,715 - 80,715 86,237 - 86,237
Withholding income tax 30,315 - 30,315 68,454 - 68,454
Advances 50,400 - 50,400 17,783 - 17,783
TOTAL 201,276 75,344 276,620 176,680 85,939 262,619
Consolidated
12.31.2016 12.31.2015
Deferred
assets
Deferred
liabilities
Deferred
net
Deferred
assets
Deferred
liabilities
Deferred
net
DEFERRED INCOME TAX AND SOCIAL CONTRIBUTION 948,394 (556,021) 392,373 938,384 (709,640) 228,744
Allowance for doubtful accounts (Note 6) 267,642 - 267,642 239,789 - 239,789
Provision for profit sharing 8,847 - 8,847 9,435 - 9,435
Provision for contingencies (Note 19) 142,077 - 142,077 184,088 - 184,088
Pension plan complement - CVM 695/12 (Note 21) 12,817 - 12,817 10,872 - 10,872
Other 47,500 - 47,500 55,641 (692) 54,949
Tax losses 319,590 - 319,590 320,064 - 320,064
Social contribution tax loss carryforwards 118,079 - 118,079 118,250 - 118,250
Derivative financial instruments (Note 32) 31,842 (62,646) (30,804) 245 (198,221) (197,976)
Remuneration of financial assets - (302,758) (302,758) - (309,655) (309,655)
Deemed cost - Light Energia - (190,617) (190,617) - (201,072) (201,072)
GROSS DEFERRED TAX ASSETS/(LIABILITIES) 948,394 (556,021) 392,373 938,384 (709,640) 228,744
Net amount (355,896) 355,896 - (441,493) 441,493 -
NET DEFERRED TAX ASSETS/(LIABILITIES) 592,498 (200,125) 392,373 496,891 (268,147) 228,744
Consolidated
12.31.2016 12.31.2015

vs vsvsvsvs
43
Changes in deferred income tax and social contribution for the years ended December 31, 2016 and 2015 are as follows:
Based on technical studies, the Company’s Management estimated future tax results, demonstrating its ability to use these tax credits in the years indicated, as required by CVM Instruction 371 of June 27, 2002. This study is examined by the Fiscal Council and approved by the Board of Directors at the end of each year. It shows the recovery of deferred tax credits recorded on December 31, 2016 in up to six years, in accordance with the following annual realization schedule:
The Company estimates that the use of deferred tax credits throughout 2017 will be concentrated in allowance for doubtful accounts and derivative financial instruments, among others. On December 31, 2016, the Company had an unrecognized credit balance on accumulated tax losses and social contribution tax loss carryforwards amounting to R$75,232 (R$63,311 on December 31, 2015) related to the Parent Company, in view of uncertainties regarding its realization.
Balance on
01.01.2015
Recognized in
the income
statement
Recognized in
the
shareholders'
equity
Balance on
12.31.2015
Recognized in
the income
statement
Recognized in
the
shareholders'
equity
Balance on
12.31.2016
DEFERRED INCOME TAX AND SOCIAL CONTRIBUTION - ASSETS
Allowance for doubtful accounts 182,743 57,046 - 239,789 27,853 - 267,642
Provision for profit sharing 8,650 785 - 9,435 (588) - 8,847
Provision for contingencies 163,937 20,151 - 184,088 (42,011) - 142,077
Pension plan complement - CVM 695/12 10,872 - - 10,872 - 1,945 12,817
Other 69,083 (13,442) - 55,641 (8,141) - 47,500
Tax losses 230,257 89,807 - 320,064 (474) - 319,590
Social contribution tax loss carryforwards 85,919 32,331 - 118,250 (171) - 118,079
Derivative financial instruments - 245 - 245 31,597 - 31,842
TOTAL DEFERRED INCOME TAX AND SOCIAL CONTRIBUTION - ASSETS 751,461 186,923 - 938,384 8,065 1,945 948,394
DEFERRED INCOME TAX AND SOCIAL CONTRIBUTION - LIABILITIES
Derivative financial instruments (70,743) (127,478) - (198,221) 135,575 - (62,646)
Remuneration of financial assets (217,787) (91,868) - (309,655) 6,897 - (302,758)
Deemed cost - Light Energia (211,776) 10,704 - (201,072) 9,680 775 (190,617)
Other - (692) - (692) 692 - -
TOTAL DEFERRED INCOME TAX AND SOCIAL CONTRIBUTION - LIABILITIES (500,306) (209,334) - (709,640) 152,844 775 (556,021)
2017 234,186
2018 264,550
2019 125,291
2020 158,444
2021 141,953
2022 23,970
GROSS TOTAL 948,394

vs vsvsvsvs
44
9. FINANCIAL ASSETS AND LIABILITIES OF THE SECTOR This item represents balances receivable and/or payable related to financial assets and liabilities incurred of the sector and not yet realized by the energy distribution company’s tariff (Light SESA). The chart below shows a breakdown of the balance of financial assets and liabilities of the sector on December 31, 2016 and 2015:
ASSETS LIABILITIES ASSETS LIABILITIES ASSETS LIABILITIES ASSETS LIABILITIES
Portion A items 534,284 (59,124) 19,017 (31,134) 95,083 (155,669) 648,384 (245,927)
Energy Development Account - CDE 59,034 - - (15,450) - (78,419) 59,034 (93,869)
Power acquisition costs 426,699 - 17,030 - 85,148 - 528,877 -
System Service Charges - ESS - (59,124) - (15,684) - (77,250) - (152,058)
PROINFA 42,160 - 166 - 831 - 43,157 -
Electric power transportation - Itaipu 3,030 - 162 - 811 - 4,003 -
Electric power transportation through basic network 3,361 - 1,659 - 8,293 - 13,313 -
Financial items 112,006 (974,991) 2,612 (5,904) 13,064 (29,520) 127,682 (1,010,415)
Other financial items 33,091 (949,077) 173 - 870 - 34,134 (949,077)
Energy overcontracting / involuntary exposure - (25,914) 2,439 - 12,194 - 14,633 (25,914)
Portion A neutrality 78,915 - - (5,904) - (29,520) 78,915 (35,424)
Gross financial ASSETS / (LIABILITIES) of the sector 646,290 (1,034,115) 21,629 (37,038) 108,147 (185,189) 776,066 (1,256,342)
Net amount (646,290) 646,290 (21,629) 21,629 (108,147) 108,147 (776,066) 776,066
TOTAL NET (excluding PIS/COFINS rate increase) - (387,825) - (15,409) - (77,042) - (480,276)
PIS/COFINS rate increase (Note 7) - (35,874) - (1,425) - (7,126) - (44,425)
Financial ASSETS / (LIABILITIES) of the sector - (423,699) - (16,834) - (84,168) - (524,701)
Consolidated
Total
12.31.2016
Current Non-current
Approved Amounts Next Adjustments Next Adjustments
ASSETS LIABILITIES ASSETS LIABILITIES ASSETS LIABILITIES ASSETS LIABILITIES
Portion A items 1,615,518 (155,434) 16,096 (6,536) 80,485 (32,684) 1,712,099 (194,654)
Energy Development Account - CDE 750,819 - 15,817 - 79,089 - 845,725 -
Power acquisition costs 836,608 - - (478) - (2,389) 836,608 (2,867)
System Service Charges - ESS - (148,712) - (5,340) - (26,697) - (180,749)
PROINFA - (6,722) - (26) - (131) - (6,879)
Electric power transportation - Itaipu 5,131 - 279 - 1,396 - 6,806 -
Electric power transportation through basic network 22,960 - - (692) - (3,467) 22,960 (4,159)
Financial items 49,046 (996,476) 1,283 (2,971) 6,412 (14,853) 56,741 (1,014,300)
Other financial items 49,046 (767,745) - - 49,046 (767,745)
Energy overcontracting/involuntary exposure - (222,831) 685 (2,971) 3,424 (14,853) 4,109 (240,655)
Portion A neutrality - (5,900) 598 - 2,988 - 3,586 (5,900)
Gross financial ASSETS / (LIABILITIES) of the sector 1,664,564 (1,151,910) 17,379 (9,507) 86,897 (47,537) 1,768,840 (1,208,954)
Net amount (1,151,910) 1,151,910 (9,507) 9,507 (47,537) 47,537 (1,208,954) 1,208,954
TOTAL NET (excluding PIS/COFINS rate increase) 512,654 - 7,872 - 39,360 - 559,886 -
PIS/COFINS rate increase (Note 16) 47,421 - 728 - 3,641 - 51,790 -
Financial ASSETS / (LIABILITIES) of the sector 560,075 - 8,600 - 43,001 - 611,676 -
Approved Amounts Next Adjustments
Current Non-current
Next Adjustments
Consolidated
Total
12.31.2015
Current

vs vsvsvsvs
45
The chart below shows the changes in the balance of financial assets and liabilities of the sector in the years ended December 31, 2016 and 2015:
(a) Balances recognized in the statement of income, under Net Revenue, financial assets and liabilities of the sector – unbilled revenue (see Note 28), which included funds from the Regulated Trading Environment Account (ACR Account) and the Centralized Account for Tariff Flag Resources (CCRBT).
The chart below shows the changes in the net balance of financial assets and liabilities of the sector and excluding the effect of the PIS/COFINS tax increase by tariff cycle:
10. CONCESSION’S FINANCIAL ASSETS These represent the amounts receivable at the end of concession from the granting authority, or any of its agents, by way of compensation for investments made and not recovered through services rendered related to subsidiary Light SESA's concession. In March 2017, the subsidiary Light SESA signed an amendment to the concession agreement whereby it undertook new obligations related to service quality indicators; adhered to financial and economic monitoring clauses and Portion A neutrality; and changed the adjustment date to March 2017. As a result, Aneel approved a new Regulatory Remuneration Base for Light SESA.
BALANCE ON 01.01.2015 1,114,170
(+) Recognition (a) 1,040,450
(-) Amortization (a) (587,719)
(-) Contributions from ACR and CCRBT accounts (a) (1,049,263)
(+) Selic rate update (Note 32) 94,038
BALANCE ON 12.31.2015 611,676
(+) Recognition (a) (587,346)
(-) Amortization (a) (538,530)
(-) Contributions from CCRBT accounts (a) (19,073)
(+) Selic rate update (Note 32) 8,572
BALANCE ON 12.31.2016 (524,701)
Ratified by Aneel in
adjustment of
11.01.2016
Next tariff
adjustmentsTotal
Balance ratified by Aneel in adjustment of 11.01.2016 (473,775) - (473,775)
Financial assets and liabilities of the sector (Amortization/Recognition) 85,950 (92,451) (6,501)
BALANCE ON 12.31.2016 (387,825) (92,451) (480,276)

vs vsvsvsvs
46
On December 31, 2016, the Company recorded as fair value the negative amount related to the difference between the new replacement value approved by Aneel and the restated balance of the concession’s financial assets, in the amount of R$155,604, against operating revenue. Below, the changes in the balances related to indemnifiable assets at the end of concession, in the years ended December 31, 2016 and 2015:
(a) Transfer resulting from the bifurcation of assets after start-up, pursuant to IFRIC 12 / ICPC 01 (see Note 14). (b) Aneel's Normative Resolution No. 686/2015 amended the Tariff Regulation Procedure (PRORET), changing the index of the ratified
indemnifiable financial assets since the last tariff review process, from IGPM to IPCA (see Note 32).
11. OTHER RECEIVABLES
(a) Includes subsidy resulting from Decrees 7945/13 and 8221/14. (b) Aneel Normative Resolution 649/2015 (Centralized Account for Tariff Flag Resources - CCRBT). (c) It refers to sundry receivables.
Gross
Financial
Assets
Special
Obligations
Net Financial
Assets
BALANCE ON 01.01.2015 2,593,528 (147,085) 2,446,443
Additions (a) 461,584 (229,085) 232,499
Fair value – adjustment to VNR (Note 28) (b) 286,448 (21,079) 265,369
Write-offs (11,478) - (11,478)
BALANCE ON 12.31.2015 3,330,082 (397,249) 2,932,833
Additions (a) 661,020 (332,420) 328,600
Fair value – adjustment to VNR (Note 28) (b) 145,808 (10,489) 135,319
Fair value of the concession's indemnifiable assets – BRR (Note 28) (65,903) (89,701) (155,604)
Write-offs (6,809) - (6,809)
BALANCE ON 12.31.2016 4,064,198 (829,859) 3,234,339
Consolidated
Current Non-current Total Current Non-current Total
Advances to suppliers 5,598 - 5,598 25,295 - 25,295
Public lighting fee 64,742 - 64,742 45,010 - 45,010
Expenditures to refund 59,100 - 59,100 74,342 - 74,342
Ongoing deactivations and sales 68,054 - 68,054 48,529 - 48,529
Subsidy to low-income segment 7,848 - 7,848 4,453 - 4,453
CDE subsidy (a) - - - 29,328 - 29,328
Contribution from Tariff Flags (b) - - - 456 - 456
Assets and rights allocated for sale - - - - 2,147 2,147
Other (c) 6,263 1,322 7,585 2,455 - 2,455
TOTAL 211,605 1,322 212,927 229,868 2,147 232,015
Consolidated
12.31.2016 12.31.2015

vs vsvsvsvs
47
12. INVESTMENTS
(a) Company at pre-operational stage (b) Refers to investments calculated based on the shareholders’ equity for the purposes of equity in the earnings (losses) of subsidiaries * Light Institute has a balance of less than R$1 for the years presented.
12.31.2016 12.31.2015 12.31.2016 12.31.2015
Measured by the equity method: *
Light SESA 2,486,026 2,549,436 - -
Light Energia 329,704 690,991 - -
Renova Energia (a)(b) - - 305,543 480,275
Guanhães Energia (a)(b) - - (61,481) 11,858
Light Esco 141,580 100,074 - -
Lightcom 19,131 13,574 - -
Light Soluções 3,240 3,228 - -
Lightger (b) 42,555 38,983 42,555 38,983
Itaocara Energia (a) 34,829 33,361 - -
Axxiom (b) 20,050 24,685 20,050 24,685
Amazônia Energia (a) (b) 267,330 169,886 267,330 169,886
Energia Olímpica (b) 1,540 2,497 1,540 2,497
SUBTOTAL 3,345,985 3,626,715 575,537 728,184
Goodwill from future profitability - 2,034 - 2,034
Other permanent investments - - 27,422 19,427
SUBTOTAL - 2,034 27,422 21,461
Total unsecured equity interest - - 61,481 -
TOTAL INVESTMENTS 3,345,985 3,628,749 664,440 749,645
Parent Company Consolidated

vs vsvsvsvs
48
Information on subsidiaries (consolidated) and jointly-owned subsidiaries (equity income and proportional balances) is as follows:
12.31.2016 12.31.2015 12.31.2016 12.31.2015 12.31.2016 12.31.2015 12.31.2016 12.31.2015
Light SESA 100.0% 2,486,026 2,549,436 - - - (82,906) (184,825) (39,158)
Light Energia 100.0% 329,704 690,991 - (3,834) (196,435) (173,917) (173,938) 15,335
Light Esco 100.0% 141,580 100,074 - - (1,428) - (30,014) (436)
Lightcom 100.0% 19,131 13,574 - - (80,838) (95,416) 86,395 80,888
Light Soluções 100.0% 3,240 3,228 (498) (369) - - (400) 172
Lightger 51.0% 42,555 38,983 (669) - - - 4,240 (1,505)
Itaocara Energia 100.0% 34,829 33,361 - - - - (1,418) (1,170)
Axxiom 51.0% 20,050 24,685 (150) - - (227) (4,926) 420
Amazônia Energia 25.5% 267,330 169,886 - - - - (2,279) (6,220)
Energia Olímpica 50.1% 1,540 2,497 - - - - 103 2,497
3,345,985 3,626,715 (1,317) (4,203) (278,701) (352,466) (307,062) 50,823
12.31.2016 12.31.2015 12.31.2016 12.31.2015 12.31.2016 12.31.2015 12.31.2016 12.31.2015
Light Energia
Renova Energia 15.7% 305,543 417,050 - - - - (172,930) 18,757
Guanhães Energia 51.0% (61,481) 11,858 - - - - (98,271) (36,554)
Lightger 51.0% 42,555 38,983 (669) - - - 4,240 (1,505)
Axxiom 51.0% 20,050 24,685 (150) - - (227) (4,926) 420
Amazônia Energia 25.5% 267,330 169,886 - - - - (2,279) (6,220)
Energia Olímpica 50.1% 1,540 2,497 - - - - 103 2,497
575,537 664,959 (819) - - (227) (274,063) (22,605)
Parent Company
Subsidiaries and jointly-owned
subsidiaries - Interest
Shareholders’ equity Dividends receivable
Dividends received
Profit / (Loss) for the year
Consolidated
Dividends received
Jointly-owned subsidiaries -
Interest
Shareholders’ equity Profit / (Loss) for the yearDividends receivable
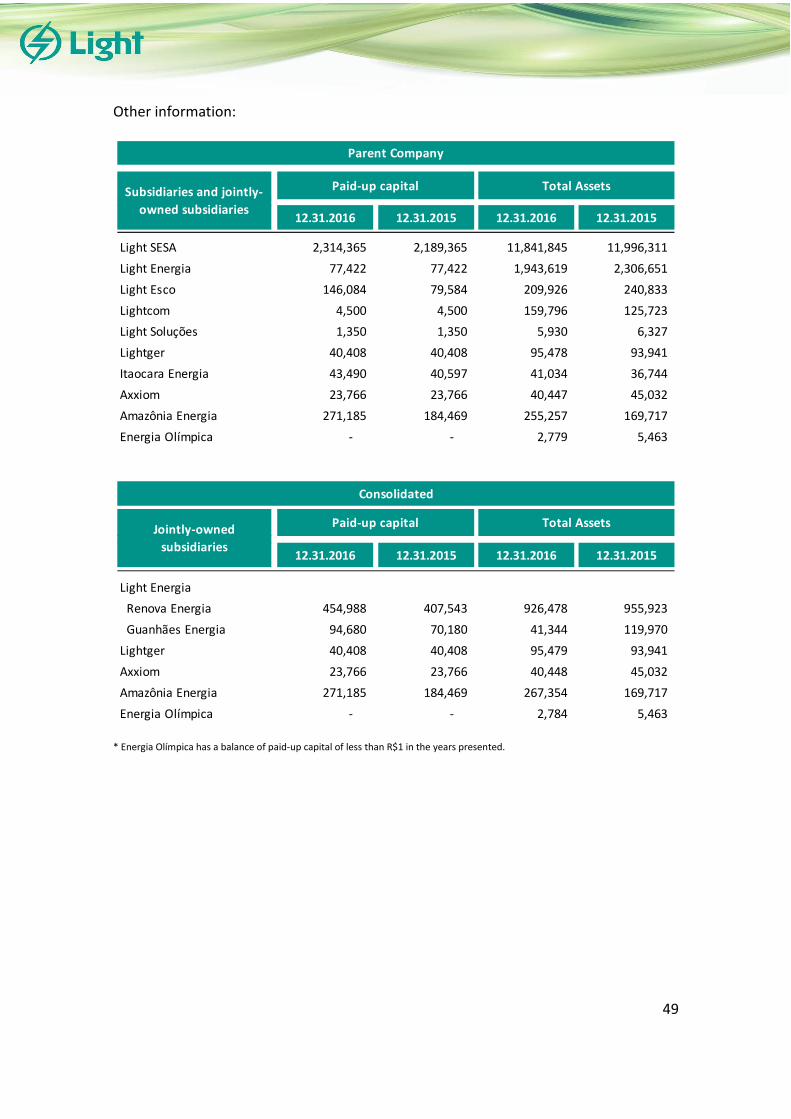
vs vsvsvsvs
49
Other information:
* Energia Olímpica has a balance of paid-up capital of less than R$1 in the years presented.
12.31.2016 12.31.2015 12.31.2016 12.31.2015
Light SESA 2,314,365 2,189,365 11,841,845 11,996,311
Light Energia 77,422 77,422 1,943,619 2,306,651
Light Esco 146,084 79,584 209,926 240,833
Lightcom 4,500 4,500 159,796 125,723
Light Soluções 1,350 1,350 5,930 6,327
Lightger 40,408 40,408 95,478 93,941
Itaocara Energia 43,490 40,597 41,034 36,744
Axxiom 23,766 23,766 40,447 45,032
Amazônia Energia 271,185 184,469 255,257 169,717
Energia Olímpica - - 2,779 5,463
12.31.2016 12.31.2015 12.31.2016 12.31.2015
Light Energia
Renova Energia 454,988 407,543 926,478 955,923
Guanhães Energia 94,680 70,180 41,344 119,970
Lightger 40,408 40,408 95,479 93,941
Axxiom 23,766 23,766 40,448 45,032
Amazônia Energia 271,185 184,469 267,354 169,717
Energia Olímpica - - 2,784 5,463
Parent Company
Consolidated
Jointly-owned
subsidiaries
Subsidiaries and jointly-
owned subsidiaries
Paid-up capital
Paid-up capital Total Assets
Total Assets

vs vsvsvsvs
50
Changes in subsidiaries (consolidated) and jointly-controlled entities (equity income) in the years ended December 31, 2016 and 2015:
(a) The comprehensive income of the Light Energia subsidiary refers to: (i) currency conversion effect on the indirect investee Renova Energia from investments abroad, and (ii) recognition of an actuarial liability loss. The comprehensive income of the subsidiary Light SESA refers to recognition of an actuarial liability loss.
(a) The main effect in Renova Energia was the write off of the added value of the concession after the results presented by Renova Energia, which included the recognition of impairment totaling R$41,091 at Light Energia on December 31, 2016.
Other Profit & Loss
Light SESA 2,549,436 125,000 - (3,584) - (1) (184,825) 2,486,026
Light Energia 690,991 - (192,602) 6,759 (1,505) (1) (173,938) 329,704
Light Esco 100,074 66,500 (1,428) - - 6,448 (30,014) 141,580
Lightcom 13,574 - (80,838) - - - 86,395 19,131
Light Soluções 3,228 - (128) - - 540 (400) 3,240
Lightger 38,983 - (669) - - 1 4,240 42,555
Itaocara Energia 33,361 2,891 - - - (5) (1,418) 34,829
Axxiom 24,685 - (150) - - 441 (4,926) 20,050
Amazônia Energia 169,886 99,917 - - - (194) (2,279) 267,330
Energia Olímpica 2,497 - - - - (1,060) 103 1,540
TOTAL 3,626,715 294,308 (275,815) 3,175 (1,505) 6,169 (307,062) 3,345,985
DividendsComprehensive
income (a)
Parent Company
12.31.2015 Capital increase 12.31.2016
Equity in the earnings of subsidiariesWrite-off of
attributed cost
Other Profit & Loss
Light SESA 2,481,594 107,000 - - - - (39,158) 2,549,436
Light Energia 777,818 - - (110,834) 8,671 1 15,335 690,991
Light Esco 100,826 - - - - (316) (436) 100,074
Lightcom 28,100 - - (95,416) - 2 80,888 13,574
Light Soluções 3,097 - - (40) - (1) 172 3,228
Lightger 40,488 - - - - - (1,505) 38,983
Itaocara Energia 24,797 9,732 - - - 2 (1,170) 33,361
Axxiom 24,598 14,994 (14,994) (227) - (106) 420 24,685
Amazônia Energia 138,631 41,116 - - - (3,641) (6,220) 169,886
Energia Olímpica - - - - - - 2,497 2,497
TOTAL 3,619,949 172,842 (14,994) (206,517) 8,671 (4,059) 50,823 3,626,715
Dividends12.31.2014 Capital increase
Parent Company
Equity in the earnings of subsidiaries12.31.2015
Funds allocated to
capital increase
Comprehensive
income (a)
Other (a) Profit & Loss
Light Energia
Renova Energia 480,275 52,137 - 6,950 (60,889) (172,930) 305,543
Guanhães Energia 11,858 25,596 - - (664) (98,271) (61,481)
Lightger 38,983 - (669) - 1 4,240 42,555
Axxiom 24,685 - (150) - 441 (4,926) 20,050
Amazônia Energia 169,886 99,917 - - (194) (2,279) 267,330
Energia Olímpica 2,497 - - - (1,060) 103 1,540
TOTAL 728,184 177,650 (819) 6,950 (62,365) (274,063) 575,537
12.31.2016Comprehensive
incomeDividendsCapital increase12.31.2015
Consolidated
Equity in the earnings of subsidiaries
Other Profit & Loss
Light Energia
Renova Energia 514,543 - - - 8,671 (61,696) 18,757 480,275
Guanhães Energia 86,766 - - - - (38,354) (36,554) 11,858
Lightger 40,488 - - - - - (1,505) 38,983
Axxiom 24,598 14,994 (14,994) (227) - (106) 420 24,685
Amazônia Energia 138,631 41,116 - - - (3,641) (6,220) 169,886
Energia Olímpica - - - - - - 2,497 2,497
TOTAL 805,026 56,110 (14,994) (227) 8,671 (103,797) (22,605) 728,184
Funds allocated to
capital increaseCapital increase 12.31.2014 Dividends
Comprehensive
income
Equity in the earnings of subsidiaries12.31.2015
Consolidated

vs vsvsvsvs
51
(a) The main effect in Renova Energia was the realization of the added value of the concession, which was allocated to wind farms sold to TerraForm Global after the loss recognition of Renova Energia’s investment in TerraForm Global. The main effect on Guanhães Energia was the provision for investment impairment carried out on December 31, 2015.
Below, the full balances on December 31, 2016 and 2015, and the results in the years ended December 31, 2016 and 2015 of the main jointly-controlled entities, which were recorded under the equity method:
(1) Renova Energia recorded a loss of R$455,427 in the year ended December 31, 2016, of which (i) R$281,030 refers to the provision for impairment losses in the investment in Terraform Global, due to the period decline in its share price, and (ii) R$174,397 refers to estimated losses with the put option Renova Energia holds against SunEdison, given that the latter has announced that it has filed a request for Court-Supervised Reorganization in April 2016.
12.31.2016 Axxiom Amazônia Lightger Renova Guanhães Energia Olímpica
ASSETS
Current 65,829 63 34,912 135,860 15,923 5,523
Cash and cash equivalents 9,041 51 31,817 35,786 1,185 2,781
Other 56,788 12 3,095 100,074 14,738 2,742
Non-current 13,480 1,048,383 152,301 5,765,276 65,143 33
TOTAL ASSETS 79,309 1,048,446 187,213 5,901,136 81,066 5,556
LIABILITIES
Current 32,317 94 17,330 3,346,901 190,672 2,483
Loans, financing and debentures 9,769 - 8,553 2,715,544 190,175 -
Other 22,548 94 8,777 631,357 497 2,483
Non-current 7,678 - 86,413 598,637 10,946 -
Loans, financing and debentures 6,509 - 86,413 93,338 - -
Other 1,169 - - 505,299 10,946 -
Shareholders’ equity 39,314 1,048,352 83,470 1,955,598 (120,552) 3,073
TOTAL LIABILITIES AND SHAREHOLDERS' EQUITY 79,309 1,048,446 187,213 5,901,136 81,066 5,556
2016 Axxiom Amazônia Lightger Renova Guanhães Energia Olímpica
STATEMENT OF INCOME
Net revenue from sales 57,217 - 18,716 483,137 - -
Cost of sales (63,842) - - (453,613) - -
GROSS PROFIT/ (LOSS) (6,624) - 18,716 29,524 - -
General and administrative expenses (7,853) (1,439) (1,619) (80,238) (974) (468)
Equity in the earnings of subsidiaries - (7,519) - (5,013) (90,274) -
Provision for impairment - - - (261,723) - -
Investment losses (1) - - - (455,427) - -
Other revenues - - - 20,373 - -
Net financial result 200 20 (6,471) (402,601) (101,443) 674
EARNINGS BEFORE INCOME TAX AND SOCIAL CONTRIBUTION (14,278) (8,938) 10,626 (1,155,105) (192,691) 206
Income tax and social contribution 4,621 - (2,312) 53,633 - -
NET INCOME (LOSS) FOR THE YEAR (9,657) (8,938) 8,314 (1,101,472) (192,691) 206

vs vsvsvsvs
52
On December 31, 2016, current liabilities from the Jointly controlled indirect entity Guanhães Energia were higher than current assets by R$174,749 (R$209,973 on December 31, 2015). In January 2017, Guanhães Energia’s shareholders made a capital transfer to settle loans with financial institutions, as mentioned in Note 40.
On December 31, 2016, current liabilities from the Jointly controlled indirect entity Renova Energia were higher than current assets by R$3,210,536 (R$946,376 on December 31, 2015). The main reasons for the current scenario are: (i) purchase of energy to honor the commitments related to the delay in the operation of wind farms; (Ii) relevant investments being allocated in the construction of the Alto Sertão III parks and (iii) delay in the release of long-term financing from BNDES. In view of this scenario, the Company has been carrying out several actions with the objective of rebalancing its liquidity and cash generation structure, such as reduction of administrative expenses, capital contributions and anticipation of resources by controlling shareholders, postponement of certain projects and contracting of long-term financing with the BNDES.
12.31.2015 Axxiom Amazônia Lightger Renova Guanhães Energia Olímpica
ASSETS
Current 73,977 464 23,254 550,630 2,012 10,871
Cash and cash equivalents 6,885 453 18,381 66,147 1,460 8,269
Other 67,092 11 4,873 484,483 552 2,602
Non-current 14,322 682,970 160,944 5,472,831 233,224 33
TOTAL ASSETS 88,299 683,434 184,198 6,023,461 235,236 10,904
LIABILITIES
Current 33,827 94 14,457 1,497,006 211,985 5,920
Loans, financing and debentures 6,367 - 8,460 762,584 211,502 -
Other 27,460 94 5,997 734,422 483 5,920
Non-current 5,819 - 93,303 1,898,539 - -
Loans, financing and debentures 5,006 - 93,303 1,609,672 - -
Other 813 - - 288,867 - -
Shareholders’ equity 48,653 683,339 76,438 2,627,916 23,251 4,984
TOTAL LIABILITIES AND SHAREHOLDERS' EQUITY 88,299 683,433 184,198 6,023,461 235,236 10,904
2015 Axxiom Amazônia Lightger Renova Guanhães Energia Olímpica
STATEMENT OF INCOME
Net revenue from sales 58,933 - 7,251 409,830 - 91,371
Cost of sales (51,749) - - (213,385) - (77,773)
GROSS PROFIT 7,184 - 7,251 196,445 - 13,598
General and administrative expenses (6,296) (1,523) (2,010) (128,626) (418) (4,911)
Equity in the earnings of subsidiaries - (5,026) - (3,662) (37,641) (701)
Gains from the sale of assets - - - 672,351 - -
Investment losses - (17,878) - (279,144) - -
Other revenues - - - 13,406 - -
Net financial result - 34 (6,505) (132,121) (33,606) (471)
EARNINGS BEFORE INCOME TAX AND SOCIAL CONTRIBUTION 888 (24,393) (1,264) 338,649 (71,665) 7,515
Income tax and social contribution (65) - (1,687) (220,457) (9) (2,531)
NET INCOME (LOSS) FOR THE YEAR 823 (24,393) (2,951) 118,192 (71,674) 4,984
vs vsvsvsvs
53
a) Consortia
• Itaocara Hydroelectric Power Plant Consortium The Company, through the subsidiary Itaocara Energia, holds a 51% interest in the UHE Itaocara consortium, while Cemig Geração e Transmissão S.A. – Cemig GT holds the other 49.0%. The consortium aims to explore the Itaocara hydroelectric power plant. Assets and liabilities balances referring to the participation in the Consortium are incorporated into the subsidiary’s balances. On December 28th, 2011, IBAMA granted the prior license and on July 29, 2013, Itaocara Hydroelectric Power Plant obtained the installation license allowing the beginning of works. On October 23, 2015, the concession agreement was signed by UHE Itaocara Consortium, related to the concession of the Hydroelectric Power Plant Itaocara I, with energy sold for 30 years, in the regulated trading environment (ACR), for R$154.99/MWh (reference date – April 2015). The plant will be built by Hidrelétrica Itaocara and is expected to begin operations in 2019.
• Maracanã Solar Consortium The Company, through subsidiary Light Esco, holds a 51.0% interest in the Maracanã Solar consortium, whereas EDF Consultoria holds 49.0% interest. The consortium aimed at the development, construction and operation of a photovoltaic plant with capacity of 391 kWp, installed on the top of the Maracanã stadium. The construction was concluded in the second quarter of 2013. No amount was recorded because the Company does not expect to recover the fixed assets invested by the Consortium.
• Água Limpa Hydroelectric Power Plant Consortium The Company, through its subsidiary Light Energia, is a party to the Água Limpa Hydroelectric Power Plant Consortium, with a 51.0% interest, and the other party is Cemig GT, with a 49.0% interest. The consortium’s purpose is to analyze participation in the project to implement, operate, maintain and commercially explore the project. There were no relevant expenses incurred until December 31, 2016.
vs vsvsvsvs
54
b) Events that took place at Renova Energia
• Sale of assets of the Jointly controlled entity Renova Energia to TerraForm Global, Inc. (“TerraForm Global”)
On September 19, 2015, the first phase of the operation between Renova Energia and TerraForm Global was concluded with the sale of operating wind assets of Bahia and Salvador projects. The projects’ assets were sold for R$R$451,000 in cash (already received) and R$R$845,026 in Terraform Global shares, respectively. This operation resulted in a gain of R$70,433 for the subsidiary Light Energia, recognized as equity in the earnings (losses) of subsidiaries in 2015 due to the interest held by Light Energia in Renova Energia.
• Termination of the Purchase and Sale Agreement of Renova Shares (“CCVA”) between the Light Energia subsidiary and SunEdison, INC. (“SunEdison”).
On December 1, 2015, Light Energia received a notification from SunEdison declaring the termination of the CCVA. Under the terms of the Agreement, if the closing of the Transaction did not occur until November 30, 2015, either party could, through a notice to the other party, terminate the CCVA without any charges. The completion of the Transaction was subject to a number of conditions precedent and, although some of these conditions had not been fully met, SunEdison and Light Energia were negotiating to conclude the Transaction. However, due to adverse market conditions, the negotiations did not prosper.
• Termination of Phase II of Renova Energia's Agreement with TerraForm Global On December 1, 2015, Renova Energia received a notification from TerraForm Global declaring the termination of the second phase of its Agreement with TerraForm Global and SunEdison. One of the conditions precedent for the completion of this phase of the agreement was the conclusion of the sale to SunEdison of Light Energia’s interest in the controlling interest of Renova Energia. With the non-fulfillment of the sale of this interest, the second phase of the Agreement was automatically terminated.
• Execution of Renova Energia’s Shareholders Support Agreement On February 26, 2016, the Shareholders Support Agreement was entered into by the Light Energia subsidiary, RR Participações, Cemig GT, Planner Trustee Distribuidora de Títulos e Valores Mobiliários Ltda., with Renova Energia as the intervening party. The members of Renova Energia's Controlling Interest pledged to invest resources in the subsidiary, in the form of capital stock, if there are insufficient resources available in Renova Energia for the payment of interest of its 3rd debenture issue. According to Light Energia’s interest in Renova Energia’s capital stock, the estimated value of this possible future liability is approximately R$88,417, without scheduled settlement.

vs vsvsvsvs
55
• Capital increase in the Jointly controlled entity Renova Energia On February 2, 2016, Renova’s Management approved a capital increase of up to R$731,248 by issuing up to 81,587,997 new common shares and up to 28,208,946 new preferred shares. Through this capital increase, concluded in the first half of 2016, Cemig Geração e Transmissão S.A. (Cemig GT) and the subsidiary Light Energia made capital transfers of R$240,000 and R$40,000, respectively. On December 23, 2016, Renova’s Management approved a capital increase of up to R$300,000 by issuing up to 115,952,502 new common shares and up to 34,047,498 new preferred shares. Through this capital increase, Cemig Geração e Transmissão S.A. (Cemig GT) and the subsidiary Light Energia had made capital transfers of R$37,863 and R$12,137, respectively, by December 31, 2016. The Capital Increase is one of the initiatives to follow up with Renova Energia’s business plan after the termination of the transaction’s Phase II with TerraForm Global and strengthened the Company’s cash and cope with the implementation of the projects already under construction and in development phase, as well as to honor the holding company’s expenses and debt.
• SunEdison’s request for Court-Supervised Reorganization
On April 1, 2016, the contract for the sale of ESPRA’s assets by Renova Energia, as set forth in the first phase of the agreement signed with TerraForm Global, was terminated. The contract cancellation was agreed between the parties upon payment of a break-up fee totaling US$10.0 million by TerraForm Global to Renova Energia. On the same date, Renova Energia notified SunEdison and TerraForm Global of its intention to exercise the put option for 7,000,000 shares it holds in TerraForm Global. On April 21, 2016, SunEdison filed a request for court-supervised reorganization and Renova Energia is taking all the applicable legal measures to ensure the exercise of its rights, which influenced the financial instrument’s pricing based on the risk model defined by Renova Energia.
• Reversal of added value of the Jointly controlled entity Renova Energia
On December 31, 2016, the Company reassessed the recoverability of the added value registered in the Jointly controlled entity Renova Energia and, due to the estimated results, decided to lower the goodwill recorded in the amount of R$60,892, in the equity line.
c) Capital increase in the subsidiary Light SESA
On December 30, 2015, the parent company Light S.A. made a contribution of R$107,000 to the subsidiary Light SESA. In addition, on September 29, 2016, the parent

vs vsvsvsvs
56
company Light S.A. made a contribution of R$125,000 to subsidiary Light SESA. d) Reversal of added value of the the Jointly controlled entity Guanhães Energia On December 31, 2015, the Company reassessed the recoverability of the added value registered in the Jointly controlled entity Guanhães Energia and, due to the estimated results, decided to lower the goodwill recorded in the amount of R$16,229, in the equity line. e) Nonadherence by the subsidiary Light Energia and the Jointly controlled entity
Lightger to the renegotiation proposal of the hydrological risk In January 2016, after the evaluation of the several scenarios of the Differences Settlement Price (“PLD”), together with the obligations and rights defined by Aneel’s Normative Resolution No. 684/2015, the Company decided not to adhere to the renegotiation proposal of the hydrological risk in the Free Market (”ACL”), pursuant to the conditions set out. f) Capital increase in subsidiary Light Esco
On September 29, 2016, the Company Light S.A. made a contribution, in the amount of R$66,500, in the subsidiary Light Esco. g) Negative equity of the Jointly controlled entity Guanhães Energia
On December 31, 2016, the Company recognized R$56,087 related to negative equity at the Jointly controlled entity Guanhães Energia after recognizing a provision for impairment of the plants under construction, whose works are temporarily suspended. h) Conclusions of the independent research in Norte Energia (NESA) The Eletrobras, which holds a 49.98% interest in NESA, hired a specialized law firm to conduct an independent internal investigation for the purpose of ascertaining any irregularities in ventures in which it holds a corporate interest, including NESA. This procedure was motivated by investigations that were being carried out by the Public Prosecutor's Office on irregularities involving some of the contractors and suppliers in investments where Eletrobras was a shareholder, including NESA. The final reports of the independent internal investigation include certain findings with estimated impacts on the NESA financial statements, and it has been determined that certain contracts with some contractors and suppliers of the Belo Monte UHE project have estimated impacts of 1% of the contract price, plus some other estimates of fixed amounts, to include bribes and manipulation activities of proposals considered of illicit nature.

vs vsvsvsvs
57
Accordingly, NESA adjusted the estimated amounts of capitalized excess costs in the amount of R$183,000, related to illegal payments in the result for the year ended on December 31, 2015 due to the impracticability of the identification of adjustments for each affected period. As a consequence of this adjustment, the Company recognized, on December 31, 2015, an adjustment in the amount of R$4,559, in the investment account against the equity accounting result. Other investigations and legal actions conducted by public entities involving other shareholders of NESA and certain executives of these other shareholders are in progress. As the evolution of these investigations and legal measures produce relevant information, the Company will evaluate any additional impacts on the financial statements, which will be accounted for and / or disclosed when applicable. 13. PROPERTY, PLANT AND EQUIPMENT
(a) Distribution property, plant and equipment refers to non-electrical equipment
12.31.2015
Average
annual rateHistorical cost
Accumulated
depreciationNet value Net value
Generation 3.32 2,828,487 (1,738,127) 1,090,360 1,090,207
Transmission 3.91 51,642 (34,921) 16,721 13,237
Distribution (a) 10.27 24,790 (23,821) 969 1,137
Administration 7.96 422,994 (216,850) 206,144 165,926
Trading 7.43 99,494 (23,200) 76,294 82,013
IN SERVICE 3,427,407 (2,036,919) 1,390,488 1,352,520
Generation 200,437 - 200,437 231,921
Administration 47,516 - 47,516 125,192
IN PROGRESS 247,953 - 247,953 357,113
TOTAL PROPERTY, PLANT AND EQUIPMENT 3,675,360 (2,036,919) 1,638,441 1,709,633
12.31.2016
Consolidated
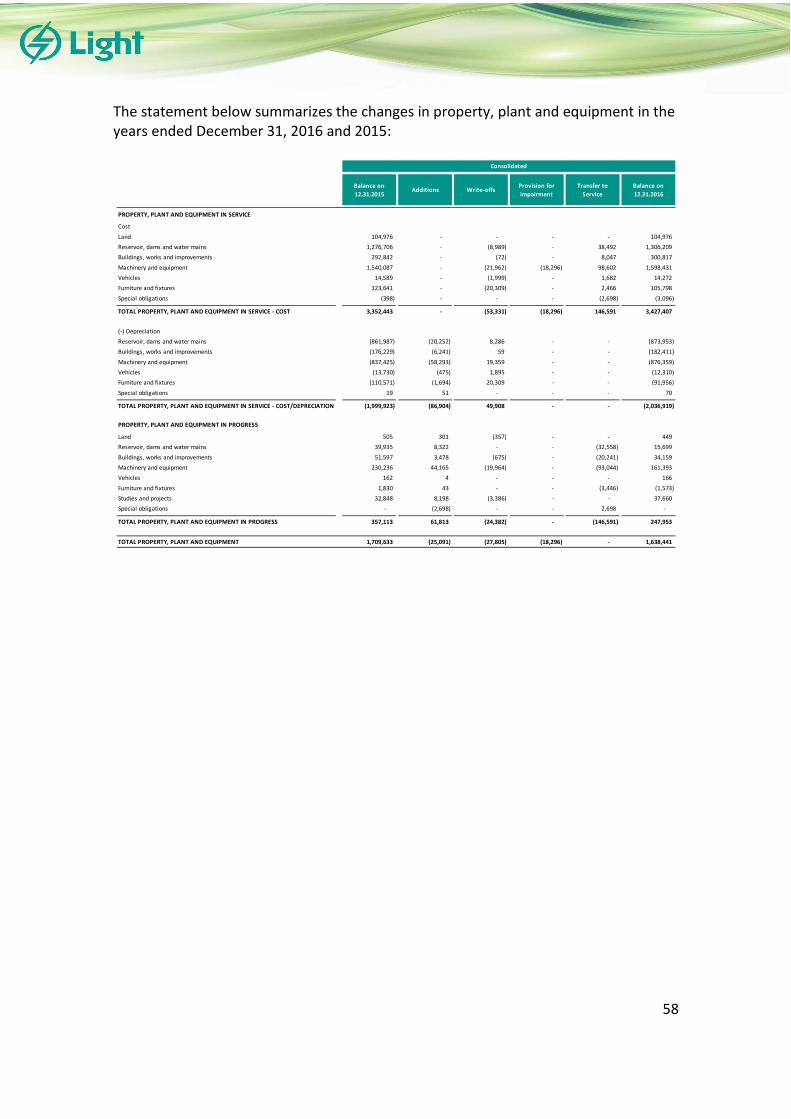
vs vsvsvsvs
58
The statement below summarizes the changes in property, plant and equipment in the years ended December 31, 2016 and 2015:
Balance on
12.31.2015Additions Write-offs
Provision for
impairment
Transfer to
Service
Balance on
12.31.2016
PROPERTY, PLANT AND EQUIPMENT IN SERVICE
Cost
Land 104,976 - - - - 104,976
Reservoir, dams and water mains 1,276,706 - (8,989) - 38,492 1,306,209
Buildings, works and improvements 292,842 - (72) - 8,047 300,817
Machinery and equipment 1,540,087 - (21,962) (18,296) 98,602 1,598,431
Vehicles 14,589 - (1,999) - 1,682 14,272
Furniture and fixtures 123,641 - (20,309) - 2,466 105,798
Special obligations (398) - - - (2,698) (3,096)
TOTAL PROPERTY, PLANT AND EQUIPMENT IN SERVICE - COST 3,352,443 - (53,331) (18,296) 146,591 3,427,407
(-) Depreciation
Reservoir, dams and water mains (861,987) (20,252) 8,286 - - (873,953)
Buildings, works and improvements (176,229) (6,241) 59 - - (182,411)
Machinery and equipment (837,425) (58,293) 19,359 - - (876,359)
Vehicles (13,730) (475) 1,895 - - (12,310)
Furniture and fixtures (110,571) (1,694) 20,309 - - (91,956)
Special obligations 19 51 - - - 70
TOTAL PROPERTY, PLANT AND EQUIPMENT IN SERVICE - COST/DEPRECIATION (1,999,923) (86,904) 49,908 - - (2,036,919)
PROPERTY, PLANT AND EQUIPMENT IN PROGRESS
Land 505 301 (357) - - 449
Reservoir, dams and water mains 39,935 8,322 - - (32,558) 15,699
Buildings, works and improvements 51,597 3,478 (675) - (20,241) 34,159
Machinery and equipment 230,236 44,165 (19,964) - (93,044) 161,393
Vehicles 162 4 - - - 166
Furniture and fixtures 1,830 43 - - (3,446) (1,573)
Studies and projects 32,848 8,198 (3,386) - - 37,660
Special obligations - (2,698) - - 2,698 -
TOTAL PROPERTY, PLANT AND EQUIPMENT IN PROGRESS 357,113 61,813 (24,382) - (146,591) 247,953
TOTAL PROPERTY, PLANT AND EQUIPMENT 1,709,633 (25,091) (27,805) (18,296) - 1,638,441
Consolidated

vs vsvsvsvs
59
In the year ended December 31, 2016, R$4,255 (R$4,865 in the year ended December 31, 2015) was carried to property, plant and equipment as interest capitalization, with average capitalization rate of 11.0% p.a.
(i) Annual depreciation rates: The schedule below summarizes significant depreciation rates, based on the assets’ estimated useful lives and in line with ANEEL Resolution No. 674, of August 11, 2015:
The Company did not identify signs of impairment for most of its property, plant and equipment items in 2016 and 2015. The concession agreements of the hydroelectric power plants of subsidiary Light Energia establish that at the end of each concession’s term the granting authority will determine the amount to be indemnified, so that
Balance on
01.01.2015Additions Write-offs
Transfer to
Service
Balance on
12.31.2015
PROPERTY, PLANT AND EQUIPMENT IN SERVICE
Cost
Land 104,976 - - - 104,976
Reservoir, dams and water mains 1,265,186 - (135) 11,655 1,276,706
Buildings, works and improvements 286,532 - - 6,310 292,842
Machinery and equipment 1,497,460 - (5,013) 47,640 1,540,087
Vehicles 14,451 - - 138 14,589
Furniture and fixtures 129,994 - (6,384) 31 123,641
Special obligations (398) - - - (398)
TOTAL PROPERTY, PLANT AND EQUIPMENT IN SERVICE - COST 3,298,201 - (11,532) 65,774 3,352,443
(-) Depreciation
Reservoir, dams and water mains (840,743) (21,281) 37 - (861,987)
Buildings, works and improvements (170,107) (6,122) - - (176,229)
Machinery and equipment (782,945) (55,167) 687 - (837,425)
Vehicles (13,334) (381) - - (13,715)
Furniture and fixtures (113,788) (3,167) 6,384 - (110,571)
Special obligations 4 - - - 4
TOTAL PROPERTY, PLANT AND EQUIPMENT IN SERVICE - COST/DEPRECIATION(1,920,913) (86,118) 7,108 - (1,999,923)
PROPERTY, PLANT AND EQUIPMENT IN PROGRESS
Land 228 277 - - 505
Reservoir, dams and water mains 43,229 10,001 - (13,295) 39,935
Buildings, works and improvements 53,951 7,372 (2,589) (7,137) 51,597
Machinery and equipment 191,679 83,899 - (45,342) 230,236
Vehicles 20 142 - - 162
Furniture and fixtures 1,394 645 (209) - 1,830
Studies and projects 37,298 274 (4,724) - 32,848
TOTAL PROPERTY, PLANT AND EQUIPMENT IN PROGRESS 327,799 102,610 (7,522) (65,774) 357,113
TOTAL PROPERTY, PLANT AND EQUIPMENT 1,705,087 16,492 (11,946) - 1,709,633
Consolidated
GENERATION % SALES % ADMINISTRATION % TRANSMISSION %31.03.2
Dams 2.50 Buildings 3.33 Buildings 3.33 System conductor 2.70
Circuit breaker 3.03 General equipment 6.25 General equipment 6.25 General equipment 6.25
Buildings 3.33 Vehicles 14.29 Vehicles 14.29 System structure 2.70
Water intake equipment 3.70 Recloser 4.00
Water intake structure 2.86
Generator 3.33
Reservoirs, dams and water mains 2.00
Local communication system 6.67
Water turbine 2.50
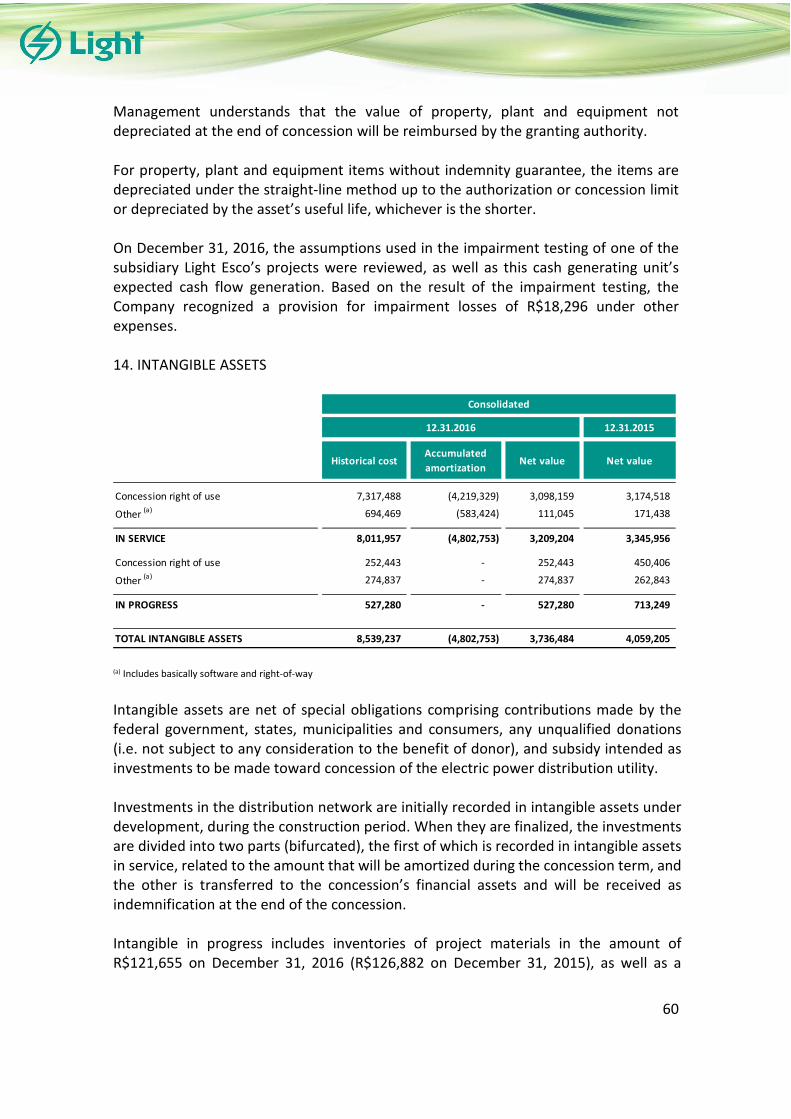
vs vsvsvsvs
60
Management understands that the value of property, plant and equipment not depreciated at the end of concession will be reimbursed by the granting authority. For property, plant and equipment items without indemnity guarantee, the items are depreciated under the straight-line method up to the authorization or concession limit or depreciated by the asset’s useful life, whichever is the shorter. On December 31, 2016, the assumptions used in the impairment testing of one of the subsidiary Light Esco’s projects were reviewed, as well as this cash generating unit’s expected cash flow generation. Based on the result of the impairment testing, the Company recognized a provision for impairment losses of R$18,296 under other expenses. 14. INTANGIBLE ASSETS
(a) Includes basically software and right-of-way
Intangible assets are net of special obligations comprising contributions made by the federal government, states, municipalities and consumers, any unqualified donations (i.e. not subject to any consideration to the benefit of donor), and subsidy intended as investments to be made toward concession of the electric power distribution utility. Investments in the distribution network are initially recorded in intangible assets under development, during the construction period. When they are finalized, the investments are divided into two parts (bifurcated), the first of which is recorded in intangible assets in service, related to the amount that will be amortized during the concession term, and the other is transferred to the concession’s financial assets and will be received as indemnification at the end of the concession. Intangible in progress includes inventories of project materials in the amount of R$121,655 on December 31, 2016 (R$126,882 on December 31, 2015), as well as a
12.31.2015
Historical costAccumulated
amortizationNet value Net value
Concession right of use 7,317,488 (4,219,329) 3,098,159 3,174,518
Other (a) 694,469 (583,424) 111,045 171,438
IN SERVICE 8,011,957 (4,802,753) 3,209,204 3,345,956
Concession right of use 252,443 - 252,443 450,406
Other (a) 274,837 - 274,837 262,843
IN PROGRESS 527,280 - 527,280 713,249
TOTAL INTANGIBLE ASSETS 8,539,237 (4,802,753) 3,736,484 4,059,205
12.31.2016
Consolidated

vs vsvsvsvs
61
provision for inventory devaluation in the amount of R$5,131 (R$4,880 on December 31, 2015). The Company has not identified signs of impairment of its other intangible assets.
A total amount of R$32,220 (R$29,957 in the year ended December 31, 2015) was carried to intangible assets as interest capitalization in the year ended December 31, 2016, with an average capitalization rate of 11.0% p.a. The infrastructure used by subsidiary Light SESA is associated with the distribution service, and therefore cannot be removed, disposed of, assigned, conveyed, or encumbered as mortgage collateral without the prior written authorization of the granting authority, which authorization, if given, is regulated by Resolution ANEEL No. 20/99. Below is a summary of changes in the intangible assets in the years ended December 31, 2016 and 2015:
(a) Transfer to Concession Financial Asset, as a result of the split of assets upon start-up, pursuant to IFRIC 12 / ICPC 01, and transfer from Concession Financial Asset referring to Special Obligations (see Note 10).
Balance on
12.31.2015Additions Write-offs
Inter-account
transfers (a)
Balance on
12.31.2016
IN SERVICE
Concession right of use 7,607,568 - (204,043) 427,251 7,830,776
Special obligations - concession right of use (376,756) - - (136,532) (513,288)
7,230,812 - (204,043) 290,719 7,317,488
Other 703,999 - (10,714) 83,670 776,955
Special obligations - other - - - (82,486) (82,486)
703,999 - (10,714) 1,184 694,469
TOTAL INTANGIBLE ASSETS IN SERVICE 7,934,811 - (214,757) 291,903 8,011,957
(-) Amortization
Concession right of use (4,119,785) (374,386) 182,879 - (4,311,292)
Special obligations - concession right of use 63,491 28,472 - - 91,963
(4,056,294) (345,914) 182,879 - (4,219,329)
Other (532,561) (68,744) 10,178 - (591,127)
Special obligations - other - 7,703 - - 7,703
(532,561) (61,041) 10,178 - (583,424)
TOTAL INTANGIBLE ASSETS IN PROGRESS/AMORTIZATION (4,588,855) (406,955) 193,057 - (4,802,753)
IN PROGRESS
Concession right of use 737,699 918,348 (948) (1,105,809) 549,290
Special obligations - concession right of use (287,293) (549,293) - 539,739 (296,847)
450,406 369,055 (948) (566,070) 252,443
Other 262,843 80,291 (2,165) (66,132) 274,837
Special obligations - other - (11,699) - 11,699 -
262,843 68,592 (2,165) (54,433) 274,837
TOTAL INTANGIBLE ASSETS IN PROGRESS 713,249 437,647 (3,113) (620,503) 527,280
TOTAL 4,059,205 30,692 (24,813) (328,600) 3,736,484
Consolidated
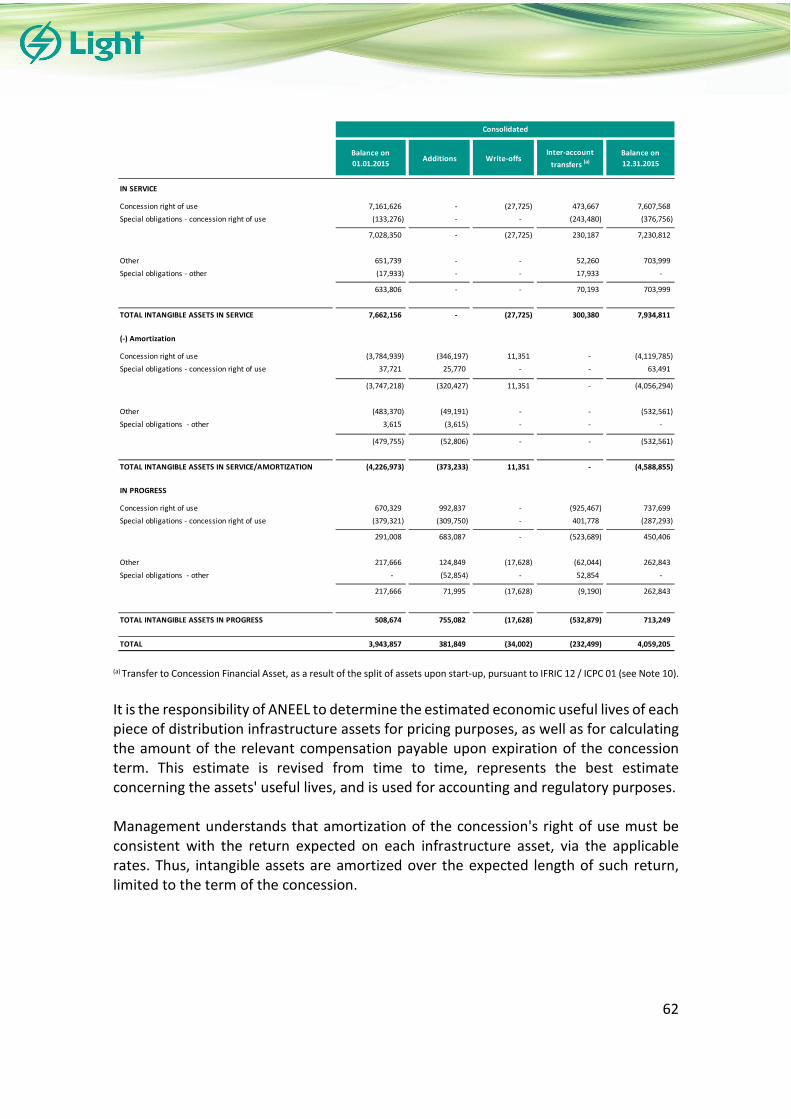
vs vsvsvsvs
62
(a) Transfer to Concession Financial Asset, as a result of the split of assets upon start-up, pursuant to IFRIC 12 / ICPC 01 (see Note 10).
It is the responsibility of ANEEL to determine the estimated economic useful lives of each piece of distribution infrastructure assets for pricing purposes, as well as for calculating the amount of the relevant compensation payable upon expiration of the concession term. This estimate is revised from time to time, represents the best estimate concerning the assets' useful lives, and is used for accounting and regulatory purposes. Management understands that amortization of the concession's right of use must be consistent with the return expected on each infrastructure asset, via the applicable rates. Thus, intangible assets are amortized over the expected length of such return, limited to the term of the concession.
Balance on
01.01.2015Additions Write-offs
Inter-account
transfers (a)
Balance on
12.31.2015
IN SERVICE
Concession right of use 7,161,626 - (27,725) 473,667 7,607,568
Special obligations - concession right of use (133,276) - - (243,480) (376,756)
7,028,350 - (27,725) 230,187 7,230,812
Other 651,739 - - 52,260 703,999
Special obligations - other (17,933) - - 17,933 -
633,806 - - 70,193 703,999
TOTAL INTANGIBLE ASSETS IN SERVICE 7,662,156 - (27,725) 300,380 7,934,811
(-) Amortization
Concession right of use (3,784,939) (346,197) 11,351 - (4,119,785)
Special obligations - concession right of use 37,721 25,770 - - 63,491
(3,747,218) (320,427) 11,351 - (4,056,294)
Other (483,370) (49,191) - - (532,561)
Special obligations - other 3,615 (3,615) - - -
(479,755) (52,806) - - (532,561)
TOTAL INTANGIBLE ASSETS IN SERVICE/AMORTIZATION (4,226,973) (373,233) 11,351 - (4,588,855)
IN PROGRESS
Concession right of use 670,329 992,837 - (925,467) 737,699
Special obligations - concession right of use (379,321) (309,750) - 401,778 (287,293)
291,008 683,087 - (523,689) 450,406
Other 217,666 124,849 (17,628) (62,044) 262,843
Special obligations - other - (52,854) - 52,854 -
217,666 71,995 (17,628) (9,190) 262,843
TOTAL INTANGIBLE ASSETS IN PROGRESS 508,674 755,082 (17,628) (532,879) 713,249
TOTAL 3,943,857 381,849 (34,002) (232,499) 4,059,205
Consolidated
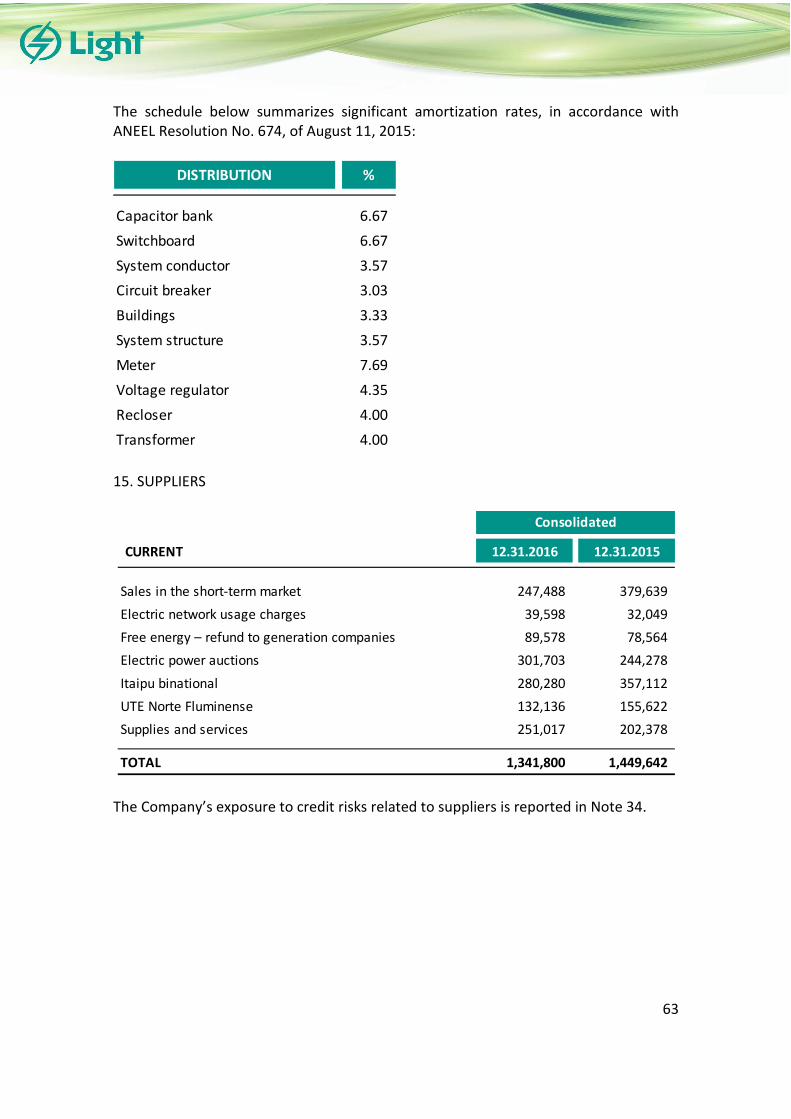
vs vsvsvsvs
63
The schedule below summarizes significant amortization rates, in accordance with ANEEL Resolution No. 674, of August 11, 2015:
15. SUPPLIERS
The Company’s exposure to credit risks related to suppliers is reported in Note 34.
DISTRIBUTION %
Capacitor bank 6.67
Switchboard 6.67
System conductor 3.57
Circuit breaker 3.03
Buildings 3.33
System structure 3.57
Meter 7.69
Voltage regulator 4.35
Recloser 4.00
Transformer 4.00
CURRENT 12.31.2016 12.31.2015
Sales in the short-term market 247,488 379,639
Electric network usage charges 39,598 32,049
Free energy – refund to generation companies 89,578 78,564
Electric power auctions 301,703 244,278
Itaipu binational 280,280 357,112
UTE Norte Fluminense 132,136 155,622
Supplies and services 251,017 202,378
TOTAL 1,341,800 1,449,642
Consolidated
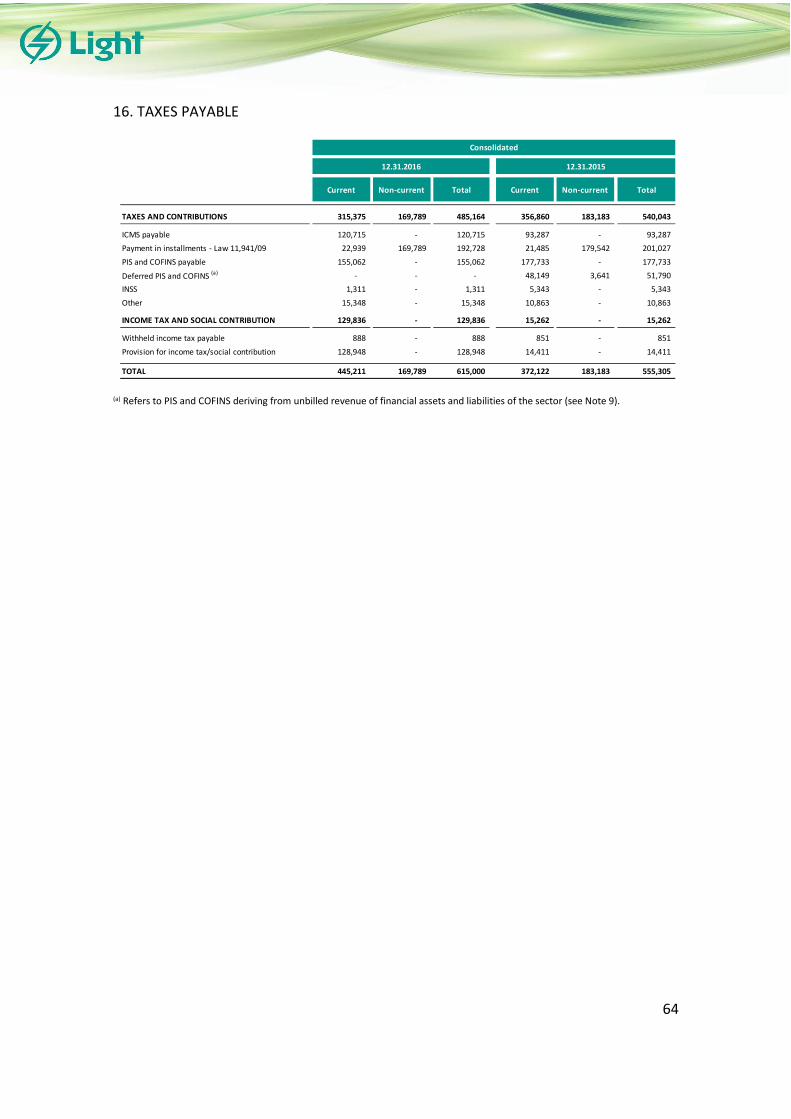
vs vsvsvsvs
64
16. TAXES PAYABLE
(a) Refers to PIS and COFINS deriving from unbilled revenue of financial assets and liabilities of the sector (see Note 9).
Current Non-current Total Current Non-current Total
TAXES AND CONTRIBUTIONS 315,375 169,789 485,164 356,860 183,183 540,043
ICMS payable 120,715 - 120,715 93,287 - 93,287
Payment in installments - Law 11,941/09 22,939 169,789 192,728 21,485 179,542 201,027
PIS and COFINS payable 155,062 - 155,062 177,733 - 177,733
Deferred PIS and COFINS (a) - - - 48,149 3,641 51,790
INSS 1,311 - 1,311 5,343 - 5,343
Other 15,348 - 15,348 10,863 - 10,863 -
INCOME TAX AND SOCIAL CONTRIBUTION 129,836 - 129,836 15,262 - 15,262
Withheld income tax payable 888 - 888 851 - 851
Provision for income tax/social contribution 128,948 - 128,948 14,411 - 14,411
TOTAL 445,211 169,789 615,000 372,122 183,183 555,305
Consolidated
12.31.2016 12.31.2015
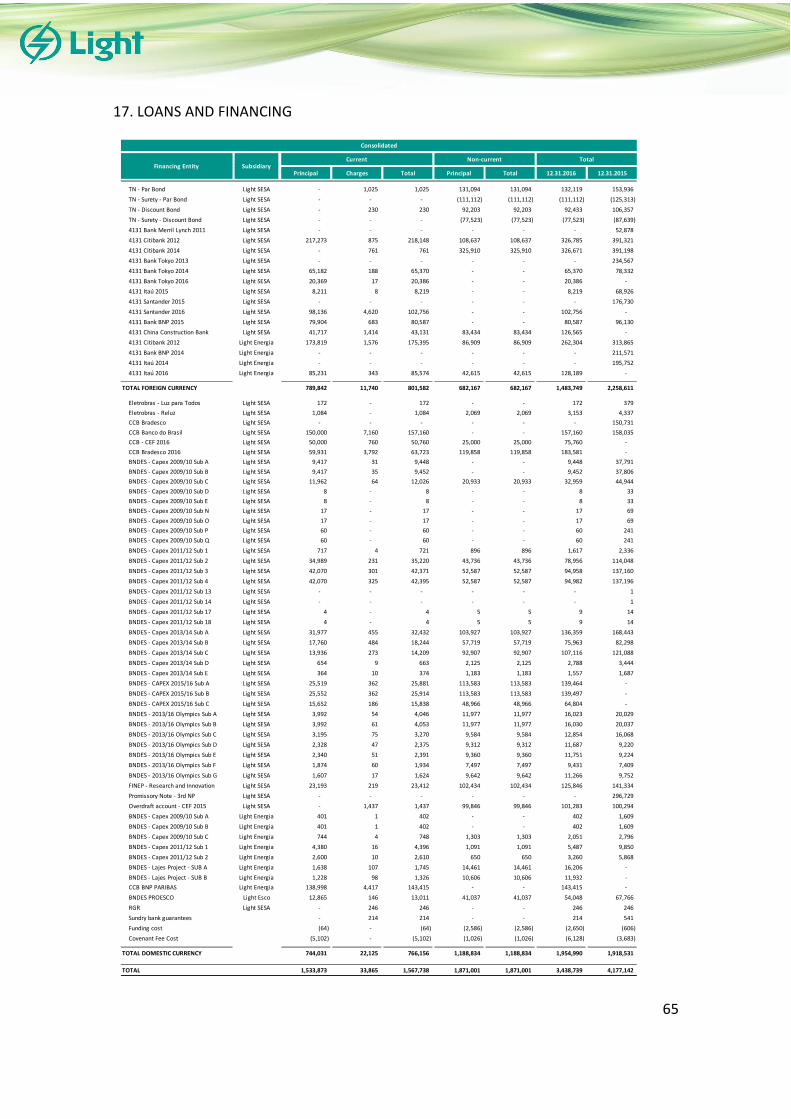
vs vsvsvsvs
65
17. LOANS AND FINANCING
Principal Charges Total Principal Total 12.31.2016 12.31.2015
TN - Par Bond Light SESA - 1,025 1,025 131,094 131,094 132,119 153,936
TN - Surety - Par Bond Light SESA - - - (111,112) (111,112) (111,112) (125,313)
TN - Discount Bond Light SESA - 230 230 92,203 92,203 92,433 106,357
TN - Surety - Discount Bond Light SESA - - - (77,523) (77,523) (77,523) (87,639)
4131 Bank Merril Lynch 2011 Light SESA - - - - - - 52,878
4131 Citibank 2012 Light SESA 217,273 875 218,148 108,637 108,637 326,785 391,321
4131 Citibank 2014 Light SESA - 761 761 325,910 325,910 326,671 391,198
4131 Bank Tokyo 2013 Light SESA - - - - - - 234,567
4131 Bank Tokyo 2014 Light SESA 65,182 188 65,370 - - 65,370 78,332
4131 Bank Tokyo 2016 Light SESA 20,369 17 20,386 - - 20,386 -
4131 Itaú 2015 Light SESA 8,211 8 8,219 - - 8,219 68,926
4131 Santander 2015 Light SESA - - - - - - 176,730
4131 Santander 2016 Light SESA 98,136 4,620 102,756 - - 102,756 -
4131 Bank BNP 2015 Light SESA 79,904 683 80,587 - - 80,587 96,130
4131 China Construction Bank Light SESA 41,717 1,414 43,131 83,434 83,434 126,565 -
4131 Citibank 2012 Light Energia 173,819 1,576 175,395 86,909 86,909 262,304 313,865
4131 Bank BNP 2014 Light Energia - - - - - - 211,571
4131 Itaú 2014 Light Energia - - - - - - 195,752
4131 Itaú 2016 Light Energia 85,231 343 85,574 42,615 42,615 128,189 -
TOTAL FOREIGN CURRENCY 789,842 11,740 801,582 682,167 682,167 1,483,749 2,258,611
Eletrobras - Luz para Todos Light SESA 172 - 172 - - 172 379
Eletrobras - Reluz Light SESA 1,084 - 1,084 2,069 2,069 3,153 4,337
CCB Bradesco Light SESA - - - - - - 150,731
CCB Banco do Brasil Light SESA 150,000 7,160 157,160 - - 157,160 158,035
CCB - CEF 2016 Light SESA 50,000 760 50,760 25,000 25,000 75,760 -
CCB Bradesco 2016 Light SESA 59,931 3,792 63,723 119,858 119,858 183,581 -
BNDES - Capex 2009/10 Sub A Light SESA 9,417 31 9,448 - - 9,448 37,791
BNDES - Capex 2009/10 Sub B Light SESA 9,417 35 9,452 - - 9,452 37,806
BNDES - Capex 2009/10 Sub C Light SESA 11,962 64 12,026 20,933 20,933 32,959 44,944
BNDES - Capex 2009/10 Sub D Light SESA 8 - 8 - - 8 33
BNDES - Capex 2009/10 Sub E Light SESA 8 - 8 - - 8 33
BNDES - Capex 2009/10 Sub N Light SESA 17 - 17 - - 17 69
BNDES - Capex 2009/10 Sub O Light SESA 17 - 17 - - 17 69
BNDES - Capex 2009/10 Sub P Light SESA 60 - 60 - - 60 241
BNDES - Capex 2009/10 Sub Q Light SESA 60 - 60 - - 60 241
BNDES - Capex 2011/12 Sub 1 Light SESA 717 4 721 896 896 1,617 2,336
BNDES - Capex 2011/12 Sub 2 Light SESA 34,989 231 35,220 43,736 43,736 78,956 114,048
BNDES - Capex 2011/12 Sub 3 Light SESA 42,070 301 42,371 52,587 52,587 94,958 137,160
BNDES - Capex 2011/12 Sub 4 Light SESA 42,070 325 42,395 52,587 52,587 94,982 137,196
BNDES - Capex 2011/12 Sub 13 Light SESA - - - - - - 1
BNDES - Capex 2011/12 Sub 14 Light SESA - - - - - - 1
BNDES - Capex 2011/12 Sub 17 Light SESA 4 - 4 5 5 9 14
BNDES - Capex 2011/12 Sub 18 Light SESA 4 - 4 5 5 9 14
BNDES - Capex 2013/14 Sub A Light SESA 31,977 455 32,432 103,927 103,927 136,359 168,443
BNDES - Capex 2013/14 Sub B Light SESA 17,760 484 18,244 57,719 57,719 75,963 82,298
BNDES - Capex 2013/14 Sub C Light SESA 13,936 273 14,209 92,907 92,907 107,116 121,088
BNDES - Capex 2013/14 Sub D Light SESA 654 9 663 2,125 2,125 2,788 3,444
BNDES - Capex 2013/14 Sub E Light SESA 364 10 374 1,183 1,183 1,557 1,687
BNDES - CAPEX 2015/16 Sub A Light SESA 25,519 362 25,881 113,583 113,583 139,464 -
BNDES - CAPEX 2015/16 Sub B Light SESA 25,552 362 25,914 113,583 113,583 139,497 -
BNDES - CAPEX 2015/16 Sub C Light SESA 15,652 186 15,838 48,966 48,966 64,804 -
BNDES - 2013/16 Olympics Sub A Light SESA 3,992 54 4,046 11,977 11,977 16,023 20,029
BNDES - 2013/16 Olympics Sub B Light SESA 3,992 61 4,053 11,977 11,977 16,030 20,037
BNDES - 2013/16 Olympics Sub C Light SESA 3,195 75 3,270 9,584 9,584 12,854 16,068
BNDES - 2013/16 Olympics Sub D Light SESA 2,328 47 2,375 9,312 9,312 11,687 9,220
BNDES - 2013/16 Olympics Sub E Light SESA 2,340 51 2,391 9,360 9,360 11,751 9,224
BNDES - 2013/16 Olympics Sub F Light SESA 1,874 60 1,934 7,497 7,497 9,431 7,409
BNDES - 2013/16 Olympics Sub G Light SESA 1,607 17 1,624 9,642 9,642 11,266 9,752
FINEP - Research and Innovation Light SESA 23,193 219 23,412 102,434 102,434 125,846 141,334
Promissory Note - 3rd NP Light SESA - - - - - - 296,729
Overdraft account - CEF 2015 Light SESA - 1,437 1,437 99,846 99,846 101,283 100,294
BNDES - Capex 2009/10 Sub A Light Energia 401 1 402 - - 402 1,609
BNDES - Capex 2009/10 Sub B Light Energia 401 1 402 - - 402 1,609
BNDES - Capex 2009/10 Sub C Light Energia 744 4 748 1,303 1,303 2,051 2,796
BNDES - Capex 2011/12 Sub 1 Light Energia 4,380 16 4,396 1,091 1,091 5,487 9,850
BNDES - Capex 2011/12 Sub 2 Light Energia 2,600 10 2,610 650 650 3,260 5,868
BNDES - Lajes Project - SUB A Light Energia 1,638 107 1,745 14,461 14,461 16,206 -
BNDES - Lajes Project - SUB B Light Energia 1,228 98 1,326 10,606 10,606 11,932 -
CCB BNP PARIBAS Light Energia 138,998 4,417 143,415 - - 143,415 -
BNDES PROESCO Light Esco 12,865 146 13,011 41,037 41,037 54,048 67,766
RGR Light SESA - 246 246 - - 246 246
Sundry bank guarantees - 214 214 - - 214 541
Funding cost (64) - (64) (2,586) (2,586) (2,650) (606)
Covenant Fee Cost (5,102) - (5,102) (1,026) (1,026) (6,128) (3,683)
TOTAL DOMESTIC CURRENCY 744,031 22,125 766,156 1,188,834 1,188,834 1,954,990 1,918,531
TOTAL 1,533,873 33,865 1,567,738 1,871,001 1,871,001 3,438,739 4,177,142
Financing Entity
Consolidated
Current Non-current TotalSubsidiary

vs vsvsvsvs
66
The statement below summarizes the contractual terms and conditions applicable to our loans and borrowings as of December 31, 2016:
Financing Entity SubsidiaryDate of
signatureCurrency Interest Rate p.a.
(a)Effective rate
(a) Beginning Payment End
TN - Par Bond Light SESA 04.29.1996 US$ 69.80% CDI 9.64% 2024 Lump sum 2024
TN - Surety - Par Bond Light SESA 04.29.1996 US$ U$ Treasury - 2024 Lump sum 2024
TN - Discount Bond Light SESA 04.29.1996 US$ 69.80% CDI 9.64% 2024 Lump sum 2024
TN - Surety - Discount Bond Light SESA 04.29.1996 US$ U$ Treasury - 2024 Lump sum 2024
4131 Bank Merril Lynch 2011 Light SESA 11.07.2011 US$ CDI + 0.65% 14.88% 2014 Half-annually 2016
4131 Citibank 2012 Light SESA 08.23.2012 US$ CDI + 1.00% 15.28% 2017 Half-annually 2018
4131 Citibank 2014 Light SESA 02.21.2014 US$ CDI + 1.15% 15.45% 2018 Lump sum 2018
4131 Bank Tokyo 2013 Light SESA 03.11.2013 US$ CDI + 0.90% 15.05% 2016 Lump sum 2016
4131 Bank Tokyo 2014 Light SESA 11.19.2014 US$ CDI + 0.88% 15.14% 2017 Lump sum 2017
4131 Bank Tokyo 2016 Light SESA 03.11.2016 US$ CDI + 4.28% 18.71% 2017 Lump sum 2017
4131 Itaú 2015 Light SESA 12.11.2015 US$ CDI + 3.50% 17.64% 2016 Monthly 2017
4131 Santander 2015 Light SESA 02.03.2015 US$ CDI + 2.0% 16.42% 2016 Lump sum 2016
4131 Santander 2016 Light SESA 02.02.2016 US$ CDI + 4.01% 18.15% 2017 Lump sum 2017
4131 Bank BNP 2015 Light SESA 04.01.2015 US$ CDI + 1.90% 16.31% 2017 Lump sum 2017
4131 China Construction Bank Light SESA 09.30.2016 US$ CDI + 5.42% 19.16% 2017 Annual 2019
4131 Citibank 2012 Light Energia 10.02.2012 US$ CDI + 1.10% 15.35% 2017 Half-annually 2018
4131 Bank BNP 2014 Light Energia 10.22.2014 EURO CDI + 1.40% 15.69% 2016 Lump sum 2016
4131 Itaú 2014 Light Energia 12.11.2014 US$ CDI + 1.75% 16.09% 2016 Lump sum 2016
4131 Itaú 2016 Light Energia 12.09.2016 US$ CDI + 5.83% 20.79% 2017 Quarterly 2018
Eletrobras - Luz para Todos Light SESA 06.30.2008 R$ 5.00% 5.00% 2008 Monthly 2017
Eletrobras - Reluz Light SESA 03.22.2010 R$ 5.00% 5.00% 2014 Monthly 2019
CCB Bradesco Light SESA 10.18.2007 R$ CDI + 0.85% 15.11% 2012 Annual 2017
CCB Banco do Brasil Light SESA 02.25.2013 R$ 109.3% of CDI 15.55% 2017 Lump sum 2017
CCB - CEF 2016 Light SESA 06.10.2016 R$ CDI + 4.05% 18.19% 2016 Quarterly 2018
CCB Bradesco 2016 Light SESA 11.16.2016 R$ CDI + 3.50% 17.64% 2017 Quarterly 2019
BNDES - Capex 2009/10 Sub A Light SESA 11.30.2009 URTJLP TJLP + 2.58% 10.08% 2011 Monthly 2019
BNDES - Capex 2009/10 Sub B Light SESA 11.30.2009 URTJLP TJLP + 3.58% 11.08% 2009 Monthly 2017
BNDES - Capex 2009/10 Sub C Light SESA 11.30.2009 R$ 4.50% 4.50% 2011 Monthly 2019
BNDES - Capex 2009/10 Sub D Light SESA 11.30.2009 URTJLP TJLP + 2.58% 10.08% 2011 Monthly 2017
BNDES - Capex 2009/10 Sub E Light SESA 11.30.2009 URTJLP TJLP + 3.58% 11.08% 2011 Monthly 2017
BNDES - Capex 2009/10 Sub N Light SESA 11.30.2009 URTJLP TJLP + 2.58% 10.08% 2011 Monthly 2017
BNDES - Capex 2009/10 Sub O Light SESA 11.30.2009 URTJLP TJLP + 3.58% 11.08% 2011 Monthly 2017
BNDES - Capex 2009/10 Sub P Light SESA 11.30.2009 URTJLP TJLP + 2.58% 10.08% 2011 Monthly 2017
BNDES - Capex 2009/10 Sub Q Light SESA 11.30.2009 URTJLP TJLP + 3.58% 11.08% 2011 Monthly 2017
BNDES - Capex 2011/12 Sub 1 Light SESA 12.06.2011 URTJLP TJLP 7.50% 2013 Monthly 2019
BNDES - Capex 2011/12 Sub 2 Light SESA 12.06.2011 URTJLP TJLP + 1.81% 9.31% 2013 Monthly 2019
BNDES - Capex 2011/12 Sub 3 Light SESA 12.06.2011 URTJLP TJLP + 2.21% 9.71% 2013 Monthly 2019
BNDES - Capex 2011/12 Sub 4 Light SESA 12.06.2011 URTJLP TJLP + 3.21% 10.71% 2013 Monthly 2019
BNDES - Capex 2011/12 Sub 13 Light SESA 12.06.2011 URTJLP TJLP + 2.21% 9.71% 2013 Monthly 2019
BNDES - Capex 2011/12 Sub 14 Light SESA 12.06.2011 URTJLP TJLP + 3.21% 10.71% 2013 Monthly 2019
BNDES - Capex 2011/12 Sub 17 Light SESA 12.06.2011 URTJLP TJLP + 2.21% 9.71% 2013 Monthly 2019
BNDES - Capex 2011/12 Sub 18 Light SESA 12.06.2011 URTJLP TJLP + 3.21% 10.71% 2013 Monthly 2019
BNDES - Capex 2013/14 Sub A Light SESA 11.28.2014 URTJLP TJLP + 2.78% 10.28% 2015 Monthly 2021
BNDES - Capex 2013/14 Sub B Light SESA 11.28.2014 R$ SELIC + 2.78% 15.58% 2015 Monthly 2021
BNDES - Capex 2013/14 Sub C Light SESA 11.28.2014 R$ 6.00% 6.00% 2015 Monthly 2021
BNDES - Capex 2013/14 Sub D Light SESA 11.28.2014 URTJLP TJLP + 2.78% 10.28% 2015 Monthly 2021
BNDES - Capex 2013/14 Sub E Light SESA 11.28.2014 R$ SELIC + 2.78% 15.58% 2015 Monthly 2021
BNDES - CAPEX 2015/16 Sub A Light SESA 12.26.2016 URTJLP TJLP + 3.74% 11.24% 2017 Monthly 2023
BNDES - CAPEX 2015/16 Sub B Light SESA 12.26.2016 URTJLP SELIC + 4.08% 11.58% 2017 Monthly 2023
BNDES - CAPEX 2015/16 Sub C Light SESA 12.26.2016 URTJLP TJLP + 3.74% 11.24% 2017 Monthly 2023
BNDES - 2013/16 Olympics Sub A Light SESA 12.16.2013 URTJLP TJLP + 2.58% 10.08% 2015 Monthly 2020
BNDES - 2013/16 Olympics Sub B Light SESA 12.16.2013 URTJLP TJLP + 3.58% 15.56% 2015 Monthly 2020
BNDES - 2013/16 Olympics Sub C Light SESA 12.16.2013 R$ SELIC + 2.58% 15.58% 2015 Monthly 2020
BNDES - 2013/16 Olympics Sub D Light SESA 12.16.2013 URTJLP TJLP + 2.58% 10.08% 2016 Monthly 2020
BNDES - 2013/16 Olympics Sub E Light SESA 12.16.2013 URTJLP TJLP + 3.58% 11.08% 2016 Monthly 2020
BNDES - 2013/16 Olympics Sub F Light SESA 12.16.2013 R$ SELIC + 2.58% 15.58% 2016 Monthly 2020
BNDES - 2013/16 Olympics Sub G Light SESA 12.16.2013 R$ 3.50% 3.50% 2016 Monthly 2023
FINEP - Research and Innovation Light SESA 04.16.2014 R$ 4.00% 4.00% 2016 Monthly 2022
Promissory Note - 3rd NP Light SESA 06.18.2015 R$ CDI + 1.63% 16.06% 2016 Lump sum 2016
Overdraft account - CEF 2015 Light SESA 12.30.2014 R$ CDI + 3.66% 18.32% 2015 Monthly 2017
BNDES - Capex 2009/10 Sub A Light Energia 11.30.2009 URTJLP TJLP + 2.58% 10.08% 2011 Monthly 2017
BNDES - Capex 2009/10 Sub B Light Energia 11.30.2009 URTJLP TJLP + 3.58% 11.08% 2011 Monthly 2017
BNDES - Capex 2009/10 Sub C Light Energia 11.30.2009 URTJLP 4.50% 4.50% 2011 Monthly 2019
BNDES - Capex 2011/12 Sub 1 Light Energia 04.10.2012 URTJLP TJLP + 1.81% 9.31% 2013 Monthly 2018
BNDES - Capex 2011/12 Sub 2 Light Energia 04.10.2012 URTJLP TJLP + 1.81% 9.31% 2013 Monthly 2018
CCB Banco Original Light Energia 09.30.2016 R$ CDI + 4.0% 18.13% 2016 Lump sum 2016
CCB BBM 2016 Light Energia 08.10.2016 R$ CDI + 4.0% 18.13% 2016 Lump sum 2016
BNDES - Lajes Project - SUB A Light Energia 09.28.2016 R$ TJLP + 2.95 10.45% 2016 Monthly 2026
BNDES - Lajes Project - SUB B Light Energia 09.28.2016 R$ TJLP + 2.95 10.45% 2016 Monthly 2026
CCB BNP PARIBAS Light Energia 10.22.2016 R$ CDI + 4.50% 18.71% 2017 Lump sum 2017
BNDES PROESCO Light Esco 09.16.2008 R$/URTJLP TJLP - 0.04% 7.46% 2009 Monthly 2023
Principal Amortization
vs vsvsvsvs
67
(a) The interest rates disclosed represent the effective cost of debt, since the Company contracted derivative financial instruments.
Below are the main financial operations in the year ended December 31, 2016:
• On February 2, 2016, the rollover of Operation 4131 of the subsidiary Light SESA with Santander in the amount of R$120,000 was carried out. The debt matures on February 1, 2017 and bears an interest rate of CDI + 4.01% p.a.
• On March 11, 2016, the partial rollover of the Operation 4131 of the Light SESA subsidiary with Tokyo in the amount of R$109,000 was carried out. The debt matures on March 11, 2017 and bears an interest rate of CDI + 4.28% p.a.
• On June 10, 2016, the 3rd Promissory Note Issue of the subsidiary Light SESA was entirely rolled over. The rollover was funded by the 11th debenture issue and the contracting of bank credit certificates in the amount of R$100,000 with Caixa Econômica Federal. The debt with Caixa Econômica Federal matures on June 10, 2018 and bears an interest rate of the CDI + 4.05% p.a.
• On August 10, 2016, R$36,000 was raised by the subsidiary Light Energia with Banco BBM through a Bank Credit Note. The loan, with an interest rate of CDI + 4.0% p.a., was settled on November 29, 2016.
• On September 28, 2016, R$28,138 was raised by the subsidiary Lajes Energia with the BNDES to finance CAPEX. The transaction has an interest rate of TJLP + 2.95% p.a. with maturity of ten years.
• On September 30 and October 3, 2016, funding was raised between the subsidiary Light SESA and China Construction Bank through operations 4131 in the amounts of R$50,000 and R$74,425, respectively. The operations were carried out at the cost of USD + libor of 6 months + 3.50% p.a., with maturity on September 16, 2019. At the same time, swaps were contracted with Banco BMG and Banco Fibra transferring the risk from U.S. dollars to reais at the cost of CDI + 4.5% p.a.
• On September 30, 2016, R$50,000 was raised by Light Energia from Banco Original through a Bank Credit Note. The loan, with an interest rate of CDI + 4.0% p.a., was settled on November 29, 2016.
• On October 24, 2016, a loan was contracted between the subsidiary Light Energia and BNP Paribas, in the amount of R$138,808. The operation has an interest rate of CDI + 4.5% p.a., with maturity on October 24, 2017.
• On November 16, 2016, the subsidiary Light SESA raised R$180,000 with Banco Bradesco through a Bank Credit Note. The operation has an interest rate of CDI
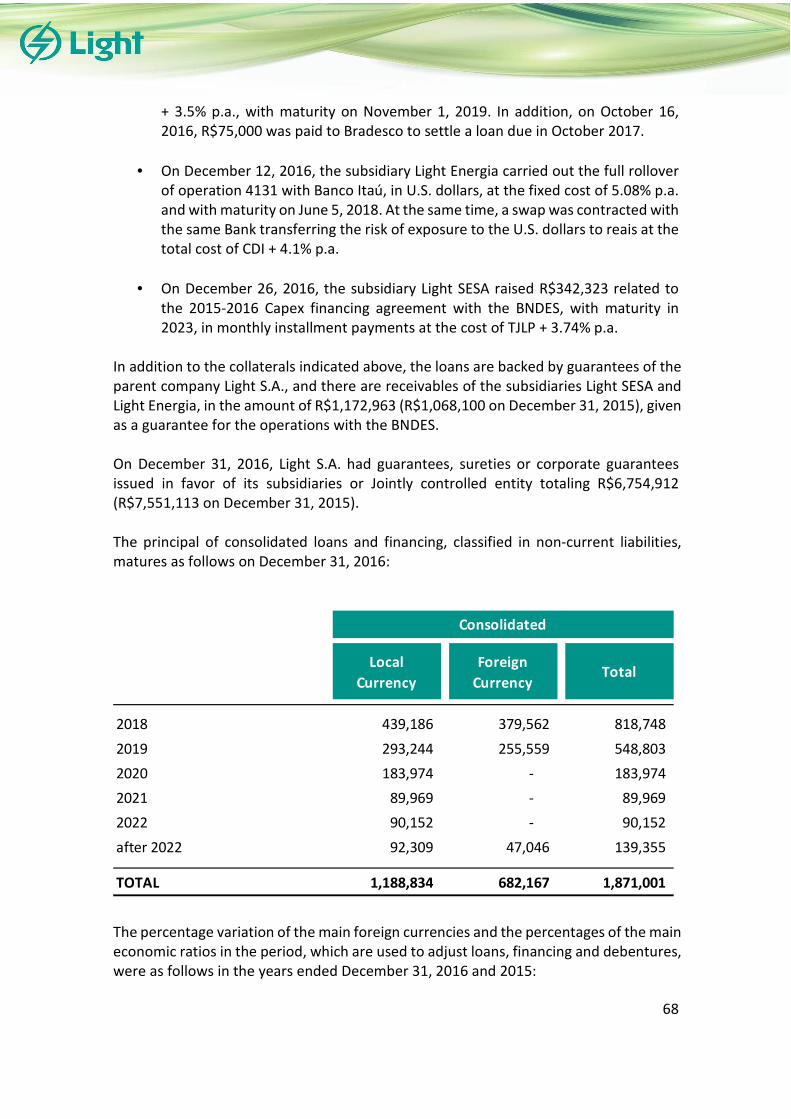
vs vsvsvsvs
68
+ 3.5% p.a., with maturity on November 1, 2019. In addition, on October 16, 2016, R$75,000 was paid to Bradesco to settle a loan due in October 2017.
• On December 12, 2016, the subsidiary Light Energia carried out the full rollover of operation 4131 with Banco Itaú, in U.S. dollars, at the fixed cost of 5.08% p.a. and with maturity on June 5, 2018. At the same time, a swap was contracted with the same Bank transferring the risk of exposure to the U.S. dollars to reais at the total cost of CDI + 4.1% p.a.
• On December 26, 2016, the subsidiary Light SESA raised R$342,323 related to the 2015-2016 Capex financing agreement with the BNDES, with maturity in 2023, in monthly installment payments at the cost of TJLP + 3.74% p.a.
In addition to the collaterals indicated above, the loans are backed by guarantees of the parent company Light S.A., and there are receivables of the subsidiaries Light SESA and Light Energia, in the amount of R$1,172,963 (R$1,068,100 on December 31, 2015), given as a guarantee for the operations with the BNDES. On December 31, 2016, Light S.A. had guarantees, sureties or corporate guarantees issued in favor of its subsidiaries or Jointly controlled entity totaling R$6,754,912 (R$7,551,113 on December 31, 2015). The principal of consolidated loans and financing, classified in non-current liabilities, matures as follows on December 31, 2016:
The percentage variation of the main foreign currencies and the percentages of the main economic ratios in the period, which are used to adjust loans, financing and debentures, were as follows in the years ended December 31, 2016 and 2015:
Local
Currency
Foreign
CurrencyTotal
2018 439,186 379,562 818,748
2019 293,244 255,559 548,803
2020 183,974 - 183,974
2021 89,969 - 89,969
2022 90,152 - 90,152
after 2022 92,309 47,046 139,355
TOTAL 1,188,834 682,167 1,871,001
Consolidated
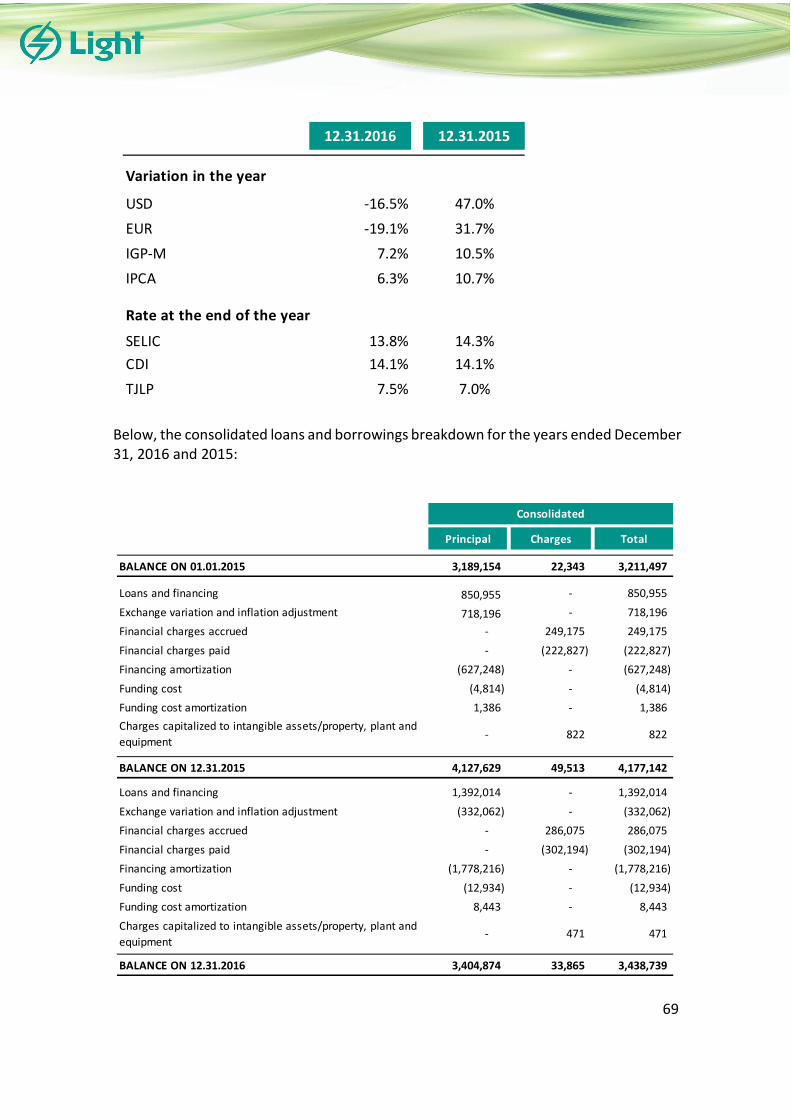
vs vsvsvsvs
69
Below, the consolidated loans and borrowings breakdown for the years ended December 31, 2016 and 2015:
12.31.2016 12.31.2015
Variation in the year
USD -16.5% 47.0%
EUR -19.1% 31.7%
IGP-M 7.2% 10.5%
IPCA 6.3% 10.7%
Rate at the end of the year
SELIC 13.8% 14.3%
CDI 14.1% 14.1%
TJLP 7.5% 7.0%
Principal Charges Total
BALANCE ON 01.01.2015 3,189,154 22,343 3,211,497
Loans and financing 850,955 - 850,955
Exchange variation and inflation adjustment 718,196 - 718,196
Financial charges accrued - 249,175 249,175
Financial charges paid - (222,827) (222,827)
Financing amortization (627,248) - (627,248)
Funding cost (4,814) - (4,814)
Funding cost amortization 1,386 - 1,386
Charges capitalized to intangible assets/property, plant and
equipment- 822 822
BALANCE ON 12.31.2015 4,127,629 49,513 4,177,142
Loans and financing 1,392,014 - 1,392,014
Exchange variation and inflation adjustment (332,062) - (332,062)
Financial charges accrued - 286,075 286,075
Financial charges paid - (302,194) (302,194)
Financing amortization (1,778,216) - (1,778,216)
Funding cost (12,934) - (12,934)
Funding cost amortization 8,443 - 8,443
Charges capitalized to intangible assets/property, plant and
equipment- 471 471
BALANCE ON 12.31.2016 3,404,874 33,865 3,438,739
Consolidated

vs vsvsvsvs
70
Total principal amount is stated net of loans-related costs. These costs are broken down in the table below.
The Company’s exposure to interest rate, foreign currency and liquidity risks related to loans and borrowings is reported in Note 34.
Covenants
The Company has clauses that may cause the early maturity of debt in certain loan and financing agreements, including cross default. The early maturity only occurs when one of the ratios has not been complied with in two consecutive quarters or four intercalate quarters. The bank credit certificates of Bradesco, Caixa and Banco do Brasil, as well as loans with BNP, Citibank, Bank Tokyo, Itaú, Santander, China Construction Bank and with the BNDES, require that the Company maintains certain net debt/EBITDA ratios and covenants. On December 31, 2016, the Company was in conformity with all required debt covenants. 18. DEBENTURES
Financing Entity Subsidiary Total cost
Balance to be
amortized on
01.01.2015
Funding costFunding cost
amortization
Balance to be
amortized on
12.31.2015
Funding costFunding cost
amortization
Balance to be
amortized on
12.31.2016
BNDES - Capex Light SESA 1,878 843 - (248) 595 - (250) 345
4131 Bank BNP 2015 Light SESA 496 - 496 (56) 440 354 (221) 573
4131 Itaú 2014 Light SESA 383 - 383 (383) - 434 (238) 196
CCB Bradesco Light SESA 752 - 752 (63) 689 449 (827) 311
Promissory Note - 3rd NP Light SESA 1,399 - 1,399 (349) 1,050 610 (1,660) -
CCB - CEF 2016 Light SESA 2,300 - - - - 2,300 - 2,300
4131 Citibank 2014 Light SESA 4,452 - - - - 4,452 (1,631) 2,821
BNDES - Capex Light Energia 44 19 - (7) 12 - (5) 7
4131 Bank BNP 2014 Light Energia 1,085 - 1,085 (180) 905 663 (1,523) 45
4131 Itaú 2014 Light Energia 699 - 699 (100) 599 333 (932) -
4131 Citibank 2012 Light Energia 3,339 - - - - 3,339 (1,156) 2,183
TOTAL 16,827 862 4,814 (1,386) 4,290 12,934 (8,443) 8,781
CHANGE IN FUNDING COSTS
Principal Charges Total Principal Charges Total 12.31.2016 12.31.2015
Debentures 8th Issue Light SESA 39,198 4,142 43,340 352,500 - 352,500 395,840 435,303
Debentures 9th Issue Series A Light SESA - 17,932 17,932 1,000,000 - 1,000,000 1,017,932 1,018,414
Debentures 9th Issue Series B Light SESA - 5,477 5,477 600,000 173,251 773,251 778,728 728,573
Debentures 10th Issue Light SESA - 16,025 16,025 750,000 - 750,000 766,025 766,936
Debentures 11th Issue Light SESA 87,500 1,139 88,639 43,750 - 43,750 132,389 -
Debentures 2nd Issue Light Energia 106,250 16,781 123,031 212,500 - 212,500 335,531 447,930
Debentures 3rd Issue Light Energia 2,502 264 2,766 22,500 - 22,500 25,266 27,785
Debentures 4th Issue Light Energia 88,933 1,476 90,409 - - - 90,409 -
Funding cost (3,523) - (3,523) (8,052) - (8,052) (11,575) (11,186)
Covenant Fee cost (5,507) - (5,507) (20,018) - (20,018) (25,525) (16,512)
TOTAL 315,353 63,236 378,589 2,953,180 173,251 3,126,431 3,505,020 3,397,243
SubsidiaryIssue
Consolidated
Current Non-current Total

vs vsvsvsvs
71
Below, contractual conditions of debentures on a consolidated basis on December 31, 2016:
On June 10, 2016, the 11th debenture issue of the subsidiary Light SESA was carried out in the amount of R$175,000, of which R$100,000 with Bradesco and R$75,000 with Itaú. The debt matures on June 13, 2018 and bears an interest rate of CDI + 4.05% p.a. On November 29, 2016, the 4th debenture issue of the subsidiary Light Energia was carried out in the amount of R$88,933, of which R$50,000 with Banco Original and R$38,933 with Banco BBM. Debt has a cost of CDI + 4.0% p.a., with maturity on November 16, 2017. The portions related to the consolidated principal of debentures, classified in non-current liabilities, have the following maturities on December 31, 2016:
Issue Subsidiary Date of signature Currency Interest Rate p.a. Effective rate Beginning Payment End
Debentures 8th Issue Light SESA 08.24.2012 R$ CDI + 1.18% 15.44% 2015 Annual 2026
Debentures 9th Issue Series A Light SESA 06.15.2013 R$ CDI + 1.15% 15.40% 2018 Annual 2021
Debentures 9th Issue Series B Light SESA 06.15.2013 R$ IPCA + 5.74% 15.59% 2020 Annual 2023
Debentures 10th Issue Light SESA 04.30.2014 R$ 115% CDI 16.37% 2018 Annual 2020
Debentures 11th Issue Light SESA 06.10.2016 R$ CDI + 4.05% 18.19% 2016 Annual 2018
Debentures 2nd Issue Light Energia 12.29.2011 R$ CDI + 1.18% 15.44% 2016 Annual 2019
Debentures 3rd Issue Light Energia 08.24.2012 R$ CDI + 1.18% 15.44% 2015 Annual 2026
Debentures 4th Issue Light Energia 11.16.2016 R$ CDI + 4.00% 18.13% 2017 Quarterly 2017
Principal Amortization
Total
2018 662,920
2019 610,141
2020 675,629
2021 481,027
2022 414,035
after 2022 109,428
TOTAL 2,953,180

vs vsvsvsvs
72
Below, debentures breakdown on a consolidated basis in the years ended December 31, 2016 and 2015:
Total principal amount is reported net of debenture issue costs. These costs are broken down in the table below.
The Company’s exposure to interest rate and liquidity risks related to debentures is reported in Note 34.
Principal Charges Total
BALANCE ON 01.01.2015 3,274,612 96,192 3,370,804
Inflation adjustment - 70,298 70,298
Financial charges accrued - 388,680 388,680
Financial charges paid - (410,544) (410,544)
Amortization of debentures (41,661) - (41,661)
Issue cost (16,972) - (16,972)
Amortization of issue cost 2,638 - 2,638
Charges capitalized to intangible assets/property, plant
and equipment- 34,000 34,000
BALANCE ON 12.31.2015 3,218,617 178,626 3,397,243
Debentures issued 263,933 - 263,933
Inflation adjustment - 49,823 49,823
Financial charges accrued - 382,108 382,108
Financial charges paid - (423,041) (423,041)
Amortization of debentures (191,648) - (191,648)
Transfer for financial charges (12,967) 12,967 -
Issue cost (17,433) - (17,433)
Amortization of issue cost 8,031 - 8,031
Charges capitalized to intangible assets/property, plant
and equipment- 36,004 36,004
BALANCE ON 12.31.2016 3,268,533 236,487 3,505,020
Consolidated
Issue Subsidiary Total cost
Balance to be
amortized on
01.01.2015
Issue costAmortization
of issue cost
Balance to be
amortized on
12.31.2015
Issue costAmortization
of issue cost
Balance to be
amortized on
12.31.2016
Debentures 4th Issue Light SESA 7,468 2 - (2) - - - -
Debentures 8th Issue Light SESA 423 352 2,063 (47) 2,368 975 (282) 3,061
Debentures 9th Issue A Light SESA 4,986 4,025 5,328 (783) 8,570 3,775 (1,929) 10,416
Debentures 9th Issue B Light SESA 2,991 2,530 3,630 (379) 5,781 3,371 (972) 8,180
Debentures 10th Issue Light SESA 5,830 5,217 3,638 (1,081) 7,774 2,980 (1,881) 8,873
Debentures 11th Issue Light SESA 4,601 - - - - 4,601 (1,899) 2,702
Debentures 2nd Issue Light Energia 1,831 1,105 2,182 (334) 2,953 1,669 (1,041) 3,581
Debentures 3rd Issue Light Energia 159 132 131 (12) 251 62 (27) 286
TOTAL 28,289 13,363 16,972 (2,638) 27,697 17,433 (8,031) 37,099
CHANGES IN ISSUE COST

vs vsvsvsvs
73
Covenants
The Company has clauses that may anticipate the maturity of debts in certain debentures agreements, including the cross default. The early maturity only takes place when an indicator is not complied with two consecutive quarters or four alternate quarters. All issues of debentures require the maintenance of net debt/EBITDA ratios and coverage of interest rates. On December 31, 2016, the Company was in conformity with all required debt covenants. 19. PROVISIONS The Company and its subsidiaries are parties in tax, labor and civil lawsuits and regulatory proceedings in several courts. Management periodically assesses the risks of contingencies related to these proceedings, and based on the legal counsel’s opinion it records a provision when unfavorable decisions are probable and whose amounts are quantifiable. Below, the balance of provisions, including provisions for risks and provisions for success fees:
TOTAL PROVISIONS Provision Success fees Total Provision Success fees Total
Labor 123,506 354 123,860 126,370 - 126,370
Civil 145,446 50,981 196,427 133,392 37,035 170,427
Tax 51,036 24,962 75,998 197,047 25,991 223,038
Other 21,297 292 21,589 21,599 - 21,599
TOTAL 341,285 76,589 417,874 478,408 63,026 541,434
12.31.2016 12.31.2015
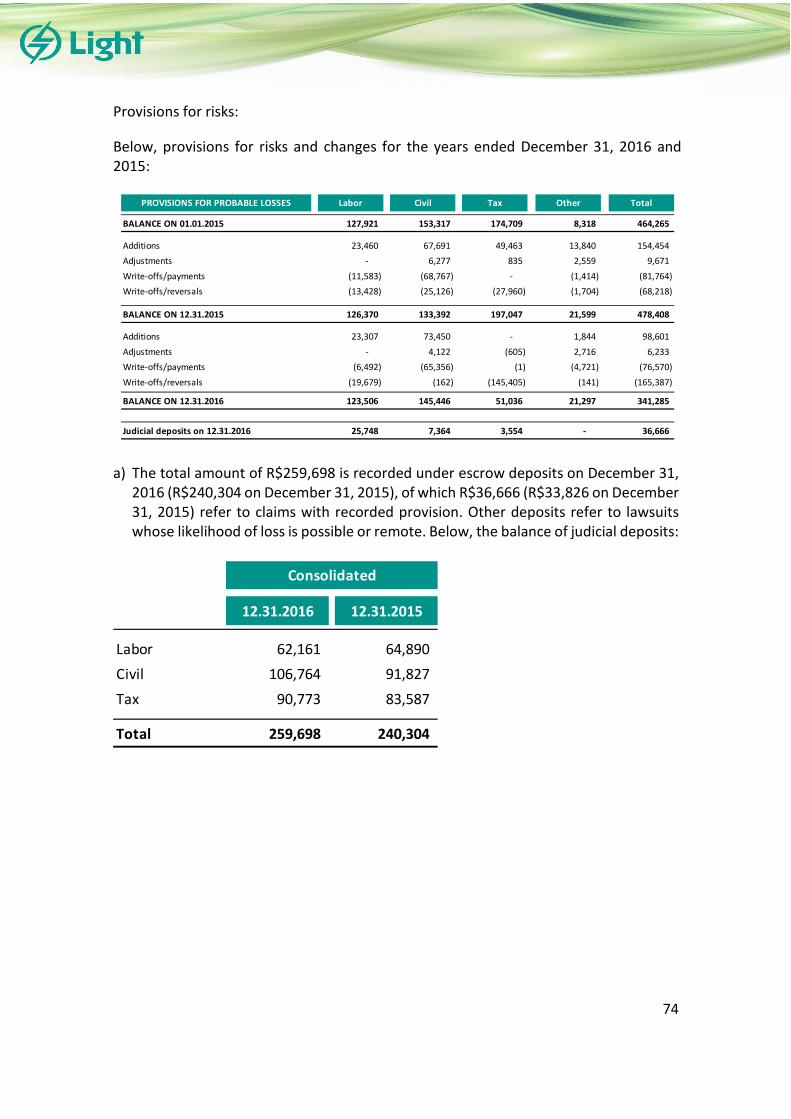
vs vsvsvsvs
74
Provisions for risks:
Below, provisions for risks and changes for the years ended December 31, 2016 and 2015:
a) The total amount of R$259,698 is recorded under escrow deposits on December 31,
2016 (R$240,304 on December 31, 2015), of which R$36,666 (R$33,826 on December 31, 2015) refer to claims with recorded provision. Other deposits refer to lawsuits whose likelihood of loss is possible or remote. Below, the balance of judicial deposits:
PROVISIONS FOR PROBABLE LOSSES Labor Civil Tax Other Total
BALANCE ON 01.01.2015 127,921 153,317 174,709 8,318 464,265
Additions 23,460 67,691 49,463 13,840 154,454
Adjustments - 6,277 835 2,559 9,671
Write-offs/payments (11,583) (68,767) - (1,414) (81,764)
Write-offs/reversals (13,428) (25,126) (27,960) (1,704) (68,218)
BALANCE ON 12.31.2015 126,370 133,392 197,047 21,599 478,408
Additions 23,307 73,450 - 1,844 98,601
Adjustments - 4,122 (605) 2,716 6,233
Write-offs/payments (6,492) (65,356) (1) (4,721) (76,570)
Write-offs/reversals (19,679) (162) (145,405) (141) (165,387)
BALANCE ON 12.31.2016 123,506 145,446 51,036 21,297 341,285
Judicial deposits on 12.31.2016 25,748 7,364 3,554 - 36,666
12.31.2016 12.31.2015
Labor 62,161 64,890
Civil 106,764 91,827
Tax 90,773 83,587
Total 259,698 240,304
Consolidated
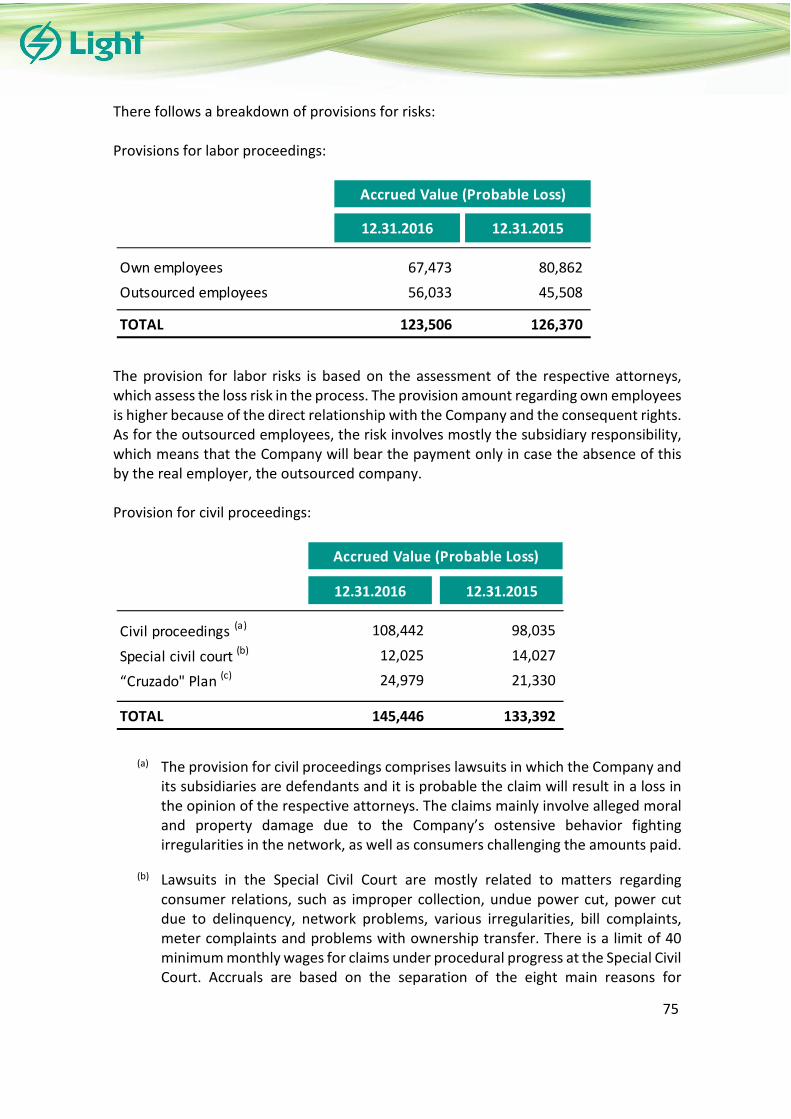
vs vsvsvsvs
75
There follows a breakdown of provisions for risks: Provisions for labor proceedings:
The provision for labor risks is based on the assessment of the respective attorneys, which assess the loss risk in the process. The provision amount regarding own employees is higher because of the direct relationship with the Company and the consequent rights. As for the outsourced employees, the risk involves mostly the subsidiary responsibility, which means that the Company will bear the payment only in case the absence of this by the real employer, the outsourced company. Provision for civil proceedings:
(a) The provision for civil proceedings comprises lawsuits in which the Company and its subsidiaries are defendants and it is probable the claim will result in a loss in the opinion of the respective attorneys. The claims mainly involve alleged moral and property damage due to the Company’s ostensive behavior fighting irregularities in the network, as well as consumers challenging the amounts paid.
(b) Lawsuits in the Special Civil Court are mostly related to matters regarding consumer relations, such as improper collection, undue power cut, power cut due to delinquency, network problems, various irregularities, bill complaints, meter complaints and problems with ownership transfer. There is a limit of 40 minimum monthly wages for claims under procedural progress at the Special Civil Court. Accruals are based on the separation of the eight main reasons for
12.31.2016 12.31.2015
Own employees 67,473 80,862
Outsourced employees 56,033 45,508
TOTAL 123,506 126,370
Accrued Value (Probable Loss)
12.31.2016 12.31.2015
Civil proceedings (a) 108,442 98,035
Special civil court (b) 12,025 14,027
“Cruzado" Plan (c) 24,979 21,330
TOTAL 145,446 133,392
Accrued Value (Probable Loss)

vs vsvsvsvs
76
complaints for the Company and its subsidiaries – which represent 66.3% of the lawsuits; a block with all the reasons related to accidents; and a block for other reasons. For the six main offenders and other reasons block, an adjusted average is used – considering 95% of the sample i.e. excluding the 2.5% highest and lowest amounts - the average of the last 12 months of condemnation amount. In the case of the accident block, the average of the last 12 months of condemnation amount is considered.
(c) These are lawsuits filed against the subsidiary Light SESA referring to increase in electricity tariffs approved by Ordinances No. 38 of February 27, 1986 and No. 45 of March 4, 1986, published by the extinguished DNAEE – National Department of Water and Electricity, which contradicted the Decree Law No. 2.283/86 (“Cruzado” Plan decree), which established that all prices would be “frozen”. The plaintiffs of these lawsuits plead the refund of amounts supposedly overpaid in the electricity bills when Light SESA’s tariffs increased in the period that prices were “frozen”.
Provision for tax proceedings:
(a) The subsidiary Light SESA, based on two reports, one from the law firm responsible for the case and another from a distinguished jurist of the Superior Courts, reassessed the likelihood of loss based on previous cases on this subject and, given that the likelihood of loss was considered as possible on December 31, 2016, it reversed the provision of R$144,802 related to litigation on the application of State Law No. 3,188/99, which restricted the appropriation of ICMS credits incurred on the acquisition of assets destined to the property, plant and equipment, requiring that credit is deferred by installments, while this restriction was not provided for in the Supplementary Law No. 87/96. The discussion revolves around the issue of whether an ordinary state law may regulate ICMS credits on the acquisition of permanent assets contrary to the provisions of Supplementary Law No. 87/96 and the 1988 Constitution.
12.31.2016 12.31.2015
ICMS – Credit limitation (a) - 139,249
ICMS – Credits approved (b) 46,232 46,232
Other 4,804 11,566
TOTAL 51,036 197,047
Accrued Value (Probable Loss)

vs vsvsvsvs
77
The lawsuit in question seeks the recognition of Light’s clear legal right to record credits without the restrictions set forth in Law No. 3,188/99, based on the following constitutional grounds: (i) Prevalence of supplementary law to deal with the matter (article 146, item III, subparagraph “b”, and article 155, item I, subparagraph “b”, paragraph 2, item XII, subparagraph “c”, of the Constitution). In summary, it is argued that, the right to credits arising from taxes paid in the acquisition of fixed assets, in particular, is governed by Supplementary Law 87/96, which has exclusive jurisdiction over this matter. As a result, the restriction to the taxpayers’ right to this credit would be unconstitutional, given that it was established by a state law and this would constitute usurpation of the supplementary law. (ii) Violation of the non-cumulative principle (article 155, item I, paragraph 2, item I, of the Constitution), given that the state law established a restriction to the right to ICMS credits on fixed asset acquisitions that is incompatible with the non-cumulative system set forth by the Constitution. Consequently, the law firm responsible for the case and our legal advisor specialized in Superior Courts believe that the claim that the supplementary law shall prevail has grounds and will waive the collection of this credit since the enactment of State Law No. 3,188/99.
(b) In the last quarter of 2015, the Light SESA subsidiary provisioned R$46,232,
regarding part of the amount fined in the process through which the State of Rio de Janeiro intends to charge ICMS from the alleged improper use of tax credits, acquired by Light SESA from third parties, and which had previously been ratified by the State Finance Department. The debt currently amounts to R$572,800. After the revaluation, the internal and external legal advisors classified the amount of R$42,029 of the principal (tax), as well as the proportional amount, concerning legal fees of the Prosecutor, in the amount of R$4,203, as probable loss, and all the remaining amount fined, regarding interests, monetary corrections and proportionate legal fees, as remote loss. The administrative proceeding was concluded in June 2015, with unfavorable decision to the Company, which in turn filed a writ of mandamus to remove part of debt to be registered as overdue state liabilities related to interest rates and monetary restatement. The injunction was granted, but subsequently reversed by a decision rendered in an interlocutory appeal filed by the State of Rio de Janeiro. The Tax Foreclosure was filed, with Light SESA presenting the insurance policy as a guarantee and, as a result, filed Motions to Stay the Tax Foreclosure, which is pending a decision.
Other Provisions: The Company will now discuss regulatory contingencies of its subsidiaries in connection with administrative issues pending with ANEEL:

vs vsvsvsvs
78
• Deficiency Notice Aneel No. 084/2015 – SFE. The Deficiency Notice was received by the subsidiary Light SESA on August 6, 2015. SFE/Aneel supervised the compliance with the Electricity Distribution Procedures in the National Electric System (“PRODIST”) regarding the voltage levels of service in the consumer units with sample measurements by Light SESA, in 2012 and 2013, imposing a fine penalty in the amount of R$4,475 for three non-compliances identified. The appeal was filed by Light SESA at Aneel on August 17, 2015. On September 9, 2015, the order No. 3,117/2015 was published, which reduced the fine from R$4,475 to R$4,375. On June 8, 2016, Light SESA submitted a supplementary statement to the appeal. The Company made a provision of R$3,355, which is its best estimate for loss, and awaits Aneel’s decision.
Provisions for success fees:
Management periodically reassesses lawsuits with success fees for legal advisors and, based on the opinion of its legal counsels, records provisions for lawsuits whose likelihood of loss was considered possible or remote. Below, a chart with the position and changes in the years ended December 31, 2016 and 2015:
PROVISIONS FOR SUCCESS FEE Labor Civil Tax Other Total
BALANCE ON 01.01.2015 - 22,341 26,180 - 48,521
Additions - 12,283 2,019 - 14,302
Adjustments - 3,464 1,734 - 5,198
Write-offs/payments - (166) (1,076) - (1,242)
Write-offs/reversals - (887) (2,866) - (3,753)
BALANCE ON 12.31.2015 - 37,035 25,991 - 63,026
Additions 440 23,218 3,463 292 27,413
Adjustments - 2,410 1,388 - 3,798
Write-offs/payments (51) (8,287) (4,029) - (12,367)
Write-offs/reversals (35) (3,395) (1,851) - (5,281)
BALANCE ON 12.31.2016 354 50,981 24,962 292 76,589
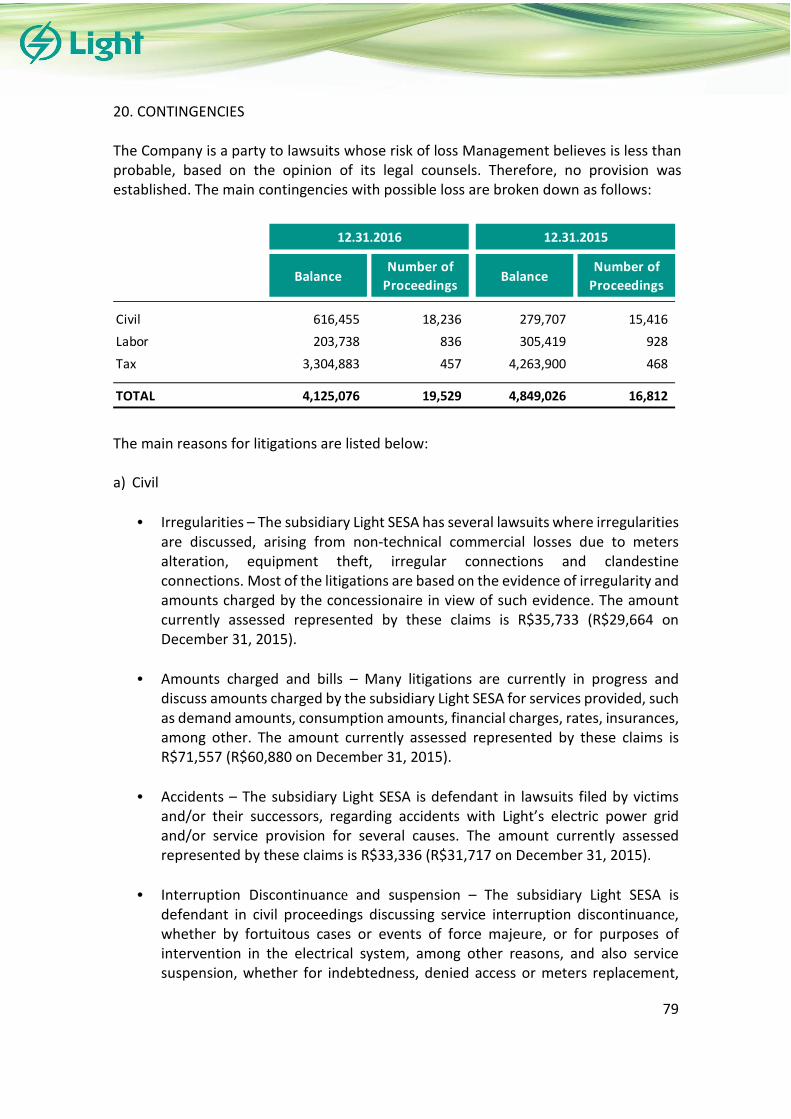
vs vsvsvsvs
79
20. CONTINGENCIES The Company is a party to lawsuits whose risk of loss Management believes is less than probable, based on the opinion of its legal counsels. Therefore, no provision was established. The main contingencies with possible loss are broken down as follows:
The main reasons for litigations are listed below:
a) Civil
• Irregularities – The subsidiary Light SESA has several lawsuits where irregularities are discussed, arising from non-technical commercial losses due to meters alteration, equipment theft, irregular connections and clandestine connections. Most of the litigations are based on the evidence of irregularity and amounts charged by the concessionaire in view of such evidence. The amount currently assessed represented by these claims is R$35,733 (R$29,664 on December 31, 2015).
• Amounts charged and bills – Many litigations are currently in progress and discuss amounts charged by the subsidiary Light SESA for services provided, such as demand amounts, consumption amounts, financial charges, rates, insurances, among other. The amount currently assessed represented by these claims is R$71,557 (R$60,880 on December 31, 2015).
• Accidents – The subsidiary Light SESA is defendant in lawsuits filed by victims and/or their successors, regarding accidents with Light’s electric power grid and/or service provision for several causes. The amount currently assessed represented by these claims is R$33,336 (R$31,717 on December 31, 2015).
• Interruption Discontinuance and suspension – The subsidiary Light SESA is defendant in civil proceedings discussing service interruption discontinuance, whether by fortuitous cases or events of force majeure, or for purposes of intervention in the electrical system, among other reasons, and also service suspension, whether for indebtedness, denied access or meters replacement,
Balance Number of
ProceedingsBalance
Number of
Proceedings
Civil 616,455 18,236 279,707 15,416
Labor 203,738 836 305,419 928
Tax 3,304,883 457 4,263,900 468
TOTAL 4,125,076 19,529 4,849,026 16,812
12.31.2016 12.31.2015

vs vsvsvsvs
80
among other facts for suspension. The amount currently assessed represented by these claims is R$40,528 (R$39,025 on December 31, 2015).
• Equipment and network – The subsidiary Light SESA has litigations due to electronic meters used to measure energy consumption. Litigations address several themes, such as meter functionality, approval by metrological agency, among others and, also, litigations about its network, due to its extension, removal or even financial contribution of the client to install the network. The amount currently assessed represented by these claims is R$6,197 (R$7,261 on December 31, 2015).
• Regarding civil discussions, we highlight the initiatives proposed by the Companhia Siderúrgica Nacional (CSN): in the first quarter of 2012, CSN filed a suit claiming approximately R$100,000 as indemnity for service interruption occurred at its Consumer Unit of Volta Redonda. We point out that out of amount claimed, R$88,700 only refer to the service interruption occurred on November 10th, 2009, affecting 40% of Brazilian territory and over 90% of Paraguay, which only evidences that causes go beyond Light SESA’s scope of operation, as electric power distribution company. Moreover, the ONS report concluded that the origin and causes of this service interruption was Furnas’ responsibility. Thus, the Company’s exposure to risk is R$53,247 (R$35,531 on December 31, 2015).
• The subsidiary Light SESA is also in litigation against Companhia Siderúrgica Nacional in a motion to set aside judgment filed by CSN through which CSN aims to vacate the sentence in the action for refund of undue payment number 1995.001.073862-2, which discussed the legality of Ordinances 38 of February 27, 1986 and 45 of March 4, 1986, published by the National Department of Water and Electricity - DNAEE, which increased the electricity tariffs of a certain class of consumers and which the Company won. The Company’s exposure to risk is R$158,872 (R$136,039 on December 31, 2015, when chances of losses were remote).
• The subsidiary Light SESA is in litigation against Valesul S.A. in a declaratory judgment action filed by Valesul, arising from the power transmission agreement entered into in 1991, whose purpose is the payment for the use of the power transmission system from the plaintiff’s small hydroelectric power plants (SHPPs) in the state of Minas Gerais to the plant located in the state of Rio de Janeiro. The 1st and 2nd instance decisions were favorable to the Company. Valesul’s Special Appeal had been denied, but Valesul reversed the denial in an interlocutory appeal. The Extraordinary Appeal was dismissed and is also object of an interlocutory appeal by Valesul. In 2014, under provisional execution, after the Company presented a Surety Bond, which was replaced by Guarantee Insurance, we collected the amounts that were in a judicial deposit totaling R$84,350. We are currently awaiting the decision on Valesul’s appeals and, at

vs vsvsvsvs
81
this moment, the Company’s risk exposure is R$102,191 (R$135,581 on December 31, 2015, when chances of losses were remote).
• In the first quarter of 2016, the subsidiary Light SESA was notified of a lawsuit filed by law firm to claim success fees resulting from an administrative agreement signed between Light SESA and Companhia Estadual de Águas e Esgotos. The Company understands that these fees are not due and the amount currently assessed represented by this claim is R$37,899.
• The subsidiary Light SESA entered into an agreement with a plaintiff in a proceeding related to the Municipal Real Estate Tax (IPTU), in which the opposing party’s attorney is pleading the payment of court costs and attorneys’ fees. The Company understands that these fees are not due. The amount represented by this claim is currently assessed at R$14,000 (R$11,800 on December 31, 2015).
• Two civil proceedings involving the Energy Reallocation Mechanism (MRE) caused by the Generation Scaling Factor (GSF). The objective of lawsuit No. 38848-51.2015.4.013400, filed by the subsidiary Light Energia, Lightger and Aliança Geração de Energia S.A., is to challenge the financial exposure due to the Energy Reallocation Mechanism (MRE) adjustment caused by a GSF lower than 1. An interlocutory relief was granted, sentencing the Agency, until the final decision is rendered, to abstain from applying the adjustment referring to the MRE, if MRE’s total generation is lower than the assured energy. The GSF amount related to Light Energia and Lightger has been duly provisioned under trade payables, against the income statement, even though payments have not been made due to the effects of the above-mentioned injunction. Despite the above decision, the filing of Writ of Mandamus No. 1005338-30.2015.4.01.3400 was also necessary in order to protect Light Energia and Lightger from the effects of court rulings restricting the other agents’ GSF. In this case, an injunction was granted so that Light Energia and Lightger would not need to be included in the apportionment of the other agents’ GSF. The Writ of Mandamus was dismissed without prejudice, as the judge understood that Aneel could not be the enforcement authority. In light of this decision, the Company filed a new lawsuit, No. 0032638-47.2016.4.01.3400, to request an interlocutory relief in order to protect itself from the other agents’ injunctions. The interlocutory relief was granted and therefore Light will not be liable to financial charges as a result any court rulings obtained by other agents, including those that have already been issued and those that may be issued during the course of the lawsuit, regardless of the jurisdiction to which they refer, related to the effects of current GSF values on hydroelectric generators. These proceedings have a possible chance of loss.

vs vsvsvsvs
82
b) Tax
• ICMS Commercial Losses (Tax Deficiency Notices Nos. 03326780-8, 04011949-7, 03.326.784-0, 04.028.752-6, 03.380329-7, 03.380330-5 and 601367), aimed at collecting ICMS, Government Fund to Combat Poverty (FECP) and penalty (relating to the periods from Jan/1992 to Jun/1993, Jan/1999 to Dec/2003 and Jan/2006 to Dec/2013) supposedly incurring on the amounts related to electric power losses in operations preceding its distribution, conducted between the generation companies and the subsidiary Light SESA. In Tax Deficiency Notices 03.326.784-0 and 04.028.752-6, Light SESA’s voluntary appeal was partially granted to recognize that the losses incorporated into the tariff should be excluded from the notified calculation base. As a result, these assessments have already been definitively reduced. The amount of debt involved went from R$1,507,960 to R$290,498. Light SESA appealed to the Plenary, challenging the remaining amount. In the notice of violation No. 601367 there was a final decision which excludes elements foreign to commercial losses from the calculation. Light SESA filed a voluntary appeal against such decision to challenge the remaining amount, which is pending judgment. In notices 03326780-8, 04011949-7 and 03.380329-7, the tax inspection authority also acknowledged the losses incorporated in the tariff. The appeal related to the remaining amounts is pending judgement. In the court order 03.380330-5, the Company Voluntary Appeal was partially disregarded, excluding definitively the losses incorporated in the tariff. The Company awaits the rectification of the value of the car by SEFAZ so that it can partially offset the contingency, and will appeal against the remainder. The amount currently assessed represented by these claims totaled R$1,228,100 (R$2,290,600 on December 31, 2015).
• LIR/LOI - IRPJ/CSLL – (Proceedings 16682.720216/2010-83, 15374-001.757/2008-13, 16682.721091/2011-90 and 16682.720203/2014-38) – The subsidiary Light SESA filed a writ of mandamus mainly discussing the taxation of profit of the subsidiaries LIR and LOI abroad, more specifically, it advocated that income tax and social contribution should be levied on profit only, not on equity in the earnings of subsidiaries (a broader concept that includes exchange variations as provided for by IN 213/02). In order to take advantage on the benefits of REFIS Program, Light SESA fully waived the writ of mandamus, thus, a final court decision was unfavorably rendered to Light SESA. Accordingly, the procedure has been changed to assess results by the equity method, in accordance with the decision of the writ of mandamus. Tax authorities disagreed with this procedure and issued a deficiency notice to Light SESA for the fiscal years 2004 to 2008, requiring taxation on profit only. For 2004, a Tax Appeal was filed, in which we presented bail to guarantee the judgment and oppose Embargoes to Execution, which is pending judgment. For 2005, the administrative sphere was closed unfavorably to the Company. We filed a writ of mandamus seeking to annul the judgment handed down by CARF and obtained an injunction to suspend the enforceability of the debt. Already for 2006 to 2008,

vs vsvsvsvs
83
the Company's Voluntary Appeal was approved. The Treasury filed a Special Appeal awaiting judgment. In April 2014, Light SESA was notified in relation to 2009 and filed objection, which was deemed groundless. The voluntary appeal is pending judgment. According to the legal counsels, the claim may possibly result in a loss involving the amount of R$638,900 (R$600,800 on December 31, 2015).
• Normative Instruction (NI) No. 86 (Proceeding 10707000751/2007-15 - (2003 through 2005) - This deficiency notice was issued to assess a fine on the Company for alleged failure to make electronic filings as required by NI No. 86/2001, for calendar years 2003 through 2005. The administrative proceeding was concluded in July 2015, with unfavorable decision to the subsidiary Light SESA, which filed a writ of mandamus aiming at removing the registration as overdue federal liability, subject matter of such collection. The Company plea was granted. The Union lodged an Appeal of Appeal awaiting. The amount currently assessed represented by this claim is R$377,800 (R$352,900 on December 31, 2015).
• ICMS on subsidies of the “Baixa Renda” (Low-income) federal program (Proceedings 0342346-60.2015.8.19.0001, 0354511-42.2015.8.19.0001, E-04/036.121/2014 and E-04/036.122/2014) – Tax deficiency notices were issued to collect ICMS levied on amounts received by the subsidiary Light SESA as economic subsidy to the low-income electric power consumers arising from the Reversal Global Reserve Fund. The proceedings Nos. E-04/059.150/2004 and 0031148-65.2016.8.19.0001 were concluded in the administrative court with an unfavorable decision for the Company, generating registry of overdue tax liabilities, against which actions for annulment were filed, in which preliminary injunction was granted for the suspension of eligibility of these credits. The remaining administrative proceedings were concluded in the administrative level with a decision unfavorable to Company. An Action for Annulment was filed and the preliminary injunction was denied. Guarantee insurance was presented. The amount currently calculated for these proceedings is R$181,500 (R$169,100 as at December 31, 2015).
• Decisions (76 proceedings) rendered by the Internal Revenue Service to deny approval to several petitions for indemnification filed by subsidiary Light SESA, for utilization of PIS, COFINS, income tax and social contribution credits, alleging that these credits would be undue or insufficient to comprise the debts against which these were opposed. The subsidiary Light SESA filed a Motion to Disagree against referred decisions. In few cases, final court decisions were favorably rendered to Light SESA and in other cases, unfavorable decisions, against which we appealed. The amount currently assessed represented by this claim is R$244,600 (R$203,200 on December 31, 2015).
c) Labor

vs vsvsvsvs
84
The main labor claims involve: equal pay and related accretions, overtime and related accretions, occupational accident, hazardous work wage premium and pain and suffering.
Each claim is detailed below:
• Equal pay and related accretions – the claimants intend to receive wage differences alleging that they exercise or exercised activities identical to other employees’ or former employees’ activities, with the same productivity and technical perfection, but they received different wages. The amount currently assessed represented by this claim is R$14,112 (R$15,322 on December 31, 2015).
• Overtime and related accretions – the claimants intend to receive overtime pay, alleging that they performed their activities beyond standard working hours and overtime has not been paid or offset. The amount currently assessed represented by this claim is R$63,004 (R$65,788 on December 31, 2015).
• Occupational accident – employees/former employees or service providers involved in occupational accidents attribute responsibility to Light, claiming indemnifications and life annuity. The amount currently assessed represented by this claim is R$14,628 (R$16,507 on December 31, 2015).
• Risk premium difference – in the past, the Company used to pay a 30% difference of base salary up to April 2012, as per 2011/2012 Collective Bargaining Agreement. The amount currently assessed represented by this claim is R$55,177 (R$59,166 on December 31, 2015).
• Pain and suffering – claim based on several grounds: persecution, moral harassment, lack of security (operations in risk area) and others. The amount currently assessed represented by this claim is R$27,242 (R$53,040 on December 31, 2015).
The Superior Labor Court (TST), considering the position adopted by the Federal Supreme Court (STF) in two direct actions for the declaration of unconstitutionality regarding the index to adjust registered warrants for inflation, decided that, on August 4, 2015, labor credits must be adjusted based on the Special Extended Consumer Price Index (IPCA-E), replacing the Reference Rate (TR), for labor lawsuits claiming debts before June 30, 2009 in the outstanding proceedings. On October 16, 2015, a preliminary injunction was granted by the STF which suspends the effects from TST decision, since it understands that only STF is able to analyze the general repercussion of the constitutional issue. The estimated amount of the difference between inflation adjustment indices for labor lawsuits is R$14,713 (R$16,757 on December 31, 2015), and no additional provision was

vs vsvsvsvs
85
recorded, because the Company, based on the opinion of its counsel, considered that the probability of loss is possible, as a result of the STF’s decision and the lack of consolidated court precedents or analysis of opinion of jurists about the issue, after preliminary injunction granted by the Federal Supreme Court. Below, we point out lawsuits in progress, whose chances of losses are remote, with relevant amounts under dispute, which, in case of unfavorable decision, may impact the Company, its subsidiaries and Jointly controlled entity:
a) Tax
• PASEP/PIS (Proceeding 15374002130/2006-18) – It refers to the Offset Disallowance made by the subsidiary Light SESA of PASEP credits with PIS debts. The Company’s objection was deemed groundless. Voluntary Appeal was filed. CARF rendered decision sentencing the case should remand to the lower court to determine the credit in dispute. The amount currently assessed represented by the first claim is R$301,900 (R$291,200 on December 31, 2015).
• IRRF - Disallowance of tax offset - LIR/LOI (Proceeding 10768.002.435/2004-11) - There is no confirmation from Brazilian Tax Authority regarding the tax offsets related to withholding income tax credits on financial investments and withholding income tax credits on the payment of energy accounts by government bodies, offset due to outstanding balance of Corporate Income Tax in the reference year of 2002. The motion to disagree filed by Light SESA subsidiary was deemed groundless. The voluntary appeal lodged by Light SESA is pending judgment. In view of the favorable decision received in August 2012 referring to the proceeding 18471002113/2004-09, which directly impacts this case, the legal counsels changed the chances of losses to remote. The amount currently assessed represented by this claim is R$242,400 (R$231,700 on December 31, 2015).
The Company does not consider the other proceedings to be individually significant for disclosure purposes.
According to the Notices to the Market dated March 30, 2015 and April 14, 2015, the Company informed, within the scope of the news disclosed by the press regarding the Operação Zelotes (Zealots Operation), that it is not aware of alleged irregularities involving Light or its subsidiaries, it was not notified to date, and all decisions favorable to its subsidiaries were based on legal theses of common knowledge substantiated by opinions of renowned legal professionals, in addition to the presentation of proper documents that prove the invalidity of tax deficiency notices. According to Notice to the Market dated October 20, 2015, the Company informed, within the scope of the news disclosed by the press regarding the acquisition of interest in Guanhães Energia, that it is not aware of any payments to agents, because it
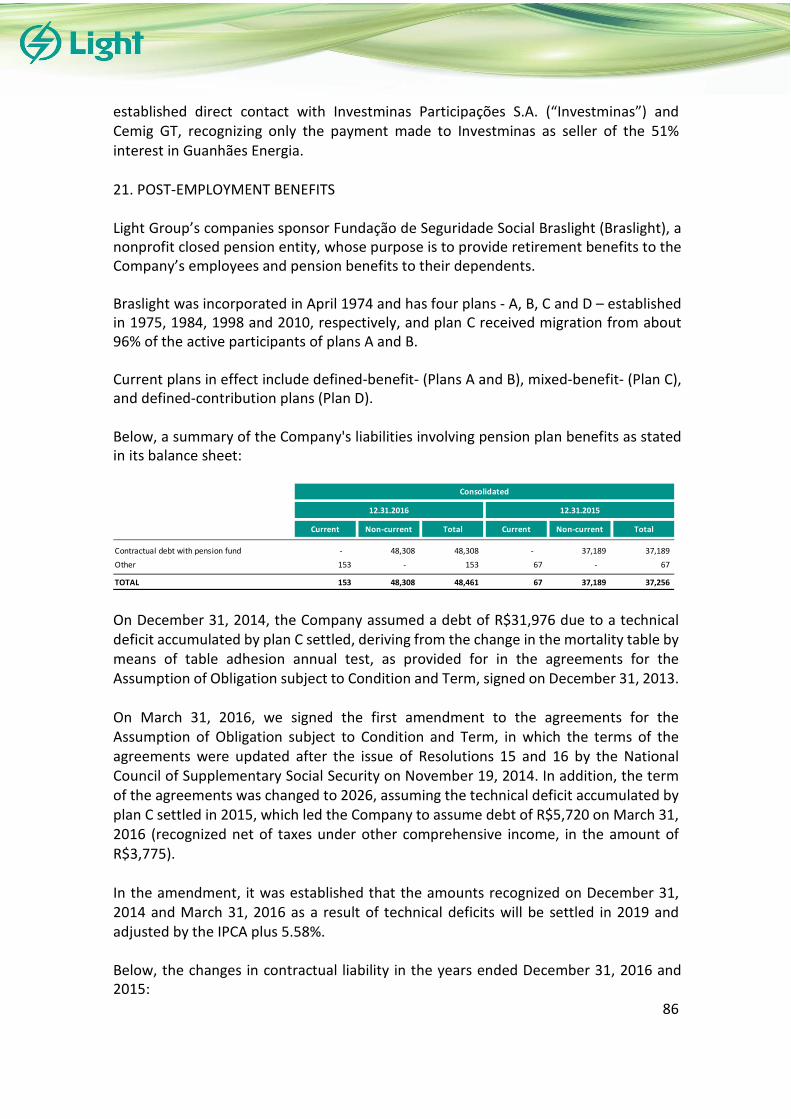
vs vsvsvsvs
86
established direct contact with Investminas Participações S.A. (“Investminas”) and Cemig GT, recognizing only the payment made to Investminas as seller of the 51% interest in Guanhães Energia.
21. POST-EMPLOYMENT BENEFITS Light Group’s companies sponsor Fundação de Seguridade Social Braslight (Braslight), a nonprofit closed pension entity, whose purpose is to provide retirement benefits to the Company’s employees and pension benefits to their dependents. Braslight was incorporated in April 1974 and has four plans - A, B, C and D – established in 1975, 1984, 1998 and 2010, respectively, and plan C received migration from about 96% of the active participants of plans A and B. Current plans in effect include defined-benefit- (Plans A and B), mixed-benefit- (Plan C), and defined-contribution plans (Plan D). Below, a summary of the Company's liabilities involving pension plan benefits as stated in its balance sheet:
On December 31, 2014, the Company assumed a debt of R$31,976 due to a technical deficit accumulated by plan C settled, deriving from the change in the mortality table by means of table adhesion annual test, as provided for in the agreements for the Assumption of Obligation subject to Condition and Term, signed on December 31, 2013. On March 31, 2016, we signed the first amendment to the agreements for the Assumption of Obligation subject to Condition and Term, in which the terms of the agreements were updated after the issue of Resolutions 15 and 16 by the National Council of Supplementary Social Security on November 19, 2014. In addition, the term of the agreements was changed to 2026, assuming the technical deficit accumulated by plan C settled in 2015, which led the Company to assume debt of R$5,720 on March 31, 2016 (recognized net of taxes under other comprehensive income, in the amount of R$3,775). In the amendment, it was established that the amounts recognized on December 31, 2014 and March 31, 2016 as a result of technical deficits will be settled in 2019 and adjusted by the IPCA plus 5.58%. Below, the changes in contractual liability in the years ended December 31, 2016 and 2015:
Current Non-current Total Current Non-current Total
Contractual debt with pension fund - 48,308 48,308 - 37,189 37,189
Other 153 - 153 67 - 67
TOTAL 153 48,308 48,461 67 37,189 37,256
12.31.201512.31.2016
Consolidated
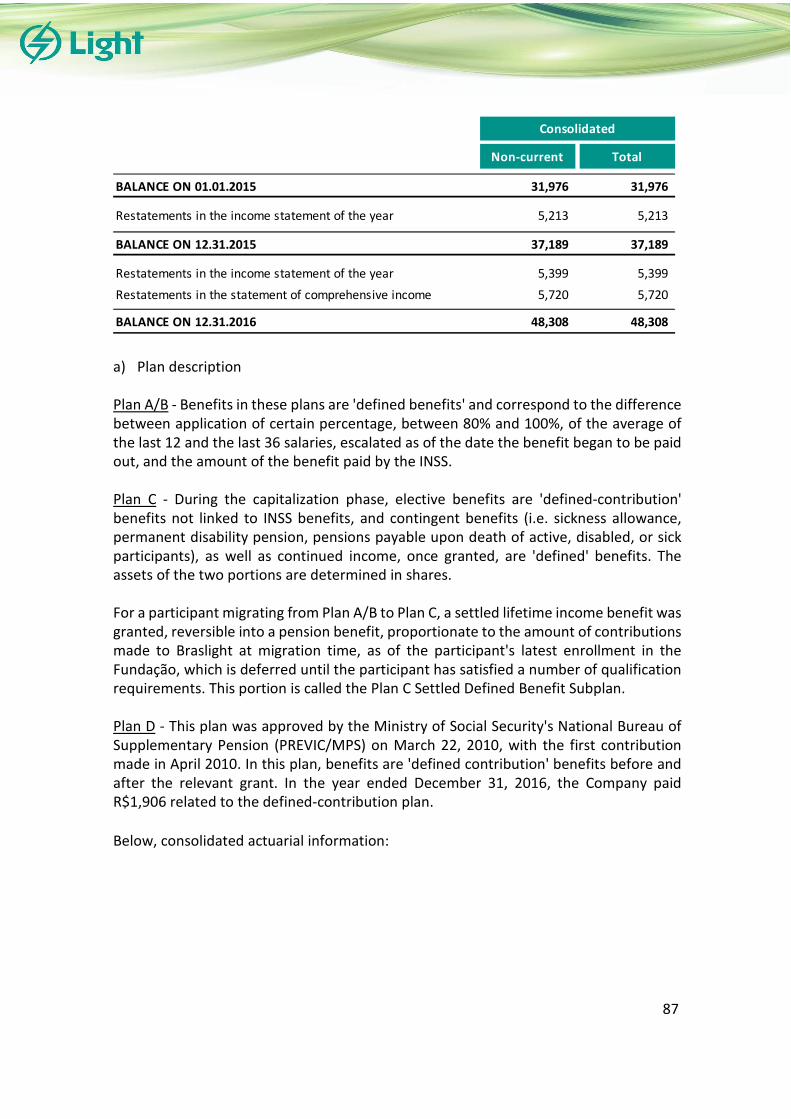
vs vsvsvsvs
87
a) Plan description
Plan A/B - Benefits in these plans are 'defined benefits' and correspond to the difference between application of certain percentage, between 80% and 100%, of the average of the last 12 and the last 36 salaries, escalated as of the date the benefit began to be paid out, and the amount of the benefit paid by the INSS. Plan C - During the capitalization phase, elective benefits are 'defined-contribution' benefits not linked to INSS benefits, and contingent benefits (i.e. sickness allowance, permanent disability pension, pensions payable upon death of active, disabled, or sick participants), as well as continued income, once granted, are 'defined' benefits. The assets of the two portions are determined in shares. For a participant migrating from Plan A/B to Plan C, a settled lifetime income benefit was granted, reversible into a pension benefit, proportionate to the amount of contributions made to Braslight at migration time, as of the participant's latest enrollment in the Fundação, which is deferred until the participant has satisfied a number of qualification requirements. This portion is called the Plan C Settled Defined Benefit Subplan. Plan D - This plan was approved by the Ministry of Social Security's National Bureau of Supplementary Pension (PREVIC/MPS) on March 22, 2010, with the first contribution made in April 2010. In this plan, benefits are 'defined contribution' benefits before and after the relevant grant. In the year ended December 31, 2016, the Company paid R$1,906 related to the defined-contribution plan. Below, consolidated actuarial information:
Non-current Total
BALANCE ON 01.01.2015 31,976 31,976
Restatements in the income statement of the year 5,213 5,213
BALANCE ON 12.31.2015 37,189 37,189
Restatements in the income statement of the year 5,399 5,399
Restatements in the statement of comprehensive income 5,720 5,720
BALANCE ON 12.31.2016 48,308 48,308
Consolidated

vs vsvsvsvs
88
Changes in plan assets’ fair value are as follows:
12.31.2016 12.31.2015
Present value of actuarial liabilities (2,853,500) (2,424,898)
Plan assets' fair value 2,880,250 2,588,321
Effect of the maximum limit in asset recognition (63,939) (195,399)
Addition - debt with Braslight (11,119) (5,213)
NET LIABILITIES (48,308) (37,189)
Net liabilities, CVM 695/12 (31,520) -
Balance of agreement adjusted with Braslight (48,308) (37,189)
12.31.2016 12.31.2015
Fair value of assets at the beginning of the year 2,588,321 2,563,457
Interest on the fair value of the plan's assets 325,362 293,968
Actuarial gains(losses) on the plan's assets 221,744 (19,204)
Sponsor's contributions 621 659
Participants' contributions 45 44
Benefit paid by the plan/company (255,843) (250,603)
FAIR VALUE OF ASSETS AT THE END OF THE YEAR 2,880,250 2,588,321
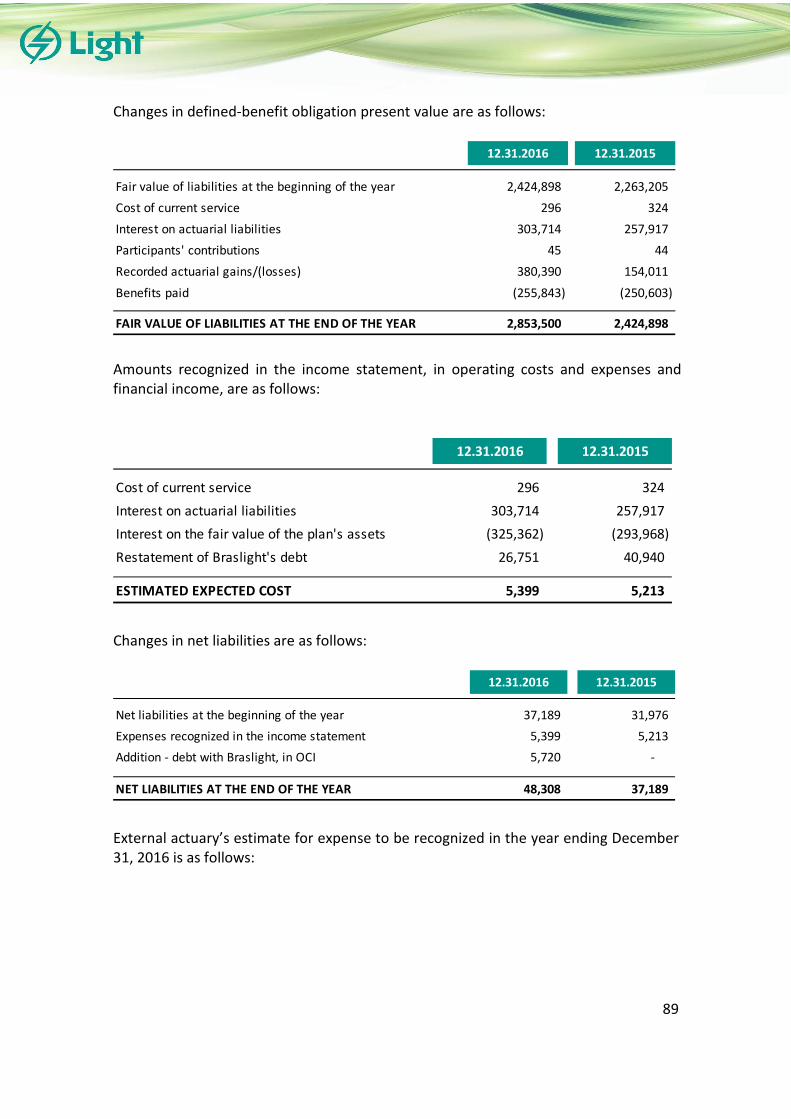
vs vsvsvsvs
89
Changes in defined-benefit obligation present value are as follows:
Amounts recognized in the income statement, in operating costs and expenses and financial income, are as follows:
Changes in net liabilities are as follows:
External actuary’s estimate for expense to be recognized in the year ending December 31, 2016 is as follows:
12.31.2016 12.31.2015
Fair value of liabilities at the beginning of the year 2,424,898 2,263,205
Cost of current service 296 324
Interest on actuarial liabilities 303,714 257,917
Participants' contributions 45 44
Recorded actuarial gains/(losses) 380,390 154,011
Benefits paid (255,843) (250,603)
FAIR VALUE OF LIABILITIES AT THE END OF THE YEAR 2,853,500 2,424,898
12.31.2016 12.31.2015
Cost of current service 296 324
Interest on actuarial liabilities 303,714 257,917
Interest on the fair value of the plan's assets (325,362) (293,968)
Restatement of Braslight's debt 26,751 40,940
ESTIMATED EXPECTED COST 5,399 5,213
12.31.2016 12.31.2015
Net liabilities at the beginning of the year 37,189 31,976
Expenses recognized in the income statement 5,399 5,213
Addition - debt with Braslight, in OCI 5,720 -
NET LIABILITIES AT THE END OF THE YEAR 48,308 37,189

vs vsvsvsvs
90
The plan assets’ main categories, as percentage of total plan assets, are as follows:
The actual result on plan assets was a gain of R$221,744 in the year ended December 31, 2016 (a loss of R$19,204 in the year ended December 31, 2015). Braslight carries out Asset Liability Management (ALM) studies of the benefit plans on a regular basis in order to reassess the investment allocation strategy in light of the actuarial liabilities, with the purpose of protecting itself from changes in the prices of financial instruments, as well as avoiding mismatches between inflows and outlays, thereby ensuring that resources are available on the date the plans’ benefits and other obligations are paid. Actuarial assumptions:
(a) Table without aggravation
2017
Cost of current service 141
Interest on actuarial liabilities 316,162
Expected return on the plan's assets (319,360)
(3,057)
12.31.2016 12.31.2015
Fixed income 93.54% 92.09%
Equities 0.71% 1.30%
Structured investments 0.65% 1.15%
Real property 4.58% 4.63%
Loans and financing 0.47% 0.91%
Other realizable amounts 0.06% 0.06%
Provision for contingencies -0.01% -0.14%
100.00% 100.00%
12.31.2016 12.31.2015
Nominal interest rate (discount) at present value of actuarial liabilities 11.63%(A/B) and 11.59%(C ) 13.21%(A/B) and 13.18%(C )
Expected nominal rate of return on plan's assets 11.63%(A/B) and 11.59%(C ) 13.21%(A/B) and 13.18%(C )
Annual inflation rate 5.50% 5.50%
Nominal salary growth rate 8.14% 8.14%
Nominal adjustment index of benefits granted from continued installment 5.50% 5.50%
Capacity factor 98.00% 98.00% Revolving rate Based on age Based on age
General mortality table (a) AT - 83/ BR(A/B) and EMS 2010 (C ) AT - 83/ BR(A/B) and EMS 2010 (C )
Disability table (plans A/B) LIGHT - Medium LIGHT - Medium
Disability table (plan C settled) LIGHT - Medium LIGHT - Medium
Mortality table of disabled people 1/2(IAPB55+AT83Male)*0.70 1/2(IAPB55+AT83Male)*0.70
Active participants 1,920 2,203
Retiree and pensioner participants 5,614 5,612

vs vsvsvsvs
91
b) Sensitivity analysis The main actuarial assumptions to determine the defined obligation are the discount rate and mortality table. The following sensitivity analyses were based on reasonably possible changes to the respective assumptions at the end of the reporting period, with all other assumptions remaining unchanged. In the presentation of the sensitivity analysis, the present value of the defined-benefit obligation was calculated using the projected credit unit method at the end of the reporting period method, which is equivalent to the method used to calculate the defined-benefit obligation. Below, we show the effects on the defined-benefit obligation in the event of a discount rate 0.25% lower and a change to the following more restrictive mortality table:
Nominal discount rate (p.a.)
Report
assumption
Discount rate
reduction
Impact on the
plan's obligation
Plan A/B 5.47% -0.25% (28,147)
Plan C 5.58% -0.25% (43,788)
Mortality table
Report
assumptionTable change
Impact on the
plan's obligation
Plan A/B AT-83 AT-2000 (23,698)
Plan C EMS 2010EMS 2010 Broken down by gender
Remedied for 2 years(69,090)

vs vsvsvsvs
92
22. OTHER PAYABLES
(a)It refers to sundry payables.
• Voluntary dismissal program
On April 4, 2016, the Company disclosed a Voluntary Dismissal Program (PDV) for its employees. The main conditions for adhesion to the PDV were: to have worked for the company for more than ten years, to be more than 55 years old at the time of termination and to meet the legal retirement requirements. In addition to severance pay, the benefits include from 2.5 to 5 base salaries and the extension of the health plan for 12 months. The employees may adhere to the program until April 20, 2016, and the termination of the employment contracts will take place by May 2, 2017. Of the 224 employees that adhered to the Program, 165 had their contracts terminated by December 31, 2016, incurring costs of R$20,150. The compensatory damages are estimated at R$8,806. 23. RELATED-PARTY TRANSACTIONS
On December 31, 2016, Light S.A. pertained to the controlling group Companhia Energética de Minas Gerais – CEMIG, Luce Empreendimentos e Participações S.A. and Rio Minas Energia Participações S.A. (RME).
Interest in subsidiaries and Jointly controlled entity is outlined in the Note 2.
Current Non-current Total Current Non-current Total
Regulatory charges 424,381 - 424,381 467,051 - 467,051
Energy Research Company – EPE 2,591 - 2,591 2,142 - 2,142
National Scientific and Technological Development Fund – FNDCT 4,131 - 4,131 1,735 - 1,735
Energy Efficiency Program – PEE 95,607 - 95,607 60,628 - 60,628
Research and Development Program – P&D 57,451 - 57,451 42,387 - 42,387
Energy development account quota – CDE 262,980 - 262,980 331,345 - 331,345
Global reversal reserve quota – RGR 1,621 - 1,621 951 - 951
Charges for capacity and emergency acquisition - - - 27,863 - 27,863
Other 168,791 75,510 244,301 160,739 76,101 236,840
Advances from clients 7,254 - 7,254 36,451 - 36,451
Compensation for use of water resources 3,897 - 3,897 2,864 - 2,864
Public lighting fee 88,776 - 88,776 69,862 - 69,862
Reserve for reversal - 69,933 69,933 - 70,320 70,320
Provision for Voluntary Redundancy 8,806 - 8,806 - - -
Other (a) 60,058 5,577 65,635 51,562 5,781 57,343
TOTAL 593,172 75,510 668,682 627,790 76,101 703,891
Consolidated
12.31.2016 12.31.2015

vs vsvsvsvs
93
Below, a summary of related-party transactions occurred in the years ended December 31, 2016 and 2015:
a) Assets and revenues
(1) The agreements related to charges for the use of the distribution system and the basic network are billed in accordance with the
network’s energy demand. b) Liabilities and expenses
(1) The agreements related to charges for the use of the distribution system and the basic network are billed in accordance with the
network’s energy demand. (2) The service agreement is billed in accordance with the number of hours spent in the contracted service.
The subsidiary Lightcom has subsidized energy purchase agreements of average 67 MW with supply starting in stages, between July 2014 and August 2035. The energy will derive from the portfolio projects of the Jointly controlled entity Renova Energia. Related-party transactions have been executed in accordance with the agreements between the parties.
12.31.2016 12.31.2015 2016 2015
Client - Collection of charge for the use of
distribution system between Light SESA and
CEMIG - it holds interest in the controlling
group
N/A (1) 61
As of Nov/2003.
Indefinite
maturity
Price practiced in
the regulated
market
N/A 61 58 702 737
Client - Collection of charge for the use of basic
network between Light SESA and Lightger -
under joint control
N/A (1) 31
As of Dec/2010.
Indefinite
maturity
Price practiced in
the regulated
market
N/A 31 29 356 327
Client - Collection of charge for the use of basic
network between Light Energia and CEMIG - it
holds interest in the controlling groupN/A (1) 11 As of Dec/2002
Price practiced in
the marketN/A 11 11 131 142
Client - Collection referring to services rendered
by Light Energia to Lightger - under joint control4,325 2,497
Dec/2012 to
Apr/2019
Terms and
conditions
agreed between
the parties
N/A 76 68 924 1,345
Assets RevenuesAgreements with the same group (Balance
sheet group, characteristics of the agreement
and relationship)
Original valueRemaining
balance
Effectiveness
period
Contractual
conditions
Conditions for
cancellation or
termination
12.31.2016 12.31.2015 2016 2015
Supplier - power purchase commitment between
Light SESA and CEMIG - it holds interest in the
controlling group
614,049 - Jan/2006 to
Dec/2038
Price practiced in
the regulated
market
30% of the remaining
balance- 177 (597) (27,334)
Supplier - power purchase commitment between
Light SESA and CEMIG - it holds interest in the
controlling group
275,238 54,081Jan/2010 to
Dec/2039
Price practiced in
the regulated
market
30% of the remaining
balance5,754 4,872 (72,362) (19,134)
Supplier - Commitment with charges for the use
of basic network between Light SESA and
CEMIG - it holds interest in the controlling
group
N/A (1) 708
As of Dec/2002.
Indefinite
maturity
Price practiced in
the regulated
market
N/A 708 636 (5,965) (6,060)
Supplier - Power purchase commitment between
Light Energia and Lightger - under joint control217,213 1,365
Dec/2010 to
Jun/2028
Terms and
conditions
agreed between
the parties
N/A 1,365 - (18,862) (17,712)
Supplier - Commitment with service rendering
from Ativa Data Center to Light SESA and Light
Energia - it holds interest in the controlling
group
16,393 - Aug/2011 to
Jan/2016
Terms and
conditions
agreed between
the parties
Non-compliance with
any contractual index
for three consecutive
months
- 426 (341) (2,528)
Other debts - Commitment with advisory
services between Light SESA and Axxiom - under
joint controlN/A (2) 6,491
As of Dec/2010.
Indefinite
maturity
IGP-M N/A 6,491 6,856 (22,754) (24,525)
Pension plan - Commitment between Light S.A,
Light SESA, Light Energia, Light Esco and
Lightcom and Fundação de Seguridade Social
Braslight - the foundation's sponsor
42,726 48,461 Dec/2013 to
Jun/2026.
IPCA + 5.58%
p.a. N/A 48,461 42,726 (5,399) (5,213)
Agreements with the same group (Balance
sheet group, characteristics of the agreement
and relationship)
Original valueRemaining
balance
Effectiveness
period
Contractual
conditions
Conditions for
cancellation or
termination
Liabilities Expenses
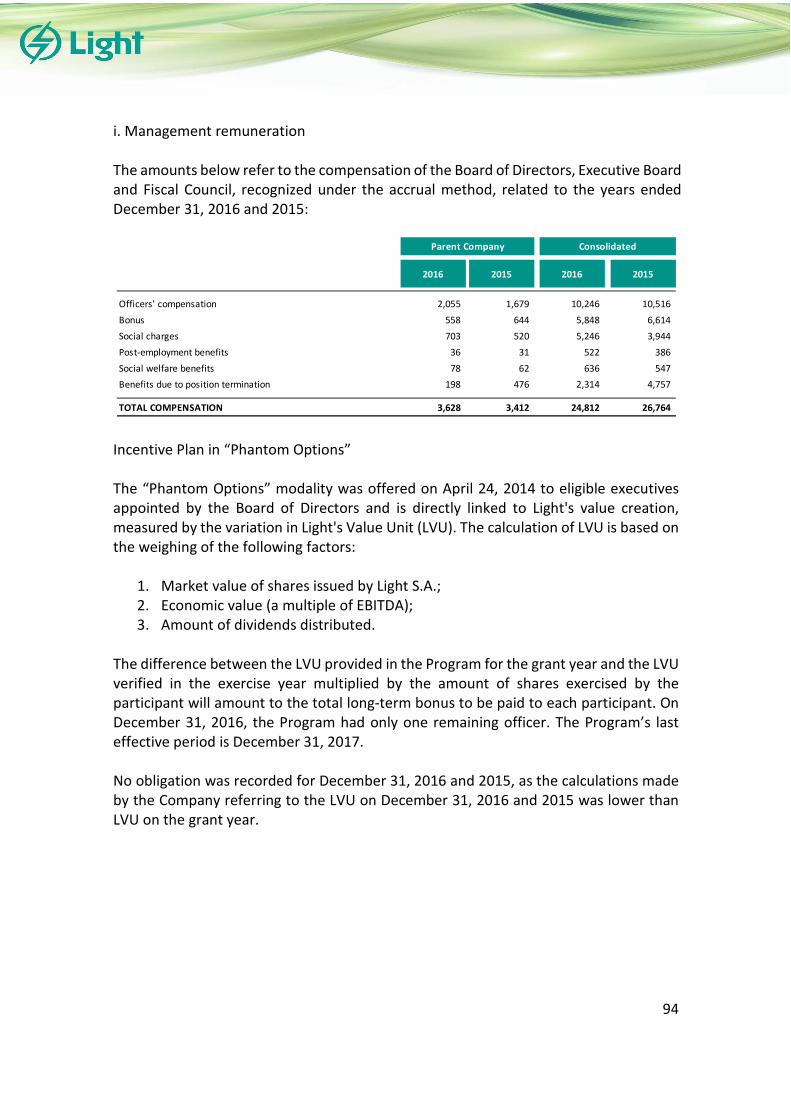
vs vsvsvsvs
94
i. Management remuneration The amounts below refer to the compensation of the Board of Directors, Executive Board and Fiscal Council, recognized under the accrual method, related to the years ended December 31, 2016 and 2015:
Incentive Plan in “Phantom Options” The “Phantom Options” modality was offered on April 24, 2014 to eligible executives appointed by the Board of Directors and is directly linked to Light's value creation, measured by the variation in Light's Value Unit (LVU). The calculation of LVU is based on the weighing of the following factors:
1. Market value of shares issued by Light S.A.; 2. Economic value (a multiple of EBITDA); 3. Amount of dividends distributed.
The difference between the LVU provided in the Program for the grant year and the LVU verified in the exercise year multiplied by the amount of shares exercised by the participant will amount to the total long-term bonus to be paid to each participant. On December 31, 2016, the Program had only one remaining officer. The Program’s last effective period is December 31, 2017. No obligation was recorded for December 31, 2016 and 2015, as the calculations made by the Company referring to the LVU on December 31, 2016 and 2015 was lower than LVU on the grant year.
2016 2015 2016 2015
Officers' compensation 2,055 1,679 10,246 10,516
Bonus 558 644 5,848 6,614
Social charges 703 520 5,246 3,944
Post-employment benefits 36 31 522 386
Social welfare benefits 78 62 636 547
Benefits due to position termination 198 476 2,314 4,757
TOTAL COMPENSATION 3,628 3,412 24,812 26,764
ConsolidatedParent Company
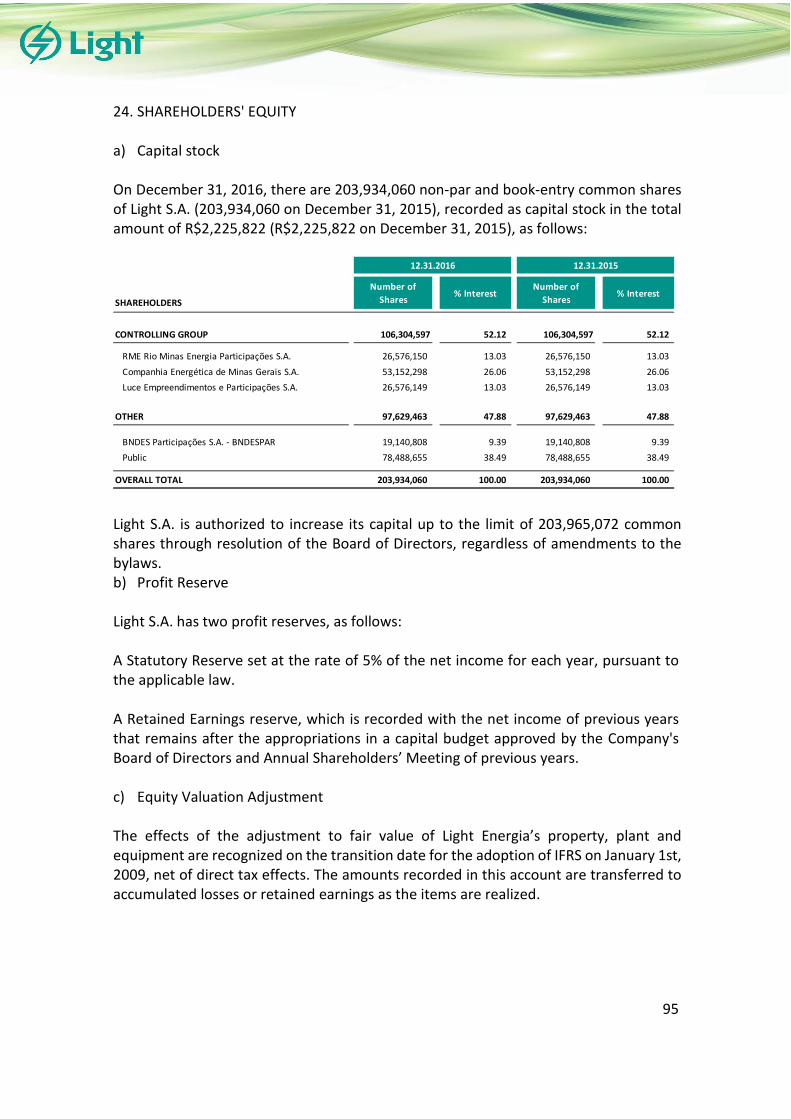
vs vsvsvsvs
95
24. SHAREHOLDERS' EQUITY
a) Capital stock
On December 31, 2016, there are 203,934,060 non-par and book-entry common shares of Light S.A. (203,934,060 on December 31, 2015), recorded as capital stock in the total amount of R$2,225,822 (R$2,225,822 on December 31, 2015), as follows:
Light S.A. is authorized to increase its capital up to the limit of 203,965,072 common shares through resolution of the Board of Directors, regardless of amendments to the bylaws. b) Profit Reserve Light S.A. has two profit reserves, as follows: A Statutory Reserve set at the rate of 5% of the net income for each year, pursuant to the applicable law. A Retained Earnings reserve, which is recorded with the net income of previous years that remains after the appropriations in a capital budget approved by the Company's Board of Directors and Annual Shareholders’ Meeting of previous years. c) Equity Valuation Adjustment
The effects of the adjustment to fair value of Light Energia’s property, plant and equipment are recognized on the transition date for the adoption of IFRS on January 1st, 2009, net of direct tax effects. The amounts recorded in this account are transferred to accumulated losses or retained earnings as the items are realized.
Number of
Shares% Interest
Number of
Shares% Interest
CONTROLLING GROUP 106,304,597 52.12 106,304,597 52.12
RME Rio Minas Energia Participações S.A. 26,576,150 13.03 26,576,150 13.03
Companhia Energética de Minas Gerais S.A. 53,152,298 26.06 53,152,298 26.06
Luce Empreendimentos e Participações S.A. 26,576,149 13.03 26,576,149 13.03
OTHER 97,629,463 47.88 97,629,463 47.88
BNDES Participações S.A. - BNDESPAR 19,140,808 9.39 19,140,808 9.39
Public 78,488,655 38.49 78,488,655 38.49
OVERALL TOTAL 203,934,060 100.00 203,934,060 100.00
SHAREHOLDERS
12.31.2016 12.31.2015
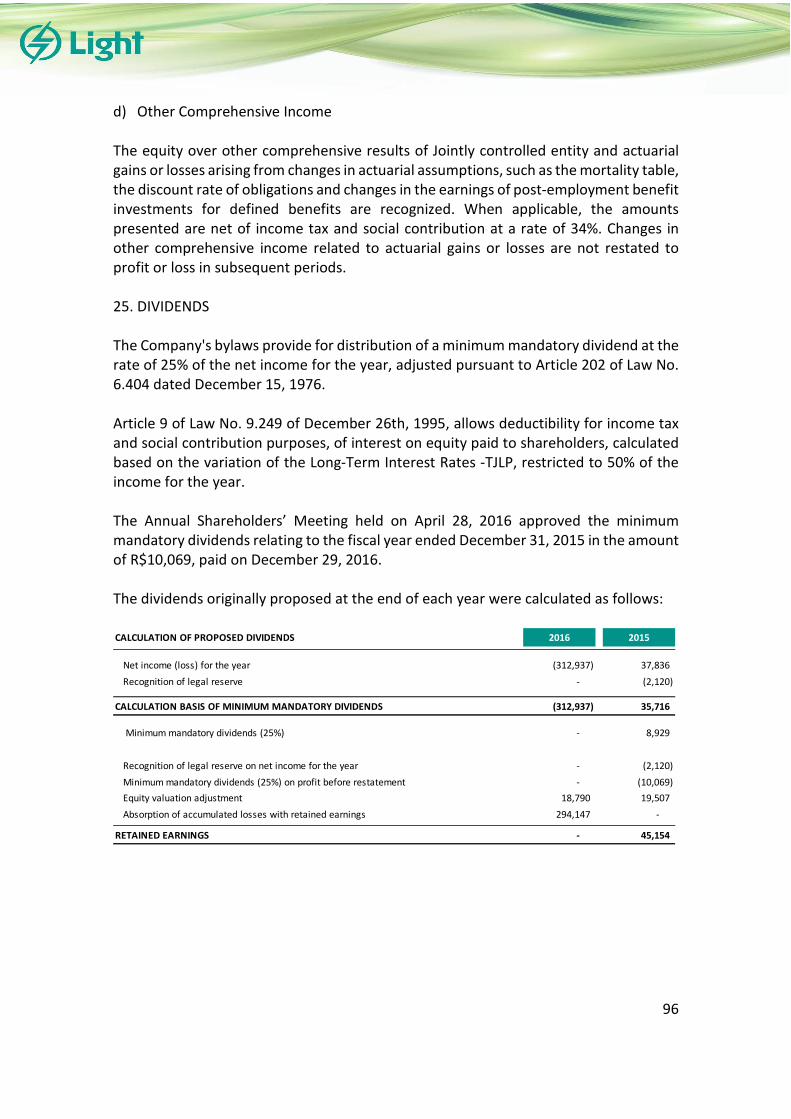
vs vsvsvsvs
96
d) Other Comprehensive Income The equity over other comprehensive results of Jointly controlled entity and actuarial gains or losses arising from changes in actuarial assumptions, such as the mortality table, the discount rate of obligations and changes in the earnings of post-employment benefit investments for defined benefits are recognized. When applicable, the amounts presented are net of income tax and social contribution at a rate of 34%. Changes in other comprehensive income related to actuarial gains or losses are not restated to profit or loss in subsequent periods. 25. DIVIDENDS The Company's bylaws provide for distribution of a minimum mandatory dividend at the rate of 25% of the net income for the year, adjusted pursuant to Article 202 of Law No. 6.404 dated December 15, 1976. Article 9 of Law No. 9.249 of December 26th, 1995, allows deductibility for income tax and social contribution purposes, of interest on equity paid to shareholders, calculated based on the variation of the Long-Term Interest Rates -TJLP, restricted to 50% of the income for the year. The Annual Shareholders’ Meeting held on April 28, 2016 approved the minimum mandatory dividends relating to the fiscal year ended December 31, 2015 in the amount of R$10,069, paid on December 29, 2016. The dividends originally proposed at the end of each year were calculated as follows:
CALCULATION OF PROPOSED DIVIDENDS 2016 2015
Net income (loss) for the year (312,937) 37,836
Recognition of legal reserve - (2,120)
CALCULATION BASIS OF MINIMUM MANDATORY DIVIDENDS (312,937) 35,716
Minimum mandatory dividends (25%) - 8,929
Recognition of legal reserve on net income for the year - (2,120)
Minimum mandatory dividends (25%) on profit before restatement - (10,069)
Equity valuation adjustment 18,790 19,507
Absorption of accumulated losses with retained earnings 294,147 -
RETAINED EARNINGS - 45,154

vs vsvsvsvs
97
Below, the breakdown of payable dividends balances:
26. PROFIT SHARING The Company's Profit Sharing Plan implemented in 1997 spans the whole corporation and is essentially contingent upon consolidated net income and EBITDA results of the Company. Payment of the profit-sharing amount comprises two portions, a fixed and a variable one. The Program has evolved over the years in order to elicit increased employee commitment to improving the Company's and its subsidiaries' bottom-lines.
On December 31, 2016, the balance of the provision for profit sharing, in estimated liabilities, was R$26,668 (R$27,749 on December 31, 2015), with payment expected to take place in April 2017. 27. EARNINGS PER SHARE The statement below reconciles the net results for the years ended December 31, 2016 and 2015 with the amounts used to calculate the basic and diluted earnings (losses) per share.
In the years ended December 31, 2016 and 2015, there were no differences between basic and diluted earnings (losses) per share, considering that the Company did not have any dilutive instruments.
BALANCE ON 01.01.2015 157,422 R$ / SHARE
Minimum mandatory dividends - 25% 10,069 0.0494
Paid in the year (116,392)
BALANCE ON 12.31.2015 51,099
Paid in the year (51,099)
BALANCE ON 12.31.2016 -
2016 2015
NUMERATOR
Net income (loss) for the year (312,937) 37,836
DENOMINATOR
Weighted average number of common shares 203,934,060 203,934,060
BASIC AND DILUTED EARNINGS (LOSSES) PER COMMON SHARE IN R$ (1.53) 0.19

vs vsvsvsvs
98
28. NET REVENUE
Revenue is recognized to the extent that it is probable that the economic benefits will flow to the Company and revenue can be reliably measured. Revenues are measured at fair value of the receivable or received consideration. Gross revenue is composed of revenue from electric power supply (billed or unbilled), revenue from network usage, revenue from construction and revenues from services rendered by the Company’ subsidiaries. Light SESA’s revenue comprises over four million consumers, being largely diluted and not concentrated on a few consumers. The tariffs are established by Aneel and applied to each consumer class. The Company’s revenue has a certain level of seasonality due to temperature variation in its concession area. Revenue increases in the periods recording highest temperatures.
20162015
Restated
Supply (Note 29) 16,153,220 15,208,217
Leases, rents and other 103,313 75,969
Revenue from network usage 845,827 818,892
Revenue from construction 889,632 936,829
Revenue from services rendered 87,625 51,592
CDE subsidy 130,052 117,859
Taxed service fee 5,821 5,427
Fair value of the concession's indemnifiable assets (Note 10) (20,285) 265,369
Unbilled revenue - Contributions from ACR and CCRBT accounts (Note 9) 19,073 1,049,263
Financial assets and liabilities of the sector - Unbilled revenue (Note 9) (1,144,949) (596,532)
GROSS REVENUE 17,069,329 17,932,885
ICMS (3,935,784) (3,682,959)
PIS / COFINS (1,480,464) (1,360,781)
Other (8,864) (5,515)
REVENUE TAXES (5,425,112) (5,049,255)
Energy Development Account - CDE (1,526,525) (1,584,212)
Global Reversal Reserve - RGR (13,766) (10,703)
Energy Research Company - EPE (9,528) (8,702)
National Technological Development Fund - FNDCT (19,058) (17,408)
Energy Efficiency Program - PEE (41,342) (37,954)
Research and Development -P&D (19,058) (17,408)
Special obligations (321,509) (246,786)
Other charges - Proinfa (17,167) (20,829)
Other charges (31,027) (26,955)
CONSUMER CHARGES (1,998,980) (1,970,957)
TOTAL DEDUCTIONS (7,424,092) (7,020,212)
NET REVENUE 9,645,237 10,912,673
Consolidated

vs vsvsvsvs
99
The special obligations refer to the revenue earned with excess of demand and excessive reactive power charged from consumers, in the amount of R$58,850 in the year ended December 31, 2016 (R$58,010 in the year ended December 31, 2015), and the tariff difference related to the special treatment of non-technical losses of Light SESA’s concession area, totaling R$262,659 in the year ended December 31, 2016 (R$188,776 in the year ended December 31, 2015), which although they are billed to consumers, they do not impact the Company’s net revenue since the last tariff revision of subsidiary Light SESA, which took place in November 2013.
During the fiscal year ended on December 31, 2015, the subsidiary Light SESA conducted discussions with Aneel with the purpose of maintaining PIS/COFINS tax neutrality for the concessionary, whose credits from the acquisition of property, plant and equipment and intangible assets have been passed on to consumers through the effective rate. After approval of the regulatory agency, through Official Letter 591/2015 – SFF/Aneel on October 5, 2015, the subsidiary Light SESA recognized the cost of property, plant and equipment and intangible assets, as a corresponding entry to PIS/COFINS expenses, since the PIS/COFINS cost is recovered effectively by Light SESA through the regulatory remuneration base, upon the tariff review process.
29. ELECTRIC POWER SUPPLY
(a) Not reviewed by independent auditors (b) Number of invoiced bills in December, with and without consumption (c) Light SESA
2016 2015 2016 2015 2016 2015
Residential 4,058,527 3,942,220 8,850 8,778 5,227,165 4,660,012
Industrial 7,060 7,366 1,060 1,274 488,941 484,795
Commerce, services and other 326,839 325,873 7,149 7,567 3,891,290 3,735,070
Rural 12,160 12,054 67 73 7,112 6,987
Public sector 12,361 11,857 1,488 1,521 864,176 794,265
Public lighting 659 741 746 860 209,201 224,467
Public utility 1,991 1,603 1,185 1,170 467,210 420,651
Own consumption 460 465 116 119 - -
BILLED SALES 4,420,057 4,302,179 20,661 21,362 11,155,095 10,326,247
ICMS - - - - 3,859,082 3,621,793
Unbilled sales (net of ICMS) - - - - (132,200) 224,631
TOTAL SUPPLY (c) 4,420,057 4,302,179 20,661 21,362 14,881,977 14,172,671
Sale of energy - - 4,670 4,291 1,154,683 977,804
Short-term energy - - 2,845 568 116,560 57,742
TOTAL SUPPLY - - 7,515 4,859 1,271,243 1,035,546
OVERALL TOTAL 4,420,057 4,302,179 28,176 26,221 16,153,220 15,208,217
Consolidated
Number of billed sales (a) (b)
GWh (a) R$

vs vsvsvsvs
100
30. OPERATING COSTS AND EXPENSES
31. ELECTRIC POWER PURCHASED FOR RESALE
(a) Not reviewed by independent auditors
COSTS2016 2015 2016
2015
Restated2016
2015
Restated
Personnel and management - - (231,420) (191,210) (150,631) (149,299)
Supplies - - (59,647) (17,976) (1,754) (189)
Outsourced services - - (343,865) (298,388) (154,859) (180,668)
Electric power purchased for resale (Note 31) (6,167,503) (7,160,923) - - - -
Depreciation and amortization - - (452,260) (411,647) (42,647) (47,754)
Allowance for doubtful accounts - - - - (217,057) (153,188)
Provision for contingencies/success/judicial deposits/Voluntary Dismissal Program (PDV) - - - - (6,438) (138,888)
Cost of construction - - (889,632) (936,829) - -
Fine due to non-compliance with power supply continuity indicators - - - - (46,080) (41,164)
Other revenues and expenses / costs - - 102,301 29,654 (51,855) (59,200)
TOTAL (6,167,503) (7,160,923) (1,874,523) (1,826,396) (671,321) (770,350)
Consolidated
Electric Power Operation General and administrative expenses
COSTS EXPENSES
2016 2015 2016 2015
Connection charges - - (11,933) (11,011)
Expenses related to the use of Distribution Network - CUSD - - (3,192) (2,555)
Spot market energy 775 1,645 (127,369) (1,126,405)
Network Usage Charges - - (317,656) (311,209)
UTE Norte Fluminense 6,368 6,351 (1,676,846) (1,301,208)
Itaipu - binational 5,113 5,099 (987,489) (1,427,757)
Energy transportation - Itaipu - - (25,908) (22,801)
National Electric System Operator (O.N.S.) - - (22,085) (20,713)
PROINFA 534 525 (188,957) (127,191)
ESS - - (302,064) (253,280)
Other contracts and electric power auctions 19,597 17,438 (3,162,157) (3,167,006)
PIS/COFINS credits on purchase - - 658,153 610,213
TOTAL 32,387 31,058 (6,167,503) (7,160,923)
Consolidated
GWh (a) R$

vs vsvsvsvs
101
32. FINANCIAL RESULT
On April 1, 2015, Decree 8426/15 was published, which revoked Decree 5442/05 and increased PIS/COFINS rate on financial revenues to 4.65% as of July 1, 2015. Subsequently, Decree 8451 was published on May 19, 2015, which, among other measures, maintained a zero rate specifically for revenues arising from inflation adjustment in loans, borrowings and hedge transactions. The Company is paying PIS/COFINS on financial income, except for income from swap transactions and from revenues arising from updates of the Concession Agreement, which are excluded by Law 12,973/2014.
33. RECONCILIATION OF TAXES IN PROFIT OR LOSS Reconciliation of effective and nominal rates in the provision for income tax and social contribution:
20162015
Restated
REVENUES
Interest on debts paid by installments 44,262 32,088
Income from cash equivalents and marketable securities 45,728 60,843
Swap operations - 520,608
Restatement of judicial deposits 17,393 18,003
Adjustment to financial assets and liabilities of the sector (Note 9) 8,572 94,038
Other financial income 31,578 22,011
TOTAL FINANCIAL REVENUE 147,533 747,591
EXPENSES
Restatement of provision for contingencies (10,030) (9,671)
Expenses with tax liabilities (37,938) (20,177)
Debt charges (690,056) (647,092)
Exchange variation and inflation adjustment 282,239 (788,494)
Swap operations (499,110) -
Exchange variation on power bills 73,415 (65,796)
Other financial expenses (63,567) (70,665)
TOTAL FINANCIAL EXPENSES (945,047) (1,601,895)
FINANCIAL RESULT (797,514) (854,304)
Consolidated
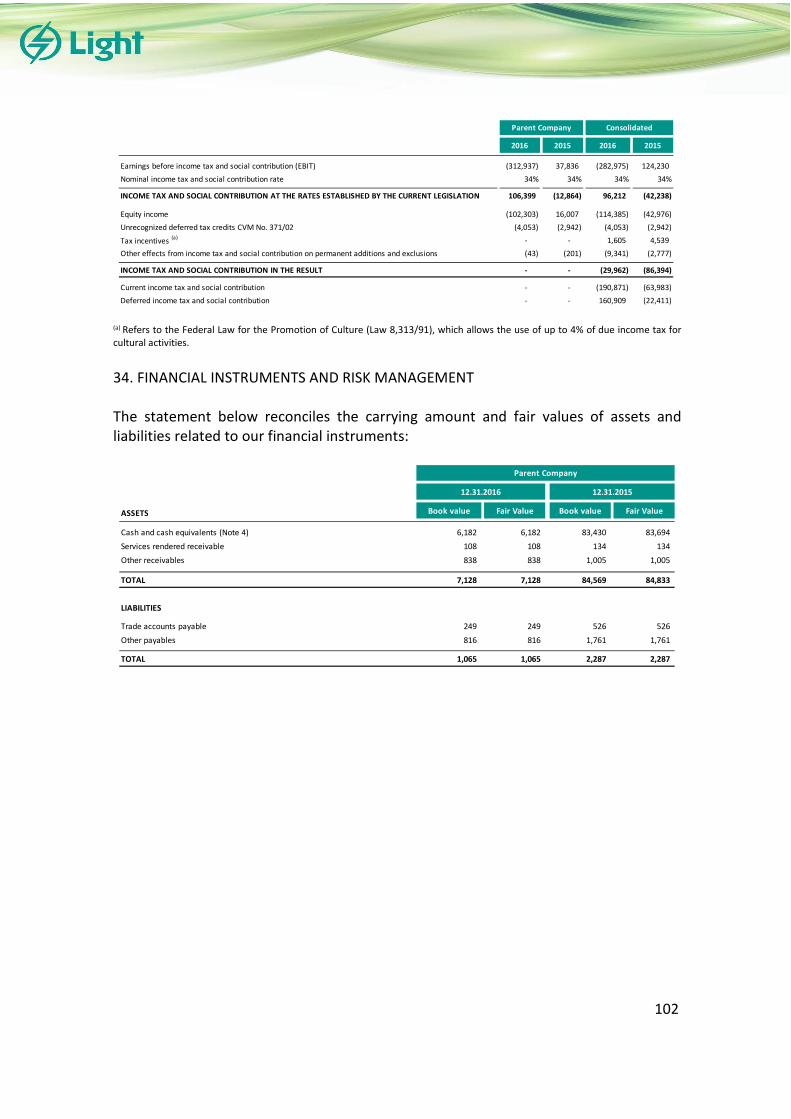
vs vsvsvsvs
102
(a) Refers to the Federal Law for the Promotion of Culture (Law 8,313/91), which allows the use of up to 4% of due income tax for cultural activities.
34. FINANCIAL INSTRUMENTS AND RISK MANAGEMENT The statement below reconciles the carrying amount and fair values of assets and liabilities related to our financial instruments:
2016 2015 2016 2015
Earnings before income tax and social contribution (EBIT) (312,937) 37,836 (282,975) 124,230
Nominal income tax and social contribution rate 34% 34% 34% 34%
INCOME TAX AND SOCIAL CONTRIBUTION AT THE RATES ESTABLISHED BY THE CURRENT LEGISLATION 106,399 (12,864) 96,212 (42,238)
Equity income (102,303) 16,007 (114,385) (42,976)
Unrecognized deferred tax credits CVM No. 371/02 (4,053) (2,942) (4,053) (2,942)
Tax incentives (a) - - 1,605 4,539
Other effects from income tax and social contribution on permanent additions and exclusions (43) (201) (9,341) (2,777)
INCOME TAX AND SOCIAL CONTRIBUTION IN THE RESULT - - (29,962) (86,394)
Current income tax and social contribution - - (190,871) (63,983)
Deferred income tax and social contribution - - 160,909 (22,411)
Parent Company Consolidated
ASSETS Book value Fair Value Book value Fair Value
Cash and cash equivalents (Note 4) 6,182 6,182 83,430 83,694
Services rendered receivable 108 108 134 134
Other receivables 838 838 1,005 1,005
TOTAL 7,128 7,128 84,569 84,833
LIABILITIES
Trade accounts payable 249 249 526 526
Other payables 816 816 1,761 1,761
TOTAL 1,065 1,065 2,287 2,287
Parent Company
12.31.2016 12.31.2015
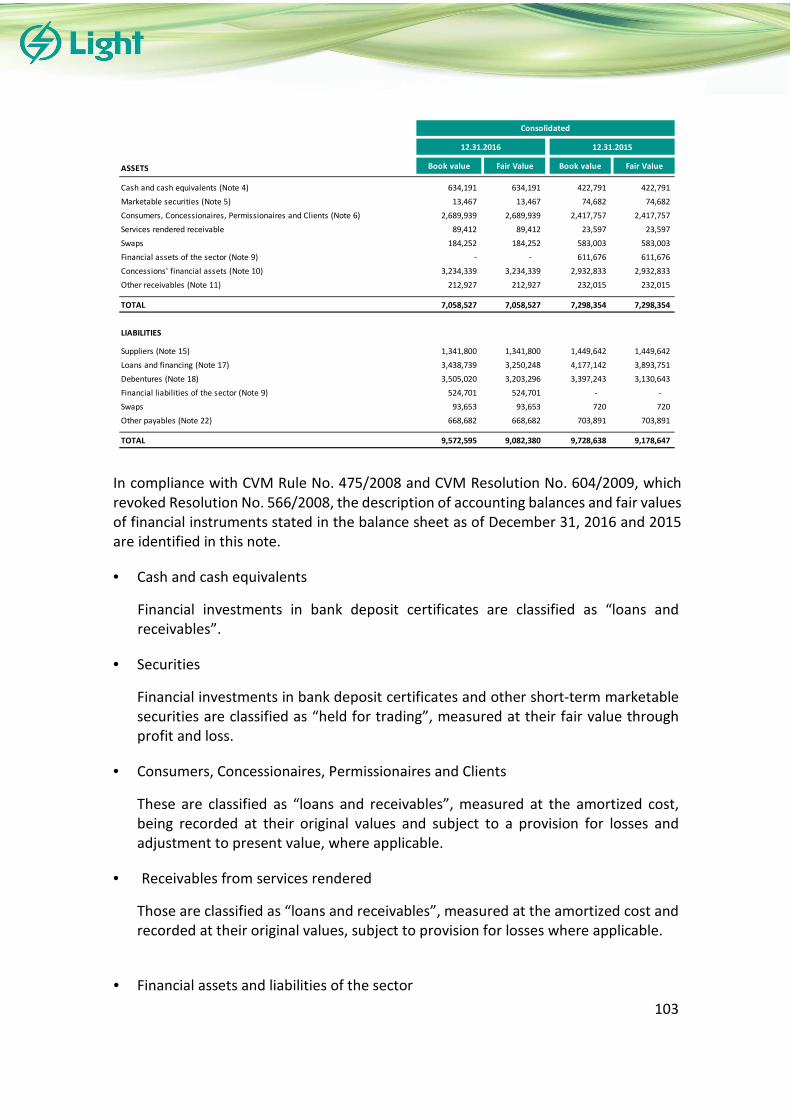
vs vsvsvsvs
103
In compliance with CVM Rule No. 475/2008 and CVM Resolution No. 604/2009, which revoked Resolution No. 566/2008, the description of accounting balances and fair values of financial instruments stated in the balance sheet as of December 31, 2016 and 2015 are identified in this note.
• Cash and cash equivalents
Financial investments in bank deposit certificates are classified as “loans and receivables”.
• Securities
Financial investments in bank deposit certificates and other short-term marketable securities are classified as “held for trading”, measured at their fair value through profit and loss.
• Consumers, Concessionaires, Permissionaires and Clients
These are classified as “loans and receivables”, measured at the amortized cost, being recorded at their original values and subject to a provision for losses and adjustment to present value, where applicable.
• Receivables from services rendered
Those are classified as “loans and receivables”, measured at the amortized cost and recorded at their original values, subject to provision for losses where applicable.
• Financial assets and liabilities of the sector
ASSETS Book value Fair Value Book value Fair Value
Cash and cash equivalents (Note 4) 634,191 634,191 422,791 422,791
Marketable securities (Note 5) 13,467 13,467 74,682 74,682
Consumers, Concessionaires, Permissionaires and Clients (Note 6) 2,689,939 2,689,939 2,417,757 2,417,757
Services rendered receivable 89,412 89,412 23,597 23,597
Swaps 184,252 184,252 583,003 583,003
Financial assets of the sector (Note 9) - - 611,676 611,676
Concessions' financial assets (Note 10) 3,234,339 3,234,339 2,932,833 2,932,833
Other receivables (Note 11) 212,927 212,927 232,015 232,015
TOTAL 7,058,527 7,058,527 7,298,354 7,298,354
LIABILITIES
Suppliers (Note 15) 1,341,800 1,341,800 1,449,642 1,449,642
Loans and financing (Note 17) 3,438,739 3,250,248 4,177,142 3,893,751
Debentures (Note 18) 3,505,020 3,203,296 3,397,243 3,130,643
Financial liabilities of the sector (Note 9) 524,701 524,701 - -
Swaps 93,653 93,653 720 720
Other payables (Note 22) 668,682 668,682 703,891 703,891
TOTAL 9,572,595 9,082,380 9,728,638 9,178,647
Consolidated
12.31.2016 12.31.2015

vs vsvsvsvs
104
These are classified as “loans and receivables”, measured at the amortized cost and recorded by their original amounts, plus related charges, monetary restatements and subject to provision for losses, where applicable.
• Concessions' financial assets
These are classified as “available for sale”, measured at their fair value at initial recognition. After initial recognition, the changes in the fair value are recognized in net operating revenue.
• Suppliers
Accounts payable to suppliers of materials and services required in the operations of the Company, the amounts of which are known or easily determinable, added, where applicable, of relevant charges, monetary and/or exchange variations incurred up to the balance sheet date. These balances are classified as other financial liabilities at amortized cost and were recognized at their amortized cost, which is not significantly different from their fair value.
• Loans, borrowings and debentures
These are measured at the amortized cost. For reporting purposes, the fair value was calculated at interest rates applicable to instruments with similar nature, maturities and risks, or based on market quotations of these securities. The fair value for BNDES financing is identical to the accounting balance, since there are no similar instruments, with comparable maturities and interest rates. These financial instruments are classified as “other financial liabilities at amortized cost”.
• Other receivables and other payables
Other receivables and other payables classified as "loans and receivables" and “other financial liabilities at amortized cost” are measured at the amortized cost and stated at their original values, accrued of, where applicable, corresponding charges, monetary and/or currency variations incurred up to the balance sheet date or subject to a provision for losses, where applicable.
• Swaps
These are measured at fair value. A determination of fair value used available information on the market and usual pricing methodology: the face value (notional) evaluation for long position (in U.S. Dollars and Euros) until maturity date and discounted at present value of clean coupon rates, published in bulletins of Securities, Commodities and Futures Exchange – BM&FBOVESPA.
It is worth mentioning that estimated fair value of financial assets and liabilities was determined by means of information available on the market and appropriate valuation methodologies. Nevertheless, meaningful judgment was required from Management when interpreting market data to produce the most appropriate fair value estimate.
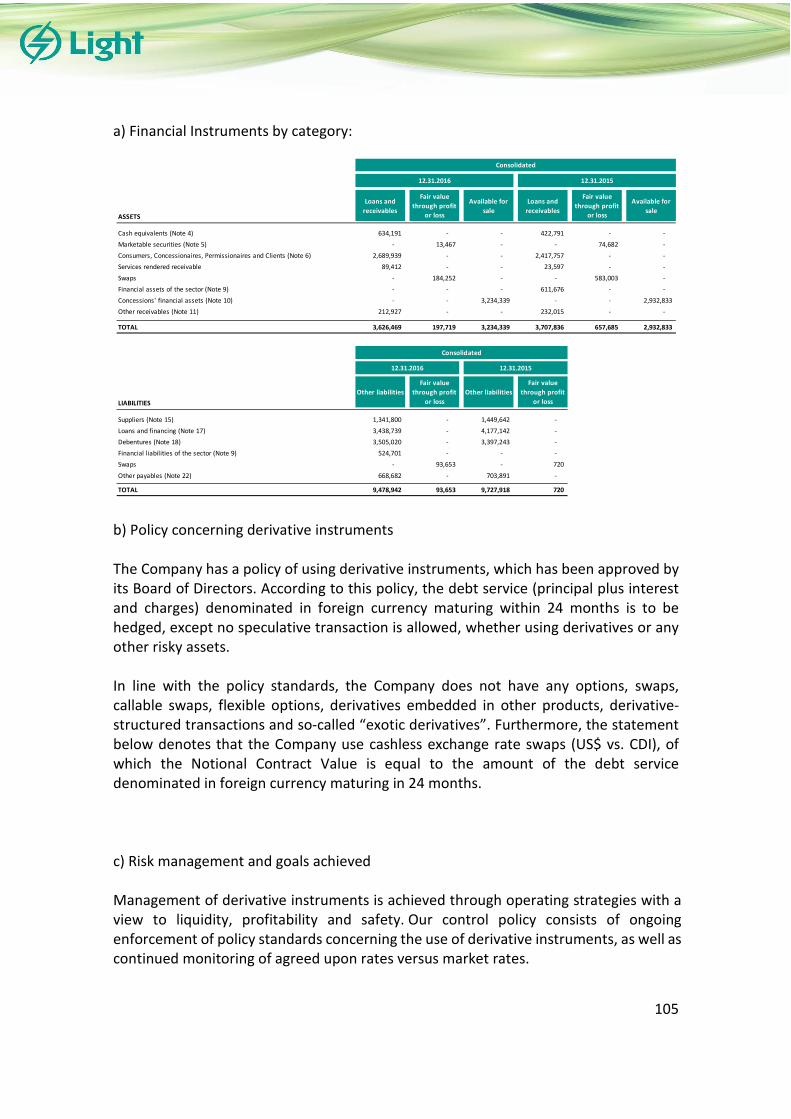
vs vsvsvsvs
105
a) Financial Instruments by category:
b) Policy concerning derivative instruments The Company has a policy of using derivative instruments, which has been approved by its Board of Directors. According to this policy, the debt service (principal plus interest and charges) denominated in foreign currency maturing within 24 months is to be hedged, except no speculative transaction is allowed, whether using derivatives or any other risky assets. In line with the policy standards, the Company does not have any options, swaps, callable swaps, flexible options, derivatives embedded in other products, derivative-structured transactions and so-called “exotic derivatives”. Furthermore, the statement below denotes that the Company use cashless exchange rate swaps (US$ vs. CDI), of which the Notional Contract Value is equal to the amount of the debt service denominated in foreign currency maturing in 24 months. c) Risk management and goals achieved Management of derivative instruments is achieved through operating strategies with a view to liquidity, profitability and safety. Our control policy consists of ongoing enforcement of policy standards concerning the use of derivative instruments, as well as continued monitoring of agreed upon rates versus market rates.
ASSETS
Loans and
receivables
Fair value
through profit
or loss
Available for
sale
Loans and
receivables
Fair value
through profit
or loss
Available for
sale
Cash equivalents (Note 4) 634,191 - - 422,791 - -
Marketable securities (Note 5) - 13,467 - - 74,682 -
Consumers, Concessionaires, Permissionaires and Clients (Note 6) 2,689,939 - - 2,417,757 - -
Services rendered receivable 89,412 - - 23,597 - -
Swaps - 184,252 - - 583,003 -
Financial assets of the sector (Note 9) - - - 611,676 - -
Concessions' financial assets (Note 10) - - 3,234,339 - - 2,932,833
Other receivables (Note 11) 212,927 - - 232,015 - -
TOTAL 3,626,469 197,719 3,234,339 3,707,836 657,685 2,932,833
LIABILITIES
Other liabilities
Fair value
through profit
or loss
Other liabilities
Fair value
through profit
or loss
Suppliers (Note 15) 1,341,800 - 1,449,642 -
Loans and financing (Note 17) 3,438,739 - 4,177,142 -
Debentures (Note 18) 3,505,020 - 3,397,243 -
Financial liabilities of the sector (Note 9) 524,701 - - -
Swaps - 93,653 - 720
Other payables (Note 22) 668,682 - 703,891 -
TOTAL 9,478,942 93,653 9,727,918 720
12.31.2015
Consolidated
12.31.2016 12.31.2015
Consolidated
12.31.2016

vs vsvsvsvs
106
d) Market Risk During the normal course of its businesses, the Company and its subsidiaries are exposed to the market risks related to currency variations and interest rates, as evidenced in the chart below: There follows a breakdown of debt by currency and index (it does not include financial charges):
Derivative financial instruments in the form of swaps were contracted for the portion of debt denominated in foreign currency, in accordance with the policy for utilization of derivative instruments approved by the Board of Directors. Thus, including the swaps, the Company’s foreign exchange exposure related to debt represents 0.53% of total debt denominated in foreign currency (0.67% on December 31, 2015). Below, we provide a few considerations and analyses on risk factors impacting on business of Light Group’s companies:
• Currency risk For a portion of loans and borrowings denominated in foreign currency, the company uses derivative financial instruments (swap operations) to hedge against service associated with these debts (principal plus interest and commissions) to expire within 24 months. Funds raised as per BACEN Resolution 4131 from BNP, Citibank, Itaú, Santander, Bank Tokyo and China Construction Bank were already contracted with swap for the entire duration of the debt, duly previously approved by the Board of Directors. Listed below is the chart with the breakdown of derivative transactions on December 31, 2016 and 2015:
R$ % R$ %
USD 1,472,009 22.1 2,035,207 27.7
EUR - - 209,876 2.9
TOTAL - FOREIGN CURRENCY 1,472,009 22.1 2,245,083 30.6
CDI 3,305,678 49.4 3,283,694 44.7
IPCA 600,000 9.0 607,185 8.3
TJLP 895,497 13.5 756,150 10.3
Other 400,223 6.0 454,134 6.1
TOTAL - LOCAL CURRENCY 5,201,398 77.9 5,101,163 69.4
TOTAL 6,673,407 100.0 7,346,246 100.0
Consolidated
12.31.2016 12.31.2015
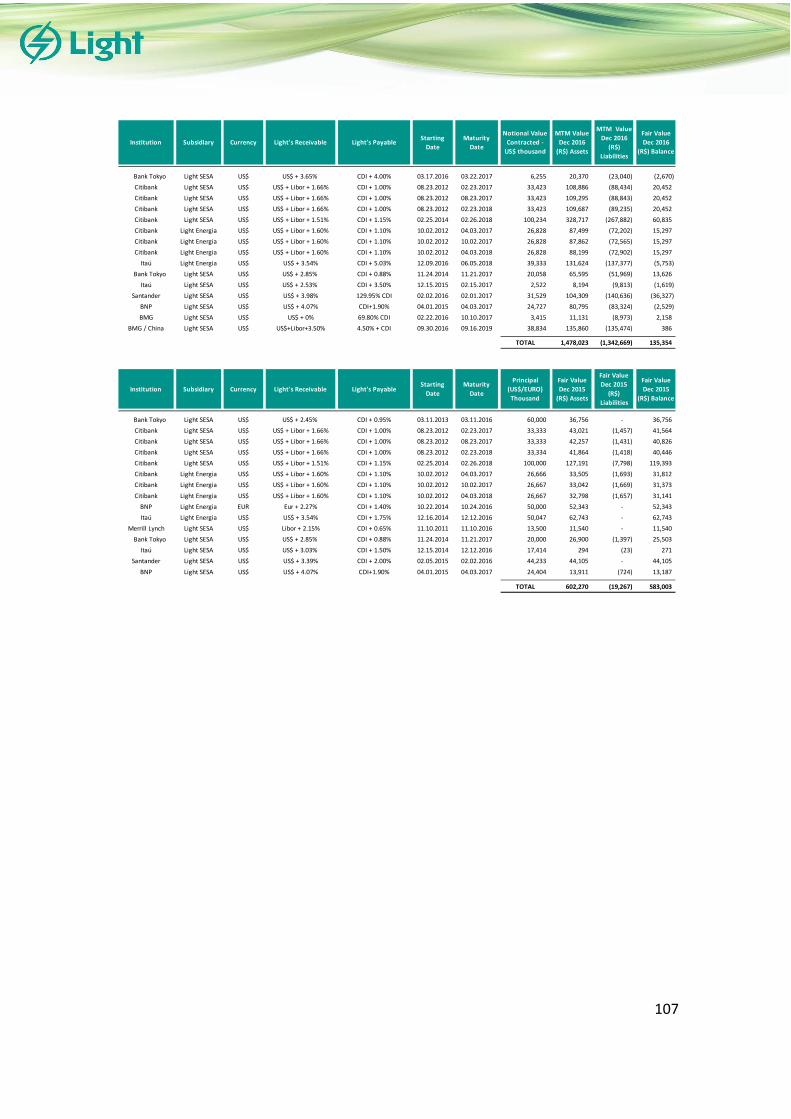
vs vsvsvsvs
107
Institution Subsidiary Currency Light's Receivable Light's PayableStarting
Date
Maturity
Date
Notional Value
Contracted -
US$ thousand
MTM Value
Dec 2016
(R$) Assets
MTM Value
Dec 2016
(R$)
Liabilities
Fair Value
Dec 2016
(R$) Balance
Bank Tokyo Light SESA US$ US$ + 3.65% CDI + 4.00% 03.17.2016 03.22.2017 6,255 20,370 (23,040) (2,670)
Citibank Light SESA US$ US$ + Libor + 1.66% CDI + 1.00% 08.23.2012 02.23.2017 33,423 108,886 (88,434) 20,452
Citibank Light SESA US$ US$ + Libor + 1.66% CDI + 1.00% 08.23.2012 08.23.2017 33,423 109,295 (88,843) 20,452
Citibank Light SESA US$ US$ + Libor + 1.66% CDI + 1.00% 08.23.2012 02.23.2018 33,423 109,687 (89,235) 20,452
Citibank Light SESA US$ US$ + Libor + 1.51% CDI + 1.15% 02.25.2014 02.26.2018 100,234 328,717 (267,882) 60,835
Citibank Light Energia US$ US$ + Libor + 1.60% CDI + 1.10% 10.02.2012 04.03.2017 26,828 87,499 (72,202) 15,297
Citibank Light Energia US$ US$ + Libor + 1.60% CDI + 1.10% 10.02.2012 10.02.2017 26,828 87,862 (72,565) 15,297
Citibank Light Energia US$ US$ + Libor + 1.60% CDI + 1.10% 10.02.2012 04.03.2018 26,828 88,199 (72,902) 15,297
Itaú Light Energia US$ US$ + 3.54% CDI + 5.03% 12.09.2016 06.05.2018 39,333 131,624 (137,377) (5,753)
Bank Tokyo Light SESA US$ US$ + 2.85% CDI + 0.88% 11.24.2014 11.21.2017 20,058 65,595 (51,969) 13,626
Itaú Light SESA US$ US$ + 2.53% CDI + 3.50% 12.15.2015 02.15.2017 2,522 8,194 (9,813) (1,619)
Santander Light SESA US$ US$ + 3.98% 129.95% CDI 02.02.2016 02.01.2017 31,529 104,309 (140,636) (36,327)
BNP Light SESA US$ US$ + 4.07% CDI+1.90% 04.01.2015 04.03.2017 24,727 80,795 (83,324) (2,529)
BMG Light SESA US$ US$ + 0% 69.80% CDI 02.22.2016 10.10.2017 3,415 11,131 (8,973) 2,158
BMG / China Light SESA US$ US$+Libor+3.50% 4.50% + CDI 09.30.2016 09.16.2019 38,834 135,860 (135,474) 386
TOTAL 1,478,023 (1,342,669) 135,354
Institution Subsidiary Currency Light's Receivable Light's PayableStarting
Date
Maturity
Date
Principal
(US$/EURO)
Thousand
Fair Value
Dec 2015
(R$) Assets
Fair Value
Dec 2015
(R$)
Liabilities
Fair Value
Dec 2015
(R$) Balance
Bank Tokyo Light SESA US$ US$ + 2.45% CDI + 0.95% 03.11.2013 03.11.2016 60,000 36,756 - 36,756
Citibank Light SESA US$ US$ + Libor + 1.66% CDI + 1.00% 08.23.2012 02.23.2017 33,333 43,021 (1,457) 41,564
Citibank Light SESA US$ US$ + Libor + 1.66% CDI + 1.00% 08.23.2012 08.23.2017 33,333 42,257 (1,431) 40,826
Citibank Light SESA US$ US$ + Libor + 1.66% CDI + 1.00% 08.23.2012 02.23.2018 33,334 41,864 (1,418) 40,446
Citibank Light SESA US$ US$ + Libor + 1.51% CDI + 1.15% 02.25.2014 02.26.2018 100,000 127,191 (7,798) 119,393
Citibank Light Energia US$ US$ + Libor + 1.60% CDI + 1.10% 10.02.2012 04.03.2017 26,666 33,505 (1,693) 31,812
Citibank Light Energia US$ US$ + Libor + 1.60% CDI + 1.10% 10.02.2012 10.02.2017 26,667 33,042 (1,669) 31,373
Citibank Light Energia US$ US$ + Libor + 1.60% CDI + 1.10% 10.02.2012 04.03.2018 26,667 32,798 (1,657) 31,141
BNP Light Energia EUR Eur + 2.27% CDI + 1.40% 10.22.2014 10.24.2016 50,000 52,343 - 52,343
Itaú Light Energia US$ US$ + 3.54% CDI + 1.75% 12.16.2014 12.12.2016 50,047 62,743 - 62,743
Merrill Lynch Light SESA US$ Libor + 2.15% CDI + 0.65% 11.10.2011 11.10.2016 13,500 11,540 - 11,540
Bank Tokyo Light SESA US$ US$ + 2.85% CDI + 0.88% 11.24.2014 11.21.2017 20,000 26,900 (1,397) 25,503
Itaú Light SESA US$ US$ + 3.03% CDI + 1.50% 12.15.2014 12.12.2016 17,414 294 (23) 271
Santander Light SESA US$ US$ + 3.39% CDI + 2.00% 02.05.2015 02.02.2016 44,233 44,105 - 44,105
BNP Light SESA US$ US$ + 4.07% CDI+1.90% 04.01.2015 04.03.2017 24,404 13,911 (724) 13,187
TOTAL 602,270 (19,267) 583,003
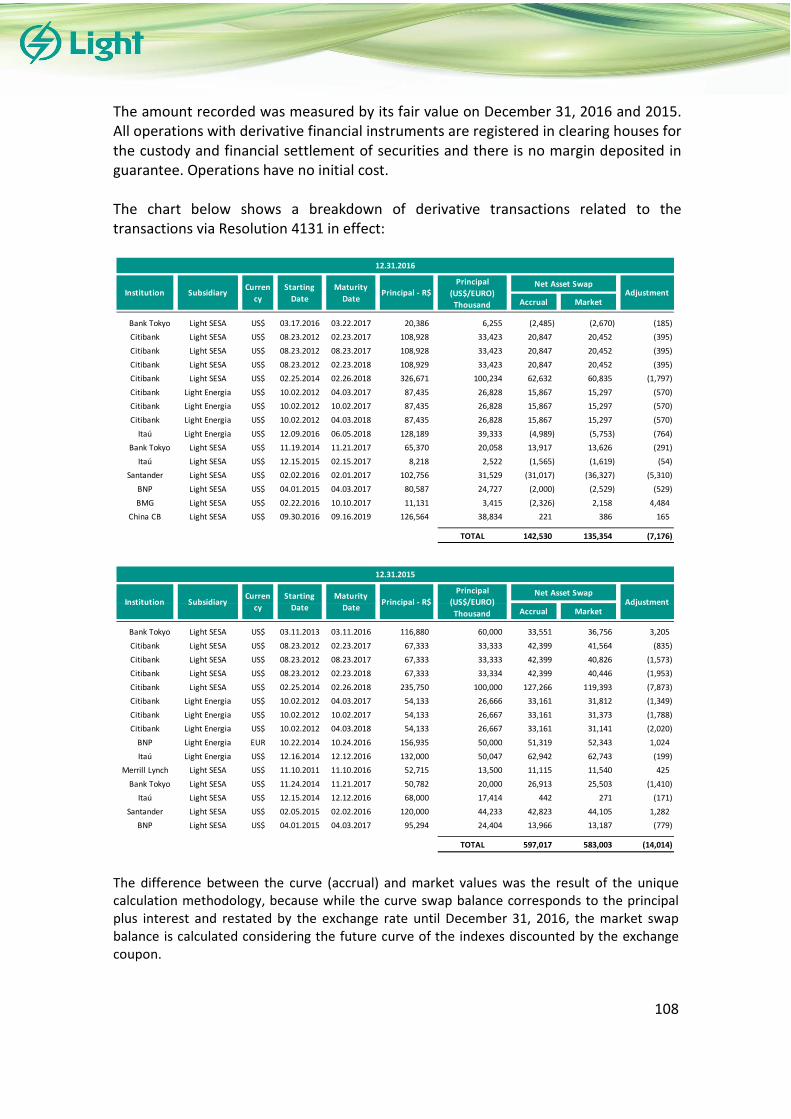
vs vsvsvsvs
108
The amount recorded was measured by its fair value on December 31, 2016 and 2015. All operations with derivative financial instruments are registered in clearing houses for the custody and financial settlement of securities and there is no margin deposited in guarantee. Operations have no initial cost. The chart below shows a breakdown of derivative transactions related to the transactions via Resolution 4131 in effect:
The difference between the curve (accrual) and market values was the result of the unique calculation methodology, because while the curve swap balance corresponds to the principal plus interest and restated by the exchange rate until December 31, 2016, the market swap balance is calculated considering the future curve of the indexes discounted by the exchange coupon.
Accrual Market
Bank Tokyo Light SESA US$ 03.17.2016 03.22.2017 20,386 6,255 (2,485) (2,670) (185)
Citibank Light SESA US$ 08.23.2012 02.23.2017 108,928 33,423 20,847 20,452 (395)
Citibank Light SESA US$ 08.23.2012 08.23.2017 108,928 33,423 20,847 20,452 (395)
Citibank Light SESA US$ 08.23.2012 02.23.2018 108,929 33,423 20,847 20,452 (395)
Citibank Light SESA US$ 02.25.2014 02.26.2018 326,671 100,234 62,632 60,835 (1,797)
Citibank Light Energia US$ 10.02.2012 04.03.2017 87,435 26,828 15,867 15,297 (570)
Citibank Light Energia US$ 10.02.2012 10.02.2017 87,435 26,828 15,867 15,297 (570)
Citibank Light Energia US$ 10.02.2012 04.03.2018 87,435 26,828 15,867 15,297 (570)
Itaú Light Energia US$ 12.09.2016 06.05.2018 128,189 39,333 (4,989) (5,753) (764)
Bank Tokyo Light SESA US$ 11.19.2014 11.21.2017 65,370 20,058 13,917 13,626 (291)
Itaú Light SESA US$ 12.15.2015 02.15.2017 8,218 2,522 (1,565) (1,619) (54)
Santander Light SESA US$ 02.02.2016 02.01.2017 102,756 31,529 (31,017) (36,327) (5,310)
BNP Light SESA US$ 04.01.2015 04.03.2017 80,587 24,727 (2,000) (2,529) (529)
BMG Light SESA US$ 02.22.2016 10.10.2017 11,131 3,415 (2,326) 2,158 4,484
China CB Light SESA US$ 09.30.2016 09.16.2019 126,564 38,834 221 386 165
TOTAL 142,530 135,354 (7,176)
InstitutionCurren
cy
Starting
Date
12.31.2016
AdjustmentPrincipal - R$Maturity
Date
Principal
(US$/EURO)
Thousand
Net Asset SwapSubsidiary
Accrual Market
Bank Tokyo Light SESA US$ 03.11.2013 03.11.2016 116,880 60,000 33,551 36,756 3,205
Citibank Light SESA US$ 08.23.2012 02.23.2017 67,333 33,333 42,399 41,564 (835)
Citibank Light SESA US$ 08.23.2012 08.23.2017 67,333 33,333 42,399 40,826 (1,573)
Citibank Light SESA US$ 08.23.2012 02.23.2018 67,333 33,334 42,399 40,446 (1,953)
Citibank Light SESA US$ 02.25.2014 02.26.2018 235,750 100,000 127,266 119,393 (7,873)
Citibank Light Energia US$ 10.02.2012 04.03.2017 54,133 26,666 33,161 31,812 (1,349)
Citibank Light Energia US$ 10.02.2012 10.02.2017 54,133 26,667 33,161 31,373 (1,788)
Citibank Light Energia US$ 10.02.2012 04.03.2018 54,133 26,667 33,161 31,141 (2,020)
BNP Light Energia EUR 10.22.2014 10.24.2016 156,935 50,000 51,319 52,343 1,024
Itaú Light Energia US$ 12.16.2014 12.12.2016 132,000 50,047 62,942 62,743 (199)
Merrill Lynch Light SESA US$ 11.10.2011 11.10.2016 52,715 13,500 11,115 11,540 425
Bank Tokyo Light SESA US$ 11.24.2014 11.21.2017 50,782 20,000 26,913 25,503 (1,410)
Itaú Light SESA US$ 12.15.2014 12.12.2016 68,000 17,414 442 271 (171)
Santander Light SESA US$ 02.05.2015 02.02.2016 120,000 44,233 42,823 44,105 1,282
BNP Light SESA US$ 04.01.2015 04.03.2017 95,294 24,404 13,966 13,187 (779)
TOTAL 597,017 583,003 (14,014)
Adjustment
12.31.2015
Institution SubsidiaryCurren
cy
Starting
DatePrincipal - R$
Principal
(US$/EURO)
Thousand
Net Asset SwapMaturity
Date
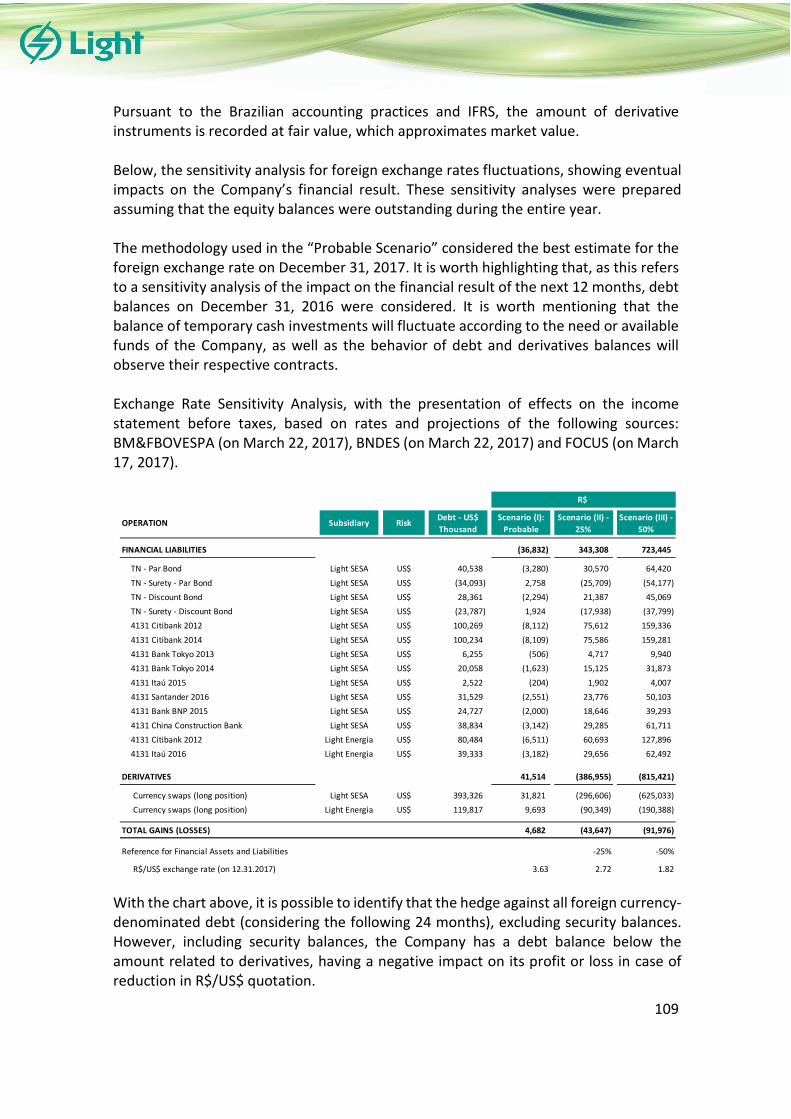
vs vsvsvsvs
109
Pursuant to the Brazilian accounting practices and IFRS, the amount of derivative instruments is recorded at fair value, which approximates market value. Below, the sensitivity analysis for foreign exchange rates fluctuations, showing eventual impacts on the Company’s financial result. These sensitivity analyses were prepared assuming that the equity balances were outstanding during the entire year. The methodology used in the “Probable Scenario” considered the best estimate for the foreign exchange rate on December 31, 2017. It is worth highlighting that, as this refers to a sensitivity analysis of the impact on the financial result of the next 12 months, debt balances on December 31, 2016 were considered. It is worth mentioning that the balance of temporary cash investments will fluctuate according to the need or available funds of the Company, as well as the behavior of debt and derivatives balances will observe their respective contracts. Exchange Rate Sensitivity Analysis, with the presentation of effects on the income statement before taxes, based on rates and projections of the following sources: BM&FBOVESPA (on March 22, 2017), BNDES (on March 22, 2017) and FOCUS (on March 17, 2017).
With the chart above, it is possible to identify that the hedge against all foreign currency-denominated debt (considering the following 24 months), excluding security balances. However, including security balances, the Company has a debt balance below the amount related to derivatives, having a negative impact on its profit or loss in case of reduction in R$/US$ quotation.
OPERATION Subsidiary RiskDebt - US$
Thousand
Scenario (I):
Probable
Scenario (II) -
25%
Scenario (III) -
50%
FINANCIAL LIABILITIES (36,832) 343,308 723,445
TN - Par Bond Light SESA US$ 40,538 (3,280) 30,570 64,420
TN - Surety - Par Bond Light SESA US$ (34,093) 2,758 (25,709) (54,177)
TN - Discount Bond Light SESA US$ 28,361 (2,294) 21,387 45,069
TN - Surety - Discount Bond Light SESA US$ (23,787) 1,924 (17,938) (37,799)
4131 Citibank 2012 Light SESA US$ 100,269 (8,112) 75,612 159,336
4131 Citibank 2014 Light SESA US$ 100,234 (8,109) 75,586 159,281
4131 Bank Tokyo 2013 Light SESA US$ 6,255 (506) 4,717 9,940
4131 Bank Tokyo 2014 Light SESA US$ 20,058 (1,623) 15,125 31,873
4131 Itaú 2015 Light SESA US$ 2,522 (204) 1,902 4,007
4131 Santander 2016 Light SESA US$ 31,529 (2,551) 23,776 50,103
4131 Bank BNP 2015 Light SESA US$ 24,727 (2,000) 18,646 39,293
4131 China Construction Bank Light SESA US$ 38,834 (3,142) 29,285 61,711
4131 Citibank 2012 Light Energia US$ 80,484 (6,511) 60,693 127,896
4131 Itaú 2016 Light Energia US$ 39,333 (3,182) 29,656 62,492
DERIVATIVES 41,514 (386,955) (815,421)
Currency swaps (long position) Light SESA US$ 393,326 31,821 (296,606) (625,033)
Currency swaps (long position) Light Energia US$ 119,817 9,693 (90,349) (190,388)
TOTAL GAINS (LOSSES) 4,682 (43,647) (91,976)
Reference for Financial Assets and Liabilities -25% -50%
R$/US$ exchange rate (on 12.31.2017) 3.63 2.72 1.82
R$
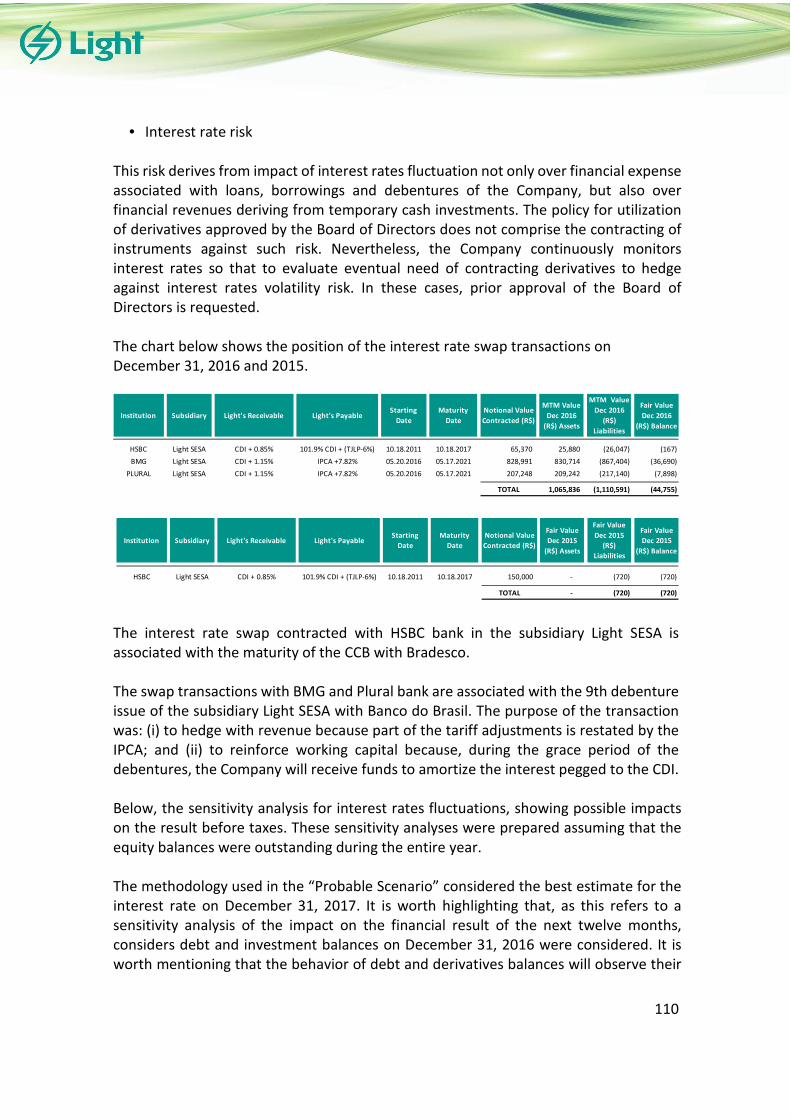
vs vsvsvsvs
110
• Interest rate risk This risk derives from impact of interest rates fluctuation not only over financial expense associated with loans, borrowings and debentures of the Company, but also over financial revenues deriving from temporary cash investments. The policy for utilization of derivatives approved by the Board of Directors does not comprise the contracting of instruments against such risk. Nevertheless, the Company continuously monitors interest rates so that to evaluate eventual need of contracting derivatives to hedge against interest rates volatility risk. In these cases, prior approval of the Board of Directors is requested. The chart below shows the position of the interest rate swap transactions on December 31, 2016 and 2015.
The interest rate swap contracted with HSBC bank in the subsidiary Light SESA is associated with the maturity of the CCB with Bradesco. The swap transactions with BMG and Plural bank are associated with the 9th debenture issue of the subsidiary Light SESA with Banco do Brasil. The purpose of the transaction was: (i) to hedge with revenue because part of the tariff adjustments is restated by the IPCA; and (ii) to reinforce working capital because, during the grace period of the debentures, the Company will receive funds to amortize the interest pegged to the CDI. Below, the sensitivity analysis for interest rates fluctuations, showing possible impacts on the result before taxes. These sensitivity analyses were prepared assuming that the equity balances were outstanding during the entire year. The methodology used in the “Probable Scenario” considered the best estimate for the interest rate on December 31, 2017. It is worth highlighting that, as this refers to a sensitivity analysis of the impact on the financial result of the next twelve months, considers debt and investment balances on December 31, 2016 were considered. It is worth mentioning that the behavior of debt and derivatives balances will observe their
Institution Subsidiary Light's Receivable Light's PayableStarting
Date
Maturity
Date
Notional Value
Contracted (R$)
MTM Value
Dec 2016
(R$) Assets
MTM Value
Dec 2016
(R$)
Liabilities
Fair Value
Dec 2016
(R$) Balance
HSBC Light SESA CDI + 0.85% 101.9% CDI + (TJLP-6%) 10.18.2011 10.18.2017 65,370 25,880 (26,047) (167)
BMG Light SESA CDI + 1.15% IPCA +7.82% 05.20.2016 05.17.2021 828,991 830,714 (867,404) (36,690)
PLURAL Light SESA CDI + 1.15% IPCA +7.82% 05.20.2016 05.17.2021 207,248 209,242 (217,140) (7,898)
TOTAL 1,065,836 (1,110,591) (44,755)
Institution Subsidiary Light's Receivable Light's PayableStarting
Date
Maturity
Date
Notional Value
Contracted (R$)
Fair Value
Dec 2015
(R$) Assets
Fair Value
Dec 2015
(R$)
Liabilities
Fair Value
Dec 2015
(R$) Balance
HSBC Light SESA CDI + 0.85% 101.9% CDI + (TJLP-6%) 10.18.2011 10.18.2017 150,000 - (720) (720)
TOTAL - (720) (720)

vs vsvsvsvs
111
respective contracts, and the balance of temporary cash investments will fluctuate according to the need or available funds of the Company. Below is the interest rate sensitivity analysis, showing the effects on income statement before taxes, based on rates and projections of the following sources: BM&FBOVESPA (on March 22, 2017), BNDES (on March 22, 2017) and FOCUS (on March 17, 2017).
(a) Includes Light Group’s subsidiaries.
OPERATIONSubsidiary Risk
Scenario (I):
Probable
Scenario (II) +
25%
Scenario (III) +
50%
FINANCIAL ASSETS (6,105) 4,284 14,672
Cash equivalents and marketable securities (a) CDI (6,105) 4,284 14,672
FINANCIAL LIABILITIES 231,347 110,703 (8,429)
TN - Discount Bond Light SESA Libor6M (476) (810) (1,144)
BNDES - Capex 2009/10 Sub A Light SESA TJLP - (200) (382)
BNDES - Capex 2009/10 Sub B Light SESA TJLP - (209) (392)
BNDES - Capex 2009/10 Sub N Light SESA TJLP - - (1)
BNDES - Capex 2009/10 Sub O Light SESA TJLP - - (1)
BNDES - Capex 2009/10 Sub P Light SESA TJLP - (1) (2)
BNDES - Capex 2009/10 Sub Q Light SESA TJLP - (1) (3)
BNDES - Capex 2011/12 Sub 1 Light SESA TJLP - (30) (61)
BNDES - Capex 2011/12 Sub 2 Light SESA TJLP - (1,614) (3,122)
BNDES - Capex 2011/12 Sub 3 Light SESA TJLP - (1,977) (3,797)
BNDES - Capex 2011/12 Sub 4 Light SESA TJLP - (2,067) (3,905)
Debentures 8th Issue Light SESA CDI 17,582 7,830 (1,922)
4131 Citibank 2012 Light SESA Libor3M (1,005) (1,965) (2,926)
BNDES - Capex 2013/14 Sub A Light SESA TJLP - (2,912) (5,540)
BNDES - Capex 2013/14 Sub B Light SESA SELIC 4,154 2,430 707
BNDES - Capex 2013/14 Sub D Light SESA TJLP - (60) (113)
BNDES - Capex 2013/14 Sub E Light SESA SELIC 85 50 14
BNDES - CAPEX 2015/16 SUB A Light SESA TJLP 9,534 6,846 4,158
BNDES - CAPEX 2015/16 SUB B Light SESA SELIC 7,628 4,463 1,298
BNDES - CAPEX 2015/16 SUB C Light SESA TJLP 4,429 3,180 1,932
BNDES - 2013/16 Olympics Sub A Light SESA TJLP - (339) (647)
BNDES - 2013/16 Olympics Sub B Light SESA TJLP - (354) (666)
BNDES - 2013/16 Olympics Sub C Light SESA SELIC 701 410 119
BNDES - 2013/16 Olympics Sub D Light SESA TJLP - (247) (472)
BNDES - 2013/16 Olympics Sub E Light SESA TJLP - (260) (488)
BNDES - 2013/16 Olympics Sub F Light SESA SELIC 515 301 88
CCB Bradesco 2016 Light SESA CDI 8,386 3,734 (917)
CCB Banco do Brasil Light SESA CDI 7,556 3,368 (828)
CCB CEF 2016 Light SESA CDI 3,461 1,541 (378)
Overdraft Account - CEF 2015 Light SESA CDI 4,609 2,053 (504)
Debentures 9th Issue Series A Light SESA CDI 45,201 20,129 (4,942)
Debentures 9th Issue Series B Light SESA IPCA 52,564 44,466 36,368
Debentures 10th Issue Light SESA CDI 39,124 17,451 (4,292)
Debentures 11th Issue Light SESA CDI 6,047 2,693 (661)
4131 Citibank 2014 Light SESA Libor3M (1,003) (1,962) (2,920)
4131 China Construction Bank Light SESA Libor3M (400) (782) (1,165)
BNDES - Capex 2009/10 Sub A Light Energia TJLP - (9) (16)
BNDES - Capex 2009/10 Sub B Light Energia TJLP - (9) (17)
BNDES - Capex 2011/12 Sub 1 Light Energia TJLP - (112) (216)
BNDES - Capex 2011/12 Sub 2 Light Energia TJLP - (67) (129)
Debentures 2nd Issue Light Energia CDI 14,771 6,578 (1,615)
Debentures 3rd Issue Light Energia CDI 1,122 500 (123)
Debentures 4th Issue Light Energia CDI 4,128 1,838 (451)
CCB - BNP PARIBAS Light Energia CDI 4,103 808 (2,003)
4131 CITI - 2012 Light Energia Libor 3M (806) (1,577) (2,347)
4131 ITAÚ - 2016 Light Energia Libor 3M (663) (1,045) (1,426)
BNDES - Lajes Project - SUB A Light Energia TJLP - (346) (656)
BNDES - Lajes Project - SUB B Light Energia TJLP - (259) (492)
BNDES - São Bento 2011 Light Esco TJLP - (1) (1)
BNDES - SP Market 2012 Light Esco TJLP - (25) (47)
BNDES - Coca-Cola 2013 Sub A Light Esco TJLP - (414) (795)
BNDES - Coca-Cola 2013 Sub C Light Esco TJLP - (77) (140)
BNDES - Nova América 2013 Sub A Light Esco TJLP - (103) (198)
BNDES - Nova América 2013 Sub C Light Esco TJLP - (31) (56)
BNDES - Hotel HSC 2014 Sub A Light Esco TJLP - (43) (83)
BNDES - Hotel HSC 2014 Sub C Light Esco TJLP - (10) (19)
BNDES - Iguatemi Caxias 2014 Sub A Light Esco TJLP - (2) (3)
BNDES - Norte Shopping 2014 Sub A Light Esco TJLP - (33) (63)
BNDES - Leblon 2015 Sub A Light Esco TJLP - (8) (16)
BNDES - Leblon 2015 Sub B Light Esco TJLP - (5) (10)
DERIVATIVES 198,656 128,734 58,814
Currency swaps (short position) (a) CDI 70,566 33,989 (2,586)
Interest rate swaps (long position) (a) Libor3M 3,210 6,278 9,345
Interest rate swaps (long position) (a) Libor6M 7,249 7,392 7,535
Interest rate swaps (long position) (a) CDI 46,014 20,491 (5,031)
Interest rate swaps (short position) (a) IPCA 71,617 60,584 49,551
TOTAL LOSS 423,898 243,721 65,057
Reference for FINANCIAL ASSETS
CDI (% on 12.31.2017) 13.25% 16.56% 19.88%
Reference for FINANCIAL LIABILITIES
CDI (% on 12.31.2017) 9.74% 12.18% 14.61%
TJLP (% on 12.31.2017) 7.50% 9.38% 11.25%
IPCA (% on 12.31.2017) 3.95% 4.94% 5.93%
Selic (% on 12.31.2017) 8.83% 11.04% 13.25%
Libor3M (% on 12.31.2017) 1.16% 1.45% 1.73%
Libor6M (% on 12.31.2017) 1.43% 1.79% 2.15%
R$

vs vsvsvsvs
112
• Credit risk It refers to the Company eventually suffering losses deriving from default of counterparties or financial institutions depositary of funds or temporary cash investments. To mitigate these risks, the Company uses all collection tools allowed by the regulatory body, such as disconnection for delinquency, debit losses and permanent monitoring and negotiation of outstanding positions. Credit risk of receivables is diluted due to the Company´s client base. Item "a" of this note contains a summary of the financial instruments broken down by category, including the Company's maximum credit risk. Concerning financial institutions, the Company only carries out low-risk operations, classified by rating agencies. The Company has a policy of not concentrating its portfolio in certain financial institution. Therefore, the policy’s principle is to control the portfolio concentration through limits imposed to the Groups and monitor financial institutions through their shareholders’ equity and ratings. Through its policy, the Company will be able to invest in fixed income products and Interbank Deposit Rate (CDI)-indexed post-fixed income and post-fixed government bonds.
• Liquidity risk Liquidity risk relates to the Company's ability to settle its liabilities. In order to determine the ability to meet satisfactorily its financial liabilities, the streams of maturities for funds raised and other liabilities are reported with the Company's statements. Further information on the funds raised can be found in detail in Notes 17 and 18. The Company has raised funds through its operations, from financial market transactions and from affiliate companies, primarily allocated to support its investment plan and in managing its cash for working capital and liability management purposes. The Company manages the liquidity risk by continuously monitoring expected and real cash flows and combining the maturity profiles of its financial liabilities and its financial indicator limits (covenants). On December 31, 2016, the Company had consolidated negative circulating capital of R$1,258,928 (R$423,135 on December 31, 2015). The Company presented an improvement in operating cash flow during 2016 due to the tariff adjustments made in the year ended on December 31, 2015, and the operational performance presented in 2016, together with the reduction in investments and the improvement of the hydrological scenario. Additionally, the Company has been negotiating the renewal of short-term loans and financings and the extension of its debt profile, as described in Note 17, and expects higher operating cash generation as a result of the tariff revision,

vs vsvsvsvs
113
as described in Note 40. Management believes that the success of these steps will reverse the current scenario of negative net circulating capital. It should also be noted that the Company presented positive consolidated operating cash flow of R$1,142,837 in the year ended December 31, 2016 (R$979,481 in the year ended December 31, 2015), which led to amortization of loans, financing and debentures R$344,284 higher than funding in the year ended December 31, 2016, (funding R$160,260 higher than amortization in the year ended December 31, 2015). In addition, as disclosed in Note 40, on March 14, 2017, Aneel approved the result of the 4th Periodic Tariff Review (RTP) of the subsidiary Light SESA, which caused an average increase of 10.45% in electricity bills as of March 15, 2017, guaranteeing an economic and financial rebalancing for the distribution company. As a result, the Company believes that there is no material uncertainty that casts doubt on its ability to continue as a going concern. The ratings assigned to the Company by the credit rating agencies are as follows:
The energy sold by the Company is mostly produced by hydroelectric power plants. A rainfall shortage lengthy period may result in reduced water volume in power plants reservoirs and result in losses due to higher energy acquisition costs or decreased revenues with the implementation of comprehensive electric power conservation programs. The lengthening of energy generation through the thermal power plants may pressure higher costs for energy distribution companies, causing higher cash needs in the short term, which are recoverable within current regulatory framework, and may result in future tariff increases. In the regular process of energy purchase and agreements for the use of transmission system, subsidiary Light SESA’s future receivables were tendered as collateral, especially in energy auctions, in the regulated trading environment (ACR), as provided for in agreements, totaling R$365,931 on December 31, 2016 (R$369,469 on December 31, 2015). The realization flow concerning future liabilities as per the relevant terms and conditions, which include future interest up to the contractual maturity dates, is summarized in the statement below:
Fitch A- - 06.06.2016
S&P brBBB+/brA-3 - 06.09.2016
Moody's Baa3.br B1 07.21.2016
Ratings National InternationalDate of
publication

vs vsvsvsvs
114
• Energy contracting risk
The portfolio of energy contracts comprises Itaipu contracts, PROINFA, assured energy quotas (CCGF), Angra 1 and 2 quotas and energy trading contracts in the regulated environment (CCEARs). Pursuant to MME Decree No. 5,163/2004, energy must be contracted by distribution agents through auction bids and the duration of these contracts (CCEARs) is established by the Ministry of Mines and Energy (MME). Costs related to the acquisition of energy are composed of non-manageable items. The current legislation establishes that distribution companies must guarantee service to all their energy markets and stipulates that ANEEL must consider, in the transfer of energy acquisition costs, up to 105% of the total amount of contracted energy in relation to the distribution company’s annual supply volume. The Company’s energy contracting strategy seeks to ensure that the contracting level remains between 100% and 105%, minimizing costs with the acquisition of energy to supply the captive market. As a result, the Company adopted a risk management approach to energy acquisition focused on the identification and measurement of volume, prices and period of supply, in addition to the use of optimization tools to support the decision to contract energy. The uncertainties in the macroeconomic and meteorological scenarios have a significant impact on the projected volumes to be acquired. However, the models used guide energy contracting with acceptable risk levels and, over time, the projections need to be adjusted. The main factors for uncertainty in energy acquisition are related to future price estimates and the projection of energy acquisition needs between three and five years before the beginning of the acquired energy supply. If the Company fails to serve 100% of the market, it may be subject to penalties due to under-contracting and will not be able to pass through the full cost of energy acquisition in the spot market to the tariffs.
Interest rate instruments: Up to 3 months3 months to 1
year1 to 5 years
More than
5 yearsTotal
Floating
Loans, borrowings and debentures (143,765) (1,332,229) (5,169,457) (2,636,822) (9,282,274)
Fixed rate
Loans, borrowings and debentures (179,068) (287,857) (152,232) (32,852) (652,010)
Trade accounts payable (1,341,800) - - - (1,341,800)
Swap (33,523) 69,170 (31,993) - 3,654
Total (1,698,156) (1,550,916) (5,353,683) (2,669,675) (11,272,430)
Consolidated

vs vsvsvsvs
115
The penalties from not fully serving the distribution agents’ energy market are not applicable in the event of an involuntary contractual exposure recognized by ANEEL. In addition, ANEEL will not pass through energy acquisition costs to the end consumers’ tariffs if the contracting level is higher than one hundred and five percent (105%) of the total amount of energy acquired in relation to the distribution agent’s annual supply volume. In order to mitigate over- and under-contracting (exposure), the regulation establishes certain instruments, such as (i) adjustment auctions, (ii) Surplus and Deficit Compensation Mechanism (MCSD) of new and existing energy, (iii) bilateral reduction agreements, (iv) temporary energy sales, (v) option to reduce existing energy CCEARs due to the migration of customers to the free market, increases in the acquisition of energy from contracts executed before the enactment of Law No. 10,848/2004 and other market variations, and (vi) the recognition of involuntary exposure or over contracting. Pursuant to ANEEL’s Normative Resolution No. 453, of October 18, 2011, any involuntary exposure or over contracting to which the distribution companies may be subject, as a result of facts outside their control, may be passed through to the respective tariffs. This pass-through will be granted as long as the distribution agents use all the mechanisms set forth in the regulation to meet the obligation to contract energy for their entire market. The difference not passed through to consumer tariffs will be absorbed by the concessionaire, and may result in risk or opportunity, depending on the energy price scenario throughout the year. The economic crisis, temperatures, migration of special customers to the free market and increase in the energy tariff caused the market to decline and, as the Company’s contracting level is based on the results of the acquisition contracts entered into and the energy required to serve its captive customers, the Company closed 2016 with a contracting level of 106.2%. Although this contracting level may still be adjusted and fall below 105% if certain factors are considered involuntary by the regulatory body, on December 31, 2016, the Company did not recognize the amount of R$29,500 related to this possible pass-through to the tariff as a sectorial financial asset, given that this matter is still being discussed with Aneel. Even though the costs related to involuntary over contracting are passed through to the tariff, there is a temporary cash mismatch, given that these occur at different times. A similar effect occurs when energy acquisition costs and sectorial charges increase, which occasionally causes the Company to finance itself through working capital. The Company estimates that the 2017 contracting level will remain between 100% and 105% of the total amount of contracted energy in relation to Light SESA’s annual supply volume.
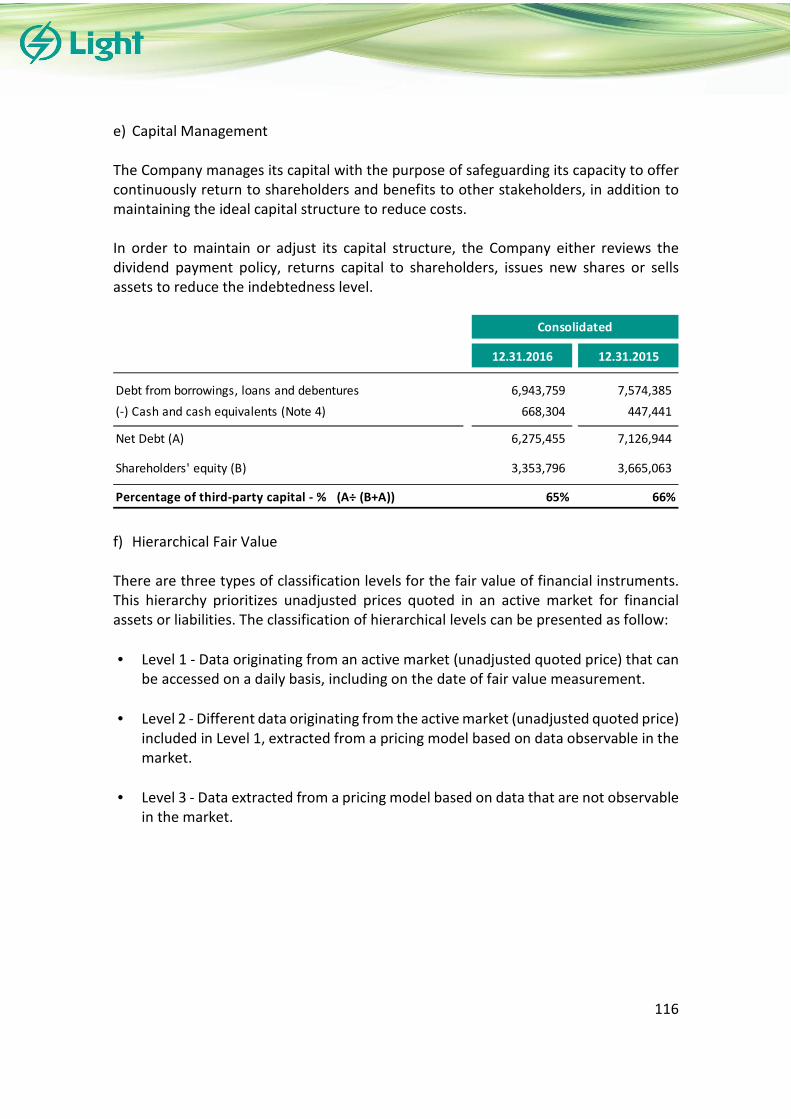
vs vsvsvsvs
116
e) Capital Management The Company manages its capital with the purpose of safeguarding its capacity to offer continuously return to shareholders and benefits to other stakeholders, in addition to maintaining the ideal capital structure to reduce costs. In order to maintain or adjust its capital structure, the Company either reviews the dividend payment policy, returns capital to shareholders, issues new shares or sells assets to reduce the indebtedness level.
f) Hierarchical Fair Value There are three types of classification levels for the fair value of financial instruments. This hierarchy prioritizes unadjusted prices quoted in an active market for financial assets or liabilities. The classification of hierarchical levels can be presented as follow:
• Level 1 - Data originating from an active market (unadjusted quoted price) that can be accessed on a daily basis, including on the date of fair value measurement.
• Level 2 - Different data originating from the active market (unadjusted quoted price) included in Level 1, extracted from a pricing model based on data observable in the market.
• Level 3 - Data extracted from a pricing model based on data that are not observable in the market.
12.31.2016 12.31.2015
Debt from borrowings, loans and debentures 6,943,759 7,574,385
(-) Cash and cash equivalents (Note 4) 668,304 447,441
Net Debt (A) 6,275,455 7,126,944
Shareholders' equity (B) 3,353,796 3,665,063
Percentage of third-party capital - % (A÷ (B+A)) 65% 66%
Consolidated

vs vsvsvsvs
117
Regarding the concession’s financial assets, classified as available for sale, the inclusion in level 3 was due to the fact that the relevant factors for the valuation at fair value were not publicly observable. The changes between the years and the respective gains and losses in the income statement for the year, as well as the assumptions, are described in Notes 3 and 10. 35. INSURANCE On December 31, 2016, the Light group had insurances covering its main assets, including: Operational Risk Insurance - it covers damages caused to hydroelectric and thermoelectric power plants, including, but not limited to its machinery, steam turbines, gas turbines, generators, boilers, transformers, channels, tunnels, dams, spillway, civil works, offices and warehouses. All assets are insured under the Operational Risks
12.31.2016Identical markets
Level 1
Similar markets
Level 2
Without active
market
Level 3
ASSETS
Marketable securities (Note 5) 13,467 3,127 10,340 -
Concessions' financial assets (Note 10) 3,234,339 - - 3,234,339
Swaps 184,252 - 184,252 -
TOTAL 3,432,058 3,127 194,592 3,234,339
LIABILITIES
Swaps 93,653 - 93,653 -
TOTAL 93,653 - 93,653 -
Consolidated
Measurement of Fair Value
12.31.2015
Identical markets
Level 1
Restated
Similar markets
Level 2
Restated
Without active
market
Level 3
ASSETS
Marketable securities (Note 5) 74,682 9,124 65,558 -
Concessions' financial assets (Note 10) 2,932,833 - - 2,932,833
Swaps 583,003 - 583,003 -
TOTAL 3,590,518 9,124 648,561 2,932,833
LIABILITIES
Swaps 720 - 720 -
TOTAL 720 - 720 -
Measurement of Fair Value
Consolidated

vs vsvsvsvs
118
modality, with an “All Risks” coverage, including the transmission and distribution lines up to 1,000 feet from generation site. Directors and Officers Liability Insurance (D&O) - It has the purpose of protecting Executives from losses and damages resulting from the performance of their activities inherent to the position as Directors, Officers and Managers of the Company. General and Civil Liability Insurance - focuses on the payment of indemnity if the Company is deemed civilly liable by a final and irrevocable court decision or deal authorized by the insurance company, in relation to remedies for property damage and involuntary personal injury caused to third parties and also those related to pollution, contamination, sudden and/or accidental leakage. Financial Guarantee Insurance – Energy Trading and Judicial. Property Insurance – Comprehensive Business (Leased Properties). International Transport Insurance – Imports, Corporate Travel Insurance and Personal Insurance. Below, a summarized breakdown of main insurance policies considered by Management:
36. SEGMENT REPORTING Segment reporting is presented in relation to the business of the Company, identified based on its management structure and internal management information. The Company's Management considers the following segments: power distribution, power generation, power trading and others (including the holding company). The eliminations comprise intersegment balances and transactions. The Company is segmented according to its operation, which has different risks and compensation. No client accounts for more than 10% of the Company’s revenue or receivables, and the Company operates only in Brazil.
From To
Directors & Officers (D&O) 08.10.2016 08.10.2017 40,350 136
Civil and general liabilities 10.31.2016 10.31.2017 20,000 910
Operating risks (a) 10.31.2016 10.31.2017 6,847,100 3,531
(a) Total Value in Risk of R$6,847,100
(a) Maximum limit of liability (LMR) is R$300,000 - Indemnity
TermAmount Insured
Gross Premium (including
cost of insurance policy +
IOF)
RISKS

vs vsvsvsvs
119
Segment information for the years ended December 31, 2016 and 2015 are presented below:
Income segment reporting:
Distribution Generation Services Trading Other EliminationsConsolidated
12.31.2016
Assets:
Current assets 3,276,435 202,356 59,164 128,534 15,992 (70,004) 3,612,477
Other non-current assets 4,567,019 137,211 89,550 2,727 1,880 (120,000) 4,678,387
Investments 24,323 305,746 - - 3,348,880 (3,014,509) 664,440
Property, plant and equipment 248,497 1,298,057 58,334 356 33,197 - 1,638,441
Intangible assets 3,725,571 5,644 1,720 63 3,486 - 3,736,484
TOTAL ASSETS 11,841,845 1,949,014 208,768 131,680 3,403,435 (3,204,513) 14,330,229
Liabilities and shareholders' equity:
Current liabilities 3,848,496 945,950 26,155 112,549 8,259 (70,004) 4,871,405
Non-current liabilities 5,507,323 673,360 41,037 - 3,308 (120,000) 6,105,028
Shareholders’ equity 2,486,026 329,704 141,576 19,131 3,391,868 (3,014,509) 3,353,796
TOTAL LIABILITIES AND SHAREHOLDERS' EQUITY 11,841,845 1,949,014 208,768 131,680 3,403,435 (3,204,513) 14,330,229
Distribution Generation Services Trading Other EliminationsConsolidated
12.31.2015
Assets:
Current assets 3,419,128 398,175 80,692 97,560 100,399 (119,718) 3,976,236
Other non-current assets 4,234,131 95,700 68,790 2,054 6,026 - 4,406,701
Investments 19,264 492,297 - - 3,628,750 (3,390,666) 749,645
Property, plant and equipment 269,331 1,317,658 92,654 350 29,640 - 1,709,633
Intangible assets 4,054,457 2,821 1,613 63 251 - 4,059,205
TOTAL ASSETS 11,996,311 2,306,651 243,749 100,027 3,765,066 (3,510,384) 14,901,420
Liabilities and shareholders' equity:
Current liabilities 3,614,557 666,353 90,396 86,450 61,333 (119,718) 4,399,371
Non-current liabilities 5,832,319 949,307 53,279 3 2,078 - 6,836,986
Shareholders’ equity 2,549,435 690,991 100,074 13,574 3,701,655 (3,390,666) 3,665,063
TOTAL LIABILITIES AND SHAREHOLDERS' EQUITY 11,996,311 2,306,651 243,749 100,027 3,765,066 (3,510,384) 14,901,420
2016 Distribution Generation Services Trading Other EliminationsConsolidated
2016
NET REVENUE 8,657,674 627,738 59,852 951,405 6,010 (657,442) 9,645,237
OPERATING COSTS AND EXPENSES (8,269,719) (234,369) (102,852) (824,874) (19,897) 657,442 (8,794,269)
Equity in the earnings (losses) of subsidiaries - (332,755) - - (306,600) 302,926 (336,429)
FINANCIAL RESULT (664,515) (152,557) 15,141 3,616 801 - (797,514)
Financial income 104,154 27,664 21,818 4,061 1,473 (11,637) 147,533
Financial expense (768,669) (180,221) (6,677) (445) (672) 11,637 (945,047)
EARNINGS BEFORE TAXES (276,560) (91,943) (27,859) 130,147 (319,686) 302,926 (282,975)
Social contribution 34,585 (21,946) 1,135 (11,769) (87) - 1,918
Income tax 57,150 (60,049) 3,153 (31,983) (151) - (31,880)
NET RESULT (184,825) (173,938) (23,571) 86,395 (319,924) 302,926 (312,937)

vs vsvsvsvs
120
37. TARIFF ADJUSTMENT On November 1, 2016, the Brazilian Electricity Regulatory Agency – Aneel, approved a tariff readjustment index for Light Serviços de Eletricidade S.A. with an average decrease of 12.25%, composed of two components: the structural component, of -1.24%, which will be integrated into the tariff and consist of non-manageable costs (Portion A) and manageable costs (Portion B); and the financial component, of -4.23%, exclusively applied to the next twelve months. Considering the removal of the financial component of 6.79% currently present in Light’s tariff, Light SESA’s consumers will observe an average increase of 12.25% in their electricity bills. The new tariffs will be applied as of November 7, 2016. 38. LONG-TERM CONTRACTS a) Electric power sale agreements
On December 31, 2016, the Company had power sale commitments positioned in average MW, as shown in the chart below:
2015 Distribution Generation Services Trading Other Eliminations
Consolidated
2015
Restated
NET REVENUE 10,016,227 567,931 53,245 816,777 11,567 (553,074) 10,912,673
OPERATING COSTS AND EXPENSES (9,319,157) (253,607) (62,041) (702,571) (23,439) 553,074 (9,807,741)
Equity in the earnings (losses) of subsidiaries - (117,848) - - 43,085 (51,637) (126,400)
FINANCIAL RESULT (757,359) (112,704) 6,923 6,787 2,049 - (854,304)
Financial income 545,411 188,983 12,592 7,220 2,161 (8,776) 747,591
Financial expense (1,302,770) (301,687) (5,669) (433) (112) 8,776 (1,601,895)
EARNINGS BEFORE TAXES (60,289) 83,772 (1,873) 120,993 33,262 (51,637) 124,228
Social contribution 5,616 (18,404) 381 (11,040) (189) - (23,636)
Income tax 15,515 (50,033) 1,056 (29,065) (229) - (62,756)
NET RESULT (39,158) 15,335 (436) 80,888 32,844 (51,637) 37,836
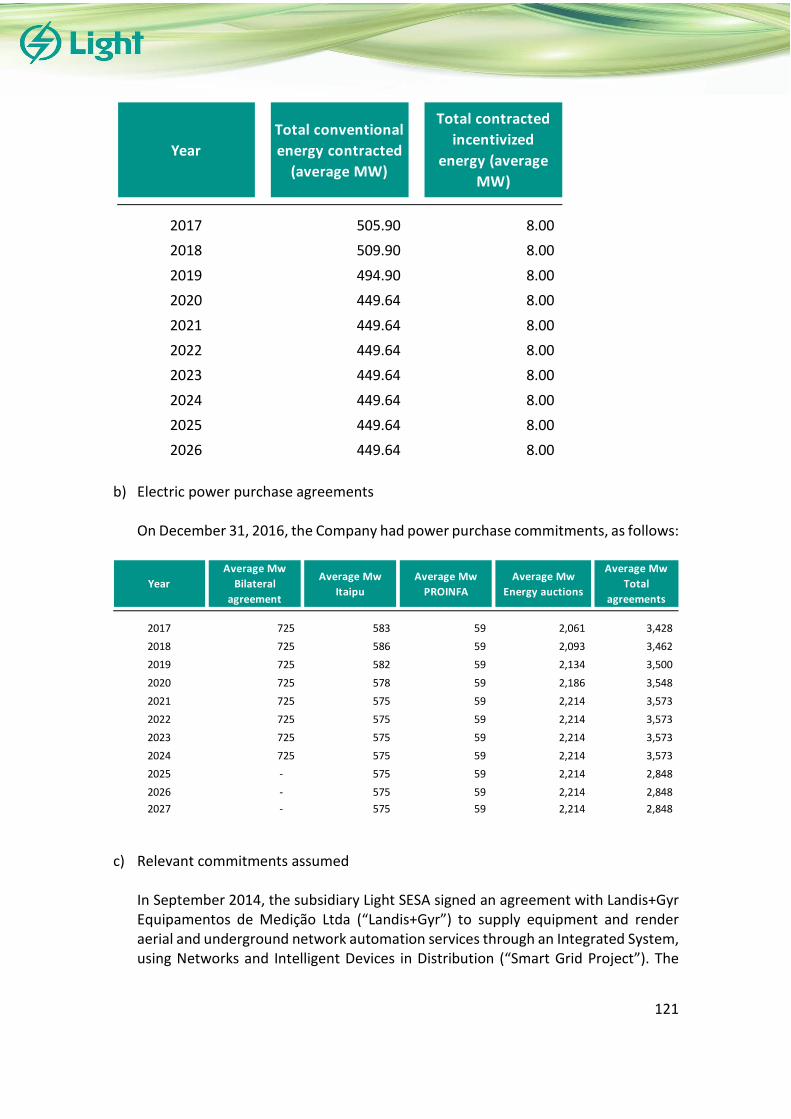
vs vsvsvsvs
121
b) Electric power purchase agreements
On December 31, 2016, the Company had power purchase commitments, as follows:
c) Relevant commitments assumed
In September 2014, the subsidiary Light SESA signed an agreement with Landis+Gyr Equipamentos de Medição Ltda (“Landis+Gyr”) to supply equipment and render aerial and underground network automation services through an Integrated System, using Networks and Intelligent Devices in Distribution (“Smart Grid Project”). The
Year
Total conventional
energy contracted
(average MW)
Total contracted
incentivized
energy (average
MW)
2017 505.90 8.00
2018 509.90 8.00
2019 494.90 8.00
2020 449.64 8.00
2021 449.64 8.00
2022 449.64 8.00
2023 449.64 8.00
2024 449.64 8.00
2025 449.64 8.00
2026 449.64 8.00
Year
Average Mw
Bilateral
agreement
Average Mw
Itaipu
Average Mw
PROINFA
Average Mw
Energy auctions
Average Mw
Total
agreements
2017 725 583 59 2,061 3,428
2018 725 586 59 2,093 3,462
2019 725 582 59 2,134 3,500
2020 725 578 59 2,186 3,548
2021 725 575 59 2,214 3,573
2022 725 575 59 2,214 3,573
2023 725 575 59 2,214 3,573
2024 725 575 59 2,214 3,573
2025 - 575 59 2,214 2,848
2026 - 575 59 2,214 2,848
2027 - 575 59 2,214 2,848

vs vsvsvsvs
122
agreement provides for the supply of approximately one million meters for five years, for the total amount of R$750,000, R$433,657 of which are still to be incurred.
39. NON-CASH TRANSACTIONS In the years ended December 31, 2016 and 2015, the Company carried out the following non-cash investment and financing activities which are, therefore, not reflected in the statements of cash flows:
40. SUBSEQUENT EVENTS a) Capital increase in the Jointly controlled entity Guanhães Energia S.A.
In the first quarter of 2017, the subsidiary Light Energia made a contribution of R$74,970 to the Jointly controlled entity Guanhães Energia, mainly to fully settle the promissory notes held by Guanhães Energia and to settle project expenses. b) Agreement to sell wind farms between the Jointly controlled entity Renova Energia
and AES Tietê Energia S.A.
On January 12, 2017, the Jointly controlled entity Renova Energia entered into an agreement with AES Tietê Energia to sell the group of wind farms comprising the Alto Sertão II complex (“Alto Sertão II”), which has an installed capacity of 386 MW. The base price of the transaction totals R$650,000 and it involves the acquisition of shares of Renova Eólica Participações S.A. or Nova Energia Holding S.A., which control the fifteen special-purpose entities (“SPEs”) comprising Alto Sertão II. The price will be subject to change if certain conditions of the transaction are fulfilled. c) Capital increase in the Jointly controlled entity Amazônia Energia Participações S.A. On January 31 and February 24, 2017, the Company made capital transfers of R$7,349 and R$3,363, respectively, to the Jointly controlled entity Amazônia Energia.
2016 2015
Capitalized financial charges (property, plant and equipment and intangible assets) 36,475 34,822
Acquisition of intangible assets against suppliers 70,577 23,349
Construction revenue (Statement of Value Added) 931,804 993,029
Consolidated
vs vsvsvsvs
123
d) Approval by Aneel of the result of the 4th Periodic Tariff Review (RTP) of the subsidiary Light SESA
On March 14, 2017, Aneel approved the result of the 4th Periodic Tariff Review (RTP) of the subsidiary Light SESA. The 4th RTP, previously scheduled for November 7, 2018, was moved to March 15, 2017, through the fifth amendment to its concession agreement, approved by the seventh Public Meeting of Aneel’s Board on March 7, 2017, pursuant to Aneel Order No. 2,194 of August 16, 2016. As a result of the amendment, the ordinary tariff processes of the subsidiary Light SESA will take place on March 15 of each year, and the next RTP is scheduled to occur on March 15, 2022. Light SESA’s concession term will still end on June 4, 2026. The items associated with the distribution service were recalculated and the regulatory loss and technical loss percentages were redefined, currently representing 36.06% of the low-voltage market and 6.34% of the Regulatory Grid Load, respectively (these figures previously stood at 30.11% and 5.35%, respectively). The subsidiary Light SESA’s new tariffs also reflect an adjustment to Portion A items, associated with energy acquisition, sectorial charges and transmission costs, as well as to financial components. This process caused an average increase of 10.45% in Light SESA’s electricity bills as of March 15, 2017. The items associated with Unrecoverable Revenues and Portion B (Distribution), associated with Light SESA’s manageable costs, accounted for 2.81% of the total average effect. e) Loan rollover with Santander
On February 1, 2017, the rollover of the subsidiary Light SESA’s debt with Santander in the amount of R$120,000 was carried out through a Bank Credit Note. The debt matures on August 1, 2018 and bears an interest rate of CDI + 4.5% p.a.
f) Loan rollover with Citibank
On February 3, 2017, the rollover of the subsidiaries Light SESA’s and Light Energia’s debt with Citibank was carried out through a swap monetization. Light SESA’s rollover, totaling R$631,000, matures on November 1, 2019, and Light Energia’s rollover, totaling R$220,850, matures on May 1, 2018. Both operations were carried out through operation 4131 with swap at the cost of CDI + 3.5% p.a. g) Issue of the subsidiary Light Energia’s 2nd Promissory Note On February 6, 2017, the subsidiary Light Energia issued its 2nd Promissory Note in the amount of R$60,000, of which R$24,700 with Banco Itaú, R$20,000 with Banco BBM and R$15,300 with Banco ABC. The operation matures on July 31, 2018 and bears an interest rate of CDI + 4.5% p.a.
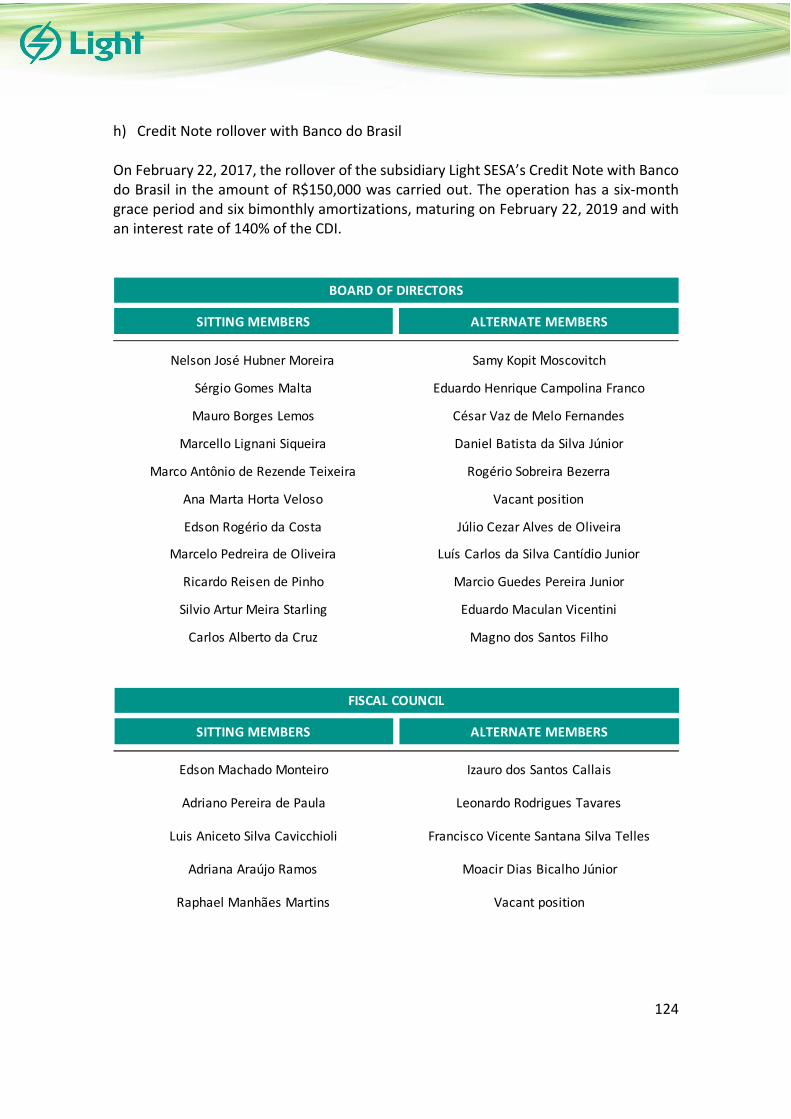
vs vsvsvsvs
124
h) Credit Note rollover with Banco do Brasil
On February 22, 2017, the rollover of the subsidiary Light SESA’s Credit Note with Banco do Brasil in the amount of R$150,000 was carried out. The operation has a six-month grace period and six bimonthly amortizations, maturing on February 22, 2019 and with an interest rate of 140% of the CDI.
SITTING MEMBERS ALTERNATE MEMBERS
Nelson José Hubner Moreira Samy Kopit Moscovitch
Sérgio Gomes Malta Eduardo Henrique Campolina Franco
Mauro Borges Lemos César Vaz de Melo Fernandes
Marcello Lignani Siqueira Daniel Batista da Silva Júnior
Marco Antônio de Rezende Teixeira Rogério Sobreira Bezerra
Ana Marta Horta Veloso Vacant position
Edson Rogério da Costa Júlio Cezar Alves de Oliveira
Marcelo Pedreira de Oliveira Luís Carlos da Silva Cantídio Junior
Ricardo Reisen de Pinho Marcio Guedes Pereira Junior
Silvio Artur Meira Starling Eduardo Maculan Vicentini
Carlos Alberto da Cruz Magno dos Santos Filho
BOARD OF DIRECTORS
SITTING MEMBERS ALTERNATE MEMBERS
Edson Machado Monteiro Izauro dos Santos Callais
Adriano Pereira de Paula Leonardo Rodrigues Tavares
Luis Aniceto Silva Cavicchioli Francisco Vicente Santana Silva Telles
Adriana Araújo Ramos Moacir Dias Bicalho Júnior
Raphael Manhães Martins Vacant position
FISCAL COUNCIL

vs vsvsvsvs
125
BOARD OF EXECUTIVE OFFICERS
Ana Marta Horta Veloso
Chief Executive Officer and Interim Chief Business Development and
Investor Relations Officer
Cláudio Bernardo Guimarães de Moraes
Chief Financial Officer
Jaconias de Aguiar
Human Resources and Corporate Management Officer
Wilson Couto Oliveira
Commercial Officer
Fernando Antônio Fagundes Reis
Legal Officer
Luis Fernando de Almeida Guimarães
Energy Officer
Ronald Cavalcante de Freitas
Communications Officer
Dalmer Alves de Souza
Engineering Officer
Roberto Caixeta Barroso Simone da Silva Cerutti de Azevedo
Controllership Superintendent Accountant - Accounting Manager
CPF 013.011.556-83 CPF 094.894.347-52
CRC-MG 078086/O-8 CRC-RJ 103826/O-9
CONTROLLERSHIP SUPERINTENDENCE

“Deloitte” refers to one or more of Deloitte Touche Tohmatsu Limited, a UK private company limited by guarantee (“DTTL”), its network of member firms, and their related entities. DTTL and each DTTL member firm are legally separate and independent entities. DTTL (also referred to as “Deloitte Global”) does not provide services to clients. Please see www.deloitte.com/about for a more detailed description of DTTL and its member firms. Deloitte provides audit, consulting, financial advisory, risk management, and tax services to public and private clients spanning multiple industries. Deloitte serves four of each five organizations listed in Fortune Global 500®, through a globally connected network of member firms in more than 150 countries, bringing world-class capabilities and high-quality and service to clients, delivering the insights they need to address their most complex business challenges. To know more about the approximately 225,000 Deloitte professionals have positively impacted to our clients, connect to us via Facebook, LinkedIn, and Twitter © 2017 Deloitte Touche Tohmatsu Limited.
Deloitte Touche Tohmatsu Rua São Bento, 18 - 15º e 16º andares 20090-010 - Rio de Janeiro - RJ Brasil Tel: + 55 (21) 3981-0500 Fax: + 55 (21) 3981-0600 www.deloitte.com.br
(Convenience Translation into English from the Original Previously Issued in Portuguese)
INDEPENDENT AUDITOR’S REPORT
To the Shareholders, Board of Directors and Management of Light S.A. Rio de Janeiro, RJ
Opinion
We have audited the accompanying individual and consolidated financial statements of Light S.A. (“Company”), identified as Parent and Consolidated, respectively, which comprise the balance sheet as at December 31, 2016, and the income statement, statement of comprehensive income (loss), statement of changes in equity and statement of cash flows for the year then ended, and notes to the financial statements, including a summary of significant accounting policies.
In our opinion, the individual and consolidated financial statements present fairly, in all material respects, the financial position of Light S.A. as at December 31, 2016, and its financial performance and its cash flows for the year then ended in accordance with accounting practices adopted in Brazil and International Financial Reporting Standards (“IFRSs”) issued by the International Accounting Standards Board (“IASB”).
Basis for Opinion
We conducted our audit in accordance with Brazilian and International Standards on Auditing. Our responsibilities under those standards are further described in the Auditor’s
Responsibilities for the Audit of the Individual and Consolidated Financial Statements section of our report. We are independent of the Company and its subsidiaries in accordance with the relevant ethical requirements in the Code of Ethics for Professional Accountants and the professional standards issued by the Federal Accounting Council (“CFC”), and we have fulfilled our other ethical responsibilities in accordance with these requirements. We believe that the audit evidence we have obtained is sufficient and appropriate to provide a basis for our audit opinion.
Emphases of Matter
Law- and regulation-related risks
We draw attention to notes 2 and 12, which states that the Company has an indirect investment in Norte Energia S.A. in the amount of R$267,330 thousand as at December 31, 2016 (R$169,886 thousand as at December 31, 2015) and share of loss of subsidiaries in the amount of R$2,473 thousand in the year ended December 31, 2016, (share of loss of subsidiaries in the amount of R$981 thousand in the year ended December 31, 2015). The General Attorneys’ Office is conducting investigations and applying other legal measures, involving other shareholders of Norte Energia S.A. and certain executive officers of such other shareholders. Our opinion is not modified in respect of this matter.

© 2017 Deloitte Touche Tohmatsu. All rights reserved. 2
Significant uncertainty that may raise doubt as to the ability of indirect joint venture Renova
S.A. to continue as going concern.
Without modifying our opinion, as described in Notes 2 (Group entities) and 12 (Investments) to the financial statements, as at December 31, 2016 and 2015, the indirect joint venture Renova Energia S.A. (Renova): (i) recognized excess of current liabilities over current assets in the consolidated amounts of R$3,211,041 thousand and R$946,376 thousand, respectively; and (ii) presented the need to raise funds to meet the commitments relating to the construction of wind and solar power farms. These conditions indicate the existence of significant uncertainty that may raise significant doubts as to Renova’s and its subsidiaries’ ability to continue as going concern.
Restatement of the corresponding figures for the year ended December 31, 2015
As referred to in Note 3 to the financial statements, as a result of the reclassifications described in said Note, the corresponding figures in the consolidated income (loss) statements for the year then ended, presented for purposes of comparison, were adjusted and are being restated as provided for by CPC 23 - and IAS 8 - Accounting Policies, Changes in Accounting Estimates and Errors, and CPC 26 (R1) and IAS 1 - Presentation of Financial Statements . Our opinion is not modified in respect of this matter.
Key Audit Matters
Key audit matters are those matters that, in our professional judgment, were of most significance in our audit of the financial statements of the current period. These matters were addressed in the context of our audit of the individual and consolidated financial statements as a whole, and in forming our opinion thereon, and we do not provide a separate opinion on these matters. We established that the matters described below are the key audit matters to be communicated in our report.
Revenue recognition - electric power supply
As referred to in Note 28 to the financial statements, the billing of electric power sold that comprises the revenue of direct subsidiary Light Serviços de Eletricidade S.A. is complex because of the volume and dilution of the billings and different tariffs and types of customers, which results in a high dependence on information systems to ensure that all consumers are included.
In addition, the measurement of revenue should be in accordance with the established criteria, ratified by the regulatory agency, mainly as regards the consumer class and tariffs prevailing in the year of supply. At the end of the billing process, its accounting appropriateness depends on the appropriate integration between the billing and accounting systems.
To address the significant risks that involve mainly revenue measurement and recognition, we performed the following audit procedures, among others: assess the design, implementation, and effectiveness of the relevant internal control over billing and revenue; involve our IT specialists to reprocess the revenue sample, taking into account consumer classes and tariffs; test revenue valuation by matching the amounts recognized by the entity with the consumption expectations generated based on our industry knowledge; test, on a sampling basis, balance accuracy and completeness by matching documentation with the individual consumption data from the sales department and the analysis of the tariffs charged against those actually authorized by the regulatory agency; and test the integrity between revenue and accounting systems.
Provision for risks and contingent liabilities
The Company and its subsidiaries are parties to a high number of lawsuits and tax, civil, labor, and regulatory claims, the outcomes of which do not fully depend on the Company and its subsidiaries (Notes 19 and 20). As a result, the Company and its joint ventures, together with

© 2017 Deloitte Touche Tohmatsu. All rights reserved. 3
their legal counsel, need to exercise significant judgment in assessing the risks involved about the forecasts and the amounts at risk for each ongoing lawsuit or administrative proceeding. Mainly in light of the foregoing, the outcome forecasts for part of these lawsuits may not be assessed by the legal counsel on a timely basis so that they are reported in due course to the Company’s legal department and, consequently, recognized in the proper period. Additionally, the information from each attorney needs to be analyzed, consolidated, and integrated with accounting.
To address the significant risks related to the provision for risks and contingent liabilities, we performed the following audit procedures, among others: assess the design, implementation, and effectiveness of the relevant internal control over the contingency cycle; send requests for independent confirmation to the outside legal counsel in charge of the ongoing lawsuits and/or claims and check the consistency of their replies against Company controls, and conduct a qualitative analysis of such replies; hold discussions with Management and its legal counsel on the assumptions adopted to define the forecasts of loss for the material proceedings; analyze the independent legal opinion obtained by the Company for the lawsuits whose outcome forecasts involved significant level of judgment; and review the information included in the disclosure of contingent liabilities in the notes to the financial statements.
Realization of deferred taxes
As disclosed in Note 8 to the financial statements, direct subsidiary Light Serviços de Eletricidade S.A. records substantial amounts of deferred tax assets arising on tax loss carryforwards and temporary differences. The review of these amounts’ recognition requires significant Management judgment and estimates since it requires Management to make projections, based on subjective assumptions, and the generation of future taxable income and the recognition of deferred tax liabilities to realize such credits.
Our audit procedures to address the significant risk related to the realization of deferred tax credit included, among others: assess the design, implementation, and effectiveness of the relevant internal control over the recognition and monitoring of deferred tax credits; involve our valuation specialists to review the key assumptions and the methodology used by Management to make the recoverability projections of deferred tax credits, such as the future taxable income projections; and analyze the profit for the year ended December 31, 2016 as compared to Company approved projections.
Changes in accounting policies in the year ended December 31, 2016
As referred to in Note 3 to the financial statements and emphasis of matter section on the restatement of the corresponding figures in the year ended December 31, 2015, direct subsidiary Light Serviços de Eletricidade S.A. reassessed some accounting policies adopted and made some changes in accounting policies as at December 31, 2016 and reclassifications as required by CPC 23 – Accounting Policies, Changes in Accounting Estimates and Errors. Direct subsidiary Light Serviços de Eletricidade S.A. changed the fair value classification of the indemnifiable concession asset and the income from fines charged on customers’ late payments, which were previously classified as finance income to net revenue and other operating income, respectively.

© 2017 Deloitte Touche Tohmatsu. All rights reserved. 4
Our audit procedures related to changes in accounting policies made by direct subsidiary Light Serviços de Eletricidade S.A. included, among others: assess the changes in light of the relevant CPCs and IFRSs in order to verify that the changes made by the Company were in fact acceptable by making a formal consultation to our specialists in accounting and professional standards; we challenged the technical arguments used by Management to define the new accounting policies by checking if, from a Company's standpoint, the change would reflect more reliably its operational performance and financial disclosures; we checked the new formal accounting policy and the related required approvals from those charged of governance of direct subsidiary Light Serviços de Eletricidade S.A.; we obtained an understanding and checked the reclassifications and their impacts on the income (loss) statement and the statement of value added, as well as the impacts on prior years; and we assessed the appropriateness of the required disclosure in notes to the financial statements.
Other Matters
Statements of value added
The individual and consolidated statements of value added (“DVA”) for the year ended December 31, 2016, prepared under the responsibility of the Company’s management and disclosed as supplemental information for purposes of the IFRSs, were subject to audit procedures performed together with the audit of the Company’s individual and consolidated financial statements. In forming our opinion, we assess whether these statements are reconciled with the individual and consolidated financial statements and accounting records, as applicable, and whether their form and content are in accordance with the criteria set out in technical pronouncement CPC 09 - Statement of Value Added. In our opinion, these statements of value added are appropriately prepared, in all material respects, in accordance with the criteria set out in such technical pronouncement and are consistent in relation to the individual and consolidated financial statements taken as a whole.
Other Information Accompanying the Individual and Consolidated Financial
Statements and the Independent Auditor’s Report
Management is responsible for the other information. The other information comprises the Management Report and the Social Report.
Our opinion on the individual and consolidated financial statements does not cover the Management Report and the Social Report and we do not express any form of audit conclusion thereon.
In connection with our audit of the individual and consolidated financial statements, our responsibility is to read the Management Report and the Social Report and, in doing so, consider whether these reports are materially inconsistent with the financial statements or our knowledge obtained in the audit, or otherwise appears to be materially misstated. If, based on the work we have performed, we conclude that there is a material misstatement of the Management Report and Social Report, we are required to report that fact. We have nothing to report in this regard.
Responsibilities of Management and Those Charged with Governance for the
Individual and Consolidated Financial Statements
Management is responsible for the preparation and fair presentation of the individual and consolidated financial statements in accordance with accounting practices adopted in Brazil and the International Financial Reporting Standards (“IFRSs”), issued by the International Accounting Standards Board (“IASB”), and for such internal control as management determines is necessary to enable the preparation of financial statements that are free from material misstatement, whether due to fraud or error.

© 2017 Deloitte Touche Tohmatsu. All rights reserved. 5
In preparing the individual and consolidated financial statements, Management is responsible for assessing the Company’s ability to continue as a going concern, disclosing, as applicable, matters related to going concern and using the going concern basis of accounting unless Management either intends to liquidate the Company and its subsidiaries or to cease operations, or has no realistic alternative but to do so.
Those charged with governance are responsible for overseeing the Company’s and its subsidiaries’ financial reporting process.
Auditor’s Responsibilities for the Audit of the Individual and Consolidated Financial
Statements
Our objectives are to obtain reasonable assurance about whether the individual and consolidated financial statements as a whole are free from material misstatement, whether due to fraud or error, and to issue an auditor’s report that includes our opinion. Reasonable assurance is a high level of assurance, but is not a guarantee that an audit conducted in accordance with Brazilian and International Standards on Auditing will always detect a material misstatement when it exists. Misstatements can arise from fraud or error and are considered material if, individually or in the aggregate, they could reasonably be expected to influence the economic decisions of users taken on the basis of these financial statements.
As part of an audit in accordance with Brazilian and International Standards on Auditing, we exercise professional judgment and maintain professional skepticism throughout the audit. We also:
• Identify and assess the risks of material misstatement of the individual and consolidated financial statements, whether due to fraud or error, design and perform audit procedures responsive to those risks, and obtain audit evidence that is sufficient and appropriate to provide a basis for our opinion. The risk of not detecting a material misstatement resulting from fraud is higher than for one resulting from error, as fraud may involve collusion, forgery, intentional omissions, misrepresentations, or the override of internal control.
• Obtain an understanding of internal control relevant to the audit in order to design audit procedures that are appropriate in the circumstances, but not for the purpose of expressing an opinion on the effectiveness of the Company’s internal control.
• Evaluate the appropriateness of accounting policies used and the reasonableness of accounting estimates and related disclosures made by Management.
• Conclude on the appropriateness of Management’s use of the going concern basis of accounting and based on the audit evidence obtained, whether a material uncertainty exists related to events or conditions that may cast significant doubt on the Company’s ability to continue as a going concern. If we conclude that a material uncertainty exists, we are required to draw attention in our auditor’s report to the related disclosures in the individual and consolidated financial statements or, if such disclosures are inadequate, to modify our opinion. Our conclusions are based on the audit evidence obtained up to the date of our auditor’s report. However, future events or conditions may cause the Company to cease to continue as a going concern.
• Evaluate the overall presentation, structure and content of the financial statements, including the disclosures, and whether the individual and consolidated financial statements represent the underlying transactions and events in a manner that achieves fair presentation.
• Obtain sufficient appropriate audit evidence regarding the financial information of the entities or business activities within the Group to express an opinion on the consolidated financial statements. We are responsible for the direction, supervision and performance of the group audit. We remain solely responsible for our audit opinion.
© 2017 Deloitte Touche Tohmatsu. All rights reserved. 6
2017-RJO-0148.docx
We communicate with those charged with governance regarding, among other matters, the planned scope and timing of the audit and significant audit findings, including any significant deficiencies in internal control that we identify during our audit.
We also provide those charged with governance with a statement that we have complied with relevant ethical requirements regarding independence, and to communicate with them all relationships and other matters that may reasonably be thought to impair on our independence, and where applicable, related safeguards.
From the matters communicated with those charged with governance, we determine those matters that were of most significance in the audit of the individual and consolidated financial statements of the current period and are therefore the key audit matters. We describe these matters in our auditor’s report unless law or regulation precludes public disclosure about the matter or when, in extremely rare circumstances, we determine that a matter should not be communicated in our report because the adverse consequences of doing so would reasonably be expected to outweigh the public interest benefits of such communication.
Convenience translation
The accompanying individual and consolidated financial statements have been translated into English for the convenience of readers outside Brazil. Rio de Janeiro, March 23, 2017
DELOITTE TOUCHE TOHMATSU John Alexander Harold Auton Auditores Independentes Engagement Partner