Embed Size (px)
Citation preview
This document is available from www.hse.gov.uk/statistics/ Page 1 of 22
Health and Safety Executive
Mesothelioma Mortality by Geographical Area
Mesothelioma mortality in Great Britain 1981-2015
Contents
Summary 2
Introduction 3
Results and Discussion 4
Results for the overall period 1981-2015 4
Temporal trends – Scotland, Wales and English regions 9
Temporal trends for UA and LA areas, males 11
Temporal trends for UA and LA areas, females 14
Annex 1 – Methodology 17
SMR calculation – worked example 17
Annex 2 – Unitary Authorities created in 2009 18
Annex 3 – Other areas with significantly raised male SMRs 19
Relevant scientific publications on mesothelioma 21
This document is available from www.hse.gov.uk/statistics/ Page 2 of 22
Summary This fact sheet provides statistics on mesothelioma deaths in Great Britain by geographical area for deaths
occurring in the period 1981 to 2015. Numbers of deaths for males and females are given for areas within
the current local government structure down to Unitary Authority (UA) and Local Authority (LA) level.
Standardised Mortality Ratios (SMRs) are also provided with associated 95% Confidence Intervals in order
to allow comparison of areas after taking into account the age distributions of the underlying populations.
The statistics are presented in tabular form in the following spreadsheet:
www.hse.gov.uk/statistics/tables/mesoarea.xlsx
MESOAREA01: Number of mesothelioma deaths and SMRs for males by geographical area in Great
Britain. MESOAREA02: Number of mesothelioma deaths and SMRs for females by geographical area in Great
Britain. MESOAREA03: Mesothelioma deaths and Standardised Mortality Ratios (SMRs) for males in Great
Britain by area and five year time periods 1981-2015. MESOAREA04: Mesothelioma deaths and Standardised Mortality Ratios (SMRs) for females in Great
Britain by area and five year time periods 1981-2015.
Results are also available as interactive maps available at: https://arcg.is/PLzSj.
This document is available from www.hse.gov.uk/statistics/ Page 3 of 22
Introduction Previous descriptive analyses of mesothelioma death rates for geographical areas within Great Britain have
highlighted the effect of geographically-specific sources of asbestos exposure: geographical areas with the
highest mortality rates tend to be those known to contain large industrial sites such as shipyards and
asbestos product factories.
This factsheet provides an update of analyses of mesothelioma mortality by Unitary Authority (UA) and Local
Authority (LA) area to include deaths occurring during the period 1981 to 2015, the longest period for which
data are available according to the current UA and LA structure. It also provides more detailed analysis of
temporal trends within these geographical areas using Generalised Additive Models (see Annex 1 for further
details).
The analyses are based on the last area of residence of the deceased, as recorded on death certificates,
and use Standardised Mortality Ratios (SMRs) which compare the mortality rate in a particular area with the
mortality rate for GB, taking account of age differences (see Annex 1 for further details). SMRs are
expressed as a percentage: values higher or lower than 100 indicate mesothelioma rates that are higher or
lower, respectively, than for GB as a whole.
A number of Unitary Authorities were created in 2009 and these are detailed in Annex 2. A detailed map
showing all current UAs and LAs can be found at:
www.arcgis.com/sharing/rest/content/items/f5e202d4bca34b1ea8c8fa1d54823fc2/data.
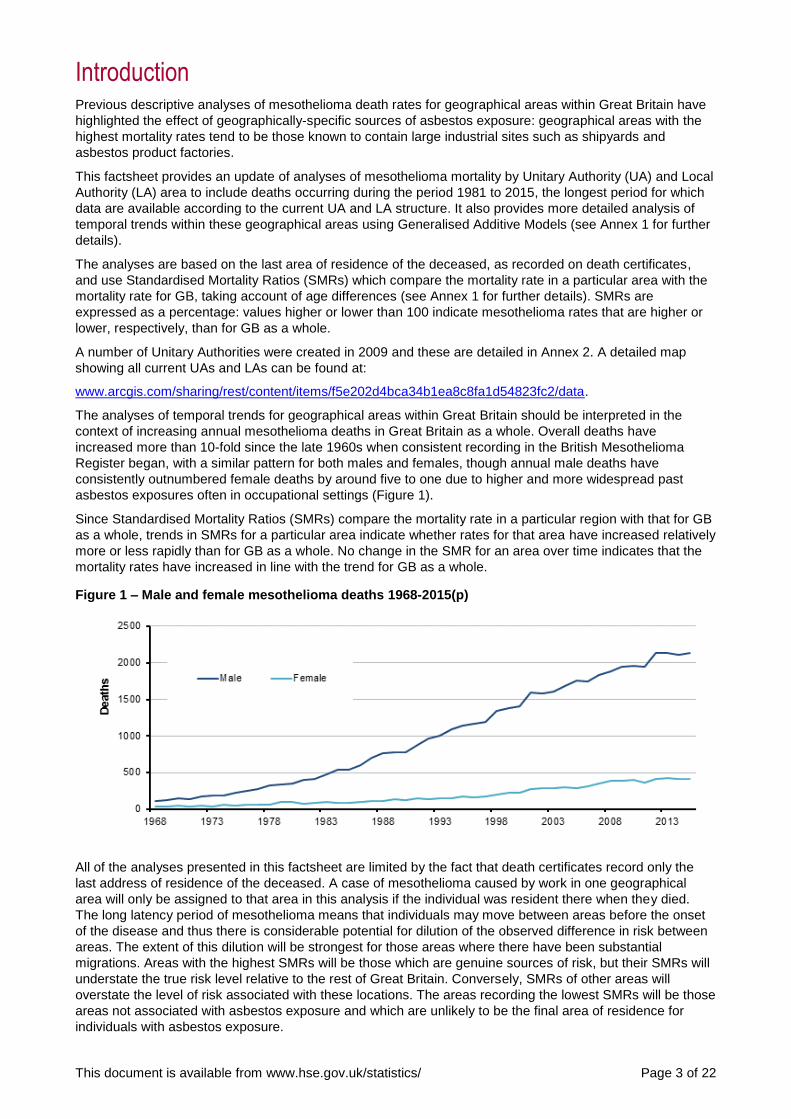
The analyses of temporal trends for geographical areas within Great Britain should be interpreted in the
context of increasing annual mesothelioma deaths in Great Britain as a whole. Overall deaths have
increased more than 10-fold since the late 1960s when consistent recording in the British Mesothelioma
Register began, with a similar pattern for both males and females, though annual male deaths have
consistently outnumbered female deaths by around five to one due to higher and more widespread past
asbestos exposures often in occupational settings (Figure 1).
Since Standardised Mortality Ratios (SMRs) compare the mortality rate in a particular region with that for GB
as a whole, trends in SMRs for a particular area indicate whether rates for that area have increased relatively
more or less rapidly than for GB as a whole. No change in the SMR for an area over time indicates that the
mortality rates have increased in line with the trend for GB as a whole.
Figure 1 – Male and female mesothelioma deaths 1968-2015(p)
All of the analyses presented in this factsheet are limited by the fact that death certificates record only the
last address of residence of the deceased. A case of mesothelioma caused by work in one geographical
area will only be assigned to that area in this analysis if the individual was resident there when they died.
The long latency period of mesothelioma means that individuals may move between areas before the onset
of the disease and thus there is considerable potential for dilution of the observed difference in risk between
areas. The extent of this dilution will be strongest for those areas where there have been substantial
migrations. Areas with the highest SMRs will be those which are genuine sources of risk, but their SMRs will
understate the true risk level relative to the rest of Great Britain. Conversely, SMRs of other areas will
overstate the level of risk associated with these locations. The areas recording the lowest SMRs will be those
areas not associated with asbestos exposure and which are unlikely to be the final area of residence for
individuals with asbestos exposure.
This document is available from www.hse.gov.uk/statistics/ Page 4 of 22
Results and Discussion
These analyses for the period 1981 to 2015 are based on 45,527 male and 8,054 female mesothelioma
deaths from mesothelioma (a small number of individuals with an overseas address are excluded).
Full results are available in Excel tables at:
www.hse.gov.uk/statistics/tables/mesoarea.xlsx
MESOAREA01: Number of mesothelioma deaths and SMRs for males by geographical area in Great
Britain. MESOAREA02: Number of mesothelioma deaths and SMRs for females by geographical area in Great
Britain MESOAREA03: Mesothelioma deaths and Standardised Mortality Ratios (SMRs) for males in Great
Britain by area and five year time periods 1981-2015 MESOAREA04: Mesothelioma deaths and Standardised Mortality Ratios (SMRs) for females in Great
Britain by area and five year time periods 1981-2015
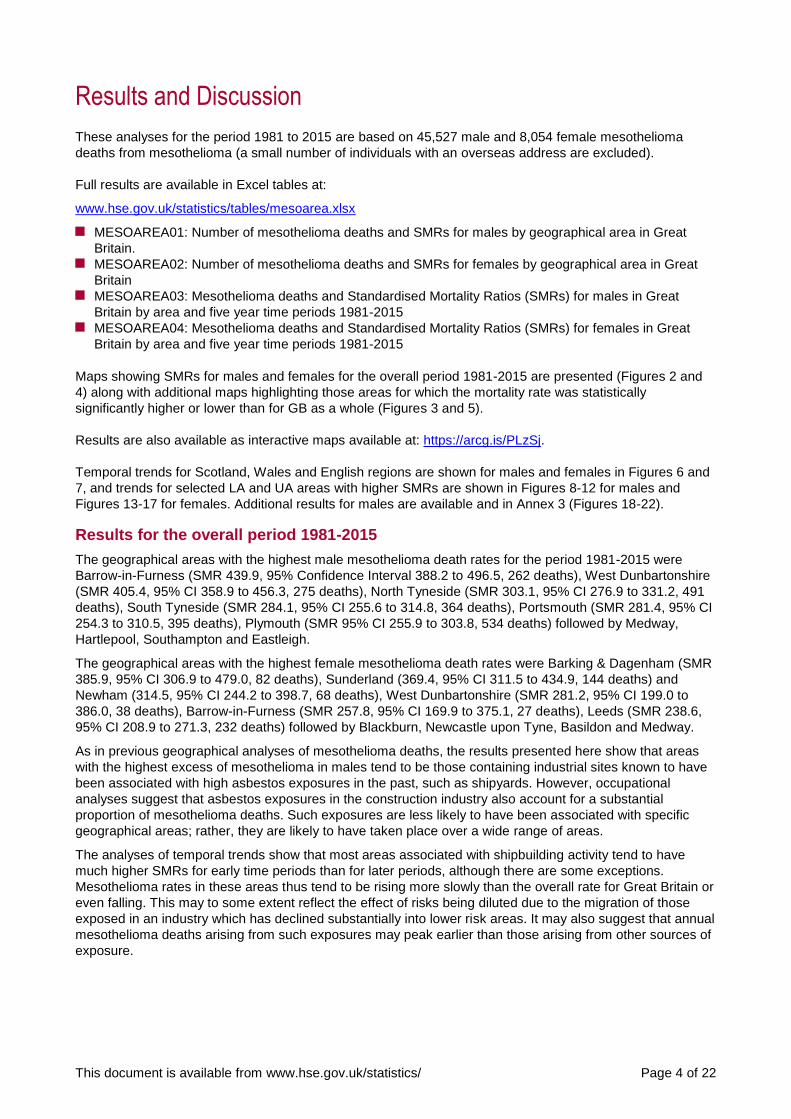
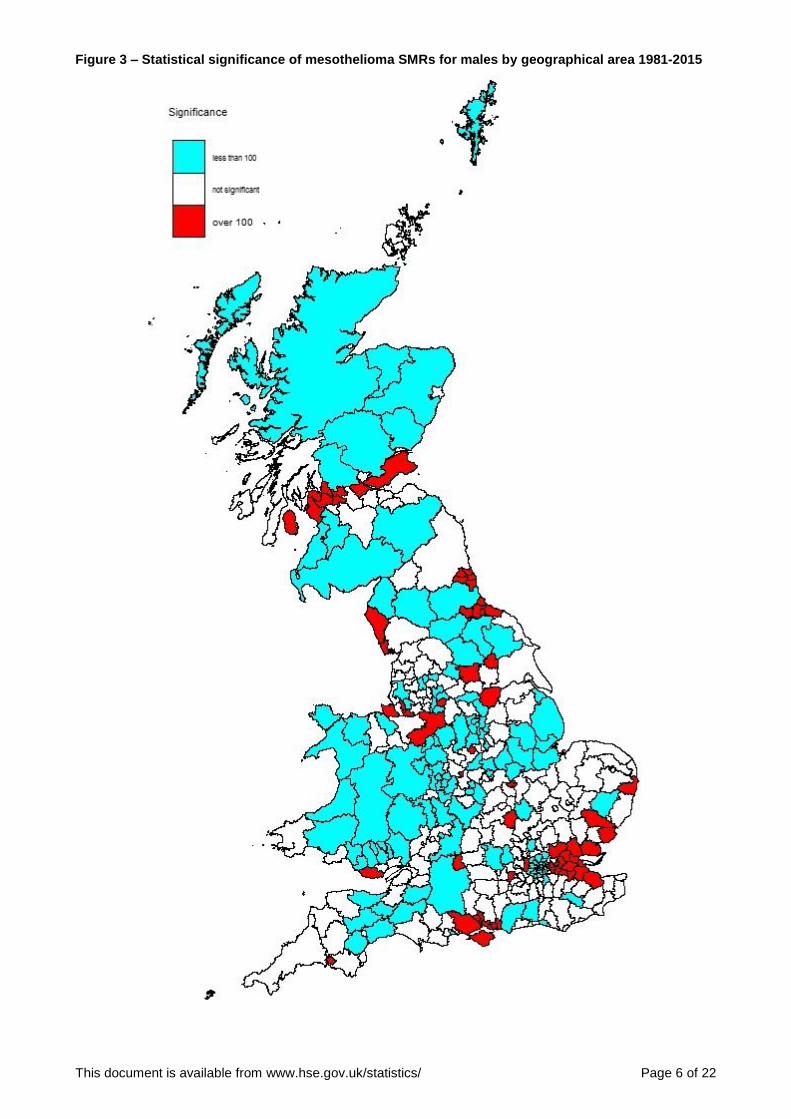
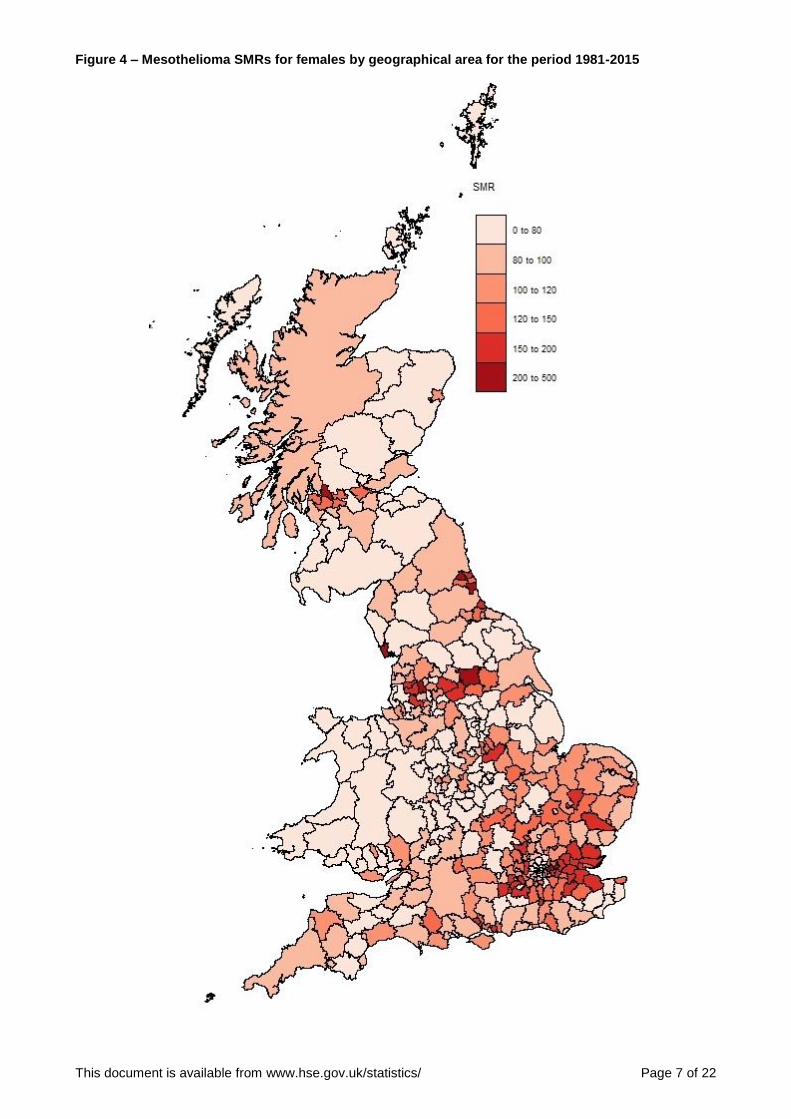
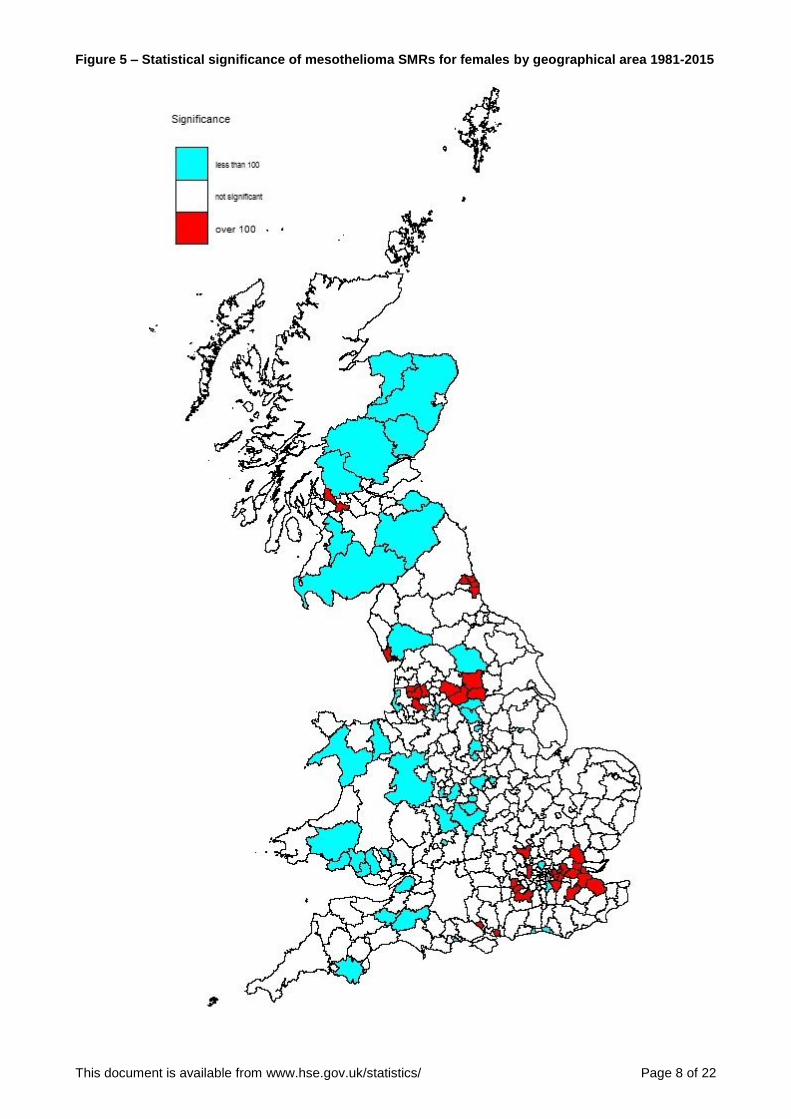
Maps showing SMRs for males and females for the overall period 1981-2015 are presented (Figures 2 and
4) along with additional maps highlighting those areas for which the mortality rate was statistically
significantly higher or lower than for GB as a whole (Figures 3 and 5).
Results are also available as interactive maps available at: https://arcg.is/PLzSj.
Temporal trends for Scotland, Wales and English regions are shown for males and females in Figures 6 and
7, and trends for selected LA and UA areas with higher SMRs are shown in Figures 8-12 for males and
Figures 13-17 for females. Additional results for males are available and in Annex 3 (Figures 18-22).
Results for the overall period 1981-2015
The geographical areas with the highest male mesothelioma death rates for the period 1981-2015 were
Barrow-in-Furness (SMR 439.9, 95% Confidence Interval 388.2 to 496.5, 262 deaths), West Dunbartonshire
(SMR 405.4, 95% CI 358.9 to 456.3, 275 deaths), North Tyneside (SMR 303.1, 95% CI 276.9 to 331.2, 491
deaths), South Tyneside (SMR 284.1, 95% CI 255.6 to 314.8, 364 deaths), Portsmouth (SMR 281.4, 95% CI
254.3 to 310.5, 395 deaths), Plymouth (SMR 95% CI 255.9 to 303.8, 534 deaths) followed by Medway,
Hartlepool, Southampton and Eastleigh.
The geographical areas with the highest female mesothelioma death rates were Barking & Dagenham (SMR
385.9, 95% CI 306.9 to 479.0, 82 deaths), Sunderland (369.4, 95% CI 311.5 to 434.9, 144 deaths) and
Newham (314.5, 95% CI 244.2 to 398.7, 68 deaths), West Dunbartonshire (SMR 281.2, 95% CI 199.0 to
386.0, 38 deaths), Barrow-in-Furness (SMR 257.8, 95% CI 169.9 to 375.1, 27 deaths), Leeds (SMR 238.6,
95% CI 208.9 to 271.3, 232 deaths) followed by Blackburn, Newcastle upon Tyne, Basildon and Medway.
As in previous geographical analyses of mesothelioma deaths, the results presented here show that areas
with the highest excess of mesothelioma in males tend to be those containing industrial sites known to have
been associated with high asbestos exposures in the past, such as shipyards. However, occupational
analyses suggest that asbestos exposures in the construction industry also account for a substantial
proportion of mesothelioma deaths. Such exposures are less likely to have been associated with specific
geographical areas; rather, they are likely to have taken place over a wide range of areas.
The analyses of temporal trends show that most areas associated with shipbuilding activity tend to have
much higher SMRs for early time periods than for later periods, although there are some exceptions.
Mesothelioma rates in these areas thus tend to be rising more slowly than the overall rate for Great Britain or
even falling. This may to some extent reflect the effect of risks being diluted due to the migration of those
exposed in an industry which has declined substantially into lower risk areas. It may also suggest that annual
mesothelioma deaths arising from such exposures may peak earlier than those arising from other sources of
exposure.
This document is available from www.hse.gov.uk/statistics/ Page 5 of 22
Figure 2 – Mesothelioma SMRs for males by geographical area for the period 1981-2015
This document is available from www.hse.gov.uk/statistics/ Page 6 of 22
Figure 3 – Statistical significance of mesothelioma SMRs for males by geographical area 1981-2015
This document is available from www.hse.gov.uk/statistics/ Page 7 of 22
Figure 4 – Mesothelioma SMRs for females by geographical area for the period 1981-2015
This document is available from www.hse.gov.uk/statistics/ Page 8 of 22
Figure 5 – Statistical significance of mesothelioma SMRs for females by geographical area 1981-2015
This document is available from www.hse.gov.uk/statistics/ Page 9 of 22
Temporal trends – Scotland, Wales and English regions
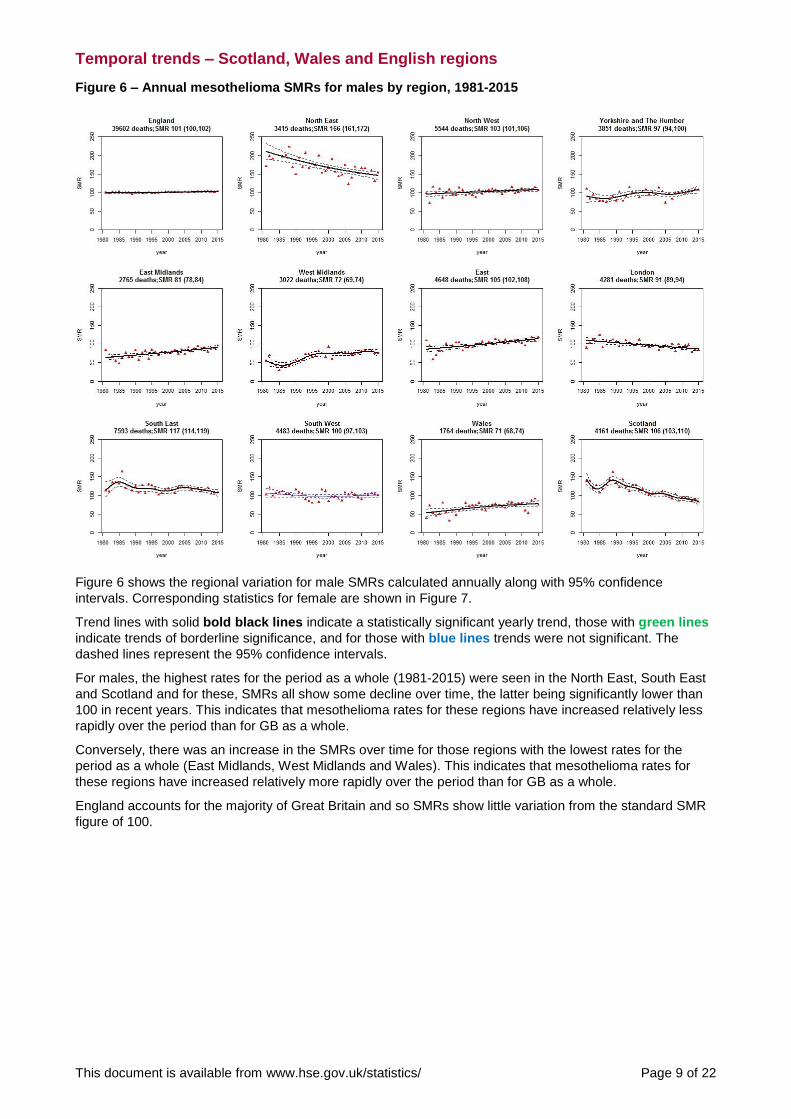
Figure 6 – Annual mesothelioma SMRs for males by region, 1981-2015
Figure 6 shows the regional variation for male SMRs calculated annually along with 95% confidence
intervals. Corresponding statistics for female are shown in Figure 7.
Trend lines with solid bold black lines indicate a statistically significant yearly trend, those with green lines
indicate trends of borderline significance, and for those with blue lines trends were not significant. The
dashed lines represent the 95% confidence intervals.
For males, the highest rates for the period as a whole (1981-2015) were seen in the North East, South East
and Scotland and for these, SMRs all show some decline over time, the latter being significantly lower than
100 in recent years. This indicates that mesothelioma rates for these regions have increased relatively less
rapidly over the period than for GB as a whole.
Conversely, there was an increase in the SMRs over time for those regions with the lowest rates for the
period as a whole (East Midlands, West Midlands and Wales). This indicates that mesothelioma rates for
these regions have increased relatively more rapidly over the period than for GB as a whole.
England accounts for the majority of Great Britain and so SMRs show little variation from the standard SMR
figure of 100.

This document is available from www.hse.gov.uk/statistics/ Page 10 of 22
Figure 7 – Annual mesothelioma SMRs for females by region, 1981-2015
For females, the highest rates for the period as a whole were in the North-East, East of England and London.
There was evidence of an increase in the SMR over time for the East of England and a decline for London.
This document is available from www.hse.gov.uk/statistics/ Page 11 of 22
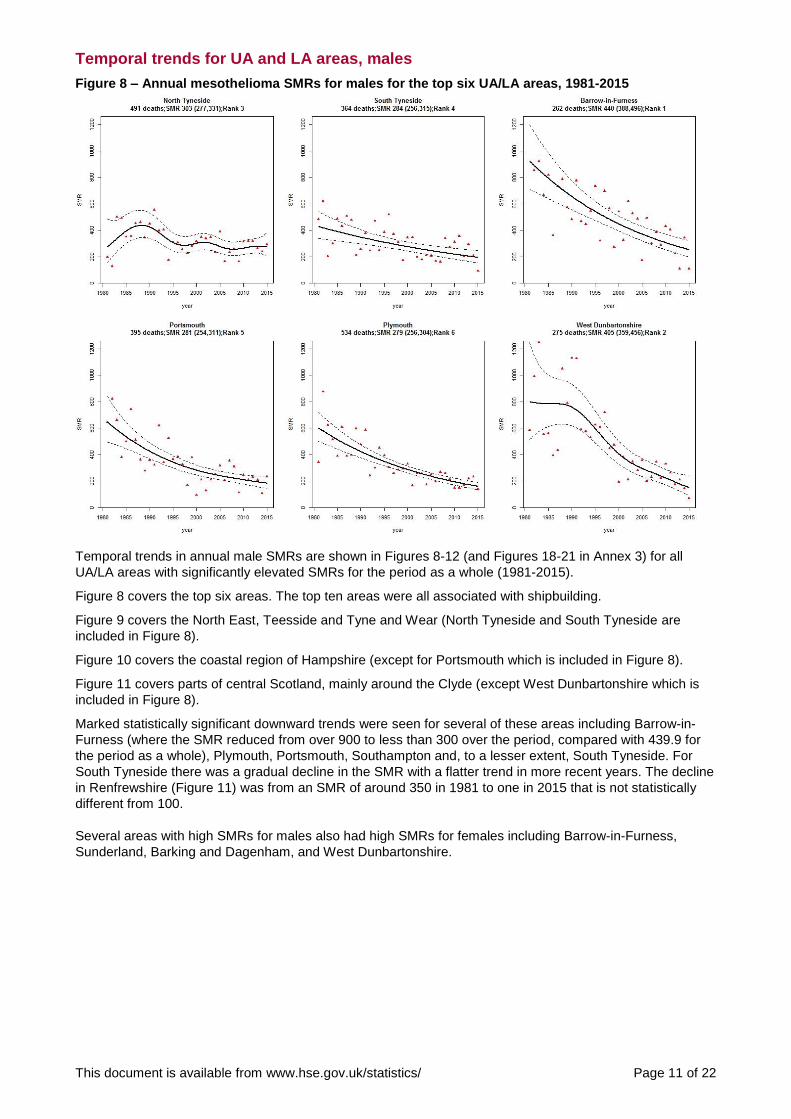
Temporal trends for UA and LA areas, males
Figure 8 – Annual mesothelioma SMRs for males for the top six UA/LA areas, 1981-2015
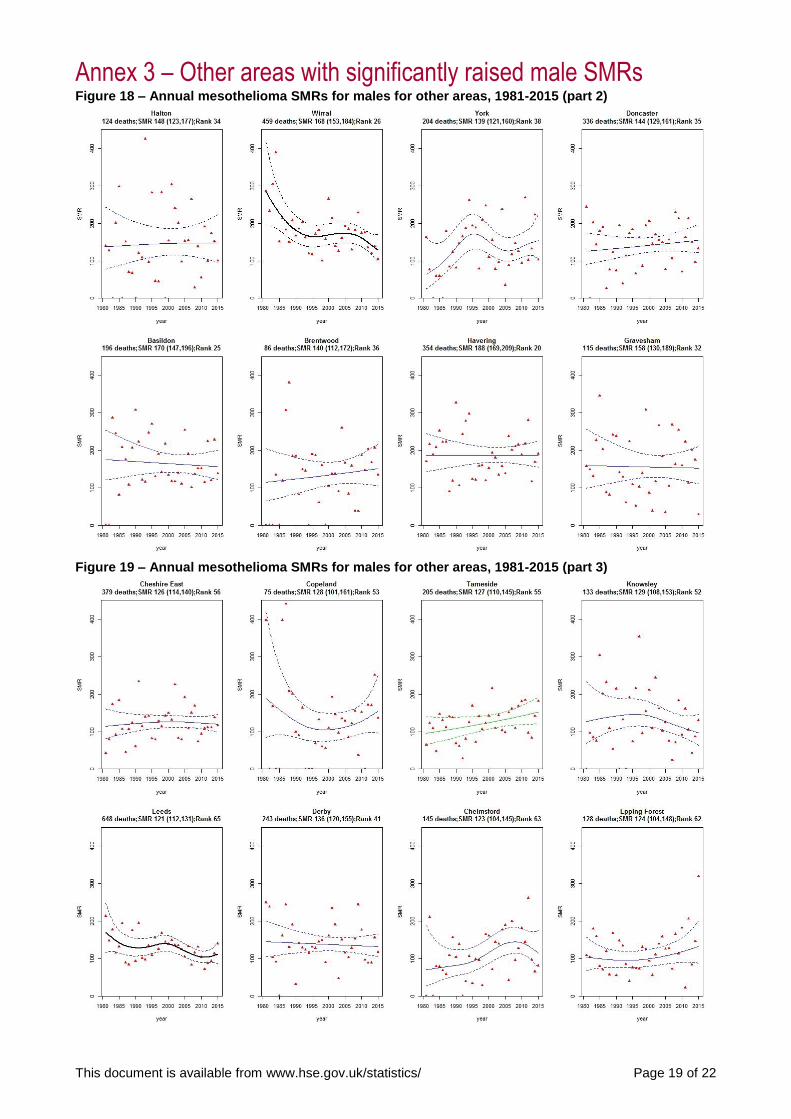
Temporal trends in annual male SMRs are shown in Figures 8-12 (and Figures 18-21 in Annex 3) for all
UA/LA areas with significantly elevated SMRs for the period as a whole (1981-2015).
Figure 8 covers the top six areas. The top ten areas were all associated with shipbuilding.
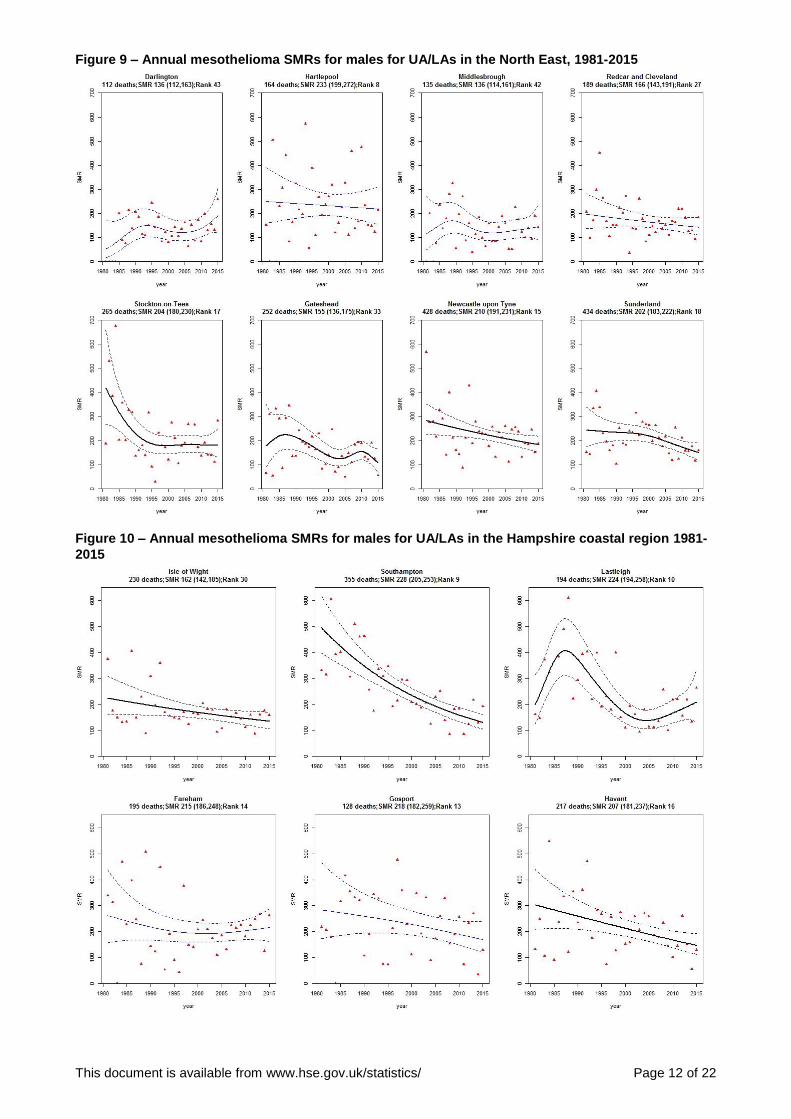
Figure 9 covers the North East, Teesside and Tyne and Wear (North Tyneside and South Tyneside are
included in Figure 8).
Figure 10 covers the coastal region of Hampshire (except for Portsmouth which is included in Figure 8).
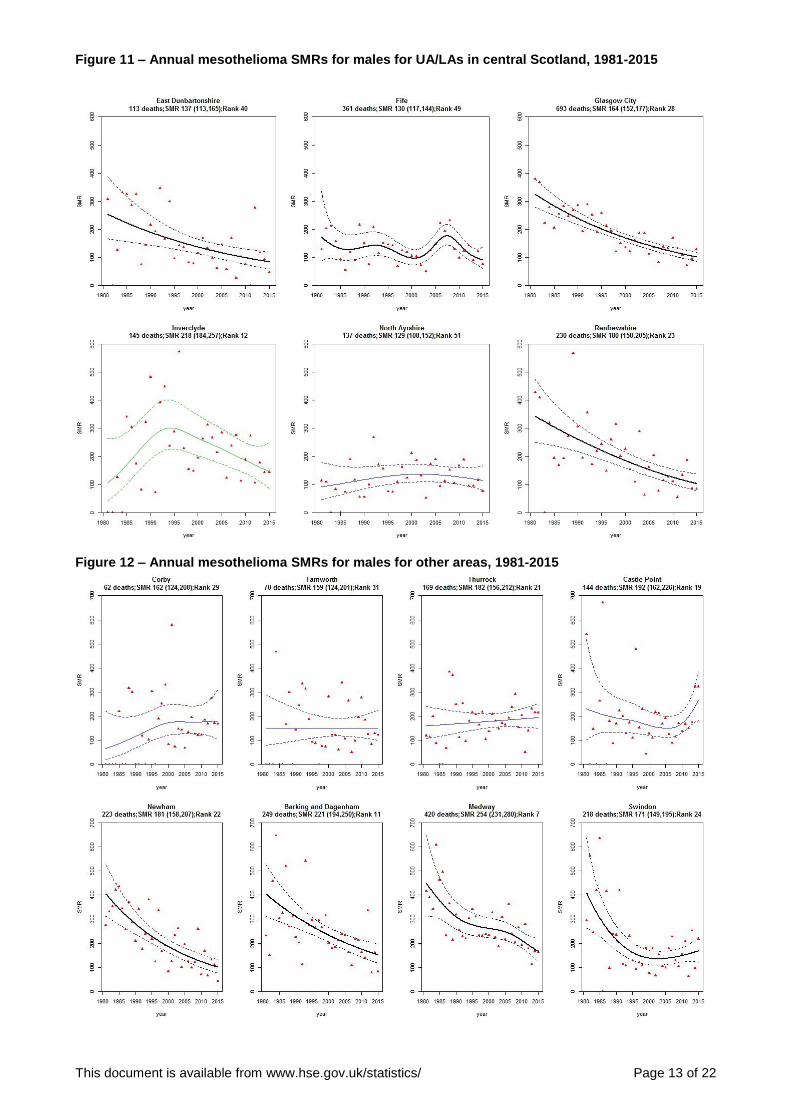
Figure 11 covers parts of central Scotland, mainly around the Clyde (except West Dunbartonshire which is
included in Figure 8).
Marked statistically significant downward trends were seen for several of these areas including Barrow-in-
Furness (where the SMR reduced from over 900 to less than 300 over the period, compared with 439.9 for
the period as a whole), Plymouth, Portsmouth, Southampton and, to a lesser extent, South Tyneside. For
South Tyneside there was a gradual decline in the SMR with a flatter trend in more recent years. The decline
in Renfrewshire (Figure 11) was from an SMR of around 350 in 1981 to one in 2015 that is not statistically
different from 100.
Several areas with high SMRs for males also had high SMRs for females including Barrow-in-Furness,
Sunderland, Barking and Dagenham, and West Dunbartonshire.
This document is available from www.hse.gov.uk/statistics/ Page 12 of 22
Figure 9 – Annual mesothelioma SMRs for males for UA/LAs in the North East, 1981-2015
Figure 10 – Annual mesothelioma SMRs for males for UA/LAs in the Hampshire coastal region 1981-
2015
This document is available from www.hse.gov.uk/statistics/ Page 13 of 22
Figure 11 – Annual mesothelioma SMRs for males for UA/LAs in central Scotland, 1981-2015
Figure 12 – Annual mesothelioma SMRs for males for other areas, 1981-2015
This document is available from www.hse.gov.uk/statistics/ Page 14 of 22
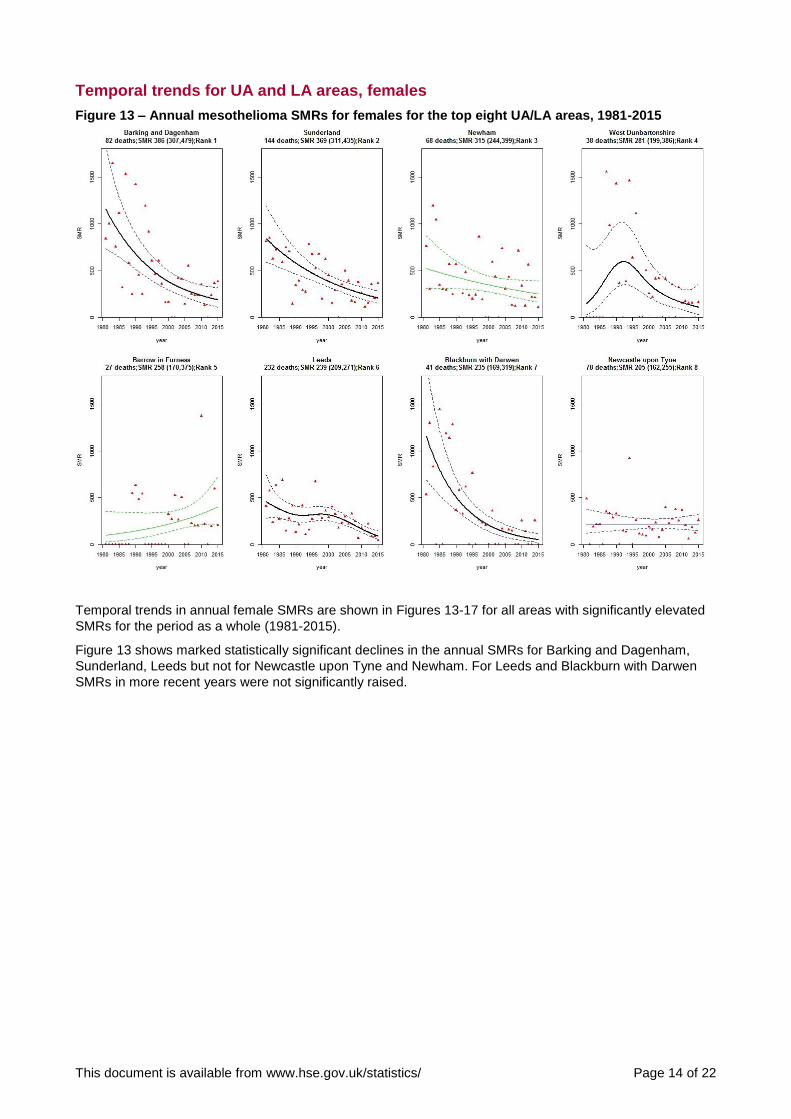
Temporal trends for UA and LA areas, females
Figure 13 – Annual mesothelioma SMRs for females for the top eight UA/LA areas, 1981-2015
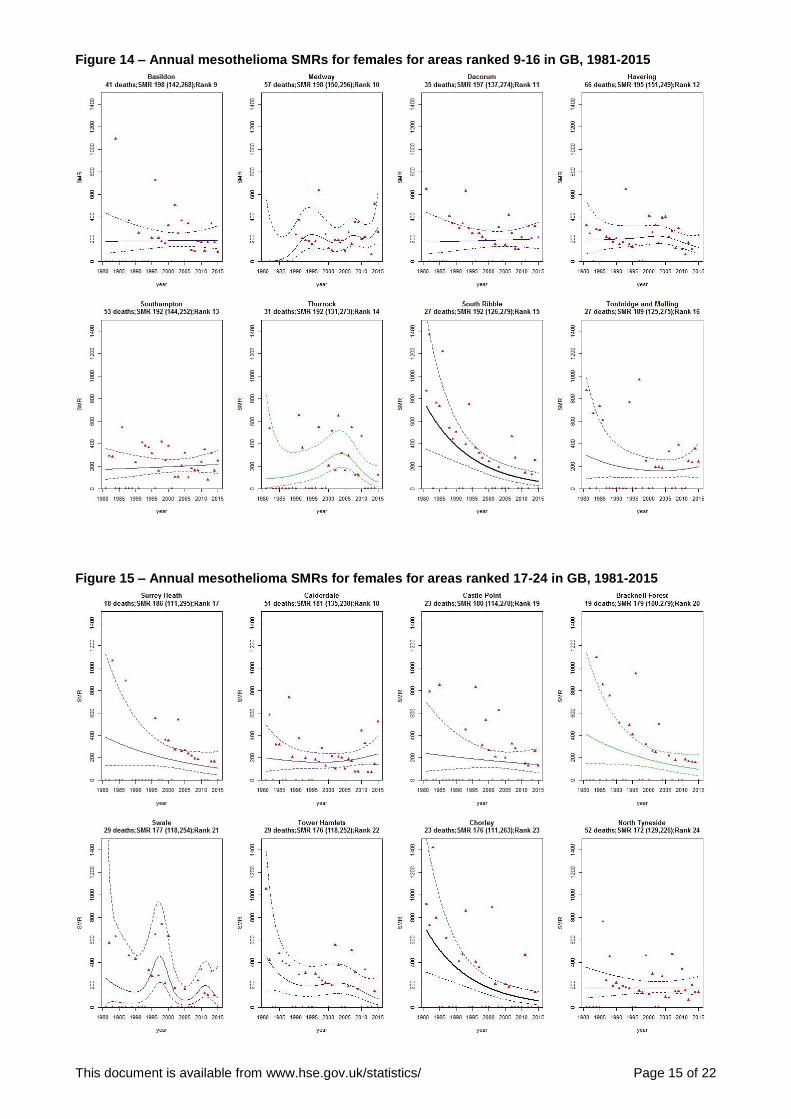
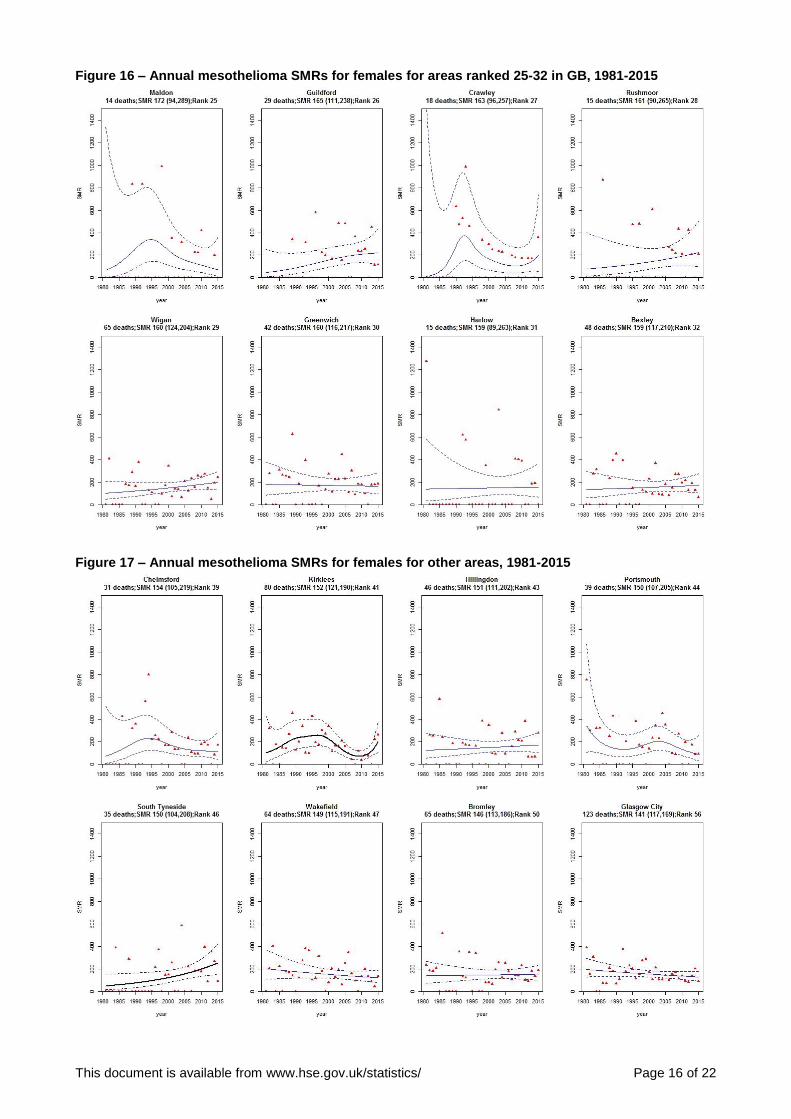
Temporal trends in annual female SMRs are shown in Figures 13-17 for all areas with significantly elevated
SMRs for the period as a whole (1981-2015).
Figure 13 shows marked statistically significant declines in the annual SMRs for Barking and Dagenham,
Sunderland, Leeds but not for Newcastle upon Tyne and Newham. For Leeds and Blackburn with Darwen
SMRs in more recent years were not significantly raised.
This document is available from www.hse.gov.uk/statistics/ Page 15 of 22
Figure 14 – Annual mesothelioma SMRs for females for areas ranked 9-16 in GB, 1981-2015
Figure 15 – Annual mesothelioma SMRs for females for areas ranked 17-24 in GB, 1981-2015
This document is available from www.hse.gov.uk/statistics/ Page 16 of 22
Figure 16 – Annual mesothelioma SMRs for females for areas ranked 25-32 in GB, 1981-2015
Figure 17 – Annual mesothelioma SMRs for females for other areas, 1981-2015
This document is available from www.hse.gov.uk/statistics/ Page 17 of 22
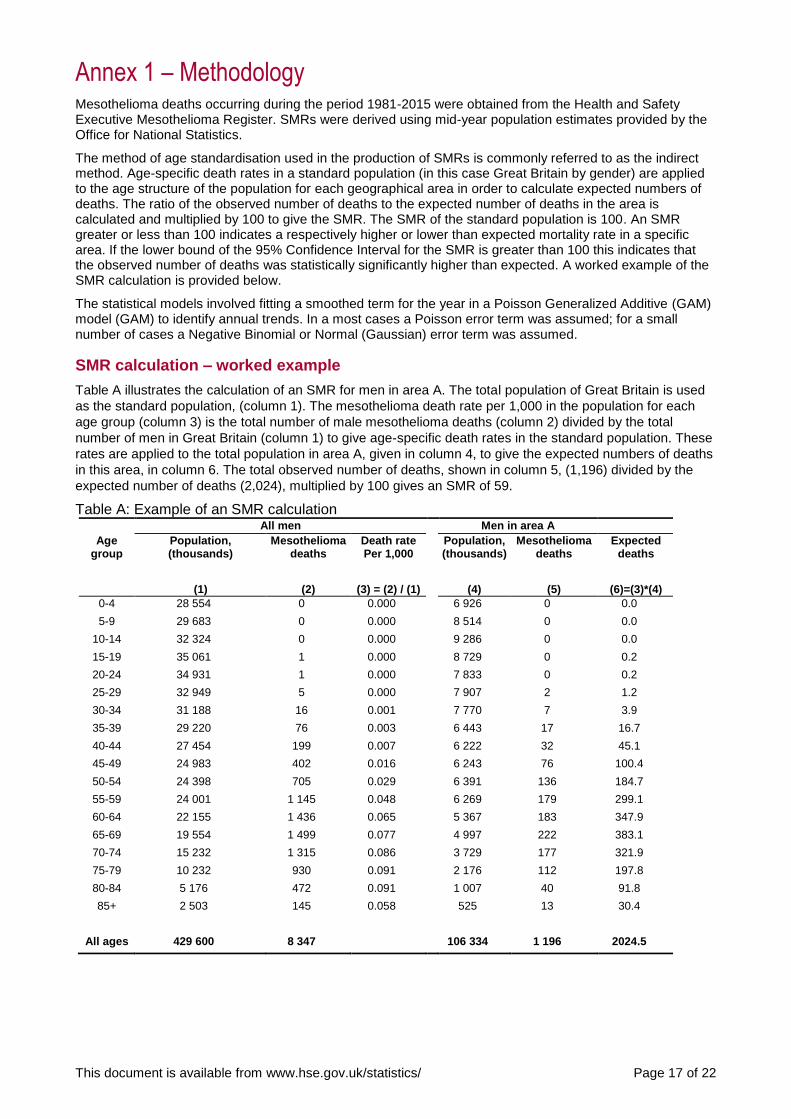
Annex 1 – Methodology Mesothelioma deaths occurring during the period 1981-2015 were obtained from the Health and Safety Executive Mesothelioma Register. SMRs were derived using mid-year population estimates provided by the Office for National Statistics.
The method of age standardisation used in the production of SMRs is commonly referred to as the indirect method. Age-specific death rates in a standard population (in this case Great Britain by gender) are applied to the age structure of the population for each geographical area in order to calculate expected numbers of deaths. The ratio of the observed number of deaths to the expected number of deaths in the area is calculated and multiplied by 100 to give the SMR. The SMR of the standard population is 100. An SMR greater or less than 100 indicates a respectively higher or lower than expected mortality rate in a specific area. If the lower bound of the 95% Confidence Interval for the SMR is greater than 100 this indicates that the observed number of deaths was statistically significantly higher than expected. A worked example of the SMR calculation is provided below.
The statistical models involved fitting a smoothed term for the year in a Poisson Generalized Additive (GAM) model (GAM) to identify annual trends. In a most cases a Poisson error term was assumed; for a small number of cases a Negative Binomial or Normal (Gaussian) error term was assumed.
SMR calculation – worked example
Table A illustrates the calculation of an SMR for men in area A. The total population of Great Britain is used
as the standard population, (column 1). The mesothelioma death rate per 1,000 in the population for each
age group (column 3) is the total number of male mesothelioma deaths (column 2) divided by the total
number of men in Great Britain (column 1) to give age-specific death rates in the standard population. These
rates are applied to the total population in area A, given in column 4, to give the expected numbers of deaths
in this area, in column 6. The total observed number of deaths, shown in column 5, (1,196) divided by the
expected number of deaths (2,024), multiplied by 100 gives an SMR of 59.
Table A: Example of an SMR calculation
All men Men in area A Age
group Population, (thousands)
(1)
Mesothelioma deaths
(2)
Death rate Per 1,000
(3) = (2) / (1)
Population, (thousands)
(4)
Mesothelioma deaths
(5)
Expected deaths
(6)=(3)*(4) 0-4 28 554 0 0.000 6 926 0 0.0
5-9 29 683 0 0.000 8 514 0 0.0
10-14 32 324 0 0.000 9 286 0 0.0
15-19 35 061 1 0.000 8 729 0 0.2
20-24 34 931 1 0.000 7 833 0 0.2
25-29 32 949 5 0.000 7 907 2 1.2
30-34 31 188 16 0.001 7 770 7 3.9
35-39 29 220 76 0.003 6 443 17 16.7
40-44 27 454 199 0.007 6 222 32 45.1
45-49 24 983 402 0.016 6 243 76 100.4
50-54 24 398 705 0.029 6 391 136 184.7
55-59 24 001 1 145 0.048 6 269 179 299.1
60-64 22 155 1 436 0.065 5 367 183 347.9
65-69 19 554 1 499 0.077 4 997 222 383.1
70-74 15 232 1 315 0.086 3 729 177 321.9
75-79 10 232 930 0.091 2 176 112 197.8
80-84 5 176 472 0.091 1 007 40 91.8
85+ 2 503 145 0.058 525 13 30.4
All ages 429 600 8 347 106 334 1 196 2024.5
This document is available from www.hse.gov.uk/statistics/ Page 18 of 22
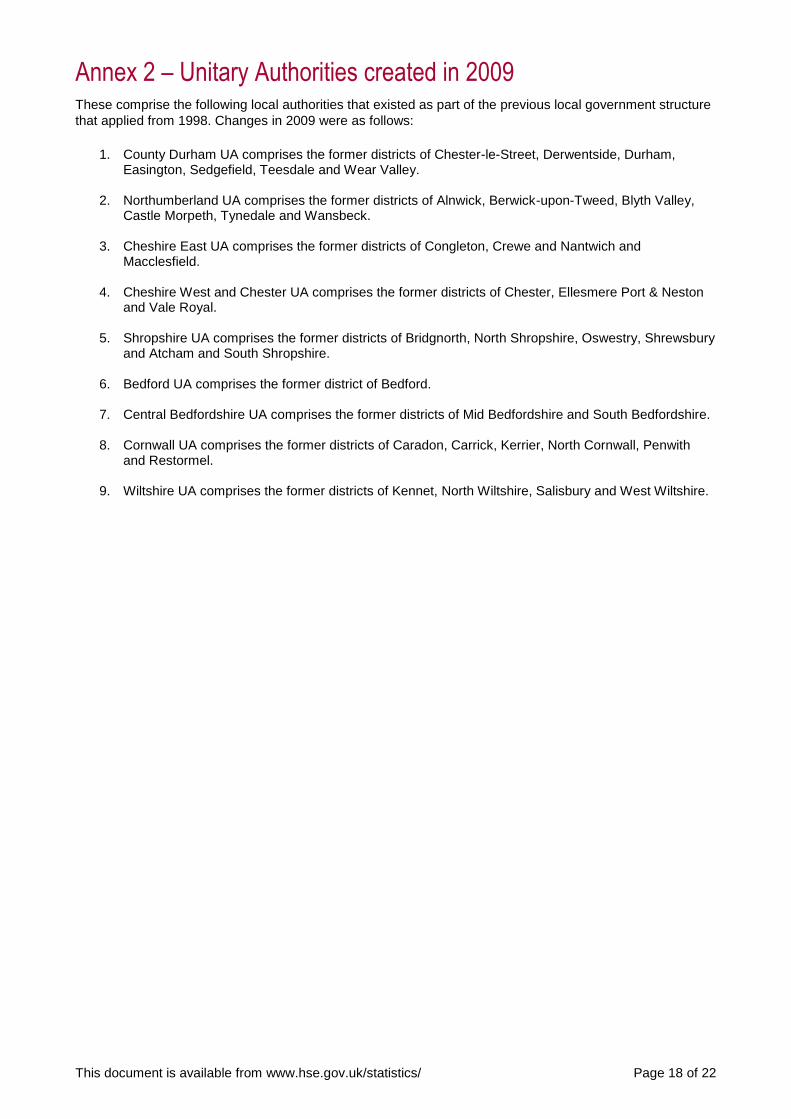
Annex 2 – Unitary Authorities created in 2009 These comprise the following local authorities that existed as part of the previous local government structure
that applied from 1998. Changes in 2009 were as follows:
1. County Durham UA comprises the former districts of Chester-le-Street, Derwentside, Durham,
Easington, Sedgefield, Teesdale and Wear Valley.
2. Northumberland UA comprises the former districts of Alnwick, Berwick-upon-Tweed, Blyth Valley, Castle Morpeth, Tynedale and Wansbeck.
3. Cheshire East UA comprises the former districts of Congleton, Crewe and Nantwich and
Macclesfield.
4. Cheshire West and Chester UA comprises the former districts of Chester, Ellesmere Port & Neston and Vale Royal.
5. Shropshire UA comprises the former districts of Bridgnorth, North Shropshire, Oswestry, Shrewsbury
and Atcham and South Shropshire.
6. Bedford UA comprises the former district of Bedford.
7. Central Bedfordshire UA comprises the former districts of Mid Bedfordshire and South Bedfordshire.
8. Cornwall UA comprises the former districts of Caradon, Carrick, Kerrier, North Cornwall, Penwith and Restormel.
9. Wiltshire UA comprises the former districts of Kennet, North Wiltshire, Salisbury and West Wiltshire.
This document is available from www.hse.gov.uk/statistics/ Page 19 of 22
Annex 3 – Other areas with significantly raised male SMRs Figure 18 – Annual mesothelioma SMRs for males for other areas, 1981-2015 (part 2)
Figure 19 – Annual mesothelioma SMRs for males for other areas, 1981-2015 (part 3)
This document is available from www.hse.gov.uk/statistics/ Page 20 of 22
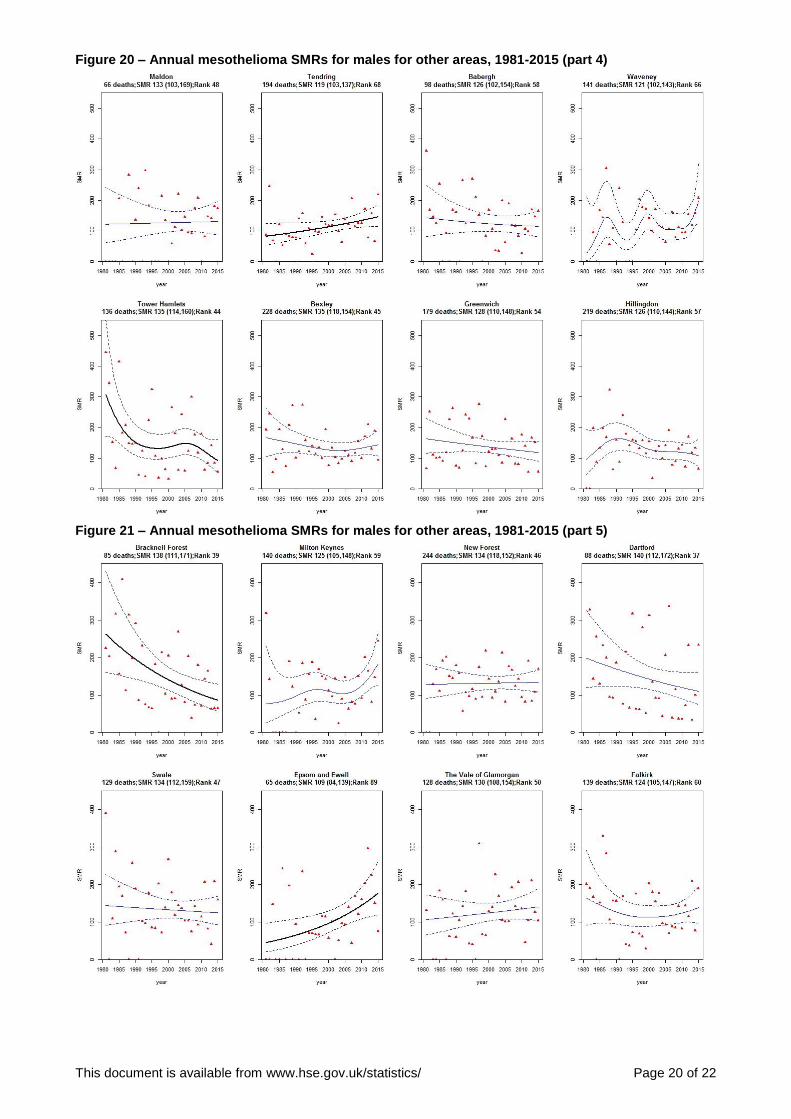
Figure 20 – Annual mesothelioma SMRs for males for other areas, 1981-2015 (part 4)
Figure 21 – Annual mesothelioma SMRs for males for other areas, 1981-2015 (part 5)
This document is available from www.hse.gov.uk/statistics/ Page 21 of 22
Relevant scientific publications on mesothelioma 1. McElvenny DM1, Darnton AJ, Price MJ, Hodgson JT. (2005) Mesothelioma mortality in Great Britain
from 1968 to 2001. Occup Med (Lond) (2005) 55 (2): 79-87.
© Crown copyright If you wish to reuse this information visit www.hse.gov.uk/copyright.htm for details.
First published 07/17.
Published by the Health and Safety Executive V2 11/17
National Statistics
National Statistics status means that official statistics meet the highest standards of trustworthiness, quality and public value.
All official statistics should comply with the Code of Practice for Official Statistics. They are awarded National Statistics status following an assessment by the Authority’s regulatory arm. The Authority considers whether the statistics meet the highest standards of Code compliance, including the value they add to public decisions and debate.
It is Health and Safety Executive’s responsibility to maintain compliance with the standards expected by National Statistics. If we become concerned about whether these statistics are still meeting the appropriate standards, we will discuss any concerns with the Authority promptly. National Statistics status can be removed at any point when the highest standards are not maintained, and reinstated when standards are restored.
An account of how the figures are used for statistical purposes can be found at www.hse.gov.uk/statistics/sources.htm .
For information regarding the quality guidelines used for statistics within HSE see www.hse.gov.uk/statistics/about/quality-guidelines.htm
A revisions policy and log can be seen at www.hse.gov.uk/statistics/about/revisions/
Additional data tables can be found at www.hse.gov.uk/statistics/tables/.
Last updated: November 2017
General enquiries: Statistician [email protected]
Journalists/media enquiries only: www.hse.gov.uk/contact/contact.htm