Embed Size (px)
Citation preview
43
Journal of Oceanography, Vol. 56, pp. 43 to 57. 2000
Keywords:⋅ Mesoscale eddy,⋅ Acoustic DopplerCurrent Profiler(ADCP),
⋅ satellite altimetry,⋅ Kuroshiorecirculation.
Mesoscale Eddies Observed by TOLEX-ADCP andTOPEX/POSEIDON Altimeter in the KuroshioRecirculation Region South of Japan
NAOTO EBUCHI1 and KIMIO HANAWA2
1Center for Atmospheric and Oceanic Studies, Graduate School of Science, Tohoku University, Aoba, Sendai 980-8578, Japan2Department of Geophysics, Graduate School of Science, Tohoku University, Aoba, Sendai 980-8578, Japan
(Received 12 February 1999; in revised form 28 April 1999; accepted 28 April 1999)
Mesoscale eddies in the Kuroshio recirculation region south of Japan have been in-vestigated by using surface current data measured by an Acoustic Doppler CurrentProfiler (ADCP) installed on a regular ferry shuttling between Tokyo and Chichijima,Bonin Islands, and sea surface height anomaly derived from the TOPEX/POSEIDONaltimeter. Many cyclonic and anticyclonic eddies were observed in the region. Spatialand temporal scales of the eddies were determined by lag-correlation analyses in spaceand time. The eddies are circular in shape with a diameter of 500 km and a temporalscale of 80 days. Typical maximum surface velocity and sea surface height anomalyassociated with the eddies are 15–20 cm s–1 and 15 cm, respectively. The frequency ofoccurrence, temporal and spatial scales, and intensity are all nearly the same for thecyclonic and anticyclonic eddies, which are considered to be successive wave-like dis-turbances rather than solitary eddies. Phase speed of westward propagation of theeddies is estimated as 6.8 cm s–1, which is faster than a theoretical estimate based onthe baroclinic first-mode Rossby wave with or without a mean current. The spatialdistribution of sea surface height variations suggests that these eddies may be gener-ated in the Kuroshio Extension region and propagate westward in the Kuroshiorecirculation region, though further studies are needed to clarify the generation proc-esses.
Satellite altimetry is a powerful tool for studyingoceanic variations, including mesoscale eddies, since itcan provide sea surface dynamic topography over the glo-bal ocean with high spatial resolution and temporal fre-quency and can penetrate clouds. Altimeter data have beenutilized to investigate the spatial scale, generation, propa-gation and kinematic energy distribution of mesoscaleeddies in the Kuroshio Extension region (e.g., Tai andWhite, 1990; Qiu et al., 1991; Ichikawa and Imawaki,1994; Aoki et al., 1995; Aoki and Imawaki, 1996).
In the present paper, time series of surface currentvelocities from the Tokyo-Ogasawara Line Experiment(TOLEX) - Acoustic Doppler Current Profiler (ADCP)monitoring are combined with sea surface height datafrom the TOPEX/POSEIDON altimeter to investigate themesoscale eddies in the Kuroshio recirculation regionsouth of Japan. We investigate the detailed structure ofthe surface current velocity field associated with eddiesusing data of high temporal frequency from the TOLEX-
1. IntroductionMesoscale eddies around the Kuroshio and Kuroshio
Extension regions are thought to play important roles intransportation of mass, momentum, energy, heat and sa-linity in the subtropical gyre. There have been severalstudies of the generation, propagation and decay of theseeddies using hydrographic observations and drifting bu-oys (e.g., Kawai, 1972; Kitano, 1975; Cheney et al., 1980;Mizuno and White, 1983). However, spatial coverage andtemporal frequency of in-situ measurements such ashydrographic observations and drifting buoys are verylimited. Infrared images from satellites have also helpedtrace these mesoscale eddies (e.g., Yasuda et al., 1992),but the images cannot be obtained under cloudy condi-tions.
Corresponding author e-mail: [email protected]
Copyright © The Oceanographic Society of Japan.
44 N. Ebuchi and K. Hanawa
ADCP monitoring. The TOPEX/POSEIDON altimeterprovides sea surface height data with wide spatial cover-age and high temporal frequency to investigate the spa-tial scale and propagation of eddies and the distributionof eddy energy.
TOLEX is a program operated by the Physical Ocea-nography Group, Tohoku University and the Japan Ma-rine Science and Technology Center (JAMSTEC) to moni-tor the Kuroshio Current System south of Japan by usingthe ferry “Ogasawara Maru”, which regularly shuttlesbetween Tokyo and the Ogasawara (Bonin) Islands.TOLEX-ADCP monitoring has been conducted since Feb-ruary 1991 using a 150 kHz-type ADCP (Hanawa andYoshikawa, 1993; Hanawa et al., 1996). By analyzing thepreliminary data, Hanawa et al. (1996) reported observa-tions of several cyclonic and anticyclonic eddies withscales of 200–400 km in diameter and passage time of 2–4 months. Using the same ferry, XBT monitoring of thetemperature profile has also been carried out every twomonths since 1988 (Yoshikawa et al., 1996).
TOPEX/POSEIDON (hereafter T/P) is a joint U.S./French space mission to study the world ocean circula-tion. The satellite was launched in August 1992. The mis-sion carries two altimeters, the National Aeronautics andSpace Administration (NASA) dual-frequency TOPEXaltimeter, and the advanced, experimental solid-statePOSEIDON altimeter, designed by Centre Nationald’Etudes Spatiales (CNES). The satellite is taking exactrepeat orbits of period 9.91 days. The ground track spac-ing is 315 km at the equator and about 200 km at midlatitude. Details of the mission, satellite, and instrumentshave been described by Fu et al. (1994). Ebuchi and
Hanawa (1995) compared surface current velocity varia-tions derived from the TOPEX altimeter data with thosefrom the TOLEX-ADCP data, and reported that the twodata sets agree well, with an rms difference of 9.5 cm s–1.
The TOLEX-ADCP and T/P altimeter data are brieflydescribed in Section 2. The nature of mesoscale eddiessouth of Kuroshio, including typical feature of the ed-dies, their spatial and temporal scales and propagatingspeed derived from the ADCP and altimeter data are de-scribed in Section 3. Generation and propagation of theeddies are discussed in Section 4, followed by a brief sum-mary in Section 5.
2. Data
2.1 TOLEX-ADCP dataTOLEX-ADCP monitoring was started in 1991 us-
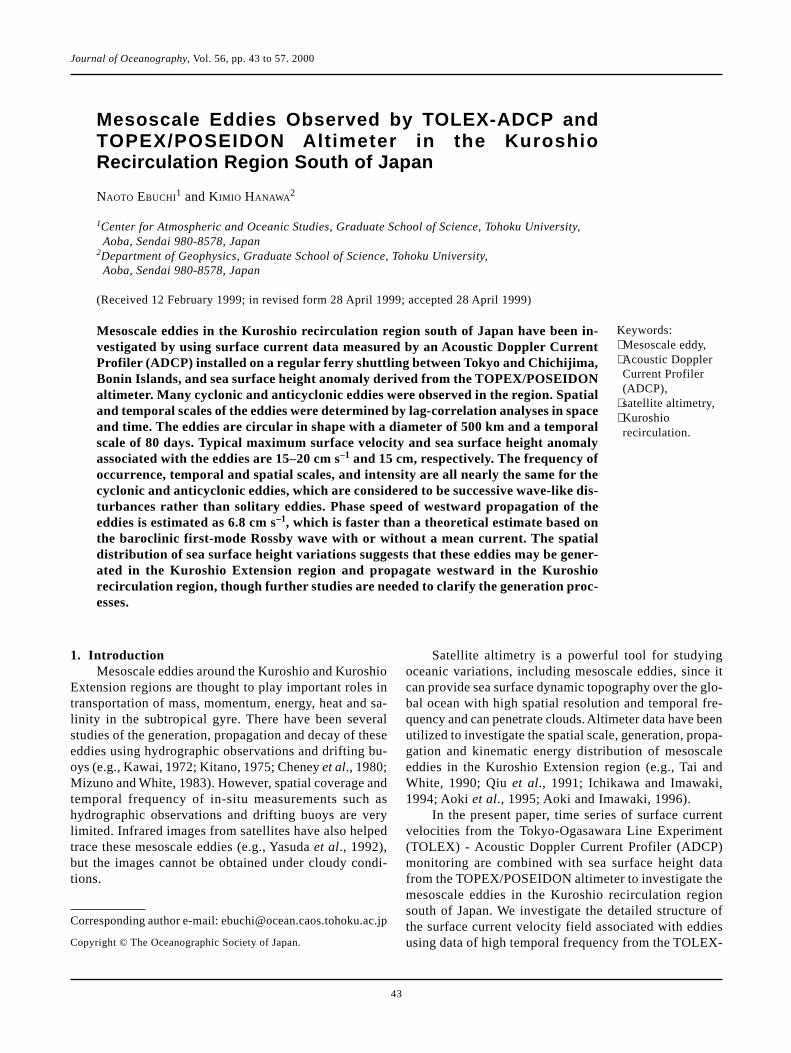
ing the ferry “Ogasawara Maru” (110 m long, 3553 tons),operated by Ogasawara Kaiun Company (Hanawa andYoshikawa, 1993; Hanawa et al., 1996). A 150 kHz-typeADCP (RD Instruments, U.S.A.) was installed on theferry. Figure 1 shows the ship track of the ferry togetherwith the ground tracks of the T/P altimeter analyzed inthe present study. This ferry regularly shuttles 58 roundtrips a year between Tokyo and Chichijima, which be-longs to the Ogasawara (Bonin) Islands: that is, 116 crosssections are obtained in a year.
By using the ADCP, a current velocity profile in ver-tical bins of 16 m from the surface to about 350 m depthwas obtained at 48 spatial grid points located every tenminutes in latitude from 35°N to 27°10′ N along the shiptrack (Fig. 1). Detailed procedures for the ADCP data
Fig. 1. Locations of the ship track of TOLEX-ADCP monitoring (solid circles) and ground tracks of the TOPEX/POSEIDONaltimeter analyzed in the present study (dots). Thick outline and thin outline rectangles are explained in Subsection 3.2.
Mesoscale Eddies in the Kuroshio Recirculation Region 45
processing including data averaging, ship velocity meas-urement by the Global Positioning System (GPS) andangle correction, have been described by Hanawa et al.(1996).
In the present study, current velocity at 50 m depthwas utilized as the most representative surface current,since the ADCP data are instantaneous velocities and in-clude ageostrophic components, such as tidal current, in-ternal waves and wind-driven surface current. Kizu et al.(1999) applied a harmonic analysis to remove the tidalcurrent components from the ADCP data. The tide-freesurface current vectors they provided were linearly inter-polated in time to a regular 5-day interval to produce the
data used in this study. The period of the data extendsfrom April 1991 to November 1996. However, the totallength of the data is about 5 years, since there are someintermittent gaps in the data due to problems with theADCP observations and bad weather conditions.
2.2 TOPEX/POSEIDON altimeter dataIn the present study we analyzed TOPEX/
POSEIDON Sea Level Anomaly (SLA) altimeter prod-ucts for a period of 5 years from October 2, 1992 to Oc-tober 11, 1997 (cycles 2–186). These products are sup-plied by the Collecte Localisation Satellites (CLS) SpaceOceanography Division, Toulouse, France (AVISO/
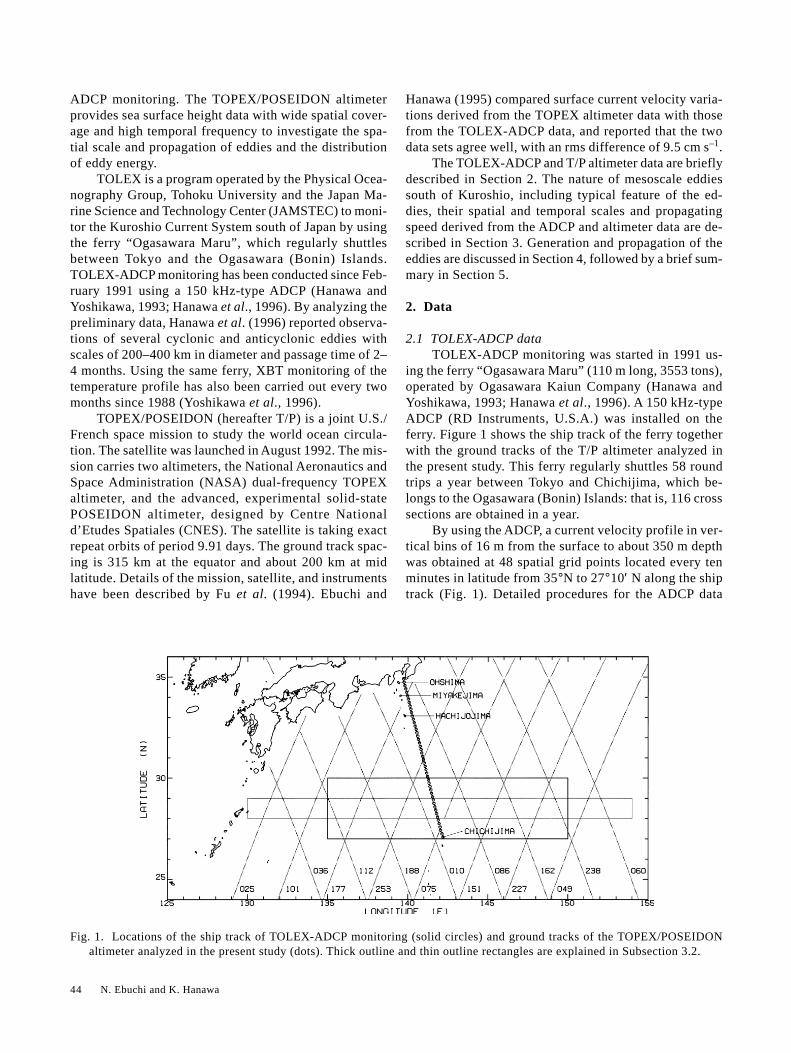
Fig. 2. An example of time series of surface current velocity vectors observed by the TOLEX-ADCP monitoring at a depth of50 m.

46 N. Ebuchi and K. Hanawa
Fig. 3. (a) Vector mean velocity, (b) mean zonal (circles) and meridional (triangles) velocity components, and (c) their standarddeviations (thick line for zonal component, thin line for meridional component, and dashed line for root-mean-square of thezonal and meridional deviations) calculated for the whole data period.
Altimetry, 1996). They are generated, using the conven-tional repeat-track analysis method, from the altimetersea surface heights corrected for instrumental errors, en-vironment perturbations (wet tropospheric, dry tropo-spheric and ionospheric effects), ocean wave influence
(sea state bias), tide influence (ocean tide, earth tide andpole tide) and inverse barometric effect. The sea surfaceheight anomaly is resampled every 7 km for a given trackand for each cycle. Locations of the ground tracksanalyzed in this study are shown in Fig. 1.
Fig. 4. Ensemble averages of rotary spectra of the surface current vectors calculated from the time series observed at latitudesfrom 27 to 30°N. Thick and thin lines represent clockwise (anticyclonic) and counter-clockwise (cyclonic) components, re-spectively. An error bar indicating the 95% confidence level is shown for a particular point at a peak.
Mesoscale Eddies in the Kuroshio Recirculation Region 47
3. Results
3.1 Mesoscale eddies observed along the TOLEX moni-toring lineIn this section, features of mesoscale eddies which
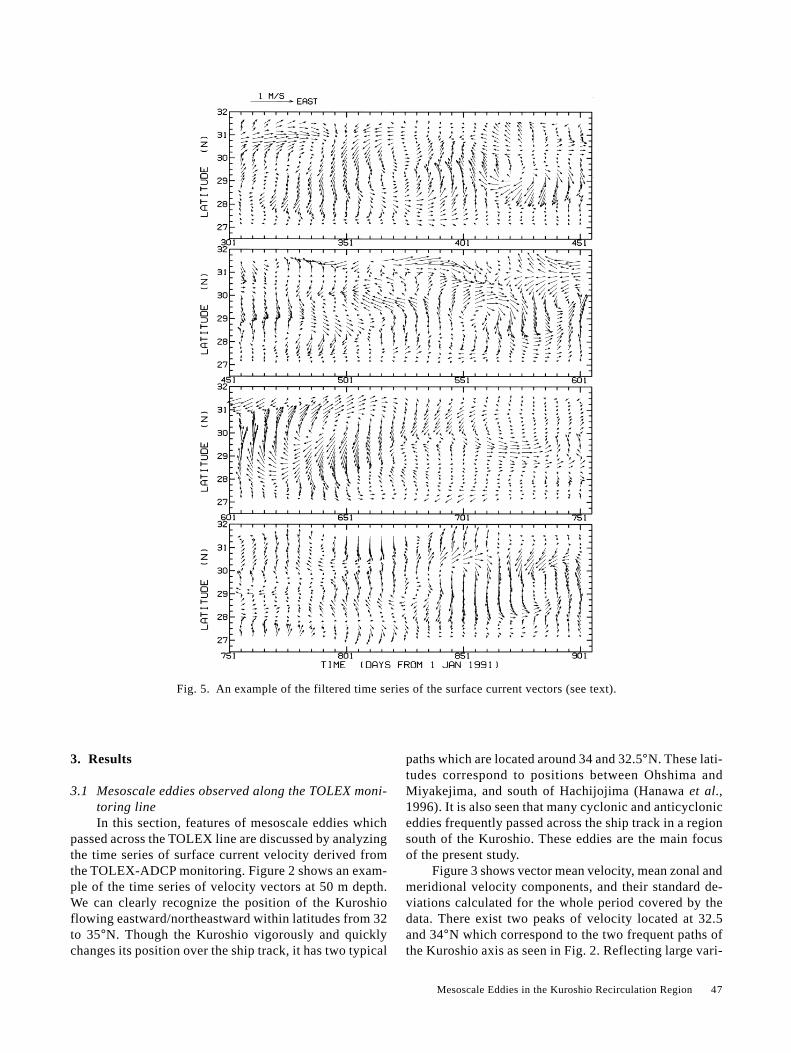
passed across the TOLEX line are discussed by analyzingthe time series of surface current velocity derived fromthe TOLEX-ADCP monitoring. Figure 2 shows an exam-ple of the time series of velocity vectors at 50 m depth.We can clearly recognize the position of the Kuroshioflowing eastward/northeastward within latitudes from 32to 35°N. Though the Kuroshio vigorously and quicklychanges its position over the ship track, it has two typical
Fig. 5. An example of the filtered time series of the surface current vectors (see text).
paths which are located around 34 and 32.5°N. These lati-tudes correspond to positions between Ohshima andMiyakejima, and south of Hachijojima (Hanawa et al.,1996). It is also seen that many cyclonic and anticycloniceddies frequently passed across the ship track in a regionsouth of the Kuroshio. These eddies are the main focusof the present study.
Figure 3 shows vector mean velocity, mean zonal andmeridional velocity components, and their standard de-viations calculated for the whole period covered by thedata. There exist two peaks of velocity located at 32.5and 34°N which correspond to the two frequent paths ofthe Kuroshio axis as seen in Fig. 2. Reflecting large vari-
48 N. Ebuchi and K. Hanawa
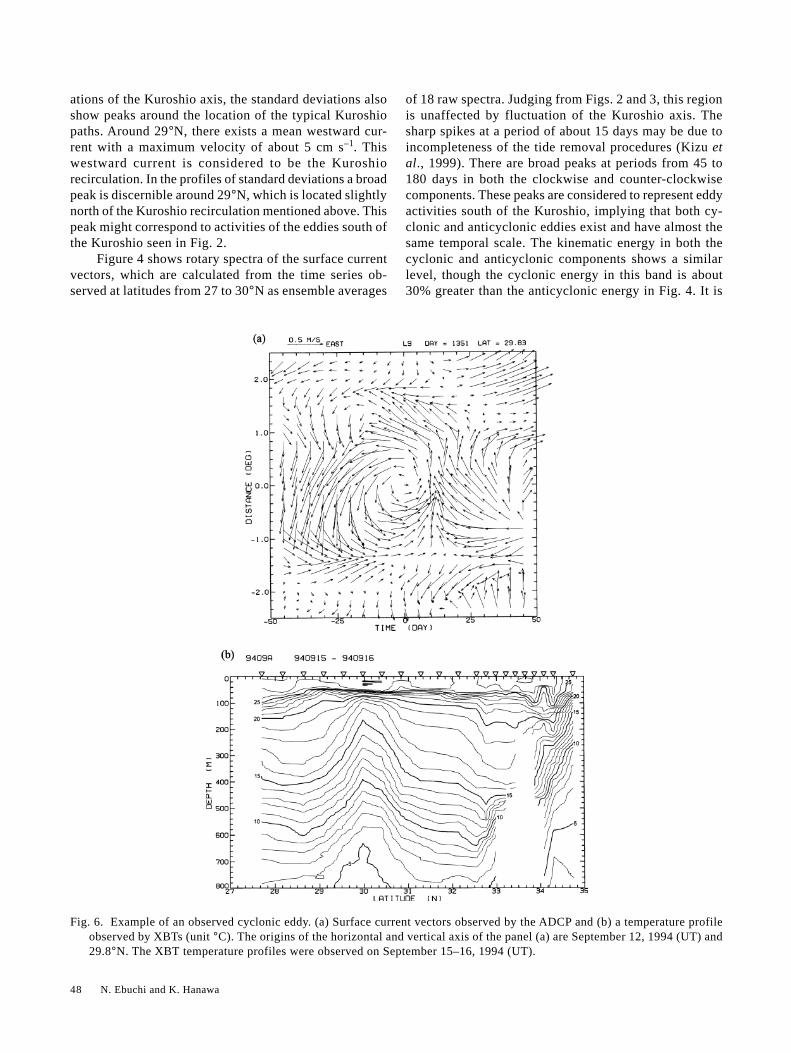
Fig. 6. Example of an observed cyclonic eddy. (a) Surface current vectors observed by the ADCP and (b) a temperature profileobserved by XBTs (unit °C). The origins of the horizontal and vertical axis of the panel (a) are September 12, 1994 (UT) and29.8°N. The XBT temperature profiles were observed on September 15–16, 1994 (UT).
ations of the Kuroshio axis, the standard deviations alsoshow peaks around the location of the typical Kuroshiopaths. Around 29°N, there exists a mean westward cur-rent with a maximum velocity of about 5 cm s–1. Thiswestward current is considered to be the Kuroshiorecirculation. In the profiles of standard deviations a broadpeak is discernible around 29°N, which is located slightlynorth of the Kuroshio recirculation mentioned above. Thispeak might correspond to activities of the eddies south ofthe Kuroshio seen in Fig. 2.
Figure 4 shows rotary spectra of the surface currentvectors, which are calculated from the time series ob-served at latitudes from 27 to 30°N as ensemble averages
of 18 raw spectra. Judging from Figs. 2 and 3, this regionis unaffected by fluctuation of the Kuroshio axis. Thesharp spikes at a period of about 15 days may be due toincompleteness of the tide removal procedures (Kizu etal., 1999). There are broad peaks at periods from 45 to180 days in both the clockwise and counter-clockwisecomponents. These peaks are considered to represent eddyactivities south of the Kuroshio, implying that both cy-clonic and anticyclonic eddies exist and have almost thesame temporal scale. The kinematic energy in both thecyclonic and anticyclonic components shows a similarlevel, though the cyclonic energy in this band is about30% greater than the anticyclonic energy in Fig. 4. It is

Mesoscale Eddies in the Kuroshio Recirculation Region 49
Fig. 7. Example of an observed anticyclonic eddy. (a) Surface current vectors observed by the ADCP and (b) a temperatureprofile observed by XBTs (unit °C). The origins of the horizontal and vertical axis of the panel (a) are October 7, 1992 (UT)and 30.3°N. The XBT temperature profiles were observed on September 27–28, 1992 (UT).
also shown that such eddy activities are the dominantoceanic variation in this region.
In order to focus on the eddy activities, a recursive-type band-pass filter with cut-off periods of 236.8 and40.3 days (determined by the results in Fig. 4) and a cut-off gain of –45 dB per octave is applied to the time seriesof the surface current vectors. An example of the filteredtime series is shown in Fig. 5. The period is the same asin Fig. 2, though only the southern part from 27 to 32°Nis shown. Several cyclonic (e.g., around day 376, 496,596, 721, 881) and anticyclonic (e.g., around day 316,426, 556, 646, 831) eddies are discernible. All centers ofthe eddies are located between 28 and 30°N.
Figures 6 and 7 show examples of observed cyclonicand anticyclonic eddies, respectively, together with tem-perature profiles derived from the TOLEX-XBT moni-toring (Yoshikawa et al., 1996). The cyclonic eddy shownin Fig. 6(a) has a diameter of a few hundred kilometersand a maximum velocity around 50 cm s–1, and stays formore than two months on the ship track. Location of thecenter of the eddy in the current field coincides with thatin the vertical section of temperature (Fig. 6(b)). The ver-tical structure associated with the eddy extends from thesubsurface layer to below 800 m, and the 15°C isothermrises about 250 m at the center of the eddy (30°N) com-pared to the surrounding area.
50 N. Ebuchi and K. Hanawa
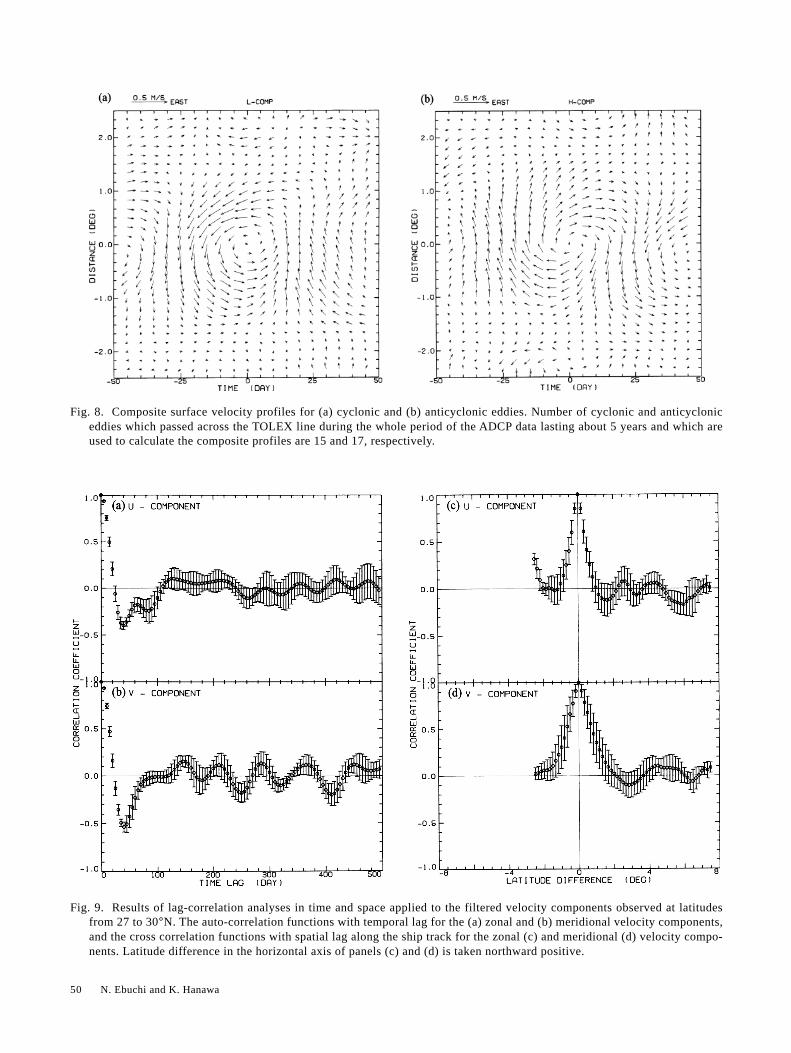
Fig. 8. Composite surface velocity profiles for (a) cyclonic and (b) anticyclonic eddies. Number of cyclonic and anticycloniceddies which passed across the TOLEX line during the whole period of the ADCP data lasting about 5 years and which areused to calculate the composite profiles are 15 and 17, respectively.
Fig. 9. Results of lag-correlation analyses in time and space applied to the filtered velocity components observed at latitudesfrom 27 to 30°N. The auto-correlation functions with temporal lag for the (a) zonal and (b) meridional velocity components,and the cross correlation functions with spatial lag along the ship track for the zonal (c) and meridional (d) velocity compo-nents. Latitude difference in the horizontal axis of panels (c) and (d) is taken northward positive.

Mesoscale Eddies in the Kuroshio Recirculation Region 51
The anticyclonic eddy in Fig. 7(a) shows slightlylarger scales in time and space than those of the cycloniceddy in Fig. 6(a), though its maximum velocity is weaker.Collocation of the eddy centers in the current vector fieldand vertical temperature section (Fig. 7(b)) is also dis-cernible. The vertical structure is less steep than thatshown in Fig. 6(b), but it reaches below 800 m. Displace-ment of the 15°C isotherm reaches 200 m at the center ofthe eddy (30°N).
Visual observation revealed 15 cyclonic and 17 anti-cyclonic eddies which passed across the TOLEX lineduring the whole period of the ADCP data, covering about5 years. Composite profiles of these cyclonic and anticy-clonic eddies are calculated and shown in Figs. 8(a) and(b), respectively. The centers of these eddies were deter-mined by identifying the time and position where the ve-locity minimum exists together with maximum veloci-ties of opposite directions south and north of the mini-mum. Then the centers were aligned to make up the com-posites. Mean latitudes of these centers were 29.7 and29.3°N for the cyclonic and anti-cyclonic eddies, respec-tively.
Both composite eddies show very similar and sym-metrical features. The along-track spatial scales (the ver-tical axis) and temporal scales (the horizontal axis) areestimated to be a few hundred kilometers and about twomonths. The typical magnitude of the maximum velocityis a few tens of centimeters per second. It is suggestedthat the frequency of occurrence, temporal and spatialscales, and intensity of the eddies are almost identical forthe cyclonic and anticyclonic eddies. This is consistentwith the result from the rotary spectrum shown in Fig. 4.
Fig. 10. An ensemble average of power spectra of the altimeter-derived sea surface height anomaly calculated in an area between27 and 30°N, and 135 and 150°E, which is indicated by a solid outline rectangle in Fig. 1. An error bar indicating the 95%confidence level is shown for a particular point at a peak.
In regions south of the Kuroshio or Kuroshio Extension,most studies (e.g., Cheney et al., 1980; Mizuno and White,1983; Ichikawa and Imawaki, 1994) have paid attentionto the generation and propagation of cyclonic (cold) ed-dies. However, the results of this study show that bothcyclonic and anticyclonic eddies are commonly observedin this region.
In order to estimate spatial and temporal scales ofthe eddies, lag-correlation analysis in time and space isapplied to the filtered velocity components observed atlatitudes from 27 to 30°N. The results are shown in Fig.9. Panels (a) and (b) show the auto-correlation functionswith temporal lag for the zonal and meridional compo-nents, respectively. It is shown that the single-side tem-poral scale of the eddies is 40 days, where the correlationcoefficient takes a minimum value. Thus, the typical tem-poral scale of the eddies is estimated as 80 days. By con-sidering the time scale (80 days) and occurrence frequencyof the eddies (3.4 eddies/year for each of the cyclonicand anticyclonic eddies), these eddies are almost alwaysobserved in this region. This suggests that the cyclonicand anti-cyclonic eddies are not solitary eddies but suc-cessive wave-like disturbances, though the temporal lagcorrelation functions shown in panels (a) and (b) do notshow significant second peaks. This conclusion is sup-ported by the fact that preceding and succeeding eddieswith opposite polarity are discernible in the compositecurrent velocity profiles shown in Fig. 8.
Panels (c) and (d) show the cross correlation func-tion with spatial lag along the ship track for the zonal andmeridional components, respectively. The spatial scalesof the eddies, which are defined by minima of the corre-
52 N. Ebuchi and K. Hanawa
served by T/P altimeter are analyzed to investigate fur-ther the spatial and temporal scales of the eddies and toexplore propagation of the eddies. The power spectrumof the altimeter-derived sea surface height anomaly wascalculated as an ensemble average in an area between 27and 30°N, and 135 and 150°E, which is indicated by asolid outline rectangle in Fig. 1. The result is shown inFig. 10. A peak can be seen at a period of one year, whichrepresents the annual variation of the sea surface heightincluding the steric change of the surface layer. There alsoexists a broad band of energy with several peaks at peri-ods between 45 to 180 days. This period range coincideswith the peaks in the rotary spectrum of the surface cur-rent shown in Fig. 4, and these are considered to repre-sent eddy activities in this area.
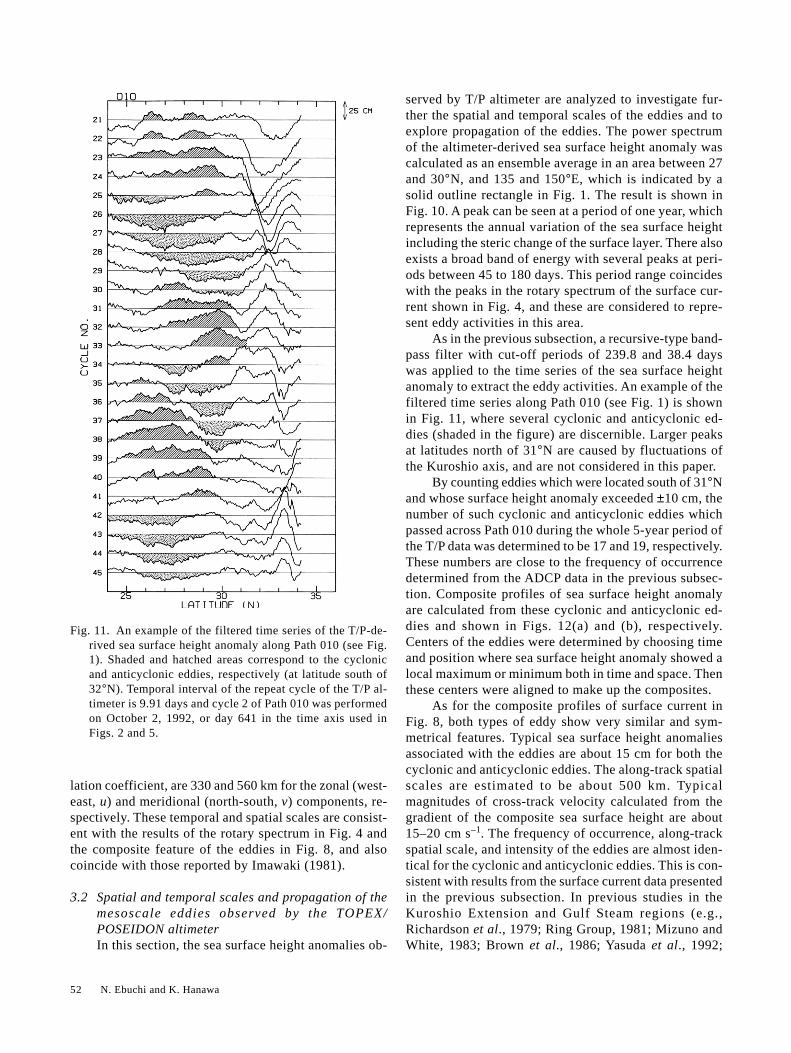
As in the previous subsection, a recursive-type band-pass filter with cut-off periods of 239.8 and 38.4 dayswas applied to the time series of the sea surface heightanomaly to extract the eddy activities. An example of thefiltered time series along Path 010 (see Fig. 1) is shownin Fig. 11, where several cyclonic and anticyclonic ed-dies (shaded in the figure) are discernible. Larger peaksat latitudes north of 31°N are caused by fluctuations ofthe Kuroshio axis, and are not considered in this paper.
By counting eddies which were located south of 31°Nand whose surface height anomaly exceeded ±10 cm, thenumber of such cyclonic and anticyclonic eddies whichpassed across Path 010 during the whole 5-year period ofthe T/P data was determined to be 17 and 19, respectively.These numbers are close to the frequency of occurrencedetermined from the ADCP data in the previous subsec-tion. Composite profiles of sea surface height anomalyare calculated from these cyclonic and anticyclonic ed-dies and shown in Figs. 12(a) and (b), respectively.Centers of the eddies were determined by choosing timeand position where sea surface height anomaly showed alocal maximum or minimum both in time and space. Thenthese centers were aligned to make up the composites.
As for the composite profiles of surface current inFig. 8, both types of eddy show very similar and sym-metrical features. Typical sea surface height anomaliesassociated with the eddies are about 15 cm for both thecyclonic and anticyclonic eddies. The along-track spatialscales are estimated to be about 500 km. Typicalmagnitudes of cross-track velocity calculated from thegradient of the composite sea surface height are about15–20 cm s–1. The frequency of occurrence, along-trackspatial scale, and intensity of the eddies are almost iden-tical for the cyclonic and anticyclonic eddies. This is con-sistent with results from the surface current data presentedin the previous subsection. In previous studies in theKuroshio Extension and Gulf Steam regions (e.g.,Richardson et al., 1979; Ring Group, 1981; Mizuno andWhite, 1983; Brown et al., 1986; Yasuda et al., 1992;
Fig. 11. An example of the filtered time series of the T/P-de-rived sea surface height anomaly along Path 010 (see Fig.1). Shaded and hatched areas correspond to the cyclonicand anticyclonic eddies, respectively (at latitude south of32°N). Temporal interval of the repeat cycle of the T/P al-timeter is 9.91 days and cycle 2 of Path 010 was performedon October 2, 1992, or day 641 in the time axis used inFigs. 2 and 5.
lation coefficient, are 330 and 560 km for the zonal (west-east, u) and meridional (north-south, v) components, re-spectively. These temporal and spatial scales are consist-ent with the results of the rotary spectrum in Fig. 4 andthe composite feature of the eddies in Fig. 8, and alsocoincide with those reported by Imawaki (1981).
3.2 Spatial and temporal scales and propagation of themesoscale eddies observed by the TOPEX/POSEIDON altimeterIn this section, the sea surface height anomalies ob-
Mesoscale Eddies in the Kuroshio Recirculation Region 53
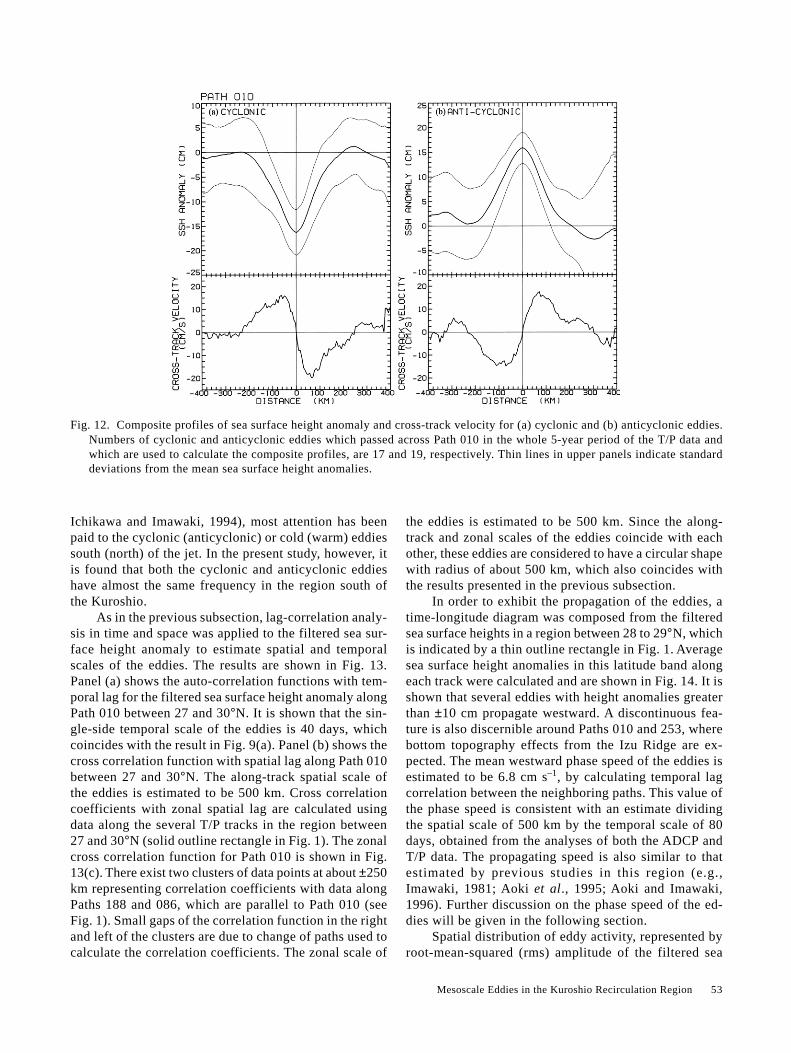
Fig. 12. Composite profiles of sea surface height anomaly and cross-track velocity for (a) cyclonic and (b) anticyclonic eddies.Numbers of cyclonic and anticyclonic eddies which passed across Path 010 in the whole 5-year period of the T/P data andwhich are used to calculate the composite profiles, are 17 and 19, respectively. Thin lines in upper panels indicate standarddeviations from the mean sea surface height anomalies.
Ichikawa and Imawaki, 1994), most attention has beenpaid to the cyclonic (anticyclonic) or cold (warm) eddiessouth (north) of the jet. In the present study, however, itis found that both the cyclonic and anticyclonic eddieshave almost the same frequency in the region south ofthe Kuroshio.
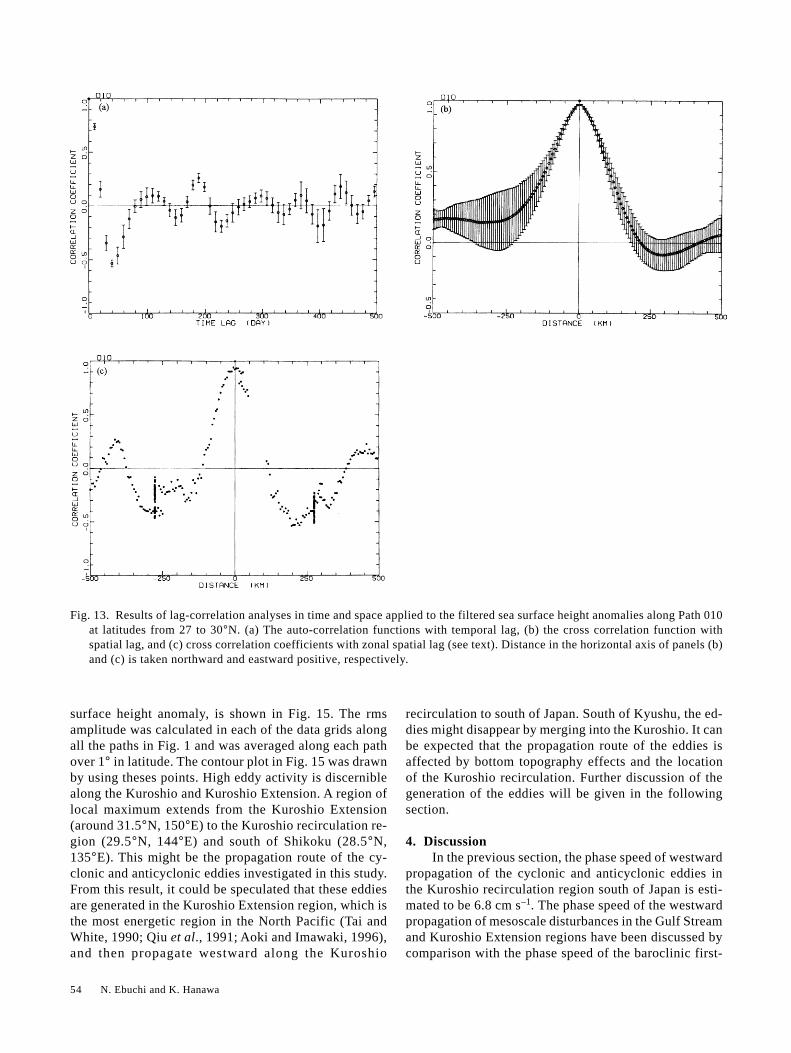
As in the previous subsection, lag-correlation analy-sis in time and space was applied to the filtered sea sur-face height anomaly to estimate spatial and temporalscales of the eddies. The results are shown in Fig. 13.Panel (a) shows the auto-correlation functions with tem-poral lag for the filtered sea surface height anomaly alongPath 010 between 27 and 30°N. It is shown that the sin-gle-side temporal scale of the eddies is 40 days, whichcoincides with the result in Fig. 9(a). Panel (b) shows thecross correlation function with spatial lag along Path 010between 27 and 30°N. The along-track spatial scale ofthe eddies is estimated to be 500 km. Cross correlationcoefficients with zonal spatial lag are calculated usingdata along the several T/P tracks in the region between27 and 30°N (solid outline rectangle in Fig. 1). The zonalcross correlation function for Path 010 is shown in Fig.13(c). There exist two clusters of data points at about ±250km representing correlation coefficients with data alongPaths 188 and 086, which are parallel to Path 010 (seeFig. 1). Small gaps of the correlation function in the rightand left of the clusters are due to change of paths used tocalculate the correlation coefficients. The zonal scale of
the eddies is estimated to be 500 km. Since the along-track and zonal scales of the eddies coincide with eachother, these eddies are considered to have a circular shapewith radius of about 500 km, which also coincides withthe results presented in the previous subsection.
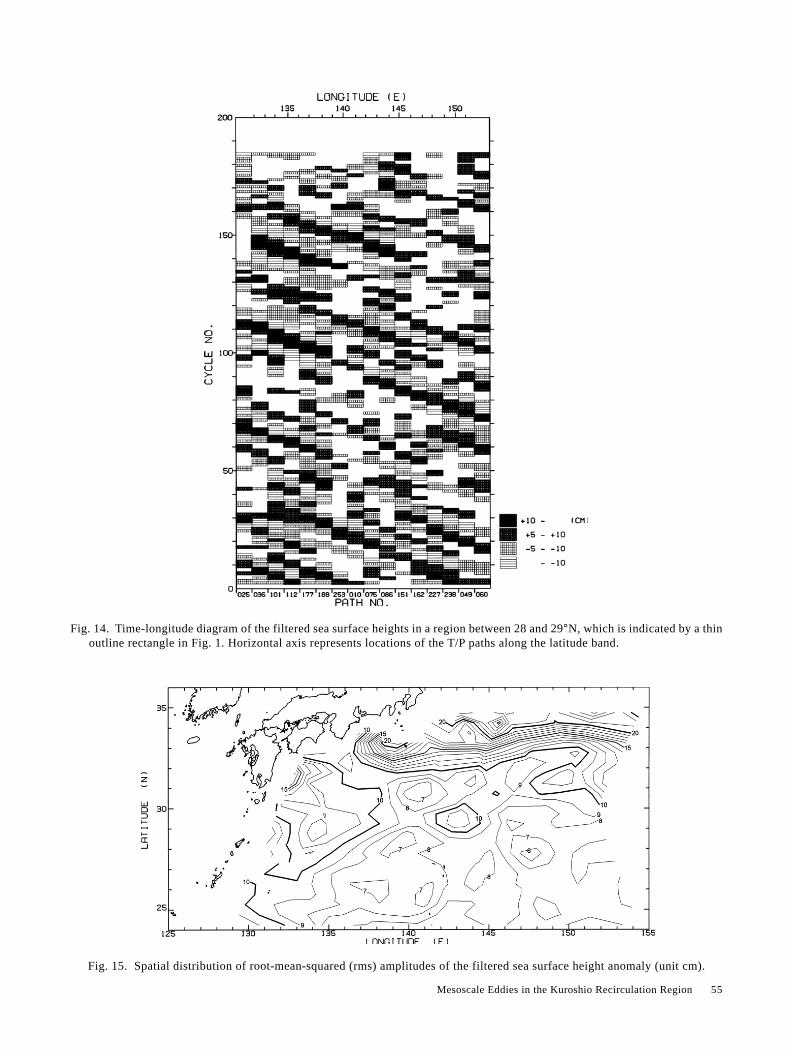
In order to exhibit the propagation of the eddies, atime-longitude diagram was composed from the filteredsea surface heights in a region between 28 to 29°N, whichis indicated by a thin outline rectangle in Fig. 1. Averagesea surface height anomalies in this latitude band alongeach track were calculated and are shown in Fig. 14. It isshown that several eddies with height anomalies greaterthan ±10 cm propagate westward. A discontinuous fea-ture is also discernible around Paths 010 and 253, wherebottom topography effects from the Izu Ridge are ex-pected. The mean westward phase speed of the eddies isestimated to be 6.8 cm s–1, by calculating temporal lagcorrelation between the neighboring paths. This value ofthe phase speed is consistent with an estimate dividingthe spatial scale of 500 km by the temporal scale of 80days, obtained from the analyses of both the ADCP andT/P data. The propagating speed is also similar to thatestimated by previous studies in this region (e.g.,Imawaki, 1981; Aoki et al., 1995; Aoki and Imawaki,1996). Further discussion on the phase speed of the ed-dies will be given in the following section.
Spatial distribution of eddy activity, represented byroot-mean-squared (rms) amplitude of the filtered sea
54 N. Ebuchi and K. Hanawa
surface height anomaly, is shown in Fig. 15. The rmsamplitude was calculated in each of the data grids alongall the paths in Fig. 1 and was averaged along each pathover 1° in latitude. The contour plot in Fig. 15 was drawnby using theses points. High eddy activity is discerniblealong the Kuroshio and Kuroshio Extension. A region oflocal maximum extends from the Kuroshio Extension(around 31.5°N, 150°E) to the Kuroshio recirculation re-gion (29.5°N, 144°E) and south of Shikoku (28.5°N,135°E). This might be the propagation route of the cy-clonic and anticyclonic eddies investigated in this study.From this result, it could be speculated that these eddiesare generated in the Kuroshio Extension region, which isthe most energetic region in the North Pacific (Tai andWhite, 1990; Qiu et al., 1991; Aoki and Imawaki, 1996),and then propagate westward along the Kuroshio
recirculation to south of Japan. South of Kyushu, the ed-dies might disappear by merging into the Kuroshio. It canbe expected that the propagation route of the eddies isaffected by bottom topography effects and the locationof the Kuroshio recirculation. Further discussion of thegeneration of the eddies will be given in the followingsection.
4. DiscussionIn the previous section, the phase speed of westward
propagation of the cyclonic and anticyclonic eddies inthe Kuroshio recirculation region south of Japan is esti-mated to be 6.8 cm s–1. The phase speed of the westwardpropagation of mesoscale disturbances in the Gulf Streamand Kuroshio Extension regions have been discussed bycomparison with the phase speed of the baroclinic first-
Fig. 13. Results of lag-correlation analyses in time and space applied to the filtered sea surface height anomalies along Path 010at latitudes from 27 to 30°N. (a) The auto-correlation functions with temporal lag, (b) the cross correlation function withspatial lag, and (c) cross correlation coefficients with zonal spatial lag (see text). Distance in the horizontal axis of panels (b)and (c) is taken northward and eastward positive, respectively.
Mesoscale Eddies in the Kuroshio Recirculation Region 55
Fig. 15. Spatial distribution of root-mean-squared (rms) amplitudes of the filtered sea surface height anomaly (unit cm).
Fig. 14. Time-longitude diagram of the filtered sea surface heights in a region between 28 and 29°N, which is indicated by a thinoutline rectangle in Fig. 1. Horizontal axis represents locations of the T/P paths along the latitude band.
56 N. Ebuchi and K. Hanawa
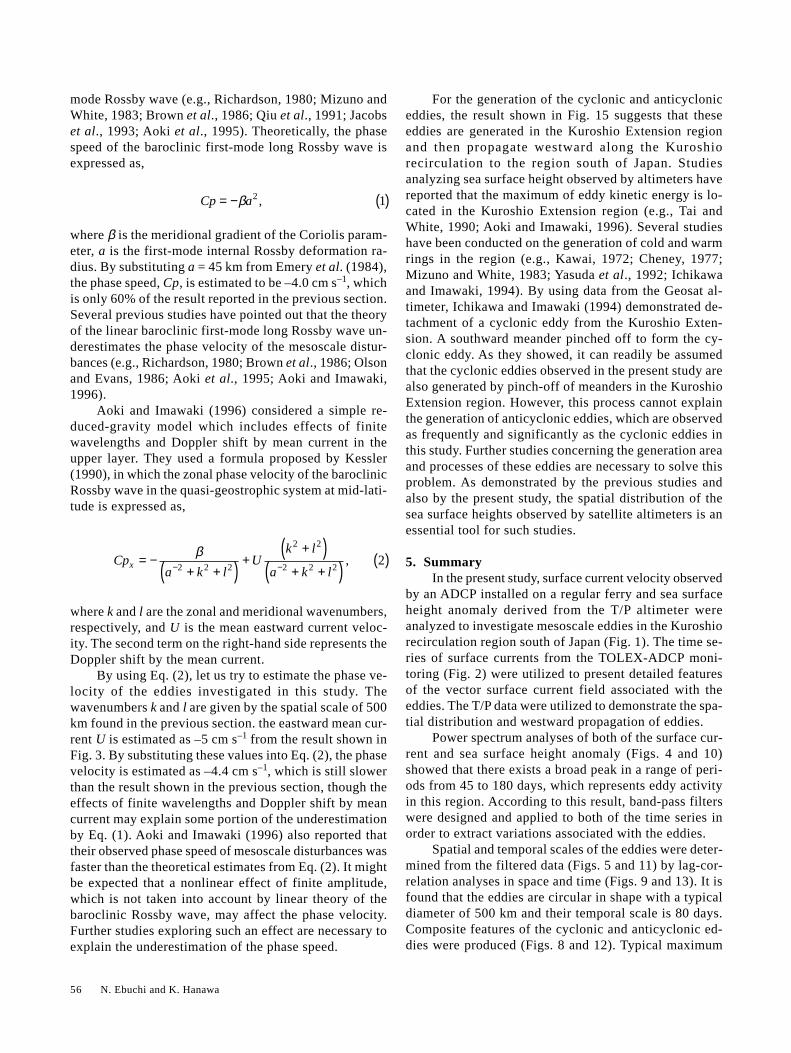
mode Rossby wave (e.g., Richardson, 1980; Mizuno andWhite, 1983; Brown et al., 1986; Qiu et al., 1991; Jacobset al., 1993; Aoki et al., 1995). Theoretically, the phasespeed of the baroclinic first-mode long Rossby wave isexpressed as,
Cp a= − ( )β 2 1,
where β is the meridional gradient of the Coriolis param-eter, a is the first-mode internal Rossby deformation ra-dius. By substituting a = 45 km from Emery et al. (1984),the phase speed, Cp, is estimated to be –4.0 cm s–1, whichis only 60% of the result reported in the previous section.Several previous studies have pointed out that the theoryof the linear baroclinic first-mode long Rossby wave un-derestimates the phase velocity of the mesoscale distur-bances (e.g., Richardson, 1980; Brown et al., 1986; Olsonand Evans, 1986; Aoki et al., 1995; Aoki and Imawaki,1996).
Aoki and Imawaki (1996) considered a simple re-duced-gravity model which includes effects of finitewavelengths and Doppler shift by mean current in theupper layer. They used a formula proposed by Kessler(1990), in which the zonal phase velocity of the baroclinicRossby wave in the quasi-geostrophic system at mid-lati-tude is expressed as,
Cpa k l
Uk l
a k lx = −
+ +( ) ++( )
+ +( ) ( )− −β
2 2 2
2 2
2 2 22,
where k and l are the zonal and meridional wavenumbers,respectively, and U is the mean eastward current veloc-ity. The second term on the right-hand side represents theDoppler shift by the mean current.
By using Eq. (2), let us try to estimate the phase ve-locity of the eddies investigated in this study. Thewavenumbers k and l are given by the spatial scale of 500km found in the previous section. the eastward mean cur-rent U is estimated as –5 cm s–1 from the result shown inFig. 3. By substituting these values into Eq. (2), the phasevelocity is estimated as –4.4 cm s–1, which is still slowerthan the result shown in the previous section, though theeffects of finite wavelengths and Doppler shift by meancurrent may explain some portion of the underestimationby Eq. (1). Aoki and Imawaki (1996) also reported thattheir observed phase speed of mesoscale disturbances wasfaster than the theoretical estimates from Eq. (2). It mightbe expected that a nonlinear effect of finite amplitude,which is not taken into account by linear theory of thebaroclinic Rossby wave, may affect the phase velocity.Further studies exploring such an effect are necessary toexplain the underestimation of the phase speed.
For the generation of the cyclonic and anticycloniceddies, the result shown in Fig. 15 suggests that theseeddies are generated in the Kuroshio Extension regionand then propagate westward along the Kuroshiorecirculation to the region south of Japan. Studiesanalyzing sea surface height observed by altimeters havereported that the maximum of eddy kinetic energy is lo-cated in the Kuroshio Extension region (e.g., Tai andWhite, 1990; Aoki and Imawaki, 1996). Several studieshave been conducted on the generation of cold and warmrings in the region (e.g., Kawai, 1972; Cheney, 1977;Mizuno and White, 1983; Yasuda et al., 1992; Ichikawaand Imawaki, 1994). By using data from the Geosat al-timeter, Ichikawa and Imawaki (1994) demonstrated de-tachment of a cyclonic eddy from the Kuroshio Exten-sion. A southward meander pinched off to form the cy-clonic eddy. As they showed, it can readily be assumedthat the cyclonic eddies observed in the present study arealso generated by pinch-off of meanders in the KuroshioExtension region. However, this process cannot explainthe generation of anticyclonic eddies, which are observedas frequently and significantly as the cyclonic eddies inthis study. Further studies concerning the generation areaand processes of these eddies are necessary to solve thisproblem. As demonstrated by the previous studies andalso by the present study, the spatial distribution of thesea surface heights observed by satellite altimeters is anessential tool for such studies.
5. SummaryIn the present study, surface current velocity observed
by an ADCP installed on a regular ferry and sea surfaceheight anomaly derived from the T/P altimeter wereanalyzed to investigate mesoscale eddies in the Kuroshiorecirculation region south of Japan (Fig. 1). The time se-ries of surface currents from the TOLEX-ADCP moni-toring (Fig. 2) were utilized to present detailed featuresof the vector surface current field associated with theeddies. The T/P data were utilized to demonstrate the spa-tial distribution and westward propagation of eddies.
Power spectrum analyses of both of the surface cur-rent and sea surface height anomaly (Figs. 4 and 10)showed that there exists a broad peak in a range of peri-ods from 45 to 180 days, which represents eddy activityin this region. According to this result, band-pass filterswere designed and applied to both of the time series inorder to extract variations associated with the eddies.
Spatial and temporal scales of the eddies were deter-mined from the filtered data (Figs. 5 and 11) by lag-cor-relation analyses in space and time (Figs. 9 and 13). It isfound that the eddies are circular in shape with a typicaldiameter of 500 km and their temporal scale is 80 days.Composite features of the cyclonic and anticyclonic ed-dies were produced (Figs. 8 and 12). Typical maximum
Mesoscale Eddies in the Kuroshio Recirculation Region 57
velocity and sea surface height anomaly associated withthe eddies are found to be 15–20 cm s–1 and 15 cm, re-spectively. It is also pointed out that the frequency ofoccurrence, temporal and spatial scales, and intensity areall nearly the same for the cyclonic and anticyclonic ed-dies. These eddies are considered to be successive wave-like disturbances rather than solitary eddies.
From the time-longitude diagram of the filtered seasurface height anomaly (Fig. 14), the phase velocity ofwestward propagation of the eddies is estimated as 6.8cm s–1, which is faster than the theoretical estimationbased on the baroclinic first-mode Rossby wave. The spa-tial distribution of sea surface height variations (Fig. 15)suggests that these eddies might be generated in theKuroshio Extension region and propagate westward in theKuroshio recirculation, though further studies are neededto clarify the generation processes.
AcknowledgementsWe are grateful to the captain and crew of the ferry
“Ogasawara Maru” and Ogasawara Kaiun Co. for theircooperation to the TOLEX monitoring. The SLA altim-eter products utilized in the present study are supplied bythe CLS Space Oceanography Division, Toulouse, France.The present study is partially supported by Grants-in-Aidfor Scientific Research (project No. 09440165) and foran International Cooperative Research Project (projectNo. 10044088), and the NEAR-GOOS (North East AsianRegional-Global Ocean Observing System) Project, fromthe Ministry of Education, Science and Culture, Japan.
ReferencesAoki, S. and S. Imawaki (1996): Eddy activities of the surface
layer in the western North Pacific detected by satellite al-timeter and radiometer. J. Oceanogr., 52, 457–474.
Aoki, S., S. Imawaki and K. Ichikawa (1995): Baroclinic dis-turbances propagating westward in the Kuroshio Extensionregion as seen by a satellite altimeter and radiometers. J.Geophys. Res., 100, 839–855.
AVISO/Altimetry (1996): AVISO User Handbook for Sea LevelAnomaly Altimeter Products (edition 2.0), AVI-NT-011-312-CN, CLS Space Oceanography Division, Toulouse, France.
Brown, O. B., P. C. Comillon, S. R. Emmerson and H. M. Carle(1986): Gulf Stream warm rings: A statistical study of theirbehavior. Deep-Sea Res., 33, 1459–1473.
Cheney, R. E. (1977): Synoptic observations of the oceanic fron-tal system east of Japan. J. Geophys. Res., 82, 5459–5468.
Cheney, R. E., P. L. Richardson and K. Nagasaka (1980): Track-ing a Kuroshio cold ring with a free-drifting surface buoy.Deep-Sea Res., 27, 641–654.
Ebuchi, N. and K. Hanawa (1995): Comparison of surface cur-rent variations observed by TOPEX altimeter with TOLEX-ADCP data. J. Oceanogr., 51, 351–362.
Emery, W. J., W. G. Lee and L. Magaard (1984): Geographicand seasonal distributions of Brunt-Väisälä-frequency andRossby radii in the North Pacific and North Atlantic. J. Phys.
Oceanogr., 14, 294–317.Fu, L. L., E. J. Christensen, C. A. Yamarone, M. Lefebvre, Y.
Menard, M. Dorrer and P. Escudier (1994): TOPEX/POSEIDON mission overview. J. Geophys. Res., 99,24,369–24,381.
Hanawa, K. and Y. Yoshikawa (1993): TOLEX-XBT/ADCPmonitoring. Ext. Abst. Int. WCRP Symp.—Clouds and Oceanin Climate—, Nagoya, Japan, 3.25–3.27.
Hanawa, K., Y. Yoshikawa and T. Taneda (1996): TOLEX-ADCP monitoring. Geophys. Res. Lett., 23, 2429–2432.
Ichikawa, K. and S. Imawaki (1994): Life history of a cyclonicring detached from the Kuroshio Extension as seen by theGeosat altimeter. J. Geophys. Res., 99, 15,953–15,966.
Imawaki, S. (1981): Vertical structure and horizontal scale ofthe mesoscale baroclinic variability in the western NorthPacific. La mer, 19, 85–92.
Jacobs, G. A., W. J. Emery and G. H. Born (1993): Rossby wavesin the Pacific Ocean extracted from Geosat altimeter data.J. Phys. Oceanogr., 23, 1155–1175.
Kawai, H. (1972): Hydrography of the Kuroshio Extension. p.235–352. In Kuroshio; Its Physical Aspects, ed. by H.Stommel and K. Yoshida, Univ. Tokyo. Press, Tokyo, Ja-pan.
Kessler, W. B. (1990): Observation of long Rossby waves inthe northern tropical Pacific. J. Geophys. Res., 95, 5183–5217.
Kitano, K. (1975): Some properties of the warm eddies gener-ated in the confluence zone of the Kuroshio and OyashioCurrents. J. Phys. Oceanogr., 5, 245–252.
Kizu, S., T. Taneda and K. Hanawa (1999): Estimation of tidalconstituents from the TOLEX-ADCP data. J. Oceanogr.(submitted).
Mizuno, K. and W. B. White (1983): Annual and interannualvariability in the Kuroshio current system. J. Phys.Oceanogr., 13, 1847–1867.
Olson, D. B. and R. H. Evans (1986): Rings of the AgulhasCurrent. Deep-Sea Res., 33, 27–42.
Qiu, B., K. A. Kelly and T. M. Joyce (1991): Mean flow andvariability in the Kuroshio Extension from Geosat altimetrydata. J. Geophys. Res., 96, 18,491–18,507.
Richardson, P. L. (1980): Gulf Stream ring trajectories. J. Phys.Oceanogr., 10, 90–104.
Richardson, P. L., C. Maillard and T. B. Stanford (1979): Thephysical structure and life history of cyclonic Gulf Streamring Allen. J. Geophys. Res., 84, 7727–7741.
Ring Group (1981): Gulf Stream cold-core rings: Their phys-ics, chemistry and biology. Science, 212, 1091–1100.
Tai, C. K. and W. B. White (1990): Eddy variability in theKuroshio Extension as revealed by Geosat altimetry; En-ergy propagation away form the jet, Reynolds stress, andseasonal cycle. J. Phys. Oceanogr., 20, 1761–1777.
Yasuda, I., K. Okuda and M. Hirai (1992): Evolution of aKuroshio warm-core ring: Variability of the hydrographicstructure. Deep-Sea Res., 39, suppl. 1, S131–S161.
Yoshikawa, Y., K. Ando, H. Mitsudera, K. Muneyama and K.Hanawa (1996): Data report: Tokyo-Ogasawara Line Ex-periment XBT monitoring, 1988–1995. JAMSTEC DataReport, JAMSTEC, Yokosuka, Japan, 102 pp.