Embed Size (px)
Citation preview
Mesoscale Atmospheric Systems Radar meteorology (part 2) 11 March 2014 Heini Wernli
Today‘s topics - Stratiform precipitation & the „bright band“
- Doppler radar à wind observation
- Polarimetric radar à microphysical information
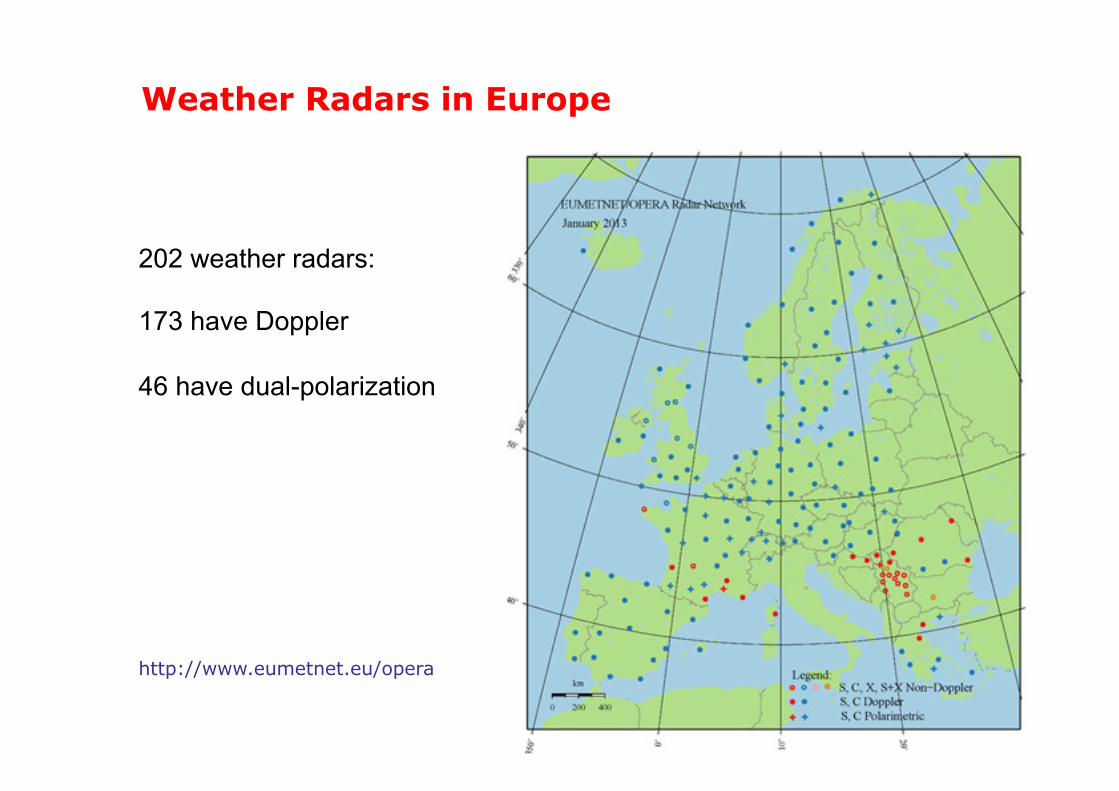
Weather Radars in Europe
202 weather radars:
173 have Doppler
46 have dual-polarization
http://www.eumetnet.eu/opera
Useful radar webpages
§ MeteoSwiss » www.meteoschweiz.ch
§ nowcasting of precipitation (ETH spinoff) » www.meteoradar.ch
§ tornadic phenomena around Switzerland » www.tordach.org/ch
§ European composite » www.meteox.com

Stratiform precipitation and the “bright band”
§ vertical wind < ~ 1 m/s § horizontal scale ~ 100 km § stable stratification § external lifting through, e.g., fronts, orography § in polar regions and in midlatitudes in winter

The bright band Circular symmetry implies a reflectivity field that is horizontally stratified.
Close to the radar, the signal comes from a region where T>0°C (rain) Far away from the radar, the signal comes from a region where T<0°C (snow). The “bright band” indicates the region where snow flakes are melting.
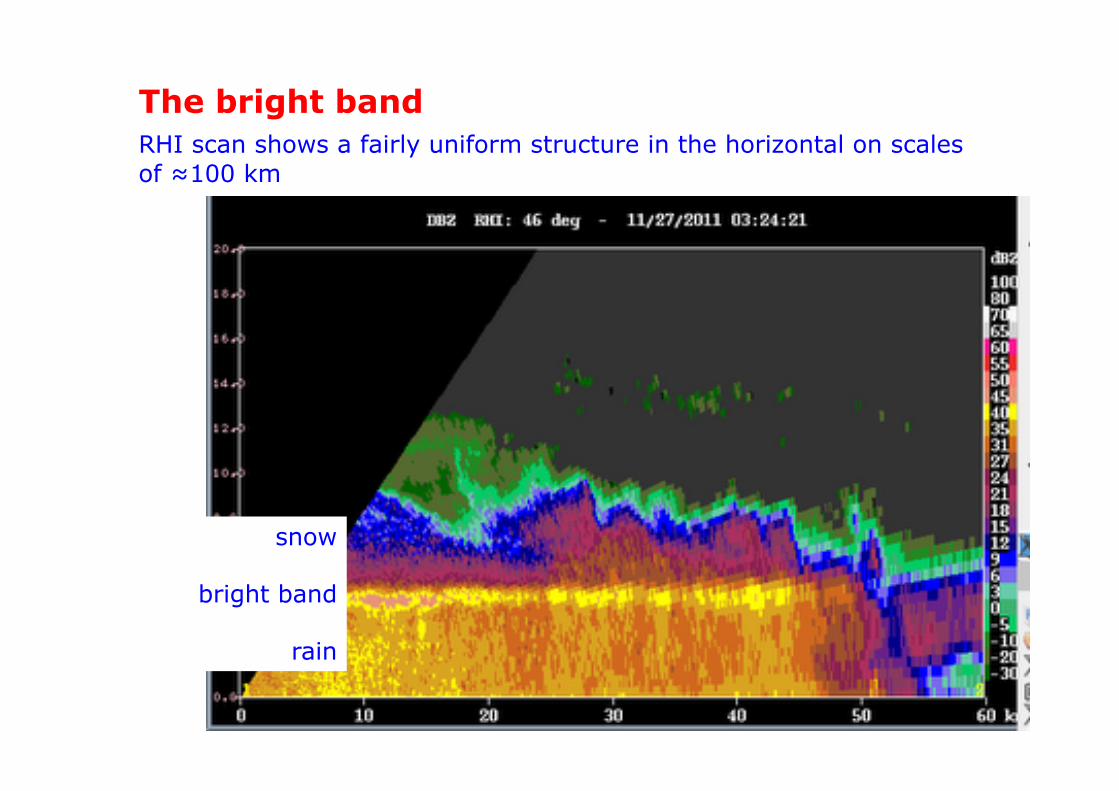
The bright band RHI scan shows a fairly uniform structure in the horizontal on scales of ≈100 km
snow
bright band
rain

The physics of the bright band
As snowflakes fall into air warmer than 0°C, their radar reflectivity increases for several reasons:
1. the dielectric constant of water exceeds that of ice by about 5 dB
2. in its initial stage, melting produces distorted snowflakes with higher reflectivities than those of spherical drops of the same mass
3. raindrops fall faster than snowflakes (6 ms-1 vs. 1.5 ms-1), which reduces their concentration in space. This dilution effect accounts in part for the decrease in reflectivity in the lower part of the melting layer
4. if large rain drops break up further reduction in reflectivity occurs

Bright band in a convective situation?

Doppler velocity
§ The echo of a moving particle from a pulse 1 has the phase
§ For the succeeding pulse 2 will, the particle will have moved thus the new phase for pulse 2 is
§ From the distance the particle has moved in the meantime we can calculate its velocity along the radar beam:
( )πλ
πλ
4PRF
4PRF
PRF/11212 ⋅⋅ΔΦ
=⋅⋅Φ−Φ
=−
=Δ
Δ=
rrtrv
λπ22 1
01r
+Φ=Φ
λπ22 2
02r
+Φ=Φ
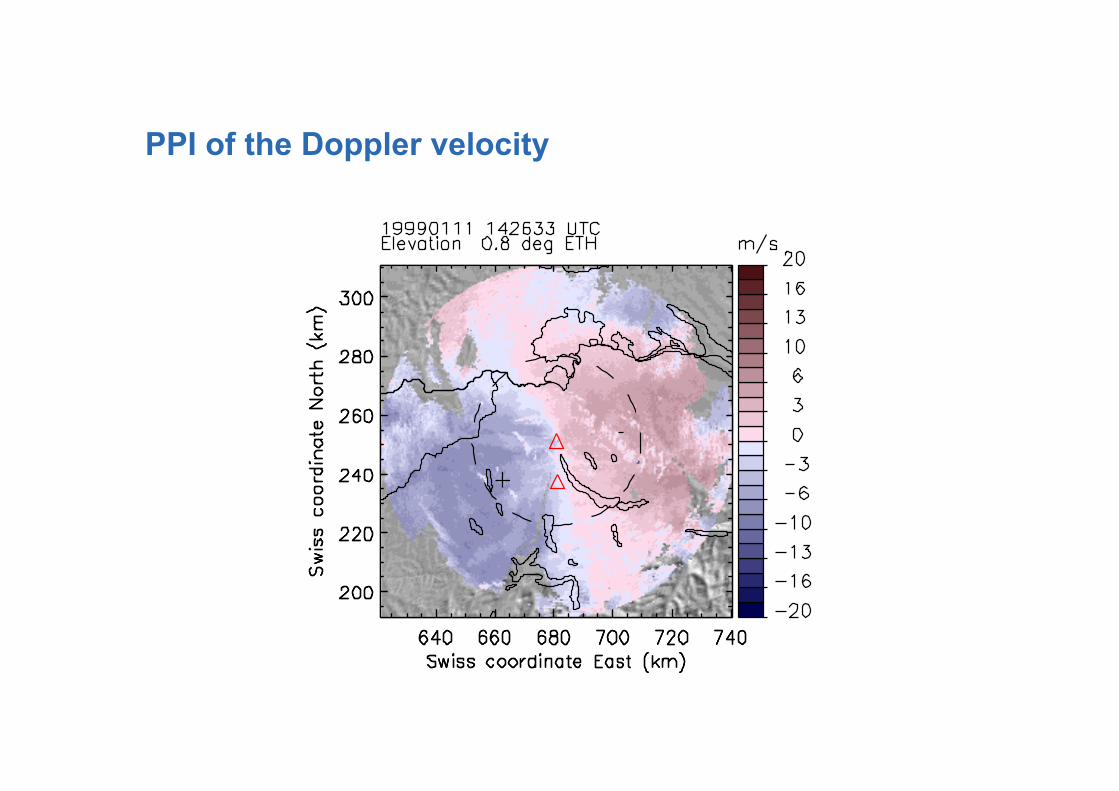
PPI of the Doppler velocity

Real Doppler field of circulation

Real Doppler field of convergent flow
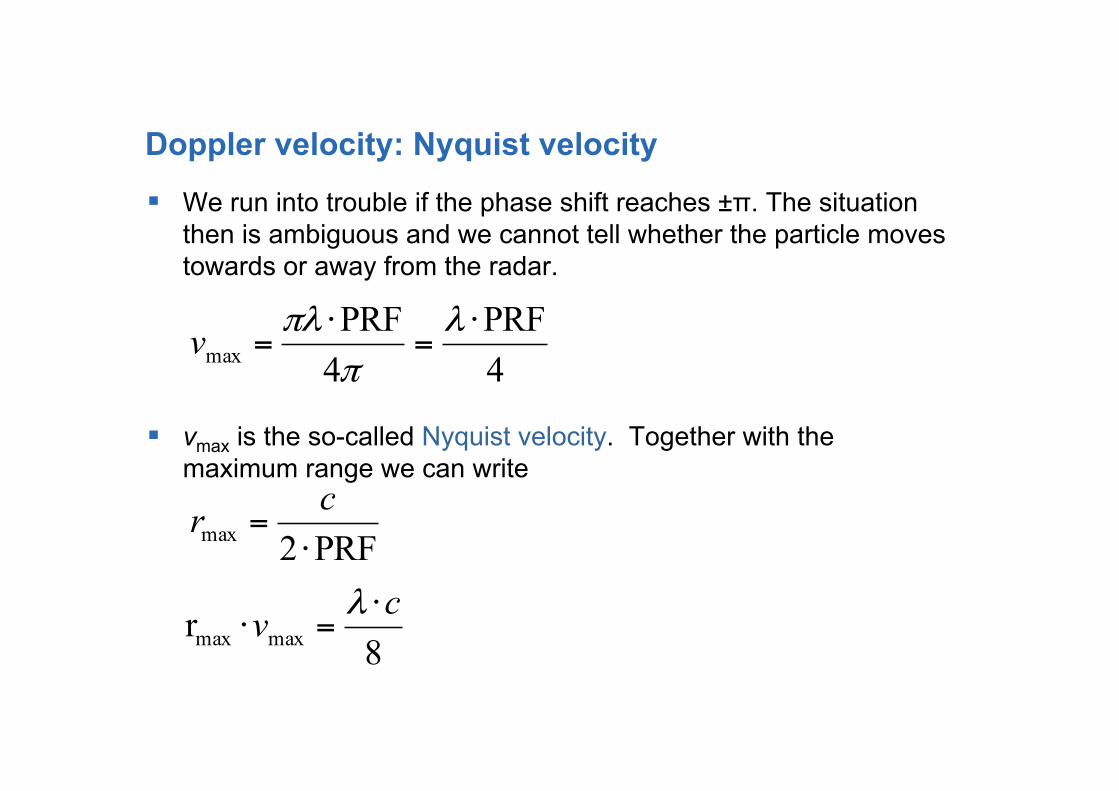
Doppler velocity: Nyquist velocity
§ We run into trouble if the phase shift reaches ±π. The situation then is ambiguous and we cannot tell whether the particle moves towards or away from the radar.
§ vmax is the so-called Nyquist velocity. Together with the maximum range we can write
4PRF
4PRF
max⋅
=⋅
=λ
ππλv
PRF2max ⋅=
cr
8r maxmax
cv ⋅=⋅λ
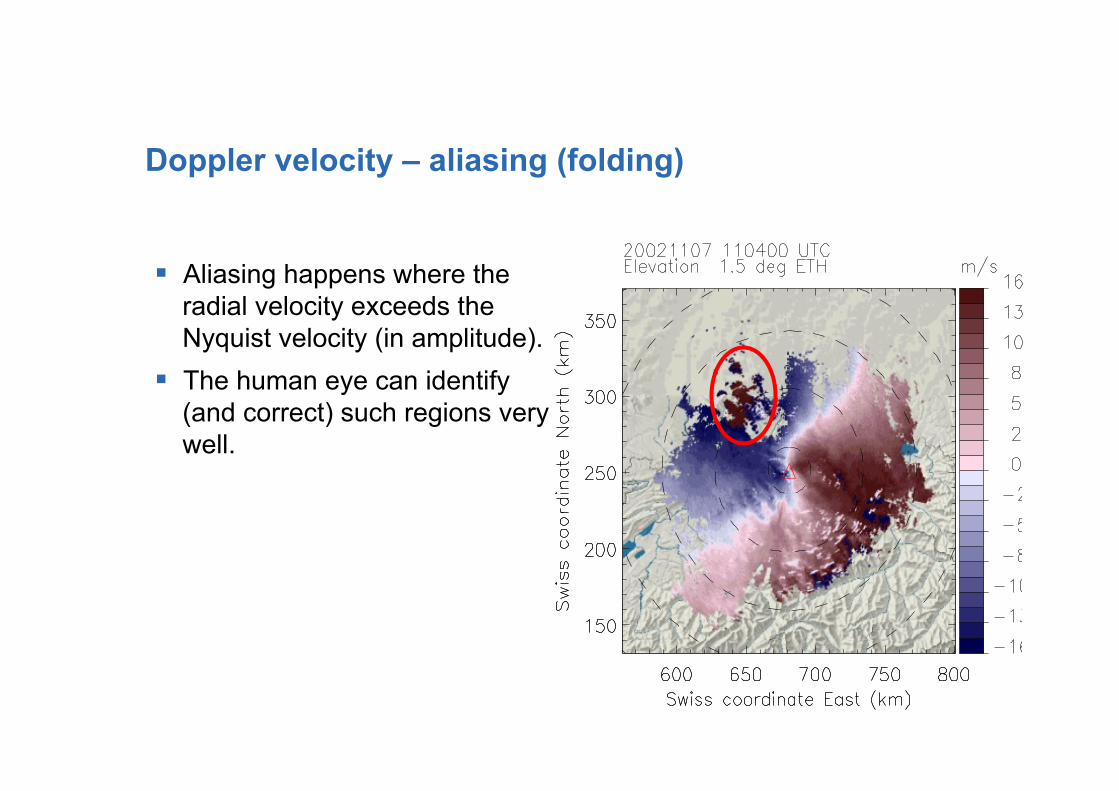
Doppler velocity – aliasing (folding)
§ Aliasing happens where the radial velocity exceeds the Nyquist velocity (in amplitude).
§ The human eye can identify (and correct) such regions very well.
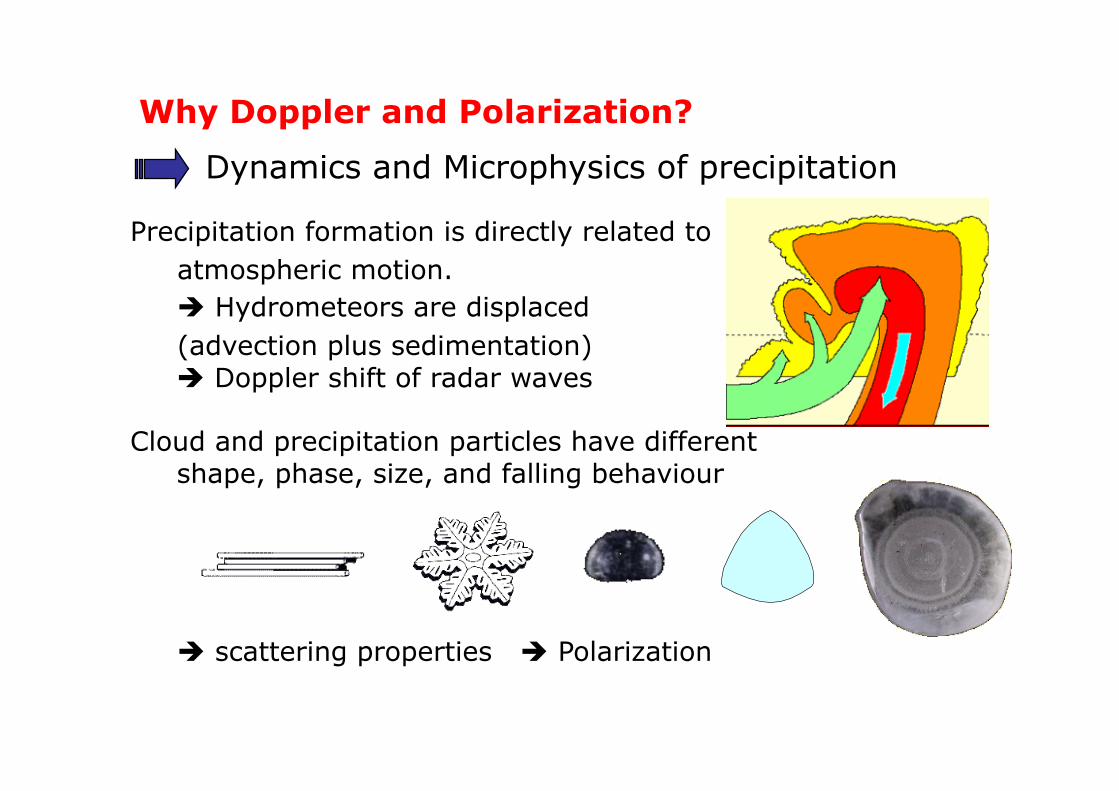
Precipitation formation is directly related to atmospheric motion. è Hydrometeors are displaced (advection plus sedimentation) è Doppler shift of radar waves
Cloud and precipitation particles have different
shape, phase, size, and falling behaviour
è scattering properties è Polarization
Why Doppler and Polarization?
Dynamics and Microphysics of precipitation
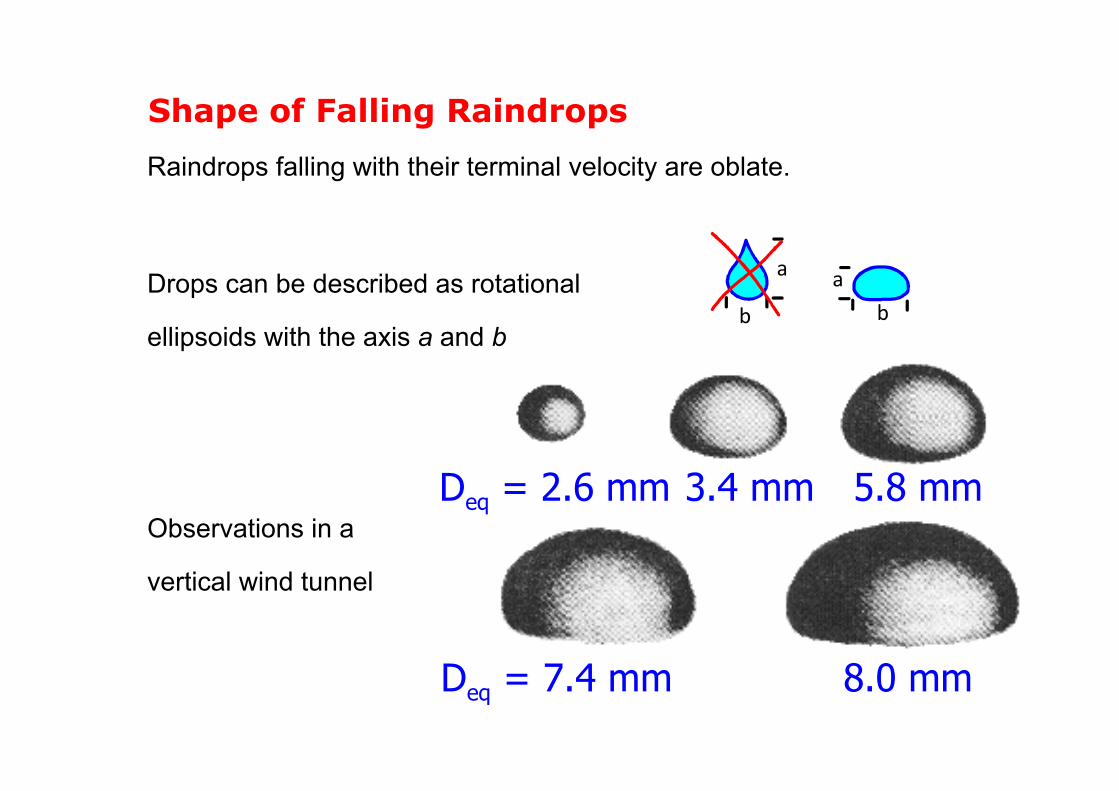
Shape of Falling Raindrops Raindrops falling with their terminal velocity are oblate.
Drops can be described as rotational
ellipsoids with the axis a and b
Observations in a
vertical wind tunnel
(Pruppacher & Klett)
baa
b
Deq = 2.6 mm 3.4 mm 5.8 mm
Deq = 7.4 mm 8.0 mm

Polarimetric Radar Observations
§ The polarization of an electromagnetic wave is defined by the
orientation of the electrical field vector E
§ Conventional Doppler radars use horizontal linear polarization only

Polarimetric Radar Observations
§ Dual polarization mode
simultaneous H and V
transmit and receive
- simple technical realization
- possible contamination by
strong depolarization in
melting layer
Rain Graupel Hail
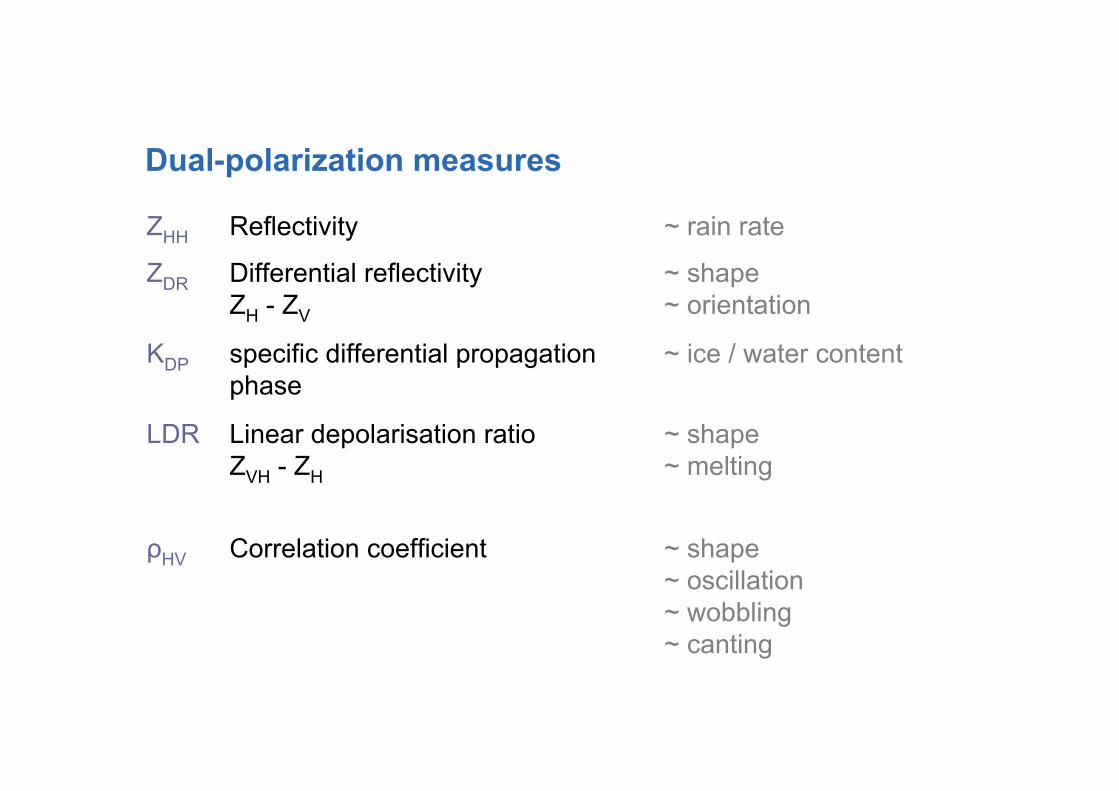
ZHH Reflectivity ~ rain rate ZDR Differential reflectivity
ZH - ZV ~ shape ~ orientation
KDP specific differential propagation phase
~ ice / water content
LDR Linear depolarisation ratio ZVH - ZH
~ shape ~ melting
ρHV Correlation coefficient ~ shape ~ oscillation ~ wobbling ~ canting
Dual-polarization measures

Differential Reflectivity (ZDR)
Differential reflectivity is the ratio between horizontal and vertical
reflectivity factor
using zH, zV in mm6 m3, or ZH, ZV in dBZ.
§ positive ZDR is caused by oblate
particles.
§ ZDR depends on particle shape, orientation and falling behaviour.
§ Note: Polarimetric quantities are only available for rainfall rates above
a certain value, since small raindrops are spherical.
dB unit = orlog VHzz ZZZDR10=ZDRVH −⎟⎠
⎞⎜⎝
⎛
Z H Z V
V
H
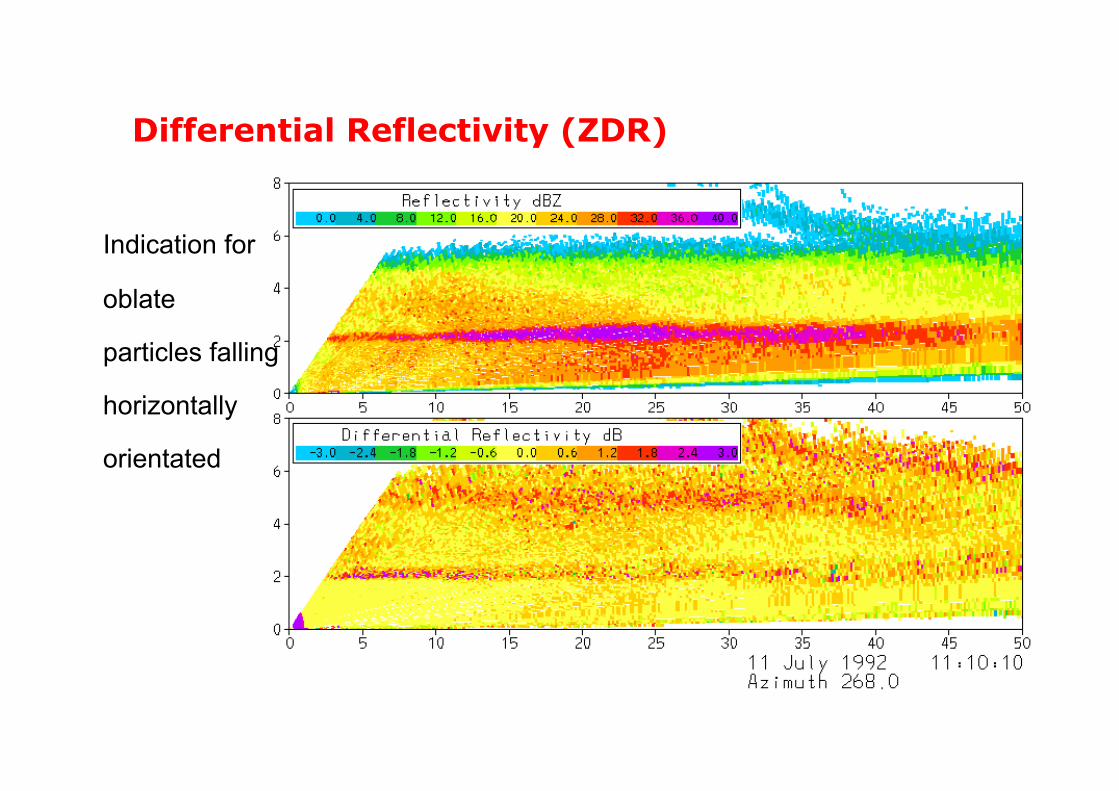
Differential Reflectivity (ZDR)
Indication for
oblate
particles falling
horizontally
orientated

Differential Reflectivity (ZDR)
§ ZDR can be used to identify insects and birds in clear air echoes
§ Rain: ZDR 0 – 5 dB
§ Insects ZDR 5 – 10 dB
Z ZDR
POLD
IRAD
at
Wal
tenh
eim
-sur
-Zor
n

Linear Depolarization Ratio (LDR) The linear depolarization ratio LDR describes the ratio of cross-polar
reflectivity to co-polar reflectivity
§ using zVH, zH in mm6 m-3 or ZVH, ZH in dBZ.
§ LDR is caused by particles which are rotated to the polarization plane.
§ LDR is weighted by reflectivity.
§ LDR depends on the shape of the particles, their orientation and their falling behaviour.
dB) unit( = LDRorlog HVHzz ZZ10 = LDR
HVH −⎟
⎠
⎞⎜⎝
⎛

Indication for oblate particles falling irregularly or canted
Linear Depolarization Ratio (LDR)
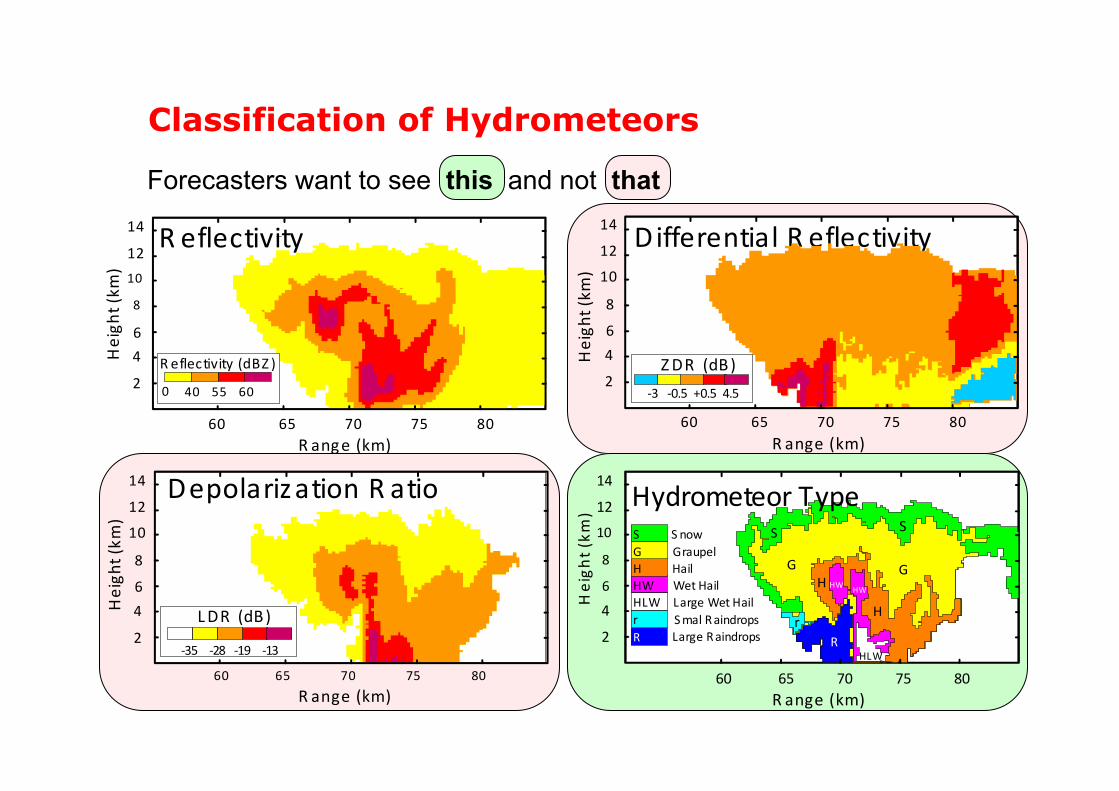
Forecasters want to see this and not that
Differential R eflectivity
R ange (km)
Heigh
t (km
)
60 65 70 75 80
2
46
8
10
12
14
40 55 600
Heigh
t (km
)
2
46
8
10
12
14
R ange (km)60 65 70 75 80
ZDR (dB)-‐3 -‐0.5 +0.5 4.5
Heigh
t (km
)
2
46
8
10
12
14
60 65 70 75 80R ange (km)
LDR (dB)
-‐35 -‐28 -‐19 -‐13
R eflectivity
Depolarization R atio
R Large Raindrops
G
S S
rR
GH
H
HW HW
HLW
Hydrometeor Type
2
46
8
10
12
14
Heigh
t (km
)
S S nowG GraupelH HailHW Wet HailHLW Large Wet Hailr Smal RaindropsR
R eflectivity (dBZ )
R ange (km)60 65 70 75 80
Classification of Hydrometeors

Classification of Hydrometeors
From observations and theoretical or practical considerations we know:
Z (dBZ)
ZDR (dB)
KDP (°/km)
ρHV(0) LDR (dB)
Rain 10 – 55 0 – 5 0 – 10 ≈ 1.0 < -30
Ice crystals < 15 0 – 2 0 ≈ 0.99 < -30
Snow aggregates
< 25 0 – 2 0 ≈ 0.99 < -30
Graupel up to 40 ≈ 0 ≈ 0 > 0.95 < 0.95 melting
< -30 < -25 melting
Hail up to 70 ≈ 0
≈ 0
0.9 – 0.95 < 0.9 melting
> -25 -25 – -15 melting

Z (dBZ)
ZDR (dB)
KDP (°/km)
ρHV(0) LDR (dB)
Insects < 5 5 – 10 ? 0.9 – 1.0 ? < -30 ?
Birds < 5 3 – 6 ? 0.9 – 1.0 ? < -30 ?
Chaff < 5 0 – 6 ? < 0.3 > -20
Ground clutter
any noisy noisy 1 stopped < 0.6 rotating antenna
> -20
Classification of Hydrometeors
From observations and theoretical or practical considerations we know:
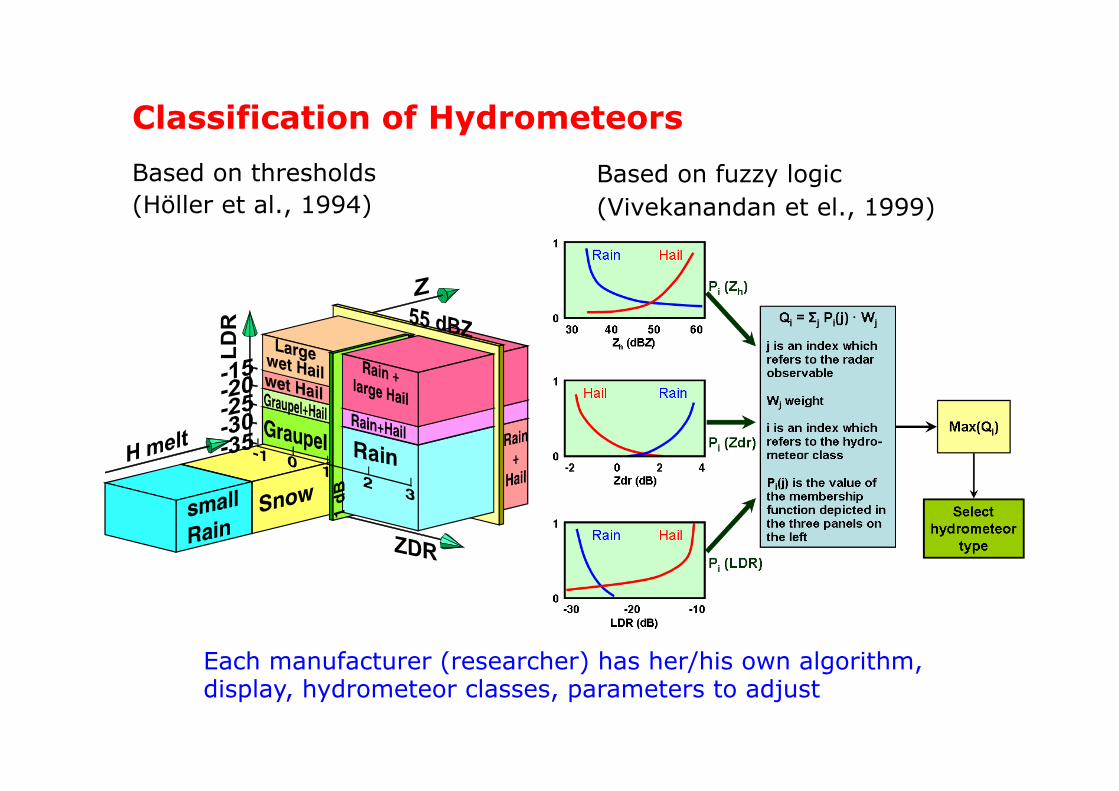
Based on thresholds (Höller et al., 1994)
Based on fuzzy logic (Vivekanandan et el., 1999)
LDR
Each manufacturer (researcher) has her/his own algorithm, display, hydrometeor classes, parameters to adjust
Classification of Hydrometeors
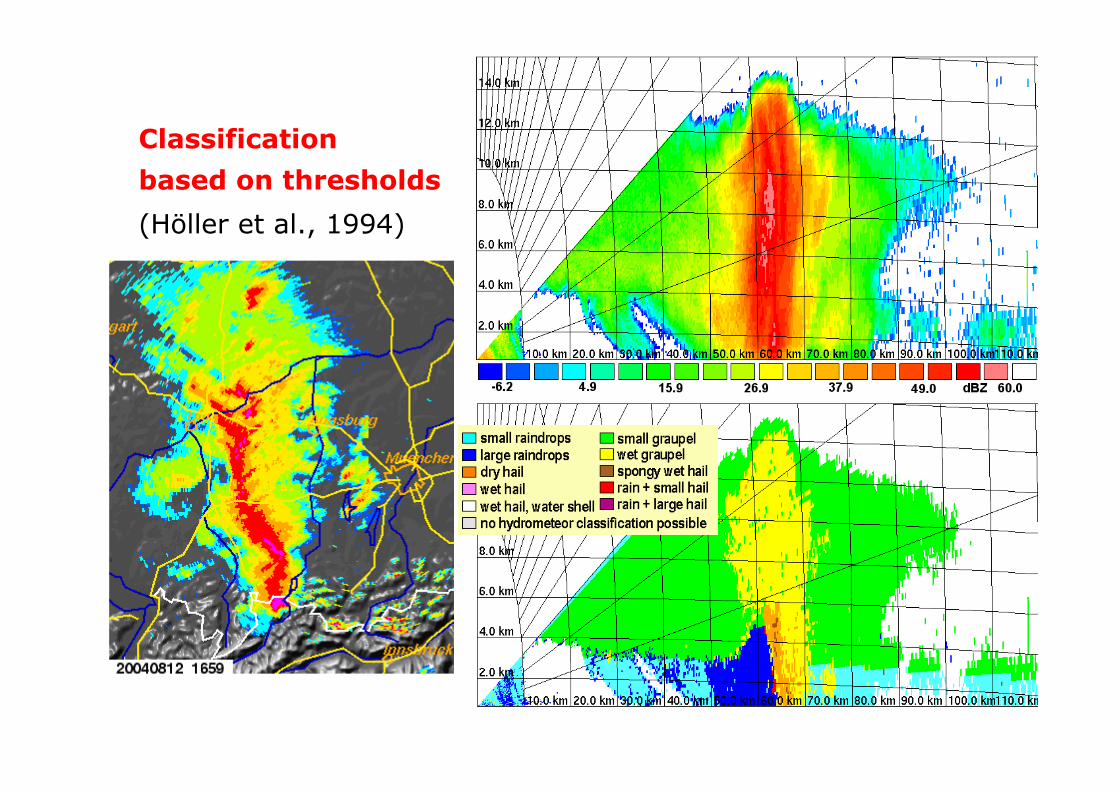
Classification based on thresholds (Höller et al., 1994)
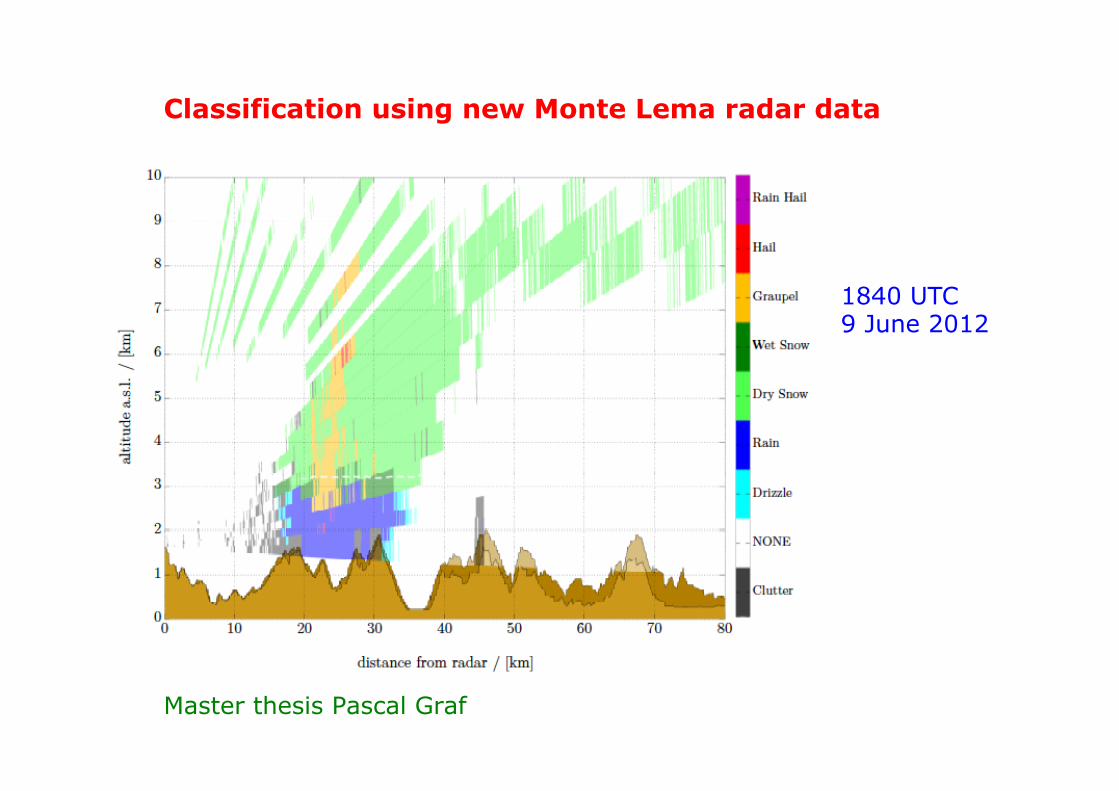
Classification using new Monte Lema radar data Master thesis Pascal Graf
1840 UTC 9 June 2012