Embed Size (px)
Citation preview

2007 ANNuAl REPoRt
we areINvEStMENt BANkINg | EQuIty RESEARCh | INStItutIoNAl SERvICES
PRIMARy MARkEt RESEARCh | ASSEt MANAgEMENt | CoRPoRAtE & vENtuRE SERvICES
M e r r i M a n C u r h a n F o r d
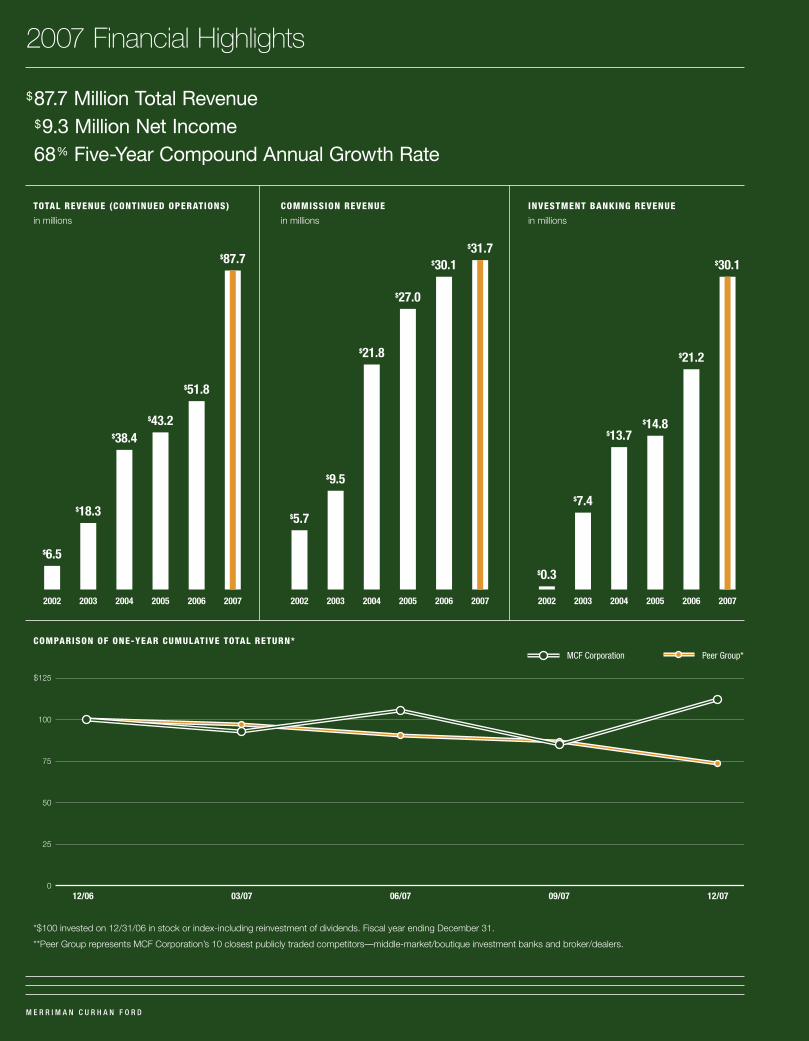
0
25
50
75
100
$125
12/06 03/07 06/07 09/07 12/07
COMPARISON OF ONE-YEAR CUMULATIVE TOTAL RETURN*
*$100 invested on 12/31/06 in stock or index-including reinvestment of dividends. Fiscal year ending December 31.
**Peer Group represents MCF Corporation’s 10 closest publicly traded competitors—middle-market/boutique investment banks and broker/dealers.
Peer Group**MCF Corporation
COMMISSION REVENUE
in millions
20062005200420032002
$30.1
2007
$31.7
$27.0
$21.8
$9.5
$5.7
TOTAL REVENUE (CONTINUED OPERATIONS)
in millions
20062005200420032002
$51.8
2007
$87.7
$43.2$38.4
$18.3
$6.5
INVESTMENT BANKING REVENUE
in millions
20062005200420032002
$21.2
2007
$30.1
$14.8$13.7
$7.4
$0.3
$87.7 Million Total Revenue $9.3 Million Net Income 68% Five-Year Compound Annual Growth Rate
2007 Financial Highlights

M e r r i M a n C u r h a n F o r d p a g e 1
We are Merriman Curhan Ford—one team dedicated to our clients’ financial success and to delivering value for our stockholders. We are a financial services firm focused on fast-growing companies and their institutional investors. We are committed to these growth industry sectors:
C l e a n T e C h
We launched our CleanTech industry practice nearly four years ago, making us one of the first Wall Street firms to devote significant resources to the sector. Today, our expertise in CleanTech runs deep. Led by our president, Greg Curhan, our seven-member CleanTech finance team has completed more than $1 billion in financings for corporate issuers.
Our equity research team comprises three industry expert sell-side analysts who cover more than 30 companies in next-generation energy, advanced hydrocarbon technologies and energy storage. Each year we showcase our market insight at our annual CleanTech Conference—now in its fourth year. We also provide primary market research to CleanTech corporate clients and institutional investors through Panel Intelligence.
C o n s u m e r
We help entrepreneurial startups and growth-oriented consumer and retail companies as they bring fresh ideas to market every day.
Our consumer equity research analysts are among the top in the industry, regularly ranking at or near the top of their categories in The Wall Street Journal’s “Best on the Street” as well as the Forbes/Starmine annual rankings. Our consumer analysts have built reputations by discovering strong companies in the early stages of their growth and spotting emerging trends in their sector, including athletic life-style, branded consumer, health and wellness and specialty retail.
We have also raised more than $1 billion for our consumer industry corporate clients, completing more than 35 transactions.
h e a l T h C a r e
Advancements in genetics, drug discovery and related life science technologies continue to drive new product development. Throughout the commercialization process, we provide growth capital and strategic advice to preclinical startups and well-established medical device and biopharma companies.
Currently, we have three equity research analysts who cover more than 40 companies leading advance-ments in biotechnology, medical technologies and pharmaceuticals.
Our health care finance team, which we expanded in June 2007, has completed 25 transactions for public and private health care companies and raised more than $750 million.
In addition, our primary market research platform, Panel Intelligence, was developed for health care industry clients and institutional investors. It continues to serve the top 10 biotechnology, pharmaceu-tical and medical device companies.
T e C h / m e d i a / T e l e C o m ( T m T )
In recent years, developments in these key industries have accelerated, making TMT one of the hottest growth sectors. As a result, our TMT finance team has completed more than 40 transactions for our corporate clients, both public and private, raising more than $1.3 billion since 2002.
Each year, we host an IP Video Conference to bring together institutional investors and executives from fast-growing TMT companies. Leading the conference are our TMT equity research analysts, who provide unique insights on more than 70 Internet, data center, communication technology, broadband access, telecom and wireless companies.
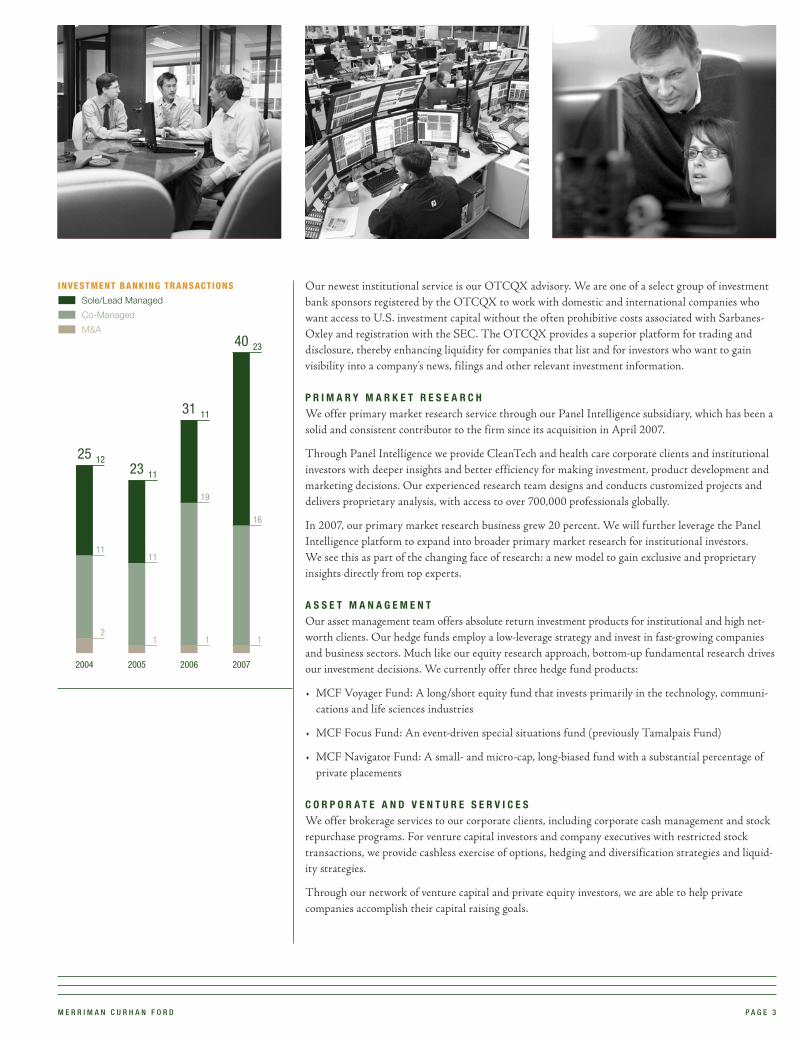
INVESTMENT BANKING TRANSACTIONS BY EXPERTISE2007 Transactions
26%
Tech/Media/Telecom
20%
Consumer
23%
Health Care
28%
CleanTech
3%
China
EQUITY RESEARCH COVERAGE BY INDUSTRYas of 12/31/07
47%
Tech/Media/Telecom
22%
Consumer20%
Health Care
11%
CleanTech
Ident If y Ing fu t ure Indus try Le aders
In early 2008, our equity research analysts selected their
picks of small-cap companies that we believe have the
capability to obtain a $1 billion market capitalization and
create sustainable market leadership in their respective
industries. This is an example of how we strive to be first
to identify fast-growing companies and themes within our
industry sectors.
Who We Are

p a g e 2 M e r r i M a n C u r h a n F o r d
We provide high-quality investment banking, research and trade execution to growth companies and institutional investors. We bring fresh financial ideas to our clients with the highest degree of integrity and camaraderie in all our interactions, while also delivering shareholder value.
i n v e s T m e n T B a n k i n g
We offer investment banking and advisory services to our corporate clients and growth-oriented insti-tutional investors in each of our four industry sectors as well as in the emerging China market. By combining our proven capital market and advisory execution capabilities with our deep domain expertise in our coverage sectors, we are able to provide our clients with sound financial and strategic advice. And through our suite of financing options and advisory services, including M&A and private placements, we are able to address the particular needs of each of our clients.
Since 2002, we have raised more than $4 billion for our clients. And in 2007 alone, we completed 40 investment banking transactions with average fees exceeding $700,000, which resulted in revenue of more than $30 million.
e q u i T y r e s e a r C h
Solid fundamental analysis is at the core of everything we do and drives our business decisions. As such, we view equity research as the “point of the arrow” among our services. Our team of 16 research analysts conducts bottom-up, fundamental coverage of more than 180 fast-growing, small-cap compa-nies in each of our four industry sectors. Our research analysts focus on companies that have little or no research coverage from other firms. By picking up coverage of these under-followed companies, we are able to help clients spot strong growth opportunities early that otherwise might pass below the radar.
We built our equity research team by recruiting a unique type of analyst: individuals who are dedi-cated to rolling up their sleeves and getting to the core of their companies—digging through financial filings, obsessively following their sectors, asking difficult questions of management and always being proactive in their analysis.
This approach continues to serve us well. In 2007, The Wall Street Journal recognized four of our ana-lysts with a “Best on the Street” designation and ranked the firm 16th out of 85 overall—the highest ranking for a firm of our size.
i n s T i T u T i o n a l s e r v i C e s
Our sales and trading team provides best execution trading for more than 600 active institutional clients, and we make markets in more than 1,200 securities. Our exclusive focus on fast-growing com-panies allows us to find the “other side” of a trade in otherwise illiquid stocks. In 2007, we traded over 1.1 billion shares of equity securities for our institutional and high net-worth investors.
Our equity capital markets team works with clients to help underwrite their securities offerings, assists clients with investor relations advice and introduces companies seeking to raise capital to long-term investors.
Through our capital access service, we help our venture capital, private equity and institutional hedge fund clients raise and reallocate capital.
Our Institutional Cash Distributors (ICD) service provides short-term investing solutions for corporate treasury departments at companies throughout the United States and Europe, and through affiliates overseas. ICD averaged nearly $20 billion in funds brokered on a monthly basis during 2007.
EQUITY RESEARCH COVERAGE BY MARKET CAPITALIZATIONas of 12/31/07
22%
Mid-Cap>$1 Bil.
13%
Small-Cap$500 Mil. - $1 Bil.
42%
Micro-Cap$100 - $500 Mil.
23%
Nano-Cap<$100 Mil.
What We Do
M e r r i M a n C u r h a n F o r d p a g e 3
Our newest institutional service is our OTCQX advisory. We are one of a select group of investment bank sponsors registered by the OTCQX to work with domestic and international companies who want access to U.S. investment capital without the often prohibitive costs associated with Sarbanes-Oxley and registration with the SEC. The OTCQX provides a superior platform for trading and disclosure, thereby enhancing liquidity for companies that list and for investors who want to gain visibility into a company’s news, filings and other relevant investment information.
P r i m a r y m a r k e T r e s e a r C h
We offer primary market research service through our Panel Intelligence subsidiary, which has been a solid and consistent contributor to the firm since its acquisition in April 2007.
Through Panel Intelligence we provide CleanTech and health care corporate clients and institutional investors with deeper insights and better efficiency for making investment, product development and marketing decisions. Our experienced research team designs and conducts customized projects and delivers proprietary analysis, with access to over 700,000 professionals globally.
In 2007, our primary market research business grew 20 percent. We will further leverage the Panel Intelligence platform to expand into broader primary market research for institutional investors. We see this as part of the changing face of research: a new model to gain exclusive and proprietary insights directly from top experts.
a s s e T m a n a g e m e n T
Our asset management team offers absolute return investment products for institutional and high net-worth clients. Our hedge funds employ a low-leverage strategy and invest in fast-growing companies and business sectors. Much like our equity research approach, bottom-up fundamental research drives our investment decisions. We currently offer three hedge fund products:
• MCF Voyager Fund: A long/short equity fund that invests primarily in the technology, communi-cations and life sciences industries
• MCF Focus Fund: An event-driven special situations fund (previously Tamalpais Fund)
• MCF Navigator Fund: A small- and micro-cap, long-biased fund with a substantial percentage of private placements
C o r P o r a T e a n d v e n T u r e s e r v i C e s
We offer brokerage services to our corporate clients, including corporate cash management and stock repurchase programs. For venture capital investors and company executives with restricted stock transactions, we provide cashless exercise of options, hedging and diversification strategies and liquid-ity strategies.
Through our network of venture capital and private equity investors, we are able to help private companies accomplish their capital raising goals.
0
5
10
15
20
25
30
35
40
2007200620052004
INVESTMENT BANKING TRANSACTIONS
Sole/Lead Managed
Co-Managed
M&A
2007200620052004
1112
16
19
1111
23
11
11
12
40
31
2325

Letter to Stockholders
p a g e 4 M e r r i M a n C u r h a n F o r d
By any measure, 2007 was a breakout year for us. We delivered record revenue and income, four quarters of profitability, and we broke new ground across many of our service offerings.
As a result, I am proud to report the company is in the best financial condition in our history, and we entered 2008 with a strong balance sheet ref lecting a solid cash position and little debt.
Our strategic goals for 2007 were simple: to become profitable, integrate our newly acquired primary market research subsidiary and grow revenue by at least 25 percent. These goals became more challenging as the equity markets experienced very rough waters in the second half of 2007. Nevertheless, we not only achieved our strategic priorities but exceeded them, increasing profitability, fully integrating Panel Intelligence and growing revenue by 69 percent.
Our success in 2007 ref lects the teamwork and dedication of our 200 employees. Their hard work is a testament to our commitment to hiring smart, ethical people and fostering a culture of constant communication, aggressiveness, accountability and success.
As we move further into 2008 and beyond, we will focus on three areas to drive superior client results and deliver exceptional shareholder value: recurring revenue, continued growth and optimizing our resources.
focus on recurrIng re venue Historically, investment banking and institutional trading have been among our strongest revenue engines. We intend to continue growing these areas by screening for larger deals and trading creatively and aggressively. These are cyclical businesses, however. To generate more consistent revenue, we are focusing on building out our recurring revenue sources.
Our high-margin asset management products are one source of recurring revenue. At the end of 2007, we had roughly $60 million under manage-ment across our three fund products, up 100 percent from December 2006. I am pleased with the performance of these funds in a difficult period. Recent senior-level additions to our asset management team will continue to drive growth in this important area.
Last year, we became the first investment bank to become a designated sponsor for domestic and international companies wishing to list on the OTCQX platform. This new service allows us to tap our expertise in working with fast-growing companies and further build an international presence. We expect this fee-based service to continue to grow in popularity for international companies and to create additional recurring revenue for us.
focus on grow th The company’s long-term growth imperative starts with a simple premise: we must continue building our client base, deepening our client relationships and growing our institutional accounts. Instrumental to our growth is the continued ability to align services with our differenti-ated expertise in the emerging China market and four growth industries: CleanTech, Consumer, Health Care and Tech/Media/Telecom (TMT).
This strategy helped us complete 40 investment banking transactions in 2007 and increase our active accounts by seven percent over the same period.
Equity research remains a powerful growth driver for us and continues to be the “point of the arrow.” Our research team strives to be first at discov-ering and initiating coverage on fast-growing companies with large poten-tial markets.
Because of our focus on fast-growing companies, we see a tremendous f low of interesting ideas. When outstanding opportunities arise we will invest in them. This merchant banking approach helped us strengthen our balance sheet and generate a record principal profit last year. We will continue to look for profitable ways to put capital to work on behalf of our stockholders.
As we grow organically, we will occasionally make acquisitions to enhance our client experience and increase shareholder value. Last year we com-pleted our acquisition of MedPanel and launched our primary market research service, called Panel Intelligence. This powerful online platform provides corporate clients and institutional investors with expert insights for business and investment decisions in CleanTech and health care. Panel Intelligence is already contributing to our growth and recurring revenue.
focus on resources We continually evaluate our performance against critical success factors. We seek to become more effective and efficient and to align our resources so that each team member is positioned to maximize his or her contribution. This focus on resources includes me. In November, we opted to separate the chairman and chief executive officer roles by appointing John Thompson as chairman of the board. This not only adds a seasoned leader to our board, but it also allows me to concentrate on generating revenue and building the brand.
In addition to looking inward, we want to ensure that the quality and com-mitment of our firm is clear externally. In February 2008, we moved from the American Stock Exchange to NASDAQ and are now listed under the ticker symbol MERR. I believe our new listing and your upcoming vote to approve the company’s name change to Merriman Curhan Ford Group are important steps to increasing our profile. These initiatives will tie our business successes back to our stock under one unified brand.
In 2007, we exceeded our goals through an uncertain market environment and a very hazardous landscape for the investment banking and brokerage business. There has been no letup in this environment, and if anything it has become more difficult. However, as I have noted in prior annual letters, tough markets bring us great people, great investment ideas and great opportunities to expand our business.
We look forward to continuing our momentum throughout 2008 and building shareholder value. As always, I thank you for your continued commitment and support.
Sincerely,
D. Jonathan MerrimanCEO

M e r r i M a n C u r h a n F o r d p a g e 5
MCF Corporation 2007 Form 10-K

UNITED STATESSECURITIES AND EXCHANGE COMMISSION
Washington, D.C. 20549
Form 10-K
(Mark One)� ANNUAL REPORT PURSUANT TO SECTION 13 OR 15(d)
OF THE SECURITIES EXCHANGE ACT OF 1934
For the Fiscal Year Ended December 31, 2007
OR
□ TRANSITION REPORT PURSUANT TO SECTION 13 OR 15(d)OF THE SECURITIES EXCHANGE ACT OF 1934
For the Transition Period from to .
Commission File Number 001-15831
MCF CORPORATION(Exact Name of Registrant as Specified in Its Charter)
Delaware 11-2936371(State or Other Jurisdiction ofIncorporation or Organization)
(IRS EmployerIdentification No.)
600 California Street, 9th FloorSan Francisco, CA 94108
(Address of Principal Executive Offices) (Zip Code)
(415) 248-5600(Registrant’s Telephone Number, Including Area Code)
Securities registered pursuant to Section 12(b) of the Act:
Securities registered pursuant to Section 12(g) of the Act: None
Indicate by check mark if the registrant is a well-known seasoned issuer, as defined in Rule 405 of the Securities Act.Yes � No �
Indicate by check mark if the registrant is not required to file reports pursuant to Section 13 or Section 15(d) of the Act.Yes � No �
Indicate by check mark whether the registrant (1) has filed all reports required to be filed by Section 13 or 15(d) of theSecurities Exchange Act of 1934 during the preceding 12 months (or for such shorter period that the registrant was required to filesuch reports), and (2) has been subject to such filing requirements for the past 90 days. Yes � No �
Indicate by check mark if disclosure of delinquent filers pursuant to Item 405 of Regulation S-K is not contained herein, andwill not be contained, to the best of registrant’s knowledge, in definitive proxy or information statements incorporated by reference inPart III of this Form 10-K or any amendment to this Form 10-K. □
Indicate by check mark whether the registrant is a large accelerated filer, an accelerated filer, or a non-accelerated filer. Seedefinition of ‘‘accelerated filer and large accelerated filer’’ in Rule 12b-2 of the Exchange Act.
Large Accelerated Filer □ Accelerated Filer � Non-accelerated Filer □
Indicate by check mark whether the registrant is a shell company (as defined in Rule 12b-2 of the Act). Yes � No �
The aggregate market value of the 11,157,574 shares of common stock of the Registrant issued and outstanding as of June 30,2007, the last business day of the registrant’s most recently completed second fiscal quarter, excluding 976,446 shares of commonstock held by affiliates of the Registrant was $56,011,021. This amount is based on the closing price of the common stock on theAmerican Stock Exchange of $5.02 per share on June 30, 2007.
The number of shares of Registrant’s common stock outstanding as of February 11, 2008 was 12,317,940.
DOCUMENTS INCORPORATED BY REFERENCEPart III of this Form 10-K incorporates by reference certain portions of the Registrant’s proxy statement for its 2008 annual
meeting of stockholders to be filed with the Commission not later than 120 days after the end of the fiscal year covered by thisreport.

MCF CORPORATION
TABLE OF CONTENTS
Page
PART I
Item 1. Business . . . . . . . . . . . . . . . . . . . . . . . . . . . . . . . . . . . . . . . . . . . . . . . . . . . . . . . . 1
Item 1A. Risk Factors . . . . . . . . . . . . . . . . . . . . . . . . . . . . . . . . . . . . . . . . . . . . . . . . . . . . . . 10
Item 1B. Unresolved Staff Comments . . . . . . . . . . . . . . . . . . . . . . . . . . . . . . . . . . . . . . . . . . . 21
Item 2. Properties . . . . . . . . . . . . . . . . . . . . . . . . . . . . . . . . . . . . . . . . . . . . . . . . . . . . . . . . 21
Item 3. Legal Proceedings . . . . . . . . . . . . . . . . . . . . . . . . . . . . . . . . . . . . . . . . . . . . . . . . . . 21
Item 4. Submission of Matters to a Vote of Stockholders . . . . . . . . . . . . . . . . . . . . . . . . . . . . . 21
PART II
Item 5. Market for Registrant’s Common Stock and Related Stockholder Matters. . . . . . . . . . . . . 22
Item 6. Selected Financial Data . . . . . . . . . . . . . . . . . . . . . . . . . . . . . . . . . . . . . . . . . . . . . . 23
Item 7. Management’s Discussion and Analysis of Financial Condition and Results ofOperations . . . . . . . . . . . . . . . . . . . . . . . . . . . . . . . . . . . . . . . . . . . . . . . . . . . . . . . 24
Item 7A. Quantitative and Qualitative Disclosures about Market Risk . . . . . . . . . . . . . . . . . . . . . . 37
Item 8. Financial Statements and Supplementary Data . . . . . . . . . . . . . . . . . . . . . . . . . . . . . . . 38
Item 9. Changes in and Disagreements with Accountants on Accounting and FinancialDisclosure . . . . . . . . . . . . . . . . . . . . . . . . . . . . . . . . . . . . . . . . . . . . . . . . . . . . . . . 69
Item 9A. Controls and Procedures . . . . . . . . . . . . . . . . . . . . . . . . . . . . . . . . . . . . . . . . . . . . . . 69
Item 9B. Other Information . . . . . . . . . . . . . . . . . . . . . . . . . . . . . . . . . . . . . . . . . . . . . . . . . . 69
PART III
Item 10. Directors and Executive Officers of the Registrant . . . . . . . . . . . . . . . . . . . . . . . . . . . . 71
Item 11. Executive Compensation. . . . . . . . . . . . . . . . . . . . . . . . . . . . . . . . . . . . . . . . . . . . . . 74
Item 12. Security Ownership of Certain Beneficial Owners and Management . . . . . . . . . . . . . . . . 74
Item 13. Certain Relationships and Related Transactions . . . . . . . . . . . . . . . . . . . . . . . . . . . . . . 75
Item 14. Principal Accounting Fees and Services . . . . . . . . . . . . . . . . . . . . . . . . . . . . . . . . . . . 75
PART IV
Item 15. Exhibits and Financial Statement Schedules. . . . . . . . . . . . . . . . . . . . . . . . . . . . . . . . . 75
i

This Annual Report on Form 10-K and the information incorporated by reference in this Form 10-Kinclude forward-looking statements within the meaning of Section 27A of the Securities Act of 1933, asamended, and Section 21E of the Securities Exchange Act of 1934, as amended. Some of the forward-lookingstatements can be identified by the use of forward-looking words such as ‘‘believes,’’ ‘‘expects,’’ ‘‘may,’’‘‘will,’’ ‘‘should,’’ ‘‘seeks,’’ ‘‘approximately,’’ ‘‘intends,’’ ‘‘plans,’’ ‘‘estimates’’ or ‘‘anticipates’’ or the negativeof those words or other comparable terminology. Forward-looking statements involve risks and uncertainties.You should be aware that a number of important factors could cause our actual results to differ materiallyfrom those in the forward-looking statements. We will not necessarily update the information presented orincorporated by reference in this Annual Report on Form 10-K if any of these forward-looking statements turnout to be inaccurate. Risks affecting our business are described throughout this Form 10-K and especially inthe section ‘‘Risk Factors.’’ This entire Annual Report on Form 10-K, including the consolidated financialstatements and the notes and any other documents incorporated by reference into this Form 10-K should beread for a complete understanding of our business and the risks associated with that business.
PART I
Item 1. Business
Overview
We are a financial services holding company that provides investment research, capital markets services,corporate and venture services, investment banking, asset management and primary research through ouroperating subsidiaries, Merriman Curhan Ford & Co., MCF Asset Management, LLC and Panel Intelligence,LLC.
Merriman Curhan Ford & Co. is an investment bank and securities broker-dealer focused on fast growingcompanies and institutional investors. Our mission is to become a leader in the researching, advising, financ-ing, trading and investing in fast growing companies under $2 billion in market capitalization. We provideequity research, brokerage and trading services primarily to institutions, as well as investment banking andadvisory services to corporate clients. We are gaining market share by originating differentiated research forour institutional investor clients and providing specialized and integrated services for our fast-growingcorporate clients.
In April 2007, we acquired MedPanel, Inc. (now Panel Intelligence, LLC) and began offering custom andpublished primary research to industry clients and investment professionals through online panel discussions,quantitative surveys and an extensive research library. Panel Intelligence is positioned to provide greateraccess, compliance, insights and productivity to clients in the healthcare, clean technology (‘‘CleanTech’’),technology, media and telecommunications (‘‘TMT’’) and financial industries.
MCF Asset Management, LLC manages absolute return investment products for institutional and high-networth clients. During 2006, we introduced the MCF Navigator fund and MCF Voyager fund. Additionally, weare the sub-advisor for the MCF Focus fund. As of December 31, 2007, assets under management across ourthree fund products exceeded $56 million.
We are headquartered in San Francisco, with additional offices in New York, NY, Cambridge, MA,Newport Beach, CA and Portland, OR. As of December 31, 2007, we had 198 employees. Merriman CurhanFord & Co. is registered with the Securities and Exchange Commission as a broker-dealer and is a member ofFinancial Industry Regulatory Authority (‘‘FINRA’’) and the Securities Investors Protection Corporation.MCF Asset Management, LLC is registered with the Securities and Exchange Commission.
Principal Services
We have three business segments: the investment bank / broker-dealer, primary research and asset man-agement. Our investment bank / broker-dealer segment provides three service offerings: investment banking,brokerage and equity research. Our primary research segment offers custom, independent primary researchservices to health care and Clean Technology companies, as well as financial services firms that invest in thesecompanies. Our asset management segment manages investment products for investors. We sold our wealthmanagement subsidiary, Catalyst Financial Planning & Investment Management Corporation, or Catalyst, inJanuary 2007. The results from this segment have been treated as discontinued operations.
1
Investment Banking
Our investment bankers provide a full range of corporate finance and strategic advisory services. Ourcorporate finance practice is comprised of industry coverage investment bankers that are focused on raisingcapital for fast growing companies in selected industry sectors. Our strategic advisory practice tailors solutionsto meet the specific needs of our clients at various points in their growth cycle. Over the last three years, wehave focused on growing our investment banking business through the hiring of increasingly senior investmentbankers and support professionals. As of December 31, 2007, we had 33 professionals in our investmentbanking group.
Corporate Finance. Our corporate finance practice advises on and structures capital raising solutions forour corporate clients through public and private offerings of primarily equity and convertible debt securities.Our focus is to provide fast growing companies with the capital necessary to drive them to the next level ofgrowth. We offer a wide range of financial services designed to meet the needs of fast growing companies,including initial public offerings, secondary offerings, private investments in public equity, or PIPEs, andprivate placements. Our equity capital markets team executes underwritten securities offerings, assists clientswith investor relations advice and introduces companies seeking to raise capital to investors that we believewill be supportive, long-term investors. Additionally, we draw upon our contacts throughout the financial andcorporate world, expanding the options available for our corporate clients.
Strategic Advisory. Our strategic advisory services include transaction specific advice regarding mergersand acquisitions, divestitures, spin-offs and privatizations, as well as general strategic advice. Our commitmentto long-term relationships and our ability to meet the needs of a diverse range of clients has made us a reli-able source of advisory services for fast growing public and private companies. Our strategic advisory servicesare also supported by our capital markets professionals, who provide assistance in acquisition financing inconnection with mergers and acquisitions transactions.
Institutional Brokerage Services
We provide institutional sales, sales trading and trading services to more than 590 institutional accountsin the United States. We execute securities transactions for money managers, mutual funds, hedge funds,insurance companies, pension and profit-sharing plans. Institutional investors normally purchase and sellsecurities in large quantities, which require the distribution and trading expertise that we provide.
We provide integrated research and trading solutions centered on helping our institutional clients to investprofitably, to grow their portfolios and ultimately their businesses. We understand the importance of buildinglong-term relationships with our clients who we believe look to us for the professional resources and relevantexpertise to provide answers for their specific situations. We believe it is important for us to be involved withpublic companies early in their corporate life cycles. We strive to provide unique investment opportunities infast growing, relatively undiscovered companies and to help our clients execute trades rapidly, efficiently andaccurately.
Institutional Sales. Our sales professionals focus on communicating investment ideas to our clients andexecuting trades in securities of companies in our target growth sectors. By actively trading in these securities,we endeavor to couple the capital market information flow with the fundamental information flow provided byour analysts. We believe that this combined information flow is the underpinning of getting our clients favor-able execution of investment strategies. Sales professionals work closely with our research analysts to provideup-to-date information to our institutional clients. We interface actively with our clients and plan to beinvolved with our clients over the long term.
Sales Trading. Our sales traders are experienced in the industry and possess in-depth knowledge of boththe markets for fast growing company securities and the institutional traders who buy and sell them.
Trading. Our trading professionals facilitate liquidity discovery in equity securities. We make markets inNASDAQ and other securities, trade listed securities and service the trading desks of institutions in theUnited States. Our trading professionals have direct access to the major stock exchanges, including theNew York Stock Exchange and the American Stock Exchange. As of December 31, 2007, we were a marketmaker in over 1,200 securities.
2
The customer base of our brokerage business is primarily institutional, including mutual funds and hedgefunds, as well as smaller, private investment firms and certain high net worth individuals. We believe thisgroup of clients and potential clients to number over 4,000. We grew our business during 2007 by adding newcustomers, and increasing the penetration of existing institutional customers that use our equity research andtrading services in their investment process.
Proprietary Trading. We will from time to time take significant positions in fast growing companiesthat we feel are undervalued in the marketplace. We believe that our window into these opportunities, due tothe types of companies we research, offers us a significant competitive advantage. We have generatedattractive returns on our capital by deploying this strategy since the inception of our firm.
Corporate and Venture Services. We offer brokerage services to corporations including corporate cashmanagement and stock repurchase programs through our Corporate and Venture Services group. We also servethe needs of venture capital investors and company executives with restricted stock transactions, cashlessexercise of options, hedging and diversification strategies, and liquidity strategies. Additionally, the VentureServices team provides sales distribution for capital raises for private companies via the introduction toventure capital and private equity investors.
Institutional Cash Distributors (ICD). ICD is a broker of money market funds serving the short-terminvesting needs of corporate finance departments at companies throughout the United States and Europe.Companies using ICD’s services receive access to over 40 fund families through ICD’s one-stop process thatincludes one application, one wire and one statement that consolidates reporting regardless of the number offunds utilized. As of December 31, 2007, ICD clients have invested over $18 billion in money market fundsfrom which ICD earns brokerage fees. ICD is a division of Merriman Curhan Ford & Co.
OTCQX Advisory. During 2007, Merriman Curhan Ford & Co. began offering services to sponsorcompanies on the Domestic and International OTCQX markets. This new service offering has been designedto enable domestic and non-U.S. companies to obtain greater exposure to U.S. institutional investors withoutthe expense and regulatory burdens of listing on a traditional U.S. exchanges. The Domestic and InternationalOTCQX market tiers do not require full SEC registration or Sarbanes Oxley compliance. Listing on themarket requires the sponsorship of a qualified investment bank called a Designated Advisor for Disclosure(DAD) for domestic companies or a Principal American Liaison (PAL) for non-U.S. companies. MerrimanCurhan Ford & Co. was the first U.S. investment bank to achieve DAD and PAL designations.
Capital Access Group. We raise capital for institutional hedge funds, venture capital and private equityclients for a fee through our Capital Access Group. We believe fee-based capital raising is an underserved areaof the institutional brokerage industry.
Equity Research
A key part of our strategy is to originate specialized and in-depth research. Our analysts cover a universeof approximately 186 companies in our focus industry sectors. We leverage the ideas generated by ourresearch teams, using them to attract and retain institutional brokerage clients.
Supported by the firm’s institutional sales and trading capabilities, our analysts deliver timely recommen-dations to clients on innovative investment opportunities. In an effort to make money for our investor clients,our analysts are driven to find undiscovered opportunities in fast growing companies that are not widely heldand that we believe are undervalued. Given the contrarian and undiscovered nature of many of our researchideas, we, as a firm, specialize in serving sophisticated, aggressive institutional investors. As of December 31,2007, approximately 78% of the companies covered by our research professionals had market capitalizationsof $1 billion or less.
3
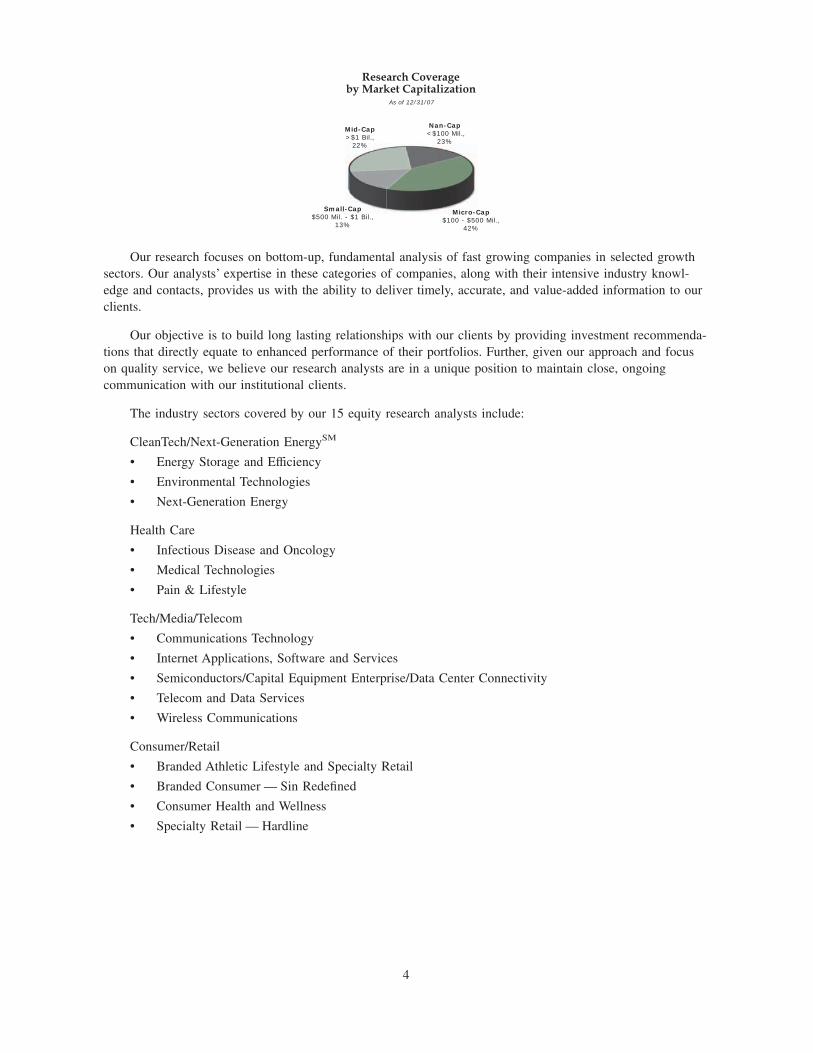
Nan-Cap <$100 Mil.,
23%
Micro-Cap$100 - $500 Mil.,
42%
Small-Cap$500 Mil. - $1 Bil.,
13%
Mid-Cap>$1 Bil.,
22%
As of 12/31/07
Research Coverageby Market Capitalization
Our research focuses on bottom-up, fundamental analysis of fast growing companies in selected growthsectors. Our analysts’ expertise in these categories of companies, along with their intensive industry knowl-edge and contacts, provides us with the ability to deliver timely, accurate, and value-added information to ourclients.
Our objective is to build long lasting relationships with our clients by providing investment recommenda-tions that directly equate to enhanced performance of their portfolios. Further, given our approach and focuson quality service, we believe our research analysts are in a unique position to maintain close, ongoingcommunication with our institutional clients.
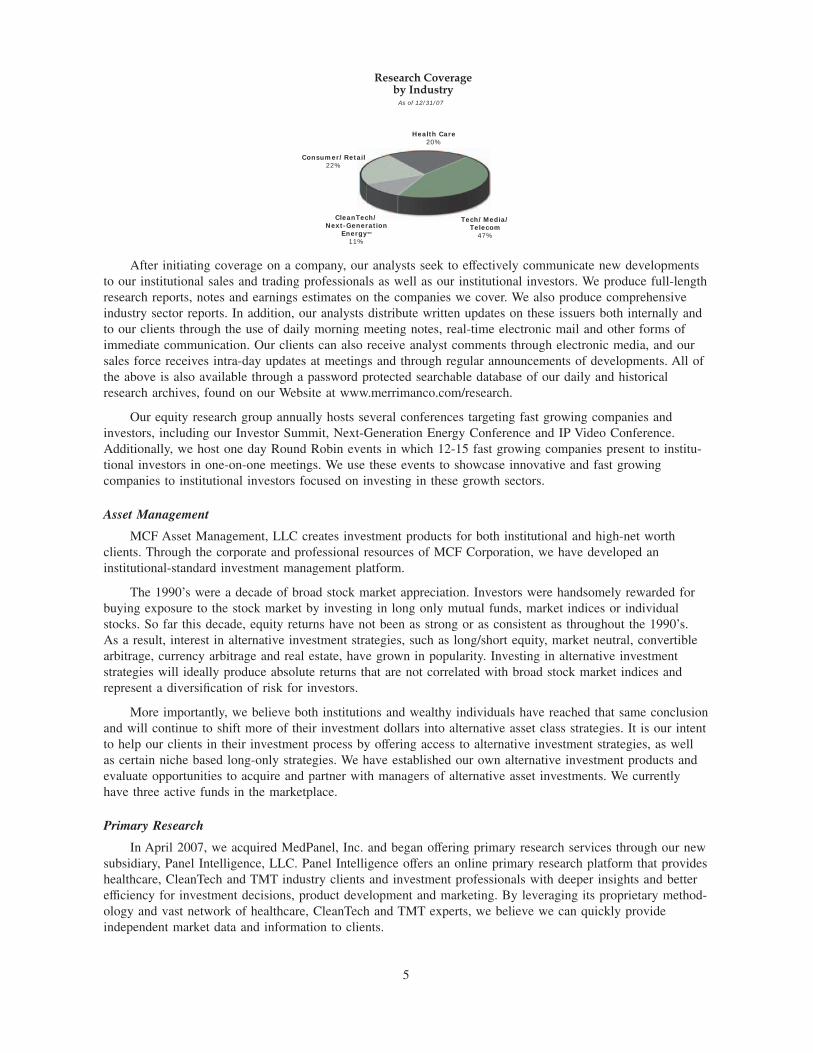
The industry sectors covered by our 15 equity research analysts include:
CleanTech/Next-Generation EnergySM
• Energy Storage and Efficiency
• Environmental Technologies
• Next-Generation Energy
Health Care
• Infectious Disease and Oncology
• Medical Technologies
• Pain & Lifestyle
Tech/Media/Telecom
• Communications Technology
• Internet Applications, Software and Services
• Semiconductors/Capital Equipment Enterprise/Data Center Connectivity
• Telecom and Data Services
• Wireless Communications
Consumer/Retail
• Branded Athletic Lifestyle and Specialty Retail
• Branded Consumer — Sin Redefined
• Consumer Health and Wellness
• Specialty Retail — Hardline
4
Health Care20%
Tech/Media/Telecom
47%
CleanTech/Next-Generation
EnergySM
11%
Consumer/Retail22%
As of 12/31/07
Research Coverageby Industry
After initiating coverage on a company, our analysts seek to effectively communicate new developmentsto our institutional sales and trading professionals as well as our institutional investors. We produce full-lengthresearch reports, notes and earnings estimates on the companies we cover. We also produce comprehensiveindustry sector reports. In addition, our analysts distribute written updates on these issuers both internally andto our clients through the use of daily morning meeting notes, real-time electronic mail and other forms ofimmediate communication. Our clients can also receive analyst comments through electronic media, and oursales force receives intra-day updates at meetings and through regular announcements of developments. All ofthe above is also available through a password protected searchable database of our daily and historicalresearch archives, found on our Website at www.merrimanco.com/research.
Our equity research group annually hosts several conferences targeting fast growing companies andinvestors, including our Investor Summit, Next-Generation Energy Conference and IP Video Conference.Additionally, we host one day Round Robin events in which 12-15 fast growing companies present to institu-tional investors in one-on-one meetings. We use these events to showcase innovative and fast growingcompanies to institutional investors focused on investing in these growth sectors.
Asset Management
MCF Asset Management, LLC creates investment products for both institutional and high-net worthclients. Through the corporate and professional resources of MCF Corporation, we have developed aninstitutional-standard investment management platform.
The 1990’s were a decade of broad stock market appreciation. Investors were handsomely rewarded forbuying exposure to the stock market by investing in long only mutual funds, market indices or individualstocks. So far this decade, equity returns have not been as strong or as consistent as throughout the 1990’s.As a result, interest in alternative investment strategies, such as long/short equity, market neutral, convertiblearbitrage, currency arbitrage and real estate, have grown in popularity. Investing in alternative investmentstrategies will ideally produce absolute returns that are not correlated with broad stock market indices andrepresent a diversification of risk for investors.
More importantly, we believe both institutions and wealthy individuals have reached that same conclusionand will continue to shift more of their investment dollars into alternative asset class strategies. It is our intentto help our clients in their investment process by offering access to alternative investment strategies, as wellas certain niche based long-only strategies. We have established our own alternative investment products andevaluate opportunities to acquire and partner with managers of alternative asset investments. We currentlyhave three active funds in the marketplace.
Primary Research
In April 2007, we acquired MedPanel, Inc. and began offering primary research services through our newsubsidiary, Panel Intelligence, LLC. Panel Intelligence offers an online primary research platform that provideshealthcare, CleanTech and TMT industry clients and investment professionals with deeper insights and betterefficiency for investment decisions, product development and marketing. By leveraging its proprietary method-ology and vast network of healthcare, CleanTech and TMT experts, we believe we can quickly provideindependent market data and information to clients.
5

Our primary research product and service offerings arise from the intelligent application of our coretechnology and research platform. Our staff guides clients in the development of highly targeted customizedquantitative and/or qualitative research instruments designed to address business issues important to the client.In addition, we have developed proprietary research products which we market to multiple clients. Thesereports provide timely, consistent and cross-comparable data on a regular basis to subscribing clients.
We believe that primary research revenue growth from financial services clients, such as mutual fundmanagers and hedge fund mangers, will accelerate due to the ability of the combined company to marketprimary research through our existing institutional sales force. Part of MedPanel’s rationale for seeking amerger partner was to expand its financial services customer base through an established sales force as well astake advantage of the future growth potential of a larger, publicly-held company with a greater depth oftechnologies, marketing opportunities and financial and operating resources.
Competition
We are engaged in the highly competitive financial services and investment industries. We compete withWall Street securities firms — from large U.S.-based firms, securities subsidiaries of major commercial bankholding companies and U.S. subsidiaries of large foreign institutions, to major regional firms, smaller nicheplayers, and those offering competitive services via the Internet. Recent developments in the brokerage indus-try, including decimalization and the growth of electronic communications networks, or ECNs, have reducedcommission rates and profitability in the brokerage industry. Many large investment banks have responded tolower margins within their equity brokerage divisions by reducing research coverage, particularly for smallercompanies, consolidating sales and trading services, and reducing headcount of more experienced sales andtrading professionals.
In addition to competing for customers and investments, we compete with other companies in thefinancial services and investment industries to attract and retain experienced and productive investmentprofessionals.
Many competitors have greater personnel and financial resources than we do. Larger competitors are ableto advertise their products and services on a national or regional basis and may have a greater number andvariety of distribution outlets for their products, including retail distribution. Discount and Internet brokeragefirms market their services through aggressive pricing and promotional efforts. In addition, some competitorshave much more extensive investment banking activities than we do and therefore, may possess a relativeadvantage with regard to access to deal flow and capital.
Recent rapid advancements in computing and communications technology, particularly the Internet, aresubstantially changing the means by which financial services and information are delivered. These changes areproviding consumers with more direct access to a wide variety of financial and investment services, includingmarket information and on-line trading and account information. Advances in technology also create demandfor more sophisticated levels of client services. We are committed to using technological advancements toprovide a high level of client service to our target markets. Provision of these services may entail considerablecost without an offsetting source of revenue.
For a further discussion of the competitive factors affecting our business, see ‘‘Item 1A. RiskFactors — The markets for securities brokerage and investment banking services are highly competitive.’’
Corporate Support
Accounting, Administration and Operations
Our accounting, administration and operations personnel are responsible for financial controls, internaland external financial reporting, human resources and personnel services, office operations, information tech-nology and telecommunications systems, the processing of securities transactions, and corporatecommunications. With the exception of payroll processing, which is performed by an outside service bureau,and customer account processing, which is performed by our clearing broker, most data processing functionsare performed internally. We believe that future growth will require implementation of new and enhancedcommunications and information systems and training of our personnel to operate such systems.
6

Compliance, Legal, Risk Management and Internal Audit
Our compliance, legal and risk management personnel (together with other appropriate personnel) areresponsible for our compliance with the legal and regulatory requirements of our investment banking and assetmanagement businesses and our exposure to market, credit, operations, liquidity, compliance, legal and reputa-tion risk. In addition, our compliance personnel test and audit for compliance with our internal policies andprocedures. Our general counsel also provides legal service throughout our company, including advice onmanaging legal risk. The supervisory personnel in these areas have direct access to senior management and tothe Audit Committee of our Board of Directors to ensure their independence in performing these functions. Inaddition to our internal compliance, legal, and risk management personnel, we retain outside consultants andattorneys for their particular functional expertise.
Risk Management
In conducting our business, we are exposed to a range of risks including:
Market risk is the risk to our earnings or capital resulting from adverse changes in the values of assetsresulting from movement in equity prices or market interest rates.
Credit risk is the risk of loss due to an individual customer’s or institutional counterparty’s unwillingnessor inability to fulfill its obligations.
Operations risk is the risk of loss resulting from systems failure, inadequate controls, human error, fraudor unforeseen catastrophes.
Liquidity risk is the potential that we would be unable to meet our obligations as they come due becauseof an inability to liquidate assets or obtain funding. Liquidity risk also includes the risk of having to sellassets at a loss to generate liquid funds, which is a function of the relative liquidity (market depth) of theasset(s) and general market conditions.
Compliance risk is the risk of loss, including fines, penalties and suspension or revocation of licenses byself-regulatory organizations, or from failing to comply with federal, state or local laws pertaining to financialservices activities.
Legal risk is the risk that arises from potential contract disputes, lawsuits, adverse judgments, or adversegovernmental or regulatory proceedings that can disrupt or otherwise negatively affect our operations orcondition.
Reputation risk is the potential that negative publicity regarding our practices, whether factually corrector not, will cause a decline in our customer base, costly litigation, or revenue reductions.
We have a risk management program that sets forth various risk management policies, provides for a riskmanagement committee and assigns risk management responsibilities. The program is designed to focus on thefollowing:
• Identifying, assessing and reporting on corporate risk exposures and trends;
• Establishing and revising as necessary policies, procedures and risk limits;
• Monitoring and reporting on adherence with risk policies and limits;
• Developing and applying new measurement methods to the risk process as appropriate; and
• Approving new product developments or business initiatives.
We cannot provide assurance that our risk management program or our internal controls will prevent ormitigate losses attributable to the risks to which we are exposed.
For a further discussion of the risks affecting our business, see ‘‘Item 1A — Risk Factors.’’
7
Regulation
As a result of federal and state registration and self-regulatory organization, or SRO, memberships, weare subject to overlapping layers of regulation that cover all aspects of our securities business. Such regula-tions cover matters including capital requirements, uses and safe-keeping of clients’ funds, conduct ofdirectors, officers and employees, record-keeping and reporting requirements, supervisory and organizationalprocedures intended to assure compliance with securities laws and to prevent improper trading on materialnonpublic information, employee-related matters, including qualification and licensing of supervisory and salespersonnel, limitations on extensions of credit in securities transactions, requirements for the registration,underwriting, sale and distribution of securities, and rules of the SROs designed to promote high standards ofcommercial honor and just and equitable principles of trade. A particular focus of the applicable regulationsconcerns the relationship between broker-dealers and their customers. As a result, many aspects of the broker-dealer customer relationship are subject to regulation including, in some instances, ‘‘suitability’’ determinationsas to certain customer transactions, limitations on the amounts that may be charged to customers, timing ofproprietary trading in relation to customers’ trades and disclosures to customers.
As a broker-dealer registered with the Securities and Exchange Commission, or SEC, and as a memberfirm of Financial Industry Regulatory Authority, we are subject to the net capital requirements of the SEC andFINRA. These capital requirements specify minimum levels of capital, computed in accordance with regula-tory requirements that each firm is required to maintain and also limit the amount of leverage that each firm isable to obtain in its respective business.
‘‘Net capital’’ is essentially defined as net worth (assets minus liabilities, as determined under accountingprinciples generally accepted in the United States), plus qualifying subordinated borrowings, less the value ofall of a broker-dealer’s assets that are not readily convertible into cash (such as furniture, prepaid expensesand unsecured receivables), and further reduced by certain percentages (commonly called ‘‘haircuts’’) of themarket value of a broker-dealer’s positions in securities and other financial instruments. The amount of netcapital in excess of the regulatory minimum is referred to as ‘‘excess net capital.’’
The SEC’s capital rules also (i) require that broker-dealers notify it, in writing, two business days prior tomaking withdrawals or other distributions of equity capital or lending money to certain related persons ifthose withdrawals would exceed, in any 30-day period, 30% of the broker-dealer’s excess net capital, and thatthey provide such notice within two business days after any such withdrawal or loan that would exceed, inany 30-day period, 20% of the broker-dealer’s excess net capital, (ii) prohibit a broker-dealer from withdraw-ing or otherwise distributing equity capital or making related party loans if, after such distribution or loan, thebroker-dealer would have net capital of less than $300,000 or if the aggregate indebtedness of the broker-dealer’s consolidated entities would exceed 1,000% of the broker-dealer’s net capital in certain othercircumstances, and (iii) provide that the SEC may, by order, prohibit withdrawals of capital from a broker-dealer for a period of up to 20 business days, if the withdrawals would exceed, in any 30-day period, 30% ofthe broker-dealer’s excess net capital and if the SEC believes such withdrawals would be detrimental to thefinancial integrity of the firm or would unduly jeopardize the broker-dealer’s ability to pay its customer claimsor other liabilities.
Compliance with regulatory net capital requirements could limit those operations that require the inten-sive use of capital, such as underwriting and trading activities, and also could restrict our ability to withdrawcapital from our broker-dealer, which in turn could limit our ability to pay interest, repay debt and redeem orrepurchase shares of our outstanding capital stock.
We believe that at all times we have been in compliance with the applicable minimum net capital rules ofthe SEC and FINRA.
The failure of a U.S. broker-dealer to maintain its minimum required net capital would require it to ceaseexecuting customer transactions until it came back into compliance, and could cause it to lose its FINRAmembership, its registration with the SEC or require its liquidation. Further, the decline in a broker-dealer’snet capital below certain ‘‘early warning levels,’’ even though above minimum net capital requirements, couldcause material adverse consequences to the broker-dealer.
8
We are also subject to ‘‘Risk Assessment Rules’’ imposed by the SEC which require, among other things,that certain broker-dealers maintain and preserve certain information, describe risk management policies andprocedures and report on the financial condition of certain affiliates whose financial and securities activitiesare reasonably likely to have a material impact on the financial and operational condition of the broker-dealers. Certain ‘‘Material Associated Persons’’ (as defined in the Risk Assessment Rules) of thebroker-dealers and the activities conducted by such Material Associated Persons may also be subject to regula-tion by the SEC. In addition, the possibility exists that, on the basis of the information it obtains under theRisk Assessment Rules, the SEC could seek authority over our unregulated subsidiary either directly orthrough its existing authority over our regulated subsidiary.
In the event of non-compliance by us or one of our subsidiaries with an applicable regulation, govern-mental regulators and one or more of the SROs may institute administrative or judicial proceedings that mayresult in censure, fine, civil penalties (including treble damages in the case of insider trading violations), theissuance of cease-and-desist orders, the deregistration or suspension of the non-compliant broker-dealer, thesuspension or disqualification of officers or employees or other adverse consequences. The imposition of anysuch penalties or orders on us or our personnel could have a material adverse effect on our operating resultsand financial condition.
Additional legislation and regulations, including those relating to the activities of our broker-dealer,changes in rules promulgated by the SEC, FINRA or other United States, state or foreign governmental regu-latory authorities and SROs or changes in the interpretation or enforcement of existing laws and rules mayadversely affect our manner of operation and our profitability. Our businesses may be materially affected notonly by regulations applicable to us as a financial market intermediary, but also by regulations of generalapplication.
Geographic Area
MCF Corporation is domiciled in the United States and all of our revenue is attributed to United Statesand Canadian customers. All of our long-lived assets are located in the United States.
Available Information
Our website address is www.merrimanco.com. You may obtain free electronic copies of our annualreports on Form 10-K, quarterly reports on Form 10-Q, current reports on Form 8-K, and all amendments tothose reports on the ‘‘Investor Relations’’ portion of our website, under the heading ‘‘SEC Filings.’’ Thesereports are available on our website as soon as reasonably practicable after we electronically file them withthe Securities and Exchange Commission. We are providing the address to our Internet site solely for theinformation of investors. We do not intend the address to be an active link or to otherwise incorporate thecontents of the website into this report.
9

Item 1a. Risk Factors
We face a variety of risks in our business, many of which are substantial and inherent in our businessand operations. The following are risk factors that could affect our business which we consider material, ourindustry and holders of our common stock. Other sections of this Annual Report on Form 10-K, includingreports which are incorporated by reference may include additional factors which could adversely impact ourbusiness and financial performance. Moreover, we operate in a very competitive and rapidly changing environ-ment. New risk factors emerge from time to time and it is not possible for our management to predict all riskfactors, nor can we assess the impact of all factors on our business or the extent to which any factor, orcombination of factors, may cause actual results to differ materially from those contained in any forward-looking statements.
Risks Related to Our Business
We may not be able to maintain a positive cash flow and profitability.
Our ability to maintain a positive cash flow and profitability depends on our ability to generate andmaintain greater revenue while incurring reasonable expenses. This, in turn, depends, among other things, onthe development of our securities brokerage and investment banking business, and we may be unable tomaintain profitability if we fail to do any of the following:
• establish, maintain and increase our client base;
• manage the quality of our services;
• compete effectively with existing and potential competitors;
• further develop our business activities;
• manage expanding operations; and
• attract and retain qualified personnel.
We cannot be certain that we will be able to sustain or increase a positive cash flow and profitability on aquarterly or annual basis in the future. Our inability to maintain profitability or positive cash flow could resultin disappointing financial results, impede implementation of our growth strategy or cause the market price ofour common stock to decrease. Accordingly, we cannot assure you that we will be able to generate the cashflow and profits necessary to sustain our business expectations, which makes our ability to successfullyimplement our business plan uncertain.
Because we are a developing company, the factors upon which we are able to base our estimates as tothe gross revenue and the number of participating clients that will be required for us to maintain a positivecash flow and any additional financing that may be needed for this purpose are unpredictable. For these andother reasons, we cannot assure you that we will not require higher gross revenue, and an increased number ofclients, securities brokerage and investment banking transactions, and/or more time in order for us to completethe development of our business that we believe we need to be able to cover our operating expenses, or obtainthe funds necessary to finance this development. It is more likely than not that our estimates will prove to beinaccurate because actual events more often than not differ from anticipated events. Furthermore, in the eventthat financing is needed in addition to the amount that is required for this development, we cannot assure youthat such financing will be available on acceptable terms, if at all.
Our financial results may fluctuate substantially from period to period, which may impair our stock price.
We have experienced, and expect to experience in the future, significant periodic variations in our rev-enue and results of operations. These variations may be attributed in part to the fact that our investmentbanking revenue is typically earned upon the successful completion of a transaction, the timing of which isuncertain and beyond our control. In most cases we receive little or no payment for investment bankingengagements that do not result in the successful completion of a transaction. As a result, our business ishighly dependent on market conditions as well as the decisions and actions of our clients and interested thirdparties. For example, a client’s acquisition transaction may be delayed or terminated because of a failure toagree upon final terms with the counterparty, failure to obtain necessary regulatory consents or board or
10
shareholder approvals, failure to secure necessary financing, adverse market conditions or unexpected financialor other problems in the client’s or counterparty’s business. If the parties fail to complete a transaction onwhich we are advising or an offering in which we are participating, we will earn little or no revenue from thetransaction. This risk may be intensified by our focus on growth companies in the technology, healthcare,clean technology and consumer sectors, as the market for securities of these companies has experiencedsignificant variations in the number and size of equity offerings. Recently, more companies initiating theprocess of an initial public offering are simultaneously exploring merger and acquisition opportunities. If weare not engaged as a strategic advisor in any such dual-tracked process, our investment banking revenuewould be adversely affected in the event that an initial public offering is not consummated.
As a result, we are unlikely to achieve steady and predictable earnings on a quarterly basis, which couldin turn adversely affect our stock price.
Our ability to retain our professionals and recruit additional professionals is critical to the success of ourbusiness, and our failure to do so may materially adversely affect our reputation, business and results ofoperations.
Our ability to obtain and successfully execute our business depends upon the personal reputation, judg-ment, business generation capabilities and project execution skills of our senior professionals, particularlyD. Jonathan Merriman, our Chief Executive Officer, and the other members of our Executive Committee. Oursenior professionals’ personal reputations and relationships with our clients are a critical element in obtainingand executing client engagements. We encounter intense competition for qualified employees from othercompanies in the investment banking industry as well as from businesses outside the investment bankingindustry, such as investment advisory firms, hedge funds, private equity funds and venture capital funds. Fromtime to time, we have experienced losses of investment banking, brokerage, research and other professionalsand losses of our key personnel may occur in the future. The departure or other loss of Mr. Merriman, anyother member of our Executive Committee or any other senior professional who manages substantial clientrelationships and possesses substantial experience and expertise, could impair our ability to secure or success-fully complete engagements, protect our market share or retain assets under management, each of which, inturn, could materially adversely affect our business and results of operations.
If any of our professionals were to join an existing competitor or form a competing company, some ofour clients could choose to use the services of that competitor instead of our services. The compensationarrangements, non-competition agreements and lock-up agreements we have entered into with certain of ourprofessionals may not prove effective in preventing them from resigning to join our competitors and thenon-competition agreements may not be upheld if we were to seek to enforce our rights under these agree-ments.
If we are unable to retain our professionals or recruit additional professionals, our reputation, business,results of operations and financial condition may be materially adversely affected.
Our compensation structure may negatively impact our financial condition if we are not able to effectivelymanage our expenses and cash flows.
We are able to recruit and retain investment banking, research and sales and trading professionals, in partbecause our business model provides that we pay our revenue producing employees a percentage of theirearned revenue. Compensation and benefits is our largest expenditure and this variable compensation compo-nent represents a significant proportion of this expense. Compensation for our employees is derived as apercentage of our revenue regardless of our profitability. Therefore, we may continue to pay individual rev-enue producers a significant amount of cash compensation as the overall business experiences negative cashflows and/or net losses. We may not be able to recruit or retain revenue producing employees if we modify oreliminate the variable compensation component from our business model.
Pricing and other competitive pressures may impair the revenue and profitability of our brokerage business.
We derive a significant portion of our revenue from our brokerage business. Along with other brokeragefirms, we have experienced intense price competition in this business in recent years. Recent developments inthe brokerage industry, including decimalization and the growth of electronic communications networks, or
11

ECNs, have reduced commission rates and profitability in the brokerage industry. We expect this trend towardalternative trading systems to continue. We believe we may experience competitive pressures in these andother areas as some of our competitors seek to obtain market share by competing on the basis of price. Inaddition, we face pressure from our larger competitors, which may be better able to offer a broader range ofcomplementary products and services to brokerage clients in order to win their trading business. As we arecommitted to maintaining our comprehensive research coverage in our target sectors to support our brokeragebusiness, we may be required to make substantial investments in our research capabilities. If we are unable tocompete effectively with our competitors in these areas, brokerage revenue may decline and our business,financial condition and results of operations may be adversely affected.
Changes in laws and regulations governing brokerage and research activities could also adversely affectour brokerage business.
In July 2006, the SEC published interpretive guidance regarding the scope of permitted brokerage andresearch services in connection with ‘‘soft dollar’’ practices (i.e., arrangements under which an investmentadviser directs client brokerage transactions to a broker in exchange for research products or services inaddition to brokerage services) and solicited further public comment regarding soft dollar practices involvingthird party providers of research. The July 2006 SEC interpretive guidance may affect our brokerage businessand laws or regulations may prompt brokerage customers to revisit or alter the manner in which they pay forresearch or brokerage services. We and firms that compete with us have or may put in place commissionsharing arrangements under which an institutional client will execute trades with a limited number of brokersand instruct those brokers to allocate a portion of the commissions generated directly to other broker-dealersor to independent research providers in exchange for research and other permissible products and services. Assuch arrangements are entered into by our clients with us and/or other brokerage firms, it may further increasethe competitive pressures within the brokerage business and/or reduce the value our clients place on highquality research.
In 2005 the SEC promulgated Regulation NMS, which made dramatic changes to the National MarketSystem, and one of the most significant of those changes, the ‘‘Order Protection Rule’’ recently became effec-tive. Under the Order Protection Rule, commonly known as the ‘‘trade-through rule,’’ broker-dealers that tradeat a price higher than the inside offer (or lower than the inside bid) of a market center’s best quotation will berequired to ‘‘take out’’, or execute against, that market’s quotation. We cannot fully predict the effect that theimplementation of the Order Protection Rule may have on our brokerage business.
We may experience significant losses if the value of our marketable security positions deteriorates.
We conduct active and aggressive securities trading, market-making and investment activities for our ownaccount, which subjects our capital to significant risks. These risks include market, credit, counterparty andliquidity risks, which could result in losses for us. These activities often involve the purchase, sale or shortsale of securities as principal in markets that may be characterized as relatively illiquid or that may be particu-larly susceptible to rapid fluctuations in liquidity and price. Trading losses resulting from such trading couldhave a material adverse effect on our business and results of operations.
Difficult market conditions could adversely affect our business in many ways.
Difficult market and economic conditions and geopolitical uncertainties have in the past adverselyaffected and may in the future adversely affect our business and profitability in many ways. Weakness inequity markets and diminished trading volume of securities could adversely impact our brokerage business,from which we have historically generated more than half of our revenue. Industry-wide declines in the sizeand number of underwritings and mergers and acquisitions also would likely have an adverse effect on ourrevenue. In addition, reductions in the trading prices for equity securities also tend to reduce the deal value ofinvestment banking transactions, such as underwriting and mergers and acquisitions transactions, which in turnmay reduce the fees we earn from these transactions. Also, difficult market conditions would likely decreasethe value of assets under management in our asset management business, which would decrease the amount ofasset-based fees we receive, and may also affect our ability to attract additional or retain existing assets undermanagement within this business. As we may be unable to reduce expenses correspondingly, our profits andprofit margins may decline.
12
We may suffer losses through our investments in securities purchased in secondary market transactions orprivate placements.
Occasionally, our company, its officers and/or employees may make principal investments in securitiesthrough secondary market transactions or through direct investment in companies through private placements.In many cases, employees and officers with investment discretion on behalf of our company decide whether toinvest in our company’s account or their personal account. It is possible that gains from investing will accrueto these individuals because investments were made in their personal accounts, and our company will notrealize gains because it did not make an investment. Conversely, it is possible that losses from investing willaccrue to our company, while these individuals do not experience losses in their personal accounts because theindividuals did not make investments in their personal accounts.
We face strong competition from larger firms.
The brokerage, investment banking and asset management industries are intensely competitive and weexpect them to remain so. We compete on the basis of a number of factors, including client relationships,reputation, the abilities and past performance of our professionals, market focus and the relative quality andprice of our services and products. We have experienced intense price competition with respect to our broker-age business, including large block trades, spreads and trading commissions. Pricing and other competitivepressures in investment banking, including the trends toward multiple book runners, co-managers and multiplefinancial advisors handling transactions, have continued and could adversely affect our revenue, even duringperiods where the volume and number of investment banking transactions are increasing. Competitive factorswith respect to our asset management activities include the amount of firm capital we can invest in newproducts and our ability to increase assets under management, including our ability to attract capital for newinvestment funds. We believe we may experience competitive pressures in these and other areas in the futureas some of our competitors seek to obtain market share by competing on the basis of price.
We are a relatively small investment bank with approximately 198 employees as of December 31, 2007and revenue less than $90 million in 2007. Many of our competitors in the brokerage, investment banking andasset management industries have a broader range of products and services, greater financial and marketingresources, larger customer bases, greater name recognition, more senior professionals to serve their clients’needs, greater global reach and more established relationships with clients than we have. These larger andbetter capitalized competitors may be better able to respond to changes in the brokerage, investment bankingand asset management industries, to compete for skilled professionals, to finance acquisitions, to fund internalgrowth and to compete for market share generally.
The scale of our competitors has increased in recent years as a result of substantial consolidation amongcompanies in the brokerage and investment banking industries. In addition, a number of large commercialbanks, insurance companies and other broad-based financial services firms have established or acquired under-writing or financial advisory practices and broker-dealers or have merged with other financial institutions.These firms have the ability to offer a wider range of products than we do, which may enhance their competi-tive position. They also have the ability to support investment banking with commercial banking, insuranceand other financial services in an effort to gain market share, which has resulted, and could further result, inpricing pressure in our businesses. In particular, the ability to provide financing has become an importantadvantage for some of our larger competitors and, because we do not provide such financing, we may beunable to compete as effectively for clients in a significant part of the brokerage and investment bankingmarket.
If we are unable to compete effectively with our competitors, our business, financial condition and resultsof operations will be adversely affected.
We have incurred losses in the recent past and may incur losses in the future.
We have incurred losses in the recent past. We recorded net losses of $8,220,000 for the year endedDecember 31, 2006 and $1,514,000 for the year ended December 31, 2005. We also recorded net losses incertain quarters within other past fiscal years. We may incur losses in any of our future periods. If we areunable to finance future losses, those losses may have a significant effect on our liquidity as well as ourability to operate.
13
In addition, we may incur significant expenses in connection with initiating new business activities or inconnection with any expansion of our underwriting, brokerage, primary research or asset management busi-nesses. We may also engage in strategic acquisitions and investments for which we may incur significantexpenses. Accordingly, we will need to increase our revenue at a rate greater than our expenses to achieve andmaintain profitability. If our revenue do not increase sufficiently, or even if our revenue increase but we areunable to manage our expenses, we will not achieve and maintain profitability in future periods.
Our capital markets and strategic advisory engagements are singular in nature and do not generallyprovide for subsequent engagements.
Our investment banking clients generally retain us on a short-term, engagement-by-engagement basis inconnection with specific capital markets or mergers and acquisitions transactions, rather than on a recurringbasis under long-term contracts. As these transactions are typically singular in nature and our engagementswith these clients may not recur, we must seek out new engagements when our current engagements aresuccessfully completed or are terminated. As a result, high activity levels in any period are not necessarilyindicative of continued high levels of activity in any subsequent period. If we are unable to generate a sub-stantial number of new engagements and generate fees from those successful completion of transactions, ourbusiness and results of operations would likely be adversely affected.
A significant portion of our brokerage revenue is generated from a relatively small number of institutionalclients.
A significant portion of our brokerage revenue is generated from a relatively small number of institutionalclients. For example, in 2007 we generated 27% of our brokerage revenue, or approximately 8% of our totalrevenue, from our ten largest brokerage clients. Similarly, in 2006 we generated 22% of our brokerage rev-enue, or approximately 13% of our total revenue, from our ten largest brokerage clients. If any of our keyclients departs or reduces its business with us and we fail to attract new clients that are capable of generatingsignificant trading volumes, our business and results of operations will be adversely affected.
Poor investment performance, pricing pressure and other competitive factors may reduce our assetmanagement revenue or result in losses.
As part of our strategy, we are investing in the expansion of our asset management business. Our revenuefrom this business is primarily derived from management fees which are based on assets under managementand incentive fees, which are earned if the return of our investment funds exceeds certain threshold returns.Our ability to maintain or increase assets under management is subject to a number of factors, includinginvestors’ perception of our past performance, market or economic conditions, competition from other fundmanagers and our ability to negotiate terms with investors.
Investment performance is one of the most important factors in retaining existing clients and competingfor new asset management business and our historical performance may not be indicative of future results.Poor investment performance and other competitive factors could reduce our revenue and impair our growthin many ways:
• existing clients may withdraw funds from our asset management business in favor of betterperforming products;
• our incentive fees could decline or be eliminated entirely;
• our capital investments in our investment funds may diminish in value or may be lost; and
• our key employees in the business may depart, whether to join a competitor or otherwise.
To the extent our future investment performance is perceived to be poor in either relative or absoluteterms, our asset management revenue will likely be reduced and our ability to raise new funds will likely beimpaired. Even when market conditions are generally favorable, our investment performance may be adverselyaffected by our investment style and the particular investments that we make.
14
Limitations on our access to capital could impair our liquidity and our ability to conduct our businesses.
Liquidity, or ready access to funds, is essential to financial services firms. Failures of financial institutionshave often been attributable in large part to insufficient liquidity. Liquidity is of importance to our tradingbusiness and perceived liquidity issues may affect our clients and counterparties’ willingness to engage inbrokerage transactions with us. Our liquidity could be impaired due to circumstances that we may be unableto control, such as a general market disruption or an operational problem that affects our trading clients, thirdparties or us. Further, our ability to sell assets may be impaired if other market participants are seeking to sellsimilar assets at the same time.
Merriman Curhan Ford & Co., our broker-dealer subsidiary, is subject to the net capital requirements ofthe SEC and various self-regulatory organizations of which it is a member. These requirements typicallyspecify the minimum level of net capital a broker-dealer must maintain and also mandate that a significantpart of its assets be kept in relatively liquid form. Any failure to comply with these net capital requirementscould impair our ability to conduct our core business as a brokerage firm. Furthermore, Merriman CurhanFord & Co. is subject to laws that authorize regulatory bodies to block or reduce the flow of funds from it toMCF Corporation. As a holding company, MCF Corporation depends on distributions and other paymentsfrom its subsidiaries to fund all payments on its obligations, including debt obligations. As a result, regulatoryactions could impede access to funds that MCF Corporation needs to make payments on obligations, includingdebt obligations.
Our risk management policies and procedures may leave us exposed to unidentified or unanticipated risk.
Our risk management strategies and techniques may not be fully effective in mitigating our risk exposurein all market environments or against all types of risk.
We are exposed to the risk that third parties that owe us money, securities or other assets will not per-form their obligations. These parties may default on their obligations to us due to bankruptcy, lack of liquidity,operational failure, breach of contract or other reasons. We are also subject to the risk that our rights againstthird parties may not be enforceable in all circumstances. As a clearing member firm, we finance our customerpositions and could be held responsible for the defaults or misconduct of our customers. Although we regu-larly review credit exposures to specific clients and counterparties and to specific industries and regions thatwe believe may present credit concerns, default risk may arise from events or circumstances that are difficultto detect or foresee. In addition, concerns about, or a default by, one institution could lead to significantliquidity problems, losses or defaults by other institutions, which in turn could adversely affect us. Also, riskmanagement policies and procedures that we utilize with respect to investing our own funds or committingour capital with respect to investment banking, trading activities or asset management activities may notprotect us or mitigate our risks from those activities. If any of the variety of instruments, processes and strate-gies we utilize to manage our exposure to various types of risk are not effective, we may incur losses.
Our operations and infrastructure may malfunction or fail.
Our businesses are highly dependent on our ability to process, on a daily basis, a large number ofincreasingly complex transactions across diverse markets. Our financial, accounting or other data processingsystems may fail to operate properly or become disabled as a result of events that are wholly or partiallybeyond our control, including a disruption of electrical or communications services or our inability to occupyone or more of our buildings. The inability of our systems to accommodate an increasing volume of transac-tions could also constrain our ability to expand our businesses. If any of these systems do not operate properlyor are disabled or if there are other shortcomings or failures in our internal processes, people or systems, wecould suffer an impairment to our liquidity, financial loss, a disruption of our businesses, liability to clients,regulatory intervention or reputational damage.
We also face the risk of operational failure of any of our clearing agents, the exchanges, clearing housesor other financial intermediaries we use to facilitate our securities transactions. Any such failure or terminationcould adversely affect our ability to effect transactions and to manage our exposure to risk.
15
In addition, our ability to conduct business may be adversely impacted by a disruption in the infrastruc-ture that supports our businesses and the communities in which we are located. This may include a disruptioninvolving electrical, communications, transportation or other services used by us or third parties with whichwe conduct business, whether due to fire, other natural disaster, power or communications failure, act ofterrorism or war or otherwise. Nearly all of our employees in our primary locations, including San Francisco,New York, Cambridge, Newport Beach and Portland, work in close proximity to each other. If a disruptionoccurs in one location and our employees in that location are unable to communicate with or travel to otherlocations, our ability to service and interact with our clients may suffer and we may not be able to implementsuccessfully contingency plans that depend on communication or travel. Insurance policies to mitigate theserisks may not be available or may be more expensive than the perceived benefit. Further, any insurance thatwe may purchase to mitigate certain of these risks may not cover our loss.
Our operations also rely on the secure processing, storage and transmission of confidential and otherinformation in our computer systems and networks. Our computer systems, software and networks may bevulnerable to unauthorized access, computer viruses or other malicious code and other events that could havea security impact. If one or more of such events occur, this potentially could jeopardize our or our clients’ orcounterparties’ confidential and other information processed and stored in, and transmitted through, our com-puter systems and networks, or otherwise cause interruptions or malfunctions in our, our clients’, ourcounterparties’ or third parties’ operations. We may be required to expend significant additional resources tomodify our protective measures or to investigate and remediate vulnerabilities or other exposures, and we maybe subject to litigation and financial losses that are either not insured against or not fully covered through anyinsurance maintained by us.
Strategic investments or acquisitions and joint ventures may result in additional risks and uncertainties inour business.
We intend to grow our business through both internal expansion and through strategic investments,acquisitions or joint ventures. To the extent we make strategic investments or acquisitions or enter into jointventures, we face numerous risks and uncertainties combining or integrating businesses, including integratingrelationships with customers, business partners and internal data processing systems. In the case of jointventures, we are subject to additional risks and uncertainties in that we may be dependent upon, and subject toliability, losses or reputational damage relating to, systems, controls and personnel that are not under ourcontrol. In addition, conflicts or disagreements between us and our joint venture partners may negativelyimpact our businesses.
Future acquisitions or joint ventures by us could entail a number of risks, including problems with theeffective integration of operations, the inability to maintain key pre-acquisition business relationships andintegrate new relationships, the inability to retain key employees, increased operating costs, exposure tounanticipated liabilities, risks of misconduct by employees not subject to our control, difficulties in realizingprojected efficiencies, synergies and cost savings, and exposure to new or unknown liabilities.
Any future growth of our business may require significant resources and/or result in significant unantici-pated losses, costs or liabilities. In addition, expansions, acquisitions or joint ventures may require significantmanagerial attention, which may be diverted from our other operations.
Evaluation of our prospects may be more difficult in light of our limited operating history.
We have a limited operating history upon which to evaluate our business and prospects. As a relativelyyoung enterprise, we are subject to the risks and uncertainties that face a company during its formative devel-opment. Some of these risks and uncertainties relate to our ability to attract and retain clients on acost-effective basis, expand and enhance our service offerings, raise additional capital and respond to competi-tive market conditions. We may not be able to address these risks adequately, and our failure to do so mayadversely affect our business and the value of an investment in our common stock.
16
Risks Related to Our Industry
Risks associated with regulatory impact on capital markets.
Highly-publicized financial scandals in recent years have led to investor concerns over the integrity of theU.S. financial markets, and have prompted Congress, the SEC, the NYSE and FINRA to significantly expandcorporate governance and public disclosure requirements. To the extent that private companies, in order toavoid becoming subject to these new requirements, decide to forgo initial public offerings, our equity under-writing business may be adversely affected. In addition, provisions of the Sarbanes-Oxley Act of 2002 and thecorporate governance rules imposed by self-regulatory organizations have diverted many companies’ attentionaway from capital market transactions, including securities offerings and acquisition and disposition transac-tions. In particular, companies that are or are planning to be public are incurring significant expenses incomplying with the SEC and accounting standards relating to internal control over financial reporting, andcompanies that disclose material weaknesses in such controls under the new standards may have greaterdifficulty accessing the capital markets. These factors, in addition to adopted or proposed accounting anddisclosure changes, may have an adverse effect on our business.
Financial services firms have been subject to increased scrutiny over the last several years, increasing therisk of financial liability and reputational harm resulting from adverse regulatory actions.
Firms in the financial services industry have been operating in a difficult regulatory environment. Theindustry has experienced increased scrutiny from a variety of regulators, including the SEC, the NYSE,FINRA and state attorneys general. Penalties and fines sought by regulatory authorities have increased sub-stantially over the last several years. This regulatory and enforcement environment has created uncertaintywith respect to a number of transactions that had historically been entered into by financial services firms andthat were generally believed to be permissible and appropriate. We may be adversely affected by changes inthe interpretation or enforcement of existing laws and rules by these governmental authorities and self-regulatory organizations. We also may be adversely affected as a result of new or revised legislation orregulations imposed by the SEC, other United States or foreign governmental regulatory authorities or self-regulatory organizations that supervise the financial markets. Among other things, we could be fined,prohibited from engaging in some of our business activities or subject to limitations or conditions on ourbusiness activities. Substantial legal liability or significant regulatory action against us could have materialadverse financial effects or cause significant reputational harm to us, which could seriously harm our businessprospects.
In addition, financial services firms are subject to numerous conflicts of interests or perceived conflicts.The SEC and other federal and state regulators have increased their scrutiny of potential conflicts of interest.We have adopted various policies, controls and procedures to address or limit actual or perceived conflicts andregularly seek to review and update our policies, controls and procedures. However, appropriately dealing withconflicts of interest is complex and difficult and our reputation could be damaged if we fail, or appear to fail,to deal appropriately with conflicts of interest. Our policies and procedures to address or limit actual or per-ceived conflicts may also result in increased costs, additional operational personnel and increased regulatoryrisk. Failure to adhere to these policies and procedures may result in regulatory sanctions or client litigation.For example, the research areas of investment banks have been and remain the subject of heightened regula-tory scrutiny which has led to increased restrictions on the interaction between equity research analysts andinvestment banking personnel at securities firms. Several securities firms in the United States reached a globalsettlement in 2003 and 2004 with certain federal and state securities regulators and self-regulatory organiza-tions to resolve investigations into equity research analysts’ alleged conflicts of interest. Under this settlement,the firms have been subject to certain restrictions and undertakings, which have imposed additional costs andlimitations on the conduct of our businesses.
Financial service companies have experienced a number of highly publicized regulatory inquiries con-cerning market timing, late trading and other activities that focus on the mutual fund industry. These inquirieshave resulted in increased scrutiny within the industry and new rules and regulations for mutual funds,investment advisers and broker-dealers.
17

Our exposure to legal liability is significant, and damages that we may be required to pay and thereputational harm that could result from legal action against us could materially adversely affect ourbusinesses.
We face significant legal risks in our businesses and, in recent years, the volume of claims and amount ofdamages sought in litigation and regulatory proceedings against financial institutions have been increasing.These risks include potential liability under securities or other laws for materially false or misleading state-ments made in connection with securities offerings and other transactions, potential liability for ‘‘fairnessopinions’’ and other advice we provide to participants in strategic transactions and disputes over the terms andconditions of complex trading arrangements. We are also subject to claims arising from disputes with employ-ees for alleged discrimination or harassment, among other things. These risks often may be difficult to assessor quantify and their existence and magnitude often remain unknown for substantial periods of time.
Our role as advisor to our clients on important underwriting or mergers and acquisitions transactionsinvolves complex analysis and the exercise of professional judgment, including rendering ‘‘fairness opinions’’in connection with mergers and other transactions. Therefore, our activities may subject us to the risk ofsignificant legal liabilities to our clients and aggrieved third parties, including shareholders of our clients whocould bring securities class actions against us. Our investment banking engagements typically include broadindemnities from our clients and provisions to limit our exposure to legal claims relating to our services, butthese provisions may not protect us or may not be enforceable in all cases.
For example, an indemnity from a client that subsequently is placed into bankruptcy is likely to be oflittle value to us in limiting our exposure to claims relating to that client. As a result, we may incur significantlegal and other expenses in defending against litigation and may be required to pay substantial damages forsettlements and adverse judgments. Substantial legal liability or significant regulatory action against us couldhave a material adverse effect on our results of operations or cause significant reputational harm to us, whichcould seriously harm our business and prospects.
In the past, following periods of volatility in the market price of a company’s securities, securities classaction litigation often has been instituted against that company. Such litigation is expensive and diverts man-agement’s attention and resources. We can not assure you that we will not be subject to such litigation. If weare subject to such litigation, even if we ultimately prevail, our business and financial condition may beadversely affected.
Employee misconduct could harm us and is difficult to detect and deter.
There have been a number of highly publicized cases involving fraud or other misconduct by employeesin the financial services industry in recent years, and we run the risk that employee misconduct could occur atour company. For example, misconduct by employees could involve the improper use or disclosure of confi-dential information, which could result in regulatory sanctions and serious reputational or financial harm. It isnot always possible to deter employee misconduct and the precautions we take to detect and prevent thisactivity may not be effective in all cases, and we may suffer significant reputational harm for any misconductby our employees.
Risks Related to Ownership of Our Common Stock
A significant percentage of our outstanding common stock is owned or controlled by our seniorprofessionals and other employees and their interests may differ from those of other shareholders.
Our executive officers and directors, and entities affiliated with them, currently control approximately25% of our outstanding common stock including exercise of their options and warrants. These stockholders, ifthey act together, will be able to exercise substantial influence over all matters requiring approval by ourstockholders, including the election of directors and approval of significant corporate transactions. This con-centration of ownership may also have the effect of delaying or preventing a change in control of us andmight affect the market price of our common stock.
18

Provisions of our organizational documents may discourage an acquisition of us.
Our Articles of Incorporation authorize our Board of Directors to issue up to an additional 27,450,000shares of preferred stock, without approval from our stockholders. If you hold our common stock, this meansthat our Board of Directors has the right, without your approval as a common stockholder, to fix the relativerights and preferences of the preferred stock. This would affect your rights as a common stockholder regard-ing, among other things, dividends and liquidation. We could also use the preferred stock to deter or delay achange in control of our company that may be opposed by our management even if the transaction might befavorable to you as a common stockholder.
In addition, the Delaware General Corporation Law contains provisions that may enable our managementto retain control and resist our takeover. These provisions generally prevent us from engaging in a broad rangeof business combinations with an owner of 15% or more of our outstanding voting stock for a period of threeyears from the date that such person acquires his or her stock. Accordingly, these provisions could discourageor make more difficult a change in control or a merger or other type of corporate reorganization even if itcould be favorable to the interests of our stockholders.
The market price of our common stock may decline.
The market price of our common stock has in the past been, and may in the future continue to be, vola-tile. A variety of events may cause the market price of our common stock to fluctuate significantly, including:
• variations in quarterly operating results;
• our announcements of significant contracts, milestones, acquisitions;
• our relationships with other companies;
• our ability to obtain needed capital commitments;
• additions or departures of key personnel;
• sales of common stock, conversion of securities convertible into common stock, exercise of optionsand warrants to purchase common stock or termination of stock transfer restrictions;
• general economic conditions, including conditions in the securities brokerage and investmentbanking markets;
• changes in financial estimates by securities analysts; and
• fluctuation in stock market price and volume.
Many of these factors are beyond our control. Any one of the factors noted herein could have an adverseeffect on the value of our common stock. Declines in the price of our stock may adversely affect our ability torecruit and retain key employees, including our senior professionals.
In addition, the stock market in recent years has experienced significant price and volume fluctuationsthat have particularly affected the market prices of equity securities of many companies and that often havebeen unrelated to the operating performance of such companies. These market fluctuations have adverselyimpacted the price of our common stock in the past and may do so in the future.
Your interest in our firm may be diluted due to issuance of additional shares of common stock.
Our Board of Directors has the authority to issue up to 300,000,000 shares of common stock and to issueoptions and warrants to purchase shares of our common stock without stockholder approval in certain circum-stances. Future issuance of additional shares of our common stock could be at values substantially below theprice at which you may purchase our stock and, therefore, could represent substantial dilution. In addition, ourBoard of Directors could issue large blocks of our common stock to fend off unwanted tender offers or hostiletakeovers without further stockholder approval.
19

We have a significant number of outstanding stock options and warrants. During 2007, shares issuableupon the exercise of these options and warrants, at prices ranging currently from approximately $1.26 to$49.00 per share, represent approximately 7% of our total outstanding stock on a fully diluted basis using thetreasury stock method.
The exercise of the outstanding options and warrants would dilute the then-existing stockholders’ percent-age ownership of our common stock. Any sales resulting from the exercise of options and warrants in thepublic market could adversely affect prevailing market prices for our common stock. Moreover, our ability toobtain additional equity capital could be adversely affected since the holders of outstanding options and war-rants may exercise them at a time when we would also wish to enter the market to obtain capital on termsmore favorable than those provided by such options and warrants. We lack control over the timing of anyexercise or the number of shares issued or sold if exercises occur.
Your ability to sell your shares may be restricted because there is a limited trading market for our commonstock.
Although our common stock is currently traded on the Nasdaq Stock Market, an active trading market inour stock has been limited. Accordingly, you may not be able to sell your shares when you want or at theprice you want.
We do not expect to pay any cash dividends in the foreseeable future.
We intend to retain any future earnings to fund the operation and expansion of our business and, there-fore, we do not anticipate paying cash dividends in the foreseeable future. Accordingly, our shareholders mustrely on sales of their shares of common stock after price appreciation, which may never occur, as the onlyway to realize any future gains on an investment in our common stock. Investors seeking cash dividendsshould not purchase our common stock.
20

Item 1b. Unresolved Staff Comments
Not applicable.
Item 2. Properties
As of December 31, 2007, all of our properties are leased. Our principal executive offices are located inSan Francisco, California. We lease four additional offices to support our various business activities. Theseoffices are located in New York, NY, Cambridge, MA, Newport Beach, CA and Portland, OR. We believe thefacilities we are now using are adequate and suitable for business requirements.
Item 3. Legal Proceedings
Thomas O’Shea v. Merriman Curhan Ford & Co.
In June 2006, our broker-dealer subsidiary Merriman Curhan Ford & Co. was served with a claim inNASD Arbitration by Mr. O’Shea. Mr. O’Shea is a former at-will employee of Merriman Curhan Ford & Co.and worked in the investment banking department. Mr. O’Shea resigned from Merriman Curhan Ford & Co.in July 2005. Mr. O’Shea alleges breach of an implied employment contract, quantum meruit, and unjustenrichment based on his allegations that he was to be paid more for his work. The matter is in the discoverystage and an arbitration hearing scheduled for June 2007 is being rescheduled between the parties and theArbitration Panel. We believe that we have meritorious defenses and intend to contest these claims vigorously.However, in the event that we did not prevail, based upon the facts as we know them to date, we do notbelieve that the outcome will have a material effect on our financial position, financial results or cash flows.
S3 Investment Company, Inc. v. Merriman Curhan Ford & Co. and Qualico Capital, Inc.
In September 2007, Merriman Curhan Ford & Co. was served with a complaint filed by a former clientS3 Investment Company, Inc. (‘‘S3i’’).The matter is pending before the Superior Count in the City andCounty of San Francisco. The plaintiff alleges theories of breach of contract, fraud, negligent misrepresenta-tion, intentional and negligent interference with prospective economic relations. We believe that we havemeritorious defenses and intend to contest these claims vigorously. However, in the event that we did notprevail, based upon the facts as we know them to date, we do not believe that the outcome will have amaterial effect on our financial position, financial results or cash flows.
Item 4. Submission of Matters to a Vote of Stockholders
No matters were submitted to a vote of stockholders during the fourth quarter of 2007.
21

PART II
Item 5. Market for Registrant’s Common Stock and Related Stockholder Matters
Our common stock has been quoted on The Nasdaq Stock Market, Inc. (‘‘Nasdaq’’) under the symbol‘‘MERR’’ since February 12, 2008. Prior to this time, our common stock traded on the American StockExchange under the symbol ‘‘MEM.’’ The following table sets forth the range of the high and low sales pricesper share of our common stock for the fiscal quarters indicated. The sales prices below have been adjustedretroactively to reflect the one-for-seven reverse stock split of our authorized and outstanding common stockaffected on November 16, 2006.
High Low
2007Fourth Quarter . . . . . . . . . . . . . . . . . . . . . . . . . . . . . . . . . . . . . . . . . . . . . . . $ 5.50 $3.90Third Quarter . . . . . . . . . . . . . . . . . . . . . . . . . . . . . . . . . . . . . . . . . . . . . . . . 5.45 3.44Second Quarter . . . . . . . . . . . . . . . . . . . . . . . . . . . . . . . . . . . . . . . . . . . . . . . 6.15 3.86First Quarter . . . . . . . . . . . . . . . . . . . . . . . . . . . . . . . . . . . . . . . . . . . . . . . . . 5.79 3.95
2006Fourth Quarter . . . . . . . . . . . . . . . . . . . . . . . . . . . . . . . . . . . . . . . . . . . . . . . $ 4.97 $3.64Third Quarter . . . . . . . . . . . . . . . . . . . . . . . . . . . . . . . . . . . . . . . . . . . . . . . . 7.35 4.06Second Quarter . . . . . . . . . . . . . . . . . . . . . . . . . . . . . . . . . . . . . . . . . . . . . . . 10.29 7.00First Quarter . . . . . . . . . . . . . . . . . . . . . . . . . . . . . . . . . . . . . . . . . . . . . . . . . 10.36 6.72
The closing sale price for our common stock on February 11, 2008 was $5.69. The market price of ourcommon stock has fluctuated significantly and may be subject to significant fluctuations in the future. SeeItem 1A. ‘‘Risk Factors.’’
According to the records of our transfer agent, we had 698 stockholders of record as of December 31,2007. Because many shares are held by brokers and other institutions on behalf of stockholders, we are unableto estimate the total number of beneficial stockholders represented by these record holders.
Our policy is to reinvest earnings in order to fund future growth. Therefore, we have not paid andcurrently do not plan to declare dividends on our common stock.
Securities Authorized for Issuance Under Equity Compensation Plans
The following table gives information about the Company’s common stock that may be issued upon theexercise of options and warrants under all of our existing equity compensation plans as of December 31, 2007.
Plan Category
Number ofSecurities to
be IssuedUpon
Exercise ofOutstandingOptions and
Warrants
WeightedAverageExercisePrice of
OutstandingOptions and
Warrants
Number ofSecurities
RemainingAvailable for
FutureIssuance Under
EquityCompensation
Plans
Equity compensation plans approved by stockholders:1999 Stock Option Plan . . . . . . . . . . . . . . . . . . . . . . . . . . . 356,160 $ 3.82 28,2412000 Stock Option and Incentive Plan . . . . . . . . . . . . . . . . . 535,816 $13.60 4,5912001 Stock Option and Incentive Plan . . . . . . . . . . . . . . . . . 505,436 $ 3.19 14,1222003 Stock Option and Incentive Plan . . . . . . . . . . . . . . . . . 2,550,687 $ 4.60 34,5112006 Directors’ Stock Option and Incentive Plan . . . . . . . . . . — $ — 53,1722002 Employee Stock Purchase Plan . . . . . . . . . . . . . . . . . . — $ — —
Equity compensation not approved by stockholders . . . . . . . . . . 118,160 $20.45 135,413
22

Equity compensation not approved by stockholders includes shares in a Non-Qualified option planapproved by the Board of Directors of Ratexchange Corporation (now known as MCF Corporation) in 1999and a Non-Qualified option plan that is consistent with the American Stock Exchange Member Guidelines,Rule 711, approved by the Board of Directors in 2004 . The American Stock Exchange guidelines require thatgrants from the option plan be made only as an inducement to a new employee, that the grant be approved bya majority of the independent member so the Compensation Committee and that a press release is issuedpromptly disclosing the terms of the option grant.
Recent Sale of Unregistered Securities
None.
Item 6. Selected Consolidated Financial Data
The following selected consolidated financial data should be read in conjunction with Item 7. ‘‘Manage-ment’s Discussion and Analysis of Financial Condition and Results of Operations’’ and the consolidatedfinancial statements and the notes thereto included in Part II, Item 8 to this Annual Report on Form 10-K.
2007 2006 2005 2004 2003
Statement of operations data:Revenue . . . . . . . . . . . . . . . . . . . $87,655,992 $51,818,638 $43,184,315 $38,368,310 $18,306,011Operating expenses . . . . . . . . . . . . 76,194,659 58,315,930 44,912,772 36,194,924 16,832,676Operating income (loss) . . . . . . . . . 11,461,333 (6,497,292) (1,728,457) 2,173,386 1,473,335Gain (loss) on retirement of
convertible notes payable(1) . . . . . — (1,348,805) — — 3,088,230Interest income. . . . . . . . . . . . . . . 461,922 484,909 446,273 120,431 39,483Interest expense(2) . . . . . . . . . . . . . (138,055) (535,014) (76,103) (169,787) (1,554,901)Income tax expense. . . . . . . . . . . . (2,462,165) — (142,425) (249,744) (74,884)Income (loss) from continuing
operations . . . . . . . . . . . . . . . . 9,323,035 (7,896,202) (1,500,712) 1,874,286 2,971,263Loss from discontinued operations. . — (324,213) (13,731) — —Net income (loss) . . . . . . . . . . . . . $ 9,323,035 $ (8,220,415) $ (1,514,443) $ 1,874,286 $ 2,971,263Diluted income (loss) from
continuing operations . . . . . . . . . $ 0.74 $ (0.79) $ (0.16) $ 0.16 $ 0.39
Statement of financial conditiondata:
Cash and cash equivalents . . . . . . . $31,962,201 $13,746,590 $11,138,923 $17,459,113 $ 6,142,958Marketable securities owned. . . . . . 14,115,022 7,492,914 8,627,543 2,342,225 608,665Total assets . . . . . . . . . . . . . . . . . 64,573,331 30,498,213 27,694,413 25,007,824 9,703,946Capital lease obligations . . . . . . . . 890,272 1,292,378 883,993 452,993 24,401Notes payable, net . . . . . . . . . . . . 238,989 325,650 408,513 1,487,728 1,927,982Stockholders’ equity . . . . . . . . . . . $34,806,048 $16,215,020 $18,403,001 $16,733,850 $ 5,261,210
(1) In April 2003, we exercised our right to cancel the convertible promissory note held by ForsytheMcArthur & Associates with the principal sum of $5,949,042. The fair value of the consideration pro-vided to Forsythe was less than the carrying amount of the convertible note payable. The differencebetween the fair value of the consideration provided to Forsythe and the carrying amount of the notepayable, or $3,088,230, was recorded as a gain. In December 2006, MCF Corporation repaid the$7.5 million variable rate secured convertible note, issued to Midsummer Investment, Ltd, or Midsum-mer, in March 2006. Midsummer retained the stock warrant to purchase 267,857 shares of our commonstock. The loss on repayment of the convertible note consists of the write-off of the unamortized discountrelated to the stock warrant as well as the write-off the unamortized debt issuance costs.
23

(2) Interest expense for 2003 included $1,291,000 in amortization of discounts and debt issuance costs, whilethe 2004 amount included $119,000 for amortization of discounts and debt issuance costs. The higheramortization expense in 2003 was due to the accelerated amortization that occurred as the notes payablewere retired or converted to equity instruments during 2003. The total amount of discounts that will beamortized in future periods was $3,000 as of December 31, 2007.
Item 7. Management’s Discussion and Analysis of Financial Condition and Results of Operations
The following discussion and analysis should be read in conjunction with our consolidated financialstatements and the notes thereto in Part II, Item 8 to this Annual Report on Form 10-K. This discussioncontains forward-looking statements reflecting our current expectations. Actual results and the timing of eventsmay differ significantly from those projected in forward looking statements due to a number of factors, includ-ing those set forth in Item 1A ‘‘Risk Factors’’ of this Annual Report on Form 10-K.
Overview
We are a financial services holding company that provides investment research, capital markets services,corporate and venture services, investment banking, asset management and primary research through ouroperating subsidiaries, Merriman Curhan Ford & Co., MCF Asset Management, LLC and Panel Intelligence,LLC.
Merriman Curhan Ford & Co. is an investment bank and securities broker-dealer focused on fast growingcompanies and institutional investors. Our mission is to become a leader in the researching, advising, financ-ing, trading and investing in fast growing companies under $2 billion in market capitalization. We provideequity research, brokerage and trading services primarily to institutions, as well as investment banking andadvisory services to corporate clients. We are gaining market share by originating differentiated research forour institutional investor clients and providing specialized and integrated services for our fast-growingcorporate clients.
In April 2007, we acquired MedPanel, Inc. (now Panel Intelligence, LLC) and began offering custom andpublished primary research to industry clients and investment professionals through online panel discussions,quantitative surveys and an extensive research library. Panel Intelligence is positioned to provide greateraccess, compliance, insights and productivity to clients in the healthcare, CleanTech, TMT and financialindustries.
MCF Asset Management, LLC manages absolute return investment products for institutional and high-networth clients. During 2006, we introduced the MCF Navigator fund and MCF Voyager fund. Additionally, weare the sub-advisor for the MCF Focus fund. As of December 31, 2007, assets under management across ourthree fund products exceeded $56 million.
Executive Summary
Our revenue grew 69% during 2007 to $87,656,000, a record high, with healthy expansion across ourbusiness lines. Net income was $9,323,000, or $0.74 per diluted share during 2007 which represents a signifi-cant turnaround from our $8,220,000 net loss in 2006. We were profitable in each of the four quarters during2007 and we have had consecutive year-over-year revenue growth since we launched Merriman Curhan Ford& Co. at the beginning of 2002. We earned $0.51 per diluted share during the fourth quarter which primarilyresulted from strong investment banking revenue and significant gains in our proprietary trading activity. Ourfocus during 2007 was to grow our revenue per employee, generate meaningful operating cash flows, intro-duce primary research as a new service offering and closely manage our non-compensation related expenses.Our focus in 2008 will be to build on our recent success in our core businesses, further develop our newbusinesses, including primary research and OTCQX advisory, while continuing to lower our compensationexpense as a percentage of revenue.
Investment Banking — The investment banking team had another strong year with 42% revenue growthin 2007, which followed 43% revenue growth in 2006. We closed 40 corporate financing and strategic advi-sory transactions during the year with average transaction fees of $710,000. Most of the growth in 2007 wasresulted from equity underwritten transaction revenue which nearly doubled over 2006. Our success inexpanding of this business in 2007 can be attributed to the seasoning of our senior investment bankers and
24

support professionals and our focus on fast growing companies in our target sectors such as Clean Technologyand healthcare. Additionally, we were more selective in the investment banking assignments that we engagedin 2007 which resulted in a higher transaction closing rate.
Principal Transactions — Our principal transactions activity during 2007 was robust with significantgains in our proprietary trading activity, investment portfolio and profitable market making. We particularlybenefited from the significant price appreciation in one equity security position, Points International, that wehad filed a Statement of Beneficial Ownership on Schedule 13D with the SEC in 2006. We profitably exitedapproximately 3 million shares of the position in late 2007 and no longer are required to file our beneficialownership with the SEC. We will from time to time take significant positions in fast growing companies thatwe feel are undervalued in the market place. We believe that our window into these opportunities, due to thetypes of companies we research, offers us a significant competitive advantage. Over the past few years, wehave generated attractive returns on our capital by deploying this strategy.
Commissions — Commissions revenue from brokering equity securities to institutional investors declinedslightly in 2007. This business continues to face increasing challenges including the proliferation of electroniccommunications networks which have reduced commission rates and profitability in the brokerage industry.Many large investment banks have responded to lower margins within their equity brokerage divisions byreducing research coverage, particularly for smaller companies, consolidating sales and trading services, andreducing headcount of sales and trading professionals. We believe that we can grow our institutional brokeragerevenue by producing differentiated equity research on relatively undiscovered, fast growing companies withinour selected growth sectors and providing this research to small and mid-sized traditional and alternativeinvestment managers for whom these companies comprise an important part of their investment portfolios.
Institutional Cash Distributors — Our Institutional Cash Distributors business continued to expand rap-idly in 2007 with average assets brokered nearly doubling over 2006. ICD revenue grew at a rate of 114% in2006 and 70% in 2007. We expect that ICD revenue will continue to grow in 2008.
Primary Research — We closed the acquisition of MedPanel, Inc. in April 2007 and began offeringcustom and published primary research to biotechnology, pharmaceutical and medical device industry clients,as well as institutional investment companies for a subscription fee. In September 2007, we launched indepen-dent primary research for the Clean Technology vertical, which encompasses technologies that reduce humans’impact on the environment. We have positioned our firm to be an early provider of primary research to bothour corporate clients as well as financial service clients who are using our product to facilitate theirinvestment decisions.
OTCQX Advisory — During 2007, Merriman Curhan Ford & Co. began offering services to sponsorcompanies on the Domestic and International OTCQX markets. This new service offering has been designedto enable domestic and non-U.S. companies to obtain greater exposure to U.S. institutional investors withoutthe expense and regulatory burdens of listing on a traditional U.S. exchanges. The Domestic and InternationalOTCQX market tiers do not require full SEC registration or Sarbanes Oxley compliance. Listing on themarket requires the sponsorship of a qualified investment bank called a Designated Advisor for Disclosure(DAD) for domestic companies or a Principal American Liaison (PAL) for non-U.S. companies. MerrimanCurhan Ford & Co. was the first U.S. investment bank to achieve DAD and PAL designations.
Employees — Our overall headcount increased by 19% to 198 during 2007, though most of this growthresulted from the MedPanel acquisition. During 2007, we emphasized finding the most qualified employee foreach position to boost revenue per employee. We expect that we will continue to increase our employeeheadcount by 10% to 15% during 2008, though as always these hiring decisions may be impacted by ouractual financial results and the overall capital markets environment.
Business Development — We continued to invest in areas of our business that we believe will increasethe awareness of our franchise and contribute to future revenue opportunities such as hosting investor confer-ences, introducing management teams of fast growing companies to institutional investors, marketing, traveland other business development activities. These activities resulted in higher operating expenses in 2007.
25

While the subprime mortgage crisis has not had any direct impact on our firm, the current economicoutlook for 2008 is obscured by credit anxieties, slowing growth, expensive commodities and the decreasingpurchasing power of the U.S. dollar which may adversely impact our capital markets activities. However, thepositive financial results from 2007 have strengthened our balance sheet and provided us with significantlymore liquidity than we had at the start of fiscal 2007.
Business Environment
The equity and commodity markets were highly volatile during 2007 with major U.S. stock indexesending the year mixed. After a brief sell-off in the first quarter, most U.S. stock indexes advanced in thesecond quarter and third quarter with many setting record highs. Stocks moved higher based on corporateearnings and later overcame short periods of increased volatility in July and August associated with investor’sconcerns about soft retail sales, rising interest rates, inflation, the housing market and sub-prime mortgagewoes. An active mergers-and-acquisitions market, fueled to a significant degree by buying from private equityfunds, was one factor supporting the market. Investors also welcomed two 50 basis point cuts in the fed fundsrate and discount rate in late summer. Stocks traded lower in the final quarter of 2007 as ongoing weakness inthe housing market, concerns over sub-prime mortgages and crude oil prices that topped $100 per barrel allundermined investor confidence. The Fed reduced rates by another 50 basis points during the fourth quarter,however this action did little for the market.
The S&P 500 Index, a large-cap benchmark, gained 5.5% for the year while the technology-sensitiveNasdaq Composite Index rose 9.8% in 2007. U.S. small cap stocks performed especially poorly in 2007 withthe Russell 2000 Index declining 1.6% for all of 2007.
Our securities broker-dealer and investment banking activities are linked to the capital markets. In addi-tion, our business activities are focused in the technology, telecommunications, next-generation energy, healthcare and consumer sectors. By their nature, our business activities are highly competitive and are not onlysubject to general market conditions, volatile trading markets and fluctuations in the volume of marketactivity, but also to the conditions affecting the companies and markets in our areas of focus.
Fluctuations in revenue also occur due to the overall level of market activity, which, among other things,affects the flow of investment dollars and the size, number and timing of investment banking transactions. Inaddition, a downturn in the level of market activity can lead to a decrease in brokerage commissions. There-fore, revenue in any particular period may vary significantly from year to year.
The financial services industry continues to be affected by an intensifying competitive environment. Therehas been an increase in the number and size of companies competing for a similar customer base; some ofsuch competitors have greater capital resources and additional associated services with which to pursue theseactivities.
26
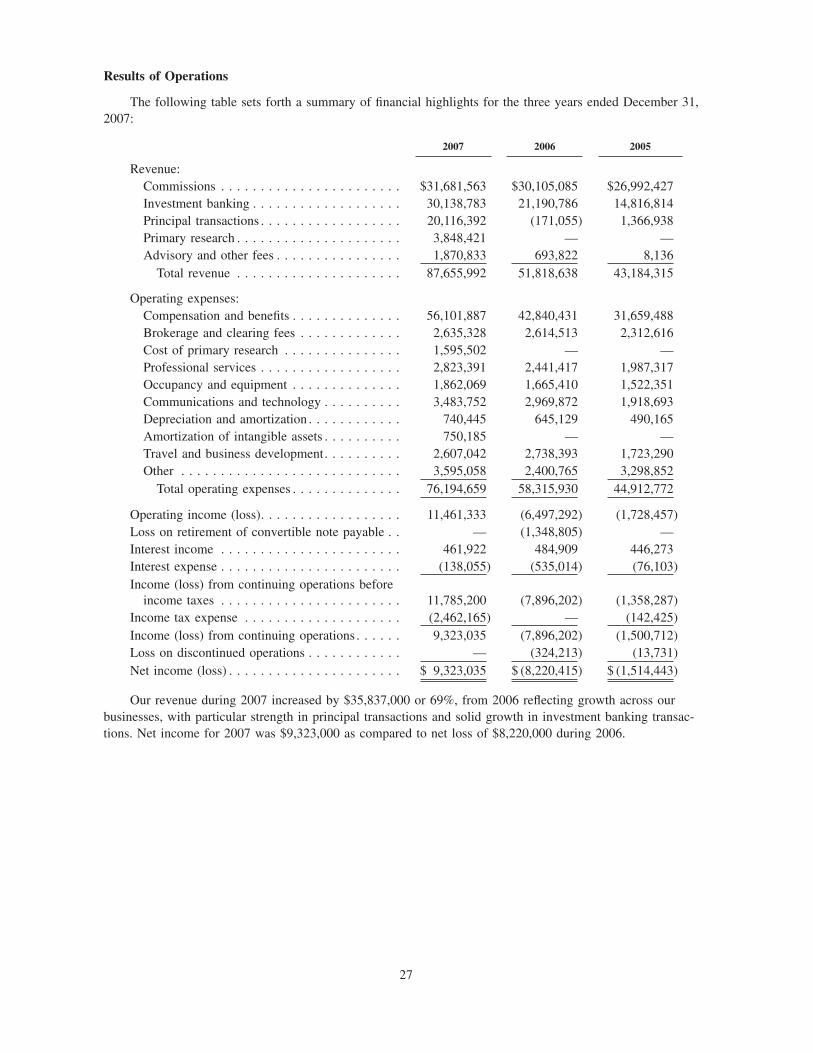
Results of Operations
The following table sets forth a summary of financial highlights for the three years ended December 31,2007:
2007 2006 2005
Revenue:Commissions . . . . . . . . . . . . . . . . . . . . . . . $31,681,563 $30,105,085 $26,992,427Investment banking . . . . . . . . . . . . . . . . . . . 30,138,783 21,190,786 14,816,814Principal transactions . . . . . . . . . . . . . . . . . . 20,116,392 (171,055) 1,366,938Primary research . . . . . . . . . . . . . . . . . . . . . 3,848,421 — —Advisory and other fees . . . . . . . . . . . . . . . . 1,870,833 693,822 8,136
Total revenue . . . . . . . . . . . . . . . . . . . . . 87,655,992 51,818,638 43,184,315
Operating expenses:Compensation and benefits . . . . . . . . . . . . . . 56,101,887 42,840,431 31,659,488Brokerage and clearing fees . . . . . . . . . . . . . 2,635,328 2,614,513 2,312,616Cost of primary research . . . . . . . . . . . . . . . 1,595,502 — —Professional services . . . . . . . . . . . . . . . . . . 2,823,391 2,441,417 1,987,317Occupancy and equipment . . . . . . . . . . . . . . 1,862,069 1,665,410 1,522,351Communications and technology . . . . . . . . . . 3,483,752 2,969,872 1,918,693Depreciation and amortization . . . . . . . . . . . . 740,445 645,129 490,165Amortization of intangible assets . . . . . . . . . . 750,185 — —Travel and business development. . . . . . . . . . 2,607,042 2,738,393 1,723,290Other . . . . . . . . . . . . . . . . . . . . . . . . . . . . 3,595,058 2,400,765 3,298,852
Total operating expenses . . . . . . . . . . . . . . 76,194,659 58,315,930 44,912,772
Operating income (loss). . . . . . . . . . . . . . . . . . 11,461,333 (6,497,292) (1,728,457)Loss on retirement of convertible note payable . . — (1,348,805) —Interest income . . . . . . . . . . . . . . . . . . . . . . . 461,922 484,909 446,273Interest expense . . . . . . . . . . . . . . . . . . . . . . . (138,055) (535,014) (76,103)Income (loss) from continuing operations before
income taxes . . . . . . . . . . . . . . . . . . . . . . . 11,785,200 (7,896,202) (1,358,287)Income tax expense . . . . . . . . . . . . . . . . . . . . (2,462,165) — (142,425)Income (loss) from continuing operations . . . . . . 9,323,035 (7,896,202) (1,500,712)Loss on discontinued operations . . . . . . . . . . . . — (324,213) (13,731)Net income (loss) . . . . . . . . . . . . . . . . . . . . . . $ 9,323,035 $ (8,220,415) $ (1,514,443)
Our revenue during 2007 increased by $35,837,000 or 69%, from 2006 reflecting growth across ourbusinesses, with particular strength in principal transactions and solid growth in investment banking transac-tions. Net income for 2007 was $9,323,000 as compared to net loss of $8,220,000 during 2006.
27

Our net income (loss) during the three years ended December 31, 2007 included the following non-cashitems:
2007 2006 2005
Stock-based compensation . . . . . . . . . . . . . . . . $2,824,107 $3,836,781 $1,959,329Amortization of intangible assets . . . . . . . . . . . 750,185 138,051 34,366Depreciation and amortization . . . . . . . . . . . . . 740,445 655,334 493,672Provision for uncollectible accounts receivable . . 368,272 383,565 556,493Issuance of common stock to consultant. . . . . . . 75,791 — —Amortization of discounts on debt. . . . . . . . . . . 10,332 146,776 10,335Loss on retirement of convertible note payable . . — 1,348,805 —Amortization of debt issuance costs. . . . . . . . . . — 35,757 —Common stock received for services . . . . . . . . . (400,875) — —Total. . . . . . . . . . . . . . . . . . . . . . . . . . . . . . . $4,368,257 $6,545,069 $3,054,195
Investment Banking Revenue
Our investment banking activity includes the following:
• Capital Raising — Capital raising includes private placements of equity and debt instruments andunderwritten public offerings.
• Financial Advisory — Financial advisory includes advisory assignments with respect to mergers andacquisitions, divestures, restructurings and spin-offs.
The following table sets forth our revenue and transaction volumes from our investment bankingactivities during the three years ended December 31, 2007:
2007 2006 2005
Revenue:Capital raising . . . . . . . . . . . . . . . . . . . . . . . . $ 26,996,283 $ 15,939,480 $ 13,396,781Financial advisory . . . . . . . . . . . . . . . . . . . . . 3,142,500 5,251,306 1,420,033Total investment banking revenue . . . . . . . . . . . $ 30,138,783 $ 21,190,786 $ 14,816,814
Transaction Volumes:Public offerings:
Capital underwritten participations . . . . . . . . . $234,596,000 $156,500,000 $ 71,238,000Number of transactions . . . . . . . . . . . . . . . . 13 15 8
Private placements:Capital raised . . . . . . . . . . . . . . . . . . . . . . . $331,480,000 $173,101,000 $253,939,000Number of transactions . . . . . . . . . . . . . . . . 26 15 14
Financial advisory:Transaction amounts . . . . . . . . . . . . . . . . . . $129,161,000 $169,423,000 $ 21,321,000Number of transactions . . . . . . . . . . . . . . . . 1 1 1
Our investment banking revenue amounted to $30,138,783, or 34% of our revenue during 2007, repre-senting a 42% increase compared to $21,191,000 recognized in 2006. Revenue growth was driven by equityunderwritten transactions which increased by 95% in 2007 as compared to the prior year. Average fees perinvestment banking transaction grew to $710,000 in 2007 from $600,000 in 2006.
Our investment banking revenue amounted to $21,191,000, or 41% of our revenue during 2006, repre-senting a 43% increase compared to $14,817,000 recognized in 2005. We expanded our public underwritingand financial advisory transactions during 2006 which we believe is valuable to us building our long-termfranchise. We participated in 15 equity underwriting transactions and lead our first initial public offeringduring 2006.
28

During each of the three years ended December 31, 2007, no single investment banking customeraccounted for more than 10% of our revenue.
Commissions and Principal Transactions Revenue
Our broker-dealer activity includes the following:
• Commissions — Commissions include revenue resulting from executing stock trades for exchange-listed securities, over-the-counter securities and other transactions as agent, as well as revenue frombrokering money market mutual funds by our Institutional Cash Distributors group.
• Principal Transactions — Principal transactions consist of a portion of dealer spreads attributed toour securities trading activities as principal in Nasdaq-listed and other securities, and include trans-actions derived from our activities as a market-maker. Additionally, principal transactions includegains and losses resulting from market price fluctuations that occur while holding positions in ourtrading security inventory.
The following table sets forth our revenue and several operating metrics which we utilize in measuringand evaluating performance and the results of our trading activity operations:
2007 2006 2005
Revenue:Commissions:
Institutional equities . . . . . . . . . . . . . . . . . . $ 25,312,803 $ 26,348,811 $ 25,240,317Institutional Cash Distributors . . . . . . . . . . . . 6,368,760 3,756,274 1,752,110Total commissions revenue . . . . . . . . . . . . . . $ 31,681,563 $ 30,105,085 $ 26,992,427
Principal transactions:Customer principal transactions, proprietary
trading and market making . . . . . . . . . . . . $ 18,380,237 $ (207,779) $ 308,764Investment portfolio . . . . . . . . . . . . . . . . . . 1,736,155 36,724 1,058,174Total principal transactions revenue . . . . . . . . $ 20,116,392 $ (171,055) $ 1,366,938
Equity research:Publishing analysts . . . . . . . . . . . . . . . . . . . 15 14 14Companies covered . . . . . . . . . . . . . . . . . . . 186 194 136
Transaction Volumes:Number of shares traded . . . . . . . . . . . . . . . 1,160,782,000 937,005,000 983,755,000Number of active clients . . . . . . . . . . . . . . . 597 564 614
Commissions amounted to $31,682,000, or 36%, of our revenue during 2007, representing a 5% increaseover $30,105,000 recognized during 2006. The growth in commissions revenue was attributed to higher assetsbrokered by our Institutional Cash Distributors group during 2007. Commissions revenue from our institu-tional equities trading business was down slightly during 2007 due to a decrease in average commissions pershare, partially offset by higher average daily trading volume.
Commissions amounted to $30,105,000, or 58%, of our revenue during 2006, representing an 11%increase over $26,992,000 recognized during 2005. The higher commissions can be attributed to the increasein the number of companies in our selected growth sectors that are covered by our research analysts from136 at December 31, 2005 to 194 at December 31, 2006. The increase in revenue during 2006 was also dueto an increase in average commissions per share, partially offset by a slight decrease in our average dailytrading volume in equity securities. Finally, assets brokered by our Institutional Cash Distributors group havemore than doubled during 2006.
Principal transaction revenue consists of four different activities — customer principal trades, marketmaking, trading for our proprietary account, and realized and unrealized gains and losses in our investmentportfolio. As a broker-dealer, we account for all of our marketable security positions on a trading basis and as
29
a result, all security positions are marked to fair market value each day. Returns from market making andproprietary trading activities tend to be more volatile than acting as agent or principal for customers.
Principal transactions amounted to $20,116,000, or 23%, of our revenue during 2007, while principaltransactions decreased revenue by $171,000 during 2006. Of the 2007 revenue, $14,164,000 resulted from ourconcentrated position in Points International Ltd (PTSEF.OB). Merriman Curhan Ford & Co. had accumulateda 5,000,000 share position in this security during 2006. During 2007, the price of this security appreciatedsignificantly resulting in a large gain for our firm. We sold approximately 3,000,000 shares of Points duringthe fourth quarter of 2007. This significant principal transactions gain in 2007 may not be recurring in futureperiods as we cannot predict overall market conditions. Other components of principal transactions revenueduring 2007 included principal trades for customers, realized and unrealized gains from our investmentportfolio and trading gains from making markets in equity securities.
During 2006, we incurred $2,255,000 in losses resulting primarily from an unrealized loss from ourposition in Points International Ltd. This loss was partially offset by revenue from principal trades forcustomers.
During the three years ended December 31, 2007, no single brokerage customer accounted for more than10% of our revenue.
Primary Research Revenue
Primary research revenue represents the operating results of Panel Intelligence from the date of theMedPanel acquisition, April 17, 2007, through December 31, 2007. We are now offering independent marketdata and information to clients in the biotechnology, pharmaceutical, medical device, clean tech and financialindustries.
Compensation and Benefits Expenses
Compensation and benefits expense represents the majority of our operating expenses and includesincentive compensation paid to sales, trading, research and investment banking professionals, as well asdiscretionary bonuses, salaries and wages, and stock-based compensation. Incentive compensation variesprimarily based on revenue production. Discretionary bonuses paid to research analysts also vary withcommissions revenue production but includes other qualitative factors as well. Salaries, payroll taxes andemployee benefits tend to vary based on overall headcount.
The following table sets forth the major components of our compensation and benefits for the three yearsended December 31, 2007:
2007 2006 2005
Incentive compensation and discretionarybonuses . . . . . . . . . . . . . . . . . . . . . . . . . . . $34,681,099 $26,563,425 $17,990,288
Salaries and wages . . . . . . . . . . . . . . . . . . . . . 14,627,800 9,076,815 8,995,642Stock-based compensation . . . . . . . . . . . . . . . . 2,824,107 3,836,781 1,959,329Payroll taxes, benefits and other . . . . . . . . . . . . 3,968,881 3,363,410 2,714,229Total compensation and benefits . . . . . . . . . . . . $56,101,887 $42,840,431 $31,659,488
Total compensation and benefits as a percentageof revenue . . . . . . . . . . . . . . . . . . . . . . . . . 64% 83% 73%
Cash compensation and benefits as a percentageof revenue . . . . . . . . . . . . . . . . . . . . . . . . . 61% 75% 69%
The increase in compensation and benefits expense of $13,261,000, or 31%, from 2006 to 2007 was dueprimarily to higher incentive compensation which is directly correlated to revenue production. Cash compen-sation is equal to total compensation and benefits expense excluding stock-based compensation, which is anon-cash expense. Cash compensation and benefits expense as a percentage of revenue decreased to 61%during 2007 as compared to 75% during 2006. This improvement in 2007 was largely attributed to our overallrevenue growth which was 69% higher than 2006 and our extraordinary principal transactions revenue as thisactivity has a low compensation expense ratio.
30
The increase in compensation and benefits expense of $11,181,000 or 35%, from 2005 to 2006 was dueprimarily to higher incentive compensation which is directly correlated to revenue production. Additionally,our stock-based compensation expenses increased by $1,877,000 during 2006 as a result of adoptingSFAS No. 123(R). Cash compensation and benefits expense as a percentage of revenue increased to 75%during 2006 as compared to 69% in 2005. The proprietary trading losses of $2,255,000 during 2006 added 3%to cash compensation as a percentage of revenue as the losses reduced revenue but did not impact compensa-tion expense. The balance of this variance was caused by our increasing certain incentive payouts during thecurrent year.
Stock-based compensation increased by $1,877,000 in 2006 as compared to 2005. We adoptedSFAS 123(R), ‘‘Share-Based Payment,’’ on January 1, 2006 which requires that we recognize compensationexpense for all share-based awards made to employees and directors based on estimated fair values. We usedthe modified prospective application transition method and, accordingly, have not restated financial statementsfor prior periods to include the impact of SFAS 123(R). To determine the valuation of share-based awardsunder SFAS 123(R), we continue to use the Black-Scholes option pricing model that we utilized to determineour pro forma share-based compensation in prior periods. Additional information regarding our adoption ofSFAS 123(R) during 2006 is set forth in the notes to the consolidated financial statements and in ‘‘CriticalAccounting Policies and Estimates.’’
Our headcount has increased from 155 at December 31, 2005 to 166 as of December 31, 2006 to 198 atDecember 31, 2007. No single sales professional accounted for more than 10% of our revenue in 2007 and2006. One sales professional accounted for 12% of our revenue during 2005.
Other Operating Expenses
Brokerage and clearing fees include trade processing expenses that we pay to our clearing broker andexecution fees that we pay to floor brokers and electronic communication networks. Merriman Curhan Ford &Co. is a fully-disclosed broker-dealer, which has engaged a third party clearing broker to perform all of theclearance functions. The clearing broker-dealer processes and settles the customer transactions for MerrimanCurhan Ford & Co. and maintains the detailed customer records. Security trades are executed by third-partybroker-dealers and electronic trading systems. These expenses are almost entirely variable with commissionsrevenue and the volume of brokerage transactions. The slight increase in brokerage and clearing fees of$21,000, or 1% from 2006 to 2007 reflected increased market making activity during the latest year. Theincrease in brokerage and clearing fees of $302,000, or 13% from 2005 to 2006 was inline with our growth inthe brokerage commission activities. We anticipate brokerage and clearing fees for 2008 will increase sequen-tially over 2007 as we are forecasting a higher level of commissions revenue for 2008.
Costs of primary research revenue principally consist of panelist honorarium and recruitment costs.Medical experts receive cash honoraria for participating in qualitative panels and quantitative surveys. We paythe honoraria to the panelists when the panel or survey has been completed and record this expense asincurred. We closed the acquisition of MedPanel on April 17, 2007 and began recognizing primary researchrevenue and related expenses since that date.
Professional services expense includes legal fees, accounting fees, expenses related to investment bankingtransactions and various consulting fees. Many of these expenses, such as legal and accounting fees, are to alarge extent fixed in nature. The increase of $382,000, or 16%, from 2006 to 2007 reflected higher legal feesfor litigation defense and corporate matters, as well as higher accounting and consulting fees mostly in con-nection with the integration of the MedPanel acquisition. The increase of $454,000 or 23%, from 2005 to2006 included higher legal fees in connection with investment banking transactions, costs involved withintroducing our new investment products and litigation related costs. We anticipate professional servicesexpense for 2008 will increase slightly as compared to 2007.
Occupancy and equipment includes rental costs for our office facilities and equipment, as well as equip-ment, software and leasehold improvement expenses. Occupancy expense is largely fixed in nature whileequipment expense tends to increase as we hire additional employees. The increase of $197,000, or 12%, from2006 to 2007 and the increase of $143,000, or 9%, from 2005 to 2006 resulted mostly from expansion of ouroffices as well as computer equipment purchases resulting from the hiring of additional investment banking,research, sales and trading professionals. During 2007, we added the office lease in Cambridge, MA as a result
31
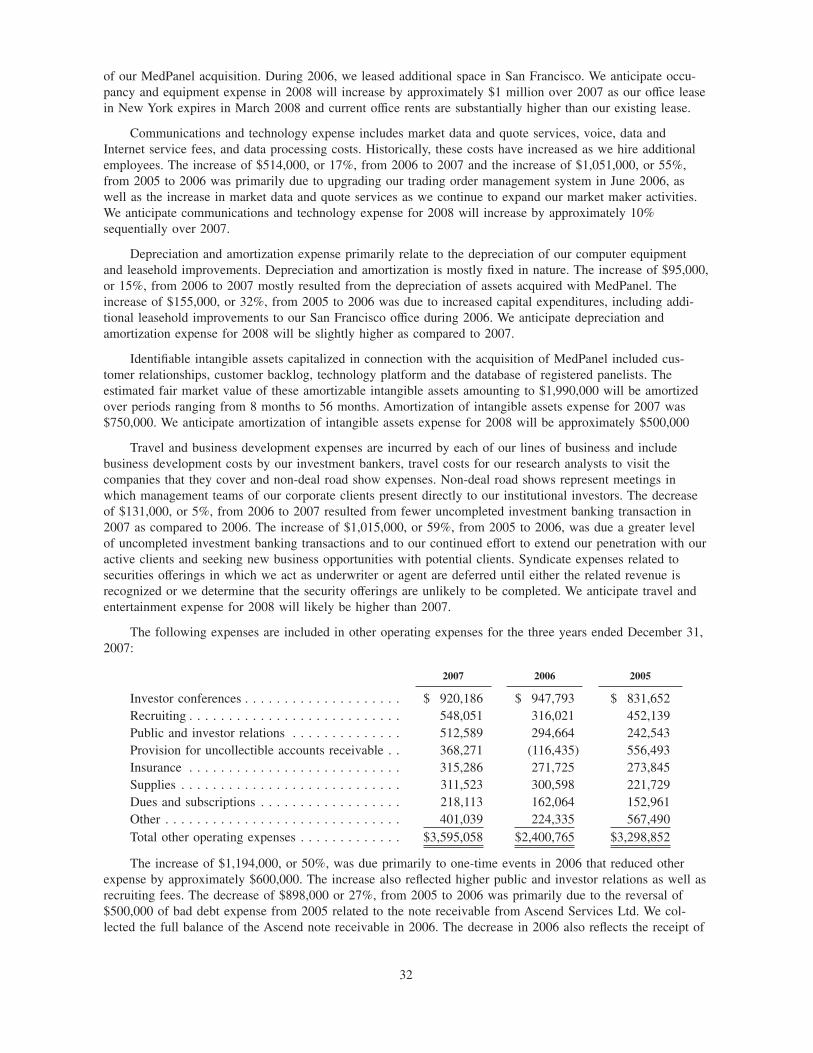
of our MedPanel acquisition. During 2006, we leased additional space in San Francisco. We anticipate occu-pancy and equipment expense in 2008 will increase by approximately $1 million over 2007 as our office leasein New York expires in March 2008 and current office rents are substantially higher than our existing lease.
Communications and technology expense includes market data and quote services, voice, data andInternet service fees, and data processing costs. Historically, these costs have increased as we hire additionalemployees. The increase of $514,000, or 17%, from 2006 to 2007 and the increase of $1,051,000, or 55%,from 2005 to 2006 was primarily due to upgrading our trading order management system in June 2006, aswell as the increase in market data and quote services as we continue to expand our market maker activities.We anticipate communications and technology expense for 2008 will increase by approximately 10%sequentially over 2007.
Depreciation and amortization expense primarily relate to the depreciation of our computer equipmentand leasehold improvements. Depreciation and amortization is mostly fixed in nature. The increase of $95,000,or 15%, from 2006 to 2007 mostly resulted from the depreciation of assets acquired with MedPanel. Theincrease of $155,000, or 32%, from 2005 to 2006 was due to increased capital expenditures, including addi-tional leasehold improvements to our San Francisco office during 2006. We anticipate depreciation andamortization expense for 2008 will be slightly higher as compared to 2007.
Identifiable intangible assets capitalized in connection with the acquisition of MedPanel included cus-tomer relationships, customer backlog, technology platform and the database of registered panelists. Theestimated fair market value of these amortizable intangible assets amounting to $1,990,000 will be amortizedover periods ranging from 8 months to 56 months. Amortization of intangible assets expense for 2007 was$750,000. We anticipate amortization of intangible assets expense for 2008 will be approximately $500,000
Travel and business development expenses are incurred by each of our lines of business and includebusiness development costs by our investment bankers, travel costs for our research analysts to visit thecompanies that they cover and non-deal road show expenses. Non-deal road shows represent meetings inwhich management teams of our corporate clients present directly to our institutional investors. The decreaseof $131,000, or 5%, from 2006 to 2007 resulted from fewer uncompleted investment banking transaction in2007 as compared to 2006. The increase of $1,015,000, or 59%, from 2005 to 2006, was due a greater levelof uncompleted investment banking transactions and to our continued effort to extend our penetration with ouractive clients and seeking new business opportunities with potential clients. Syndicate expenses related tosecurities offerings in which we act as underwriter or agent are deferred until either the related revenue isrecognized or we determine that the security offerings are unlikely to be completed. We anticipate travel andentertainment expense for 2008 will likely be higher than 2007.
The following expenses are included in other operating expenses for the three years ended December 31,2007:
2007 2006 2005
Investor conferences . . . . . . . . . . . . . . . . . . . . $ 920,186 $ 947,793 $ 831,652Recruiting . . . . . . . . . . . . . . . . . . . . . . . . . . . 548,051 316,021 452,139Public and investor relations . . . . . . . . . . . . . . 512,589 294,664 242,543Provision for uncollectible accounts receivable . . 368,271 (116,435) 556,493Insurance . . . . . . . . . . . . . . . . . . . . . . . . . . . 315,286 271,725 273,845Supplies . . . . . . . . . . . . . . . . . . . . . . . . . . . . 311,523 300,598 221,729Dues and subscriptions . . . . . . . . . . . . . . . . . . 218,113 162,064 152,961Other . . . . . . . . . . . . . . . . . . . . . . . . . . . . . . 401,039 224,335 567,490Total other operating expenses . . . . . . . . . . . . . $3,595,058 $2,400,765 $3,298,852
The increase of $1,194,000, or 50%, was due primarily to one-time events in 2006 that reduced otherexpense by approximately $600,000. The increase also reflected higher public and investor relations as well asrecruiting fees. The decrease of $898,000 or 27%, from 2005 to 2006 was primarily due to the reversal of$500,000 of bad debt expense from 2005 related to the note receivable from Ascend Services Ltd. We col-lected the full balance of the Ascend note receivable in 2006. The decrease in 2006 also reflects the receipt of
32

a favorable legal judgment to the firm related to a brokerage activity claim, as well as decrease in recruitingexpense. The 2005 expense also includes the write-off of the $500,000 note receivable from Ascend. Weanticipate other operating expense for 2008 will increase sequentially over 2007.
Loss on Retirement of Convertible Note Payable
In March 2006, we raised $7.5 million in a private placement of a five year convertible debenture with adetachable stock warrant. We raised the capital so that we could invest the proceeds as general partner in theMCF Navigator fund. In December 2006, we repaid the $7.5 million secured convertible note. The proceedsto repay the $7.5 million convertible note were provided by redemption from the MCF Navigator fund. Theinvestor, Midsummer Investment, Ltd., retained the stock warrant to purchase 267,858 shares of commonstock. The Company recorded a loss on the repayment of the convertible note in the amount of $1,349,000,which consisted of $1,154,000 for the write-off of the unamortized discount related to the stock warrant and$195,000 for the write-off the unamortized debt issuance costs. Midsummer reinvested the $7.5 milliondirectly into the MCF Voyager fund and MCF Navigator fund as limited partner.
Interest Income
Interest income represents interest earned on our cash balances maintained at financial institutions. Thedecrease of $23,000, or 5%, from 2006 to 2007 and the increase of approximately $39,000, or 9%, from 2005to 2006 were due to changes in average interest earning assets and average interest rates during these periods.
Interest Expense
Interest expense for 2007 included $128,000 for interest expense and $10,000 for amortization of dis-counts while 2006 included $352,000 for interest expense and $183,000 for amortization of discounts and debtissuance costs. The 2006 expense included interest and amortization expenses from the note payable toMidsummer Investments, Ltd.
Income Tax Expense
Income tax expense was $2,462,000 in 2007 resulting in an effective tax rate of 21%. We did not recordincome tax expense in 2006. The effective tax rate differs from the statutory rate primarily due to the exist-ence and utilization of net operating loss carryforwards which have been offset by a valuation allowanceresulting in a tax provision equal to our expected current expense for the year. We historically have hadcurrent tax expense primarily related to alternative minimum, state and minimum tax liabilities.
Historically and currently, we have recorded a valuation allowance on our deferred tax assets, the signifi-cant component of which relates to net operating loss tax carryforwards. Management continually evaluatesthe realizability of its deferred tax assets based upon negative and positive evidence available. Based on theevidence available at this time, we continue to conclude that it is not ‘‘more likely than not’’ that we will beable to realize the benefit of our deferred tax assets in the near future.
We adopted FASB Interpretation No. 48, Accounting for Uncertainty in Income Taxes — an Interpretationof FASB Statement 109 (‘‘FIN 48’’) on January 1, 2007. As a result of the implementation of FIN 48, werecognized no adjustment in the liability for unrecognized income tax benefits and no corresponding change inretained earnings. We do not have any material accrued interest or penalties associated with any unrecognizedtax benefits. We do not believe it is reasonably possible that our unrecognized tax benefits will significantlychange within the next twelve months. There were no unrecognized tax benefits as of December 31, 2007. Weare subject to taxation in the US and various state and foreign jurisdictions. The tax years 2002-2006 remainopen in several jurisdictions, none of which have individual significance.
Critical Accounting Policies and Estimates
The consolidated financial statements are prepared in accordance with accounting principles generallyaccepted in the United States, which require us to make estimates and judgments that affect the reportedamounts of assets, liabilities, revenues and expenses, and related disclosure of contingent assets and liabilities.On an on-going basis, we evaluate our estimates, including those related to the valuation of securities ownedand deferred tax assets. We base our estimates on historical experience and on various other assumptions that
33
are believed to be reasonable under the circumstances, the results of which form the basis for making judg-ments about the carrying values of assets and liabilities that are not readily apparent from other sources.Actual results could differ from those estimates. We believe the following critical accounting policies affectour more significant judgments and estimates used in the preparation of our consolidated financial statements.
Revenue Recognition
Investment banking revenue includes underwriting and private placement agency fees earned through ourparticipation in public offerings and private placements of equity and convertible debt securities and feesearned as financial advisor in mergers and acquisitions and similar transactions. Underwriting revenue isearned in securities offerings in which we act as an underwriter and includes management fees, selling conces-sions and underwriting fees. Fee revenue relating to underwriting commitments is recorded when allsignificant items relating to the underwriting cycle have been completed and the amount of the underwritingrevenue has been determined. This generally is the point at which all of the following have occurred: (i) theissuer’s registration statement has become effective with the SEC, or other offering documents are finalized,(ii) we have made a firm commitment for the purchase of the shares or debt from the issuer, and (iii) we havebeen informed of the exact number of shares or the principal amount of debt that it has been allotted.
Syndicate expenses related to securities offerings in which we act as underwriter or agent are deferreduntil the related revenue is recognized or we determine that it is more likely than not that the securities offer-ings will not ultimately be completed. Underwriting revenue is presented net of related expenses. Asco-manager for registered equity underwriting transactions, management must estimate our share of transactionrelated expenses incurred by the lead manager in order to recognize revenue. Transaction related expenses arededucted from the underwriting fee and therefore reduces the revenue that is recognized as co-manager. Suchamounts are adjusted to reflect actual expenses in the period in which we receive the final settlement, typically90 days following the closing of the transaction.
Merger and acquisition fees and other advisory service revenue are generally earned and recognized onlyupon successful completion of the engagement. Unreimbursed expenses associated with private placement andadvisory transactions are recorded as expenses as incurred.
Commissions revenue and related clearing expenses are recorded on a trade-date basis as security transac-tions occur. Principal transactions in regular-way trades are recorded on the trade date, as if they had settled.Profit and loss arising from all securities and commodities transactions entered into for the account and risk ofour company are recorded on a trade-date basis.
Primary research revenue is recognized on a proportional performance basis as services are provided.
Valuation of Securities Owned
‘‘Securities owned’’ and ‘‘Securities sold, but not yet purchased’’ in our consolidated statements of finan-cial condition consist of financial instruments carried at fair value or amounts that approximate fair value,with related unrealized gains or losses recognized in our results of operations. The use of fair value to mea-sure these financial instruments, with related unrealized gains and losses recognized immediately in our resultsof operations, is fundamental to our financial statements and is one of our most critical accounting policies.The fair value of a financial instrument is the amount at which the instrument could be exchanged in a currenttransaction between willing parties, other than in a forced or liquidation sale.
Fair values of our financial instruments are generally obtained from quoted market prices in active mar-kets, broker or dealer price quotations, or alternative pricing sources with reasonable levels of pricetransparency. To the extent certain financial instruments trade infrequently or are non-marketable securitiesand, therefore, have little or no price transparency, we value these instruments based on management’s esti-mates. The fair value of these securities is subject to a high degree of volatility and may be susceptible tosignificant fluctuation in the near term. Securities that contain restrictions are stated at a discount to the valueof readily marketable securities. Stock warrants are carried at a discount to fair value as determined by usingthe Black-Scholes Option Pricing model.
34

Stock-Based Compensation
On January 1, 2006, we adopted SFAS 123(R), ‘‘Share-Based Payment,’’ which requires the measurementand recognition of compensation expense, based on estimated fair values, for all share-based awards, made toemployees and directors, including stock options, non-vested stock, and participation in our employee stockpurchase plan. Share-based compensation expense recognized in our consolidated statement of operations forthe two years ended December 31, 2007 includes compensation expense for share-based awards granted(i) prior to, but not yet vested as of December 31, 2005, based on the grant date fair value estimated in accor-dance with the provisions of SFAS 123, and (ii) subsequent to December 31, 2005, based on the grant datefair value estimated in accordance with the provisions of SFAS 123(R).
We estimate the fair value of stock options granted using the Black-Scholes option pricing method. Thisoption pricing model requires the input of highly subjective assumptions, including the option’s expected lifeand the price volatility of the underlying stock. The expected life of employee stock options represents theweighted-average period the stock options are expected to remain outstanding. The Company calculated theexpected term using the lattice model with specific assumptions about the suboptimal exercise behavior,post-vesting termination rates and other relevant factors. The expected stock price volatility was determinedusing the historical volatility of our common stock. The fair value is then amortized on a straight-line basisover the requisite service periods of the awards, which is generally the vesting period.
Because share-based compensation expense is based on awards that are ultimately expected to vest, it hasbeen reduced to account for estimated forfeitures. SFAS 123(R) requires forfeitures to be estimated at the timeof grant and revised, if necessary, in subsequent periods if actual forfeitures differ from those estimates.Changes in these inputs and assumptions can materially affect the measure of estimated fair value of ourshare-based compensation.
Deferred Tax Valuation Allowance
We account for income taxes in accordance with the provision of SFAS No. 109, Accounting for IncomeTaxes, which requires the recognition of deferred tax assets and liabilities at tax rates expected to be in effectwhen these balances reverse. Future tax benefits attributable to temporary differences are recognized to theextent that the realization of such benefits is more likely than not. We have concluded that it is more likelythan not that our deferred tax assets as of December 31, 2007 and 2006 will not be realized based on thescheduling of deferred tax liabilities and projected taxable income. The amount of the deferred tax assetsactually realized, however, could vary if there are differences in the timing or amount of future reversals ofexisting deferred tax liabilities or changes in the actual amounts of future taxable income. Should we deter-mine that we will be able to realize all or part of the deferred tax asset in the future, an adjustment to thedeferred tax asset will be recorded in the period such determination is made.
Goodwill
Goodwill is related to the acquisitions of MedPanel, Inc. Goodwill, totaling $3,130,000, was allocated tothe Primary Research segment pursuant to SFAS No. 142, ‘‘Goodwill and Other Intangible Assets’’. Goodwillrepresents the excess cost of a business acquisition over the fair value of the net assets acquired. In accor-dance with this pronouncement, indefinite-life intangible assets and goodwill are not amortized. Rather, theyare subject to impairment testing on an annual basis, or more often if events or circumstances indicate theremay be impairment. This test involves assigning tangible assets and liabilities, identified intangible assets andgoodwill to reporting units and comparing the fair value of each reporting unit to its carrying amount. If thefair value is less than the carrying amount, a further test is required to measure the amount of the impairment.
When available, we use recent, comparable transactions to estimate the fair value of the respective report-ing unit. We calculate an estimated fair value based on multiples of revenue, earnings, and book value ofcomparable transactions. However, when such comparable transactions are not available or have becomeoutdated, we use discounted cash flow scenarios to estimate the fair value of the reporting units. As ofDecember 31, 2007, we noted no indicators of impairment of goodwill. However, changes in current circum-stances or business conditions could result in an impairment of goodwill. As required, we will performimpairment testing on an annual basis or when an event occurs or circumstances change that would morelikely than not reduce the fair value of a reporting unit below its carrying amount.
35

Liquidity and Capital Resources
Historically, we have satisfied our liquidity and regulatory capital needs through the issuance of equityand debt securities. As of December 31, 2007, liquid assets consisted primarily of cash and cash equivalentsof $31,962,000 and marketable securities of $14,115,000, for a total of $46,077,000, which is $24,837,000higher than $21,240,000 in liquid assets as of December 31, 2006.
Cash and cash equivalents increased by $18,216,000 during 2007. Cash provided by our operating activi-ties for 2007 was $18,216,000 which consists of our net income of $9,323,000 adjusted for non-cash expensesincluding stock-based compensation of $2,824,000, net unrealized gain on securities owned of $6,764,000depreciation and amortization of $740,000, provision for doubtful accounts of $368,000, amortization ofintangible assets of $750,000, partially offset by the increase in commissions and bonus payable of$9,618,000. Cash used in investing activities amounted to $32,000 during 2007 which included (i) net pro-ceeds in connection with our sales of Catalyst and (ii) our purchase of equipment and fixtures. Cash used inour financing activities was $324,000. Our financing activities included proceeds from the issuance of com-mon stock in connection with our employee stock purchase plan, partially offset by debt service payments.
Merriman Curhan Ford & Co., as a broker-dealer, is subject to Rule 15c3-1 of the Securities ExchangeAct of 1934, which specifies uniform minimum net capital requirements, as defined, for their registrants. As ofDecember 31, 2007, Merriman Curhan Ford & Co. had regulatory net capital of $17,848,000, which exceededthe required amount by $16,419,000.
We believe that our existing cash balances and investments will be sufficient to meet our liquidity andcapital spending requirements, both for the next twelve months as well as for the long-term. However, wemay require additional capital investment to fund our working capital if we incur future operating losses. Wecannot be certain that additional debt or equity financing will be available when required or, if available, thatwe can secure it on terms satisfactory to us.
The following is a table summarizing our significant commitments as of December 31, 2007, consistingof debt payments related to convertible and non-convertible notes payable and capital leases and future mini-mum lease payments under all non-cancelable operating leases with initial or remaining terms in excess of oneyear.
NotesPayable
OperatingLeases
CapitalLeases
2008 . . . . . . . . . . . . . . . . . . . . . . . . . . . . . . . . . . . . . $243,573 $ 2,628,402 $563,5262009 . . . . . . . . . . . . . . . . . . . . . . . . . . . . . . . . . . . . . — 2,444,011 341,6742010 . . . . . . . . . . . . . . . . . . . . . . . . . . . . . . . . . . . . . — 2,019,930 50,8802011 . . . . . . . . . . . . . . . . . . . . . . . . . . . . . . . . . . . . . — 1,923,516 —2012 . . . . . . . . . . . . . . . . . . . . . . . . . . . . . . . . . . . . . — 1,174,323 —Thereafter. . . . . . . . . . . . . . . . . . . . . . . . . . . . . . . . . . — 572,000 —Total commitments. . . . . . . . . . . . . . . . . . . . . . . . . . . . $243,573 $10,762,182 $956,080
Off-Balance Sheet Arrangements
We were not a party to any off-balance sheet arrangements during the three years ended December 31,2007. In particular, we do not have any interest in so-called limited purpose entities, which include specialpurpose entities and structured finance entities.
Newly Issued Accounting Standards
In September 2006, the Financial Accounting Standards Board (FASB) issued SFAS 157, ‘‘Fair ValueMeasurements.’’ SFAS 157 defines fair value, establishes a framework for measuring fair value under gener-ally accepted accounting principles, and expands disclosures about fair value measurements. SFAS 157 iseffective for financial statements issued for fiscal years beginning after November 15, 2007, and interimperiods within those fiscal years. On February 6, 2008, the FASB deferred the effective date of Statement 157for one year for all nonfinancial assets and nonfinancial liabilities, except for those items that are recognizedor disclosed at fair value in the financial statements on a recurring basis (at least annually). The adoption ofSFAS 157 did not have a material impact on our consolidated financial statements.
36

In February 2007, the FASB issued SFAS No. 159, ‘‘Fair Value Option for Financial Assets and FinancialLiabilities’’, which permits entities to choose to measure many financial instruments and certain other items atfair value that are not currently required to be measured at fair value and establishes presentation and disclo-sure requirements designed to facilitate comparisons between entities that choose different measurementattributes for similar types of assets and liabilities. SFAS No. 159 is effective for fiscal years beginning afterNovember 15, 2007. We did not adopt SFAS 159 on any individual instrument as of January 1, 2008.
In May 2007, the FASB issued FSP FIN No. 46R-7, ‘‘Application of FASB Interpretation No. 46(R) toInvestment Companies.’’ FSP FIN No. 46R-7 amends the scope of the exception to FIN 46R to state thatinvestments accounted for at fair value in accordance with the specialized accounting guidance in the Ameri-can Institute of Certified Public Accountants (‘‘AICPA’’) Audit and Accounting Guide, Investment Companies,are not subject to consolidation under FIN 46R. This interpretation is effective for fiscal years beginning on orafter December 15, 2007. We do not expect the adoption of FSP FIN No. 46R-7 will have a material impacton our consolidated financial statements.
Item 7a. Quantitative and Qualitative Disclosures about Market Risk
The following discussion about market risk disclosures involves forward-looking statements. Actualresults could differ materially from those projected in the forward-looking statements. We may be exposed tomarket risks related to changes in equity prices, interest rates and foreign currency exchange rates. We do notuse derivative financial instruments for speculative, trading or any other purpose.
Equity Price Risk
The potential for changes in the market value of our trading positions is referred to as ‘‘market risk.’’Our trading positions result from proprietary trading activities. These trading positions in individual equitiesand equity indices may be either long or short at any given time. Equity price risks result from exposures tochanges in prices and volatilities of individual equities and equity indices. We seek to manage this risk expo-sure through diversification and limiting the size of individual positions within the portfolio. The effect onearnings and cash flows of an immediate 10% increase or decrease in equity prices generally is not ascertain-able and could be positive or negative, depending on the positions we hold at the time. We do not establishhedges in related securities or derivatives. From time to time, we also hold equity securities received ascompensation for our services in investment banking transactions. These equity positions are always long.However, as the prices of individual equity securities do not necessarily move in tandem with the direction ofthe general equity market, the effect on earnings and cash flows of an immediate 10% increase or decrease inequity prices generally is not ascertainable.
Interest Rate Risk
Our exposure to market risk resulting from changes in interest rates relates primarily to our investmentportfolio and long term debt obligations. Our interest income and cash flows may be impacted by changes inthe general level of U.S. interest rates. We do not hedge this exposure because we believe that we are notsubject to any material market risk exposure due to the short-term nature of our investments. We would notexpect an immediate 10% increase or decrease in current interest rates to have a material effect on the fairmarket value of our investment portfolio.
Our long term debt obligations bear interest at a fixed rate. Accordingly, an immediate 10% increase ordecrease in current interest rates would not have an impact on our interest expense or cash flows. The fairmarket value of our long term fixed interest rate debt is subject to interest rate risk. Generally, the fair marketvalue of fixed interest rate debt will increase as interest rates fall and decrease as interest rates rise. We wouldnot expect an immediate 10% increase or decrease in current interest rates to have a material impact on thefair market value of our long term debt obligations.
Foreign Currency Risk
We do not have any foreign currency denominated assets or liabilities or purchase commitments and havenot entered into any foreign currency contracts. Accordingly, we are not exposed to fluctuations in foreigncurrency exchange rates.
37

Item 8. Financial Statements and Supplementary Data
The following financial statements are included in this report:
• Report of Independent Registered Public Accounting Firm
• Consolidated Statements of Operations
• Consolidated Statements of Financial Condition
• Consolidated Statements of Stockholders’ Equity
• Consolidated Statements of Cash Flows
• Notes to Consolidated Financial Statements
Schedules other than those listed above are omitted because of the absence of conditions under whichthey are required or because the required information is presented in the financial statements or notes thereto.
38

REPORT OF INDEPENDENT REGISTERED PUBLIC ACCOUNTING FIRM
The Board of Directors and Stockholders ofMCF Corporation and subsidiaries
We have audited the accompanying consolidated statements of financial condition of MCF Corporationand subsidiaries (the ‘‘Company’’) as of December 31, 2007 and 2006, and the related consolidated statementsof operations, stockholders’ equity, and cash flows for each of the three years in the period endedDecember 31, 2007. These financial statements are the responsibility of the Company’s management. Ourresponsibility is to express an opinion on these financial statements based on our audits.
We conducted our audits in accordance with the standards of the Public Company Accounting OversightBoard (United States). Those standards require that we plan and perform the audit to obtain reasonable assur-ance about whether the financial statements are free of material misstatement. An audit includes examining, ona test basis, evidence supporting the amounts and disclosures in the financial statements. An audit alsoincludes assessing the accounting principles used and significant estimates made by management, as well asevaluating the overall financial statement presentation. We believe that our audits provide a reasonable basisfor our opinion.
In our opinion, the financial statements referred to above present fairly, in all material respects, theconsolidated financial condition of MCF Corporation and subsidiaries at December 31, 2007 and 2006, andthe consolidated results of their operations and their cash flows for each of the three years in the period endedDecember 31, 2007, in conformity with U.S. generally accepted accounting principles.
As discussed in Note 2 to the consolidated financial statements, in 2007 the Company adopted FASBInterpretation No. 48, ‘‘Accounting for Uncertainty in Income Taxes — an interpretation of FASB StatementNo. 109.’’ As discussed in Note 2 to the consolidated financial statements, in 2006 the Company adoptedStatement of Financial Accounting Standards No. 123 (revised 2004), ‘‘Share-Based Payment.’’
We also have audited, in accordance with the standards of the Public Company Accounting OversightBoard (United States), the Company’s internal control over financial reporting as of December 31, 2007, basedon criteria established in Internal Control-Integrated Framework issued by the Committee of SponsoringOrganizations of the Treadway Commission and our report dated February 11, 2008, expressed an unqualifiedopinion thereon.
/s/ Ernst & Young LLP
San Francisco, CaliforniaFebruary 11, 2008
39
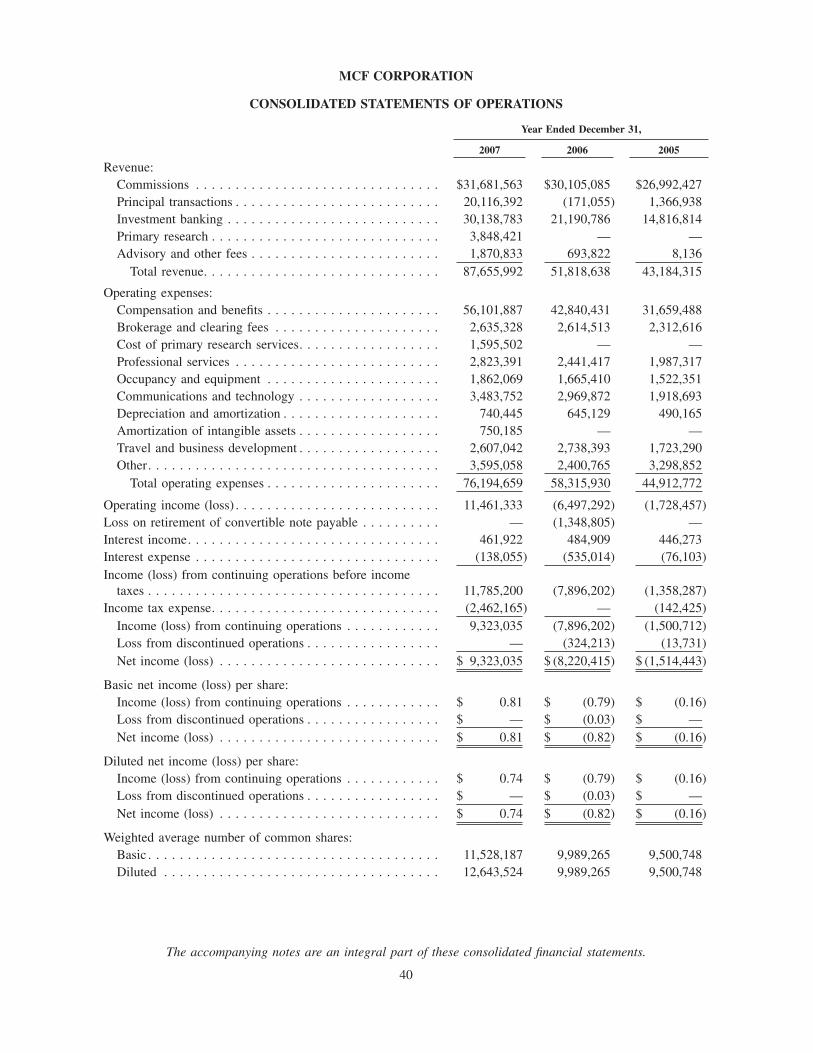
MCF CORPORATION
CONSOLIDATED STATEMENTS OF OPERATIONS
Year Ended December 31,
2007 2006 2005
Revenue:Commissions . . . . . . . . . . . . . . . . . . . . . . . . . . . . . . . $31,681,563 $30,105,085 $26,992,427Principal transactions . . . . . . . . . . . . . . . . . . . . . . . . . . 20,116,392 (171,055) 1,366,938Investment banking . . . . . . . . . . . . . . . . . . . . . . . . . . . 30,138,783 21,190,786 14,816,814Primary research . . . . . . . . . . . . . . . . . . . . . . . . . . . . . 3,848,421 — —Advisory and other fees . . . . . . . . . . . . . . . . . . . . . . . . 1,870,833 693,822 8,136
Total revenue. . . . . . . . . . . . . . . . . . . . . . . . . . . . . . 87,655,992 51,818,638 43,184,315
Operating expenses:Compensation and benefits . . . . . . . . . . . . . . . . . . . . . . 56,101,887 42,840,431 31,659,488Brokerage and clearing fees . . . . . . . . . . . . . . . . . . . . . 2,635,328 2,614,513 2,312,616Cost of primary research services. . . . . . . . . . . . . . . . . . 1,595,502 — —Professional services . . . . . . . . . . . . . . . . . . . . . . . . . . 2,823,391 2,441,417 1,987,317Occupancy and equipment . . . . . . . . . . . . . . . . . . . . . . 1,862,069 1,665,410 1,522,351Communications and technology . . . . . . . . . . . . . . . . . . 3,483,752 2,969,872 1,918,693Depreciation and amortization . . . . . . . . . . . . . . . . . . . . 740,445 645,129 490,165Amortization of intangible assets . . . . . . . . . . . . . . . . . . 750,185 — —Travel and business development . . . . . . . . . . . . . . . . . . 2,607,042 2,738,393 1,723,290Other. . . . . . . . . . . . . . . . . . . . . . . . . . . . . . . . . . . . . 3,595,058 2,400,765 3,298,852
Total operating expenses . . . . . . . . . . . . . . . . . . . . . . 76,194,659 58,315,930 44,912,772
Operating income (loss) . . . . . . . . . . . . . . . . . . . . . . . . . . 11,461,333 (6,497,292) (1,728,457)Loss on retirement of convertible note payable . . . . . . . . . . — (1,348,805) —Interest income. . . . . . . . . . . . . . . . . . . . . . . . . . . . . . . . 461,922 484,909 446,273Interest expense . . . . . . . . . . . . . . . . . . . . . . . . . . . . . . . (138,055) (535,014) (76,103)Income (loss) from continuing operations before income
taxes . . . . . . . . . . . . . . . . . . . . . . . . . . . . . . . . . . . . . 11,785,200 (7,896,202) (1,358,287)Income tax expense. . . . . . . . . . . . . . . . . . . . . . . . . . . . . (2,462,165) — (142,425)
Income (loss) from continuing operations . . . . . . . . . . . . 9,323,035 (7,896,202) (1,500,712)Loss from discontinued operations . . . . . . . . . . . . . . . . . — (324,213) (13,731)Net income (loss) . . . . . . . . . . . . . . . . . . . . . . . . . . . . $ 9,323,035 $ (8,220,415) $ (1,514,443)
Basic net income (loss) per share:Income (loss) from continuing operations . . . . . . . . . . . . $ 0.81 $ (0.79) $ (0.16)Loss from discontinued operations . . . . . . . . . . . . . . . . . $ — $ (0.03) $ —Net income (loss) . . . . . . . . . . . . . . . . . . . . . . . . . . . . $ 0.81 $ (0.82) $ (0.16)
Diluted net income (loss) per share:Income (loss) from continuing operations . . . . . . . . . . . . $ 0.74 $ (0.79) $ (0.16)Loss from discontinued operations . . . . . . . . . . . . . . . . . $ — $ (0.03) $ —Net income (loss) . . . . . . . . . . . . . . . . . . . . . . . . . . . . $ 0.74 $ (0.82) $ (0.16)
Weighted average number of common shares:Basic . . . . . . . . . . . . . . . . . . . . . . . . . . . . . . . . . . . . . 11,528,187 9,989,265 9,500,748Diluted . . . . . . . . . . . . . . . . . . . . . . . . . . . . . . . . . . . 12,643,524 9,989,265 9,500,748
The accompanying notes are an integral part of these consolidated financial statements.
40
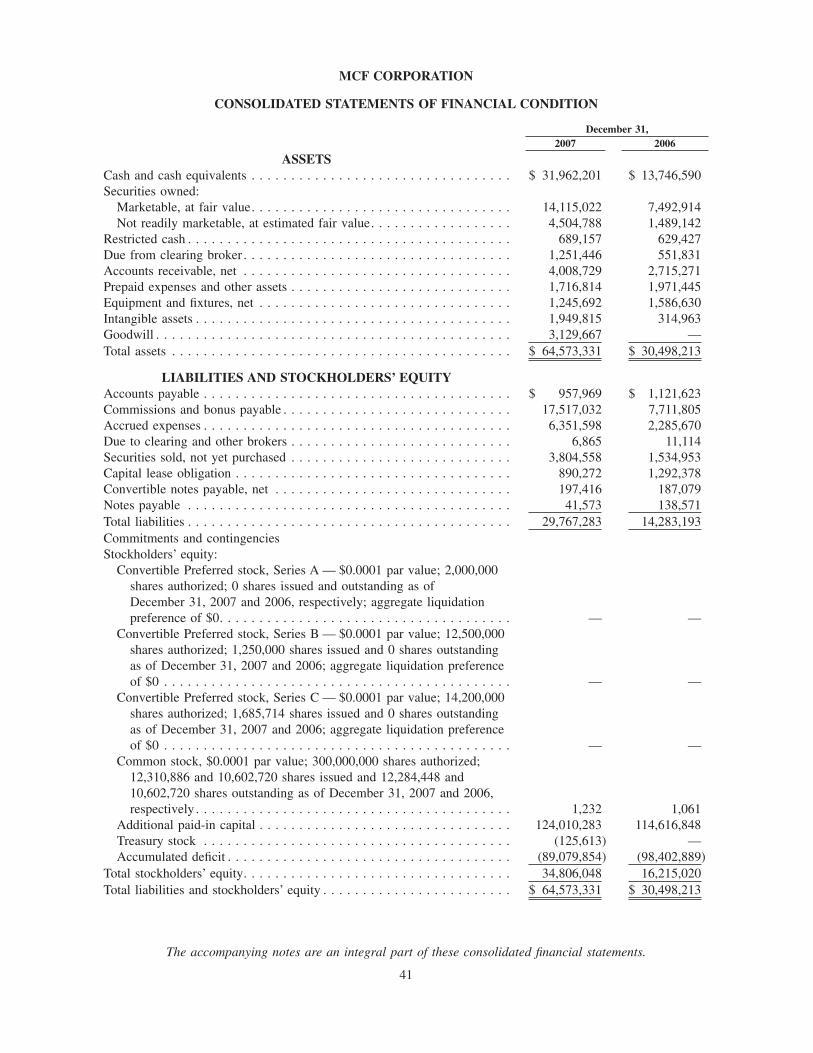
MCF CORPORATION
CONSOLIDATED STATEMENTS OF FINANCIAL CONDITION
December 31,2007 2006
ASSETSCash and cash equivalents . . . . . . . . . . . . . . . . . . . . . . . . . . . . . . . . . $ 31,962,201 $ 13,746,590Securities owned:
Marketable, at fair value. . . . . . . . . . . . . . . . . . . . . . . . . . . . . . . . . 14,115,022 7,492,914Not readily marketable, at estimated fair value. . . . . . . . . . . . . . . . . . 4,504,788 1,489,142
Restricted cash . . . . . . . . . . . . . . . . . . . . . . . . . . . . . . . . . . . . . . . . . 689,157 629,427Due from clearing broker . . . . . . . . . . . . . . . . . . . . . . . . . . . . . . . . . . 1,251,446 551,831Accounts receivable, net . . . . . . . . . . . . . . . . . . . . . . . . . . . . . . . . . . 4,008,729 2,715,271Prepaid expenses and other assets . . . . . . . . . . . . . . . . . . . . . . . . . . . . 1,716,814 1,971,445Equipment and fixtures, net . . . . . . . . . . . . . . . . . . . . . . . . . . . . . . . . 1,245,692 1,586,630Intangible assets . . . . . . . . . . . . . . . . . . . . . . . . . . . . . . . . . . . . . . . . 1,949,815 314,963Goodwill . . . . . . . . . . . . . . . . . . . . . . . . . . . . . . . . . . . . . . . . . . . . . 3,129,667 —Total assets . . . . . . . . . . . . . . . . . . . . . . . . . . . . . . . . . . . . . . . . . . . $ 64,573,331 $ 30,498,213
LIABILITIES AND STOCKHOLDERS’ EQUITYAccounts payable . . . . . . . . . . . . . . . . . . . . . . . . . . . . . . . . . . . . . . . $ 957,969 $ 1,121,623Commissions and bonus payable . . . . . . . . . . . . . . . . . . . . . . . . . . . . . 17,517,032 7,711,805Accrued expenses . . . . . . . . . . . . . . . . . . . . . . . . . . . . . . . . . . . . . . . 6,351,598 2,285,670Due to clearing and other brokers . . . . . . . . . . . . . . . . . . . . . . . . . . . . 6,865 11,114Securities sold, not yet purchased . . . . . . . . . . . . . . . . . . . . . . . . . . . . 3,804,558 1,534,953Capital lease obligation . . . . . . . . . . . . . . . . . . . . . . . . . . . . . . . . . . . 890,272 1,292,378Convertible notes payable, net . . . . . . . . . . . . . . . . . . . . . . . . . . . . . . 197,416 187,079Notes payable . . . . . . . . . . . . . . . . . . . . . . . . . . . . . . . . . . . . . . . . . 41,573 138,571Total liabilities . . . . . . . . . . . . . . . . . . . . . . . . . . . . . . . . . . . . . . . . . 29,767,283 14,283,193Commitments and contingenciesStockholders’ equity:
Convertible Preferred stock, Series A — $0.0001 par value; 2,000,000shares authorized; 0 shares issued and outstanding as ofDecember 31, 2007 and 2006, respectively; aggregate liquidationpreference of $0. . . . . . . . . . . . . . . . . . . . . . . . . . . . . . . . . . . . . — —
Convertible Preferred stock, Series B — $0.0001 par value; 12,500,000shares authorized; 1,250,000 shares issued and 0 shares outstandingas of December 31, 2007 and 2006; aggregate liquidation preferenceof $0 . . . . . . . . . . . . . . . . . . . . . . . . . . . . . . . . . . . . . . . . . . . . — —
Convertible Preferred stock, Series C — $0.0001 par value; 14,200,000shares authorized; 1,685,714 shares issued and 0 shares outstandingas of December 31, 2007 and 2006; aggregate liquidation preferenceof $0 . . . . . . . . . . . . . . . . . . . . . . . . . . . . . . . . . . . . . . . . . . . . — —
Common stock, $0.0001 par value; 300,000,000 shares authorized;12,310,886 and 10,602,720 shares issued and 12,284,448 and10,602,720 shares outstanding as of December 31, 2007 and 2006,respectively . . . . . . . . . . . . . . . . . . . . . . . . . . . . . . . . . . . . . . . . 1,232 1,061
Additional paid-in capital . . . . . . . . . . . . . . . . . . . . . . . . . . . . . . . . 124,010,283 114,616,848Treasury stock . . . . . . . . . . . . . . . . . . . . . . . . . . . . . . . . . . . . . . . (125,613) —Accumulated deficit . . . . . . . . . . . . . . . . . . . . . . . . . . . . . . . . . . . . (89,079,854) (98,402,889)
Total stockholders’ equity. . . . . . . . . . . . . . . . . . . . . . . . . . . . . . . . . . 34,806,048 16,215,020Total liabilities and stockholders’ equity . . . . . . . . . . . . . . . . . . . . . . . . $ 64,573,331 $ 30,498,213
The accompanying notes are an integral part of these consolidated financial statements.
41

MC
FC
OR
PO
RA
TIO
N
CO
NSO
LID
AT
ED
STA
TE
ME
NT
SO
FST
OC
KH
OL
DE
RS’
EQ
UIT
Y
Pre
ferr
edSt
ock
Com
mon
Stoc
kT
reas
ury
Stoc
kA
ddit
iona
lP
aid-
inC
apit
alD
efer
red
Com
pens
atio
nA
ccum
ulat
edD
efici
tSh
ares
Am
ount
Shar
esA
mou
ntSh
ares
Am
ount
Tota
l
Bal
ance
atD
ecem
ber
31,
2004
..
.—
$—9,
806,
946
$98
1—
$—
$108
,564
,776
$(3,
163,
876)
$(88
,668
,031
)$1
6,73
3,85
0
Net
loss
..
..
..
..
..
..
..
.—
——
——
——
—(1
,514
,443
)(1
,514
,443
)
Issu
ance
ofco
mm
onst
ock
..
..
.—
—22
0,89
922
——
1,21
7,84
6—
—1,
217,
846
Issu
ance
ofre
stri
cted
com
mon
stoc
k.
..
..
..
..
..
..
..
.—
—18
1,74
318
——
1,95
4,27
4(1
,954
,292
)—
—
Opt
ions
with
intr
insi
cva
lue
toem
ploy
ees
..
..
..
..
..
..
.—
——
——
—(1
2,00
0)12
,000
——
Stoc
k-ba
sed
com
pens
atio
n.
..
..
——
——
——
—1,
959,
329
—1,
959,
329
Tax
bene
fits
from
empl
oyee
stoc
kop
tion
plan
s.
..
..
..
..
..
.—
——
——
—6,
397
——
6,39
7
Bal
ance
atD
ecem
ber
31,
2005
..
.—
$—10
,209
,588
$1,0
21—
$—
$11
1,73
1,29
3$(
3,14
6,83
9)$(
90,1
82,4
74)
$18,
403,
001
Net
loss
..
..
..
..
..
..
..
.—
——
——
——
—(8
,220
,415
)(8
,220
,415
)
Issu
ance
ofco
mm
onst
ock
..
..
.—
—24
7,80
825
——
713,
062
——
713,
087
Issu
ance
ofre
stri
cted
com
mon
stoc
k.
..
..
..
..
..
..
..
.—
—52
,465
6—
—(6
)—
——
Exe
rcis
eof
stoc
kw
arra
nts
..
..
.—
—92
,859
9—
—19
1,99
1—
—19
2,00
0
Rem
oval
ofop
enin
gde
ferr
edst
ock
com
pens
atio
nba
lanc
eup
onad
optio
nof
SFA
S12
3(R
)..
..
.—
——
——
—(3
,146
,839
)3,
146,
839
—
Stoc
k-ba
sed
com
pens
atio
n.
..
..
——
——
——
3,83
6,78
1—
—3,
836,
781
Issu
ance
ofst
ock
war
rant
s.
..
..
——
——
——
1,29
0,56
6—
—1,
290,
566
Bal
ance
atD
ecem
ber
31,
2006
..
.—
$—10
,602
,720
$1,0
61—
$—
$114
,616
,848
$—
$(98
,402
,889
)$1
6,21
5,02
0
Net
inco
me.
..
..
..
..
..
..
.—
——
——
——
—9,
323,
035
9,32
3,03
5
Issu
ance
ofco
mm
onst
ock
for
Med
Pane
lac
quis
ition
..
..
..
.—
—1,
500,
120
150
——
6,09
0,33
7—
—6,
090,
487
Issu
ance
ofco
mm
onst
ock
..
..
.—
—56
,857
5—
—23
5,07
6—
—23
5,08
1
Issu
ance
ofre
stri
cted
com
mon
stoc
k.
..
..
..
..
..
..
..
.—
—12
0,12
612
——
25,7
39—
—25
,751
Exe
rcis
eof
stoc
kw
arra
nts
..
..
.—
—83
,939
9—
—17
2,98
7—
—17
2,99
6
Com
mon
stoc
kre
turn
edfr
omC
atal
yst
Shar
ehol
der
..
..
..
.—
—(5
2,87
6)(5
)(2
6,43
8)(1
25,6
13)
5—
—(1
25,6
13)
Tax
bene
fits
from
empl
oyee
stoc
kop
tion
plan
s.
..
..
..
..
..
.—
——
——
—45
,184
——
45,1
84
Stoc
k-ba
sed
com
pens
atio
n.
..
..
——
——
——
2,82
4,10
7—
—2,
824,
107
Bal
ance
atD
ecem
ber
31,
2007
..
.—
$—12
,310
,886
$1,2
32(2
6,43
8)$(
125,
613)
$124
,010
,283
$—
$(89
,079
,854
)$3
4,80
6,04
8
The
acco
mpa
nyin
gno
tes
are
anin
tegr
alpa
rtof
thes
eco
nsol
idat
edfin
anci
alst
atem
ents
.
42

MCF CORPORATION
CONSOLIDATED STATEMENTS OF CASH FLOWS
Year Ended December 31,2007 2006 2005
Cash flows from operating activities:Net income (loss) . . . . . . . . . . . . . . . . . . . . . . . . . . . . . . . . $ 9,323,035 $ (8,220,415) $ (1,514,443)Adjustments to reconcile net income (loss) to net cash
provided by (used in) operating activities:Depreciation and amortization . . . . . . . . . . . . . . . . . . . . . . 740,445 655,334 493,672Stock-based compensation . . . . . . . . . . . . . . . . . . . . . . . . 2,824,107 3,836,781 1,959,329Issuance of common stock to consultant . . . . . . . . . . . . . . . 75,791 — —Tax benefits from employee stock option plans . . . . . . . . . . 45,184 — 6,397Amortization of discounts on convertible notes payable. . . . . 10,332 146,776 10,335Amortization of debt issuance costs . . . . . . . . . . . . . . . . . . — 35,757 —Amortization of intangible asset. . . . . . . . . . . . . . . . . . . . . 750,185 138,051 34,366Loss on retirement of convertible note payable . . . . . . . . . . — 1,348,805 —Bad debt expense related to Ascend . . . . . . . . . . . . . . . . . . — — 556,493Loss on disposal of equipment and fixtures . . . . . . . . . . . . . 5,553 14,196 —Provision for uncollectible accounts receivable. . . . . . . . . . . 368,272 383,565 —Common stock received for services. . . . . . . . . . . . . . . . . . (400,875) — —Unrealized (gain) loss on securities owned . . . . . . . . . . . . . (6,763,635) 2,172,407 (1,491,688)
Changes in operating assets and liabilities:Marketable and non-marketable securities owned . . . . . . . . . (203,639) (203,536) (5,558,454)Restricted cash . . . . . . . . . . . . . . . . . . . . . . . . . . . . . . . . (59,730) (1,821) (2,606)Due from clearing broker . . . . . . . . . . . . . . . . . . . . . . . . . (699,615) 421,307 (185,276)Accounts receivable . . . . . . . . . . . . . . . . . . . . . . . . . . . . . (649,560) (789,908) (550,295)Prepaid expenses and other assets . . . . . . . . . . . . . . . . . . . 404,769 (786,306) (474,907)Accounts payable . . . . . . . . . . . . . . . . . . . . . . . . . . . . . . (740,825) 220,485 468,387Commissions and bonus payable . . . . . . . . . . . . . . . . . . . . 9,617,504 2,975,913 78,657Accrued liabilities . . . . . . . . . . . . . . . . . . . . . . . . . . . . . . 3,928,196 84,171 956,932Due to clearing and other brokers . . . . . . . . . . . . . . . . . . . (4,249) (107,684) 19,593
Net cash provided by (used in) operating activities . . . . . . 18,571,245 2,323,878 (5,193,508)Cash flows from investing activities:
Purchase of equipment and fixtures . . . . . . . . . . . . . . . . . . (170,541) (78,216) (203,665)Acquisition of Catalyst . . . . . . . . . . . . . . . . . . . . . . . . . . . — (58,558) (353,882)Proceeds from sale of Catalyst. . . . . . . . . . . . . . . . . . . . . . 163,219 — —Investment in MCF Navigator fund . . . . . . . . . . . . . . . . . . — (7,500,000) —Redemption from MCF Navigator fund. . . . . . . . . . . . . . . . — 7,500,000 —Acquisition of MedPanel . . . . . . . . . . . . . . . . . . . . . . . . . 670,027 — —Increase in intangible assets . . . . . . . . . . . . . . . . . . . . . . . (694,612) — —
Net cash used in investing activities . . . . . . . . . . . . . . . . (31,907) (136,774) (557,547)Cash flows from financing activities:
Proceeds from the issuance of common stock . . . . . . . . . . . 185,041 603,070 591,648Proceeds from the exercise of stock options and warrants . . . 172,996 302,017 126,220Proceeds from convertible debenture and stock warrant . . . . . — 7,500,000 —Repayment of convertible debenture . . . . . . . . . . . . . . . . . . — (7,500,000) —Debt service principal payments . . . . . . . . . . . . . . . . . . . . (681,764) (484,524) (1,287,003)
Net cash provided by (used in) financing activities. . . . . . . . . . (323,727) 420,563 (569,135)Increase (decrease) in cash and cash equivalents . . . . . . . . . . . . . 18,215,611 2,607,667 (6,320,190)Cash and cash equivalents at beginning of year . . . . . . . . . . . . . 13,746,590 11,138,923 17,459,113Cash and cash equivalents at end of year . . . . . . . . . . . . . . . . . . $31,962,201 $13,746,590 $11,138,923
The accompanying notes are an integral part of these consolidated financial statements.
43
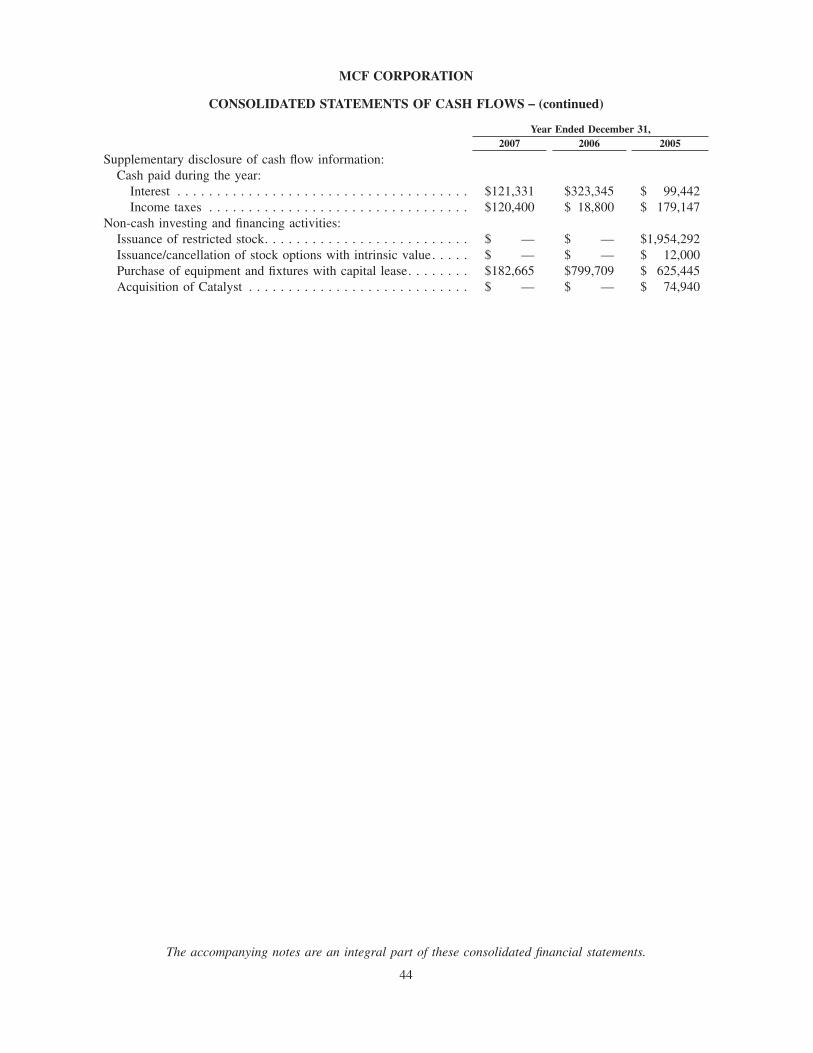
MCF CORPORATION
CONSOLIDATED STATEMENTS OF CASH FLOWS − (continued)
Year Ended December 31,2007 2006 2005
Supplementary disclosure of cash flow information:Cash paid during the year:
Interest . . . . . . . . . . . . . . . . . . . . . . . . . . . . . . . . . . . . . $121,331 $323,345 $ 99,442Income taxes . . . . . . . . . . . . . . . . . . . . . . . . . . . . . . . . . $120,400 $ 18,800 $ 179,147
Non-cash investing and financing activities:Issuance of restricted stock. . . . . . . . . . . . . . . . . . . . . . . . . . $ — $ — $1,954,292Issuance/cancellation of stock options with intrinsic value. . . . . $ — $ — $ 12,000Purchase of equipment and fixtures with capital lease. . . . . . . . $182,665 $799,709 $ 625,445Acquisition of Catalyst . . . . . . . . . . . . . . . . . . . . . . . . . . . . $ — $ — $ 74,940
The accompanying notes are an integral part of these consolidated financial statements.
44

MCF CORPORATION
NOTES TO CONSOLIDATED FINANCIAL STATEMENTS
1. Description of Business
MCF Corporation is a financial services holding company that provides investment banking, capitalmarkets services, corporate and venture services, investment banking, asset management and primary researchthrough its operating subsidiaries, Merriman Curhan Ford & Co., MCF Asset Management, LLC and PanelIntelligence, LLC. Merriman Curhan Ford & Co. is an investment bank and securities broker-dealer focusedon fast growing companies and institutional investors. MCF Asset Management, LLC manages absolute returninvestment products for institutional and high-net worth clients. Panel Intelligence offers primary researchservices to biotechnology, pharmaceutical, medical device, clean technology and financial services companies.Merriman Curhan Ford & Co. is registered with the Securities and Exchange Commission as a broker-dealerand is a member of the Financial Industry Regulatory Authority and Securities Investor ProtectionCorporation.
MCF Corporation, also referred to as the Company, formerly Ratexchange Corporation, NetAmerica.comCorporation and Venture World, Ltd., is a Delaware corporation organized on May 6, 1987. The Company’scommon stock was listed on the American Stock Exchange in July 2000 and was listed on Nasdaq in Febru-ary 2008, where it currently trades under the symbol ‘‘MERR.’’ The Company’s corporate office is located inSan Francisco, California.
Prior to 2002, the Company was engaged in the creation of liquid marketplaces for bandwidth and othertelecommunications products, as well as providing trading strategies in the futures and derivatives markets.This prior business experienced significant net losses that resulted in an accumulated deficit of $87,731,000 asof December 31, 2001.
In December 2001, the Company acquired Instream Securities, Inc. and later changed the name of theentity to RTX Securities Corporation, then to Merriman Curhan Ford & Co. The Company formed MCF AssetManagement, LLC in January 2004, MCF Wealth Management, LLC in January 2005, and Panel Intelligance,LLC in April 2007 as wholly owned subsidiaries. MCF Wealth Management, LLC is accounted for as discon-tinued operations in these consolidated financial statements.
2. Summary of Significant Accounting Policies
Principles of Consolidation
As of December 31, 2007, MCF Corporation wholly owned three U.S. subsidiaries that have been con-solidated in the accompanying financial statements. The subsidiaries are Merriman Curhan Ford & Co., MCFAsset Management, LLC and Panel Intelligence, LLC. All significant inter-company accounts and transactionshave been eliminated.
Reverse Stock Split
In November 2006, the Company effected a one-for-seven reverse stock split of the Company’s commonstock. All references to share and per share data for all periods presented have been retroactively adjusted togive effect to the one-for-seven reverse stock split.
Cash and Cash Equivalents
The Company considers all highly liquid investments purchased with original maturities of ninety days orless to be cash equivalents.
Restricted Cash
Restricted cash includes cash deposited with our clearing broker and cash collateral for a stand-by letterof credit with a commercial bank.
Securities Owned
‘‘Securities owned’’ and ‘‘Securities sold, but not yet purchased’’ in the consolidated statements of finan-cial condition consist of financial instruments carried at fair value or amounts that approximate fair value,
45

MCF CORPORATION
NOTES TO CONSOLIDATED FINANCIAL STATEMENTS
2. Summary of Significant Accounting Policies − (continued)
with related unrealized gains or losses recognized in the results of operations. The fair value of a financialinstrument is the amount at which the instrument could be exchanged in a current transaction between willingparties, other than in a forced or liquidation sale.
Fair values of the financial instruments are generally obtained from quoted market prices in active mar-kets, broker or dealer price quotations, or alternative pricing sources with reasonable levels of pricetransparency. To the extent certain financial instruments trade infrequently or are non-marketable securitiesand, therefore, have little or no price transparency, the Company values these instruments based on manage-ment’s estimates. The fair value of these securities is subject to a high degree of volatility and may besusceptible to significant fluctuation in the near term. Securities that contain resale restrictions are stated at adiscount to the value of readily marketable securities. Stock warrants are carried at a discount to fair value asdetermined by using the Black-Scholes Option Pricing model due to illiquidity.
Accounts Receivable
Accounts receivable are recorded at the invoiced amount and do not bear interest. To the extent deemednecessary, the Company maintains an allowance for estimated losses from the inability of clients to makerequired payment. The collectibility of outstanding invoices is continually assessed. In estimating the allow-ance, the Company considers factors such as historical collections, a client’s current creditworthiness, age ofthe receivable balance and general economic conditions that may affect a client’s ability to pay.
Equipment and Fixtures
Equipment and fixtures are reported at historical cost, net of accumulated depreciation and amortization.Depreciation and amortization are computed using the straight-line method over useful lives of three to fiveyears. Leasehold improvements are amortized using the straight-line method over the lesser of the life of thelease or the service lives of the improvements.
Long-Lived Assets
The Company evaluates its long-lived assets for impairment whenever events or changes in circumstancesindicate that the carrying amount of such assets may not be recoverable. Recoverability of assets to be heldand used is measured by a comparison of the carrying amount of an asset to future net cash flows expected tobe generated by the asset. When assets are considered to be impaired, the impairment to be recognized ismeasured as the amount by which the carrying amount of the assets exceeds the fair value of the assets.Assets to be disposed of are reported at the lower of the carrying amount or fair value less costs to sell.
Discontinued Operations and Assets Held for Sale
For those businesses where management has committed to a plan to divest, each business is valued at thelower of its carrying amount or estimated fair value less cost to sell. If the carrying amount of the businessexceeds its estimated fair value, a loss is recognized. For businesses classified as discontinued operations,statement of operations results are reclassified from their historical presentation to discontinued operations inthe consolidated statements of operations for all periods presented. The gains or losses associated with thesedivested businesses are recorded in income (loss) from discontinued operations in the consolidated statementsof operations. Additionally, segment information does not include the results of businesses classified as discon-tinued operations.
Goodwill and Intangible Assets
Goodwill is related to the acquisition of MedPanel, Inc. Goodwill, totaling $3,130,000, was allocated tothe Primary Research segment pursuant to SFAS No. 142, ‘‘Goodwill and Other Intangible Assets.’’ Goodwillrepresents the excess cost of a business acquisition over the fair value of the net assets acquired. In accor-dance with this pronouncement, indefinite-life intangible assets and goodwill are not amortized. Rather, they
46
MCF CORPORATION
NOTES TO CONSOLIDATED FINANCIAL STATEMENTS
2. Summary of Significant Accounting Policies − (continued)
are subject to impairment testing on an annual basis, or more often if events or circumstances indicate theremay be impairment. This test involves assigning tangible assets and liabilities, identified intangible assets andgoodwill to reporting units and comparing the fair value of each reporting unit to its carrying amount. If thefair value is less than the carrying amount, a further test is required to measure the amount of the impairment.
When available, the Company uses recent, comparable transactions to estimate the fair value of therespective reporting unit. The Company calculates an estimated fair value based on multiples of revenue,earnings, and book value of comparable transactions. However, when such comparable transactions are notavailable or have become outdated, the Company uses discounted cash flow scenarios to estimate the fairvalue of the reporting units. As of December 31, 2007, the Company noted no indicators of impairment ofgoodwill. However, changes in current circumstances or business conditions could result in an impairment ofgoodwill. As required, the Company will perform impairment testing on an annual basis or when an eventoccurs or circumstances change that would more likely than not reduce the fair value of a reporting unitbelow its carrying amount.
Investment Banking Revenue
Investment banking revenue includes underwriting and private placement agency fees earned through theCompany’s participation in public offerings and private placements of equity and convertible debt securitiesand fees earned as financial advisor in mergers and acquisitions and similar transactions. Underwriting revenueis earned in securities offerings in which the Company acts as an underwriter and includes management fees,selling concessions and underwriting fees. Fee revenue relating to underwriting commitments is recordedwhen all significant items relating to the underwriting cycle have been completed and the amount of theunderwriting revenue has been determined. This generally is the point at which all of the following haveoccurred: (i) the issuer’s registration statement has become effective with the SEC, or other offering docu-ments are finalized, (ii) the Company has made a firm commitment for the purchase of the shares or debtfrom the issuer, and (iii) the Company has been informed of the exact number of shares or the principalamount of debt that it has been allotted.
Syndicate expenses related to securities offerings in which the Company acts as underwriter or agent aredeferred until the related revenue is recognized or we determine that it is more likely than not that the securi-ties offerings will not ultimately be completed. Underwriting revenue is presented net of related expenses. Asco-manager for registered equity underwriting transactions, management must estimate the Company’s shareof transaction related expenses incurred by the lead manager in order to recognize revenue. Transaction relatedexpenses are deducted from the underwriting fee and therefore reduces the revenue that is recognized asco-manager. Such amounts are adjusted to reflect actual expenses in the period in which the Companyreceives the final settlement, typically 90 days following the closing of the transaction.
Merger and acquisition fees and other advisory service revenue are generally earned and recognized onlyupon successful completion of the engagement. Unreimbursed expenses associated with private placement andadvisory transactions are recorded as expenses as incurred.
Commissions and Principal Transactions Revenue
Commissions revenue includes revenue resulting from executing stock exchange-listed securities, over-thecounter securities and other transactions as agent for the Company’s clients. Principal transactions consist of aportion of dealer spreads attributed to the Company’s securities trading activities as principal in Nasdaq-listedand other securities, and include transactions derived from activities as a market-maker. Additionally, principaltransactions include gains and losses resulting from market price fluctuations that occur while holding posi-tions in trading security inventory. Commissions revenue and related clearing expenses are recorded on atrade-date basis as security transactions occur. Principal transactions in regular-way trades are recorded on thetrade date, as if they had settled. Profit and loss arising from all securities and commodities transactionsentered into for the account and risk of the Company are recorded on a trade-date basis.
47

MCF CORPORATION
NOTES TO CONSOLIDATED FINANCIAL STATEMENTS
2. Summary of Significant Accounting Policies − (continued)
Primary Research Revenue
Revenue from primary research services is recognized on a proportional performance basis as services areprovided.
Cost of Primary Research Services
Direct costs associated with generating primary research revenue principally consist of panelist hono-rarium and recruitment costs. Medical experts receive cash honoraria for participating in qualitative panels andquantitative surveys. The Company pays the honoraria to the panelists when the panel or survey has beencompleted and records this expense as incurred.
Share-Based Compensation Expense
On January 1, 2006, the Company adopted Statement of Financial Accounting Standards (SFAS) 123(Revised 2004), ‘‘Share-Based Payment,’’ or SFAS 123(R),which requires the measurement and recognition ofcompensation expense, based on estimated fair values, for all share-based awards, made to employees anddirectors, including stock options, non-vested stock, and participation in the Company’s employee stockpurchase plan. In March 2005, the Securities and Exchange Commission issued Staff Accounting Bulletin(SAB) No. 107 relating to SFAS 123(R). The Company has applied the provisions of SAB 107 in its adoptionof SFAS 123(R).
The Company adopted SFAS 123(R) using the modified prospective application transition method, as ofJanuary 1, 2006, the first day of the Company’s fiscal year 2006. The Company’s consolidated financial state-ments as of and for the year ended December 31, 2006 reflect the impact of SFAS 123(R). In accordance withthe modified prospective application transition method, the Company’s consolidated financial statements forprior periods have not been restated to reflect, and do not include, the impact of SFAS 123(R).
Prior to the adoption of SFAS 123(R), the Company accounted for share-based awards to employees anddirectors using the intrinsic value method in accordance with Accounting Principles Board (APB) OpinionNo. 25, ‘‘Accounting for Stock Issued to Employees,’’ as allowed under SFAS 123, ‘‘Accounting for Stock-Based Compensation.’’ Share-based compensation expense for the year ended December 31, 2005 was solelyrelated to non-vested stock awards and stock options granted with intrinsic value that the Company had beenrecognizing in its consolidated statements of operations in accordance with the provisions set forth above. Inaccordance with the intrinsic value method, no share-based compensation expense was otherwise recognizedin the Company’s consolidated statements of operations because the exercise price of nearly all of the Compa-ny’s stock options granted to employees and directors equaled the fair market value of the underlying stock atthe grant date.
SFAS 123(R) requires companies to estimate the fair value of share-based awards on the date of grantusing an option-pricing model. The value of the portion of the award that is ultimately expected to vest isrecognized as expense in the Company’s consolidated statements of operations over the requisite serviceperiods. Share-based compensation expense recognized in the Company’s consolidated statement of operationsfor the years ended December 31, 2007 and December 31, 2006 includes compensation expense for share-based awards granted (i) prior to, but not yet vested as of December 31, 2005, based on the grant date fairvalue estimated in accordance with the provisions of SFAS 123, and (ii) subsequent to December 31, 2005,based on the grant date fair value estimated in accordance with the provisions of SFAS 123(R). Compensationexpense for all share-based awards subsequent to December 31, 2005 is recognized using the straight-linesingle-option method. Because share-based compensation expense is based on awards that are ultimatelyexpected to vest, share-based compensation expense has been reduced to account for estimated forfeitures.SFAS 123(R) requires forfeitures to be estimated at the time of grant and revised, if necessary, in subsequentperiods if actual forfeitures differ from those estimates. In the Company’s pro forma information requiredunder SFAS 123 for periods prior to fiscal 2006, the Company accounted for forfeitures as they occurred.
48

MCF CORPORATION
NOTES TO CONSOLIDATED FINANCIAL STATEMENTS
2. Summary of Significant Accounting Policies − (continued)
To calculate option-based compensation under SFAS 123(R), the Company used the Black-Scholes optionpricing model, which it had previously used for valuation of option-based awards for its pro forma informa-tion required under SFAS 123 for periods prior to fiscal 2006. The Company’s determination of fair value ofoption-based awards on the date of grant using the Black-Scholes model is affected by the Company’s stockprice as well as assumptions regarding a number of subjective variables. These variables include, but are notlimited to the Company’s expected stock price volatility over the term of the awards, and actual and projectedemployee stock option exercise behaviors.
No tax benefits were attributed to the share-based compensation expense because a valuation allowancewas maintained for all net deferred tax assets.
Income Taxes
The Company uses the asset and liability method of accounting for income taxes. Deferred tax assets andliabilities are recognized for the estimated future tax consequences attributable to differences between thefinancial statement carrying amounts of existing assets and liabilities and their respective tax bases. Deferredtax assets and liabilities are measured using enacted tax rates expected to apply to taxable income in the yearsin which those temporary differences are expected to be recovered or settled. A valuation allowance isrecorded to reduce deferred tax assets to an amount whose realization is more likely than not. The effect ondeferred tax assets and liabilities of a change in tax rates is recognized in the consolidated statements ofoperations in the period that includes the enactment date. MCF Corporation adopted FIN No. 48 on January 1,2007.
Earnings (Loss) per Share
Basic earnings (loss) per share is computed by dividing net income (loss) by the weighted average num-ber of common shares outstanding. Diluted earnings per share is calculated for the year ended December 31,2007 by dividing net income by the weighted average number of common shares used in the basic earningsper share calculation plus the number of common shares that would be issued assuming exercise or conversionof all potentially dilutive common shares outstanding. Diluted loss per share is unchanged from basic loss pershare for the years ended December 31, 2006 and 2005, because the addition of common shares that would beissued assuming exercise or conversion would be anti-dilutive.
Concentrations
Substantially all of the Company’s cash and cash equivalents are held at three major U.S. financial insti-tutions. The majority of the Company’s cash equivalents consist of short-term marketable securities. Depositsheld with banks may exceed the amount of insurance provided on such deposits. Generally these deposits maybe redeemed upon demand.
As of December 31, 2007, the Company owned 1,743,900 shares of Points International in its proprietarytrading account with a fair market value of $7,264,000. The stock price of Points International is volatile andhas declined since December 31, 2007.
During 2007 and 2006, no sales professional accounted for more than 10% of revenue, while one salesprofessional accounted for 12% of revenue in 2005. During the three years ended December 31, 2007, nosingle customer accounted for more than 10% of revenue.
Fair Value of Financial Instruments
The carrying amounts of the Company’s financial instruments, which include securities owned, cashdeposited with the Company’s clearing organization, receivables, accounts payable, and other accruedexpenses, approximate their fair values.Segment Reporting
The Company organizes its operations into three operating segments for the purpose of making operatingdecisions and assessing performance. These operating segments are organized along operating subsidiaries,
49
MCF CORPORATION
NOTES TO CONSOLIDATED FINANCIAL STATEMENTS
2. Summary of Significant Accounting Policies − (continued)
Merriman Curhan Ford & Co., MCF Asset Management, LLC and Panel Intelligence, LLC. Accordingly, theCompany operated in three reportable operating segments in the United States during 2007. In January 2007,the Company sold its wealth management business and has presented its results of operations as discontinuedoperations.
Use of Estimates
The preparation of financial statements in conformity with accounting principles generally accepted in theUnited States requires management to make estimates, judgments and assumptions that affect the reportedamounts of assets, liabilities, revenue and expenses. Actual results could differ from those estimates.
Newly Issued Accounting Standards
In September 2006, the Financial Accounting Standards Board issued SFAS No. 157, ‘‘Fair Value Mea-surements.’’ SFAS No. 157 defines fair value, establishes a framework for measuring fair value undergenerally accepted accounting principles, and expands disclosures about fair value measurements. SFASNo. 157 is effective for financial statements issued for fiscal years beginning after November 15, 2007, andinterim periods within those fiscal years. On February 6, 2008, the FASB deferred the effective date of SFASNo. 157 for one year for all nonfinancial assets and nonfinancial liabilities, except for those items that arerecognized or disclosed at fair value in the financial statements on a recurring basis (at least annually). Theadoption of SFAS No. 157 did not have a material impact on the Company’s consolidated financial state-ments.
In February 2007, the FASB issued SFAS No. 159, ‘‘Fair Value Option for Financial Assets and FinancialLiabilities,’’ which permits entities to choose to measure many financial instruments and certain other items atfair value that are not currently required to be measured at fair value and establishes presentation and disclo-sure requirements designed to facilitate comparisons between entities that choose different measurementattributes for similar types of assets and liabilities. SFAS No. 159 is effective for fiscal years beginning afterNovember 15, 2007. The Company did not adopt SFAS No. 159 on any individual instrument as of January 1,2008.
In May 2007, the FASB issued FSP FIN No. 46R-7, ‘‘Application of FASB Interpretation No. 46(R) toInvestment Companies.’’ FSP FIN No. 46R-7 amends the scope of the exception to FIN No. 46R to state thatinvestments accounted for at fair value in accordance with the specialized accounting guidance in the Ameri-can Institute of Certified Public Accountants Audit and Accounting Guide, Investment Companies, are notsubject to consolidation under FIN No. 46R. This interpretation is effective for fiscal years beginning on orafter December 15, 2007. The Company does not expect the adoption of FSP FIN No. 46R-7 will have amaterial impact on its consolidated financial statements.
3. Securities Owned
The Company trades equity and debt securities for clients in a broker or dealer capacity. While tradingactivities are primarily generated by client order flow, the Company also takes selective proprietary positionsbased on expectations of future market movements and conditions. As of December 31, 2007 and 2006, fairvalue of marketable equity securities owned by the Company was approximately $14,115,000 and $7,493,000,respectively.
Securities owned that are not readily marketable consisted of notes receivable, convertible notes receiv-able, unregistered common stock and stock warrants. As of December 31, 2007 and 2006, the discounted fairvalue of the securities owned that are not readily marketable was approximately $4,505,000 and $1,489,000,respectively, based on management estimates.
50

MCF CORPORATION
NOTES TO CONSOLIDATED FINANCIAL STATEMENTS
4. Equipment and Fixtures
Equipment and fixtures consisted of the following:
December 31,
2007 2006
Computer equipment . . . . . . . . . . . . . . . . . . . . . . . . . . . . . . . . . . . . . . . . . $ 831,190 $ 723,751Furniture and equipment . . . . . . . . . . . . . . . . . . . . . . . . . . . . . . . . . . . . . . 1,236,606 1,051,994Software . . . . . . . . . . . . . . . . . . . . . . . . . . . . . . . . . . . . . . . . . . . . . . . . . 219,367 151,821Leasehold improvements . . . . . . . . . . . . . . . . . . . . . . . . . . . . . . . . . . . . . . 1,018,203 1,023,729
3,305,366 2,951,295Less accumulated depreciation . . . . . . . . . . . . . . . . . . . . . . . . . . . . . . . . . . (2,059,674) (1,364,665)
$ 1,245,692 $ 1,586,630
Equipment and fixtures purchased with capital lease financing during 2007 and 2006 were $183,000 and$800,000, respectively.
5. Notes Payable, Convertible Notes Payable and Lines of Credit
Notes payable and convertible notes payable outstanding at December 31, 2007 and 2006 consisted of thefollowing amounts, presented net of certain discounts:
December 31,
2007 2006
Convertible notes payable issued in 2003 . . . . . . . . . . . . . . . . . . . . . . . . . . . $197,416 $187,079
Note payable issued to Donald Sledge . . . . . . . . . . . . . . . . . . . . . . . . . . . . . $ 41,573 $138,571
Interest payable in connection with the notes described below is included with accrued liabilities balancein the statements of financial condition. As of December 31, 2007 and 2006, interest payable amounted to$1,500 and $29,000, respectively.
Convertible Notes Payable Issued in 2003
In April 2003, the Company completed a private placement financing that included convertible notespayable with aggregate principal of $1,000,000, due April 2008. The notes bear interest at 3% per annumpayable quarterly on January 1, April 1, July 1 and October 1 beginning July 1, 2003. The notes can beconverted to common stock at a rate of $1.40 per share. In connection with the private placement, the Com-pany issued warrants to purchase 178,300 shares of common stock with an exercise price of $2.10 per shareand a five-year term. The convertible notes were recorded in the statements of financial condition net ofdiscounts resulting from the relative fair value of the stock warrants and beneficial conversion feature totaling$258,000. The discount is being amortized over the five-year term. In October 2003, notes payable with a faceamount of $500,000 were converted under their original terms into 51,021 shares of common stock resultingin the accelerated amortization of discounts in the amount of $118,000. In December 2004, notes payable witha face amount of $300,000 were converted under their original terms into 30,613 shares of common stockresulting in the accelerated amortization of discounts in the amount of $50,000. Amortization of discountsduring 2007 and 2006 was approximately $10,000 and $10,000, respectively. The remaining unamortizeddiscount as of December 31, 2007 was $3,000.
Note Payable Held by Donald Sledge
During 2001, the Company renegotiated the severance terms included in its employment agreement withDonald Sledge, the former Chairman and CEO of the Company. Upon his leaving the Company in May 2001,the Company issued to Mr. Sledge a 7% convertible note, in an aggregate principal amount of $400,000, dueMay 2003. Interest was payable at the maturity of the two-year term. In May 2003, the Company and
51
MCF CORPORATION
NOTES TO CONSOLIDATED FINANCIAL STATEMENTS
5. Notes Payable, Convertible Notes Payable and Lines of Credit − (continued)
Mr. Sledge agreed to convert the principal and interest due at maturity into a fully amortizing note payableover five years using an effective interest rate of 4.0%. Mr. Sledge was a member of the Company’s Board ofDirectors until March 2007.
Convertible Note Payable Issued in 2006
In March 2006, the Company completed a $7.5 million private placement of a variable rate securedconvertible debenture with a detachable stock warrant. The issue was placed with Midsummer Investment, Ltd(‘‘Midsummer’’). The Company invested the proceeds in one of the proprietary funds managed by MCF AssetManagement, LLC, a wholly owned subsidiary. The debenture bears interest at a variable rate based on theannual investment performance of the investment in the proprietary funds managed by MCF Asset Manage-ment, LLC. The maturity date of the note was December 31, 2010.
The debenture was convertible into the Company’s common stock at a conversion price of $9.87 pershare, subject to certain anti-dilutive adjustments. The Company could have redeemed all or part of the deben-ture after three years at 110% of the principal amount being redeemed. The Company could have elected toforce conversion of the debenture into common stock if the Company’s common stock trades above $34.58for 20 consecutive trading days. The debenture contained covenants that could have precluded the Companyfrom issuing additional debt over a specified limit, entering into certain new liens on company assets, repur-chasing stock or paying dividends when the debenture remains outstanding with balance of at least $2 million.Stock warrants to purchase 267,858 shares of common stock at $9.87 per share were also issued to the inves-tor. The stock warrants have a six year term.
The $7,500,000 raised in the transaction described above was accounted for under generally acceptedaccounting principles, primarily APB 14, ‘‘Accounting for Convertible Debt and Debt Issued with StockPurchase Warrants,’’ SFAS 133, ‘‘Accounting for Derivative Instruments and Hedging Activities,’’ EITF Issue98-5, ‘‘Accounting for Convertible Securities with Beneficial Conversion Features or Contingently AdjustableConversion Ratios,’’ and EITF Issue 00-19, ‘‘Accounting for Derivative Financial Instruments Indexed to, andPotentially Settled in, a Company’s Own Stock.’’ The Company accounted for this transaction as the issuanceof convertible debt, an embedded derivative referred to as a participation interest obligation, and a detachablestock warrant. The $7,500,000 was allocated to the derivative using its fair value with the balance allocated tothe debt and the stock warrant based on their relative fair value as determined by management. During thethird quarter of 2006, the Company obtained an appraisal from a third party to support the fair market valuesused to allocate the proceeds. Management’s initial estimates were adjusted to the appraisal amounts.
The fair value of the stock warrant of $1,291,000 was recorded as a discount to the convertible debentureand an increase to additional paid-in capital. The fair value of the participation interest obligation of$2,276,000 was also treated as a discount to the convertible debenture and was based on a forecast of futurecash flows to be paid to the lender discounted at a risk adjusted yield. The discount to the convertible deben-ture of $3,567,000 was amortized to interest expense using the level yield method over the term of thedebenture.
In December 2006, the Company repaid the $7.5 million variable rate secured convertible note. Theproceeds to repay the $7.5 million convertible note were provided by redemption from the MCF Navigatorfund. Midsummer retained the stock warrant to purchase 267,858 shares of common stock. The Companyrecorded a loss on the repayment of the convertible note in the amount of $1,349,000 which consisted of$1,154,000 for the write-off of the unamortized discount related to the stock warrant and $195,000 for thewrite-off the unamortized debt issuance costs.
Line of Credit
The Company has a line of credit with a commercial bank that provides borrowing availability up to$3,000,000. The line of credit is secured by the assets of the Company and is due upon demand. The interest
52

MCF CORPORATION
NOTES TO CONSOLIDATED FINANCIAL STATEMENTS
5. Notes Payable, Convertible Notes Payable and Lines of Credit − (continued)
rate on amounts borrowed is payable monthly at the prime interest rate. As of December 31, 2007 and 2006,there was no borrowing under this line of credit.
6. Stockholders’ Equity
Reverse Stock Split
On August 4, 2006, the Company’s Board of Directors approved a one-for-seven reverse stock split ofthe Company’s common stock. The reverse stock split became effective at 11:59 pm, Eastern Time, onNovember 15, 2006. Pursuant to the reverse stock split, each seven shares of authorized and outstandingcommon stock was reclassified and combined into one share of new common stock. The reverse stock splitdid not change the number of authorized shares or the par value per share of common stock or preferred stockdesignated by the Company’s Certificate of Incorporation. Currently, the Company has authorized 300,000,000shares of common stock and 27,450,000 shares of preferred stock. All references to share and per share datafor all periods presented have been retroactively adjusted to give effect to the one-for-seven reverse stocksplit.
Common Stock
On January 2, 2007, the Company completed the sale of Catalyst Financial Planning & InvestmentManagement Company back to the founder of Catalyst (see Note No. 9). As part of the sale agreement, theCompany received 26,438 shares of MCF Corporation common stock previously issued to the founder ofCatalyst in February 2006. These shares were returned to the Company’s treasury and classified as treasurystock with a value of $126,000 as of December 31, 2007.
In May 2005, the Company issued 51,369 shares of common stock in exchange for a promissory notewith a face value of $500,000. In December 2005, the Company learned that the counter-party would not havethe financial resources to repay the Company’s $500,000 note receivable at maturity. As a result, the Companyrecorded a charge to other operating expense in 2005 to write-off the $500,000 note receivable balance. InApril 2006, the Company entered into a settlement agreement with the counter-party. As a result, the Com-pany reversed the $500,000 charge to write-off the note receivable balance upon the receipt of $500,000 inApril 2006.
7. Acquisition of MedPanel, Inc.
On April 17, 2007, MCF Corporation acquired 100 percent of the outstanding common shares of Med-Panel, Inc. The results of MedPanel’s operations have been included in the consolidated financial statementssince that date. As a result of the acquisition, the Company began providing independent market data andinformation to clients in the biotechnology, pharmaceutical, medical device, and financial industries by lever-aging MedPanel’s proprietary methodology and vast network of medical experts.
The Company paid $6.1 million in common stock for MedPanel. The value of the 1,547,743 shares ofcommon shares issued was determined based on the average market price of MCF Corporation’s commonstock over the period including three days before and after the terms of the acquisition were agreed to andannounced. The selling stockholders may also be entitled to additional consideration on the third anniversaryfrom the closing which is based upon MedPanel achieving specific revenue and profitability milestones. Thepayment of the incentive consideration will be 50% in cash and 50% in the Company’s common stock andmay not exceed $11,455,000. The Company registered 1,548,119 shares of common stock with the Securitiesand Exchange Commission on Form S-4, file number 333-138870, originally filed November 21, 2006, asamended.
53
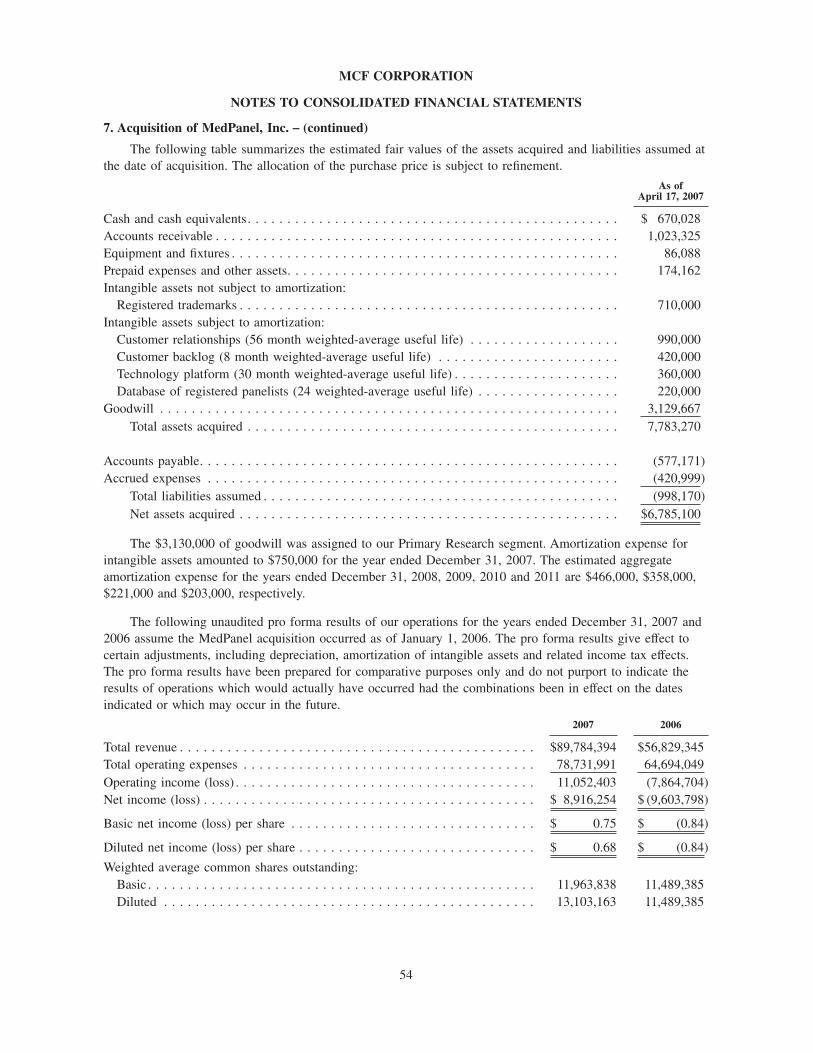
MCF CORPORATION
NOTES TO CONSOLIDATED FINANCIAL STATEMENTS
7. Acquisition of MedPanel, Inc. − (continued)
The following table summarizes the estimated fair values of the assets acquired and liabilities assumed atthe date of acquisition. The allocation of the purchase price is subject to refinement.
As ofApril 17, 2007
Cash and cash equivalents. . . . . . . . . . . . . . . . . . . . . . . . . . . . . . . . . . . . . . . . . . . . . . . $ 670,028Accounts receivable . . . . . . . . . . . . . . . . . . . . . . . . . . . . . . . . . . . . . . . . . . . . . . . . . . . 1,023,325Equipment and fixtures . . . . . . . . . . . . . . . . . . . . . . . . . . . . . . . . . . . . . . . . . . . . . . . . . 86,088Prepaid expenses and other assets. . . . . . . . . . . . . . . . . . . . . . . . . . . . . . . . . . . . . . . . . . 174,162Intangible assets not subject to amortization:
Registered trademarks . . . . . . . . . . . . . . . . . . . . . . . . . . . . . . . . . . . . . . . . . . . . . . . . 710,000Intangible assets subject to amortization:
Customer relationships (56 month weighted-average useful life) . . . . . . . . . . . . . . . . . . . 990,000Customer backlog (8 month weighted-average useful life) . . . . . . . . . . . . . . . . . . . . . . . 420,000Technology platform (30 month weighted-average useful life) . . . . . . . . . . . . . . . . . . . . . 360,000Database of registered panelists (24 weighted-average useful life) . . . . . . . . . . . . . . . . . . 220,000
Goodwill . . . . . . . . . . . . . . . . . . . . . . . . . . . . . . . . . . . . . . . . . . . . . . . . . . . . . . . . . . 3,129,667Total assets acquired . . . . . . . . . . . . . . . . . . . . . . . . . . . . . . . . . . . . . . . . . . . . . . . 7,783,270
Accounts payable. . . . . . . . . . . . . . . . . . . . . . . . . . . . . . . . . . . . . . . . . . . . . . . . . . . . . (577,171)Accrued expenses . . . . . . . . . . . . . . . . . . . . . . . . . . . . . . . . . . . . . . . . . . . . . . . . . . . . (420,999)
Total liabilities assumed . . . . . . . . . . . . . . . . . . . . . . . . . . . . . . . . . . . . . . . . . . . . . (998,170)Net assets acquired . . . . . . . . . . . . . . . . . . . . . . . . . . . . . . . . . . . . . . . . . . . . . . . . $6,785,100
The $3,130,000 of goodwill was assigned to our Primary Research segment. Amortization expense forintangible assets amounted to $750,000 for the year ended December 31, 2007. The estimated aggregateamortization expense for the years ended December 31, 2008, 2009, 2010 and 2011 are $466,000, $358,000,$221,000 and $203,000, respectively.
The following unaudited pro forma results of our operations for the years ended December 31, 2007 and2006 assume the MedPanel acquisition occurred as of January 1, 2006. The pro forma results give effect tocertain adjustments, including depreciation, amortization of intangible assets and related income tax effects.The pro forma results have been prepared for comparative purposes only and do not purport to indicate theresults of operations which would actually have occurred had the combinations been in effect on the datesindicated or which may occur in the future.
2007 2006
Total revenue . . . . . . . . . . . . . . . . . . . . . . . . . . . . . . . . . . . . . . . . . . . . . $89,784,394 $56,829,345Total operating expenses . . . . . . . . . . . . . . . . . . . . . . . . . . . . . . . . . . . . . 78,731,991 64,694,049Operating income (loss) . . . . . . . . . . . . . . . . . . . . . . . . . . . . . . . . . . . . . . 11,052,403 (7,864,704)Net income (loss) . . . . . . . . . . . . . . . . . . . . . . . . . . . . . . . . . . . . . . . . . . $ 8,916,254 $ (9,603,798)
Basic net income (loss) per share . . . . . . . . . . . . . . . . . . . . . . . . . . . . . . . $ 0.75 $ (0.84)
Diluted net income (loss) per share . . . . . . . . . . . . . . . . . . . . . . . . . . . . . . $ 0.68 $ (0.84)
Weighted average common shares outstanding:Basic . . . . . . . . . . . . . . . . . . . . . . . . . . . . . . . . . . . . . . . . . . . . . . . . . 11,963,838 11,489,385Diluted . . . . . . . . . . . . . . . . . . . . . . . . . . . . . . . . . . . . . . . . . . . . . . . 13,103,163 11,489,385
54
MCF CORPORATION
NOTES TO CONSOLIDATED FINANCIAL STATEMENTS
8. Goodwill
The Company has $3,130,000 of goodwill recorded on the Consolidated Statements of Financial Condi-tion that relates to the Company’s acquisition of MedPanel, Inc. (now Panel Intelligence) in April 2007.Goodwill is reviewed for possible impairment at least annually, consistent with valuation methodologiespursuant to FAS 142.
A two-step test is used to determine whether goodwill is impaired. The first step is to compare the carry-ing value of Panel Intelligence with the fair value of Panel Intelligence. If the carrying value exceeds the fairvalue, the second step is applied. The second step is to compare the carrying amount of the goodwill with theimplied fair value of the goodwill as determined in accordance with FAS 142. Goodwill impairment isrecognized if its carrying value exceeds its implied fair value. The determination of fair value includes consid-erations of projected cash flows and revenue multiples of comparable exchange listed corporations. As ofDecember 31, 2007, the Company noted no indicators of impairment of goodwill.
9. Discontinued Operations
In February 2005, the Company acquired Catalyst Financial Planning & Investment Management, Inc., orCatalyst, a registered investment advisor. The Company paid to the founder of Catalyst, or Catalyst Share-holder, $330,000 as initial consideration at the closing and placed into escrow 79,314 shares of common stockto be issued over the three year period following the closing date. The issuance of these shares was condi-tioned upon the Catalyst Shareholder being a full-time employee at the anniversary dates. The CatalystShareholder was entitled to additional consideration that would be payable in either cash or common stock atthe Catalyst Shareholder’s option. The additional consideration would be based on a multiple of revenuegrowth at the end of the first three anniversary dates from the closing.
With the adoption of SFAS 123(R) in January 2006, the Company treated the 79,314 common shares as anon-vested stock grant that vests over three years, subject to performance conditions. The Company initiallydetermined that the issuance of the common stock over the service period was probable and recorded anexpense of $23,000 per month over the three year service period. At the first anniversary date in Febru-ary 2006, the Company issued 26,438 shares of common stock from escrow and paid $59,000 to the CatalystShareholder for additional consideration that resulted from growth in the Catalyst revenue. The additionalconsideration was recorded as an increase in the intangible assets acquired.
In December 2006, the Company decided to sell Catalyst to an entity controlled by the Catalyst Share-holder. In January 2007, the Company sold Catalyst to the Mallory Acquisition Corp. for $282,000 and 79,314shares of MCF Corporation common stock. An impairment loss was recognized in 2006 in the amount of$92,000, which is presented as ‘‘Other expenses’’ in the table below to reduce the carrying value of thisbusiness to its estimated fair value less costs to sell. During 2006, the Company recorded approximately$47,000 as stock-based compensation expense resulting from the 26,438 shares issued from escrow in Febru-ary 2006.
As of December 31, 2006, Catalyst is being accounted for as held for sale in accordance with SFAS 144.As a result, the revenue and expenses of Catalyst and MCF Wealth Management, LLC for 2006 and 2005have been reclassified and included in discontinued operations in the consolidated statements of operations.
55

MCF CORPORATION
NOTES TO CONSOLIDATED FINANCIAL STATEMENTS
9. Discontinued Operations − (continued)
The following revenue and expenses have been reclassified as discontinued operations for the years endedDecember 31, 2006 and 2005:
2006 2005
Revenue. . . . . . . . . . . . . . . . . . . . . . . . . . . . . . . . . . . . . . . . . . . $ 865,808 $654,405Operating expenses:
Compensation and benefits . . . . . . . . . . . . . . . . . . . . . . . . . . . . 736,536 462,720Professional services. . . . . . . . . . . . . . . . . . . . . . . . . . . . . . . . . 34,834 10,722Occupancy and equipment . . . . . . . . . . . . . . . . . . . . . . . . . . . . . 121,794 63,781Communications and technology . . . . . . . . . . . . . . . . . . . . . . . . 15,410 11,094Depreciation and amortization . . . . . . . . . . . . . . . . . . . . . . . . . . 56,137 37,873Travel and entertainment . . . . . . . . . . . . . . . . . . . . . . . . . . . . . . 72,260 35,104Other expenses . . . . . . . . . . . . . . . . . . . . . . . . . . . . . . . . . . . . 156,563 48,166
1,193,534 669,460Operating loss. . . . . . . . . . . . . . . . . . . . . . . . . . . . . . . . . . . . . . . (327,726) (15,055)Interest income, net . . . . . . . . . . . . . . . . . . . . . . . . . . . . . . . . . . . 3,513 1,324Net loss . . . . . . . . . . . . . . . . . . . . . . . . . . . . . . . . . . . . . . . . . . . $ (324,213) $ (13,731)
The following assets and liabilities of operations held for sale have been included in the consolidatedstatements of financial condition as of December 31, 2006 and 2005:
December 31,
2006 2005
Assets:Cash and cash equivalents . . . . . . . . . . . . . . . . . . . . . . . . . . . . . $ 68,503 $164,118Accounts receivable . . . . . . . . . . . . . . . . . . . . . . . . . . . . . . . . . 11,155 374Furniture and equipment . . . . . . . . . . . . . . . . . . . . . . . . . . . . . . 34,234 8,710Intangible assets, net of accumulated amortization of $172,417 . . . . 314,963 394,456Prepaid expenses and other assets . . . . . . . . . . . . . . . . . . . . . . . . 24,024 27,128
$452,879 $594,786
Liabilities:Accounts payable . . . . . . . . . . . . . . . . . . . . . . . . . . . . . . . . . . . — 9,874Commissions and bonus payable . . . . . . . . . . . . . . . . . . . . . . . . 8,368 11,652Accrued liabilities . . . . . . . . . . . . . . . . . . . . . . . . . . . . . . . . . . 87,176 180,953Capital leases . . . . . . . . . . . . . . . . . . . . . . . . . . . . . . . . . . . . . — 1,273
$ 95,544 $203,752
10. Share-Based Compensation Expense
Stock Options
The 1999 Stock Option Plan, 2000 Stock Option and Incentive Plan, 2001 Stock Option and IncentivePlan, 2003 Stock Option and Incentive Plan, 2004 Non-Qualified Stock Option and Inducement Plan and 2006Directors’ Stock Option and Incentive Plan, collectively the Option Plans, permit the Company to grantemployees, outside directors, and consultants incentive stock options, nonqualified stock options or stockpurchase rights to purchase shares of the Company’s common stock. The Option Plans do not permit theexercise of non-vested stock options, and therefore as of December 31, 2007 and 2006 there were no sharessubject to repurchase.
56

MCF CORPORATION
NOTES TO CONSOLIDATED FINANCIAL STATEMENTS
10. Share-Based Compensation Expense − (continued)
As of December 31, 2007, there were 5,5591,430 shares authorized for issuance under the Option Plans,and 612,858 shares authorized for issuance outside of the Option Plans. As of December 31, 2007, 270,050shares were available for future option grants under the Option Plans. There were no shares available forfuture option grants outside of the Options Plans. Compensation expense for stock options during the threeyears ended December 31, 2007 was $1,373,000, $1,336,000, and $75,000, respectively.
The following table is a summary of the Company’s stock option activity for the three years endedDecember 31, 2007:
2007 2006 2005
Shares
Wtd-AvgExercise
Price Shares
Wtd-AvgExercise
Price Shares
Wtd-AvgExercise
Price
Outstanding at beginning ofyear. . . . . . . . . . . . . . . . . 3,570,370 $ 6.19 3,324,358 $ 6.24 3,078,001 $ 6.25
Granted . . . . . . . . . . . . . . . . 736,640 4.82 398,538 6.27 460,538 8.77Exercised. . . . . . . . . . . . . . . (83,939) (2.06) (52,819) (2.08) (33,938) (2.77)Canceled . . . . . . . . . . . . . . . (156,812) (6.76) (99,707) (10.38) (180,243) (13.55)Outstanding at end of year . . . 4,066,259 $ 6.00 3,570,370 $ 6.19 3,324,358 $ 6.24
Exercisable at end of year . . . 3,084,852 $ 6.16 2,934,029 $ 6.00 2,677,958 $ 6.02
The total intrinsic value of options exercised during the year ended December 31, 2007 was $190,000.
The following table summarizes information with respect to stock options outstanding at December 31,2007, based on the Company’s closing stock price on December 31, 2007 of $5.32 per share:
Options Outstanding at December 31, 2007 Vested Options at December 31, 2007
Range of Exercise Price Number
WeightedAverage
RemainingContractualLife Years)
WeightedAverageExercise
Price
AggregateIntrinsic
Value Number
WeightedAverageExercise
Price
AggregateIntrinsic
Value
$1.26 - $ 3.50 1,986,325 5.05 $ 2.99 $4,632,309 1,986,325 $ 2.99 $4,632,309$3.51 - $ 7.00 1,191,228 8.20 $ 4.69 746,781 386,064 4.27 405,367$7.01 - $14.00 593,038 7.06 $ 8.94 — 416,795 9.20 —$14.01 - $28.00 256,381 2.85 $22.04 — 256,381 22.04 —$28.01 - $49.00 39,287 2.15 $49.00 — 39,287 49.00 —
4,066,259 6.10 $ 6.00 $5,379,090 3,084,852 $ 6.16 $5,037,676
As of December 31, 2007, total unrecognized compensation expense related to unvested stock optionswas $3,049,000. This amount is expected to be recognized as expense over a weighted-average period of 1.4years.
Non-Vested Stock
At the date of grant, the recipients of non-vested stock have most of the rights of a stockholder otherthan voting rights, subject to certain restrictions on transferability and a risk of forfeiture. Non-vested sharestypically vest over a two to four year period beginning on the date of grant. The fair value of non-vestedstock is equal to the market value of the shares on the date of grant. The Company recognizes the compensa-tion expense for non-vested stock on a straight-line basis over the requisite service period. Compensationexpense for non-vested stock during the three years ended December 31, 2007 was $1,262,000, $1,915,000and $1,885,000, respectively.
57

MCF CORPORATION
NOTES TO CONSOLIDATED FINANCIAL STATEMENTS
10. Share-Based Compensation Expense − (continued)
The following table is a summary of the Company’s non-vested stock activity, based on the Company’sclosing stock price on December 31, 2007 of $5.32 per share:
Non-VestedStock
Outstanding
WeightedAverage
Grant DateFair Value
AggregateIntrinsic
Value
Balance as of December 31, 2004 . . . . . . . . . 490,893 $ 7.38Granted . . . . . . . . . . . . . . . . . . . . . . . . . 324,561 10.38Vested . . . . . . . . . . . . . . . . . . . . . . . . . . (91,240) (5.74)Canceled. . . . . . . . . . . . . . . . . . . . . . . . . (142,802) (9.91)
Balance as of December 31, 2005 . . . . . . . . . 581,412 $ 7.84 $4,558,000
Granted . . . . . . . . . . . . . . . . . . . . . . . . . 90,003 7.16Vested . . . . . . . . . . . . . . . . . . . . . . . . . . (327,900) (4.19)Canceled. . . . . . . . . . . . . . . . . . . . . . . . . (37,506) (10.78)
Balance as of December 31, 2006 . . . . . . . . . 306,009 $ 10.04 $3,072,000
Granted . . . . . . . . . . . . . . . . . . . . . . . . . 153,828 4.48Vested . . . . . . . . . . . . . . . . . . . . . . . . . . (257,515) (7.18)Canceled. . . . . . . . . . . . . . . . . . . . . . . . . (21,702) (9.49)
Balance as of December 31, 2007 . . . . . . . . . 180,620 $ 7.51 $1,356,000
The total intrinsic value of non-vested stock which vested during the year ended December 31, 2007 was$1,849,000.
As of December 31, 2007, total unrecognized compensation expense related to non-vested stock was$916,000. This expense is expected to be recognized over a weighted-average period of 1.00 year.
Employee Stock Purchase Plan
The Company offers an Employee Stock Purchase Plan, or ESPP, to its employees. As of December 31,2007, there are no shares available under the ESPP and the Company has no plan to request additional sharesfrom the stockholders for this program. Compensation expense for ESPP during the three years ended Decem-ber 31, 2007 was $189,000, $539,000 and $0, respectively. As of December 31, 2007, unrecognizedcompensation expense related to the ESPP was $0.
Under the ESPP, eligible employees may enroll in a 24-month offer period during certain open enroll-ment periods. New offer periods begin February 15 and August 15 of each year. Each offer period consists offour, six-month purchase periods during which employee payroll deductions are accumulated. These deductionamounts, which are subject to certain limitations, are accumulated, and, at the end of each purchase period,are used to purchase shares of common stock. The purchase price of the shares is 15% less than the fairmarket value on either the first day of an offer period or the last day of a purchase period, whichever is lower.If the fair market value on the purchase date is less than the fair market value on the first day of an offerperiod, then participants automatically commence a new 24-month offer period. The ESPP has a ten-year term.
Share-Based Compensation Under SFAS 123(R) for 2007 and 2006 and APB 25 for 2005
On January 1, 2006, the Company adopted SFAS 123(R), which requires the measurement and recogni-tion of compensation expense, based on estimated fair values, for all share-based payments awards made tothe Company’s employees and directors including stock options, non-vested stock, and stock purchased underthe Company’s ESPP.
58

MCF CORPORATION
NOTES TO CONSOLIDATED FINANCIAL STATEMENTS
10. Share-Based Compensation Expense − (continued)
Prior to the adoption of SFAS 123(R), the Company accounted for share-based awards to employees anddirectors using the intrinsic value method in accordance with APB 25, as allowed under SFAS 123, ‘‘Account-ing for Stock-Based Compensation.’’ Share-based compensation expense of $1,959,000 for the year endedDecember 31, 2005 was solely related to share-based awards resulting from non-vested stock awards andstock options granted with intrinsic value that the Company had been recognizing in its consolidated state-ments of operations in accordance with the provisions set forth above. In accordance with the intrinsic valuemethod, no share-based compensation expense was otherwise recognized in the Company’s consolidatedstatements of operations because the exercise price of nearly all of the Company’s stock options granted toemployees and directors equaled the fair market value of the underlying stock at the grant date.
Pro Forma Share-Based Compensation Under SFAS 123 for Fiscal 2005
If the Company had recognized compensation expense over the relevant service period under the fairvalue method consistent with the provisions of SFAS 123, ‘‘Accounting for Stock Based Compensation’’ asamended by SFAS 148, ‘‘Accounting for Stock Based Compensation-Transition and Disclosure,’’ with respectto stock options granted for the year ended December 31, 2005, net loss would have changed, resulting in proforma net loss and pro forma net loss per share as presented below:
2005
Net loss, as reported . . . . . . . . . . . . . . . . . . . . . . . . . . . . . . . . . . . . . . . . . . . . $(1,514,443)Add: Stock-based employee compensation expense
included in the reported net loss . . . . . . . . . . . . . . . . . . . . . . . . . . . . . . . . . . . 74,812Less: Stock-based employee compensation expense
determined under fair value method for all awards . . . . . . . . . . . . . . . . . . . . . . (1,897,647)Pro forma net loss . . . . . . . . . . . . . . . . . . . . . . . . . . . . . . . . . . . . . . . . . . . . . . $(3,337,278)
Net loss per share, as reported:Basic . . . . . . . . . . . . . . . . . . . . . . . . . . . . . . . . . . . . . . . . . . . . . . . . . . . . . $ (0.16)Diluted . . . . . . . . . . . . . . . . . . . . . . . . . . . . . . . . . . . . . . . . . . . . . . . . . . . . $ (0.16)
Net loss per share, pro forma:Basic . . . . . . . . . . . . . . . . . . . . . . . . . . . . . . . . . . . . . . . . . . . . . . . . . . . . . $ (0.35)Diluted . . . . . . . . . . . . . . . . . . . . . . . . . . . . . . . . . . . . . . . . . . . . . . . . . . . . $ (0.35)
The above pro forma disclosures are not necessarily representative of the effects on reported net incomeor loss for future years.
Fair Value and Assumptions Used to Calculate Fair Value under SFAS 123(R) and SFAS 123
The weighted average fair value of each stock option granted for 2007, 2006 and 2005 was $2.54, $3.59and $5.55, respectively.
59
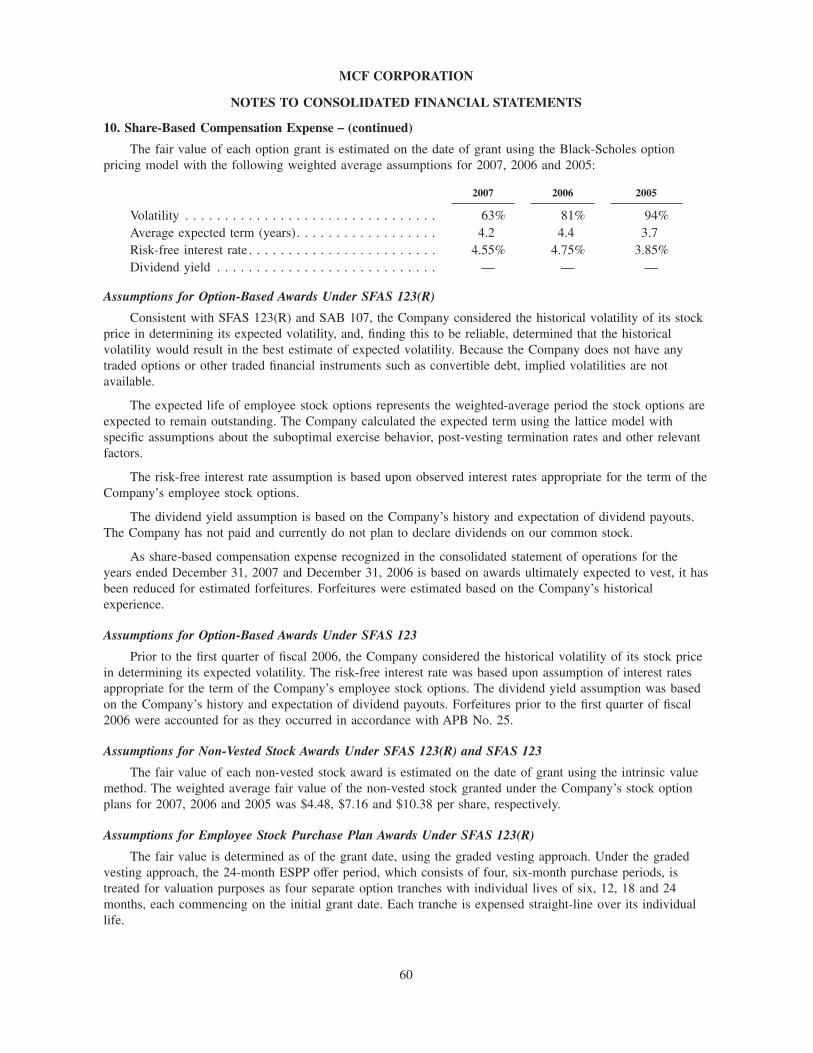
MCF CORPORATION
NOTES TO CONSOLIDATED FINANCIAL STATEMENTS
10. Share-Based Compensation Expense − (continued)
The fair value of each option grant is estimated on the date of grant using the Black-Scholes optionpricing model with the following weighted average assumptions for 2007, 2006 and 2005:
2007 2006 2005
Volatility . . . . . . . . . . . . . . . . . . . . . . . . . . . . . . . . 63% 81% 94%Average expected term (years). . . . . . . . . . . . . . . . . . 4.2 4.4 3.7Risk-free interest rate . . . . . . . . . . . . . . . . . . . . . . . . 4.55% 4.75% 3.85%Dividend yield . . . . . . . . . . . . . . . . . . . . . . . . . . . . — — —
Assumptions for Option-Based Awards Under SFAS 123(R)
Consistent with SFAS 123(R) and SAB 107, the Company considered the historical volatility of its stockprice in determining its expected volatility, and, finding this to be reliable, determined that the historicalvolatility would result in the best estimate of expected volatility. Because the Company does not have anytraded options or other traded financial instruments such as convertible debt, implied volatilities are notavailable.
The expected life of employee stock options represents the weighted-average period the stock options areexpected to remain outstanding. The Company calculated the expected term using the lattice model withspecific assumptions about the suboptimal exercise behavior, post-vesting termination rates and other relevantfactors.
The risk-free interest rate assumption is based upon observed interest rates appropriate for the term of theCompany’s employee stock options.
The dividend yield assumption is based on the Company’s history and expectation of dividend payouts.The Company has not paid and currently do not plan to declare dividends on our common stock.
As share-based compensation expense recognized in the consolidated statement of operations for theyears ended December 31, 2007 and December 31, 2006 is based on awards ultimately expected to vest, it hasbeen reduced for estimated forfeitures. Forfeitures were estimated based on the Company’s historicalexperience.
Assumptions for Option-Based Awards Under SFAS 123
Prior to the first quarter of fiscal 2006, the Company considered the historical volatility of its stock pricein determining its expected volatility. The risk-free interest rate was based upon assumption of interest ratesappropriate for the term of the Company’s employee stock options. The dividend yield assumption was basedon the Company’s history and expectation of dividend payouts. Forfeitures prior to the first quarter of fiscal2006 were accounted for as they occurred in accordance with APB No. 25.
Assumptions for Non-Vested Stock Awards Under SFAS 123(R) and SFAS 123
The fair value of each non-vested stock award is estimated on the date of grant using the intrinsic valuemethod. The weighted average fair value of the non-vested stock granted under the Company’s stock optionplans for 2007, 2006 and 2005 was $4.48, $7.16 and $10.38 per share, respectively.
Assumptions for Employee Stock Purchase Plan Awards Under SFAS 123(R)
The fair value is determined as of the grant date, using the graded vesting approach. Under the gradedvesting approach, the 24-month ESPP offer period, which consists of four, six-month purchase periods, istreated for valuation purposes as four separate option tranches with individual lives of six, 12, 18 and 24months, each commencing on the initial grant date. Each tranche is expensed straight-line over its individuallife.
60
MCF CORPORATION
NOTES TO CONSOLIDATED FINANCIAL STATEMENTS
11. Employee Benefit Plans
The Company has a 401(k) defined contribution plan. The 401(k) plan allows eligible employees tocontribute up to 15% of their compensation, subject to a statutory prescribed annual limit. Employee contribu-tions and earnings thereon vest immediately. Although the Company may make discretionary contributions tothe 401(k) plan, none were made during the three years ended December 31, 2007.
12. Income Taxes
Income tax expense consisted of the following for the three years ended December 31, 2007:
2007 2006 2005
Current:Federal . . . . . . . . . . . . . . . . . . . . . . . . . . . . . . . . $1,857,783 $— $ —State . . . . . . . . . . . . . . . . . . . . . . . . . . . . . . . . . 604,832 — 142,425
Total . . . . . . . . . . . . . . . . . . . . . . . . . . . . . . . . $2,462,165 $— $142,425
The following table reconciles the federal statutory rate to the effective tax rate of the provision forincome taxes for the three years ended December 31, 2007:
2007 2006 2005
Federal statutory income tax rate (benefit) . . . . . . . . . . 34% (34%) (34%)State income taxes. . . . . . . . . . . . . . . . . . . . . . . . . . 8 (5) 3Loss on retirement of convertible note payable . . . . . . — 5 —Permanent differences . . . . . . . . . . . . . . . . . . . . . . . 9 13 10Losses for which no benefit has been recognized . . . . . — 21 31Valuation allowance . . . . . . . . . . . . . . . . . . . . . . . . . (30%) — —Effective tax rate . . . . . . . . . . . . . . . . . . . . . . . . . . . 21% —% 10%
The effective tax rate is influenced by the Company’s performance and tax planning opportunities avail-able in the various jurisdictions in which the Company operates.
The tax effect of temporary differences that give rise to significant portions of the deferred tax assets asof December 31, 2007 and 2006 are presented as follows:
December 31,
2007 2006
Deferred tax assets:Net operating loss carryforwards . . . . . . . . . . . . . . . . . . . . . . . . . . $ 16,016,822 $ 20,834,803Stock options and warrants for services . . . . . . . . . . . . . . . . . . . . . 12,411,225 12,771,213Other. . . . . . . . . . . . . . . . . . . . . . . . . . . . . . . . . . . . . . . . . . . . . (154,566) 26,370Total deferred tax assets . . . . . . . . . . . . . . . . . . . . . . . . . . . . . . . . 28,273,481 33,632,386Valuation allowance . . . . . . . . . . . . . . . . . . . . . . . . . . . . . . . . . . . (28,273,481) (33,632,386)Net deferred tax assets . . . . . . . . . . . . . . . . . . . . . . . . . . . . . . . . . $ — $ —
The net change in the valuation allowance for the year ended December 31, 2007 was a decrease of$5,359,000. The Company has established a valuation allowance against that portion of deferred tax assetswhere management was not able to determine that it is more likely than not that the asset will be realized.
As of December 31, 2007, the Company had federal and state operating loss carryforwards of approxi-mately $42,141,000 and $21,475,000, respectively. If not earlier utilized, the federal net operating losscarryforward will expire between 2021 and 2027 and the state loss carryforward will expire between 2011 and2016. Utilization of the net operating loss carry-forwards and credits is subject to an annual limitation due to
61

MCF CORPORATION
NOTES TO CONSOLIDATED FINANCIAL STATEMENTS
12. Income Taxes − (continued)
the ownership change limitations provided by the Internal Revenue Code of 1986, as amended, and similarstate provisions. The annual limitation will result in the expiration of a portion of net operating loss carryfor-wards before utilization.
The Company adopted the provisions of FASB Interpretation 48, ‘‘Accounting for Uncertainty in IncomeTaxes − an Interpretation of FASB Statement No. 109’’ (‘‘FIN 48’’), on January 1, 2008. Prior to adoption, theCompany’s policy was to establish reserves that reflected the probable outcome of known tax contingencies.The effects of final resolution, if any, were recognized as changes to the effective income tax rate in theperiod of resolution. FIN 48 requires application of a more likely than not threshold to the recognition andderecognition of uncertain tax positions. FIN 48 permits the Company to recognize the amount of tax benefitthat has a greater than 50 percent likelihood of being ultimately realized upon settlement. It further requiresthat a change in judgment related to the expected ultimate resolution of uncertain tax positions be recognizedin earnings in the quarter of such change.
Upon adoption of FIN 48 on January 1, 2007, the Company recognized no adjustment in the liability forunrecognized income tax benefits and no corresponding change in retained earnings. The Company does nothave any material accrued interest or penalties associated with any unrecognized tax benefits. The Company’spolicy is to account for interest, if any, as interest expense and penalties as income tax expense.
The following is a rollforward of our total gross unrecognized tax benefit liabilities for the year endedDecember 31, 2007:
Balance as of December 31, 2006 . . . . . . . . . . . . . . . . . . . . . . . . . . . . . . . . . . . $ —Tax positions related to current year:
Additions . . . . . . . . . . . . . . . . . . . . . . . . . . . . . . . . . . . . . . . . . . . . . . . . . . 1,838,743Reductions . . . . . . . . . . . . . . . . . . . . . . . . . . . . . . . . . . . . . . . . . . . . . . . . . —
Tax positions related to prior year:Additions . . . . . . . . . . . . . . . . . . . . . . . . . . . . . . . . . . . . . . . . . . . . . . . . . . —Reductions . . . . . . . . . . . . . . . . . . . . . . . . . . . . . . . . . . . . . . . . . . . . . . . . . —
Settlements. . . . . . . . . . . . . . . . . . . . . . . . . . . . . . . . . . . . . . . . . . . . . . . . . . . —Lapses in statues of limitations . . . . . . . . . . . . . . . . . . . . . . . . . . . . . . . . . . . . . —Balance as of December 31, 2007 . . . . . . . . . . . . . . . . . . . . . . . . . . . . . . . . . . . $1,838,743
The unrecognized benefit arising from current year is due to timing of recognition of principal transactionrevenue in 2007. The addition to the above liability affects the Company’s effective tax rate in the respectiveperiod of change.
The Company’s tax years 2004-2006 will remain open for three years for examination by the InternalRevenue Service from the date the federal corporation tax returns were filed. The Company’s tax years2002-2006 will remain open for three to four years for examination by state tax authorities from the date thestate corporation tax returns were filed. Net operatng losses deducted are subject to review and adjustment forthree to four years after the net operating losses are deducted on the U.S. and state returns filed.
62

MCF CORPORATION
NOTES TO CONSOLIDATED FINANCIAL STATEMENTS
13. Earnings (Loss) per Share
The following is a reconciliation of the basic and diluted net income (loss) available to common stock-holders and the number of shares used in the basic and diluted net income (loss) per common sharecomputations for the periods presented:
2007 2006 2005
Net income (loss) available tocommon stockholders − basic . . . . . . . . . . . . . . . . . $ 9,323,035 $(8,220,415) $(1,514,443)
Interest on convertible note payable . . . . . . . . . . . . . . 16,336 — —Net income (loss) available to
common stockholders − diluted. . . . . . . . . . . . . . . . 9,339,371 (8,220,415) (1,514,443)
Weighted-average number ofcommon shares − basic . . . . . . . . . . . . . . . . . . . . . 11,528,187 9,989,265 9,500,748
Assumed exercise or conversion of allpotentially dilutive common shares outstanding. . . . . 1,115,337 — —
Weighted-average number ofcommon shares − diluted . . . . . . . . . . . . . . . . . . . . 12,643,524 9,989,265 9,500,748
Basic net income (loss) per share:Income (loss) from continuing operations. . . . . . . . . $ 0.81 $ (0.79) $ (0.16)Loss from discontinued operations . . . . . . . . . . . . . — (0.03) —Net income (loss). . . . . . . . . . . . . . . . . . . . . . . . . $ 0.81 $ (0.82) $ (0.16)
Diluted net income (loss) per share:Income (loss) from continuing operations. . . . . . . . . $ 0.74 $ (0.79) $ (0.16)Loss from discontinued operations . . . . . . . . . . . . . — (0.03) —
Net income (loss) . . . . . . . . . . . . . . . . . . . . . . . . . . $ 0.74 $ (0.82) $ (0.16)
Basic earnings (loss) per share is computed by dividing net income (loss) by the weighted average num-ber of common shares outstanding, excluding unvested restricted stock. Diluted earnings per share iscalculated for 2007 by dividing net income by the weighted average number of common shares used in thebasic earnings per share calculation plus the number of common shares that would be issued assuming exer-cise or conversion of all potentially dilutive common shares outstanding, including unvested restricted stock.Diluted loss per share is unchanged from basic loss per share for 2006 and 2005 because the addition ofcommon shares that would be issued assuming exercise or conversion would be anti-dilutive.
Shares used in the diluted net income (loss) per share computation in the above table include the dilutiveimpact of the Company’s stock options and warrants. The impact of the Company’s stock options and war-rants on shares used for the diluted earnings per share computation is calculated based on the average shareprice of the Company’s common stock for each period using the treasury stock method. Under the treasurystock method, the tax-effected proceeds that would be hypothetically received from the exercise of all stockoptions and warrants with exercise prices below the average share price of the Company’s common stock areassumed to be used to repurchase shares of the Company’s common stock. The dilutive impact of the Compa-ny’s stock options was calculated using an average price of the Company’s common stock of $4.56, $6.41 and$8.68 per share for 2007, 2006 and 2005, respectively.
The Company excludes all potentially dilutive securities from its diluted net income (loss) per sharecomputation when their effect would be anti-dilutive.
63

MCF CORPORATION
NOTES TO CONSOLIDATED FINANCIAL STATEMENTS
13. Earnings (Loss) per Share − (continued)
The following common stock equivalents were excluded from the earnings per share computation, as theirinclusion would have been anti-dilutive:
2007 2006 2005
Stock options and warrants excluded due to the exer-cise price exceeding the average fair value of theCompany’s common stock during the period . . . . . . 1,799,523 1,397,022 1,150,239
Weighted average restricted stock, stock options andstock warrants, calculated using the treasury stockmethod, that were excluded due to the Companyreporting a net loss during the period . . . . . . . . . . . — 1,833,389 2,450,587
Weighted average shares issuable upon conversion ofthe convertible notes payable . . . . . . . . . . . . . . . . . — 704,960 142,858
Weighted average shares contingently issuable . . . . . . . — 73,402 136,376Total common stock equivalents excluded from diluted
net income (loss) per share . . . . . . . . . . . . . . . . . . 1,799,523 4,008,773 3,880,060
14. Business Segments
The Company’s business results are categorized into the following three segments: investment bank/broker-dealer, primary research and asset management. The investment bank/broker-dealer segment includes abroad range of services, such as capital raising and financial advisory services for corporate clients, andbrokerage and equity research services for our institutional investor clients. Our primary research segmentoffers custom, independent primary research services to health care and clean technology companies, as wellas financial services firms that invest in these companies. Our asset management segment manages investmentproducts for investors. We sold our wealth management subsidiary in January 2007. The results from thissegment have been treated as discontinued operations.
The accounting policies of the segments are consistent with those described in the Significant AccountingPolicies in Note 2.
Revenue generating activities between segments are eliminated from the segments results for reportingpurposes. These activities include fees paid by the Asset Management segment to the Primary Research seg-ment for the management of its investment portfolio.
The Company’s segment information for the three years ended December 31, 2007 is prepared using thefollowing methodology:
• Revenue and expenses directly associated with each segment are included in determining income.
• Each segment’s operating expenses include compensation and benefits expenses and other operatingexpenses that are incurred directly in support of the segments. These other operating expenses,include brokerage and clearing fees, cost of primary research services, professional services, occu-pancy and equipment, communications and technology, depreciation and amortization, amortizationof intangible assets, travel and business development and other operating expenses.
• Corporate operating expenses include compensation and benefits for corporate support employees aswell as operating expenses that are not incurred directly in support of our three segments.
The Company evaluates segment results based on revenue and segment income.
64

MCF CORPORATION
NOTES TO CONSOLIDATED FINANCIAL STATEMENTS
14. Business Segments − (continued)
Management believes that the following information provides a reasonable representation of each seg-ment’s contribution to revenue, income and assets:
2007 2006 2005
Broker-DealerRevenue . . . . . . . . . . . . . . . . . . . . . . . . $83,089,485 $51,436,697 $43,184,315Operating expenses . . . . . . . . . . . . . . . . . 60,251,106 49,720,757 35,566,525Segment operating income . . . . . . . . . . . . $22,838,379 $ 1,715,940 $ 7,617,790
Segment assets . . . . . . . . . . . . . . . . . . . . $53,653,805 $27,501,531 $25,743,423
Primary ResearchRevenue . . . . . . . . . . . . . . . . . . . . . . . . $ 3,848,421 $ — $ —Operating expenses . . . . . . . . . . . . . . . . . 5,492,759 — —Segment operating loss . . . . . . . . . . . . . . $ (1,644,338) $ — $ —
Segment assets . . . . . . . . . . . . . . . . . . . . $ 6,771,371 $ — $ —
Asset ManagementRevenue . . . . . . . . . . . . . . . . . . . . . . . . $ 718,086 $ 381,941 $ —Operating expenses . . . . . . . . . . . . . . . . . 1,186,479 761,805 250,695Segment operating loss . . . . . . . . . . . . . . $ (468,393) $ (379,864) $ (250,695)Segment assets . . . . . . . . . . . . . . . . . . . . $ 3,363,019 $ 1,231,842 $ 340,838
Corporate SupportOperating loss . . . . . . . . . . . . . . . . . . . . $ 9,264,315 $ 7,833,368 $ 9,095,552
Consolidated EntityRevenue . . . . . . . . . . . . . . . . . . . . . . . . $87,655,992 $51,818,638 $43,184,315Operating expenses . . . . . . . . . . . . . . . . . 76,194,659 58,315,930 44,912,772Operating income (loss) . . . . . . . . . . . . . . $11,461,333 $ (6,497,292) $ (1,728,457)
Total assets . . . . . . . . . . . . . . . . . . . . . $64,573,331 $30,498,213 $27,694,413
15. Commitments and Contingencies
The following is a table summarizing significant commitments as of December 31, 2007, consisting ofdebt service payments related to convertible and non-convertible notes payable and future minimum leasepayments under all non-cancelable operating leases and capital leases with initial or remaining terms in excessof one year.
NotesPayable
OperatingLeases
CapitalLeases
2008 . . . . . . . . . . . . . . . . . . . . . . . . . . . . . . . . . . . . . . . . . . $243,573 2,628,402 563,5262009 . . . . . . . . . . . . . . . . . . . . . . . . . . . . . . . . . . . . . . . . . . — 2,444,011 341,6742010 . . . . . . . . . . . . . . . . . . . . . . . . . . . . . . . . . . . . . . . . . . — 2,019,930 50,8802011 . . . . . . . . . . . . . . . . . . . . . . . . . . . . . . . . . . . . . . . . . . — 1,923,516 —2012 . . . . . . . . . . . . . . . . . . . . . . . . . . . . . . . . . . . . . . . . . . — 1,174,323 —Thereafter . . . . . . . . . . . . . . . . . . . . . . . . . . . . . . . . . . . . . . — 572,000 —Total commitments . . . . . . . . . . . . . . . . . . . . . . . . . . . . . . . . $243,573 $10,762,182 $956,080
65
MCF CORPORATION
NOTES TO CONSOLIDATED FINANCIAL STATEMENTS
15. Commitments and Contingencies − (continued)
The Company leases its San Francisco corporate office under a noncancelable operating lease whichexpires in August 2011. Future annual minimum lease payments related to its various operating leases areincluded in the table above. Rent expense was approximately $1,106,000, $1,043,000 and $1,006,000 in 2007,2006 and 2005, respectively.
Legal Proceedings
Thomas O’Shea v. Merriman Curhan Ford & Co.
In June 2006, our broker-dealer subsidiary Merriman Curhan Ford & Co. was served with a claim inNASD Arbitration by Mr. O’Shea. Mr. O’Shea is a former at-will employee of Merriman Curhan Ford & Co.and worked in the investment banking department. Mr. O’Shea resigned from Merriman Curhan Ford & Co.in July 2005. Mr. O’Shea alleges breach of an implied employment contract, quantum meruit, and unjustenrichment based on his allegations that he was to be paid more for his work. The matter is in the discoverystage and an arbitration hearing scheduled for June 2007 is being rescheduled between the parties and theArbitration Panel. We believe that we have meritorious defenses and intend to contest these claims vigorously.However, in the event that we did not prevail, based upon the facts as we know them to date, we do notbelieve that the outcome will have a material effect on our financial position, financial results or cash flows.
S3 Investment Company, Inc. v. Merriman Curhan Ford & Co. and Qualico Capital, Inc.
In September 2007, Merriman Curhan Ford & Co. was served with a complaint filed by a former clientS3 Investment Company, Inc. (‘‘S3i’’).The matter is pending before the Superior Count in the City andCounty of San Francisco. The plaintiff alleges theories of breach of contract, fraud, negligent misrepresenta-tion, intentional and negligent interference with prospective economic relations. We believe that we havemeritorious defenses and intend to contest these claims vigorously. However, in the event that we did notprevail, based upon the facts as we know them to date, we do not believe that the outcome will have a mate-rial effect on our financial position, financial results or cash flows.
Other Matters
Additionally, from time to time, the Company is involved in ordinary routine litigation incidental to itsbusiness.
16. Financial Instruments, Off-Balance Sheet Arrangements and Credit Risk
Financial Instruments
The Company’s broker-dealer entity trades securities that are primarily traded in United States markets.As of December 31, 2007 and 2006, the Company had not entered into any transactions involving financialinstruments, such as financial futures, forward contracts, options, swaps or derivatives that would expose theCompany to significant related off-balance-sheet risk.
In addition, the Company, from time to time, has sold securities it does not currently own in anticipationof a decline in the fair value of that security (securities sold, not yet purchased). Securities sold, not yetpurchased represent obligations of the Company to deliver the specified security at the contracted price andthereby create a liability to purchase the security in the market at prevailing prices. These transactions resultin off-balance sheet risk as the Company’s ultimate obligation to purchase such securities may exceed theamount recognized in the consolidated statements of financial condition.
Market risk is primarily caused by movements in market prices of the Company’s trading and investmentaccount securities. The Company’s trading securities and investments are also subject to interest rate volatilityand possible illiquidity in markets in which the Company trades or invests. The Company seeks to controlmarket risk through monitoring procedures. The Company’s principal transactions are primarily long and shortequity transactions.
66

MCF CORPORATION
NOTES TO CONSOLIDATED FINANCIAL STATEMENTS
16. Financial Instruments, Off-Balance Sheet Arrangements and Credit Risk − (continued)
Off-Balance Sheet Arrangements
The Company was not a party to any off-balance sheet arrangements during the three years endedDecember 31, 2007. In particular, the Company does not have any interest in so-called limited purpose enti-ties, which include special purpose entities and structured finance entities.
Credit Risk
The Company’s broker-dealer subsidiary functions as an introducing broker that places and executescustomer orders. The orders are then settled by an unrelated clearing organization that maintains custody ofcustomers’ securities and provides financing to customers. Through indemnification provisions in agreementswith clearing organizations, customer activities may expose the Company to off-balance-sheet credit risk.Financial instruments may have to be purchased or sold at prevailing market prices in the event a customerfails to settle a trade on its original terms or in the event cash and securities in customer margin accounts arenot sufficient to fully cover customer obligations. The Company seeks to control the risks associated withcustomer activities through customer screening and selection procedures as well as through requirements oncustomers to maintain margin collateral in compliance with various regulations and clearing organizationpolicies.
The Company is also exposed to credit risk as it relates to the collection of receivables from third parties,including lead managers in underwriting transactions and the Company’s corporate clients related to privateplacements of securities and financial advisory services.
17. Regulatory Requirements
Merriman Curhan Ford & Co. is a broker-dealer subject to Rule 15c3-1 of the Securities and ExchangeCommission, which specifies uniform minimum net capital requirements, as defined, for their registrants. Asof December 31, 2007, Merriman Curhan Ford & Co. had regulatory net capital, as defined, of $17,848,000,which exceeded the amount required by $16,419,000. Merriman Curhan Ford & Co. is exempt from Rules15c3-3 and 17a-13 under the Securities Exchange Act of 1934 because it does not carry customer accounts,nor does it hold customer securities or cash.
18. Related Party Transactions
As described in Note 5, the Company issued a $400,000 convertible note payable during 2001 to theformer Chairman and CEO of the Company in connection with severance terms included in his employmentagreement. In May 2003, the Company and Mr. Sledge agreed to convert the principal and interest due atmaturity into a five year fully amortizing note payable. As of December 31, 2007, the remaining principalamount of the note payable was $42,000. Mr. Sledge served as a member of the Company’s Board of Direc-tors until March 2007.
From time to time, officers, directors, employees and/or certain large stockholders of the Company mayinvest in private placements which the Company arranges and for which the Company charges investmentbanking fees.
19. Quarterly Financial Data (Unaudited)
The table below sets forth the operating results represented by certain items in the Company’s consoli-dated statements of operations for each of the eight quarters in the period ended December 31, 2007. Thisinformation is unaudited, but in the Company’s opinion reflects all adjustments (consisting only of normalrecurring adjustments) that the Company considers necessary for a fair presentation of such information inaccordance with generally accepted accounting principles.
67

MCF CORPORATION
NOTES TO CONSOLIDATED FINANCIAL STATEMENTS
19. Quarterly Financial Data (Unaudited) − (continued)
The results for any quarter are not necessarily indicative of results for any future period.
2007
1st 2nd 3rd 4th
Revenue . . . . . . . . . . . . . . . . . . . . . . . . . . . . . $14,323,144 $20,372,349 $17,660,194 $35,300,305Operating expenses . . . . . . . . . . . . . . . . . . . . . . 14,322,037 18,077,573 17,588,823 26,206,226Operating income . . . . . . . . . . . . . . . . . . . . . . . 1,107 2,294,776 71,371 9,094,079Net income . . . . . . . . . . . . . . . . . . . . . . . . . . . 69,256 2,320,373 188,460 6,744,946Basic net income per common share . . . . . . . . . . $ 0.01 $ 0.20 $ 0.02 $ 0.56Diluted net income per common share . . . . . . . . . $ 0.01 $ 0.18 $ 0.01 $ 0.51
2006
1st 2nd 3rd 4th
Revenue . . . . . . . . . . . . . . . . . . . . . . . . . . . . . $11,560,302 $14,864,866 $ 7,426,490 $17,966,980Operating expenses . . . . . . . . . . . . . . . . . . . . . . 12,897,544 15,535,834 12,717,715 17,164,837Operating income (loss) . . . . . . . . . . . . . . . . . . . (1,337,242) (670,968) (5,291,225) 802,143Net income (loss) . . . . . . . . . . . . . . . . . . . . . . . (1,349,608) (1,059,935) (5,109,051) (701,821)Basic net income (loss) per common share . . . . . . $ (0.14) $ (0.11) $ (0.51) $ (0.07)Diluted net income (loss) per common share. . . . . $ (0.14) $ (0.11) $ (0.51) $ (0.07)
68

Item 9. Changes in and Disagreements with Accountants on Accounting and Financial Disclosure
The financial statements included in this report have been audited by Ernst & Young LLP, independentauditors, as stated in their audit report appearing herein.
During the year ended December 31, 2007 and through the date of this Annual Report on Form 10-K,there were no disagreements with Ernst & Young LLP on any matter of accounting principle or practice,financial statement disclosure, or auditing scope or procedure which, if not resolved to Ernst & Young LLP’ssatisfaction, would have caused them to make reference to the subject matter in connection with their reporton our consolidated financial statements; and there were no reportable events as set forth in applicable SECregulations.
Item 9a. Controls and Procedures
Evaluation of Disclosure Controls and Procedures — We have established disclosure controls and proce-dures to ensure that material information relating to the Company, including its consolidated subsidiaries, ismade known to the officers who certify the Company’s financial reports and to other members of seniormanagement and the Board of Directors.
Based on their evaluation as of December 31, 2007, the principal executive officer and principal financialofficer of the Company have concluded that the Company’s disclosure controls and procedures (as defined inRules 13a-15(e) and 15d-15(e) under the Securities Exchange Act of 1934) are effective.
Management’s Report on Internal Control Over Financial Reporting — Our management is responsiblefor establishing and maintaining adequate internal control over financial reporting, as such term is defined inExchange Act Rules 13a-15(f). Under the supervision and with the participation of our management, includingour principal executive officer and principal financial officer, we conducted an evaluation of the effectivenessof our internal control over financial reporting based on the framework in Internal Control — IntegratedFramework issued by the Committee of Sponsoring Organizations of the Treadway Commission. Based on ourevaluation under the framework in Internal Control — Integrated Framework, our management concluded thatour internal control over financial reporting was effective as of December 31, 2007.
Changes in internal controls — No change in the Company’s internal control over financial reporting (asdefined in Rules 13a-15(d) and 15d-15(d) of the Exchange Act) occurred during the quarter ended Decem-ber 31, 2007, that materially affected, or is reasonably likely to materially affect, the Company’s internalcontrol over financial reporting.
Item 9b. Other Information
Not applicable.
69

REPORT OF INDEPENDENT REGISTERED PUBLIC ACCOUNTING FIRM
The Board of Directors and Stockholders ofMCF Corporation and subsidiaries
We have audited MCF Corporation and subsidiaries (the ‘‘Company’’)’s internal control over financialreporting as of December 31, 2007, based on criteria established in Internal Control — Integrated Frameworkissued by the Committee of Sponsoring Organizations of the Treadway Commission (the COSO criteria). TheCompany’s management is responsible for maintaining effective internal control over financial reporting andfor its assessment of the effectiveness of internal control over financial reporting. Our responsibility is toexpress an opinion on the Company’s internal control over financial reporting based on our audit.
We conducted our audit in accordance with the standards of the Public Company Accounting OversightBoard (United States). Those standards require that we plan and perform the audit to obtain reasonable assur-ance about whether effective internal control over financial reporting was maintained in all material respects.Our audit included obtaining an understanding of internal control over financial reporting, assessing the riskthat a material weakness exists, testing and evaluating the design and operating effectiveness of internal con-trol based on the assessed risk, and performing such other procedures as we considered necessary in thecircumstances. We believe that our audit provides a reasonable basis for our opinion.
A company’s internal control over financial reporting is a process designed to provide reasonable assur-ance regarding the reliability of financial reporting and the preparation of financial statements for externalpurposes in accordance with generally accepted accounting principles. A company’s internal control overfinancial reporting includes those policies and procedures that (1) pertain to the maintenance of records that,in reasonable detail, accurately and fairly reflect the transactions and dispositions of the assets of the com-pany; (2) provide reasonable assurance that transactions are recorded as necessary to permit preparation offinancial statements in accordance with generally accepted accounting principles, and that receipts and expen-ditures of the company are being made only in accordance with authorizations of management and directors ofthe company; and (3) provide reasonable assurance regarding prevention or timely detection of unauthorizedacquisition, use, or disposition of the company’s assets that could have a material effect on the financialstatements.
Because of its inherent limitations, internal control over financial reporting may not prevent or detectmisstatements. Also, projections of any evaluation of effectiveness to future periods are subject to the risk thatcontrols may become inadequate because of changes in conditions, or that the degree of compliance with thepolicies or procedures may deteriorate.
In our opinion, the Company maintained, in all material respects, effective internal control over financialreporting as of December 31, 2007, based on the COSO criteria.
We also have audited, in accordance with the standards of the Public Company Accounting OversightBoard (United States), the consolidated statements of financial condition of the Company as of December 31,2007 and 2006, and the related consolidated statements of operations, stockholders’ equity, and cash flows foreach of the three years in the period ended December 31, 2007 of the Company and our report dated Febru-ary 11, 2008 expressed an unqualified opinion thereon.
/s/ Ernst & Young LLP
San Francisco, CaliforniaFebruary 11, 2008
70

PART III
Item 10. Directors and Executive Officers of the Registrant
The table below sets forth certain information concerning each of the Directors and executive officers ofMCF Corporation:
Name Age Position
D. Jonathan Merriman 47 Chief Executive OfficerGregory S. Curhan 46 Executive Vice PresidentRobert E. Ford 47 President and Chief Operating OfficerJohn D. Hiestand 39 Chief Financial OfficerChristopher L. Aguilar 46 General CounselPatrick H. Arbor 71 DirectorWilliam J. Febbo 39 DirectorRaymond J. Minehan 66 DirectorScott Potter 39 DirectorDennis G. Schmal 60 DirectorRonald E. Spears 59 DirectorJohn M. Thompson 69 Chairman of the Board of DirectorsSteven W. Town 47 Director
D. Jonathan Merriman has served as our Chief Executive Officer from February 2001 to the present andserved as Chairman of the Board of Directors from February 2001 to November 2007. Prior to that period,Mr. Merriman was President and CEO of Ratexchange Corporation, the predecessor company to MCF Corpo-ration. Mr. Merriman and his team engineered the transition of Ratexchange, a software trading platformcompany, into a full-service institutional investment bank, MCF Corporation. From June 1998 to Octo-ber 2000, Mr. Merriman was Managing Director and Head of the Equity Capital Markets Group and memberof the Board of Directors at First Security Van Kasper. In this capacity, he oversaw the Research, InstitutionalSales, Equity Trading, Syndicate and Derivatives Trading departments. From June 1997 to June 1998,Mr. Merriman served as Managing Director and Head of Capital Markets at The Seidler Companies in LosAngeles, where he also served on the firm’s Board of Directors. Before Seidler, Mr. Merriman was Director ofEquities for Dabney/Resnick/Imperial, LLC. In 1989, Mr. Merriman co-founded the hedge fund companyCurhan, Merriman Capital Management, Inc., which managed money for high net worth individuals andcorporations. Before Curhan, Merriman Capital Management, Inc., he worked in the Risk Arbitrage Depart-ment at Bear Stearns & Co. as a trader. Prior to Bear Stearns, Mr. Merriman worked at Merrill Lynch as afinancial analyst and as an institutional equity salesman. Mr. Merriman received his Bachelor of Arts in Psy-chology from Dartmouth College and completed coursework at New York University’s Graduate School ofBusiness. Mr. Merriman has served on the Boards of several for-profit and non-profit organizations and cur-rently holds seats on the Board of Directors of MCF Corporation and Leading Brands, Inc.
Gregory S. Curhan has served as our Executive Vice President from January 2002 to present and servedas Chief Financial Officer from January 2002 to January 2004. Previously, he served as Chief FinancialOfficer of WorldRes.com from May 1999 through June 2001. Prior to joining WorldRes.com, Mr. Curhanserved as Director of Global Technology Research Marketing and Managing Director Specialty TechnologyInstitutional Equity Sales at Merrill Lynch & Co. from May 1998 to May 1999. Prior to joining MerrillLynch, Mr. Curhan was a partner in the investment banking firm of Volpe Brown Whelan & Co., serving invarious capacities including Internet research analyst and Director of Equities from May 1993 to May 1998.Mr. Curhan was a founder and principal of the investment advisor Curhan, Merriman Capital Managementfrom July 1988 through December 1992. Prior to founding Curhan, Merriman, Mr. Curhan was a Vice Presi-dent institutional equity sales for Montgomery Securities from June 1985 through June 1988. FromAugust 1983 to May 1985, Mr. Curhan was a financial analyst in the investment banking group at MerrillLynch. Mr. Curhan earned his Bachelor of Arts degree from Dartmouth College.
Robert E. Ford had served as President and Chief Operating Officer for MCF Corporation since Febru-ary 2001. He brings 20 years of executive and operations experience to the Company. Prior to joining MCF
71
Corporation from February 2000 to February 2001, Mr. Ford was a co-Founder and CEO of Metacat, Inc., acontent management ASP that specialized in enabling supplier catalogs for Global 2000 private exchanges andeMarketplaces. From June 1996 to December 1999, he was President/COO and on the founding team ofJobDirect.com, a leading resume and job matching service for university students, which was acquired byKorn Ferry International. Previously, Mr. Ford co-founded and managed an education content company fromSeptember 1994 to 1996. Prior to that, from May 1992 to August 1994, he headed up a turnaround andmerger as General Manager of a 65 year-old manufacturing and distribution company. Mr. Ford started hiscareer as VP of Business Development at Lazar Enterprises, a technology-consulting firm he helped operatefrom June 1989 to February 1992. He earned his Masters in International Business and Law from the FletcherSchool of Law and Diplomacy in 1989 at Tufts University and a BA with high distinction from DartmouthCollege in 1982.
John D. Hiestand joined MCF Corporation as the Controller in January 2002 and became Chief Finan-cial Officer in January 2004. From December 2000 to November 2001, he served as the Controller of theMetro-Switching Division at CIENA Corporation. Mr. Hiestand had come to CIENA through the merger withCyras Systems, Inc., where he served as the Controller from March 2000 to December 2000. Prior to joiningCyras Systems, Inc., Mr. Hiestand served as a Senior Manager in the audit practice at KPMG LLP in SanFrancisco. Mr. Hiestand received a Bachelor of Arts in Business from California Polytechnic State Universityat San Luis Obispo in 1991, and holds the Certified Public Accountant (CPA) and Chartered Financial Analyst(CFA) designations.
Christopher L. Aguilar has served as General Counsel of MCF Corporation from March 2000 to presentand serves as General Counsel and Chief Compliance Officer of Merriman Curhan Ford & Co. He brings 15years of legal and regulatory experience to the Company. From August 1995 to March 2000, Mr. Aguilar wasa partner at Bradley, Curley & Asiano, a San Francisco law firm, where he represented the interests of publicand private corporations, small businesses and individuals in commercial litigation. Mr. Aguilar has alsoworked for the San Francisco City Attorney and Alameda County District Attorney’s offices. Mr. Aguilarreceived his juris doctorate degree from the University of California, Hastings College of the Law. He alsoattended Oxford University as an undergraduate and received his Bachelor of Arts degree from the IntegralProgram at St. Mary’s College of California where he was included in Who’s Who among American Collegesand Universities. Mr. Aguilar is presently an adjunct professor at University of California, Hastings College ofthe Law.
Patrick H. Arbor has served as a member of our Board of Directors since February 2001 and has servedas a member of the audit committee since April 2001. Mr. Arbor is currently Chairman of United FinancialHoldings Inc., a bank holding company. Mr. Arbor has been a principal of the trading firm of Shatkin-Arbor& Co. from 1997 to the present time. He is a longtime member of the Chicago Board of Trade (CBOT), theworld’s oldest derivatives exchange, serving as the organization’s Chairman from 1993 to 1999. During thatperiod, Mr. Arbor also served on the Board of Directors of the National Futures Association. Prior to that, heserved as Vice Chairman of the CBOT for three years and ten years as a Director. Mr. Arbor’s other exchangememberships include the Chicago Board Options Exchange, the Mid-America Commodity Exchange and theChicago Stock Exchange. Mr. Arbor received his undergraduate degree in business and economics fromLoyola University.
William J. Febbo has served as a member of our Board of Directors since April 2007. Mr. Febbo wasChief Executive Officer and founder of MedPanel, Inc., an online medical market intelligence firm, fromJanuary 1999 to April 2007. At MedPanel, Mr. Febbo oversaw the company’s sales, marketing, technology,finance and content development organizations. We acquired MedPanel, Inc. in April 2007 (now Panel Intelli-gence, LLC), where Mr. Febbo continues his responsibilities. Mr. Febbo has been Treasurer on the Board ofthe United Nations of Greater Boston since November 2004. Prior to founding MedPanel, Inc., Mr. Febbo wasChairman of the Board of Directors of Pollone, a Brazilian manufacturing venture in the automotive industry,from January 1998 to January 1999. From January 1996 to January 1999, Mr. Febbo was with Dura Automo-tive working in business development and mergers and acquisition overseas. Mr. Febbo received his B.S.degree in international studies, with a focus on economics and Spanish, from Dickinson College.
72

Raymond J. Minehan has served as a member of our Board of Directors and as a member of our auditcommittee and compensation committee since August 2003. Since May 2005, Mr. Minehan has served asChief Financial Officer for the Conservation and Liquidation Office of the State of California. From Febru-ary 2002 to May 2005, Mr. Minehan was retired. From February 2001 to February 2002, Mr. Minehan servedas the Chief Financial Officer at Memestreams, Inc., a startup company that was developing informationmanagement software. From January 1997 to August 2000, he served as the Chief Administrative Officer atSutro & Co. where he was responsible for all administrative functions including finance, management infor-mation systems, telecommunications, operations, human resources and facilities. From 1989 to 1997, heserved as chief financial officer at Hambrecht & Quist, Inc. From 1972 to 1989, Mr. Minehan served as apartner with Arthur Andersen LLP. Mr. Minehan served in the United States Air Force as a navigator assignedto the Strategic Air Command as B-52 navigator/electronic warfare officer. He attained the rank of Captain.Mr. Minehan received his Bachelor of Arts degree in Finance from Golden Gate University.
Scott Potter became a Director of MCF Corporation in August 2004 and has served as a member of ournominations committee since November 2005. From February 2005 until the present, he has served as aManaging General Partner of San Francisco Equity Partners (SFEP), a private equity firm focused on expan-sion stage companies within the information technology, media, consumer, and service industries. Prior tofounding SFEP in February 2005, Mr. Potter served as Director of LMS Capital, the venture capital arm ofLondon Merchant Securities plc (LON:LMSO) from January 2003 to February 2005, where Mr. Potter over-saw LMS’ North American Private Equity portfolio. Prior to joining LMS, Mr. Potter held the position ofSenior Vice President, Field Operations at Inktomi Corporation from August 2002 to January 2003 where hehad responsibility for Inktomi’s sales force, business development, consulting services, and field offices. FromJanuary 2000 to August 2002, Mr. Potter served as President and CEO of Quiver, Inc., an enterprise softwarecompany funded by some of the world’s leading Venture Capital firms. Under Mr. Potter’s leadership, Quiverbecame a leading company in the Information Management space, and ultimately was acquired by Inktomi inAugust of 2002. Prior to his tenure at Quiver, Mr. Potter was Executive Vice President in charge of businessdevelopment and corporate development at Worldres, Inc., an online travel technology company. Mr. Potter’scareer began as an attorney for one of Silicon Valley’s leading law firms, Venture Law Group. A frequentspeaker at technology industry conferences and investor forums, Mr. Potter holds a BA in Industrial Psychol-ogy from the University of California at Berkeley and a JD Degree from UC Berkeley’s Boalt Hall School ofLaw. Mr. Potter currently serves as Chairman of The Guild, Inc. and serves on the board of directors ofMethod Products, Modviz, Penguin Computing, and Rave Motion Pictures.
Dennis G. Schmal has served as a member of our Board of Directors and as a member of our auditcommittee since August 2003. Mr. Schmal has also served as a member of our compensation committee sinceMarch 2007. From February 1972 to April 1999, Mr. Schmal served as a partner in the audit practice atArthur Andersen LLP. Mr. Schmal now performs a variety of consulting services for a number of companies.As a senior business advisor with special focus in finance, he has extensive knowledge of financial reportingand holds the CPA designation. Besides serving on the boards of two private companies, Mr. Schmal alsoserves on the Board of Directors for Varian Semiconductor Equipment Associates, Inc. (VSEA), a publiccompany. Mr. Schmal attended California State University, Fresno where he received a Bachelor of Science inBusiness Administration — Finance and Accounting Option.
Ronald E. Spears has served as a member of our Board of Directors from March 2000 to present andserved as a member of the Audit Committee from April 2001 to August 2003. Since March 2002, Mr. Spearshas served as President of AT&T’s Signature Client Group, the sales organization that serves AT&T’s largest325 Global accounts. From October 1990 until joining AT&T in 2002, Mr. Spears served in a number of earlystage ventures primarily involved in the development and sale of technology solutions to large corporateenterprises. During this time, he served as Chief Operating Officer of e.Spire Communications, an East CoastCLEC; Chief Executive Officer of CMGI Solutions, an Internet Professional Services firm; and Chief Execu-tive Officer of Vaultus, a wireless software company. In these roles, he led several successful equity and debtofferings for these ventures. Mr. Spears also served in various capacities at MCI Communications from 1979to 1990; his last position was President of MCI’s Midwest Division from 1984 to 1990. A pioneer of thecompetitive long distance industry, Mr. Spears began his career in telecommunications as a manager at AT&T
73
Long Lines in 1978, following eight years as an officer in the United States Army. He is a graduate of theUnited States Military Academy at West Point, and also holds a Master’s Degree in Public Service fromWestern Kentucky University.
John M. Thompson has served as Chairman of our Board of Directors since November 2007. An experi-enced business advisor, Mr. Thompson has chaired several boards of directors, including Arthur D. Little andMedPanel, Inc. (now Panel Intelligence, LLC, a wholly owned subsidiary), and served on others. In his lastexecutive position, he served as chairman and Chief Executive Officer of CSC Europe, overseeing all Euro-pean operations for the Computer Sciences Corporation (NYSE: CSC). Prior to that, he was Vice Chairman ofIndex Group, the company that pioneered the concepts of process redesign and business reengineering.Mr. Thompson is well known on both sides of the Atlantic as a management consultant, helping better posi-tion firms for stronger growth. In the 1960’s he was a co-founder of Interactive Data Corporation (NYSE:IDC). Mr. Thompson has been a guest faculty member at several universities including Harvard, MIT andWharton, and he holds an M.A. from Cambridge University.
Steven W. Town has served as a member of our Board of Directors from October 2000 to present andhas served as a member of the compensation committee since April 2001. Mr. Town has served as Co-ChiefExecutive Officer of the Amerex Natural Gas, Amerex Power and Amerex Bandwidth, Ltd. Mr. Town beganhis commodities career in 1987 in the retail futures industry prior to joining the Amerex Group of Companies.He began the Amerex futures and forwards brokerage group in natural gas in 1990, in Washington D.C., andmoved this unit of Amerex to Houston in 1992. During Mr. Town’s tenure as Co-Chief Executive Officer, theAmerex companies have become the leading brokerage organizations in their respective industries. Amerexcurrently provides energy, power and bandwidth brokerage services to many of the major energy companies.Mr. Town is a graduate of Oklahoma State University.
The Company has a standing audit committee whose members are Dennis G. Schmal, Raymond J. Mine-han and Patrick H. Arbor.
There is no family relationship among any of the foregoing officers or between any of the foregoingexecutive officers and any Director of the Company.
The information set forth under the caption ‘‘Section 16(a) Beneficial Ownership Reporting Compliance’’is incorporated by reference to the Company’s definitive 2008 Proxy Statement.
Audit Committee Financial Expert
The board of directors has determined that Dennis G. Schmal and Raymond J. Minehan are ‘‘auditcommittee financial experts’’ and ‘‘independent’’ as defined under applicable SEC and American StockExchange rules. The board’s affirmative determination for Dennis G. Schmal was based, among other things,upon his 27 years at Arthur Andersen LLP, most of those years as a partner in the audit practice. The board’saffirmative determination for Raymond J. Minehan was based, among other things, upon his extensive experi-ence as chief administrative officer of Sutro & Co. and, prior to that, as chief financial officer of Hambrecht &Quist, Inc. and, prior to that, as audit partner of Arthur Andersen LLP.
Financial Code of Ethics
The Company has adopted its ‘‘Finance Code of Professional Conduct’’, a code of ethics that applies toour Chief Executive Officer, Chief Financial Officer and other finance organization employees. The financecode of ethics is publicly available on our website at www.merrimanco.com. If we make any substantiveamendments to the finance code of ethics or grant any waiver, including any implicit waiver, from a provisionof the code to our Chief Executive Officer or Chief Financial Officer, we will disclose the nature of suchamendment or waiver on that website or in a report on Form 8-K.
Item 11. Executive Compensation
The information is incorporated by reference to the Company’s definitive 2008 Proxy Statement.
Item 12. Security Ownership of Certain Beneficial Owners and Management
The information is incorporated by reference to the Company’s definitive 2008 Proxy Statement.
74
Item 13. Certain Relationships and Related Transactions
The information is incorporated by reference to the Company’s definitive 2008 Proxy Statement.
Item 14. Principal Accounting Fees and Services
The information is incorporated by reference to the Company’s definitive 2008 Proxy Statement.
PART IV
Item 15. Exhibits and Financial Statement Schedules
(a) 1. The information required by this item is included in Item 8 of Part II of this Annual Report onForm 10-K.
2. Financial Statement Schedules
The required schedules are omitted because of the absence of conditions under which they arerequired or because the required information is presented in the financial statements or notesthereto.
3. Exhibits
The exhibits listed in the accompanying index to exhibits are filed or incorporated by referenceas part of this Annual Report on Form 10-K.
75
SIGNATURES
Pursuant to the requirements of Section 13 or 15(d) of the Securities Exchange Act of 1934, the regis-trant has duly caused this report to be signed on its behalf by the undersigned, thereunto duly authorized.
MCF Corporation
February 12, 2008
By: /s/ D. Jonathan Merriman
D. Jonathan Merriman,Chief Executive Officer
Pursuant to the requirements of the Securities and Exchange Act of 1934, this report has been signedbelow by the following persons on behalf of the registrant and in the capacities and on the dates indicated.
Signature Title Date
/s/ D. Jonathan Merriman
D. Jonathan Merriman
Chief Executive Officer February 12, 2008
/s/ John D. Hiestand
John D. Hiestand
Chief Financial Officer and Principal AccountingOfficer
February 12, 2008
/s/ John M. Thompson
John M. Thompson
Chairman of the Board of Directors February 12, 2008
/s/ Patrick H. Arbor
Patrick H. Arbor
Director February 12, 2008
/s/ William J. Febbo
William J. Febbo
Director February 12, 2008
/s/ Raymond J. Minehan
Raymond J. Minehan
Director February 12, 2008
/s/ Scott Potter
Scott Potter
Director February 12, 2008
/s/ Dennis G. Schmal
Dennis G. Schmal
Director February 12, 2008
/s/ Ronald E. Spears
Ronald E. Spears
Director February 12, 2008
/s/ Steven W. Town
Steven W. Town
Director February 12, 2008
76

EXHIBIT INDEX
Exhibit No. Description
3.1 Certificate of Incorporation, as amended (incorporated herein by reference to Exhibit 3.1 toMCF’s Registration Statement on Form S-1 (Reg. No. 333-37004)).
3.3 Amended and Restated Bylaws, as amended (incorporated by reference to Exhibit 10.3 to MCF’sRegistration Statement on Form S-1 (Reg. No. 333-53316)).
4.1 Form of Convertible Subordinated Note related to MCF private financing, dated November 26,2001 (incorporated by reference to Exhibit 4.1 to MCF’s Form 10-K for the year endedDecember 31, 2001) (Reg. No. 001-15831).
4.2 Form of Class A Redeemable Warrant to Purchase Common Stock of MCF related to MCFCorporation private financing, dated November 26, 2001 (incorporated by reference to Exhibit4.2 to MCF’s Form 10-K for the year ended December 31, 2001) (Reg. No. 001-15831).
10.13+ Employment Agreement between MCF and D. Jonathan Merriman dated October 5, 2000 (incor-porated herein by reference to Exhibit 10.15 to MCF’s Registration Statement on Form S-1(Reg. No. 333-53316)).
10.15+ 1999 Stock Option Plan (incorporated herein by reference to Exhibit 4.1 to MCF’s RegistrationStatement on Form S-8 (Reg. No.333-43776)).
10.16+ Form of Non-Qualified, Non-Plan Stock Option Agreement dated February 24, 2000 betweenMCF and Phillip Rice, Nick Cioll, Paul Wescott, Ross Mayfield, Russ Matulich, Terry Ginn,Donald Sledge, Christopher Vizas, Douglas Cole, Ronald Spears and Jonathan Merriman (incor-porated by reference to Exhibit 4.2 to MCF’s Registration Statement on Forms S-8 (Reg. No.333-43776)).
10.17+ Schedule of non-plan option grants made under Non-Qualified, Non-Plan Stock Option Agree-ments to directors and executive officers (incorporated herein by reference to Exhibit 10.19 toMCF’s Registration Statement on Form S-1 (Reg. No. 333-53316)).
10.18+ 2000 Stock Option and Incentive Plan, as amended (incorporated herein by reference to Exhibit10.20 to MCF’s Registration Statement on Form S-1 (Reg. No. 333-53316)).
10.23 Master Equipment Lease Agreement dated March 16, 2000 (incorporated by reference to Exhibit10.6 to MCF’s Registration Statement on Form S-1 (Reg. No. 333-37004)).
10.29 Agreement between MCF and BL Partners related to RMG Partners Corporation, dated April 8,2001 (incorporated by reference to Exhibit 10.1 to MCF’s Form 10-Q for the quarter endedJune 30, 2001) (Reg. No. 001-15831).
10.30+ Offer of Employment Agreement between MCF Corporation and Robert E. Ford, datedFebruary 19, 2001, is Exhibit 10.2 to Form 10-Q for the quarter ended June 30, 2001, and ishereby incorporated by reference (Reg. No. 001-15831).
10.31 Ratexchange Placement Agreement with Murphy & Durieu, dated November 28, 2001, forprivate financing transaction (incorporated by reference to Exhibit 10.31 to MCF’s Form 10-Kfor the year ended December 31, 2001) (Reg. No. 001-15831).
10.32 Form of Placement Agent Warrant to Murphy & Durieu, dated November 28, 2001 (incorporatedby reference to Exhibit 10.32 to MCF’s Form 10-K for the year ended December 31, 2001)(Reg. No. 001-15831).
10.33 Convertible Promissory Note held by Forsythe/McArthur Associates, Inc., dated September 1,2001, related to restructure of Master Equipment Lease Agreement that is Exhibit 10.23 to Form10K for the year ended December 31, 2000 (incorporated by reference to Exhibit 10.33 toMCF’s Form 10-K for the year ended December 31, 2001) (Reg. No. 001-15831).
77

Exhibit No. Description
10.34+ Employment Agreement between MCF and Gregory S. Curhan, dated January 9, 2002 (incorpo-rated by reference to Exhibit 10.34 to MCF’s Form 10-K for the year ended December 31, 2001)(Reg. No. 001-15831).
10.35+ Employment Agreement between MCF Corporation and Robert E. Ford, dated January 1, 2002(incorporated by reference to Exhibit 10.35 to MCF’s Form 10-K for the year endedDecember 31, 2001) (Reg. No. 001-15831).
10.37 Stock Purchase Agreement by and among MCF and InstreamSecurities, Inc, (formerly known asSpider Securities, Inc.) and Independent Advantage Financial & Insurance Services, Inc., datedDecember 7, 2001 (incorporated by reference to Exhibit 10.37 to MCF’s Form 10-K for the yearended December 31, 2001) (Reg. No. 001-15831).
10.38 Agreement to Restructure Convertible Promissory Note held by Forsythe McArthur Associates,dated November 20, 2002 (incorporated by reference to Exhibit 10.38 to MCF’s Form 10-K forthe year ended December 31, 2001) (Reg. No. 001-15831).
10.39 Securities Exchange Agreement in connection with MCF Corporation dated June 22, 2003 (incor-porated by reference to Exhibit 99.1 to MCF’s Form 8-K filed on July 3, 2003) (Reg. No.001-15831).
10.43 Stock Purchase Agreement by and between MCF Corporation and Ascend Services Ltd., datedApril 29, 2005; together with the following documents which form exhibits thereto: EscrowAgreement and Registration Rights Agreement (incorporated by reference to the registrant’sReport on Form 10-Q for the quarter ended March 31, 2005) (Reg. No. 001-15831).
10.44 Promissory Note issued by Ascend Services Ltd. dated April 29, 2005 (incorporated by referenceto the registrant’s Report on Form 10-Q for the quarter ended March 31, 2005) (Reg. No.001-15831).
10.45 Employment Agreement between MCF Corporation and Gregory S. Curhan, dated January 1,2005 (incorporated by reference to the registrant’s Report on Form 10-Q for the quarter endedJune 30, 2005).
10.46 Employment Agreement between MCF Corporation and Robert E. Ford, dated January 1, 2005.(incorporated by reference to the registrant’s Report on Form 10-Q for the quarter ended June 30,2005) (Reg. No. 001-15831).
21.1 List of Subsidiaries of MCF.
23.1 Consent of Independent Registered Public Accounting Firm.
31.1 Certification of Principal Executive Officer Pursuant To Section 302 of The Sarbanes-Oxley Actof 2002.
31.2 Certification of Principal Financial Officer Pursuant To Section 302 of The Sarbanes-Oxley Actof 2002.
32.1 Certification of Principal Executive Officer and Principal Financial Officer Pursuant to 18 U.S.C.Section 1350.
+ Represents management contract or compensatory plan or arrangement.
78

EXHIBIT 31.1
Certification of Principal Executive OfficerPursuant To Section 302 of the Sarbanes-Oxley Act of 2002
I, D. Jonathan Merriman, certify that:
1. I have reviewed this annual report on Form 10-K of MCF Corporation;
2. Based on my knowledge, this annual report does not contain any untrue statement of a material fact oromit to state a material fact necessary to make the statements made, in light of the circumstances underwhich such statements were made, not misleading with respect to the period covered by this annualreport;
3. Based on my knowledge, the financial statements, and other financial information included in this annualreport, fairly present in all material respects the financial condition, results of operations and cash flowsof the registrant as of, and for, the periods presented in this annual report;
4. The registrant’s other certifying officer and I are responsible for establishing and maintaining disclosurecontrols and procedures (as defined in Exchange Act Rules 13a-14 and 15d-14) and internal controls overfinancial reporting (as defined in Exchange Act Rules 13a-15(f) and 15d-15(f)) for the registrant andhave:
a) Designed such disclosure controls and procedures, or caused such disclosure controls and proceduresto be designed under our supervision, to ensure that material information relating to the registrant,including its consolidated subsidiaries, is made known to us by others within those entities, particu-larly during the period in which this report is being prepared;
b) Designed such internal control over financial reporting, or caused such internal control over financialreporting to be designed under our supervision, to provide reasonable assurance regarding the reli-ability of financial reporting and the preparation of financial statements for external purposes inaccordance with generally accepted accounting principles;
c) Evaluated the effectiveness of the registrant’s disclosure controls and procedures and presented inthis report our conclusions about the effectiveness of the disclosure controls and procedures, as ofthe end of the period covered by this report based on such evaluation;
d) Disclosed in this report any change in the registrant’s internal control over financial reporting thatoccurred during the registrant’s most recent fiscal quarter (the registrant’s fourth fiscal quarter in thecase of an annual report) that has materially affected, or is reasonably likely to materially affect, theregistrant’s internal control over financial reporting;
5. The registrant’s other certifying officer and I have disclosed, based on our most recent evaluation, to theregistrant’s auditors and the audit committee of registrant’s board of directors (or persons performing theequivalent functions):
a) All significant deficiencies and material weaknesses in the design or operation of internal controlover financial reporting which are reasonably likely to adversely affect the registrant’s ability torecord, process, summarize and report financial information;
b) Any fraud, whether or not material, that involves management or other employees who have asignificant role in the registrant’s internal control over financial reporting.
/s/ D. Jonathan Merriman
D. Jonathan MerrimanChairman of the Board andChief Executive Offıcer
Date: February 12, 2008

EXHIBIT 31.2
Certification of Principal Financial OfficerPursuant To Section 302 of the Sarbanes-Oxley Act of 2002.
I, John D. Hiestand, certify that:
1. I have reviewed this annual report on Form 10-K of MCF Corporation;
2. Based on my knowledge, this annual report does not contain any untrue statement of a material fact oromit to state a material fact necessary to make the statements made, in light of the circumstances underwhich such statements were made, not misleading with respect to the period covered by this annualreport;
3. Based on my knowledge, the financial statements, and other financial information included in this annualreport, fairly present in all material respects the financial condition, results of operations and cash flowsof the registrant as of, and for, the periods presented in this annual report;
4. The registrant’s other certifying officer and I are responsible for establishing and maintaining disclosurecontrols and procedures (as defined in Exchange Act Rules 13a-14 and 15d-14) and internal controls overfinancial reporting (as defined in Exchange Act Rules 13a-15(f) and 15d-15(f)) for the registrant andhave:
a) Designed such disclosure controls and procedures, or caused such disclosure controls and proceduresto be designed under our supervision, to ensure that material information relating to the registrant,including its consolidated subsidiaries, is made known to us by others within those entities, particu-larly during the period in which this report is being prepared;
b) Designed such internal control over financial reporting, or caused such internal control over financialreporting to be designed under our supervision, to provide reasonable assurance regarding the reli-ability of financial reporting and the preparation of financial statements for external purposes inaccordance with generally accepted accounting principles;
c) Evaluated the effectiveness of the registrant’s disclosure controls and procedures and presented inthis report our conclusions about the effectiveness of the disclosure controls and procedures, as ofthe end of the period covered by this report based on such evaluation;
d) Disclosed in this report any change in the registrant’s internal control over financial reporting thatoccurred during the registrant’s most recent fiscal quarter (the registrant’s fourth fiscal quarter in thecase of an annual report) that has materially affected, or is reasonably likely to materially affect, theregistrant’s internal control over financial reporting;
5. The registrant’s other certifying officer and I have disclosed, based on our most recent evaluation, to theregistrant’s auditors and the audit committee of registrant’s board of directors (or persons performing theequivalent functions):
a) All significant deficiencies and material weaknesses in the design or operation of internal controlover financial reporting which are reasonably likely to adversely affect the registrant’s ability torecord, process, summarize and report financial information;
b) Any fraud, whether or not material, that involves management or other employees who have asignificant role in the registrant’s internal control over financial reporting.
/s/ John D. Hiestand
John D. HiestandChief Financial Offıcer
Date: February 12, 2008

EXHIBIT 32.1
Certification Pursuant to18 U.S.C. Section 1350
In connection with the Annual Report of MCF Corporation on Form 10-K for the year endedDecember 31, 2007 as filed with the Securities and Exchange Commission on the date hereof (the ‘‘Report’’),we, D. Jonathan Merriman and John D. Hiestand, certify, pursuant to 18 U.S.C. § 1350, as adopted pursuantto § 906 of the Sarbanes-Oxley Act of 2002 that:
(1) The Report fully complies with the requirements of section 13(a) or 15(d) of the SecuritiesExchange Act of 1934; and
(2) The information contained in the Report fairly presents, in all material respects, the financial condi-tion and results of operations of the Company.
February 12, 2008
/s/ D. Jonathan Merriman
D. Jonathan MerrimanChairman and Chief Executive Offıcer
/s/ John D. Hiestand
John D. HiestandChief Financial Offıcer

M e r r i M a n C u r h a n F o r d
0
100
200
300
400
500
$600
12/02 12/03 12/04 12/05 12/06 12/07
COMPARISON OF FIVE-YEAR CUMULATIVE TOTAL RETURN*
Fiscal year ending December 31
*$100 invested on 12/31/02 in stock or index-including reinvestment of dividends.
S&P SmallCap Investment Banking & BrokerageRussell 2000 GrowthNASDAQ FinancialAMEX CompositeMCF Corporation

M e r r i M a n C u r h a n F o r d
Corporate Information
Corpor ate off iCers
D. Jonathan MerrimanChief Executive Officer
Robert E. FordPresident and Chief Operating Officer
Gregory S. CurhanExecutive Vice President
John D. HiestandChief Financial Officer
Christopher L. AguilarGeneral Counsel
Board of d ireC tors
John M. ThompsonChairman of the Board
D. Jonathan Merriman
Patrick H. Arbor
William J. Febbo
Raymond J. Minehan
Scott Potter
Dennis G. Schmal
Ronald E. Spears*
Steven W. Town
* On March 5, 2008, Ronald E. Spears resigned from the Board of Directors. At the time of resignation, there were no disputes between Mr. Spears and the Board.
annual s toCk holders’ Mee t ing
May 2, 2008—1:30 p.m. (PT)MCF Corporation600 California Street, 9th FloorSan Francisco, California 94108
independent auditors
Ernst & Young LLPSan Francisco, California
tr ansfer agent
OTC Stock TransferSalt Lake City, Utah
CoMMon s toCk l is t ing
NASDAQ Stock MarketSymbol: MERR
Corpor ate he adquarters
MCF Corporation600 California Street, 9th FloorSan Francisco, California 94108415.248.5600www.mcfco.com
forward -look ing s tateMent sThis Annual Report contains certain forward-looking state-ments based on the Company’s current expectations, forecasts and assumptions that involve risks and uncertainties. Forward-looking statements in this Annual Report are based on informa-tion available as of the date hereof. Actual results may differ materially from those stated or implied in such forward-looking statements, due to risks and uncertainties associated with the Company’s business, which include the risk factors disclosed in the attached Form 10-K filed with the Securities and Exchange Commission.
Forward-looking statements include statements regarding expec-tations, beliefs, intentions or strategies regarding the future and can be identified by forward-looking words such as “anticipate,” “believe,” “could,” “estimate,” “expect,” “intend,” “may,” “should,” “will” and “would” or similar words. The Company assumes no obligation to update the information included in this Annual Report, whether as a result of new information, future events or otherwise.
on February 12, 2008, MCF Corporation began trading
on NASDAQ (ticker symbol MERR), and the company’s
management team rang the closing bell at the NASDAQ
MarketSite to commemorate the listing change. MCF
Corporation’s common stock was previously listed on the
American Stock Exchange (ticker symbol MEM).
De
sig
ned
by
Cur
ran
& C
onn
ors
, Inc
. / w
ww
.cur
ran
-co
nno
rs.c
om

MCF Corporation · 600 California Street, 9th Floor · San Francisco, California 94108 · 415.248.5600 · www.mcfco.com · NASDAQ: MERR · Member FINRA/SIPC

![Shawne Merriman Shawne DeAndre Merriman [1] (born May 25, 1984 in Washington, D.C.) is an American football outside linebacker for the San Diego Chargers](https://img.pdfslide.us/doc/110x75/5697bfa31a28abf838c96b53/shawne-merriman-shawne-deandre-merriman-1-born-may-25-1984-in-washington.jpg)