Embed Size (px)
Citation preview

1
M.E.R.I.T. (Macomb Energy Resource Integration Team) is a coordinated effort of Industry Professionals Team) is a coordinated effort of Industry Professionals and Manufacturers who take a Systems approach to deliver the best possible cost savings in energy, maintenance, labor and downtime for healthcare, education, power, retail and industry. This approach saves dollars and the environment. Merit then coordinates these efforts with the utility companies to achieve any rebates that are available to the end user.
What is MERIT
� The Macomb M.E.R.I.T. team takes a “Systems” approach to
review your - Water, Heating, Steam and Piping design to
help with the following;
� Reduce the energy consumption by improving efficiency of
the total system.the total system.
� Reduce maintenance cost by allowing the components to
work together.
� Reduce labor and downtime during replacement and repair
with innovative products.
� Reduce water consumption and sewage cost.
3

Our approach has MERIT
• Our Experienced Team will perform a
complete energy audit of your facilities’
Water, Steam and Heating Systems.
• Utilizing In House and MERIT Partner product • Utilizing In House and MERIT Partner product
Experts to identify those “under performing
assets”
• Develop Customized Solutions that will reduce
consumption, save energy and document
payback.4
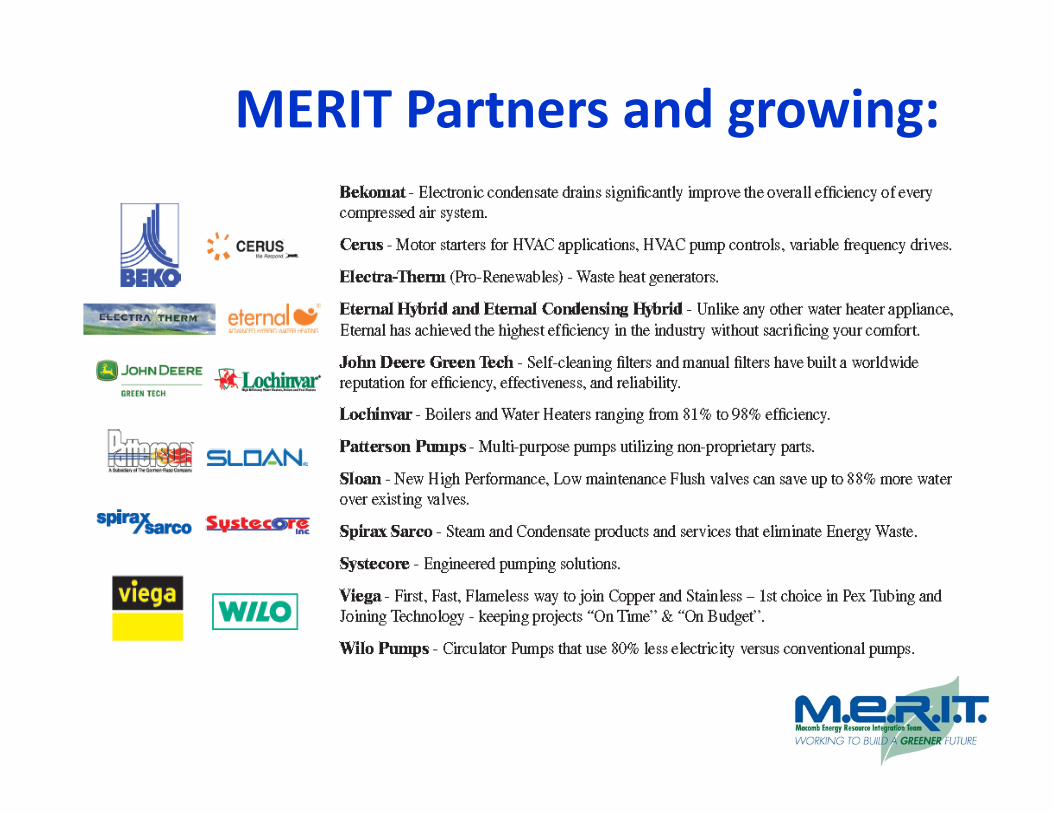
MERIT Partners and growing:
5
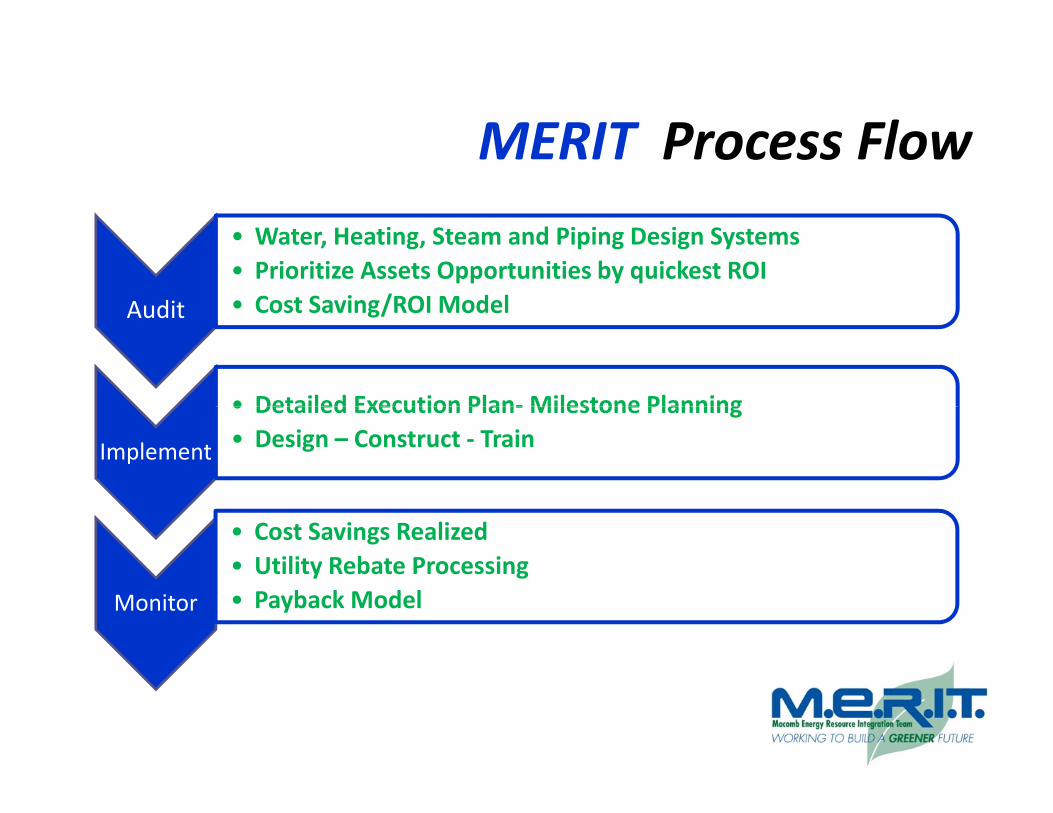
MERIT Process Flow
Audit
• Water, Heating, Steam and Piping Design Systems
• Prioritize Assets Opportunities by quickest ROI
• Cost Saving/ROI Model
• Detailed Execution Plan- Milestone Planning
Implement
• Detailed Execution Plan- Milestone Planning
• Design – Construct - Train
Monitor
• Cost Savings Realized
• Utility Rebate Processing
• Payback Model
6
Other MERIT Products & Services
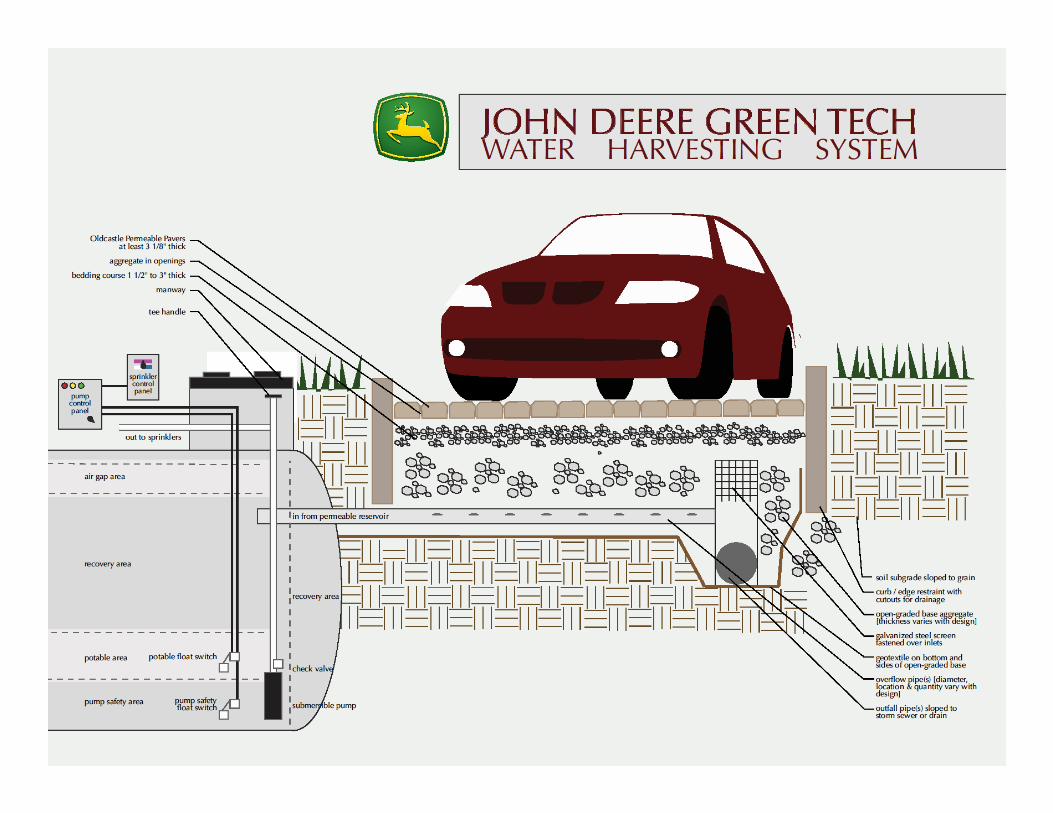
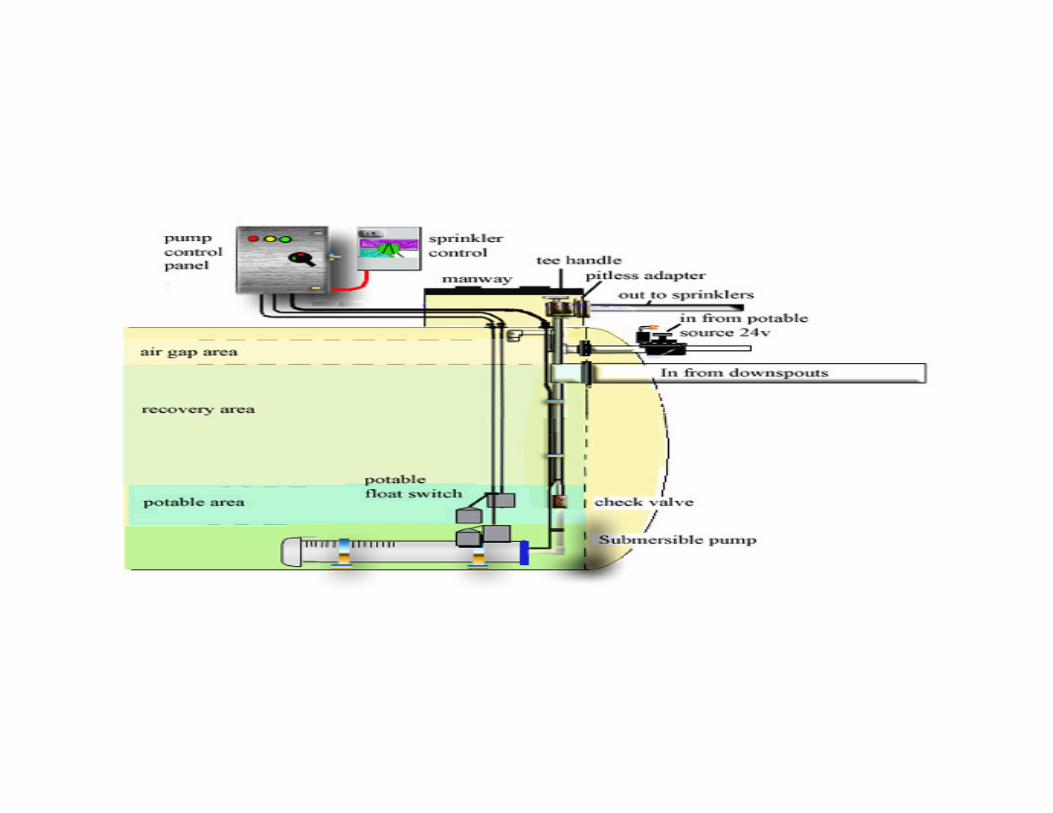
• Rain Water Harvesting for Irrigation
• Waterless Technology for Restroom Facilities
• Documented Cost Savings
• Quarterly and Annual Performance Review • Quarterly and Annual Performance Review
• Utility Rebate Filing Assistance
• 100% Turn Key Services
• Materials Management and Logistics
• Alternative Technologies, Wind Turbine/Solar
7
Next Steps
• Meet with your Maintenance and Engineering
leads
• Complete an Audit
• Delivery Customized Cost Saving • Delivery Customized Cost Saving
Recommendations
• Schedule Implementation Meeting
8
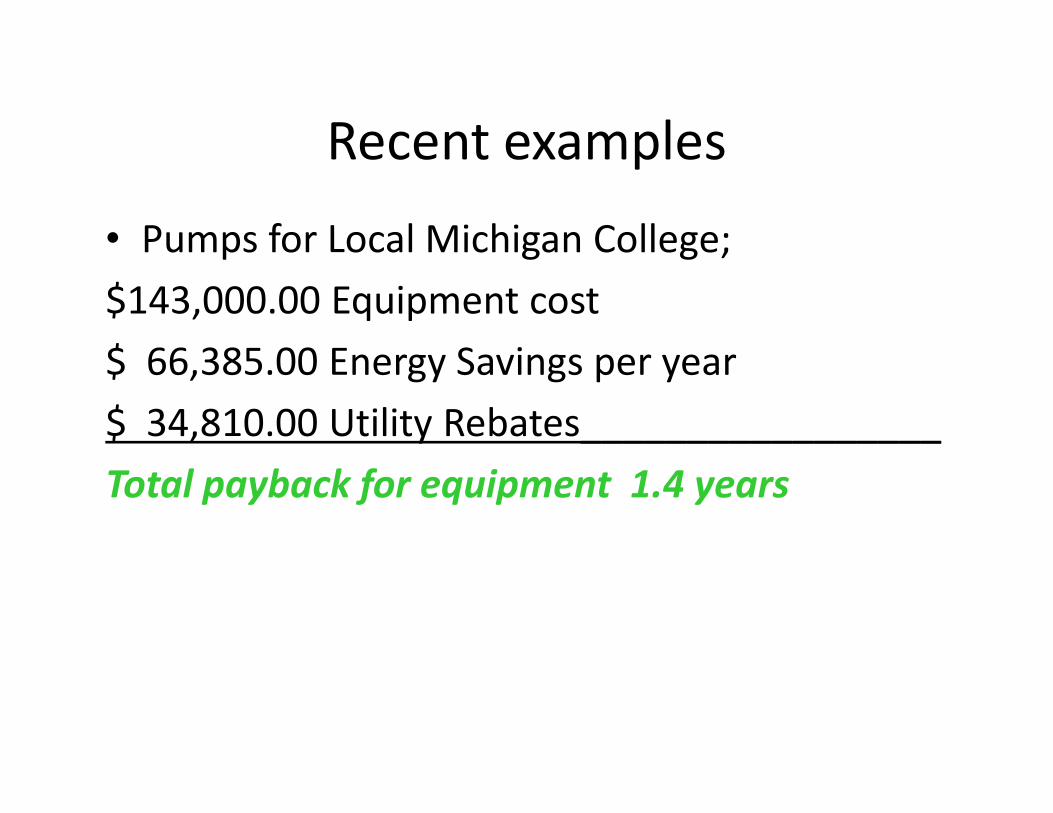
Recent examples
• Pumps for Local Michigan College;
$143,000.00 Equipment cost
$ 66,385.00 Energy Savings per year
$ 34,810.00 Utility Rebates_________________$ 34,810.00 Utility Rebates_________________
Total payback for equipment 1.4 years
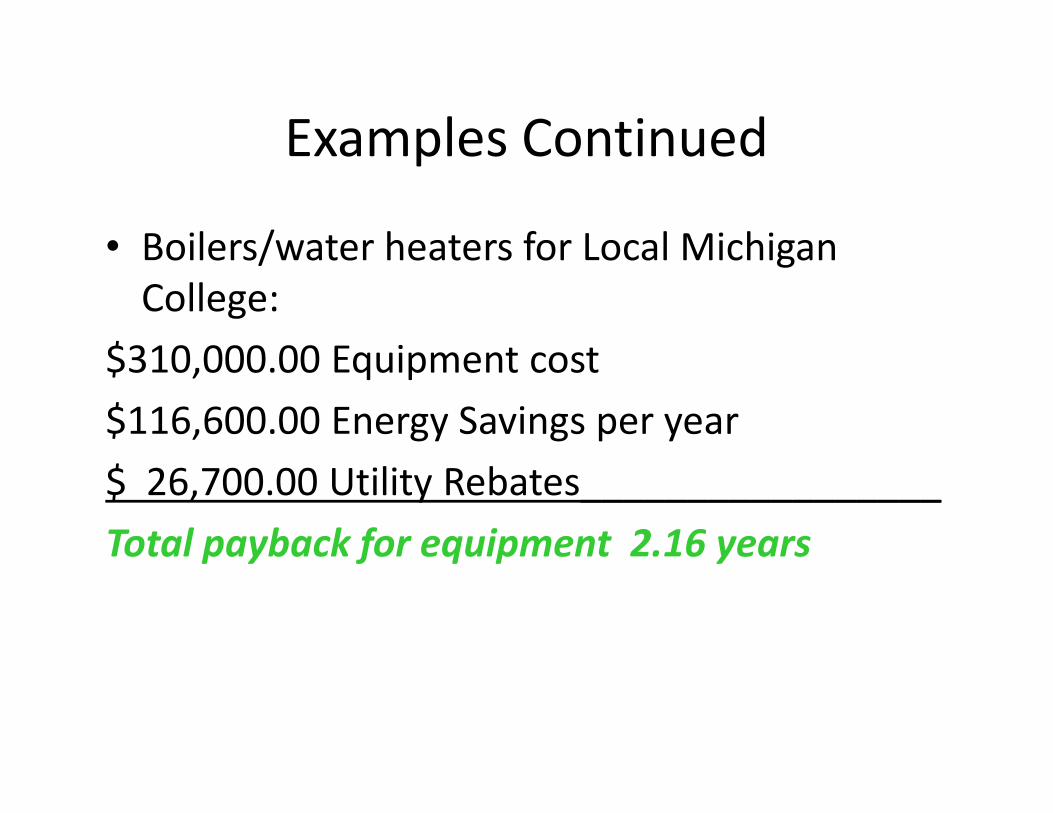
Examples Continued
• Boilers/water heaters for Local Michigan
College:
$310,000.00 Equipment cost
$116,600.00 Energy Savings per year$116,600.00 Energy Savings per year
$ 26,700.00 Utility Rebates_________________
Total payback for equipment 2.16 years

Cost of EfficiencyCost of Efficiency
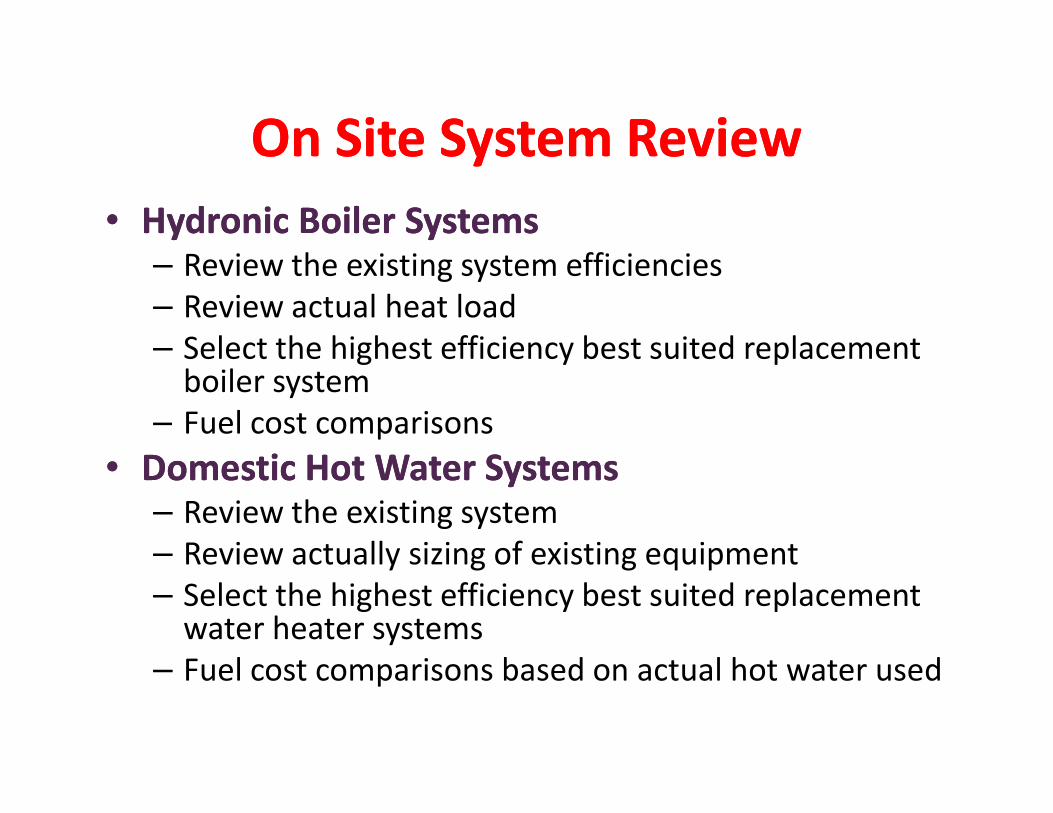
On Site System ReviewOn Site System Review
•• Hydronic Boiler SystemsHydronic Boiler Systems– Review the existing system efficiencies
– Review actual heat load
– Select the highest efficiency best suited replacement boiler system
– Fuel cost comparisons– Fuel cost comparisons
•• Domestic Hot Water SystemsDomestic Hot Water Systems– Review the existing system
– Review actually sizing of existing equipment
– Select the highest efficiency best suited replacement water heater systems
– Fuel cost comparisons based on actual hot water used
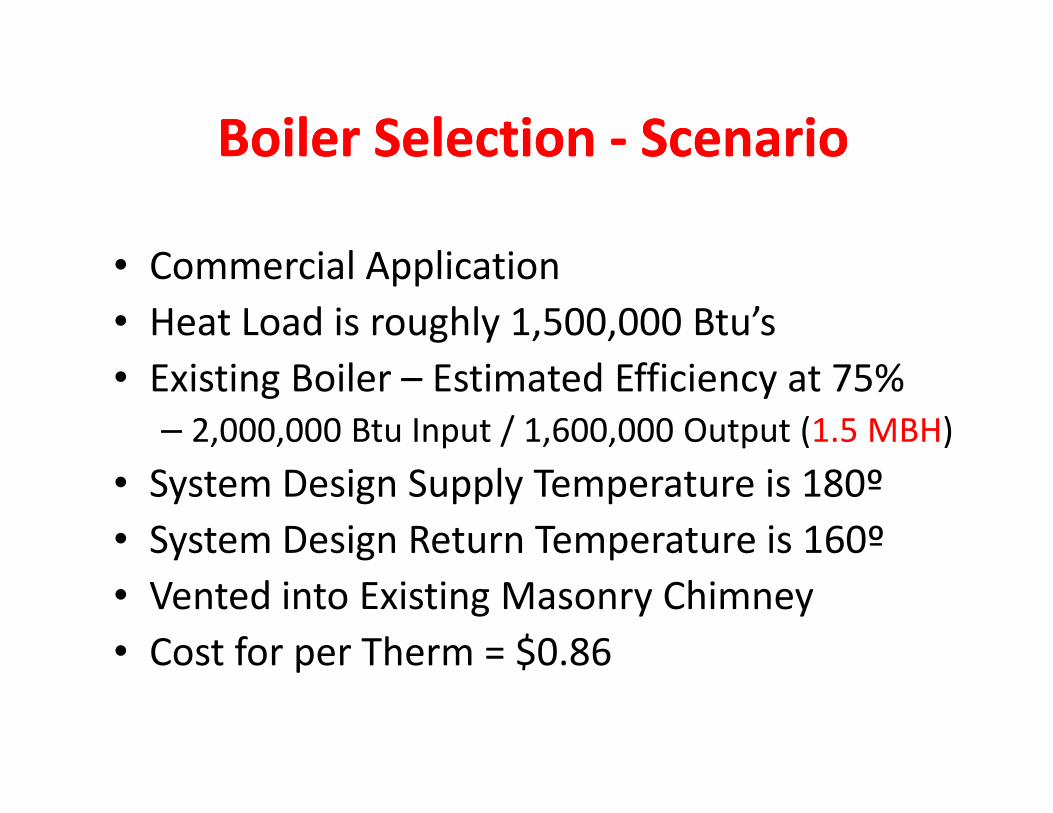
Boiler Selection Boiler Selection -- ScenarioScenario
• Commercial Application
• Heat Load is roughly 1,500,000 Btu’s
• Existing Boiler – Estimated Efficiency at 75%
2,000,000 Btu Input / 1,600,000 Output (1.5 MBH)– 2,000,000 Btu Input / 1,600,000 Output (1.5 MBH)
• System Design Supply Temperature is 180º
• System Design Return Temperature is 160º
• Vented into Existing Masonry Chimney
• Cost for per Therm = $0.86
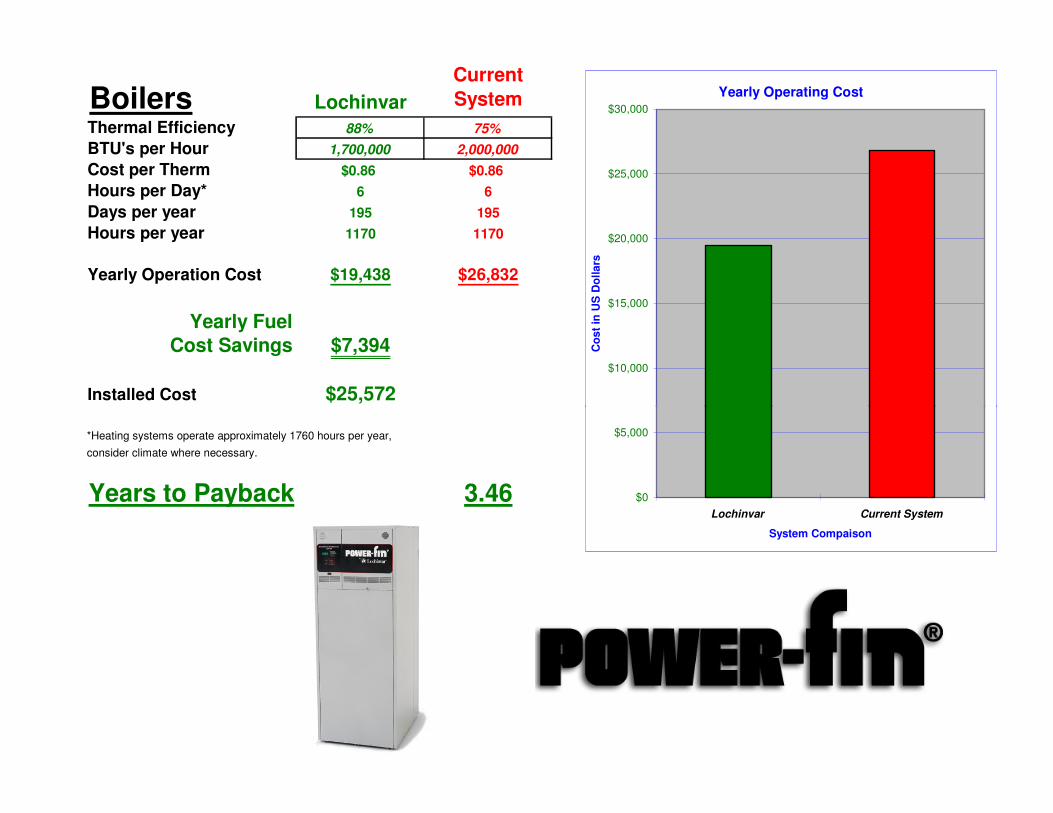
Boilers Lochinvar
Current
System
Thermal Efficiency 88% 75%
BTU's per Hour 1,700,000 2,000,000
Cost per Therm $0.86 $0.86
Hours per Day* 6 6
Days per year 195 195
Hours per year 1170 1170
Yearly Operation Cost $19,438 $26,832
Yearly Fuel Cost Savings $7,394
Installed Cost $25,572
Yearly Operating Cost
$10,000
$15,000
$20,000
$25,000
$30,000
Co
st
in U
S D
oll
ars
*Heating systems operate approximately 1760 hours per year,
consider climate where necessary.
Years to Payback 3.46 $0
$5,000
Lochinvar Current System
System Compaison
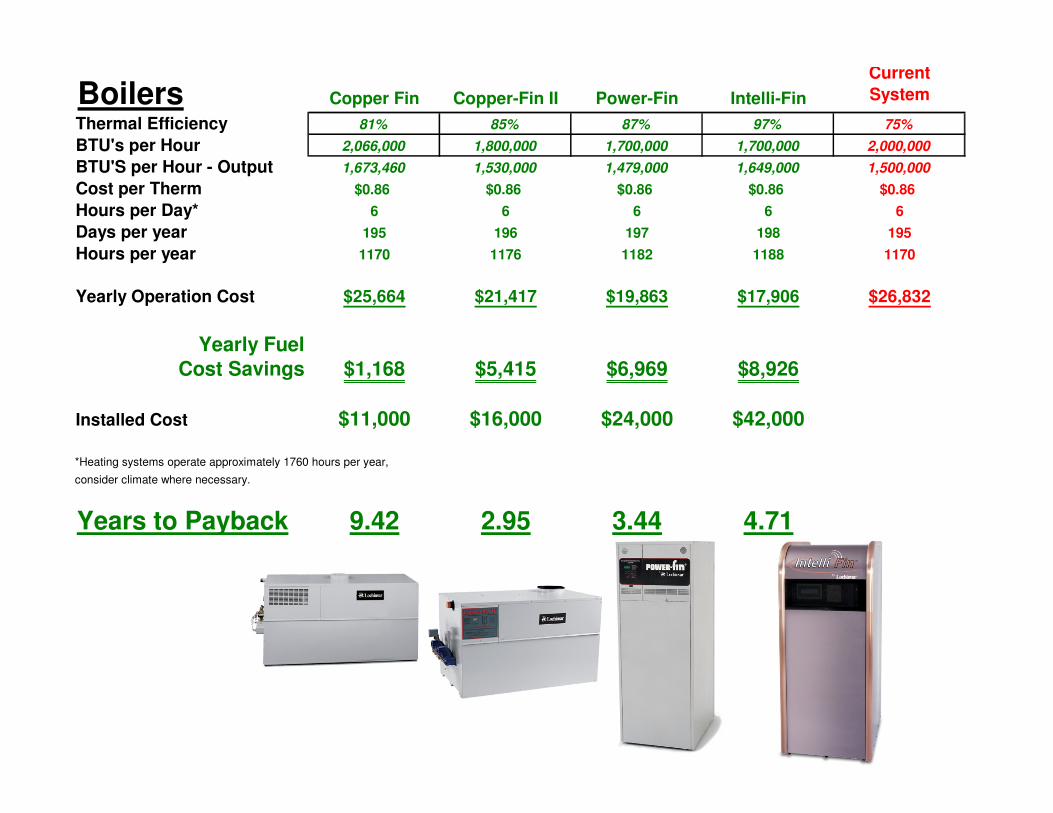
Boilers Copper Fin Copper-Fin II Power-Fin Intelli-Fin
Current
System
Thermal Efficiency 81% 85% 87% 97% 75%
BTU's per Hour 2,066,000 1,800,000 1,700,000 1,700,000 2,000,000
BTU'S per Hour - Output 1,673,460 1,530,000 1,479,000 1,649,000 1,500,000
Cost per Therm $0.86 $0.86 $0.86 $0.86 $0.86
Hours per Day* 6 6 6 6 6
Days per year 195 196 197 198 195
Hours per year 1170 1176 1182 1188 1170
Yearly Operation Cost $25,664 $21,417 $19,863 $17,906 $26,832
Yearly Fuel Cost Savings $1,168 $5,415 $6,969 $8,926
Installed Cost $11,000 $16,000 $24,000 $42,000
*Heating systems operate approximately 1760 hours per year,
consider climate where necessary.
Years to Payback 9.42 2.95 3.44 4.71
Bottom LineBottom Line
• There a numerous factors in selecting the highest efficiency boiler for a particular installation.
• All factors must be taken into consideration to get the most savings and performance out of your the most savings and performance out of your purchase.
• Choosing the wrong boiler for the wrong application can cost you more money than it did with the boiler that was replaced.
17
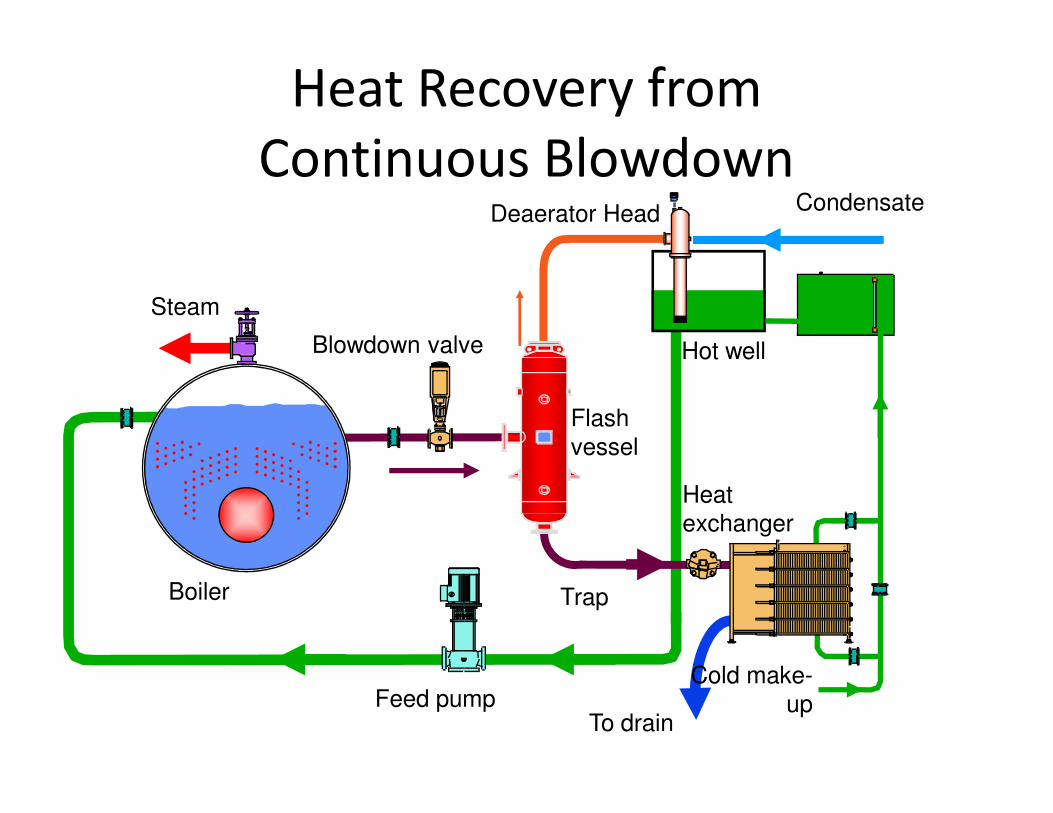
Heat Recovery from
Continuous BlowdownCondensate
Steam
Blowdown valve
Flash
Hot well
Deaerator Head
Boiler
Feed pump
Flash vessel
Heat exchanger
Trap
Cold make-up
To drain
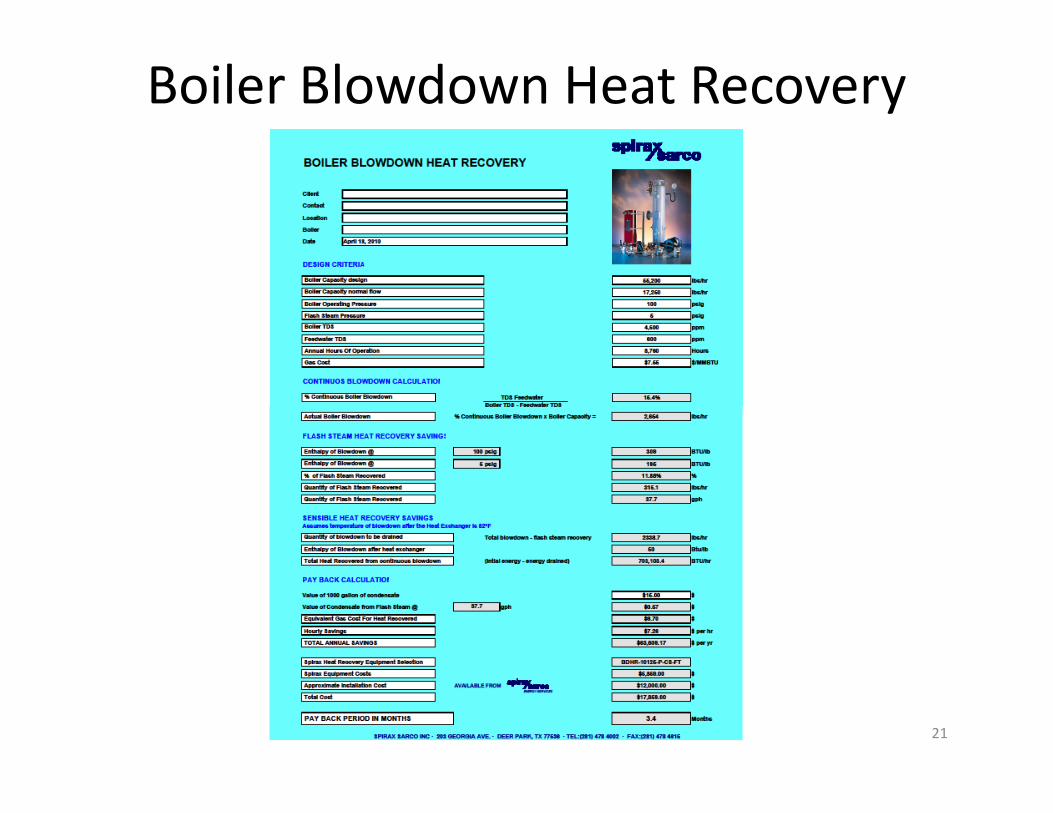
Boiler Blowdown Heat Recovery
21
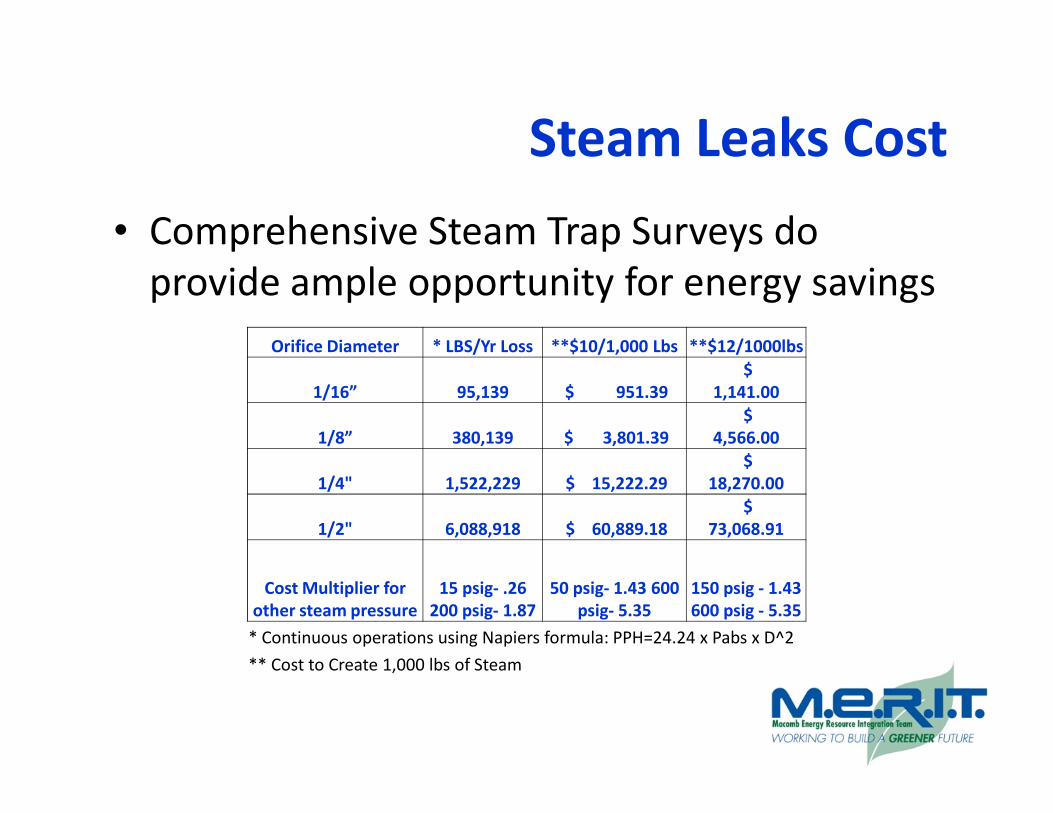
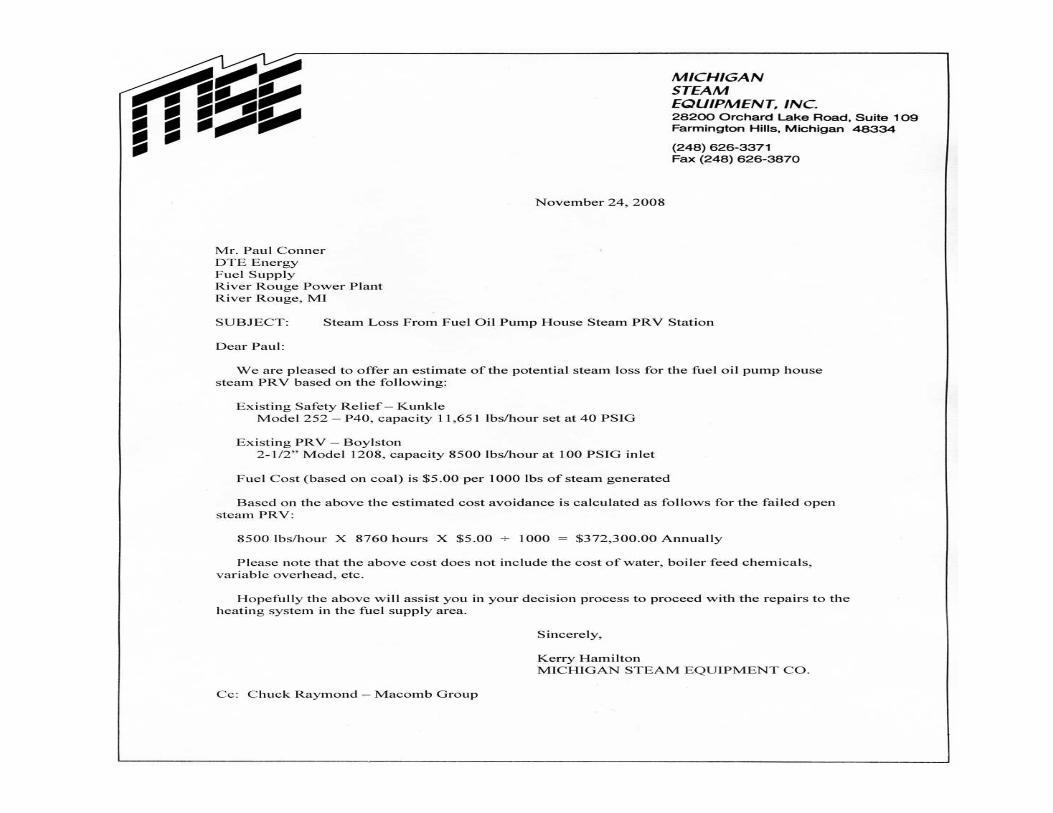
Steam Leaks Cost
• Comprehensive Steam Trap Surveys do
provide ample opportunity for energy savings
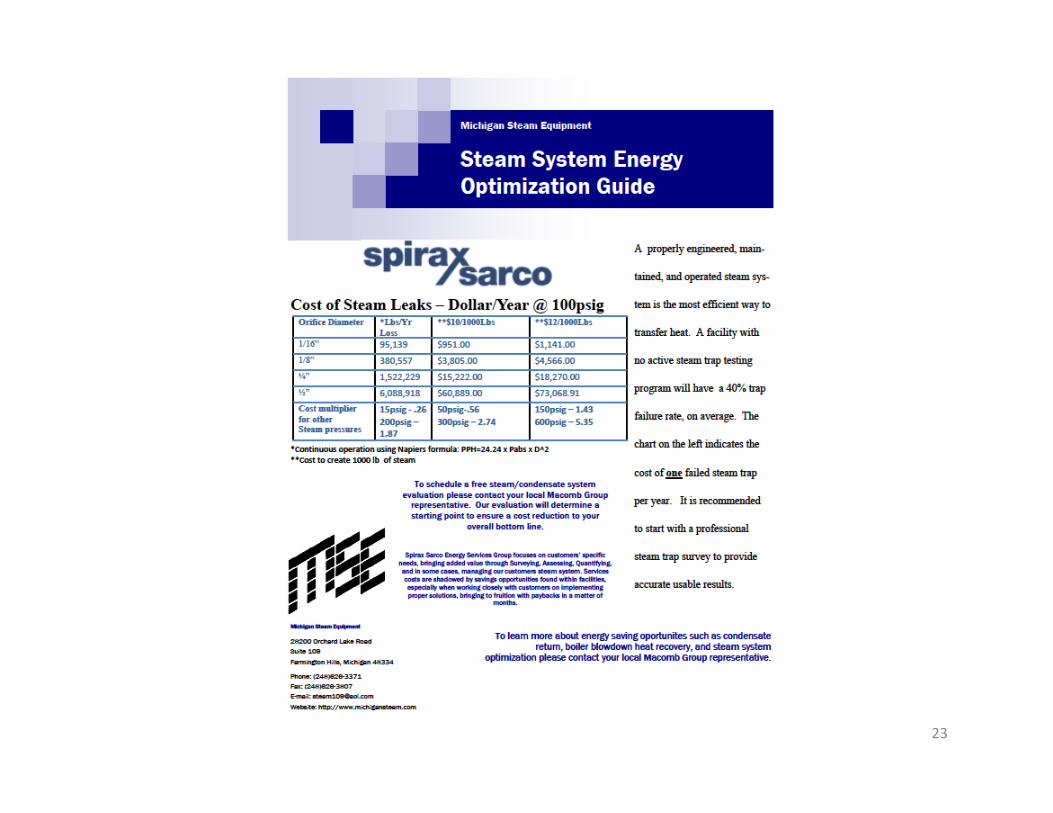
Orifice Diameter * LBS/Yr Loss **$10/1,000 Lbs **$12/1000lbs
1/16” 95,139 $ 951.39
$
1,141.00
$
22
1/8” 380,139 $ 3,801.39
$
4,566.00
1/4" 1,522,229 $ 15,222.29
$
18,270.00
1/2" 6,088,918 $ 60,889.18
$
73,068.91
Cost Multiplier for
other steam pressure
15 psig- .26
200 psig- 1.87
50 psig- 1.43 600
psig- 5.35
150 psig - 1.43
600 psig - 5.35
* Continuous operations using Napiers formula: PPH=24.24 x Pabs x D^2
** Cost to Create 1,000 lbs of Steam
23
24
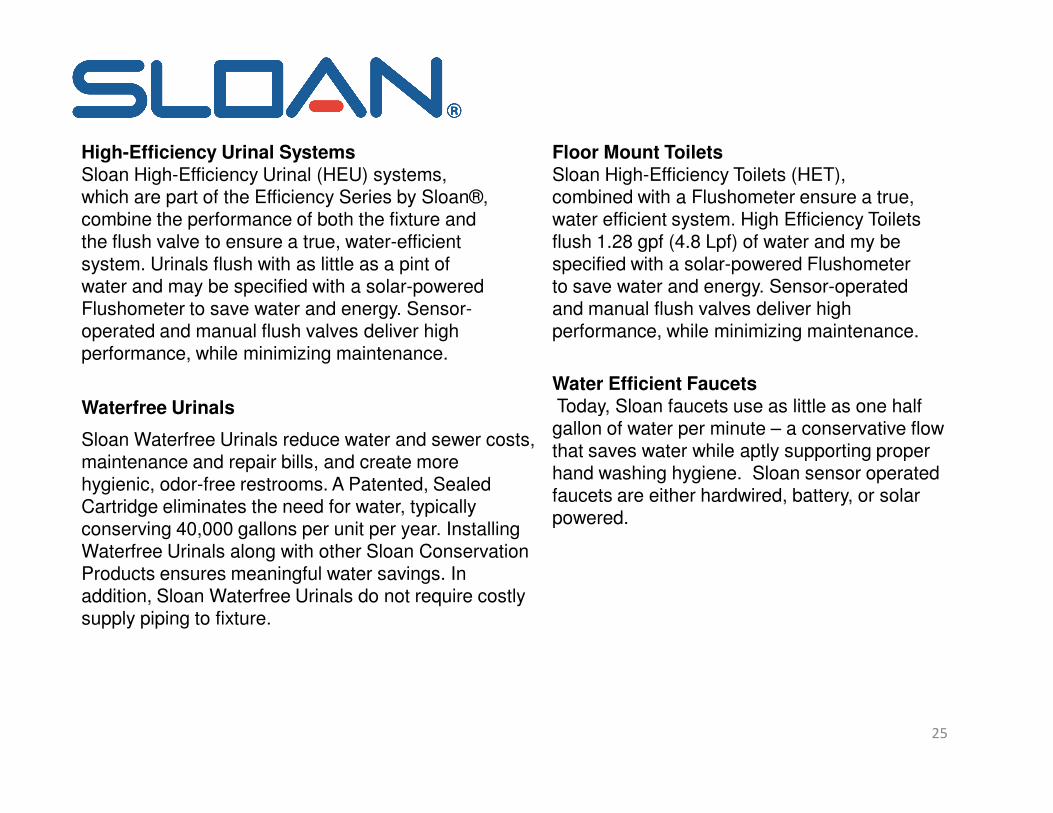
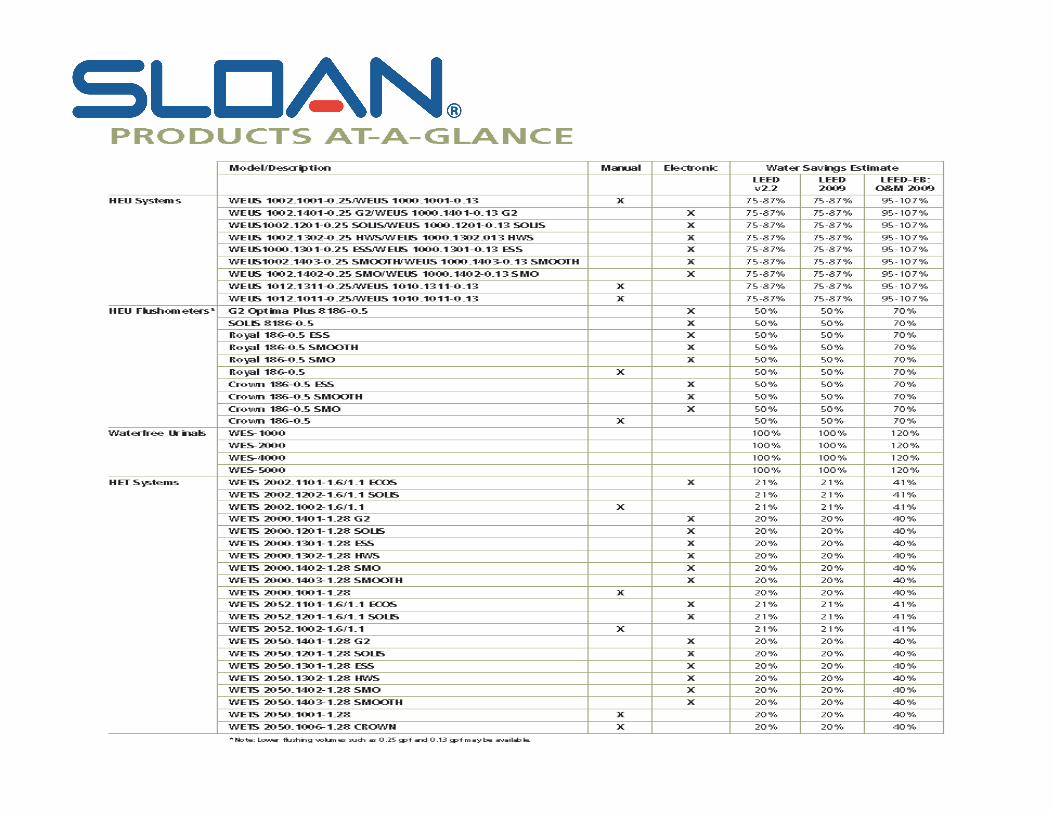
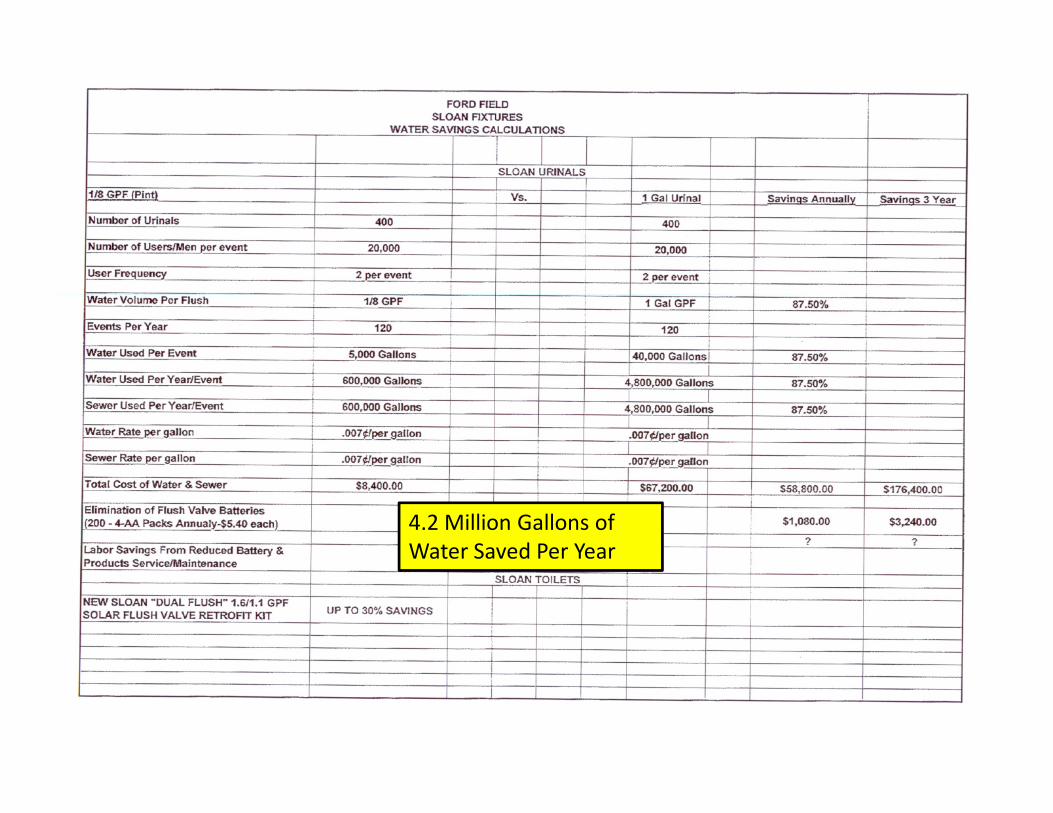
High-Efficiency Urinal SystemsSloan High-Efficiency Urinal (HEU) systems, which are part of the Efficiency Series by Sloan®, combine the performance of both the fixture and the flush valve to ensure a true, water-efficient system. Urinals flush with as little as a pint of water and may be specified with a solar-powered Flushometer to save water and energy. Sensor-operated and manual flush valves deliver high performance, while minimizing maintenance.
Floor Mount ToiletsSloan High-Efficiency Toilets (HET), combined with a Flushometer ensure a true, water efficient system. High Efficiency Toilets flush 1.28 gpf (4.8 Lpf) of water and my be specified with a solar-powered Flushometer to save water and energy. Sensor-operated and manual flush valves deliver high performance, while minimizing maintenance.
Water Efficient FaucetsToday, Sloan faucets use as little as one half Waterfree Urinals
25
Today, Sloan faucets use as little as one half gallon of water per minute – a conservative flow that saves water while aptly supporting proper hand washing hygiene. Sloan sensor operated faucets are either hardwired, battery, or solar powered.
Sloan Waterfree Urinals reduce water and sewer costs,maintenance and repair bills, and create morehygienic, odor-free restrooms. A Patented, SealedCartridge eliminates the need for water, typicallyconserving 40,000 gallons per unit per year. InstallingWaterfree Urinals along with other Sloan ConservationProducts ensures meaningful water savings. Inaddition, Sloan Waterfree Urinals do not require costlysupply piping to fixture.
Waterfree Urinals
26
27
28
4.2 Million Gallons of
Water Saved Per Year

We utilize over 350,000 Square feet of office and manufacturing space at our facilities in Toccoa and Atlanta, Georgia.
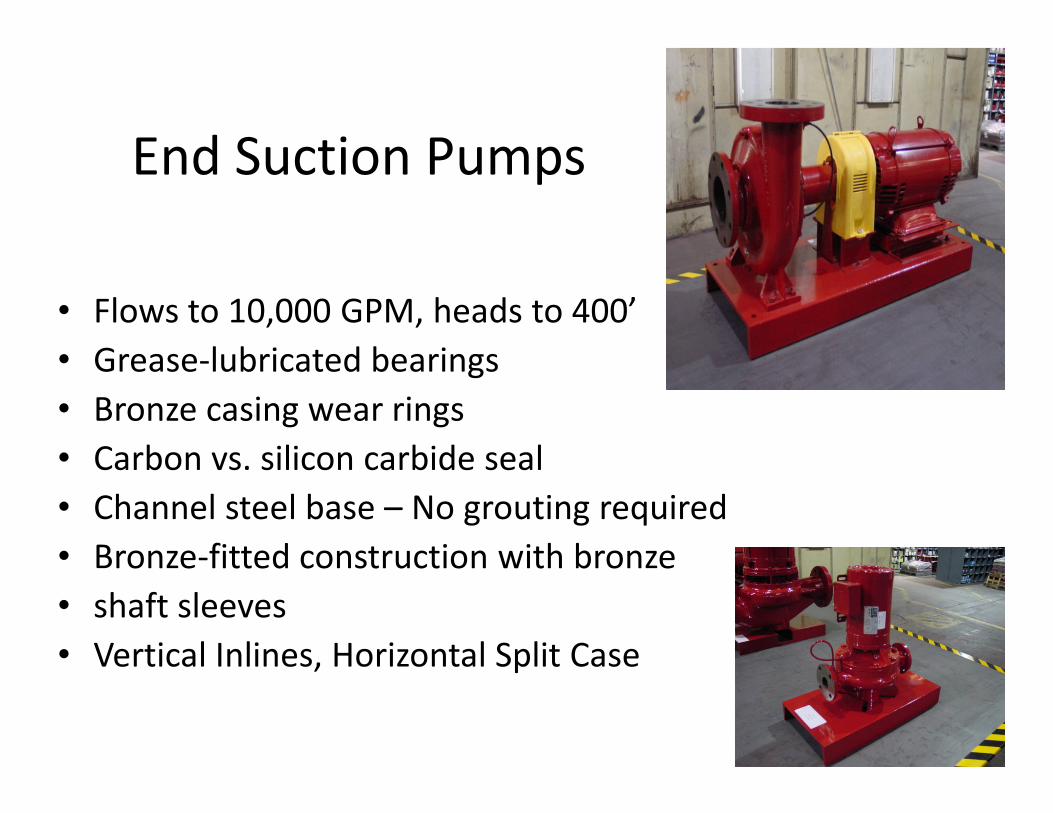
• Flows to 10,000 GPM, heads to 400’
• Grease-lubricated bearings
• Bronze casing wear rings
End Suction Pumps
• Bronze casing wear rings
• Carbon vs. silicon carbide seal
• Channel steel base – No grouting required
• Bronze-fitted construction with bronze
• shaft sleeves
• Vertical Inlines, Horizontal Split Case
31
• Consumption
• Production
Distribution
Train
• Distribution
• Variable Speed Pumping
• Variable Volume Pumping
• Cv’s / GPM of Coil or slightly greater 1#
• Coils etc / Importance of Flow Limiting
• Cv =gpm/delta P square root
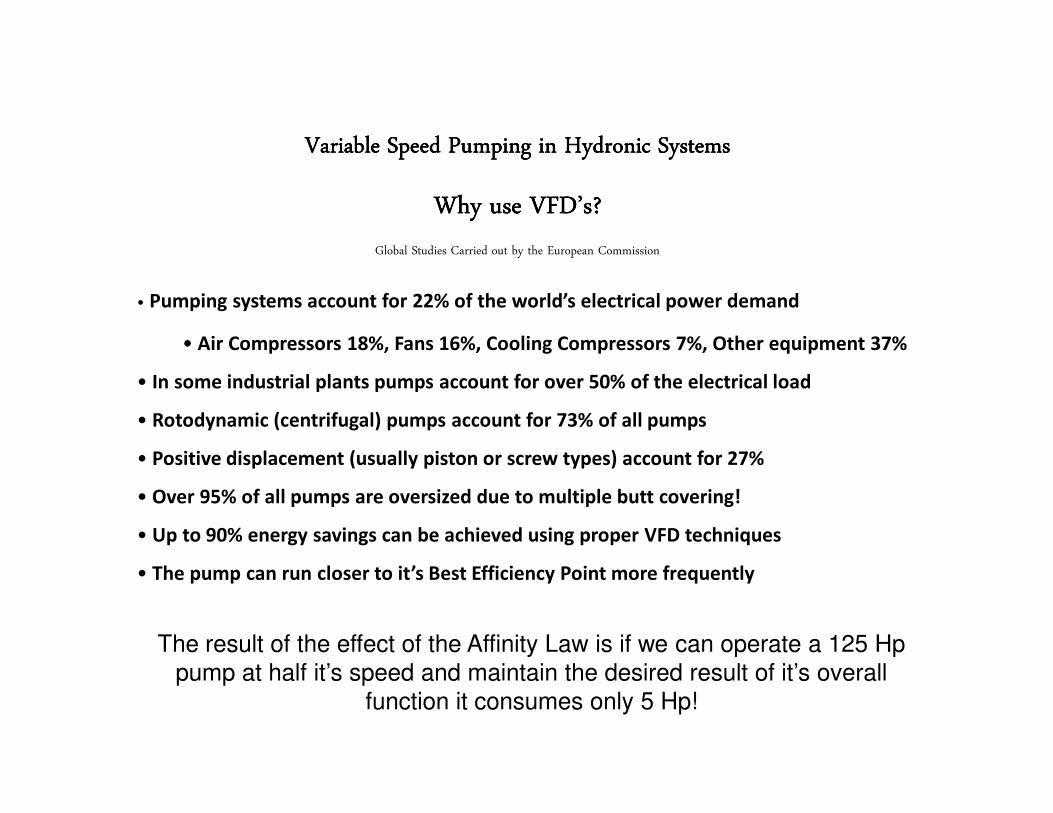
Variable Speed Pumping in Hydronic SystemsVariable Speed Pumping in Hydronic SystemsVariable Speed Pumping in Hydronic SystemsVariable Speed Pumping in Hydronic Systems
Why use VFD’s?Why use VFD’s?Why use VFD’s?Why use VFD’s?
Global Studies Carried out by the European Commission
• Pumping systems account for 22% of the world’s electrical power demand
• Air Compressors 18%, Fans 16%, Cooling Compressors 7%, Other equipment 37%
• In some industrial plants pumps account for over 50% of the electrical load
• Rotodynamic (centrifugal) pumps account for 73% of all pumps• Rotodynamic (centrifugal) pumps account for 73% of all pumps
• Positive displacement (usually piston or screw types) account for 27%
• Over 95% of all pumps are oversized due to multiple butt covering!
• Up to 90% energy savings can be achieved using proper VFD techniques
• The pump can run closer to it’s Best Efficiency Point more frequently
The result of the effect of the Affinity Law is if we can operate a 125 Hp pump at half it’s speed and maintain the desired result of it’s overall
function it consumes only 5 Hp!
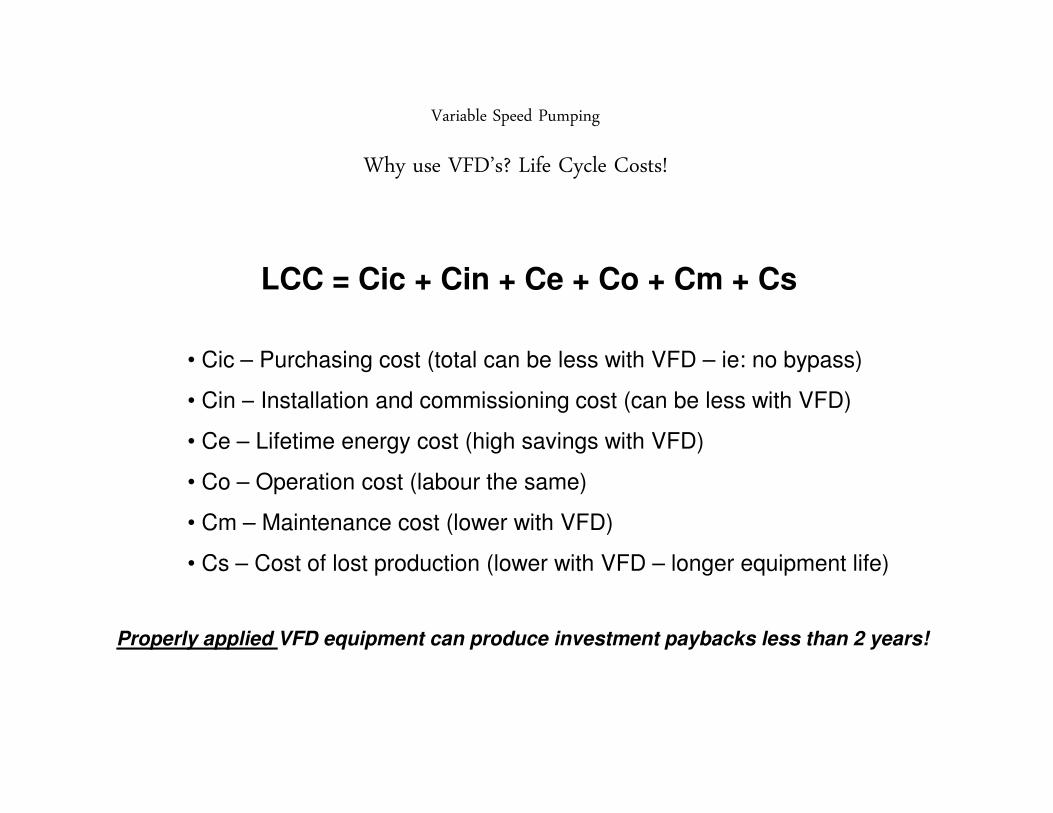
LCC = Cic + Cin + Ce + Co + Cm + Cs
• Cic – Purchasing cost (total can be less with VFD – ie: no bypass)
• Cin – Installation and commissioning cost (can be less with VFD)
Variable Speed Pumping
Why use VFD’s? Life Cycle Costs!
• Cin – Installation and commissioning cost (can be less with VFD)
• Ce – Lifetime energy cost (high savings with VFD)
• Co – Operation cost (labour the same)
• Cm – Maintenance cost (lower with VFD)
• Cs – Cost of lost production (lower with VFD – longer equipment life)
Properly applied VFD equipment can produce investment paybacks less than 2 years!
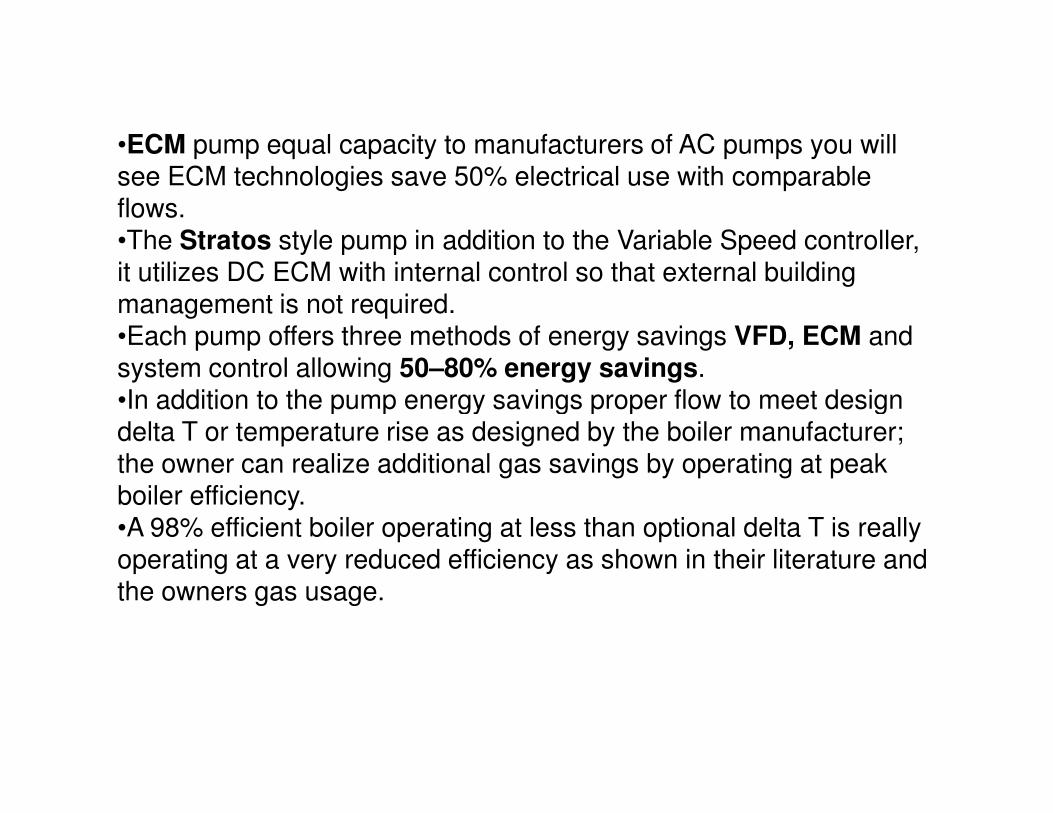
•ECM pump equal capacity to manufacturers of AC pumps you will see ECM technologies save 50% electrical use with comparable flows.•The Stratos style pump in addition to the Variable Speed controller, it utilizes DC ECM with internal control so that external building management is not required.•Each pump offers three methods of energy savings VFD, ECM and system control allowing 50–80% energy savings.•In addition to the pump energy savings proper flow to meet design •In addition to the pump energy savings proper flow to meet design delta T or temperature rise as designed by the boiler manufacturer; the owner can realize additional gas savings by operating at peak boiler efficiency.•A 98% efficient boiler operating at less than optional delta T is really operating at a very reduced efficiency as shown in their literature and the owners gas usage.
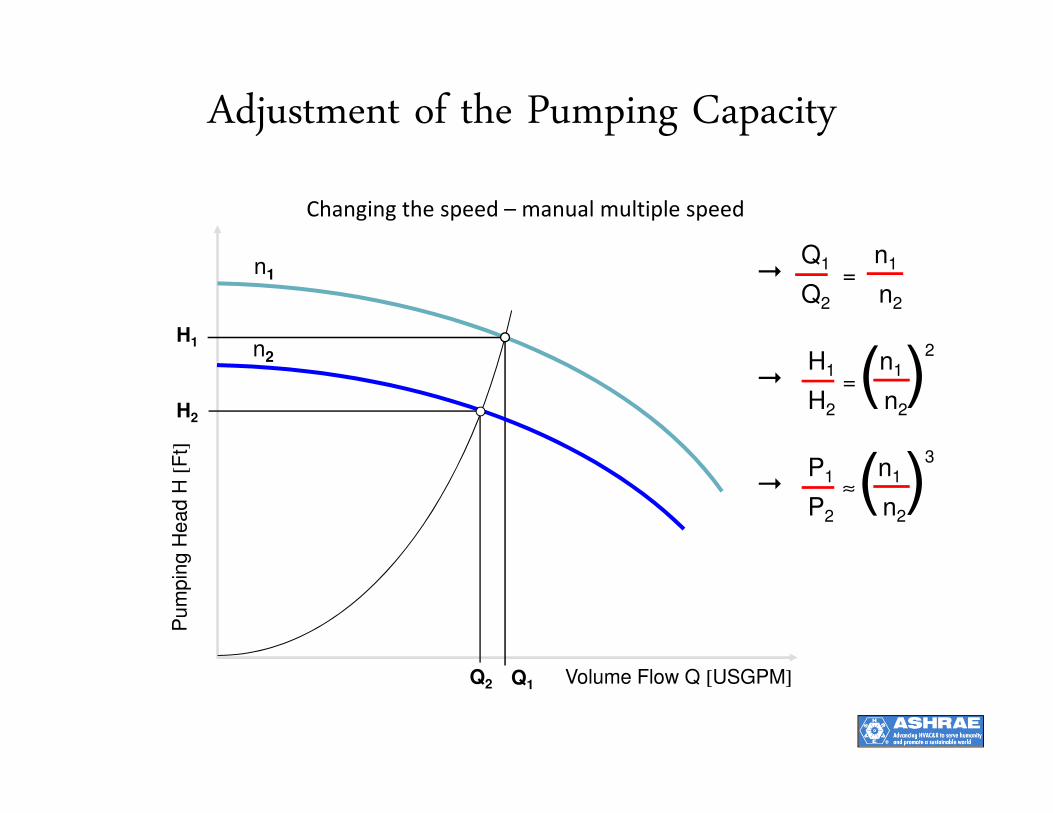
Adjustment of the Pumping Capacity
Changing the speed – manual multiple speed
H
n1
H1 n2 H1 n1
H2 n2
)(2
� =
Q1 n1
Q2 n2
� =
Pu
mp
ing
He
ad
H [
Ft]
H2
Q2 Volume Flow Q [USGPM]Q1
P1 n1
P2 n2
)(3
� ≈
H2 n2
)(
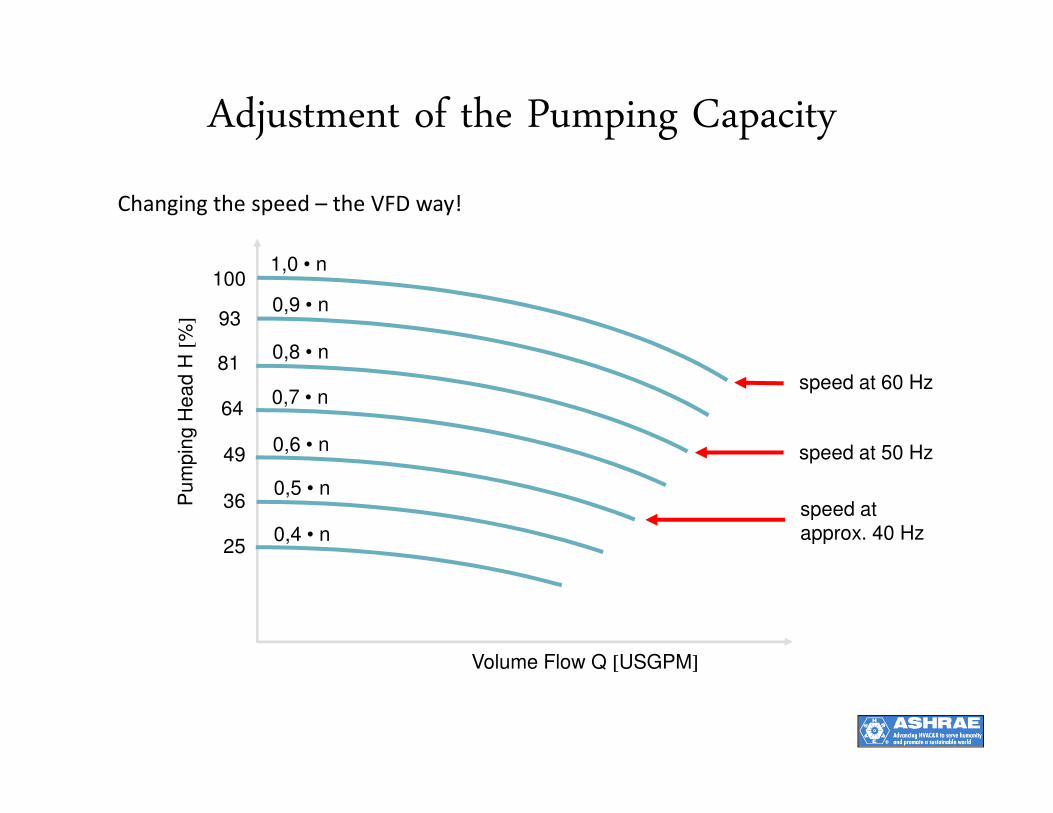
Adjustment of the Pumping Capacity
Changing the speed – the VFD way! P
um
pin
g H
ea
d H
[%
]
1,0 • n
0,9 • n
0,8 • n
0,7 • n
100
93
81
64
speed at 60 Hz
Pu
mp
ing
He
ad
H
Volume Flow Q [USGPM]
0,7 • n
0,6 • n
0,5 • n
0,4 • n
64
49
36
25
speed at 50 Hz
speed at approx. 40 Hz
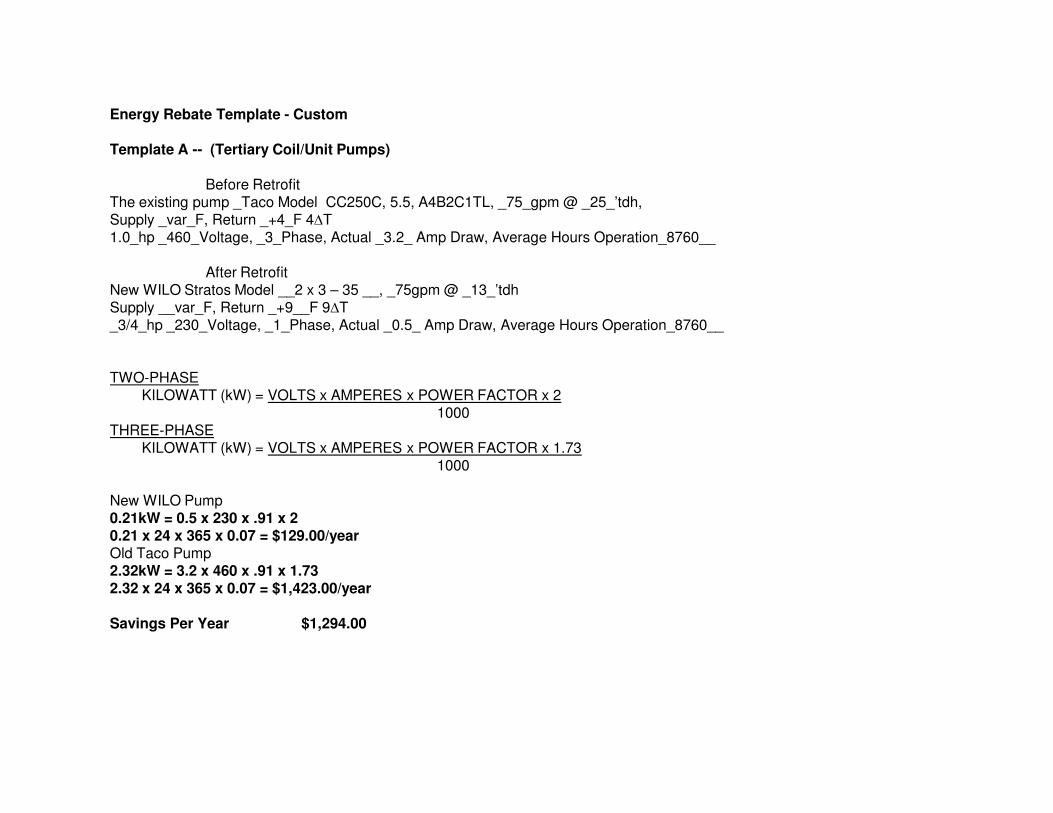
Energy Rebate Template - Custom
Template A -- (Tertiary Coil/Unit Pumps)
Before RetrofitThe existing pump _Taco Model CC250C, 5.5, A4B2C1TL, _75_gpm @ _25_’tdh, Supply _var_F, Return _+4_F 4∆T1.0_hp _460_Voltage, _3_Phase, Actual _3.2_ Amp Draw, Average Hours Operation_8760__
After RetrofitNew WILO Stratos Model __2 x 3 – 35 __, _75gpm @ _13_’tdhSupply __var_F, Return _+9__F 9∆T_3/4_hp _230_Voltage, _1_Phase, Actual _0.5_ Amp Draw, Average Hours Operation_8760__
TWO-PHASEKILOWATT (kW) = VOLTS x AMPERES x POWER FACTOR x 2
10001000THREE-PHASE
KILOWATT (kW) = VOLTS x AMPERES x POWER FACTOR x 1.731000
New WILO Pump 0.21kW = 0.5 x 230 x .91 x 20.21 x 24 x 365 x 0.07 = $129.00/yearOld Taco Pump2.32kW = 3.2 x 460 x .91 x 1.732.32 x 24 x 365 x 0.07 = $1,423.00/year
Savings Per Year $1,294.00
40
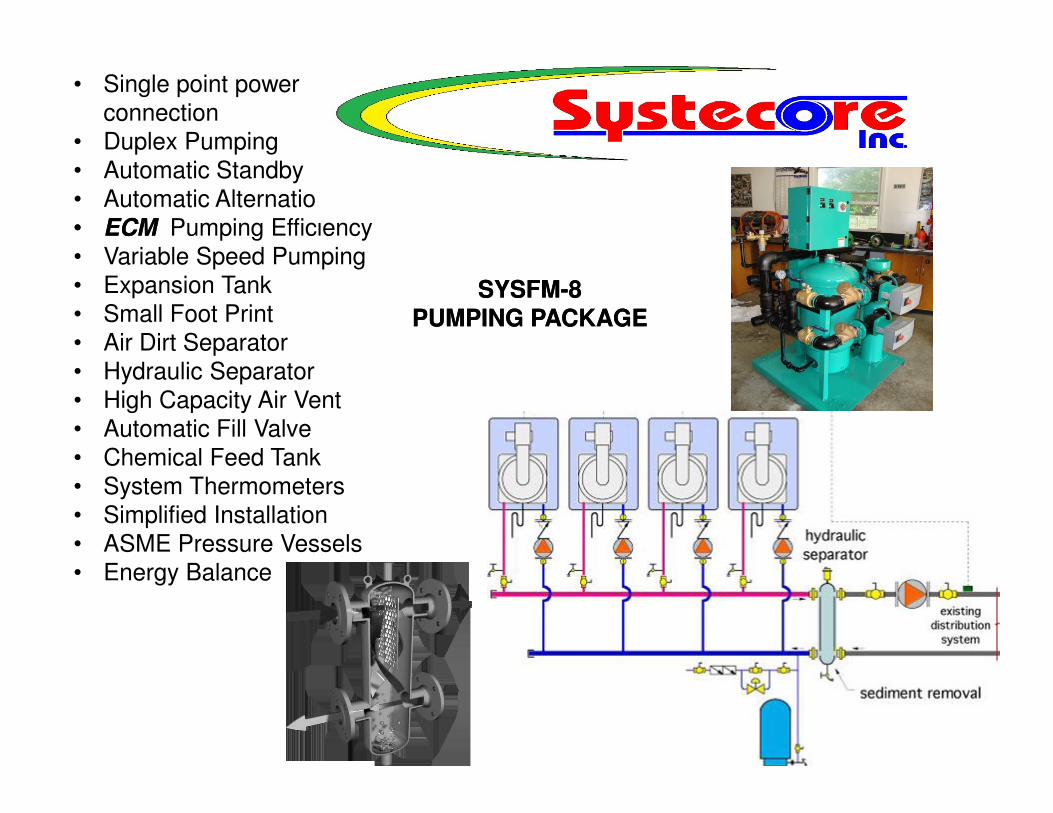
• Single point power connection
• Duplex Pumping• Automatic Standby• Automatic Alternation•• ECMECM Pumping Efficiency• Variable Speed Pumping• Expansion Tank• Small Foot Print• Air Dirt Separator• Hydraulic Separator• High Capacity Air Vent
SYSFMSYSFM--88PUMPING PACKAGEPUMPING PACKAGE
41
• High Capacity Air Vent• Automatic Fill Valve• Chemical Feed Tank• System Thermometers• Simplified Installation• ASME Pressure Vessels• Energy Balance
42

43
cut1.swf

The Amway Grand Has 2676 Tons of Cooling Operating At A Rate of 300 GPM On The
Side Stream With A Total Tower Water Flow Of 5672 GPM. The Filter Was Installed
The First Season Of The Season 2009:
Foul Thickness and
Resulting Increase in
Energy Use*:
Sacle Thickness (in)Foul Factor
(hrft2F/BTU)Energy Increase %
0.006 6.01 1,.000,000
0.012 5.15 1,.000,000
0.024 5.42 1,.000,000
0.036 4.24 1,.000,000
0.048 3.97 1,.000,000
44
Increased Energy use means Decreased Efficiency and Higher Costs.
*Data From Carrier Corp.
SYSTEMS
OPERATION
SUMMARY
UTILITY
SEASONAL2008 Pre-Filtration
2009 Post-
Filtration
2010 Post-
FiltrationPercent Reduction Capital Recovery
June July August June July August June July August June July August June July August
Electrical (KWH) 1,676,400 1,563,600 1,646,400 4% $4,998.00
Water (GAL) 2,331,516 340,340 504,900 82% $26,586.00
Chemical
Treatment (GAL) 825 275 275 66% $14,000.00
2-YR Average $45,584.00
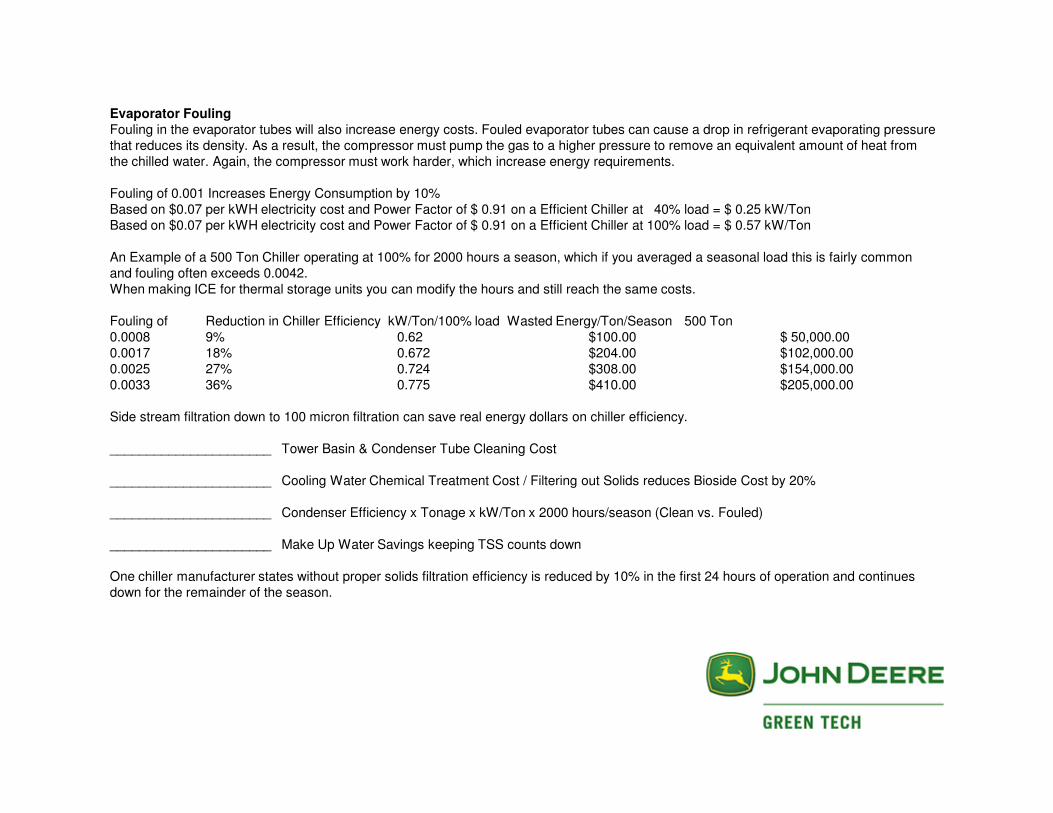
Evaporator FoulingFouling in the evaporator tubes will also increase energy costs. Fouled evaporator tubes can cause a drop in refrigerant evaporating pressure that reduces its density. As a result, the compressor must pump the gas to a higher pressure to remove an equivalent amount of heat from the chilled water. Again, the compressor must work harder, which increase energy requirements.
Fouling of 0.001 Increases Energy Consumption by 10%Based on $0.07 per kWH electricity cost and Power Factor of $ 0.91 on a Efficient Chiller at 40% load = $ 0.25 kW/TonBased on $0.07 per kWH electricity cost and Power Factor of $ 0.91 on a Efficient Chiller at 100% load = $ 0.57 kW/Ton
An Example of a 500 Ton Chiller operating at 100% for 2000 hours a season, which if you averaged a seasonal load this is fairly common and fouling often exceeds 0.0042.When making ICE for thermal storage units you can modify the hours and still reach the same costs.
Fouling of Reduction in Chiller Efficiency kW/Ton/100% load Wasted Energy/Ton/Season 500 Ton0.0008 9% 0.62 $100.00 $ 50,000.000.0017 18% 0.672 $204.00 $102,000.000.0025 27% 0.724 $308.00 $154,000.000.0033 36% 0.775 $410.00 $205,000.00
Side stream filtration down to 100 micron filtration can save real energy dollars on chiller efficiency.
______________________ Tower Basin & Condenser Tube Cleaning Cost
______________________ Cooling Water Chemical Treatment Cost / Filtering out Solids reduces Bioside Cost by 20%
______________________ Condenser Efficiency x Tonage x kW/Ton x 2000 hours/season (Clean vs. Fouled)
______________________ Make Up Water Savings keeping TSS counts down
One chiller manufacturer states without proper solids filtration efficiency is reduced by 10% in the first 24 hours of operation and continues down for the remainder of the season.

Filtering even a percentage of the total flow can yield significant return on investment (ROI).
A power generating company installed filtration to handle two percent of its 150,000 gpm flow. Its engineering staff determined that it would save $818,000 per year, including:
· $30,000 savings in tower basin and condenser tube
Screen Technology
cleaning costs;· $170,000 in cooling water chemical treatment costs;· $306,000 in improved condenser efficiency; and· $312,000 in high-efficiency fill costs.

“We figured our ROI would be under 18 months, and it turned out to be around 15 months,” he says. “That’s a good ROI. We ended up buying two more here
47
ended up buying two more here and two bigger ones for the towers across the street.”
Screen Technology
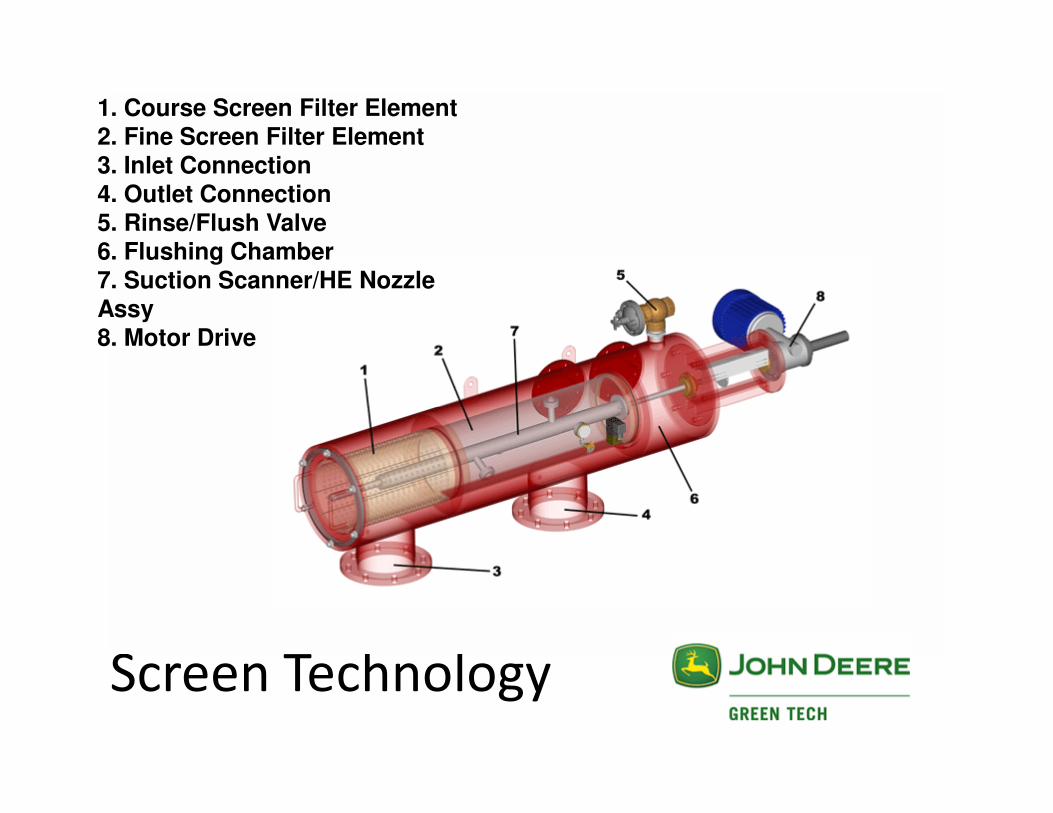
1. Course Screen Filter Element2. Fine Screen Filter Element3. Inlet Connection4. Outlet Connection5. Rinse/Flush Valve6. Flushing Chamber7. Suction Scanner/HE Nozzle Assy8. Motor Drive
Screen Technology
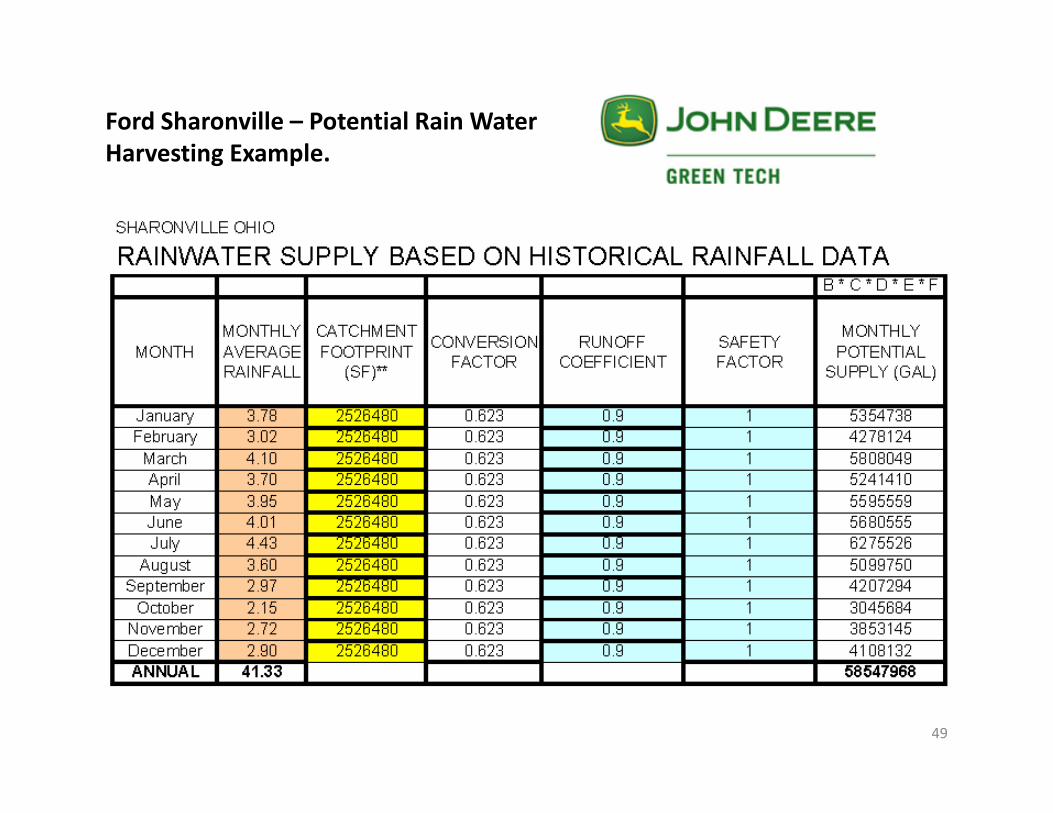
Ford Sharonville – Potential Rain Water
Harvesting Example.
49
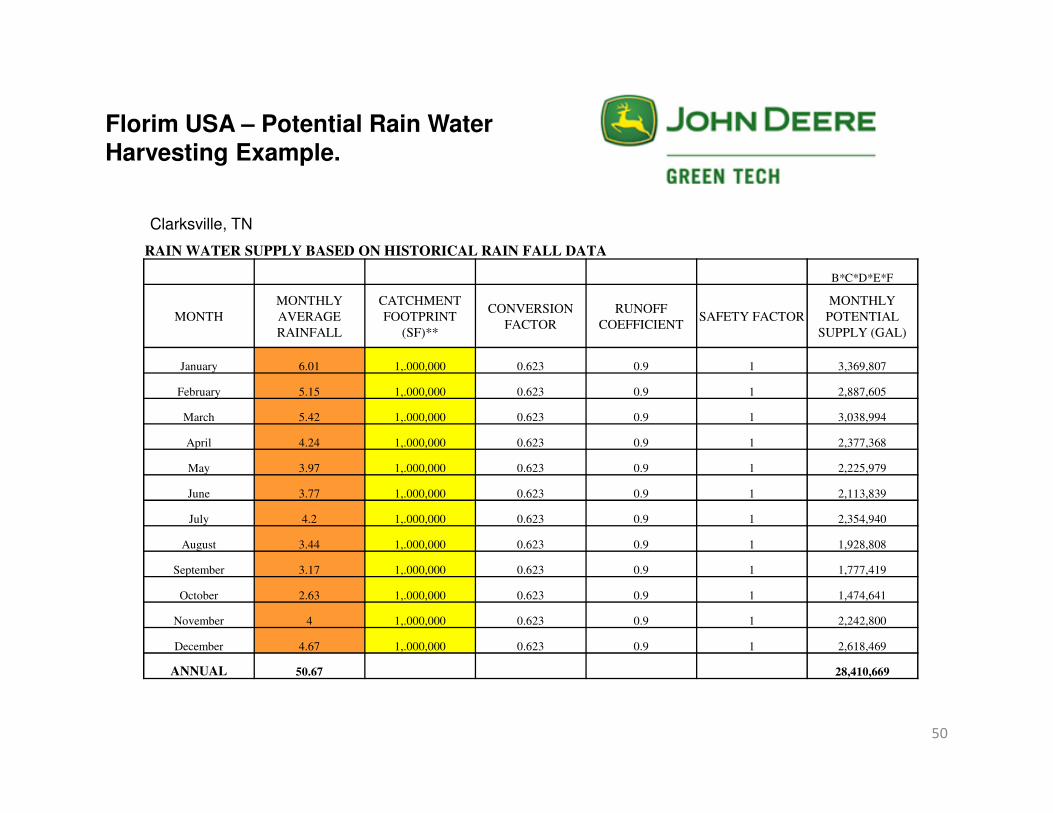
RAIN WATER SUPPLY BASED ON HISTORICAL RAIN FALL DATA
B*C*D*E*F
MONTH
MONTHLY
AVERAGE
RAINFALL
CATCHMENT
FOOTPRINT
(SF)**
CONVERSION
FACTOR
RUNOFF
COEFFICIENTSAFETY FACTOR
MONTHLY
POTENTIAL
SUPPLY (GAL)
January 6.01 1,.000,000 0.623 0.9 1 3,369,807
February 5.15 1,.000,000 0.623 0.9 1 2,887,605
Florim USA – Potential Rain WaterHarvesting Example.
Clarksville, TN
50
March 5.42 1,.000,000 0.623 0.9 1 3,038,994
April 4.24 1,.000,000 0.623 0.9 1 2,377,368
May 3.97 1,.000,000 0.623 0.9 1 2,225,979
June 3.77 1,.000,000 0.623 0.9 1 2,113,839
July 4.2 1,.000,000 0.623 0.9 1 2,354,940
August 3.44 1,.000,000 0.623 0.9 1 1,928,808
September 3.17 1,.000,000 0.623 0.9 1 1,777,419
October 2.63 1,.000,000 0.623 0.9 1 1,474,641
November 4 1,.000,000 0.623 0.9 1 2,242,800
December 4.67 1,.000,000 0.623 0.9 1 2,618,469
ANNUAL 50.67 28,410,669
51
52

Consumers Energy Rebate
Incentives Program
53
Incentives Program•Lighting
•Water Heating
•Heating and Cooling
•Motor and Drive
•New Construction
•Website:
http://www.consumersenergy.com/eeprograms/Business.aspx?id=4070&linkidentifier=id&itemid=4070

MERIT Partners:
54
John Deere Green Tech: Steve FournierLochinvar: Mark SpearsMacomb Group Heating: Kevin O’NeilMichigan Steam: Kerry Hamilton & Paul TurnerSystecore: Jeff TurnerViega: Dan Holmes
WHY ???WHY ???WHY ???WHY ???
Chiller tubes are indeed a maintenance item to be cleaned every year, but as advertised by the chiller manufacturers they can lose 10% of their clean efficiency within the first 24hours operation due to particulate fouling. They continue to lose efficiency as the season wears on, would it be wise and energy conscious to prevent the fouling in the first place; maintaining design efficiency throughout the
55
in the first place; maintaining design efficiency throughout the season? The reports by the chiller manufacturers show possible 30% loss in efficiency in the first months of operation with lowest efficiency operation during peak load season. By preventing the excessive fouling and operating at peak efficiency the energy consumption / load on the grid can be greatly reduced by numbers shown. This is directly related to electrical loading at peak demand timing. The other energy / labor / water savings just happen to be a by-product of mechanical efficiency.
Macomb Energy Resource
Integration Team
56
Thank You