Embed Size (px)
Citation preview

RESEARCH ARTICLE
Nurul Izzah Ahmad & Mohd Fairulnizal Mohd Noh & Wan Rozita Wan Mahiyuddin &
Hamdan Jaafar & Ismail Ishak & Wan Nurul Farah Wan Azmi & Yuvaneswary Veloo &
Mohd Hairulhisam Hairi
Received: 18 June 2014 /Accepted: 28 August 2014 /Published online: 26 September 2014# The Author(s) 2014. This article is published with open access at Springerlink.com
Abstract This study was conducted to determine the concen-tration of total mercury in the edible portion of 46 species ofmarine fish (n=297) collected from selected major fish land-ing ports and wholesale markets throughout Peninsular Ma-laysia. Samples were collected in June to December 2009.Prior to analysis, the fish samples were processed whichconsisted of drying at 65 °C until a constant weight wasattained; then, it was grounded and digested by a microwavedigestion system. The analytical determinationwas carried outby using a mercury analysis system. Total mercury concen-tration among fish species was examined. The results showedthat mercury concentrations were found significantly higher(p<0.001) in demersal fish (the range was from 0.173 to2.537 mg/kg in dried weight) compared to pelagic fish (whichranged from 0.055 to 2.137 mg/kg in dried weight). Themercury concentrations were also higher in carnivorous fishespecially in the species with more predatory feeding habits.Besides, the family group of Latidae (0.537±0.267 mg/kg indried weight), Dasyatidae (0.492±0.740 mg/kg in driedweight), and Lutjanidae (0.465±0.566 mg/kg in dried weight)showed significantly (p<0.001) higher mercury levels com-pared to other groups. Fish collected from Port Klang (0.563±0.509mg/kg in dry weight), Kuala Besar (0.521±0.415mg/kg
in dry weight), and Pandan (0.380±0.481 mg/kg in dryweight) were significantly higher (p=0.014) in mercury con-centrations when compared to fish from other sampling loca-tions. Total mercury levels were significantly higher(p<0.002) in bigger fish (body length >20 cm) and werepositively related with fish size (length and weight) in all fishsamples. Despite the results, the level of mercury in marinefish did not exceed the permitted levels of Malaysian andJECFA guideline values at 0.5 mg/kg methylmercury in fish.
Keywords Total mercury .Marine fish . Demersal fish .
Pelagic fish . Fish landing ports .Wetmarket . PeninsularMalaysia
Introduction
Fish is an important source of protein in Malaysia. Dailyconsumption of fish is on average one and a half medium fishper day (Norimah et al. 2008). The Malaysian per capitaconsumption of fish was 56.39 kg/person/year in the year2003 and accounted for 12.4 % of total food intake per capita(Tey et al. 2008). The results of the Household ExpenditureSurvey for Malaysia in 2004/2005 showed that budget shareson fish (22.1 %) was the second largest after cereals (23.9 %),and the trend showed an increase when compared to theprevious 1999/2000 survey (21.8 %). A study on food con-sumption behavior among Malays showed that the consumerswere not affected by the changes in fish price, where anincrease in the expenditure on fish may be caused by incre-ment of income together with an increase in the health con-sciousness (Tey et al. 2008).
Many researchers have discussed the benefits of seafoodand bioactive components from aquatic sources in relation tovarious health outcomes (Larsen et al. 2011; McManus et al.2011; Torpy 2006). Marine fish has a favorable fatty acid
Responsible editor: Philippe Garrigues
N. I. Ahmad (*) :M. F. M. Noh :W. R. W. Mahiyuddin :W. N. F. W. Azmi :Y. Veloo :M. H. HairiInstitute for Medical Research, Jalan Pahang, 50588 Kuala Lumpur,Malaysiae-mail: [email protected]
H. JaafarFisheries Biosecurity Centre, Department of Fisheries Malaysia, Lot82, Jalan Carruthers, Off Jalan Sultan Salahuddin, 50480 KualaLumpur, Malaysia
I. IshakFisheries Research Institute, 11960 Batu Maung, Penang, Malaysia
Environ Sci Pollut Res (2015) 22:3672–3686DOI 10.1007/s11356-014-3538-8
Mercury levels of marine fish commonly consumed in PeninsularMalaysia

composition, namely, the long-chain n-3 polyunsaturated fattyacids (n-3 PUFA), the eicosapentaenoic acid (EPA; C20:5n-3), and the docosahexaenoic acid (DHA; C22:6n-3) that hasbeen linked to a lower incidence of cardiovascular disease(CVD) (Larsen et al. 2011; McManus et al. 2011; Torpy2006). High-quality fish proteins contain all the essentialamino acids and are highly digestible (Larsen et al. 2011).The bioactive properties from fish proteins and peptides havebeen reported to be an antihypertensive, antioxidative, antico-agulant, and antimicrobial components in functional foods ornutraceuticals and pharmaceuticals. Marine foods are alsoexcellent source of essential nutrients such as minerals (iodineand selenium) and vitamins (vitamins A, D, and B12). Othermarine bioactive components linked to health promoting ef-fects include taurine, phytosterols, antioxidants, and phospho-lipids (Larsen et al. 2011; McManus et al. 2011; Torpy 2006).
Conversely, fish consumption is the major route of mercuryexposure to human and it is often found in the form ofmethylmercury (Burger 2009; Morgano et al. 2011; Castro-Gonžalez and Mendez-Armenta 2008; Myers and Davidson2000). Fish may concentrate methylmercury either directlythrough the water or through components of the food chain(Castro-Gonžalez and Mendez-Armenta 2008). Mercury at-tached to aquatic sediments is subject to microbial conversionto methylmercury, at which point it enters the aquatic foodchain and reaches its highest concentration in predatory fish(Clarkson et al. 2003). The cyclic order of mercury contami-nation chain starts from its emission in industries. This isfollowed by contamination in atmosphere, soil, water, phyto-plankton, zooplankton, fish, and to human (Castro-Gonžalezand Mendez-Armenta 2008). There are two important sourcesof mercury which are anthropogenic and natural sources. Themost important source is from the anthropogenic sourcesparticularly from urban discharges, agricultural materials,mining and combustion, and industrial discharges (Castro-Gonžalez and Mendez-Armenta 2008; Streets et al. 2005).Volcanic eruptions are believed to be an important naturalsource of mercury (Clarkson and Magos 2006).
Methylmercury is a robust toxicant, and the primary targetis the central nervous system (Clarkson and Magos 2006)especially the brain tissue (Clarkson et al. 2003). Methylmer-cury is highly mobile in the human body where its passageacross the blood-brain and placental barriers, cause damage,both prenatally and postnatally (Tollefson and Cordle 1986). Itappears to be most neurotoxic prenatally when the brain isdeveloping rapidly (Myers and Davidson 2000). The journeyof methylmercury into the human body is explained throughthe formation of water-soluble methylmercury complexes inbody tissues that are attached to thiol groups in protein, certainpeptides, and amino acids (Clarkson andMagos 2006). It mayenter into body cells as methylmercury-cysteine complex andexit via glutathione pathway. The main route of its eliminationfrom the body is via feces, which is as much as 90 % of total
excretion according to animal observation (Clarkson andMagos 2006). In adults, the main symptoms of methylmer-cury exposure related with intoxication are to the nervoussystem, with paraestesia or numbness in the hands and feet,coordination difficulties, and concentric constriction of thevisual field, auditory symptoms, ischemic stroke, dementiaand depression. It might also cause nephrotoxicity and gas-trointestinal toxicity with ulceration and hemorrhage (Castro-Gonžalez and Mendez-Armenta 2008; Clarkson and Magos2006; Tollefson and Cordle 1986).
Scientists worldwide have researched the toxicity of meth-ylmercury since the first outbreak which was reported inMinamata, Japan, in 1956. Numerous reports and reviewarticles discussing these issues were published. Among theearliest publications, as has been cited by Myers et al. (2000),were publications by the researchers from the University ofRochester on measurement of exposure and the consequencesof exposure to various forms of mercury on experimentalanimals. Later, Swedish investigators discovered the methyl-ation process of inorganic mercury by organisms in the aquat-ic sediments and in fish which may concentrate methylmer-cury either directly through the water or through componentsof the food chain (Myers et al. 2000). Recent scientific pub-lications have focused on the levels of methylmercury con-tamination in seafood, namely, fish (Denton et al. 2006; Gue-rin et al. 2011; Ikem and Egiebor 2005; Mendil et al. 2010;Turkmen et al. 2005; Yilmaz et al. 2010), human exposure,and its related health effects (Burger 2009; Morgano et al.2011; Castro-Gonžalez and Mendez-Armenta 2008; Myersand Davidson 2000).
There are few publications on the concentrations of mercuryin marine fish reported by Malaysian researchers. Most studiesreported on various levels of mercury in limited marine fishspecies that collected from selected sites in PeninsularMalaysiaonly. Among the most recent research studies were carried outby Alina et al. (2012), Mok et al. (2012), Kamaruzaman et al.(2011), Hajeb et al. (2009, 2010), Irwandi and Farida (2009),and Agusa et al. (2005a, 2007). Most of the results from theseresearch studies showed that mercury were found to have lowerconcentrations in marine fish compared to the permissiblelimits set either by Malaysian Standards or JECFA guidelinevalues. Only Agusa et al. (2005a) reported that some species ofthe marine fish captured from Malaysian markets had highmercury concentrations that may cause hazardous to the con-sumers. Similarly, Hajeb et al (2009, 2010) reported the highestlevel of mercury in longtail tuna and short-bodied mackerelcaptured from both east and west coast of Peninsular Malaysia.In another separated study, their findings showed high mercuryintake by fishermen families at the rural areas compared to thegeneral adult population (Hajeb et al 2011).
Studies from several neighboring areas/countries such asGresik Coast, Indonesia (Soegianto et al. 2010), MekongDelta, South Vietnam (Ikemoto et al. 2008), East Coast of
Environ Sci Pollut Res (2015) 22:3672–3686 3673

Thailand (Cheevaporn et al 2000), Mekong River, and severalplaces in Cambodia (Murphy et al. 2008; Agusa et al. 2005b)showed that variability of mercury concentrations was quitehigh from species to species of marine fish. Murphy et al.(2008) reported mercury levels of some fish species of up tosixfold higher compared to the average of 99 ng/g mercury inKratie Mekong, Cambodia. Some marine fish species such asthresher shark, tille travelly, skipjack tuna, swordfish(Sompongchaiyakul et al. 2011), sharp-tooth snapper, and ob-tuse barracuda (Agusa et al. 2005b) hadmercury concentrationsexceeded the JECFA guidelines. All these research studiesreported on few limited species of marine fish in selectedlocations for their studies only. Therefore, information on levelof mercury in various marine fish consumed is timely. Theobjectives of this study were aimed at determining andinterpreting the concentrations of total mercury in the edibletissues of 297 commonly consumed marine fish samples thatcomposed of 46 species, collected in June to December 2009from fish landing ports and wholesale markets throughoutPeninsular Malaysia. This study will provide baseline data ofmercury levels in muscle of 12 species of Carangidae, 11species of Scrombidae, 5 species of Lutjanidae, 2 species ofLatidae, 4 species ofDasyatidae, 4 species of Sciaenidae, and 8species of Nemipteridae. The relationship between mercurylevels and fish size (length and weight) was investigated, andmercury burden sampled from fish at different habitats, familygroup, and areas were also compared. It is hoped that later, thedata reported will serve as an invaluable baseline study forestimating and assessing risk on mercury contaminationthrough seafood consumption among Malaysians.
Materials and methods
Apparatus and reagent
Glassware and plastic containers were soaked in 2 % nitricacid and left overnight before they were rinsed thoroughlywith ultrapure water. All reagents used were of analyticalgrade. Ultrapure water was obtained from Elga, Ultra PureWater System, Maxima.
Sampling and sample preparation
This was a cross-sectional descriptive study, and sample sizefor sampling of seafood is based on statistical calculationusing prevalence of 48 % of marine fish contaminated withmercury higher than the Malaysian guideline value (Agusaet al. 2005a). The formulation used was N=(((Zα
2P (1-P))/E2), where Z=1.96 (based on 95 % cumulative interval (CI),E=maximum tolerance error (5%), andα=0.05 at 95%CI. Aminimum number of 383 seafood samples were required foranalysis purposes. The selection of seafood were based the
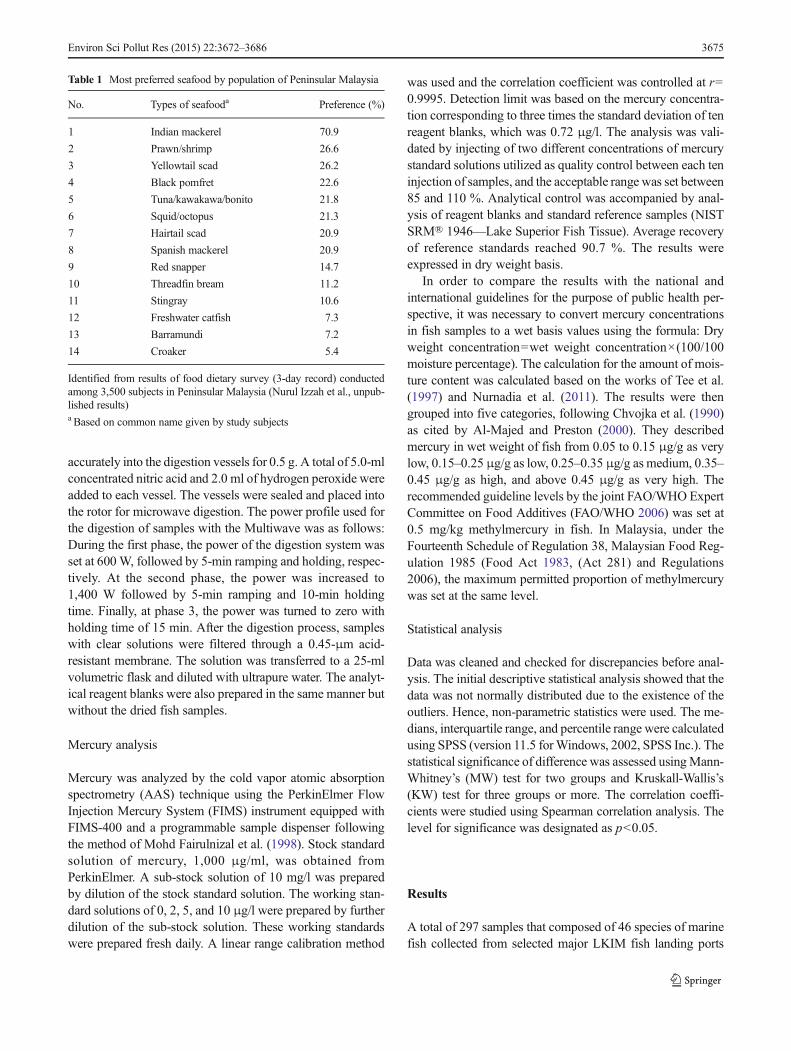
most popular/consumed seafood by local population identi-fied from results of food dietary survey conducted among3,500 subjects in Peninsular Malaysia (Nurul Izzah et al.unpublished results) (Table 1).
Samples were purchased from six selected major fish land-ing complexes of Fisheries Development Authority of Malay-sia (LKIM) and from five wholesale wet markets throughoutPeninsular Malaysia. Two fish landing complexes were in thewest coast (at Port Klang and Mergong) while the other fourcomplexes were located along the east coast of PeninsularMalaysia (at Kuala Besar, Pulau Kambing, Chendering, andKuantan). The five major wholesale wet markets were locatedat Kampong Bakau, Bukit Mertajam, Kuala Pari, andSelayang, while Pandan was the only wet market locatedsouth of Peninsular Malaysia (Fig. 1). Seafood samples werecollected from the first three fishing boats that landed at theLKIM complexes on the sampling day. At the wholesale wetmarkets, samples were collected from three randomly selectedbusiness units. Sampling was conducted from June to Decem-ber 2009. A total of 394 seafood samples were collectedduring three successive visits to each location, and this paperreported results of mercury determination in marine fish sam-ples only which consist of 297 number of samples.
Total length and weight of the fish samples were measuredto the nearest millimeter and gram (Table 2). Fish sampleswere packed in polyethylene bags, labeled, and put into anicebox before they were transported to the laboratory. In thelaboratory, the samples were kept frozen at −21 °C. Forsample preparation, the fish samples were thawed at roomtemperature. The edible portion of fish was filleted, cut intosmall pieces, and homogenized. The homogenized muscleswere then dried in the laboratory oven at 65 °C to constant dryweight and ground using mortar.
The food items and feeding habits of both the pelagic anddemersal fishes were referenced from the Global InformationSystem on Fishes at the website: http://www.fishbase.us(Table 2). Most of the fish sampled in this study wereclassified as predatory, which live by killing and eating uponother fish or animals. Only five species (redtail scad, roundscad, shortfin scad, Faughn’s mackerel, and Indo-Pacific mack-erel) that were captured in this study were non-predators. Theyfed on zooplankton, phytoplankton, and other plants. Informa-tion on tropic levels (TL) that expressed the position of aspecies in a marine food web was gathered from the samewebsite. In the marine ecosystem, TL of consumers generallyranges between 2.0 for species feeding exclusively on plants ordetritus and 5.5 for carnivores (Stergiou and Karpouzi 2002).
Digestion procedures
Samples for mercury analysis (including blanks) weredigested in a microwave digestion system (Multiwave3000—Anton Paar). Dried fish samples were weighed
3674 Environ Sci Pollut Res (2015) 22:3672–3686
accurately into the digestion vessels for 0.5 g. A total of 5.0-mlconcentrated nitric acid and 2.0 ml of hydrogen peroxide wereadded to each vessel. The vessels were sealed and placed intothe rotor for microwave digestion. The power profile used forthe digestion of samples with the Multiwave was as follows:During the first phase, the power of the digestion system wasset at 600W, followed by 5-min ramping and holding, respec-tively. At the second phase, the power was increased to1,400 W followed by 5-min ramping and 10-min holdingtime. Finally, at phase 3, the power was turned to zero withholding time of 15 min. After the digestion process, sampleswith clear solutions were filtered through a 0.45-μm acid-resistant membrane. The solution was transferred to a 25-mlvolumetric flask and diluted with ultrapure water. The analyt-ical reagent blanks were also prepared in the same manner butwithout the dried fish samples.
Mercury analysis
Mercury was analyzed by the cold vapor atomic absorptionspectrometry (AAS) technique using the PerkinElmer FlowInjection Mercury System (FIMS) instrument equipped withFIMS-400 and a programmable sample dispenser followingthe method of Mohd Fairulnizal et al. (1998). Stock standardsolution of mercury, 1,000 μg/ml, was obtained fromPerkinElmer. A sub-stock solution of 10 mg/l was preparedby dilution of the stock standard solution. The working stan-dard solutions of 0, 2, 5, and 10 μg/l were prepared by furtherdilution of the sub-stock solution. These working standardswere prepared fresh daily. A linear range calibration method
was used and the correlation coefficient was controlled at r=0.9995. Detection limit was based on the mercury concentra-tion corresponding to three times the standard deviation of tenreagent blanks, which was 0.72 μg/l. The analysis was vali-dated by injecting of two different concentrations of mercurystandard solutions utilized as quality control between each teninjection of samples, and the acceptable range was set between85 and 110 %. Analytical control was accompanied by anal-ysis of reagent blanks and standard reference samples (NISTSRM® 1946—Lake Superior Fish Tissue). Average recoveryof reference standards reached 90.7 %. The results wereexpressed in dry weight basis.
In order to compare the results with the national andinternational guidelines for the purpose of public health per-spective, it was necessary to convert mercury concentrationsin fish samples to a wet basis values using the formula: Dryweight concentration=wet weight concentration×(100/100moisture percentage). The calculation for the amount of mois-ture content was calculated based on the works of Tee et al.(1997) and Nurnadia et al. (2011). The results were thengrouped into five categories, following Chvojka et al. (1990)as cited by Al-Majed and Preston (2000). They describedmercury in wet weight of fish from 0.05 to 0.15 μg/g as verylow, 0.15–0.25μg/g as low, 0.25–0.35 μg/g as medium, 0.35–0.45 μg/g as high, and above 0.45 μg/g as very high. Therecommended guideline levels by the joint FAO/WHO ExpertCommittee on Food Additives (FAO/WHO 2006) was set at0.5 mg/kg methylmercury in fish. In Malaysia, under theFourteenth Schedule of Regulation 38, Malaysian Food Reg-ulation 1985 (Food Act 1983, (Act 281) and Regulations2006), the maximum permitted proportion of methylmercurywas set at the same level.
Statistical analysis
Data was cleaned and checked for discrepancies before anal-ysis. The initial descriptive statistical analysis showed that thedata was not normally distributed due to the existence of theoutliers. Hence, non-parametric statistics were used. The me-dians, interquartile range, and percentile range were calculatedusing SPSS (version 11.5 forWindows, 2002, SPSS Inc.). Thestatistical significance of difference was assessed usingMann-Whitney’s (MW) test for two groups and Kruskall-Wallis’s(KW) test for three groups or more. The correlation coeffi-cients were studied using Spearman correlation analysis. Thelevel for significance was designated as p<0.05.
Results
A total of 297 samples that composed of 46 species of marinefish collected from selected major LKIM fish landing ports
Table 1 Most preferred seafood by population of Peninsular Malaysia
No. Types of seafooda Preference (%)
1 Indian mackerel 70.9
2 Prawn/shrimp 26.6
3 Yellowtail scad 26.2
4 Black pomfret 22.6
5 Tuna/kawakawa/bonito 21.8
6 Squid/octopus 21.3
7 Hairtail scad 20.9
8 Spanish mackerel 20.9
9 Red snapper 14.7
10 Threadfin bream 11.2
11 Stingray 10.6
12 Freshwater catfish 7.3
13 Barramundi 7.2
14 Croaker 5.4
Identified from results of food dietary survey (3-day record) conductedamong 3,500 subjects in Peninsular Malaysia (Nurul Izzah et al., unpub-lished results)a Based on common name given by study subjects
Environ Sci Pollut Res (2015) 22:3672–3686 3675

and wholesale markets in Peninsular Malaysia are shown inTable 2. A number of 177 samples of pelagic fish werecollected in this study. This group of fish live near thesurface or in the water column of coastal and ocean.They were then classified into two different families: 80of Carangidae and 97 of Scrombidae. The remaining120 fish samples were demersal fish that live on or nearthe bottom of the sea or ocean. There were five familiesof demersal fish collected in this study, which were 24of Lutjanidae, 15 of Latidae, 25 of Dasyatidae, 25 ofSciaenidae, and 31 of Nemipteridae.
The size of fish in the samples varied. The Carangidae,Sciaenidae, and Nemipteridae were small-sized fish withbody length ranging from 12 to 30 cm and with weight ofless than 0.5 kg. Other family groups covered a relatively widesize range that composed of small, medium to large-sized fish;the smallest weighed 40 g and the largest 5 kg. Generally, thelarger fish were Spanish mackerels, tuna, red snapper, seaperch, and stingray.
The TL for fish captured in this study ranged from 2.7 to4.5. More than half (66.7 %) of the samples had TL rangefrom 3.7 to 4.5, which indicated that most of the samplescaptured were carnivores or large pelagic. Another 32.3 %had TL between 2.9 and 3.7 with a mean value of 3.4. Thisgroup was omnivorous that fed on a variety of prey. Only 1 %of the samples fed on vegetable materials.
Total mercury levels in marine fish sampled from the fishlanding ports and the wholesale markets in Peninsular Malay-sia are summarized in Table 3. Mercury levels of 46 marinefish species ranged from 0.055 to 2.537 mg/kg of dry weight.Significant variations of mercury levels exist in differentspecies (χKW
2 =103.581; p<0.001). Among pelagic fish, themedian for mercury levels was higher (>0.5 mg/kg) in scad(Selar boops) and bonito (Sarda orientalis). While for thedemersal fish, the highest mercury levels were shown inJohn’s snapper (Lutjanus ruselli), mangrove red snapper(Lutjanus argentimaculatus), and doublewhip threadfinbream (Nemipterus nematophorus). Mercury levels were
Source: ©2010 Google-map data ©2010 MapIT, Tele Atlas,GMS. 14 May 2014.
Fig. 1 Location map of samplingstations in states of PeninsularMalaysia
3676 Environ Sci Pollut Res (2015) 22:3672–3686

Table 2 List of most preferredmarine fish collected form Fisheries Development Authority ofMalaysia (LKIM) fish landing complexes and whole-salemarket in Peninsular Malaysia
No. Groups/family/species Common name No ofsamples
Size range(cm)
Weight range(kg)
*Main food/feeding habits/TL
Pelagic fish
(a) Carangidae (80)
1 Selaroides leptolepis Yellowstripe scad 13 12.6–19.6 0.028–0.290 Nekton, zooplankton, zoobenthos/predator/3.5
2 Selar boops Oxeye scad 3 19.0–24.8 0.0090–0.212 Zooplankton, zoobenthos/variables/3.5
3 Selarcrumenopthalmus
Bigeye scad 1 23.8 0.186 Nekton, zooplankton, zoobenthos, detritus/predators/4.1
4 Atule mate Yellowtail scad 4 23.1–26.3 0.150–0.224 Nekton, zooplankton, zoobenthos, plants/predators/4.5
5 Caranx sexfasciatus Bigeye trevally 1 22.7 0.140 Nekton/predators/4.5
6 Seriola dumerili Greater amberjack 1 19.6 0.106 Nekton, zooplankton, zoobenthos/predators/4.5
7 Decapterus kurroides Redtail scad 4 18.5–26.8 0.066–0.224 Zooplankton/3.4
8 Decapterus muruadsi Round scad 7 18.1–36.2 0.071–0.294 Zooplankton/3.4
9 Decapterus russelli Slender scad 10 16.5–30.1 0.052–0.420 Nekton, zooplankton, plants zoobenthos/variables/3.7
10 Decapterusmacrosoma
Shortfin scad 1 – – Zooplankton/3.4
11 Megalaspis cordyla Torpedo scad 20 22.2–34.3 0.101–0.300 Nekton, zooplankton, zoobenthos, plants detritus/predators/4.4
12 Parastromateus niger Black pomfret 15 15.6–40.3 0.082–1.466 Plants, zooplankton, zoobenthos/2.9
(b) Scrombidae (97)
13 Rastrelliger kanagurta Indian mackerel 13 13.4–24.3 0.200–0.360 Nekton, zooplankton, zoobenthos, plants detritus/predators/3.2
14 Rastrelliger faughni Faughn’s mackerel 6 19.0–21.8 0.100–0.180 Zooplankton/3.4
15 Rastrelligerbrachysoma
Indo-Pacific mackerel 3 16.6–25.5 0.050–0.280 Zooplankton, plants/2.7
16 Scomber australasicus Blue mackerel 18 17.0–22.4 0.040–0.152 Nekton, zooplankton, zoobenthos/predators/4.2
17 Scomberomorusguttatus
Indo-Pacific kingmackerel
12 29.6–55.5 0.176–1.066 Nekton, zoobenthos/predators/4.3
18 Scomberomoruscommerson
Narrowbarred Spanishmackerel
14 40.1–85.5 0.394–4.550 Nekton, zooplankton, zoobenthos/predator/4.5
19 Gymnosarda unicolor Dogtooth tuna 10 19.8–49.5 0.082–5.000 Nekton/predator/4.5
20 Sarda orientalis Striped bonito 6 25.5–48.0 0.232–1.600 Nekton, zoobenthos/predator/4.2
21 Thunnus tonggol Longtail tuna 8 17.2–50.0 0.082–1.733 Nekton, zoobenthos/predator/4.5
22 Auxis thazard thazard Frigate tuna 2 29.6–31.2 0.334–0.412 Nekton, zoobenthos/predator/4.3
23 Euthymus affinis Kawakawa 5 29.4–69.3 0.370–4.733 Nekton, zoobenthos/predator/4.5
Demersal fish
(c) Lutjanidae (24)
24 Lutjanusargentimaculatus
Mangrove red snapper 3 38.3–38.5 1.033–1.175 Nekton, zooplankton, zoobenthos/predator/3.6
25 Lutjanus gibbus Humpback red snapper 1 20.2 0.148 Nekton, zoobenthos/predator/3.6
26 Lutjanus sebae Emperor red snapper 11 18.1–62.0 0.102–3.300 Nekton, zooplankton, zoobenthos/predator/4.3
27 Lutjanus malabaricus Malabar blood snapper 5 27.9–49.75 0.394–1.175 Nekton, zoobenthos/predator/4.5
28 Lutjanus russellii John’s snapper 4 66.0 4.050 Detritus, nekton, zoobenthos/predator/4.3
(d) Latidae (15)
29 Lates calcarifer Giant sea perch 11 26.6–71.6 0.046–4.650 Nekton, zooplankton, zoobenthos/predator/4.4
30 Psammopercawaigiensis
Waigeu sea perch 4 34.6–38.3 0.396–0.875 Nekton, zoobenthos/predator/4.0
(e) Dasyatidae (25)
31 Himantura gerrardi Sharpnose stingray 10 21.4–116.3 0.208–2.880 Zoobenthos/predator/3.7
32 Neotrygon kuhlii Bluespotted stingray 7 45.7–114.0 0.510–4.300 Nekton, zoobenthos/3.2
33 Dasyatis zugei Pale-edged stingray 5 40.7–147.3 0.188–1.157 Zoobenthos/predator/3.5
Environ Sci Pollut Res (2015) 22:3672–3686 3677

significantly higher in higher tropic level fish (χKW2 =7.787;
p<0.02).The median of mercury levels for demersal fish (0.460±
0.414 mg/kg dry weight) was significantly higher (χMW2 =
5401.0; p<0.001) compared to the pelagic fish (0.292±0.169 mg/kg of dry weight) (Table 4). Mercury level wassignificantly lower (χKW
2 =7.787; p<0.02) in herbivorouswhen compared to the omnivorous and carnivorous fish.Among the family groups, mercury levels were significantlyhigher (χKW
2 =46.122; p<0.001) in Latidae, followed byDasyatidae, Lutjanidae, and Nemipteridae. No significantdifferences (χMW
2 =1,863.0; p=0.274) were shown for mercu-ry levels between local and imported fish, different coastalregions (west, east, and south) (χKW
2 =679.0; p=0.712), andsampling points (fish landing ports and wet markets) (χMW
2 =10,114.0; p=0.738). However, mercury levels in marine fish
sampled from different sampling locations showed significantdifferences at p=0.014 (χKW
2 =22.263). Higher mercury levelswere found in fish sampled from Port Klang (0.563±0.509mg/kg of dry weight), Kuala Besar (0.521±0.415mg/kgof dry weight), and Pandan (0.380±0.481 mg/kg dry weight)compared to other locations. Mercury levels in bigger fishwere significantly higher (χMW
2 =6,642.0; p=0.002) comparedto the smaller ones. Scatter plots (Fig. 2) showed that mercurylevels were positively correlated with weight and length of thefish, with significant Spearman correlation coefficients of0.237 and 0.297, respectively.
The distribution of total mercury in fish based on categoriesby Chvojka et al. (1990) is shown in Fig. 3. The results fromthis study indicated that most of the samples (83.7%) had verylow levels of mercury followed by 10.1 % with low mercurylevels. Another 4.2 % of the samples had medium levels of
Table 2 (continued)
No. Groups/family/species Common name No ofsamples
Size range(cm)
Weight range(kg)
*Main food/feeding habits/TL
34 Himantura uarnak Honeycomb stingray 3 131.6–142.0
2.266–3.040 Nekton, zoobenthos/predator/3.6
(f) Sciaenidae (25)
35 Chrysochir aureus Reeve’s croaker 3 19.0–25.4 0.074–0.220 Zoobenthos/predator/3.5
36 Otolithoides ruber Tigertooth croaker 6 13.0–24.2 0.04–0.113 Zoobenthos/predator/3.6
37 Nibea soldado Soldier croaker 15 15.3–21.6 0.041–0.274 Zoobenthos, nekton/predator/4.0
38 Otolithoides biauritus Bronze croaker 1 20.9 0.132 Zoobenthos, nekton/predator/4.1
(g) Nemipteridae (31)
39 Nemipterus bathybius Yellowbelly threadfinbream
6 15.7–33.7 0.063–0.516 Zoobenthos, nekton/predator/4.0
40 Nemipterus japonicus Japanese threadfin bream 11 16.9–29.2 0.063–0.212 Zoobenthos, nekton/predator/3.8
41 Nemipterus furcosus Forktail threadfin bream 3 18.2–21.4 0.102–0.162 Zoobenthos, nekton/predator/3.6
42 Nemipterusthosaporni
Threadfin bream 4 17.0–24.0 0.059–0.210 Not available/3.7
43 Nemipterustambuloides
Fivelined threadfin bream 2 17.5–21.4 0.086–0.109 Zoobenthos, nekton/predator/4.0
44 Nemipterusnematophorus
Doublewhip threadfinbream
2 16.1–25.6 0.058–0.154 Not available/3.7
45 Nemipterusmarginatus
Red filament threadfinbream
2 23.0–25.5 0.110–0.240 Zoobenthos/predator/3.5
46 Nemipterus nemurus Redspine threadfin bream 1 17.8 0.096 Zoobenthos, nekton/predator/4.0
Source: http://www.fishbase.us. Nekton—the division of the pelagic population that comprises of the free-swimming animals. They are capable ofwithstanding the force of the ocean current and are able to travel over long distances. Fish, squids, cetaceans, pinnipeds, sea snakes, turtles, and penguinsconstitute the nekton group. Zooplankton—animal constituent of plankton; mainly small crustaceans and fish larvae. Free-swimming aquatic animals,essentially independent of water movements. Zoobenthos—the invertebrate animals that live in or on the seabed, including the intertidal zone.Plants—phytoplankton and other plants. Detritus—non-living particulate organic material (as opposed to dissolved organic material). It typicallyincludes the bodies or fragments of dead organisms as well as fecal material
Tropic levels (TLs):
2.0–2.1 (mean 2.02)—pure herbivores
2.1<TL<2.9 (mean 2.5)—omnivores with a preference for vegetable material
2.9<TL<3.7 (mean 3.4)—omnivores with a preference for animal material (feeding on a variety of prey)
3.7<TL<4.0 (mean 3.85)—carnivores with a preference for decapods and fish
4.0<TL<4.5 (mean 4.32)—carnivores with a preference for fish cephalopods
(Stergiou and Karpouzi 2002)
3678 Environ Sci Pollut Res (2015) 22:3672–3686

Table 3 Total mercury levels in marine fish sampled from the LKIM complexes and wholesale market in Peninsular Malaysia
No. Groups/family/species Common name Number Total mercury (mg/kg dry weight (DW))
Median IQR Min Max Range
Pelagic fish
Carangidae (80)
1 Selaroides leptolepis Yellowstripe scad 13 0.252 0.125 0.138 2.137 1.999
2 Selar boops Oxeye scad 3 0.555 – 0.305 0.719 0.414
3 Selar crumenopthalmus Bigeye scad 1 0.298 – – – –
4 Atule mate Yellowtail scad 4 0.458 0.304 0.371 0.746 0.375
5 Caranx sexfasciatus Bigeye trevally 1 0.293 – – – –
6 Seriola dumerili Greater amberjack 1 0.203 – – – –
7 Decapterus kurroides Redtail scad 4 0.272 0.263 0.186 0.535 0.349
8 Decapterus muruadsi Round scad 7 0.317 0.171 0.173 0.535 0.362
9 Decapterus russelli Slender scad 10 0.195 0.108 0.078 0.304 0.226
10 Decapterus macrosoma Shortfin scad 1 0.354 – – – –
11 Megalaspis cordyla Torpedo scad 20 0.319 0.198 0.202 0.913 0.711
12 Parastromateus niger Black pomfret 15 0.242 0.121 0.158 0.518 0.360
Total 80 0.291 0.153 0.078 2.137 2.059
Scrombidae (97)
13 Rastrelliger kanagurta Indian mackerel 13 0.180 0.066 0.055 0.454 0.399
14 Rastrelliger faughni Faughn’s mackerel 6 0.357 0.246 0.254 0.753 0.499
15 Rastrelliger brachysoma Indo-Pacific mackerel 3 0.261 – 0.258 0.332 0.074
16 Scomber australasicus Blue mackerel 18 0.269 0.065 0.152 0.610 0.458
17 Scomberomorus guttatus Indo-Pacific king mackerel 12 0.262 0.355 0.159 0.983 0.824
18 Scomberomorus commerson Narrowbarred Spanish mackerel 14 0.368 0.953 0.153 1.378 1.226
19 Gymnosarda unicolor Dogtooth tuna 10 0.342 0.456 0.216 1.518 1.302
20 Sarda orientalis striped bonito 6 0.543 1.048 0.200 0.179 1.592
21 Thunnus tonggol Longtail tuna 8 0.358 0.173 0.178 0.565 0.387
22 Auxis thazard thazard Frigate tuna 2 0.237 – 0.207 0.266 0.059
23 Euthymus affinis Kawakawa 5 0.289 – 0.226 0.322 0.096
Total 97 0.293 0.190 0.055 1.792 1.737
Demersal fish
Lutjanidae (24)
24 Lutjanus argentimaculatus Mangrove red snapper 3 0.856 – 0.317 0.950 0.633
25 Lutjanus gibbus Humpback red snapper 1 0.436 – – – –
26 Lutjanus sebae Emperor red snapper 11 0.334 0.516 0.173 1.810 1.637
27 Lutjanus malabaricus Malabar blood snapper 5 0.413 0.366 0.290 0.723 0.433
28 Lutjanus russellii John’s snapper 4 1.366 – – – –
Total 24 0.465 0.566 0.173 2.666 2.493
Latidae (15)
29 Lates calcarifer Giant sea perch 11 0.537 0.436 0.255 1.408 1.153
30 Psammoperca waigiensis Waigeu sea perch 4 0.532 0.165 0.398 0.601 0.203
Total 15 0.537 0.267 0.255 1.408 1.153
Dasyatidae (25)
31 Himantura gerrardi Sharpnose stingray 10 0.384 0.741 0.206 1.432 1.226
32 Neotrygon kuhlii Bluespotted stingray 7 0.492 1.251 0.226 2.537 2.311
33 Dasyatis zugei Pale-edged stingray 5 0.548 0.509 0.233 0.905 0.672
34 Himantura uarnak Honeycomb stingray 3 0.425 – 0.204 2.517 2.313
Total 25 0.492 0.740 0.204 2.537 2.333
Sciaenidae (25)
Environ Sci Pollut Res (2015) 22:3672–3686 3679

mercury, and 1 % had high levels. Only 1 % or three samplesof bluespotted stingray (Neotrygon kuhlii), honeycomb sting-ray (Himantura uarnak), and John’s snapper (Lutjanus ruselli)had very high mercury levels. The latter two samplesexceeded the guidelines of 0.5 mg/kg. However, consideringthat 95 % or more of total mercury in the edible portions offish and other seafood is in the form of methylmercury (Liet al. 2009; Khaniki et al. 2005), only one sample (medianmercury level in Lutjanus ruselli, 0.5012 mg/kg) exceeded theguidelines. None of the samples exceeded the guidelines if theratio of methylmercury to total mercury ranged from 70 to83 % were considered (Hajeb et al. 2010).
Based on the five categories, this study has also identifiedfew samples of fish with high mercury levels, two samples oftuna (S. orientalis and Gymnosarda unicolor) and one sampleof yellowstripe scad (Selaroides leptolepis). For mediumlevels, one sample of snapper (Lutjanus sebae), four samplesof narrow-barred Spanish mackerel (Scomberomoruscommerson), one sample of barramundi (Lates calcarifer),two samples of stingray (Himantura gerrardi and Neotrygonkuhlii), two samples of tuna (G. unicolor and S. orientalis),and one sample of each thread-fin bream (N. nematophorus)and soldier croaker (S. orientalis).
Discussion
The present study provides data on total mercury levels inmarine fish tissue sampled from both the fish landing ports
and the wholesale wet markets throughout Peninsular Malay-sia. This study has several advantages whereby mercury wasdetermined in a wide range of fish species (46 marine fishspecies) captured from the different geographical areas overdifferent periods, with three visits for each sampling locationwithin a 6-month time (from June to December 2009). Severalinteresting findings can be reached from this study: The dataindicated that mercury levels differed significantly among thedifferent families and species of fish. It also showed thatmercury were found to be significantly higher in omnivorousand carnivorous food feeding fish compared to the herbivo-rous. The mercury levels were also significantly higher indemersal fish when compared to the pelagic fish. Fish cap-tured from highly anthropogenic activity areas showed highermercury level, and positive correlation were shown betweenmercury concentrations with fish size. Each of these factorswas discussed below.
The results from this study concurred with other Malaysianstudies (Table 5), in that most of the mercury levels in differentspecies of fish were lower than the national and internationalpermissible limits. Hajeb et al. (2009) reported comparableresults of mercury levels in Indo-Pacific mackerel (0.45±0.056 μg/g dry weight (DW)), black pomfret (0.13±0.15 μg/g DW), and longtail tuna (0.5±0.71 μg/g DW) ascompared to this study. However, they reported lower mercurylevels for narrow-barred Spanish mackerel (0.04±0.02 μg/gDW), giant perch (0.10±0.06 μg/g DW), and sardines (0.00±0.02 μg/g DW). Later, they reported extremely higher mercu-ry levels in Rastrelliger brachysoma (0.229–0.778 μg/gWW)
Table 3 (continued)
No. Groups/family/species Common name Number Total mercury (mg/kg dry weight (DW))
Median IQR Min Max Range
35 Chrysochir aureus Reeve’s croaker 3 0.498 – 0.282 0.733 0.451
36 Otolithoides ruber Tigertooth croaker 6 0.421 0.423 0.283 0.775 0.492
37 Nibea soldado Soldier croaker 15 0.424 0.132 0.181 1.227 1.046
38 Otolithoides biauritus Bronze croaker 1 0.069 – – – –
Total 25 0.424 0.217 0.069 1.227 1.158
Nemipteridae (31)
39 Nemipterus bathybius Yellowbelly threadfin bream 6 0.383 0.328 0.263 0.753 0.490
40 Nemipterus japonicus Japanese threadfin bream 11 0.464 0.724 0.213 1.206 0.993
41 Nemipterus furcosus Forktail threadfin bream 3 0.642 – 0.371 0.918 0.547
42 Nemipterus thosaporni Threadfin bream 4 0.570 0.659 0.402 1.244 0.842
43 Nemipterus tambuloides Fivelined threadfin bream 2 0.426 – 0.397 0.454 0.057
44 Nemipterus nematophorus Doublewhip threadfin bream 2 1.211 – 0.858 1.563 0.704
45 Nemipterus marginatus Red filament threadfin bream 2 0.244 – 0.207 0.281 0.074
46 Nemipterus nemurus Redspine threadfin bream 1 0.298 – – – –
Total 31 0.454 0.459 0.207 1.563 1.356
Comparison of mercury levels for different fish species: χKW2 =109.596, p=0.000
IQR interquartile range
3680 Environ Sci Pollut Res (2015) 22:3672–3686

and Thunnus tonggol (0.225–0.914 μg/g WW) compared tothis study (Hajeb et al. 2010). Results from Kamaruzamanet al. (2011) showed that the mercury levels were ten timeslower in Nemipterus japonicas (0.012±0.008 μg/g DW),L. sebae (0.015±0.001 μg/g DW), and Otolithes ruber(0.017±0.003μg/g DW) compared to this current study. Alinaet al. (2012) reported much lower results of mercury levels in
Japanese threadfin bream (0.004–0.0065 μg/g wet weight(WW)), Malabar red snapper (0.0021–0.0054 μg/g WW),Spanish mackerel (0.002–0.0022 μg/g WW), and Indianmackerel (0.001–0.0011 μg/g WW). They also found thatthe mercury levels in pelagic fish were lower than the levelsin demersal fish. Mercury level in Nemipterus furcosus isrelatively higher in this study (0.642 μg/g DW), and the
Table 4 Comparison of mercurylevels in marine fish collectedfrom Peninsular Malaysia at dif-ferent factors
Kruskal-Wallis (KW) and Mann-Whitney (MW) U test wereapplied
IQR interquartile range
No. Factors Number Median (IQR) (χ2) p value
1 Habitats
Pelagic 170 0.292 (0.169) MW5401.0 (0.000)
Demersal 118 0.460 (0.414)
2 Feeding habits
Herbivorous 19 0.258 (0.118) KW7.787 (0.020)
Omnivorous 109 0.334 (0.322)
Carnivorous 160 0.354 (0.250)
3 Family group
Carangidae 79 0.291 (0.153) KW46.122 (0.000)
Scrombidae 91 0.293 (0.190)
Lutjanidae 22 0.465 (0.566)
Latidae 15 0.537 (0.267)
Dasyatidae 25 0.492 (0.740)
Sciaenidae 25 0.424 (0.217)
Nemipteridae 31 0.454 (0.459)
4 Origins
Local 231 0.332 (0.275) MW1863.0 (0.274)
Import 19 0.359 (0.237)
5 Coastal
West coast 97 0.330 (0.255) KW0.679 (0.712)
East coast 158 0.333 (0.272)
South 33 0.380 (0.481)
6 Sampling points
LKIM fish landing complexes 150 0.354 (0.298) MW10114.0 (0.738)
Wholesale wet market 138 0.334 (0.263)
7 Sampling locations
Selayang 25 0.295 (0.253) KW22.263 (0.014)
Klang 20 0.563 (0.509)
Kuala Pari 37 0.356 (0.292)
Bukit Mertajam 14 0.348 (0.156)
Kuala Perlis 29 0.306 (0.185)
Mergong 33 0.320 (0.188)
Kuala Besar 20 0.521 (0.415)
Pandan 33 0.380 (0.481)
Kuantan 36 0.301 (0.142)
Chendering 15 0.285 (0.142)
Pulau Kambing 26 0.321 (0.222)
8 Body length of fish
Body length <20 cm 92 0.311 (0.223) MW6642.0 (0.002)
Body length ≥20 cm 187 0.354 (0.306)
Environ Sci Pollut Res (2015) 22:3672–3686 3681

results are similar as reported by Agusa et al. (2007) (0.67 μg/g DW). They also reported similar results for Torpedo scad(0.21–0.27 μg/g DW) and bigeye scad (0.11–0.36 μg/g DW).None of these previous studies reported on the mercury levelsin N. nematophorus, whereas in this study, the level was
among the highest for family Nemipteridae. Nevertheless,only two samples were captured in this study (Table 3).
Total mercury median concentrations varied significantly(p<0.05) among different fish species tested. Mercury accu-mulates into fish tissue through the food chain whereby ittransfers between aquatic plants and aquatic animals, fromsediment, as well as from the water environments (Bidoneet al. 1997). Methylmercury is a major fraction of total mer-cury concentrations accumulated into fish tissue where itranges from 85 to 97 % (Bidone et al. 1997). Highest percent-age of mercury as methylmercury in ray species was found inmuscle tissue and accounting to nearly 100 % of mercurypresent as methylmercury (Horvat et al. 2014). The indirectbioaccumulation process is a phenomena in which a mercurysubstance accumulates into fish tissue based on its tropic levelin a food chain (Bidone et al. 1997). The variability of fishfood is based on their habitat, which may be demersal, bentho-pelagic, pelagic, bathy-demersal, and reef-associated with fishliving and feeding on or near coral reefs (Stergiou andKarpouzi 2005). Tropic level expresses the position of aspecies in the marine food web, and its estimation requiresknowledge of what each species feeds on and in what quan-tities (Stergiou and Karpouzi 2005). Briefly, mercury entersthe food chain via phytoplankton and then accumulated asmethylmercury by other links in the chain, via tropic transfer(Seixas et al. 2013).
Carnivorous species are placed at higher tropic level thannon-carnivorous species in a food chain (Bidone et al. 1997;Stergiou and Karpouzi 2005). These groups of fish live andfeed in the open sea and are associated with the surface ormiddle depths of a body of water; they are free-swimming inthe seas, oceans, or open waters, and they were not associatedwith the bottom (Stergiou and Karpouzi 2005). It is wellknown that mercury concentrations in carnivorous fish withhigher tropic level are higher than in herbivores, omnivores, orplanktivores (Burger et al. 2001; Burger and Gochfeld 2011;Liu et al. 2014). Yet, mercury concentration in top-levelpredators had the highest levels compared to the bottom-dwelling fish (Burger and Gochfeld 2011). Findings from this
Fig. 2 Relationship between total mercury levels (mg/kg dry weight),length, and weight of marine fish samples from Peninsular Malaysia
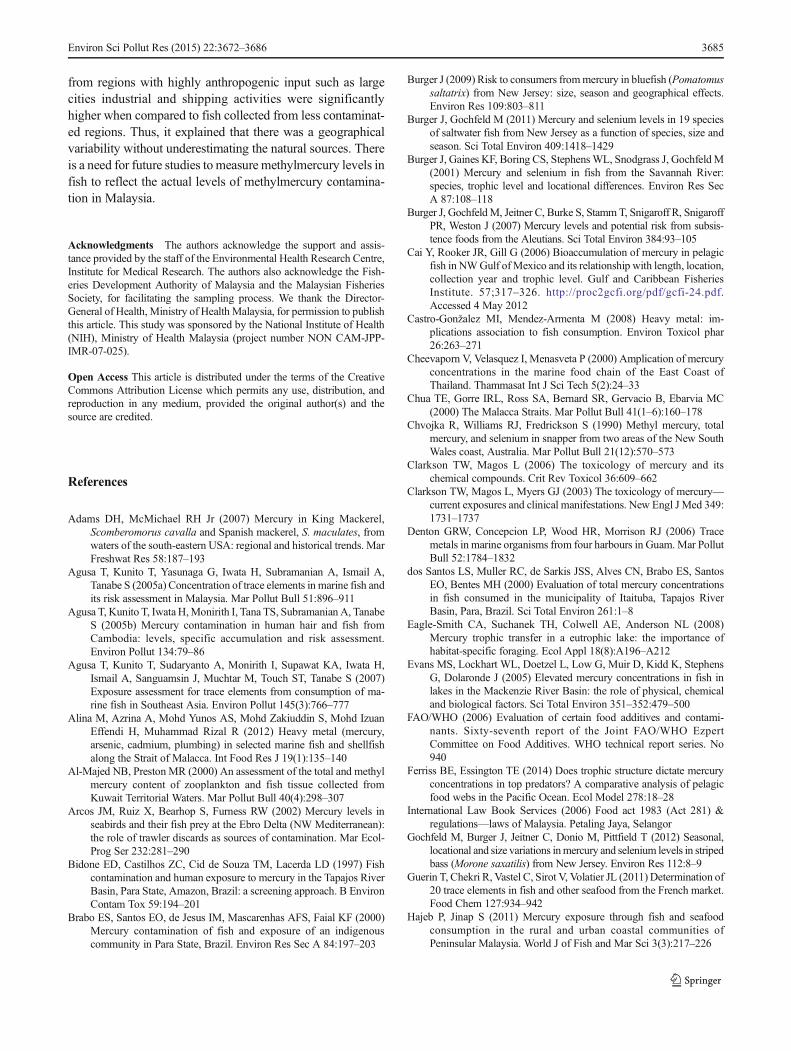
Fig. 3 The distribution of totalmercury in fish based oncategories by Chvojka et al.(1990) in their study: mercury insnapper from the New SouthWales Coast, Australia. Thesecategories were cited by Al-Majed and Preston (2000) in theirstudy of mercury content inzooplankton and fish tissuecollected from Kuwait TerritorialWaters
3682 Environ Sci Pollut Res (2015) 22:3672–3686

study explained this facts where mercury levels in carnivorousfish is more than 1.3 times higher as compared to the levels inherbivorous fish. Another study conducted at Tapajos Riverbasin in the Munduruku Reserve, Jacareacanga, Brazil,showed that the mean mercury concentrations in carnivorousfish (0.297 μg/g) was three times higher when compared tothe non-carnivorous species (0.095 μg/g) (Brabo et al. 2000).An earlier study conducted at the same river basin showed thedifferences of up to seven times between non-carnivorous andcarnivorous fish (Bidone et al. 1997). The differences wereeven more in fish captured from the municipality of Itaituba,Tapajos River Basin, Para, Brazil, where mercury concentra-tions in carnivorous fish ranged from 112.4 to 2,250 μg/gcompared to the detrivorous, herbivorous, and omnivorousthat ranged from 3.2 to 309.8 μg/g (dos Santos et al. 2000).Another study by Seixas et al. (2013) showed that the mud-eater iliophagous fish were the food items to the voraciouspredator, and they were also indirectly transmitted themethylmercury to this top predator. Ferriss et al. (2014) haddeveloped models that capable of exploring variations in theconcentrations of mercury in top pelagic predators relative tofood web structure and mercury input at the base of thesystem. The data from this study is consistent with thoseprevious studies where the mercury levels in fish with highertropic level were significantly higher than in fish with lowertropic level. Mercury accumulation through the food chainresulted in higher mercury concentrations in predator fishwhen compared to fish with lower tropic level.
Although tropic level correlations with mercury in fishhave been reported in many studies (Kinghorn et al. 2007;Evans et al. 2005; Burger et al. 2001; Brabo et al. 2000; dos
Santos et al. 2000; Burger and Gochfeld 2011), it was not theonly factor that affects mercury contamination in fish (Burgerand Gochfeld 2011). Another important factor for mercurycontamination in fish was found to be the bioaccumulationprocess based on its bioavailability, uptake, and toxicokinetics(Burger et al. 2001). Other additional recorded factors werephysiological differences between different fish species, mi-gration from unpolluted areas to relatively more polluted areas(Al-Majed and Preston 2000), total organic carbon, biologicactivity, pH, conductance, oxygen concentration, water tem-perature, water level, wetland runoff (Kinghorn et al. 2007),seasons, and habitat (Saei-Dehkordi et al. 2010).
The results for total mercury in demersal fish from thisstudy showed higher levels of mercury, of nearly two timesmore than in the pelagic fish. Among demersal fish, thehighest values corresponded to the smaller species(N. furcosus, Nemipterus thosaporni, N. nematophorus), largedemersal species (L. argentimaculatus, Lutjanus russelli), andbenthic species (Dasyatis zugei, H. uarnak). The benthicspecies exhibited high concentrations of mercury thanthose of pelagic species. This reflected the area varia-tions that may be due to the highest values of mercuryin the marine environment where high methylation ratesoccurred (Arcos et al. 2002; Joiris et al. 1999). Benthicspecies are more exposed to higher concentrations ofmethylmercury in the sediment (Al-Majed and Preston2000) and of their specific prey (Eagle-Smith et al.2008). Methylation processes are important in the sub-thermocline waters of the open ocean where low oxygenconditions favor those organisms that transform inorgan-ic mercury into organic forms (Arcos et al. 2002).
Table 5 Recent publications of mercury analysis in marine fish in Malaysia
Sampling locations Species and no. of samples Significant findings References
Retail outlet in Selangor and fishesoriginated from the South ChinaSea
A total of 69 marine fish samplesfrom 12 different species
Thunnus tonggol (0.5 μg/g DW) and Rastrelligerbrachsoma (0.45 μg/g DW) had the highest levelof mercury compared to other species.
Hajeb et al. (2009)
Fishermen boat at fish landings inKuantan, Chendering, and KualaPerlis
A total of 69 samples ofshort-bodied mackerel andlongtail tuna
Total mercury in all samples ranged from 0.180 to1.460 μg/g DW. Samples of both species fromeast coast showed higher levels compared to thewest coast.
Hajeb et al. (2010)
Local LKIM fish market from Johor,Melaka, and Negeri Sembilan
A total of 162 demersal marinefish from five species
Range of Hg in muscle tissue were between 0.012and 0.019 μg/g DW
Kamaruzamanet al. (2011)
Ten identified fish landing areasalong the Strait of Malacca
A total of 60 marine fish from12 species of most popularand preferred by local consumers
Hg levels in demersal fish ranging from 0.0017 to0.0065 ppm WW. In pelagic fish the range wasbetween 0.001 and 0.0065 ppm. None of thesamples exceeded the permitted levels.
Alina et al. (2012)
Cabang Tiga Kelantan, KualaTerengganu, Mersing, ParitJawa, Port Dickson, and Langkawi
A total of 102 samples from 13species of marine fish
Mercury levels in fish muscle ranged from less than0.05 to 0.67 μg/g DW. The highest Hg wasdetermined in Fork-tailed threadfin bream andbigeye scads.
Agusa et al.(2007)
Pulau Tuba, Langkawi A total of 76 marine fish samplesfrom eight different species
Mercury levels in fish were very much lowercompared to the permissible limits set by the FAO/WHO in 1984, ranging from 0.02 to 0.08 ppm DW
Irwandi andFarida (2009)
Environ Sci Pollut Res (2015) 22:3672–3686 3683

In addition to natural inputs, local pollution in the areaswhere the fish were captured could explain the concentrationsof mercury for this study. Most of the fish samples in thisstudy were of local origin, and they were mainly harvestedfrom the South China Sea and the Strait of Malacca. Thecountries surrounding the South China Sea are among themost densely populated, fastest growing and until 1997, themost vibrant economies on earth. There would have beenintroduced wastes from large cities (sewage, industrial waste,and hydrocarbons) and agricultural runoff (nutrients, pesti-cides and sediment) into the sea (Morton and Blackmore2001). Besides, the Strait of Malacca contained wastedischarged from both land-based and sea-based sources (Chuaet al. 2000). For example, this is the area where vesselsoperate, also hustles of activities from gas platforms activitiesas well as a consequence of accidents. High concentrations ofheavy metal were reported in the waters off the southern coastof Singapore and near petroleum refineries, and it was alsodetected in bottom sediment, especially in areas experiencingheavy shipping traffic (Chua et al. 2000).
In this study, with mercury contamination being higher infish samples collected from Port Klang, Selangor, it wouldreflect urban contamination from the large cities of KualaLumpur and Shah Alam, Selangor, and also from shippingactivities around Port Klang itself. Mercury contamination infish collected from Pandan Johor would have been a result ofurban activities of Johor Bahru, as well as from the nearbyKeppel Harbour and the main port of Singapore (Chua et al.2000). For Kuala Besar, Kelantan, which is situated at the eastcoast of Peninsular Malaysia, higher mercury contaminationwas a result of pollution from anthropogenic activities in theSouth China Sea coastal waters (Liu et al. 2014), oil wellactivities in the surrounding area, petroleum refineries, andoil tanker movements (Morton and Blackmore 2001). Re-suspension and deposition of dissolved and particulate matterby rain were also major sources of metal pollution in Asianmarginal seas (Macdonald et al. 2002; Liu et al. 2014). Un-derstanding the migration patterns and origins of fish are alsoimportant factors as the seasonal variation in mercury proba-bly reflects movements of fish of various sources and sizes(Gochfeld et al. 2012). It would seem that a combination of theseveral factors listed here were responsible for the differencesof mercury body burdens between the different species of fishin this study.
A positive relationship between total mercury levels andfish size were often observed indicating that mercury levelstend to increase over time during the growth of the fish(Burger et al. 2001, 2007; Cai et al. 2006; Adams andMcMichael 2007; Burger 2009; Burger and Gochfeld 2011;Gochfeld et al. 2012; Seixas et al. 2013; Horvat et al. 2014). Inthis study, a positive relationship between mercury contentand weight was more apparent than when compared to the fishlength. These relationships are influenced by the relatively
slow rate of mercury eliminated when compared to the rate ofits accumulation in fish tissues (Adams and McMichael2007).Mercury elimination rates for fish tend to decrease withincreasing fish body size (Adams and McMichael 2007) aselimination rate is negatively correlated with size (Trudel andRasmussen 1997). Larger fish usually are older and have hadlonger time to accumulate mercury (Gochfeld et al. 2012)from their environment. Moreover, they may eat larger preyand varieties of other species of prey that are already highlycontaminated with mercury (Adams and McMichael 2007;Gochfeld et al. 2012). Length (Weis 2004; Kinghorn et al.2007; Li et al. 2009) and weight (Al-Majed and Preston 2000)were used as standard indicators of fish age and were usuallyused as proxy measurements for age as it was easy to deter-mine in the field (Kinghorn et al. 2007). As a result, in older orlonger or bigger fish, mercury concentration was expected toincrease unless elimination took place and/or the fishmigratedfrom the polluted area to a relatively less or unpolluted area.
The results of this study will contribute toward the baselinedata and information on mercury concentration in marine fishthat are commonly consumed in Peninsular Malaysia. Thisstudy has identified lower mercury levels in marine fish ac-cording to the guidelines; thus, commercial marine fish fromPeninsular Malaysia is considered safe for human consump-tion. It would be appropriate to note that the risk frommercurycontaminations could still have an impact on human health iffish were to be consumed in excessive amounts. This isespecially so when one refers to the fish species found to havemedium to very high levels of mercury contamination; hence,these data would be invaluable as it would provide usefulinformation for assessment of potential health risks frommercury contamination in the populations of PeninsularMalaysia.
Conclusion
This study evaluated mercury concentrations in 46 species ofcommonly consumed marine fish sampled from fish landingports and wholesale markets in Peninsular Malaysia. The dataprovided information and served as baseline reference forfuture studies concerning mercury contaminations in marinefish for the country. The edible portion of marine fishcontained mercury at low levels and were within the permis-sible limits by both national and international guidelines. Theresults from this study also showed that the total mercuryconcentration in marine fish was positively correlated withlength and weight, in that it reflected an accumulation ofmercury with time. In addition, the mercury concentrationswere found to be higher in carnivorous fish when compared tothe herbivorous. Mercury concentrations were also higher indemersal fish, especially the benthic species than their levelsin the pelagic species. Mercury concentration in fish collected
3684 Environ Sci Pollut Res (2015) 22:3672–3686
from regions with highly anthropogenic input such as largecities industrial and shipping activities were significantlyhigher when compared to fish collected from less contaminat-ed regions. Thus, it explained that there was a geographicalvariability without underestimating the natural sources. Thereis a need for future studies to measure methylmercury levels infish to reflect the actual levels of methylmercury contamina-tion in Malaysia.
Acknowledgments The authors acknowledge the support and assis-tance provided by the staff of the Environmental Health Research Centre,Institute for Medical Research. The authors also acknowledge the Fish-eries Development Authority of Malaysia and the Malaysian FisheriesSociety, for facilitating the sampling process. We thank the Director-General of Health, Ministry of Health Malaysia, for permission to publishthis article. This study was sponsored by the National Institute of Health(NIH), Ministry of Health Malaysia (project number NON CAM-JPP-IMR-07-025).
Open Access This article is distributed under the terms of the CreativeCommons Attribution License which permits any use, distribution, andreproduction in any medium, provided the original author(s) and thesource are credited.
References
Adams DH, McMichael RH Jr (2007) Mercury in King Mackerel,Scomberomorus cavalla and Spanish mackerel, S. maculates, fromwaters of the south-eastern USA: regional and historical trends. MarFreshwat Res 58:187–193
Agusa T, Kunito T, Yasunaga G, Iwata H, Subramanian A, Ismail A,Tanabe S (2005a) Concentration of trace elements in marine fish andits risk assessment in Malaysia. Mar Pollut Bull 51:896–911
Agusa T, Kunito T, Iwata H,Monirith I, Tana TS, Subramanian A, TanabeS (2005b) Mercury contamination in human hair and fish fromCambodia: levels, specific accumulation and risk assessment.Environ Pollut 134:79–86
Agusa T, Kunito T, Sudaryanto A, Monirith I, Supawat KA, Iwata H,Ismail A, Sanguamsin J, Muchtar M, Touch ST, Tanabe S (2007)Exposure assessment for trace elements from consumption of ma-rine fish in Southeast Asia. Environ Pollut 145(3):766–777
Alina M, Azrina A, Mohd Yunos AS, Mohd Zakiuddin S, Mohd IzuanEffendi H, Muhammad Rizal R (2012) Heavy metal (mercury,arsenic, cadmium, plumbing) in selected marine fish and shellfishalong the Strait of Malacca. Int Food Res J 19(1):135–140
Al-Majed NB, Preston MR (2000) An assessment of the total and methylmercury content of zooplankton and fish tissue collected fromKuwait Territorial Waters. Mar Pollut Bull 40(4):298–307
Arcos JM, Ruiz X, Bearhop S, Furness RW (2002) Mercury levels inseabirds and their fish prey at the Ebro Delta (NW Mediterranean):the role of trawler discards as sources of contamination. Mar Ecol-Prog Ser 232:281–290
Bidone ED, Castilhos ZC, Cid de Souza TM, Lacerda LD (1997) Fishcontamination and human exposure to mercury in the Tapajos RiverBasin, Para State, Amazon, Brazil: a screening approach. B EnvironContam Tox 59:194–201
Brabo ES, Santos EO, de Jesus IM, Mascarenhas AFS, Faial KF (2000)Mercury contamination of fish and exposure of an indigenouscommunity in Para State, Brazil. Environ Res Sec A 84:197–203
Burger J (2009) Risk to consumers frommercury in bluefish (Pomatomussaltatrix) from New Jersey: size, season and geographical effects.Environ Res 109:803–811
Burger J, Gochfeld M (2011) Mercury and selenium levels in 19 speciesof saltwater fish from New Jersey as a function of species, size andseason. Sci Total Environ 409:1418–1429
Burger J, Gaines KF, Boring CS, StephensWL, Snodgrass J, Gochfeld M(2001) Mercury and selenium in fish from the Savannah River:species, trophic level and locational differences. Environ Res SecA 87:108–118
Burger J, GochfeldM, Jeitner C, Burke S, StammT, Snigaroff R, SnigaroffPR, Weston J (2007) Mercury levels and potential risk from subsis-tence foods from the Aleutians. Sci Total Environ 384:93–105
Cai Y, Rooker JR, Gill G (2006) Bioaccumulation of mercury in pelagicfish in NWGulf ofMexico and its relationship with length, location,collection year and trophic level. Gulf and Caribbean FisheriesInstitute. 57;317–326. http://proc2gcfi.org/pdf/gcfi-24.pdf.Accessed 4 May 2012
Castro-Gonžalez MI, Mendez-Armenta M (2008) Heavy metal: im-plications association to fish consumption. Environ Toxicol phar26:263–271
Cheevaporn V, Velasquez I, Menasveta P (2000) Amplication of mercuryconcentrations in the marine food chain of the East Coast ofThailand. Thammasat Int J Sci Tech 5(2):24–33
Chua TE, Gorre IRL, Ross SA, Bernard SR, Gervacio B, Ebarvia MC(2000) The Malacca Straits. Mar Pollut Bull 41(1–6):160–178
Chvojka R, Williams RJ, Fredrickson S (1990) Methyl mercury, totalmercury, and selenium in snapper from two areas of the New SouthWales coast, Australia. Mar Pollut Bull 21(12):570–573
Clarkson TW, Magos L (2006) The toxicology of mercury and itschemical compounds. Crit Rev Toxicol 36:609–662
Clarkson TW, Magos L, Myers GJ (2003) The toxicology of mercury—current exposures and clinical manifestations. New Engl J Med 349:1731–1737
Denton GRW, Concepcion LP, Wood HR, Morrison RJ (2006) Tracemetals in marine organisms from four harbours in Guam.Mar PollutBull 52:1784–1832
dos Santos LS, Muller RC, de Sarkis JSS, Alves CN, Brabo ES, SantosEO, Bentes MH (2000) Evaluation of total mercury concentrationsin fish consumed in the municipality of Itaituba, Tapajos RiverBasin, Para, Brazil. Sci Total Environ 261:1–8
Eagle-Smith CA, Suchanek TH, Colwell AE, Anderson NL (2008)Mercury trophic transfer in a eutrophic lake: the importance ofhabitat-specific foraging. Ecol Appl 18(8):A196–A212
Evans MS, Lockhart WL, Doetzel L, Low G, Muir D, Kidd K, StephensG, Dolaronde J (2005) Elevated mercury concentrations in fish inlakes in the Mackenzie River Basin: the role of physical, chemicaland biological factors. Sci Total Environ 351–352:479–500
FAO/WHO (2006) Evaluation of certain food additives and contami-nants. Sixty-seventh report of the Joint FAO/WHO EzpertCommittee on Food Additives. WHO technical report series. No940
Ferriss BE, Essington TE (2014) Does trophic structure dictate mercuryconcentrations in top predators? A comparative analysis of pelagicfood webs in the Pacific Ocean. Ecol Model 278:18–28
International Law Book Services (2006) Food act 1983 (Act 281) ®ulations—laws of Malaysia. Petaling Jaya, Selangor
Gochfeld M, Burger J, Jeitner C, Donio M, Pittfield T (2012) Seasonal,locational and size variations inmercury and selenium levels in stripedbass (Morone saxatilis) from New Jersey. Environ Res 112:8–9
Guerin T, Chekri R, Vastel C, Sirot V, Volatier JL (2011) Determination of20 trace elements in fish and other seafood from the French market.Food Chem 127:934–942
Hajeb P, Jinap S (2011) Mercury exposure through fish and seafoodconsumption in the rural and urban coastal communities ofPeninsular Malaysia. World J of Fish and Mar Sci 3(3):217–226
Environ Sci Pollut Res (2015) 22:3672–3686 3685

Hajeb P, Jinap S, Ismail A, Fatimah AB, Jamilah B, Abdul Rahim M(2009) Assessment of mercury level in commonly consumedmarinefishes in Malaysia. Food Control 20:79–84
Hajeb P, Jinap S, Ahmad I (2010) Biomagnifications of mercury andmethylmercury in tuna and mackerel. Environ Monit Assess 171:205–217
Horvat M, Degenek N, Lipej L (2014) Trophic transfer and accumulationof mercury in ray species in coastal waters affected by historicmercury mining (Gulf of Trieste, Northern Adriatic Sea). EnvironSci Pollut R 21:4163–4176
Ikem A, Egiebor NO (2005) Assessment of trace elements in cannedfishes (mackerel, tuna, salmon, sardines and herrings) marketed inGeorgia and Alabama (United States of America). J Food ComposAnal 18:771–787
Ikemoto T, Tu NPC, Okuda N, Iwata A, Omori K, Tanabe S, Tuyen BC,Takeuchi I (2008) Biomagnification of trace elements in the aquaticfood web in theMekongDelta, South Vietnam using stable carbon andnitrogen isotope analysis. Arch Environ Contam Toxicol 54:504–515
Irwandi J, Farida O (2009) Mineral and heavy metal contents of marinefin fish in Langkawi Island, Malaysia. Int Food Res J 16:105–112
Joiris CR, Holsbeek L, Moatemri NL (1999) Total and methylmercury insardines Sardinella aurita and Sardina pilchardus from Tunisia.Mar Pollut Bull 38(3):188–192
Kamaruzaman BY, Rina Z, John BA, Jalal KCA (2011) Heavy metalaccumulation in commercial important fishes of South WestMalaysian Coast. Res J Environ Sci 1–8
Khaniki GRJ, Alli I, Nowroozi E, Nabizadeh R (2005) Mercury contam-ination in fish and public health aspects: a review. Pak J Nutr 4(5):276–281
Kinghorn A, Solomon P, Chan HM (2007) Temporal and spatial trends ormercury in fish collected in the English Wabigoon river system inOntario, Canada. Sci Total Environ 372:615–623
Larsen R, Eilertsen KE, Elvevoll EO (2011) Health benefits of marinefoods and ingredients. Biotechnol Adv 29:508–518
Li S, Zhou L, Wang H (2009) Feeding habits and habitats preferencesaffecting mercury bioaccumulation in 37 subtropical fish speciesfrom Wujiang River, China. Ecotoxicology 18:204–210
Liu L, Xu X, Yu S, Cheng H, Hong Y, Feng X (2014) Mercury pollutionin fish from South China Sea: levels, species-specific accumulationand possible sources. Environ Res 131:160–164
Macdonald RW, Morton B, Addison RF, Johannessen SC (2002) Marineenvironmental contaminant issues in the North Pacific: What are thedangers and how do we identify them? In: Perry RI, Livingston P,Bychkov AS (eds) Pices science: the first ten years and a look to thefuture. Pices Scientific Report No. 22. http://pices.int/publications/scientific_reports/Report22/Macdonald.pdf.
McManus A, Feilder L, Newton W, White J (2011) Health benefits ofseafood for men. J Men’s Health 8(4):252–257
Mendil D, Demirci Z, Tuzen M, Soylak M (2010) Seasonal investigationof trace element contents in commercially valuable fish species fromthe black sea, Turkey. Food Chem Toxicol 48:865–870
Mohd Fairulnizal MN, Tumijah AH, Zakiah I (1998) Determination ofmercury in urine by on-line digestion with a flow injection mercurysystem. Atom Spectrosc 19(3):95–99
Mok WJ, Senoo S, Itoh T, Tsukamasa Y, Kawasaki K, Ando M (2012)Assessment of concentrations toxic elements in aquaculture foodproducts in Malaysia. Food Chem 133:1326–1332
MorganoMA, Rabonato LC, Milani RF, Miyagusku L, Balian SC (2011)Assessment of trace elements in fishes of Japanese foods marketedin Sao Paulo (Brazil). Food Control 22:778–785
Morton B, Blackmore G (2001) South China Sea.Mar Pollut Bull 42(12):1236–1263
Murphy TP, Irvine KN, Sampson M, Guo J, Parr T (2008) Mercurycontamination along the Mekong River, Cambodia. Asian J WaterEnviron Pollut 6(1):1–9
Myers GJ, Davidson PW (2000) Does methylmercury have a role incausing development disabilities in children? Environ Health Persp108(3):413–420
Myers GJ, Davidson PW, Cox C, Shamlaye C, Cernichiari E, ClarksonTW (2000) Twenty-seven years studying the human neurotoxicityof methylmercury exposure. Environ Res 83A:275–285
Norimah AK, Safiah M, Jamal K, Haslinda S, Zuhaida H, Rohida S,Fatimah S, Azlin S, Poh BK, Kandiah M, Zalilah MS, Wan MananWM, Fatimah S, Azmi MY (2008) Food consumption patterns:findings from the Malaysian adult nutrition survey (MANS). Mal JNutr 14(1):25–39
Nurnadia AA, Azrina A, Amin I (2011) Proximate compositionand energetic value of selected marine fish and shellfish fromthe West Coast of Peninsular Malaysia. Int Food Res J 18:137–148
Saei-Dehkordi SS, Fallah AA, Nematollahi A (2010) Arsenic and mer-cury in commercially valuable fish species from the Persian Gulf:influence of season and habitat. Food Chem Toxicol 48:2945–2950
Seixas TG, Moreira I, Malm O, Kehrig HA (2013) Ecological andbiological determinants of methylmercury accumulation in tropicalcoastal fish. Environ Sci Pollut R 20:1142–1150
Soegianto A, Moehammadi N, Irawan B, Affandi M, Hamami (2010)Mercury concentrations in edible species harvested from GresikCoast, Indonesia and its health risk assessment. Cah Biol Mar51:1–8
Sompongchaiyakul P, Hantow J, Sornkrut S, Sumontha M, JayasingheRPPK (2011) An assessment of mercury concentration in fish tis-sues caught from three compartments of the Bay of Bengal. In:Harper S, O’Meara D, Booth S, Zeller D, Pauly D (eds) Fisheriescatches for the Bay of Bengal large marine ecosystem since 1950,vol 16, Report to the Bay of Bengal large marine ecosystem project.BOBLME-2011-Ecology-., pp 221–232
Stergiou KI, Karpouzi VS (2002) Feeding habits and trophic levels ofMediterranean fish. Rev Fish Biol Fish 11:217–254
Stergiou KI, Karpouzi VK (2005) The trophic position of fishes inHellenic Marine Ecosystems. In: Papathanassiou E, Zenetos A(eds). State of the Hellenic marine environment, Hellenic Centerfor the Marine Research, Athens, Greece, p 280–284
Streets DG, Hao J, Wu Y, Jiang J, Chan M, Tian H, Feng X (2005)Anthropogenic mercury emissions in China. Atmos Environ 39:7789–7806
Tee ES, Mohd Ismail N, Mohd Nasir A, Khatijah I (1997) Nutrientcomposition of Malaysian foods, ASEAN sub-committee on pro-tein: food habits research and development. Institute for MedicalResearch, Kuala Lumpur
Tey YS, Shamsudin MN, Mohamed Z, Abdullah AM, Radam A (2008)Complete demand systems of food in Malaysia. Agr Econ – Czech10:467–475
Tollefson L, Cordle F (1986) Methylmercury in fish: a review of residuelevels, fish consumption and regulatory action in the United States.Environ Health Persp 68:203–208
Torpy JM (2006) Eating fish: health benefits and risks. J Amer MedAssoc 296(15):1926
TrudelM, Rasmussen JB (1997)Modelling the elimination ofmercury byfish. Environ Sci Technol 31:1716–1722
Turkmen A, Turkmen M, Tepe Y, Akyurt I (2005) Heavy metals in threecommercially valuable fish species from Iskenderun Bay, NorthernEast Mediterranean Sea Turkey. Food Chem 91:167–172
Weis IM (2004) Mercury concentrations in fish from Canadian GreatLakes areas of concern: an analysis of data from the Canadiandepartment of environment database. Environ Res 95:341–350
Yilmaz AB, Sangun MK, Yaglioglu D, Turan C (2010) Metals (major,essential to non-essential) composition of the different tissues ofthree demersal fish species from Iskenderun Bay, Turkey. FoodChem 123:410–415
3686 Environ Sci Pollut Res (2015) 22:3672–3686