Embed Size (px)
Citation preview

HAL Id: tel-00803208https://tel.archives-ouvertes.fr/tel-00803208v1
Submitted on 27 Mar 2013 (v1), last revised 30 Mar 2016 (v2)
HAL is a multi-disciplinary open accessarchive for the deposit and dissemination of sci-entific research documents, whether they are pub-lished or not. The documents may come fromteaching and research institutions in France orabroad, or from public or private research centers.
L’archive ouverte pluridisciplinaire HAL, estdestinée au dépôt et à la diffusion de documentsscientifiques de niveau recherche, publiés ou non,émanant des établissements d’enseignement et derecherche français ou étrangers, des laboratoirespublics ou privés.
Contribution des parties aériennes et souterraines desplantes à la matière organique des sols évaluée à partir
de la dynamique des marqueurs des cutines et dessubérines
Mercédès Gonzalez Mendez-Millan
To cite this version:Mercédès Gonzalez Mendez-Millan. Contribution des parties aériennes et souterraines des plantes à lamatière organique des sols évaluée à partir de la dynamique des marqueurs des cutines et des subérines.Science des sols. Université Pierre et Marie Curie - Paris VI, 2007. Français. �NNT : 2007PA066476�.�tel-00803208v1�

1
THESE DE DOCTORAT DE
L’UNIVERSITE PIERRE ET MARIE CURIE
Spécialité
Terre solide et Enveloppes Superficielles
Présentée par
Mme Gonzalez Mendez-Millan Mercédès
Pour obtenir le grade de
DOCTEUR de L’UNIVERSITE PIERRE ET MARIE CURIE
Contribution des parties aériennes et souterraines des plantes
à la matière organique des sols
évaluée à partir de la dynamique des marqueurs
des cutines et des subérines
Soutenue le 13 décembre 2007
Devant le jury composé de :
Mme DERENNE Sylvie
M. AMBLÈS André
M. BARRIUSO Enrique
M. MARIOTTI André
M. CHEFETZ Benny
Mle. DIGNAC Marie-France
Directrice de thèse Rapporteur
Rapporteur
Examinateur
Examinateur
Examinateur

2

3
Résumé
La matière organique des sols (MOS) représente un réservoir majeur de carbone. Certaines
pratiques agricoles ont pour effet de minéraliser la MOS. Dans un système où les résidus de
cultures sont retournés au sol, la biomasse racinaire contribue plus à la MOS que les parties
aériennes, alors que la proportion de MO contenue dans les racines est plus faible. Afin de
mieux comprendre les processus de dégradation et/ou de stabilisation de la MOS, nous avons
choisi d’étudier dans une chronoséquence blé/maïs, la dynamique des marqueurs de deux
biopolyesters, les cutines et les subérines, spécifiques des parties aériennes et souterraines des
plantes. Le blé est une plante en C3 (13
C ≈ -28‰) alors que le maïs est une plante en C4 (13
C
≈ -12‰). Ce dispositif permet de suivre in situ, l’incorporation des marqueurs provenant du
maïs à la MOS, par mesure de leur 13
C dans le sol. Les marqueurs des cutines du maïs ne
sont pas ou peu incorporés à la MOS, alors que ceux des subérines du maïs le sont, lors des
six premières années de culture de maïs. Les marqueurs des cutines sont stabilisés dans le sol,
soit parce qu’ils appartiennent à un compartiment chimiquement réfractaire, soit parce qu’ils
sont protégés par la matrice du sol (protection physique, adsorption sur les minéraux). Les
marqueurs des subérines, présentent deux compartiments cinétiques, un rapidement
renouvelable, l’autre plus stable suivant les mécanismes de protections semblables à ceux des
cutines. En profondeur, la concentration des marqueurs des subérines des racines de maïs
augmente alors que celle des cutines diminue, indiquant que le changement de culture de blé à
maïs influence la dynamique de la MOS.
Mots clés : Cutine; Subérine; Matière Organique; Sol; Monomère; Marqueur; Blé; Maïs ;
Chronoséquence; Isotopie moléculaire; 13
C

4
Contribution of above and below ground plant biomass to soil organic
matter assessed by the dynamics of markers of the cutin and the suberin
Abstract
Soil organic matter (SOM) represents an important pool of carbon. In cropland soils, root
biomass organic matter (OM) is known to contribute in higher proportion to SOM than above
ground biomass OM, when plant biomass is returned to soil. To improve the knowledge on
degradation and / or stabilisation processes of SOM, we studied in a wheat/maize
chronosequence the fate of markers derived from cutin and suberin, which are specific
biopolyesters of above and below ground tissues.. The two cropping plants have different 13
C
contents. The analysis of the natural 13
C labelling of biopolyester markers in the two plants
and the soil allows following their incorporation into the SOM pool.
Incorporation rates of cutin and suberin markers display contrasted behaviour between the
two biopolyesters. Cutin monomers derived from maize plant are poorly incorporated into
SOM inferring that cutins added to the soil is promptly degraded and that monomers released
from soils samples arise from old C3 vegetation. The incorporation rates of the suberin
monomers in soils underlined the higher contribution of maize root biomass when compared
to wheat one. Stabilisation of suberin markers after 6 years of maize cropping suggested the
presence in soils of two kinetic pools for these compounds. The vegetation change from
wheat to maize influenced cutin and suberin concentrations in the deep soils. The higher
maize root density when compared to that of wheat roots lead to high incorporation of suberin
monomers deriving from maize root in all the soil profile. The lower concentration of cutin
markers at depth in the soil under maize when compared to the soil under wheat suggested
that cutins were degraded in deep soils, although we showed that they were stabilized in the
surface horizon.
Keywords: Cutin; Suberin; Soil organic matter, Monomer; Marker; Wheat; Maize;
Chronosequence, Molecular isotopes, 13
C
Cette thèse a été effectuée au sein du Laboratoire de Biogéochimie et Ecologie des
Milieux Continentaux. Bât. EGER, Campus INA-PG, INRA, 78850 Thiverval-Grignon

5
TABLE DES MATIERES
INTRODUCTION GENERALE……………………………………………………….……9
CHAPITRE 1 SYNTHESE BIBLIOGRAPHIQUE........................................................... 15
1.1 Contexte général de l’étude ......................................................................................... 17
1.1.1. Rôle de la matière organique dans les sols .................................................................. 17
1.1.2. Mécanismes responsables de la stabilisation des matières organiques dans les sols
………………………………………………………………………………... .......... 18
1.1.3. Origine des matières organiques dans les sols ............................................................ 19
1.1.4. Etudes de la composition chimique et de la dynamique des MOS ............................. 20
1.2 Les cutines et les subérines .......................................................................................... 23
1.2.1. Structure et composition ................................................................................................ 23
1.2.2. Méthodes d'analyses plantes/sols des cutines et des subérines………………..……..26
1.2.2.1. Isolement/Purification ............................................................................................. 26
1.2.2.2. Caractérisation des polyesters ................................................................................ 27
1.2.3. Cutines et subérines dans les plantes blé et maïs .......................................................... 28
1.2.4. Devenir des cutines et des subérines dans les sols ........................................................ 31
1.2.4.1. Contribution des cutines et des subérines à la MOS dans les sols ......................... 31
1.2.4.2. Etude de la dégradation de la cutine lors d'incubations ......................................... 34
1.2.4.3. . Réactivité des cutines vis-à-vis des polluants… .................................................... 34
1.3 Objectifs de l’étude ....................................................................................................... 35
CHAPITRE 2 MATERIELS ET METHODES ................................................................. 37
2.1. Site expérimental de l'étude .......................................................................................... 39
2.2. Echantillonnages des plantes et des sols ....................................................................... 39
2.2.1. Echantillonnage des plantes. ......................................................................................... 39
2.2.2. Echantillonnage des sols ............................................................................................... 40
2.2.2.1. Echantillonnage des sols en surfaces ...................................................................... 40
2.2.2.2. Caractéristiques des sols en surfaces étudiés ......................................................... 41
2.2.2.3. Echantillonnage des sols en profondeurs ................................................................ 41
2.2.2.4. Caractéristiques des sols étudiés en profondeur .................................................... 42
2.3. Protocoles d’analyse des biopolymères dans les plantes et les sols ............................ 42
2.3.1. Méthodes d’analyses testées sur les feuilles de maïs. ................................................... 42
2.3.1.1. Extraction des lipides libres……………………………………..…………………43
2.3.1.2. Oxydation à l’oxyde cuivrique (CuO) ..................................................................... 43
2.3.1.3. Transesterification (BF3 10%/MeOH) .................................................................... 43
2.3.1.4. Saponification (KOH 6%/MeOH) ........................................................................... 44
2.3.1.5. Dérivatisation des monomères. ............................................................................... 44

6
2.3.1.6. Identification des monomères .................................................................................. 44
2.3.1.7. Quatification………………...…..…………………………………………………44
2.3.1.8. Thermochemolyse/TMAH ........................................................................................ 45
2.3.2. Méthodes d'analyses des biopolyesters dans les plantes et les sols...……………. ...45
2.3.2.1. Extraction des lipides libres par ASE ..................................................................... 45
2.3.2.2. Saponification………………………………………………………………..…….45
2.3.2.3. Mesure de la signature isotopique des monomères ................................................ 46
CHAPITRE 3 COMPARAISON DE TROIS METHODES DE DEPOLYMERISATION
SUR DES FEUILLES DE MAÏS APPLICATION DE LA METHODE
SELECTIONNEE A UN SOL .............................................................................................. 47
3.1. Introduction .................................................................................................................... 49
3.2. Material and methods .................................................................................................... 52
3.2.1. Plant samples and pretreatment ..................................................................................... 52
3.2.2. Soil sampling and pretreatment ..................................................................................... 52
3.2.3. Saponification ................................................................................................................ 52
3.2.4. Transesterification ......................................................................................................... 52
3.2.5. CuO oxidation ............................................................................................................... 53
3.2.6. Derivatisation ................................................................................................................ 53
3.2.7. Indentification ............................................................................................................... 53
3.2.8. Quantification ................................................................................................................ 54
3.2.9. Thermochemolysis ........................................................................................................ 54
3.3. results and discussion ..................................................................................................... 55
3.3.1. Distribution of monomers from the three depolymerisation methods with maize leaves .
......................................................................................................................................55
3.3.1.1. Monomers specific for cutin .................................................................................... 55
3.3.1.2. Other aliphatic monomers recovered from depolymerisations ............................... 58
3.3.2. Comparison of methods ................................................................................................ 60
3.3.2.1. CuO oxidation vs. Saponification ............................................................................ 60
3.3.2.2. Saponification vs. transesterification ...................................................................... 61
3.3.2.3. Derivatisation procedure ........................................................................................ 63
3.3.2.4. Thermochemolysis/TMAH ....................................................................................... 64
3.3.3. Bound lipids released by saponification of a soil sample. ............................................ 66
3.3.3.1. Cutin-derived monomers ......................................................................................... 68
3.3.3.2. Other aliphatic compounds non specific for cutin .................................................. 69
3.4. Conclusion……………………………………………………………………………….71

7
CHAPITRE 4 COMPOSITION MONOMERIQUE ET SIGNATURE ISOTOPIQUE
DES CUTINES ET DES SUBÉRINES DANS LES FEUILLES, TIGES ET RACINES73
4.1. Introduction .................................................................................................................... 75
4.2. Material ans methods ..................................................................................................... 78
4.2.1. Sampling and preparation of plant samples .................................................................. 78
4.2.2. Saponification ................................................................................................................ 78
4.2.3. Derivatisation ................................................................................................................ 78
4.2.4. Identification ................................................................................................................. 78
4.2.5. Quantification ................................................................................................................ 79
4.2.6. Isotopic measurements .................................................................................................. 79
4.3.Results and discussion ..................................................................................................... 80
4.3.1. Monomeric composition of the biopolyesters in plants ................................................ 80
4.3.1.1. Carboxylic acids ...................................................................................................... 81
4.3.1.2. n-alcohols ................................................................................................................ 82
4.3.1.3. ω-hydroxy carboxylic acids..................................................................................... 82
4.3.1.4. α-hydroxy carboxylic acids ..................................................................................... 83
4.3.1.5. diacids ..................................................................................................................... 85
4.3.1.6. Mid-chain hydroxy acids ......................................................................................... 85
4.3.1.7. Distribution of mid-chain hydroxy monomerss in wheat leaves. ............................ 86
4.3.1.8. Distribution of mid-chain hydroxy monomers in maize leaves. .............................. 87
4.3.1.9. Mid-chain hydroxy monomerss released from maize and wheat roots. ................. 88
4.3.1.10. Distribution of mid-chain hydroxy monomers in maize and wheat stems. ............ 88
4.3.2. Specificity of the monomers and their possible use as biomarkers of below and
aboveground tissues. ............................................................................................................... 88
4.3.3. Isotopic composition ..................................................................................................... 89
4.3.3.1. 13
C depletion of biopolyesters compared to bulk organs ........................................ 90
4.3.3.2. 13C values of monomers released from plant organs ............................................ 90
4.4. Conclusion ....................................................................................................................... 94
CHAPITRE 5 DYNAMIQUES DES MONOMÈRES SPECIFIQUES DES CUTINES
ET DES SUBERINES DANS UN SOL AGRICOLE ......................................................... 95
5.1. Introduction .................................................................................................................... 97
5.2. Material and methods .................................................................................................... 99
5.2.1. Experimental site, sampling and sample preparation .................................................... 99
5.2.2. Saponification ................................................................................................................ 99
5.2.3. Derivatisation .............................................................................................................. 100
5.2.4. Identification ............................................................................................................... 100
5.2.5. Quantification .............................................................................................................. 100

8
5.2.6. Isotopic mesaesurements ............................................................................................. 101
5.3. Results and discussion .................................................................................................... 102
5.3.1. Comparison betxeen monomer inputs from plants with soil monomers distribution: 102
5.3.1.1 Specific root/shoot origin of the monomers present in soils .................................. 102
5.3.1.2. Relative distributions of monomers and classes of monomers from plants to soils:
selective preservation and/or degradation in soils. ........................................................... 108
5.3.2. Maize-derived monomers in soils after 6 and 12 year of maize cropping. ................. 109
5.3.2.1. Isotopic signature of monomers released from plants and soils ........................... 110
5.3.3.2. Incorporation of monomers specifics for roots and shoots polymers ................... 112
5.4. Conclusion ...................................................................................................................... 115
CHAPITRE 6 DYNAMIQUES DES CUTINES ET DES SUBERINES EN
PROFONDEUR LORS D’UN CHANGEMENT DE CULTURE BLE/MAÏS.............. 117
6.1. Introduction .................................................................................................................... 119
6.2. Résultats et discussions .................................................................................................. 121
6.2.1. Concentrations des monomères aliphatiques en profondeur dans les sols sous blé et sous
maïs. ................................................................................................................................... 121
6.2.1.1.Concentration des lipides liés totaux dans les sols sous blé et sous maïs
............................................................................................................................................ 121
6.2.1.2. Contribution des monomères spécifiques des racines à la MOS en profondeur .. 125
6.2.1.3. Contribution des monomères spécifiques des cutine à la MOS en profondeur .... 126
6.2.2. Mesures des signatures isotopiques des monomères spécifiques en profondeur. ....... 129
6.2.2.1. δ13
C des monomères spécifiques des subérines racinaires en profondeur. .......... 129
6.2.2.2. δ13
C des monomères spécifiques des cutines des parties aériennes en profondeur.
............................................................................................................................................ 130
6.3. Conclusion ...................................................................................................................... 131
CONCLUSION GENERALE ET PERSPECTIVES ....................................................... 133
REFERENCES .................................................................................................................... 137

9
INTRODUCTION GENERALE

10

11
Introduction générale
Cette thèse s’inscrit dans un ensemble de projets cherchant à identifier et à comprendre les
mécanismes de stockage du carbone, sous forme de matières organiques, dans les sols
cultivés. Les matières organiques du sol (MOS) sont étudiées, en raison de leur importance
agronomique et environnementale. En agronomie, la matière organique (MO) est une source
de nutriment pour les plantes et les microorganismes (Manlay et al., 2007). Elle permet aussi
une meilleure cohésion de la structure physique des sols et augmente la rétention d’eau (Jiao
et al., 2006). D’un point de vue environnemental, la MO contribue à la rétention de polluants,
évitant ainsi leur lessivage vers nappes phréatiques et cours d’eau. Une meilleure gestion des
stocks de carbone passe par une meilleure compréhension des processus de dégradation et de
stabilisation. Ces derniers sont encore mal connus en raison de leur complexité. Dans les sols,
les MOS proviennent essentiellement des résidus végétaux et des microorganismes présents et
représentent un stock de carbone 2 à 3 fois plus important que le carbone contenu dans
l’atmosphère et dans la biomasse végétale. Différents mécanismes permettent d’expliquer la
préservation des MO dans les sols : protection physique, protection physico-chimique et
récalcitrante chimique (Six et al., 2002). C’est l’action conjointe de ces mécanismes qui
détermine le temps de résidence des MO dans les sols (Sollins et al., 1996) et peut conduire à
leur préservation et au stockage de carbone sous forme organique à court, moyen et long
terme.
En raison de la complexité de leur structure, les MOS sont mal caractérisées au niveau
moléculaire (Gleixner, 2001; Kögel-Knabner, 2002). Cependant grâce à l’utilisation
croissante de nouvelles méthodes d’analyses chimiques de pointe pour l’études des MOS
(spectrométrie de masse, méthodes spectroscopiques…) la connaissance de la composition
chimique des MOS s’améliore (Gleixner, 2001; Gonzalez Perez et al., 2004; Hempfling et al.,
1988; Hempfling et al., 1986; Kögel-Knabner, 1997; Naafs et al., 2004; Nierop, 2001). Il reste
toutefois beaucoup de travaux à mener pour comprendre l’influence de la composition
chimique au niveau moléculaire sur les mécanismes de transformation qui conduisent les MO
fraîches apportées au sol à contribuer aux différents pools cinétiques de carbone du sol.
En effet, les mécanismes de dégradation/stabilisation des MOS pourraient agir différemment
en fonction de la nature des MO apportées aux sols. Ainsi les MO apportées par les racines
contribueraient de manière plus importante aux MOS que les MO de parties aériennes, alors
que cet apport en MO par les racines est plus faible que celui des feuilles et des tiges (Rasse et
al., 2005). Comprendre l’influence de l’origine aérienne ou souterraine des MO et leur

12
dynamique dans les sols permettrait de mieux comprendre les mécanismes de dégradation/
stabilisation qui agissent sur les résidus végétaux.
Dans le cadre de cette thèse, nous nous proposons de rechercher des marqueurs moléculaires
permettant de différencier l’origine aérienne ou souterraine des MOS et d’étudier leurs
dynamiques dans les sols. Nous rechercherons ces marqueurs au sein des cutines et subérines,
polymères d'origine végétale car elles sont à priori spécifiques respectivement des parties
aériennes et souterraines des plantes (Kolattukudy 1981). Nous suivrons la cinétique de
renouvellement de ces marqueurs spécifiques dans les sols. Les cutines et les subérines sont
des macromolécules insolubles et récalcitrantes chimiquement et biologiquement en raison de
leur structure macromoléculaire (de Leeuw et Largeau, 1993). Une bibliographie importante
existe sur l’étude de ces biopolymères dans les plantes, en raison de leurs propriétés
physiques, chimiques et biologiques exceptionnelles (Benitez et al., 2004a; Bernards, 2002;
Cordeiro et al., 1997; Dean and Kolattukudy, 1976; Dean and Kolattukudy, 1977; Espelie et
al., 1980; Holloway, 1983; Kolattukudy, 1984; Kolattukudy and Dean, 1974; Riederer and
Schonherr, 1988; Schmidt and Schönherr, 1982; Zeier and Schreiber, 1998). Dans les
sédiments, les monomères spécifiques de la cutine sont utilisés comme marqueur des plantes
supérieures (Cardoso and Eglinton, 1975, 1983; Goñi and Hedges, 1990b, 1990c). Enfin, dans
les sols, les cutines et les subérines sont très étudiées car elles contribuent de manière
importante à la MOS (Kögel-Knabner, 2002; Kögel-Knabner et al., 1989; Nierop et al., 2003;
Otto et al., 2005; Riederer et al., 1993; Rumpel et al., 2004). Cependant, à notre connaissance,
aucune étude n’a été menée sur la dynamique des cutines et des subérines dans les sols.
Les méthodes utilisant l’isotope stable du carbone, le 13
C, sont des outils de choix pour
étudier la dynamique des MO dans les sols. Dans les sols, les processus de transformation des
résidus végétaux n’introduisent qu’une très faible variation du rapport 13
C/12
C, ce qui signifie
que les MOS possèdent un rapport isotopique proche de celui de la végétation qui y pousse
(Mariotti, 1991). Les plantes en C3 et C4 possèdent des signatures isotopiques différentes
(Smith and Epstein, 1971), et permettent de suivre la dynamique de MO dans les sols
(Balesdent et Mariotti, 1996). Nous utiliserons un champ expérimental de l’INRA de
Versailles utilisant une chronoséquence blé (C3) / maïs (C4) pour suivre in situ l’incorporation
dans les sols des marqueurs spécifiques des deux biopolymères grâce à la mesure du rapport
13C/
12C.
Les objectifs de la thèse étaient d’identifier les monomères spécifiques des tiges, feuilles et
racines des plantes de maïs et de blé et de mesurer leur valeur isotopique dans les plantes et
dans les sols de la chronoséquence C3/C4 afin d’estimer leur dynamique de renouvellement
13
dans les sols. Pour mieux évaluer l’impact des pratiques agricoles sur l’incorporation des
résidus végétaux aux MOS, nous avons également étudié ces deux biopolymères à différentes
profondeurs.
Nous avons divisé ce travail en six chapitres dont le premier est une revue bibliographique sur
les matières organiques dans les sols, leur composition et fonctions. Cette partie regroupe les
données bibliographiques sur la structure chimique des cutines et des subérines dans les
plantes et leurs contributions aux MOS. Un deuxième chapitre regroupe les caractéristiques su
site étudié, l’échantillonnage des sols et des plantes ainsi que les méthodes utilisées pour
l’étude des cutines et des subérines. A partir de la revue bibliographique, il est apparu que
plusieurs méthodes d’analyses étaient utilisées pour l’étude des biopolymères dans les plantes
comme dans les sols. Le chapitre 3 teste trois méthodes de dépolymérisation les plus
couramment utilisées pour l’étude des cutines et des subérines dans les plantes et dans les
sols, afin de sélectionner la méthode la plus sélective vis-à-vis des monomères
caractéristiques des biopolymères pour l’étude des polymères dans les plantes comme le maïs
et le blé et dans un sol agricole, où la concentration en carbone organique est faible. La
composition en monomères provenant de la dépolymérisation des trois parties (feuilles, tiges,
racines) des deux plantes (blé et maïs) étudiées ainsi que la signature isotopique de ces
monomères sont discutés dans le chapitre 4. L’objectif de ce chapitre est d’identifier les
monomères caractéristiques des parties aériennes et racinaires des plantes, en comparant
concentrations et distributions de monomères au sein de la plante et entre les plantes de blé et
de maïs. Le chapitre 5 est consacré à l’étude de la dynamique d’incorporation des monomères
provenant du maïs lors de la chronoséquence blé / maïs. Enfin, dans le dernier chapitre de
cette étude, nous nous sommes intéressés à la dynamique des cutines et des subérines en
profondeur dans deux sols de la chronoséquence.
Les résultats de ce travail sur les dynamiques des cutines et subérines dans les sols devraient
permettre de mieux comprendre les mécanismes de dégradation/stabilisation des parties
aériennes et souterraines des plantes et leur contribution au stockage de carbone. Ces
structures étant réactives vis-à-vis des micropolluants organiques, mieux connaître leur
dynamique dans les sols pourra aider aussi à mieux comprendre leur influence sur la
dynamique des polluants.

14

15
CHAPITRE 1
SYNTHESE BIBLIOGRAPHIQUE
ET
OBJECTIFS DE L’ETUDE

16
17
Synthèse bibliographique
1.1 Contexte général de l’étude
1.1.1. Rôle de la matière organique dans les sols
La matière organique des sols (MOS) est un élément essentiel au bon fonctionnement d’un
sol. En effet, quantité et composition chimique de la matière organique agissent sur les
propriétés physiques, chimiques et biologiques du sol (Pare et al., 1999). Des études montrent
que la cohésion structurale d’un sol est directement reliée à la quantité de MOS (Barral et al.,
2007). La cohésion d’un sol offre un meilleur support physique aux cultures et évite les
phénomènes d’érosions. La MOS influence les caractéristiques chimiques des sols (pH,
nutriments minéraux) et agit sur le devenir des polluants dans les sols (rétention, dégradation)
(Barriuso et al., 1996; Huang et al., 2003). De plus, la décomposition de la matière organique
dans les sols libère les éléments nutritifs essentiels pour les organismes vivants et les plantes
(Manlay et al., 2007). La MOS permet aussi une meilleure rétention de l’eau, rendant l’eau
ainsi que les nutriments qui y sont présents plus disponibles pour les plantes et les
microorganismes (Jiao et al., 2006).
De plus, la MOS est une forme de stockage de carbone dans les sols (Batjes, 1996) car la
MOS contenue dans les sols constitue un réservoir important de carbone (2 fois le stock de
CO2 atmosphérique et 3 fois celui de la végétation), sensible aux changements climatiques et
aux activités humaines. Dans le contexte actuel de réchauffement climatique, provoqué par
une augmentation du CO2 atmosphérique depuis plus d’un siècle due aux activités
anthropiques (combustion fossile, déforestation, etc…) (Eswaran et al., 1993; Bruce et al.,
1999; Amundson, 2001), mieux comprendre la dynamique de la MOS devient primordial
(Houghton, 1995).
Les pratiques culturales entraînent une augmentation de la minéralisation de la matière
organique dans les sols et donc une diminution des stocks de carbone (Lal, 2002). Afin de
lutter contre cette diminution de MOS, des actions sont mises en œuvre comme l’apport de
matière organique tel que le fumier ou le compost ainsi qu’une meilleure gestion des sols
(Robert et Saugier, 2003). L’apport de compost augmente significativement le carbone
organique présent dans le sol, stimule l’activité microbienne, et conduit à une amélioration
des rendements des cultures et des propriétés physiques du sol (Annabi, 2005 ; Moldes et al,
2007 ; Odlare et al, 2007). La mise en œuvre de pratiques agricoles favorisant le stockage de

18
carbone dans les sols sous forme de MOS devient un facteur primordial (Jean-Baptiste et
Ducroux, 2003). Pour cela, une meilleure compréhension de l’impact des MO provenant des
plantes cultivées sur la MOS et des processus de stabilisation et de dégradation subies par ces
MO fraîches dans les sols est nécessaire. En effet, c’est l’action conjointe des processus de
stabilisation et de dégradation des MO fraîches corrélées à leur nature chimique qui conduit
cette même MO à se stabiliser et à stocker du carbone sous forme organique dans les sols à
court, moyen et long terme (Six et Jastrow, 2002). De plus, les études menées sur la
dynamique des MOS dans les sols agricoles montrent des résultats très contrastés quant à
l’effet d’un changement de pratiques agricoles (labour, non labour, restitution des résidus de
cultures) sur l’accumulation ou la diminution des stocks de carbone. En effet, Campbell et al.,
(1991) rapportent que les stocks de carbone ne sont pas modifiés après 30 ans de restitution de
résidus de blé. De même, 13 ans de restitution des parties aériennes de maïs diminue les
stocks de carbone dans les sols lorsque ceux-ci sont comparés aux mêmes champs cultivés
sans incorporation de la biomasse aérienne (Clapp et al. 2000). D’autres études montrent que
la restitution ou la non-restitution de la biomasse aérienne de maïs sur 30 ans de culture n’a
pas d’impact sur les stocks de carbone des les sols (Reicosky et al. 2002).
Les processus conduisant à une préservation et/ou dégradation des MO initiales incorporées
dans le sol sont mal connus. Les modèles prédisant les dynamiques des MO dans les sols
distinguent trois compartiments ayant des cinétiques de dégradation variables : un premier
compartiment se dégradant rapidement (temps de résidence de l’ordre de l’année), un
compartiment ayant un temps de résidence moyen dans le sol (plusieurs dizaines d’années), et
un compartiment stable avec un temps de résidence de plusieurs centaines d’années. C’est ce
dernier compartiment qui est responsable du stockage de carbone à long terme (Six et
Jastrow, 2002). Par conséquent, une meilleure connaissance de ses processus conduisant à la
dégradation et/ou stabilisation des MO dans les sols permettrait de mieux gérer les stocks de
carbone dans les sols agricoles.
1.1.2. Mécanismes responsables de la stabilisation des matières organiques dans les sols
La stabilisation des MOS est complexe car elle fait appel à différents mécanismes (Six et al.,
2002):
- Les processus physiques (protection des MO dans les agrégats des sols)
- Les processus physico-chimiques (adsorption des MO sur les matrices minérales)
- Les processus chimiques (récalcitrance de certaines molécules)

19
- Les processus biologiques (biodégradation par les microorganismes qui induisent des
transformations des MO)
Ces différents mécanismes sont dépendants les uns des autres et c’est leur action conjointe qui
conduit à la stabilisation des MOS (Sollins et al., 1996).
D’autres conditions interviennent dans la stabilisation des MOS comme les facteurs
environnementaux (température, hydrologie…), la nature du sol ainsi que la nature de la
matière organique apportée aux sols. Tous ces processus de dégradation et de stabilisation des
MO changent les caractéristiques de la MO initiale par transformation, polycondensation
et/ou par préservation sélective de certains composés (Baldock et al., 2006; Gleixner, 2001;
Sollins et al., 1996). Les MOS forment par conséquent une matrice très complexe plus ou
moins différente des MO initiales selon le degré de dégradation.
Ces mécanismes agissent différemment sur les différentes molécules des plantes, qui peuvent
avoir des dynamiques contrastées (Gleixner, 2001; Six and Jastrow, 2002). Des études sur la
dynamique et les temps de renouvellement des acides carboxyliques libres (Wiesenberg et al.,
2004a), des lignines (Bahri et al., 2006), ou des sucres (Derrien et al., 2006) ont déjà été
menées. Il en résulte que des molécules comme les sucres représentent jusqu’à 10% du
carbone du sol, alors qu’elles sont facilement biodégradables, et que les lignines,
macromolécules considérées comme récalcitrantes chimiquement et biologiquement, se
dégradent relativement rapidement dans les sols. Au vu de toutes les études menées et des
efforts faits pour prédire le comportement des MOS, il semble nécessaire d’approfondir la
dynamique des MOS à l’échelle moléculaire. Comme les lignines, les cutines et les subérines
sont des macromolécules qui contribuent de manière importante à la MOS (Kögel-Knabner et
al., 1992a; Otto and Simpson, 2006; Riederer et al., 1993) mais n’ont pas fait l’objet, à notre
connaissance, d’étude sur leurs dynamiques.
1.1.3. Origine des matières organiques dans les sols
La matière organique des sols (MOS) est définie comme étant de la matière morte provenant
essentiellement des résidus végétaux et des microorganismes qui y sont présents. Les
végétaux sont majoritairement composés de polysaccharides (cellulose, hémicellulose) et de
lignine. On retrouve aussi des protéines, pigments, tannins, lipides, lignines, cutines et
subérines. Les microorganismes sont pour leur part majoritairement composés de
polysaccharides, de lipides et de protéines (Kögel-Knabner, 2002). Tous ces composés se
retrouvent dans les MOS à différents stades de dégradation, constituant une importante
20
réserve de carbone dans une matrice très complexe. Mieux connaître la composition des MO
initiales des végétaux et des microorganismes et leurs dynamiques dans les sols permettrait de
comprendre les processus de dégradation et stabilisation des MOS (Gleixner, 2001).
C’est en profondeur que l’on retrouve les MO les plus stables comme le montrent les profils
de datation au 14
C (O'Brein and Stout, 1978). Or, en profondeur, on constate une
augmentation de la teneur relative en chaînes aliphatiques qui peuvent représenter jusqu’à
40% du carbone organique total (Kögel-Knabner et al., 1992b; Nierop, 1998; Rumpel et al.,
2004). Ces structures aliphatiques ont deux origines possibles : soit elles proviennent des
composés sélectivement préservés de la biodégradation comme les cutanes et subéranes (Nip
et al., 1986; Tegelaar et al., 1989c; Augris et al., 1998) ou cutines et subérines (Kögel-
Knabner, 1992b). La contribution des composés aliphatiques dérivés des microorganismes et
des composés aliphatiques non-saponifiables tels que les cutanes et les subéranes aux MOS
stables serait faible (Kögel-Knabner et al., 1992a). Ces structures aliphatiques stables
pourraient aussi provenir de la polycondensation des composés aliphatiques dérivés des
plantes (Kögel-Knabner et al., 1992a; Riederer et al., 1993; Gupta et al., 2007a,b).
Des études ont montré que la contribution des racines aux MOS serait 2.4 fois plus importante
que celle des parties aériennes des plantes, bien que ces dernières représentent la majeure
partie de la biomasse incorporée dans les sols (Balesdent et Balabane, 1996, Rasse et al,
2005). Barber et al. (1979) et Hooker et al. (1982) ont montrés que la restitution au sol de la
biomasse aérienne des résidus de culture contribuait à l’augmentation de carbone organique
dans les sols. Toutefois, cette contribution est bien moindre que celle des parties racinaires.
La protection physique des racines par les agrégats ainsi qu’une récalcitrance à la
biodégradation de ses constituants seraient les causes majeures de la préservation de la MO
provenant de racines par rapport à celle provenant des parties aériennes des plantes (Rasse et
al., 2005). De plus les processus physicochimiques d’adsorption dans les matrices du sol des
exsudats racinaires ou de produits de dégradation des racines pourraient conduire à une
préservation de la MO provenant des racines vis à vis des microorganismes (Christensen,
1996).
1.1.4. Etudes de la composition chimique et de la dynamique des MOS
Les avancées des techniques d’analyse des matrices organiques complexes pendant ces vingt
dernières années ont permis de mieux comprendre le devenir des MO dans les sols ainsi que
les processus de dégradation et de stabilisation. On distingue les méthodes spectroscopiques

21
des méthodes d’analyses au niveau moléculaire, soit des produits extractibles comme les
lipides libres (Amblès et al., 1994; Quénéa et al., 2004), soit après dégradation chimique ou
thermique des MOS (Amblès et al., 1991, Gobe et al., 2000, Quénéa et al., 2005). De plus
l’analyse de l’isotope stable 13
C permet de suivre les cinétiques de renouvellement au
niveaux global ou moléculaire (Balesdent et Mariotti, 1996; Boutton, 1996; Mariotti, 1991,
Hayes et al., 1990).
Grâce à la RMN du 13
C (Résonance Magnétique Nucléaire du Carbone) et à l’IRTF
(Infrarouge à transformée de Fourier) par exemple, il est possible de caractériser les structures
et fonctions majoritaires des MOS et de suivre leur évolution au cours du temps parfois sans
étapes préalables d’extractions chimiques (Baldock et al., 2006; Gonzalez Perez et al., 2004;
Hempfling et al., 1986; Kögel-Knabner, 1997).
D’un point de vue moléculaire, la pyrolyse et la thermochemolyse couplées à la
chromatographie en phase gazeuse (CG) et à la spectrométrie de masse (MS) permettent
d’avoir des indications sur la composition moléculaire de macromolécules et leur provenance
(plantes ou microorganismes, produits de dégradation) (Capriel et al., 1990; Amblès et al.,
1993; Almendros et al., 1997; Clifford et al., 1995; Augris et al., 1998; Clausen et al., 1998;
Leinweber and Schulten, 1999; Nierop et al., 2001; Dorado et al., 2003) que ce soit sur les
substances humiques (Saiz-Jimenez and De Leeuw, 1985, 1987; Saiz-Jimenez, 1994; Fabbri
et al., 1996), ou la MO totale (Hempfling et Schulten, 1990; Leinweber et Schulten, 1995). La
thermochemolyse est surtout utilisée lorsque les macromolécules que l’on veut étudier
possèdent des unités polaires comme les lignines ou les subérines (Clifford et al., 1995;
McKinney et al., 1995; Nierop et al., 2003; Klingberg et al., 2005; Ohra-aho et al., 2005). En
effet, cette technique augmente la volatilité des composés polaires en méthylant les fonctions
les fonctions alcools ou acides. Ces molécules sont ainsi analysables en chromatographie en
phase gazeuse alors qu’elles n’auraient pas été détectées avec les techniques conventionnelles
de pyrolyse/CG/SM.
L’extraction par différents solvants permettent l’étude des lipides (Stevenson, 1966;
Morrison, 1969; Dinel et Schnitzer, 1990; Amblès et al., 1994; Quénéa et al.,2004;
Wiesenberg et al., 2004a,b). Les dégradations chimiques par oxydations ou hydrolyses
utilisant des produits chimiques plus ou moins agressifs agissant spécifiquement sur certaines
liaisons, et l’identification des produits de dégradation par CG-SM, ont aussi permis de mieux
caractériser la structure des MOS (Amblès et al, 1991; Kögel-Knabner, 1992a,b; Quénéa et
al., 2005).
Cependant, ces méthodes ne permettent pas de déterminer la contribution réelle aux MOS des

22
matières organiques fraîches apportées continuellement au sol.
L’analyse de l’abondance naturelle de l’isotope du carbone 13
C a été appliquée en science du
sol pour répondre à cette question. L’élément carbone a deux isotopes stables, le 12
C
(abondance naturelle de 98.9%) et le 13
C (abondance naturelle de 1.1%). Il existe chez les
plantes deux types de chemin photosynthétique, le cycle photosynthétique où le premier
produit formé après fixation du CO2 est composé de 3 carbones (plantes en C3) et celui où le
premier produit formé après fixation du CO2 est composé de 4 carbones (plantes en C4). Cette
différence de chemin de synthèse induit un fractionnement isotopique du CO2 assimilé par la
plante (Smith et Epstein, 1971). Ainsi les plantes en C4 sont enrichies en 13
C par rapport aux
plantes en C3. Le rapport isotopique 13
C/12
C est exprimé en 13
C par rapport à un standard
international, le VPDB (Vienna Pee Dee Beleenite) (équation 1):
1000)/(
)/( (‰)
1213
1213
13
VPDB
éch
CC
CCC équation1
Dans les sols, les processus de dégradation des résidus végétaux n’introduisent qu’une très
faible variation du rapport 13
C/12
C, ce qui signifie que la MOS possède un rapport isotopique
proche de celui de la végétation qui les recouvre. Lors de tout changement de végétation entre
des plantes C3 et C4, les MOS vont progressivement incorporer les MO des végétaux qui
poussent sur ce sol. Il est possible alors, de suivre in situ la variation du rapport isotopique de
la MOS et donc leur cinétique de renouvellement (Mariotti, 1991; Balesdent et Mariotti,
1996; Boutton, 1996). L’avancée la plus remarquable dans le domaine des isotopes stables du
C a été l’analyse isotopique moléculaire (Hayes et al., 1999). Elle permet de déterminer la
provenance des molécules (plantes C3 ou C4, microorganismes…) dans les sols et les
sédiments. Ainsi, la signature isotopique des biomarqueurs de plantes ou de microorganismes
dans les sédiments permet de reconstruire les paléoclimats (Hayes et al., 1999; Chikaraishi et
Naraoka, 2005; Dümig et al., 2007). Cet outil analytique est également utilisé dans les sols
agricoles pour estimer la dynamique des lipides (Wiesenberg et al., 2004a; Quénéa, et al.,
2006;), et pour modéliser les temps de résidence des lignines (Bahri et al., 2006) et des sucres
(Derrien et al., 2006).

23
1.2 Les cutines et les subérines
1.2.1. Structure et composition
Une bibliographie scientifique conséquente s'est intéressée à la composition chimique, et la
structure physique ainsi qu’à la synthèse des cutines et des subérines dans les plantes. On peut
classer ces études en deux catégories : celles qui étudient ces biopolymères dans une optique
botanique et physiologie végétale (structure, rôle dans la plante, synthèse, échanges…), et
celles qui s’intéressent au devenir de ces macromolécules dans le milieu naturel (dégradation,
contribution aux MOS, biomarqueurs des végétaux dans les sédiments). C'est pour la première
catégorie que l'on trouve le plus d'études.
La cutine
La cutine est un biopolymère amorphe qui, associé aux cires (mélange de différents lipides
aliphatiques, esters, acides gras, etc.) forme la cuticule (Kolattukudy et Walton, 1973). Elle
est constituée de monomères d’acides gras possédant une chaîne aliphatique de 16 ou 18
atomes de carbone. La chaîne aliphatique peut comporter une ou plusieurs fonctions alcools,
des insaturations, ou une fonction époxyde ( Hunneman et Eglinton, 1971; Holloway et al.,
1981; Kolattukudy, 1981). Ces monomères sont reliés entre eux par des fonctions ester (figure
1) pour former une macromolécule permettant de réguler l’eau dans la plante, mais aussi de
protéger la plante contre les agressions externes qu’elles soient physiques, chimiques ou
biologiques (Heredia, 2003).
Figure 1 : Représentation schématique de la cutine, d’après Kolattukudy (1981).

24
Les isomères les plus fréquemment identifiés dans la littérature pour la cutine sont indiqués
ci-dessous (d’après Kolattukudy 1981):
Outre ces acides gras hydroxylés, d'autres types de monomères peuvent être présents dans la
cutine. Kögel-Knabner et al. (1994) retrouvent des monomères phénoliques comparables à
ceux de la lignine dans la cuticule des aiguilles de sapins et estiment que ces monomères
représentent jusqu’à 17% en poids de la cuticule (w/w). Graça et al. (2002) ont mis en
évidence la présence de monomères de glycérol dans la cutine qui lui permettraient de se
structurer de façon tridimensionnelle.
La subérine
La subérine est un biopolymère structuré présent dans le périderme superficiel des organes
aériens et souterrains des plantes (les tiges et les racines). On retrouve aussi la subérine dans
la paroi des cellules des tissus internes spécialisés comme dans l’hypoderme (Barnabas, 1996)
et l’endoderme des racines et du xylem (Zeier et Schreiber, 1997) etc... Sa fonction principale
est de protéger la plante contre les agents pathogènes (bactéries, champignons) (Bernards,
2002). La subérine est constituée d’un domaine aromatique, composé de monomères
phénoliques, et d’un domaine aliphatique dit « lamellaire » (figure 2). Les monomères
phénoliques présents dans la subérine sont les mêmes que ceux retrouvés dans la lignine. Ils
sont constitués majoritairement des unités p-hydroxybenzaldéhyde, vanilline, acide vanillique,
acide p-coumarique, acide férulique et acide cafféique (Borg-Olivier et Monties, 1993; Negrel
et al., 1996; Bernards et Lewis, 1998; Bernards et Razem, 2001)

25
Figure 2 : Représentation schématique de la subérine, d’après Bernards (2002).
La partie aliphatique est constituée essentiellement de monomères d’acides gras, d’acides gras
ayant une fonction alcool en bout de chaîne, de diacides et d’alcools. Les longueurs des
chaînes aliphatiques de ces monomères, vont de 16 à 32 atomes de carbone (Kolattukudy,
1981; Holloway, 1983; Matzke and Riederer, 1991; Santos Bento et al., 2001). Les
monomères les plus fréquemment identifiés sont donnés ci-dessous (Kolattukudy, 1981) :
Plus récemment, des études ont montré la présence de « glycérols » comme monomères
constitutifs de la subérine (Moire et al., 1999) comme dans la cutine. Les proportions sont
faibles et varient d’une espèce à l'autre. Ces unités glycérol confèrent à la subérine sa
structure tridimensionnelle.
La composition en monomères des biopolymères cutines et subérines varie selon les espèces
et selon leur localisation au sein de la plante (Hunneman and Eglinton, 1971; Holloway, 1983;
Matzke and Riederer, 1991). Les facteurs environnementaux (eau, température…) influencent
aussi la composition monomérique des polymères (Zimmermann et al., 2000). Ces différences
26
ont conduit plusieurs chercheurs à essayer de différencier des grandes familles végétales en
fonction de la composition en monomères de leur cutine (Caldicott et Eglinton, 1976; Goñi
and Hedges, 1990b; Matzke et Riederer, 1991).
1.2.2. Méthodes d’analyses plantes/sols des cutines et subérines.
Les études des cutines et subérines dans les plantes et les sols utilisent indifféremment un
grand nombre de méthodes d’analyse. Il apparaît qu'il n’y pas de méthode standard d'analyse
des cutines et des subérines, que ce soit dans les plantes ou dans les sols. Cependant, il est
nécessaire de passer par des étapes clefs qui sont communes aux différents protocoles
analytiques utilisés dans la littérature.
1.2.2.1. Isolement/Purification
La première étape de préparation d’un échantillon de plante ou de sol est l’extraction des
lipides libres par différents solvants (dichlorométhane, chloroforme, méthanol…). En effet,
les cires, par exemple, contiennent des monomères communs avec ceux des cutines et des
subérines tel que les acides carboxyliques ou les acides carboxyliques ω-hydroxylés
(Kolattukudy et Walton, 1973). Il est nécessaire de les extraire afin d’éviter toute interférence
avec les monomères que l’on veut étudier.
Dans le cas des plantes, les biopolyesters peuvent ensuite être isolés par voie chimique ou
enzymatique. Par exemple l’élimination de la cellulose peut se faire par une hydrolyse acide
en présence de Chlorure de zinc (Caldicott et Eglinton, 1976). Mais cette hydrolyse modifie
les caractéristiques chimiques des biopolyesters et engendre une perte des monomères
insaturés de la cutine. La voie enzymatique est utilisée pour des plantes entières ou broyées.
Elle consiste à traiter le résidu végétal avec des enzymes, comme la cellulase, pectinase,
hemicellulase (Rocha et al., 2001). Cette étape d’isolement permet d’obtenir des polyesters
assez purs.
Dans le cas des sols, des hydrolyses acides successives permettent d’isoler les polyesters.
Elles consistent à éliminer le plus de substances tels que les carbohydrates ou les lignines afin
de simplifier les analyses et d’éviter les interférences avec d’autres composés. (Nip et al.,
1986; Kögel-Knabner et al., 1992a; Nierop et al., 2003).
27
1.2.2.2. Caractérisation des polyesters
Plusieurs techniques existent pour analyser les cutines et les subérines dans les plantes ou
dans les sols. On peut les regrouper en trois catégories : les méthodes spectroscopiques et
microscopiques, les méthodes de dégradation thermiques, ou chimiques.
La première catégorie regroupe les techniques qui renseignent sur la structure générale du
polyester (e.g. fonctions) dans la plante ou dans la MOS. Se sont des méthodes qualitatives et
en général non destructives. La RMN 13
C ou l’IR sont les techniques les plus utilisées pour
l’étude des polyesters dans les sols mais aussi dans les plantes (Fang et al., 2001; Kögel-
Knabner et al., 1992a). Dans les plantes, d’autres techniques comme la spectrométrie de
masse MALDI (Matrice Assisted Laser Desorption Ionisation), les mesures de la pression
osmotique, angles de contact etc…, sont utilisées pour caractériser la composition chimique et
les propriétés physiques des polyesters (Cordeiro et al., 1997; Cordeiro et al., 1998; Matas et
al., 2004). Certaines techniques spectroscopiques comme la RMN 1H, RMN
1H/
13C et IRFT,
après dépolymérisation partielle, permettent aussi d’identifier des fragments de polyester et de
déterminer les enchaînements de monomères (Fang et al., 2001; Ray et al., 1998; Ray et al.,
1998).
La thermochemolyse fait partie de la deuxième catégorie des techniques utilisées pour
l’analyse des polyesters. Elle s’applique aussi bien à l’étude des polyesters dans les plantes
qu’à leur contribution à la MOS (Nip et al., 1986; Tegelaar et al., 1989b,c; Kögel-Knabner et
al., 1992a; Bento et al., 1998; del Rio et Hatcher, 1998; Hermosin et Saiz-Jimenez, 1999;
Bento et al., 2001; Nierop, 2001; Gonzalez et al., 2003; Nierop et al., 2006;). Cette technique
permet d’identifier les monomères présents dans les plantes et dans les sols, mais reste
qualitative.
Enfin, la troisième catégorie des techniques utilisées pour l’étude des polyesters est la
dépolymérisation chimique. Ces méthodes sont les plus utilisées dans les sols comme dans les
plantes car elles permettent de séparer, identifier et quantifier les monomères constitutifs des
polymères. Cependant, chaque méthode, selon le réactif utilisé, peut conduire à une sous
estimation de certains monomères.
Il existe plusieurs techniques de dépolymérisation des polyesters communes aux plantes, aux
sols et aux sédiments :

28
la saponification avec NaOH ou KOH dans le méthanol (Cardoso et Eglinton, 1975; Nip
et al., 1986; Kögel-Knabner et al., 1992b; Ray et al., 1995; Naafs et Van Bergen, 2002;
Nierop et al., 2003;)
la transesterification par BF3 dans le méthanol (Riederer et Schonherr, 1988; Kögel-
Knabner et al., 1989; Matzke et Riederer, 1990, 1991; Franke et al., 2005; Otto et
Simpson, 2006; Riederer et al., 1993). La dépolymérisation par BF3/CH3OH a l’avantage
de méthyler les fonctions carboxyliques au fur et à mesure que les monomères sont
libérés.
l’hydrogénolyse par AlLiH4 (Kolattukudy et Walton, 1973; Espelie et Kolattukudy,
1979). L’hydrogénolyse pose des problèmes d’identification des monomères puisqu’elle
réduit les fonctions acides en fonctions alcools. L’identification des monomères natifs
nécessite de faire en parallèle une hydrogénolyse avec l’équivalent deutéré du réactif afin
de reconnaître les fonctions initialement carboxylées.
l’oxydation par l'oxyde cuivrique CuO (Dignac et Rumpel, 2006; Goñi et Hedges,
1990a,b,c; Rumpel et al., 2004).
la dépolymérisation enzymatique est aussi parfois utilisée sur les végétaux. Les
rendements de dépolymérisation sont de l’ordre de 10%, alors qu’avec les
dépolymérisations chimiques on peut atteindre au moins 80% (Ray et al., 1998).
Si toutes ces méthodes d’analyses permettent d’estimer la contribution aux MOS des
monomères provenant des cutines et des subérines, aucune ne peut suivre la dégradation de
ces polymères végétaux in situ dans les sols.
1.2.3. Cutines et subérines dans les plantes blé et maïs
En utilisant certaines des méthodes décrites ci-dessous, la composition monomérique des
cutines et des subérines dans différentes parties des plantes de blé et de maïs a déjà été
étudiée. Seule la composition des cutines dans les feuilles de blé et de maïs et des subérines
dans les racines de maïs ont été examinées. Les données de la bibliographie sont rassemblées
dans le tableau 1. La composition en monomères de la cutine des feuilles de blé est très
différente de celle identifiée dans les différents tissus de la feuille de maïs. La cutine des
feuilles de blé est composée majoritairement des monomères 9,10-epoxy,18-OH C18 (36,7%)
et x,16-DiOH C16 (21.45%). Dans les feuilles de maïs, les composés majoritaires sont les
acides ω-hydroxylés (32%) avec une forte contribution des monomères ω-OH C16 et ω-OH

29
C18 :1. Viennent ensuite les composés 9,10-epoxy,18-OH C18 (18.5%) et x,16-DiOH C16
(13.7%). Dans le maïs, les monomères en C16 et C18 polyhydroxylés (9,10-epoxy,18-OH C18 ,
x,16-DiOH C16 et 9,10,18-TriOH C18) ne sont retrouvés que dans les feuilles, alors que la
plupart des autres monomères ont été identifiés aussi bien dans les racines que dans les
feuilles. A notre connaissance, il n’y a aucune autre donnée sur les polymères présents dans
les tiges du blé ou du maïs ou dans les racines de blé.
Chaque étude, utilise une méthode de dépolymérisation chimique différente. Dans le cas de
l’étude de Maktze et Riederer, (1990), et de Zeier et al., (1999) la transesterification a été
utilisée pour la dépolymerisation des cutines et des subérines, alors que Espelie et
Kolattukudy (1979) ont utilisé l’hydrogénolyse.
Il est intéressant de noter que des monomères avec des chaînes aliphatiques supérieures à 18
atomes de carbone sont présents dans la cutine du blé comme celle du maïs. Dans les feuilles
de maïs, des tissus spécifiques contenant de la cutine existent en plus de la cutine présente
dans la cuticule. La composition monomérique des deux types de cutines présentes dans les
feuilles est différente (Espelie et Kolattukudy, 1979). Ce résultat suggère que la composition
en monomères des différents biopolyesters dans la plante est directement reliée à leur fonction
vis-à-vis du tissu auquel ils sont associés.
Dans les sols, les monomères communs aux différentes cutines ou subérines ne sont pas
différenciables. Les monomères polyhydroxylés en C16 ou C18 tels que les x,16-DiOH C16 et
le 9,10,18-TriOH C18 sont considérés comme étant spécifiques des parties aériennes des
plantes alors que les diacides seraient spécifiques des racines. Cependant, une étude sur la
composition monomérique de la subérine de racines de plusieurs espèces de plantes montre la
présence de monomères attribués aux cutines tel que le 7,16-DiOH C16 (Zeier et Schreiber
1998). D’autres composés comme les acides carboxyliques ou les alcools peuvent provenir
des cires cuticulaires ou des microorganismes (Otto et al. 2005). Il est donc nécessaire de
quantifier les monomères totaux provenant de l’ensemble des biopolyesters présents dans la
plante afin d’estimer l’incorporation des monomères issus de tous les biopolymères de la
plante dans les sols.

30
Tableau 1 : composition relative en monomères des cutines ou des subérines des différentes parties de plantes de
blé et de maïs données en pourcentage de la concentration totale en monomères. Les monomères sont regroupés
par familles de composés. Les abréviations correspondent à : ωOH acides = acides ω-hydroxylés, x,16-DiOH
C16 = acides hexadécanoïques dihydroxylés en position 16 et (x=7, 8, 9 ou/et10), 9,10,18-TriOH C18 = acide
9,10,18-trihydroxyoctadécanoïque, 9,10-epoxy,18-OH C18 = acide 9,10-époxy, 18-hydroxyoctadécanoïque. Cx
correspond au monomère identifié dans chaque famille avec x = nombre de carbone de la chaîne aliphatique.
(1) (Matzke and Riederer, 1990), (2) (Espelie and Kolattukudy, 1979), (3) (Zeier et al., 1999), la valeur donnée
ici est une moyenne calculée à partir des données sur la composition monomérique de différents tissus des
racines de maïs
Acides Diacides ωOH
acides
αOH
acides
x,16-
DiOH
C16
9,10,18-
TriOH
C18
9,10-
epoxy,18-
OH C18
Alcan-1-
ol
Cuticule
feuille de
blé (1)
26.5
(C18, C20
et C24)
- 2.2
(C16)
12
(C24)
21.45 - 36.7 -
Cuticule
feuille de
maïs (2)
1.7
(C16, C20
et C22)
1
(C18:1)
32.4
(C16 et
C18:1)
- 13.7 2.7 18.5 7.8
(C16, C17a
C19a C20
et C22
gaines
protectrices
dans les
feuilles de
maïs (2)
3.8
(de C20 à
C30)
7.2
(C16,
C18:1, C22
et C24)
23.1
(C16,
C18:1, C22
et C24)
- 19.6 6.0 4.6 22.7
(de C17a à
C30)
Racines de
maïs (3)
21
(de C16 à
C26)
23
(C16,
C18:1, C18,
C22 et
C24)
44
(de C16 à
C28)
9
(de C16 à
C26)
- - - 4
(C16, C18,
C20, C22,
C24)
1.2.4. Devenir des cutines et des subérines dans les sols
Les cutines et les subérines sont souvent étudiées dans les sols et les sédiments car leurs
monomères leur sont spécifiques et sont considérés comme des biomarqueurs des plantes
(Cardoso et Eglinton, 1975, 1983; Nip et al., 1986; Nierop et al., 2006;). En réalité, peu
d’études ont été menées sur leur dégradation et/ou stabilisation dans les sols. Seules quatre

31
études ont quantifié la contribution de la cutine et de la subérine à la MOS. Riederer et al.,
(1993) et Kögel-Knabner et al., (1989) ont étudié la contribution des biopolymères dans les
sols sous forêts. Otto et al., (2005) et Otto et Simpson (2006) ont réalisé le même type
d’études dans des sols sous forêts et sous prairies. La spécificité des monomères permet de
distinguer dans les sols les monomères provenant des cutines, et donc des parties aériennes de
plantes, des subérines, plus spécifiques des parties racinaires, et d’estimer la proportion de ces
deux biopolymères par rapport à la MOS ( Kögel-Knabner et al., 1989; Otto and Simpson,
2006). Une étude préliminaire a aussi été menée dans les sols cultivés (Dignac et Rumpel,
2006).
On distingue les études réalisées sur des échantillons prélevés sur le terrain et celles réalisées
après incubations.
1.2.4.1. Contribution des cutines et des subérines à la MOS
Dans les études de Riederer et al., (1993), Otto et al., (2005) et de Otto et Simpson (2006), six
classes de monomères aliphatiques sont identifiées dans les sols après dépolymerisation: les
acides carboxyliques, les ω-hydroxy acides, les alcan-1-ols, les acides α-hydroxylés, les
diacides, et les composés en C16 et C18 polyhydroxylés comme les acides x,16-DiOH C16.
Parmi ces familles, seuls les acides ω-hydroxylés, les diacides, et les composés en C16 et C18
polyhydroxylés sont spécifiques des cutines et des subérines dans les sols. L’étude de Kögel-
Knabner et al., (1989) ne porte que sur la concentration de quatre monomères , les acides
x,16-DiOH C16 (x=9 et 10), 9,10,18-TriOH C18, 9,10-epoxy,18-OH C18 et l’acide 18-
hydroxyoctadéc-9-ènoïque. Ces monomères, identifiés dans la litière, appartiennent soit à la
cutine des feuilles, soit à la subérine contenue dans les écorces des arbres soit au deux.
Trois études portent sur des sols sous forêt : Otto et Simpson (2006), étudient les sols de 0-10
cm et 10-25cm, Riederer et al., (1993) et Kögel-Knabner et al., (1989), étudient les sols par
horizons pédologiques, particuliers à chaque type de sols. L’étude de Otto et al., (2005) a été
réalisée dans un sol sous prairie.
Lorsque l’on considère les horizons minéraux (Ah), dans les études de sols sous forêt, l’étude
de Riederer et al., (1993), estime que la contribution des cutines et des subérines par rapport à
la quantité de carbone organique (Corg) est d’environ 5 à 70 mg g-1
Corg pour la cutine et de 12
à 120 mg g-1
Corg pour la subérine selon le type de sol. Lorsque l’on compare ces résultats à
l’étude menée par Otto et Simpson (2006) dans d’autres sols sous forêt, la somme des
monomères spécifiques des cutines est de 0.2 mg g-1
Corg et de 0.2 à 0.7 mg g-1
Corg pour les
subérines, soit de 10 à 100 fois plus faibles que dans l’étude de Riederer et al., (1993). Kögel-
32
Knabner et al., (1989), ont évalué la contribution des cutines et des subérines dans quatre
profils de sols sous forêt. La concentration totale des quatre monomères par rapport au
carbone organique total varie de 0.8 à 13.5 mg g-1
Corg pour l’horizon minéral. Si on calcule
pour l’horizon minéral la somme de ces quatre monomères pour les études de Riederer et al.,
(1993), et de Otto and Simpson (2006) on trouve des concentrations de l’ordre de 2.4 à 7 mg
g-1
Corg et de 1.6 à 2.1 mg g-1
Corg respectivement.
Dans les sols sous prairies, les concentrations en monomères spécifiques des cutines et des
subérines varient de 0.5 à 0.9 mg g-1
Corg pour les cutines et 4.5 à 0.6 mg g-1
Corg pour les
subérines (Otto et al., 2005) selon le type de sol.
Les études les plus intéressantes sur le devenir des polyesters sont celles qui concernent les
horizons profonds puisqu’elles montrent que la cutine et la subérine sont préservées dans ces
horizons (Kögel-Knabner et al., 1989; Riederer et al., 1993). Si leur concentration décroît
avec la profondeur, lorsque cette concentration est rapportée au carbone organique total, les
profils de concentration (g kg-1
Corg) indiquent qu’en profondeur, la contribution de ces
polyesters aux MOS augmente ou si elle n’augmente pas, reste importante (figure 3). De plus,
les profils de concentration des monomères de la cutine et de la subérine avec la profondeur
sont différents ce qui indique que les vitesses de décomposition ne sont pas identiques pour
les deux polymères

33
Figure 3 : Concentration des monomères des cutines et des subérines dans deux profils de sol sous forêt. D’après
Riederer et al., 1993
Les monomères de la subérine et la cutine sont des marqueurs fiables de la contribution des
parties aériennes et souterraines des plantes à la MOS et sont retrouvés en profondeur. Grâce
à la RMN et à la pyrolyse, Kögel-Knabner et al., (1992a) a montré que les monomères des
cutines et des subérines contribuent fortement au domaine aliphatique de la MOS. Avec la
profondeur, la concentration en monomères spécifiques de la subérine contribuent plus à la
MOS que ceux de la cutine, ce qui démontre que la contribution des racines à la MOS n’est
pas négligeable en accord avec d’autres publications (Balesdent et Balabane, 1996; Nierop et
Buurman, 1999; Nierop et al., 2003). Cette préservation peut être due à un apport continuel de
MO par les racines, ainsi qu’à une récalcitrance chimique et une protection physique de la
subérine qui est contenue à l’intérieur des tissus, contrairement à la cutine. Cependant la
présence des cutines et des subérines dans les horizons profonds et leur appartenance aux
MOS stables ne serait pas due qu’à leur récalcitrance chimique ou à une protection physique.
En effet dans les biopolymères il y aurait une augmentation des liaisons entre les chaînes
aliphatiques lors des transformations dans le sol modifiant leur structure et augmentant leur
résistance à la biodégradation (Tegelaar et al., 1990; Kögel-Knabner et al., 1992b).

34
1.2.4.2. Etude de la dégradation de la cutine lors d’incubations
Le suivi de la décomposition des cutines des feuilles in vivo et in vitro, a été réalisé et a
permis de déterminer des tendances générales quant à la dégradation de la cutine.
Ces expériences ont porté sur la dégradation de la cutine in vivo lors d’incubations d’épines
de sapin enfouies dans un sol sous forêt sur une période de 7 ans (Kögel-Knabner et al.,
1992a) et sur la dégradation de feuilles de Fagus sylvatica incubées en laboratoire sur une
période de 446 jours (Riederer et al., 1993).
Dans ces deux études, les auteurs estiment que la cutine et le Corg total ont des cinétiques de
dégradation similaires. Au bout des périodes entières d’incubation, la cutine s’est dégradée à
70% dans l’étude de Riederer et al., (1993) et à 80% dans l’étude de Kögel-Knabner et al.,
(1992a). La quantité de monomères de cutines dégradés est plus élevée que la quantité de
carbone organique total dégradé pour les deux études ce qui montre que la cutine n’est pas
sélectivement préservée dans les sols.
1.2.4.3. Réactivité des cutines vis-à-vis des polluants
Des études ont montré l’importance des cutines vis-à-vis de l’adsorption des hydrocarbures
aromatiques polycycliques (HAP), comme le phénanthrène, et d’hétérocycles comme la
triazine (herbicide) (Barriuso et al., 1996). Lors d’expériences d’incubations la cutine favorise
l’adsorption des polluants dans les sols et sa dégradation entraîne invariablement la
diminution de quantité de polluants adsorbés (Chefetz, 2007; Stimler et al., 2006).
L’adsorption des polluants est directement correlée à l’accessibilité des polluants aux sites
d’interactions (Chen et al., 2005), et à l’affinité des polluants sur les différentes fractions
cuticulaires (Chefetz, 2003). Une étude, a clairement déterminé que le pyrène s’adsorbe
lentement dans la cutine et migre vers l’intérieur du réseau cuticulaire, ce qui rend la
désorption plus difficile (Sachleben et al., 2004).

35
1.3 Objectifs de l’étude
L’objectif général de cette étude est d’estimer la dynamique de renouvellement des cutines et
des subérines, marqueurs spécifiques des parties aériennes et souterraines des plantes, dans les
sols agricoles et d’évaluer la contribution des racines vs les parties aériennes à la MOS afin de
mieux comprendre les processus conduisant à la stabilisation de la MOS. Pour mieux
comprendre les processus conduisant à la dégradation et/ou la stabilisation des résidus
végétaux dans les sols et de déterminer la contribution à la MOS des racines vs parties
aériennes nous avons choisi d’étudier les cutines et les subérines. Ce sont des biomarqueurs
spécifiques des parties aériennes et souterraines des plantes, présents dans tous les sols ainsi
que dans les sédiments (Cardoso et Eglinton, 1975; Goñi et Hedges, 1990b,c; de Leeuw et
Largeau, 1993; Riederer et al., 1993; Otto et Simpson, 2006). Le site expérimental utilisé pour
l’étude de ces macromolécules est une chronoséquence blé (C3) / maïs (C4). Le dispositif mis
en place nous permettra d’étudier la dynamique des cutines et des subérines dans le sol.
En raison de la diversité des méthodes d’analyse de ces biopolyesters dans les plantes et dans
les sols, la première partie de ce travail a consisté à tester les trois méthodes de
dépolymérisation les plus couramment utilisées pour l’étude des cutines et des subérines dans
les plantes et leur contribution à la MOS : l’oxydation à l’oxyde cuivrique (CuO), la
saponification (KOH 6%/MeOH) et la transesterification (BF3 10%/MeOH). La méthode
sélectionnée devait être sélective vis-à-vis des monomères spécifiques des biopolymères. Les
trois méthodes de dépolymérisation ont été testées sur des feuilles de maïs, d’une part, parce
que la cutine des feuilles contient plus de monomères spécifiques que les autres parties de la
plante, d’autre part, parce qu’elle a déjà été étudiée par Espelie et Kolattukudy, (1979). Cela
nous a permis d’avoir une première composition monomérique de la cutine et de la comparer
à nos propres résultats. En effet, la cutine présente une variété de monomères plus grande que
la subérine des racines avec notamment la présence des monomères polyhydroxylés comme
les acides dihydroxyhexadécanoïques et trihydroxyoctadécanoïques. Les critères de sélection
de la méthode de dépolymérisation sont (1) le rendement de dépolymérisation, (2) le nombre
de monomères identifiables et (3) la sélectivité de la séparation de chaque composé
permettant quantification et mesure de la signature isotopique.
Une fois la méthode sélectionnée, nous avons identifié et quantifié les monomères libérés par
dépolymérisation des racines, des tiges et des feuilles de blé et de maïs. Une connaissance
précise des monomères constitutifs des biopolymères présents dans les différentes parties des

36
deux plantes étudiées (blé et maïs) avant incorporation au sol est nécessaire afin de déterminer
quels marqueurs moléculaires seront viables pour l’étude de la dynamique des cutines et des
subérines dans les sols. L’objectif de cette partie est de déterminer la spécificité de chaque
monomère vis-à-vis des parties aériennes ou racinaires des plantes. Cette partie inclut les
mesures des signatures isotopiques des monomères et compare l’analyse des différences de
δ13
C mesurés entre les monomères des différents organes des deux plantes.
La troisième partie se focalise sur la provenance des monomères libérés par dépolymérisation
des sols (horizons de surface) et les rendements d’incorporation des monomères déterminés
comme étant spécifiques des cutines et des subérines grâce à la chronoséquence blé/maïs. Ces
résultats nous permettront d’évaluer la contribution in situ des parties aériennes et racinaires
aux MOS et la dynamique d’incorporation des monomères provenant du maïs aux MOS.
Enfin, dans une dernière partie, nous avons évalué quelle était la contribution de ces
monomères à la MOS en profondeur. En effet, c’est en profondeur que l’on retrouve les MO
les plus stabilisées.
37
CHAPITRE 2
MATÉRIELS ET MÉTHODES

38

39
Matériels et Méthodes
2.1 Site expérimental de l’étude
Le site expérimental « des Closeaux » a été mis au point à l’INRA de Versailles, près de
Paris, par Jérôme Balesdent, en 1993. Le site comporte 32 placettes de 6.4 m par 15 m,
cultivées sous blé ou ayant recouverte par une végétation en C3 avant le début de l’expérience
(figure 1). Depuis 1993, chaque année, trois parcelles cultivées initialement en blé sont
cultivées en maïs. Quatre parcelles témoins continuent à être cultivées en blé.
Figure 1 : Schéma du dispositif expérimental du Site des Closeaux à l’INRA de Versailles. *= nombre d’années
de culture de maïs
Deux campagnes de prélèvements en 2002 et 2005 nous ont permit d’avoir des sols de 0 à 12
ans de culture sous maïs.
2.2. Echantillonnages des plantes et des sols
2.2.1. Echantillonnage des plantes.
Les plantes de blé et de maïs ont été échantillonnées juste avant le retour au sol des résidus de
culture après récolte des épis. Les différentes parties des plantes ont été séparées séchées à
l’air et broyées à 100µm. La teneur en carbone ainsi que la signature isotopique des différents
organes des plantes de blé et de maïs sont données dans le tableau 1 :
7*558
46119
4121112
8697
11766
bléBlé48
10121112
BléBlé57
7*558
46119
4121112
8697
11766
bléBlé48
10121112
BléBlé57
60 m
51 m

40
Tableau 1 : Les résultats donnés pour les signatures isotopiques dans ce tableau sont proches de ceux déjà publié
dans Dignac et al. (2005). * écart type sur la moyenne calculée à partir de trois réplicats.
Organe Teneur C δ
13C
(mg/g d’organe) (‰/VDPB)*
Feuilles de blé 176 -28.6±0.5
Tiges de blé 184 -27.6±0.5
Racines de blé 63.5 -28.7±0.5
Feuilles de maïs 170 -12.8±0.5
Tiges de maïs 130 -12.5±0.5
Racines de maïs 126 -11.9±0.5
Les calculs des apports du carbone organique total au sol des feuilles, tiges, et racines des
plantes de blé et de maïs ont été calculés à partir de rapport allométriques trouvé dans la
littérature. L’estimation des apports a déjà été publié dans Bahri et al (2006) et sont données
ci-dessous :
Tableau 2 : Apport du carbone organique total
Blé Maïs
en g Corg-organe / 100g Corg-plante
Feuilles 37* 41
Tiges 47 39
Racines 16 20
* Signifie que pour 100g de carbone organique apporté par la plante apporté au sol, 37g provient des feuilles.
2.2.2. Echantillonnage des sols
2.2.2.1. Echantillonnage des sols en surface
Lors de la campagne 2002, les sols de 0 à 9 ans de culture sous maïs ont été échantillonnés sur
la profondeur 0-25 cm, sachant que la profondeur de labour se situe aux alentours de 30cm.
En 2005, les placettes correspondant à 10, 11 et 12 années sous culture de maïs ont été
échantillonnées à nouveaux. Ces deux campagnes de prélèvements ont permit d’avoir des
échantillons de sols de 0 à 12 années de cultures sous maïs. L’échantillonnage des sols, s’est

41
faite en trois points de la diagonale de la placette, en prenant garde de ne pas échantillonner
trop près des bords des placettes comme indiqué sur la figure 2. Les trois échantillons de sols
ont été ensuite mélangés afin d’avoir un échantillon composite représentatif de la parcelle.
Figure2 : Schéma d’échantillonnage des placettes.
Lors du deuxième échantillonnage en 2005, nous avons pris soins de ne pas rééchantillonné
aux mêmes endroits que lors de la campagne précédente.
2.2.2.2. Caractéristiques des sols en surface étudiés
Pour cette étude nous avons choisit d’étudier trois sols : un sol cultivé sous blé (control), un
sol après 6 années de culture sous maïs, et un sol après 12 années de cultures sous mais.
Le sol du site expérimental est un luvisol, dont les caractéristiques ont déjà été publiées
(Dignac et al. 2005) et sont présentées dans le tableau 3
Tableau 3 : Caractéristiques principales des sols étudiés
Profondeur pH (eau) C N Argiles Limons Sable
(cm) mg/g (%)
0-25 6.8 13.5 1.27 17 50 33
2.2.2.3. Echantillonnage des sols en profondeurs
L’échantillonnage des sols en profondeur a été réalisé lors de la campagne 2003. Les sols ont
été échantillonnés grâce à un carottier hydraulique possédant une sonde de 2 cm de diamètre.
Sur chaque parcelle, quatre carottes de sol ont été prélevées puis divisées tout les 15 cm de 0 à
105 cm, soit 7 profondeurs. Chaque profondeur provenant des quatre échantillonnages ont été
mélangées, afin d’avoir un échantillon représentatif pour chaque profondeur et pour chaque
parcelle (Rasse et al. 2006). Pour notre étude nous avons sélectionné deux sols : un sol sous
2 m
5 m
2.9 m
2.9 m
6.4 m
15 m
2 m
5 m
2.9 m
2.9 m
6.4 m
15 m

42
blé (le même que celui choisit pour les analyses des sols en surface) et un sol après 9 années
de culture sous maïs.
2.2.2.4. Caractéristiques des sols en profondeur étudiés
Le tableau 4 regroupe les principales données sur les deux sols étudiés en profondeurs.
La teneur en carbonates (CaCO3) est inférieure à 1 g kg-1
de sol sec, sur tout le profil étudié,
ce qui signifie que les teneurs en carbone mesurés sont considérés comme étant du carbone
organique. Sous les deux sols étudiés, le pH varie de 6.8 pour le premier horizon à 8.0 pour la
profondeur 90-105 cm. Les caractéristiques physicochimiques des parcelles des Closeaux en
profondeur ont déjà été publiées dans Rasse et al. (2006).
Tableau 4 : Caractéristiques des sols en profondeur sous blé et après 9 ans de maïs
Sol sous blé Sol sous maïs
Profondeur
(cm) ∂13C‰
TENEUR C
(mg/g)
TENEUR N
(mg/g) C/N ∂13C‰
TENEUR C
(mg/g)
TENEUR N
(mg/g) C/N
0-15 -26,1 12,1 1,1 10,5 -24,8 12,0 1,3 9,5
15-30 -26,0 12,9 1,2 10,6 -24,6 12,5 1,3 9,9
30-45 -26,1 8,9 0,9 9,4 -24,7 10,8 1,1 9,9
45-60 -26,1 4,8 0,6 8,3 -25,4 5,6 0,7 8,3
60-75 -26,0 4,1 0,5 8,0 -25,4 4,6 0,6 8,0
75-90 -26,1 3,9 0,5 7,6 -25,4 3,3 0,5 7,2
90-105 -26,4 4,9 0,6 7,7 -24,6 2,0 0,3 6,2
2.3. Protocoles d’analyse des biopolyesters dans les plantes et les sols
2.3.1. Méthodes d’analyses testées sur les feuilles de maïs.
Nous présentons dans ce paragraphe les trois méthodes de dépolymérisations testées dans le
chapitre 3 pour l’étude des monomères de la cutine présents dans les feuilles de maïs. En plus
de ces trois méthodes, nous avons pour chaque méthode testée deux méthodes de
dérivatisations.

43
2.3.1.1. Extraction des lipides libres
Préalablement aux méthodes de dépolymérisation, nous avons effectué une extraction des
lipides libres par sonication dans un bain thermostaté (20 min) de feuilles de maïs au
dichlorométhane (DCM) (3 x 50ml) pendant 20 min. Les trois méthodes de dépolymérisation
ont été testées sur le même échantillon extrait.
2.3.1.2. Oxydation à l’oxyde cuivrique (CuO)
Dans un bécher en téflon nous avons pesé 50 mg de feuilles de maïs ainsi que 50 mg de
[Fe(NH4)2(SO4).6H2O] (sulfate d’ammonium de fer 6 fois hydraté), 250 mg d’oxyde de cuivre
et 50 mg de glucose. 15ml d’hydroxyde de sodium sont ajoutés. Le mélange est agité pendant
30 sec sous flux d’azote et fermé afin d’évité une teneur trop forte en O2 dans le milieux. Les
béchers sont ensuite inséré dans un « chauffeur », que l’on programme à 270°C pendant 2h30.
Une fois le mélange refroidit, il est filtré et rincer à l’eau distillé. Le filtrat est amené à un pH
de deux grâce à de l’acide chlorhydrique 6N et transvasé dans une fiole jaugées de 100ml. Les
échantillons sont laissés au repos toute une nuit puis centrifugés à 15000rpm pendant 20 min
à une température de 4°C. La solution ainsi récupérée est purifiée sur des cartouches C18.
(Les cartouches C18 sont préparées en faisant percoler successivement, sans jamais assécher,
2 ml d’acétate d’éthyle, 2 ml de méthanol. Elles sont ensuite remplies d’eau distillée que l’on
fait un peu percolée avant de passer l’échantillon.). Les cartouches sont séchées sous azote
pendant 1h15 puis les composés sont élués de la cartouche avec 6ml d’acétate d’éthyle.
L’échantillon est séché sous azote, redissout dans du DCM et conservé au congélateur en
attendant d’être analysé.
2.3.1.3. Transesterification (BF3 10%/MeOH)
50 mg de feuilles de maïs extraites sont pesées dans un ballon dans lequel on ajoute 15 ml de
trifluorure de bore à 10% dans le méthanol. Après 15 min de barbotage sous flux d’azote le
ballon est fermé et mis à chauffer au bain marie à 70°c pendant 16h. Une fois la solution
refroidie, et filtrée. Le filtre est rincé au méthanol. Après ajout de 150ml d’eau, le pH est
ajusté à 2. Le filtrat est transvasé dans une ampoule à décanter et extrait 3 fois avec 50 ml de
DCM. La phase organique DCM est transférée dans un ballon et évaporée à l’évaporateur
rotatif et transférée dans un vial. En attendant d’être analysé

44
2.3.1.4. Saponification (KOH 6%/MeOH)
50 mg de feuilles de maïs extraites sont pesées dans un ballon dans lequel on ajoute 100ml
d’une solution de d’hydroxyde de potassium (KOH) 6% dans le méthanol (MeOH) préparée
le jour même. La solution est préparée en pesant 6g de KOH dissout dans 10ml d’eau
désionisée auquel on rajoute 90ml de MeOH. La solution est mise à reflux pendant 18h. La
suite du protocole est identique à celui de la transesterification.
2.3.1.5. Dérivatisations des monomères.
Nous avons testé deux méthodes de dérivatisations une silylation simple et une méthylation
suivie d’une silylation. Les échantillons issus des trois méthodes de dépolymérisation sont
sécher sous azote dans et redissout dans le DCM. L’échantillon est divisé en deux sécher à
nouveau et redissout dans 0.4µl de pyridine auquel on ajoute 100 μl BSTFA (N,O-
bis(trimethylsilyl)trifluoroacetamide; Altech). La silylation se fait à 70°C pendant 1 h. Pour la
méthylation-silylation, avant la procédure de silylation, l’échantillon redissout dans le DCM
est transféré dans un ballon, dissout dans 15 ml de MeOH auquel on ajoute quelques gouttes
de Chlorure d’acétyle. Le mélange est chauffé sous reflux pendant 1h. L’échantillon est
ensuite évaporé à l’évaporateur rotatif, transféré dans un vial et séché sous azote La silylation
transforme les fonctions hydroxylés et acides en fonctions éthers et esters trimethylsilylés. La
méthylation-silylation transforme ces fonctions en fonctions éthers triméthylsilyls et
méthylesters respectivement.
2.3.1.6. Identification des monomères
La séparation et l’identification ont été réalisées sur un chromatographe en phase gazeuse
6890 équipé d’une colonne a SGE BPX-5 (50 m х 0.25 mm х 0.32 µm) couplé à un
quadrupole Agilent 5973 à impact électronique (70 eV). L’injecteur est à une température de
300°C. La programmation en température est de:100°C (2 min), suivie d’une rampe de
température de 10°C min jusqu’à 150 °C, puis 5 °C min-1
jusqu’à 200 °C. Enfin de 200°C à
350 °C à 2o C min
-1 terminé par un palier de 5 min à 350°C.
2.3.1.7. Quantification des monomères
La séparation des monomères à été réalisée sur un chromatographe en phase gazeuse HP GC
6890 équipé d’une colonne SGE BPX-5 (50 m х 0.25 mm х 0.32 µm) couplé à un détecteur
FID pour la quatification. La programmation en température du chromatographe est identique
à celle utilisée pour l’identification. Avant la dérivatisation, un standard interne, l’acide

45
nonadecanoïque à été ajouté aux l’échantillons. Une calibration externe a été réalisée avec
l’acide 16-hydroxy hexadécanoïques et permet de calculer la concentration des monomères
dans l’échantillon. Le facteur de réponse entre les deux acides est proche de 1 quelque soit la
méthode de dérivatisations utilisée.
2.3.1.8. Thermochemolyse
La thermochemolyse a été réalisée sur un aliquote de résidu végétal (≈ 5 mg), auquel on a
ajouté le réactif méthylant, l’hydroxyde de tetramethylammonium (TMAH) 25% dans l’eau
(w/w), dans une proportion 1:1 (w/w). Après un temps de contact de cinq minutes, le mélange
est lyophilisé et pyrolysé à 650°C pendant 15 s grâce à un pyrolyseur à point Curie (induction
ferromagnétique). Le pyrolyseur (GSG Curie Point Pyrolyser 1040 PSC) est couplé à un
chromatographe HP-5890 Hewlett Packard équipé d’une colonne CPSil5CB (30 m х 0.25
mm, х 0.5 μm) pour la séparation des composés et d’un spectromètre de masse quadrupolaire
HP-5889A Hewlett Packard à impact électronique (70 eV) pour l’identification. La
programmation en température du chromatographe est de 3°C/min de 100°C à 320°C.
2.3.2. Méthodes d’analyses appliquées aux échantillons de plantes et de sols
2.3.2.1. Extraction des lipides libres par ASE
La méthode sélectionnée pour l’ensemble de l’étude est une extraction par solvant à haute
température sous pression, publiée dans wiesenberg et al., (2004b). Environ 400 mg de plante
et 15 g de sol sont extraits dans des cellules de 30ml, sur l’appareil Dionex ASE 200. Les
échantillons sont successivement extraits à 75°C et 140°C par un mélange DCM/MeOH (3:1
v/v), puis à 140°C avec du DCM. Les paramètres d’extractions sont 5 min pour le temps de
chauffe et 20 min pour le temps de contact à une pression de 5 х 106 Pa.
2.3.2.2. Saponification
Les échantillons extraits de plantes (100 mg) et de sols (1g) sont mis à reflux dans 100ml
d’une solution de KOH 6%/MeOH pendant 18h. Pour les sols en profondeur la quantité de sol
pesée est augmentée proportionnellement à la teneur en C organique des sols (3 g pour les
sols échantillonnés à 90-105 cm). La solution est ensuite filtrée et le résidu lavé avec une
solution eau/MeOH (1:9, V:V). 150ml d’eau distillée est ajoutée à la solution, dont le pH est
ensuite ajusté à pH 2 grâce à une solution HCL 6N. La solution aqueuse acidifiée est extraite
3 fois avec 50 ml de DCM et la phase organique est évaporée à l’évaporateur rotatif.

46
L’échantillon est transféré dans un vial séché sous azote, redissout dans 400µl de pyridine
contenant le standard interne, et conservé au congélateur.
2.3.2.3. Mesure de la signature isotopique des monomères
La signature isotopique moléculaire a été effectuée sur un spectromètre de masse à ratio
isotopique Micromass-GVI Optima Isochrom III couplé à un chromatographe en phase
gazeuse GC HP5890 équipé d’une colonne CPSil5CB (30 m х 0.25 mm, х 0.5 μm). Les
échantillons sont injectés en mode splitless. La signature du dérivatisant a été déterminée par
un analyseur élémentaire couplé à un spectromètre de masse à ratio isotopique Micromass NA
1500 NC, afin de corriger les valeurs isotopiques mesurées du nombre de carbones introduits
lors de la silylation des monomères.

47
CHAPITRE 3
COMPARAISON DE TROIS MÉTHODES DE
DÉPOLYMÉRISATION SUR DES FEUILLES DE MAÏS
APPLICATION DE LA MÉTHODE SELECTIONNÉE A
UN SOL

48
49
Comparaison de trois méthodes de dépolymérisation sur des feuilles de
maïs
Application de la méthode sélectionnée à un sol
Depolymerisation of the aliphatic macromolecular polyesters
in maize leaves and soil: comparison of methods
Soumis à Organic Geochemistry
3.1. Introduction
Soil organic matter (SOM) provides essential physical and chemical properties for the
efficient functioning of soil. In cropland soil, intensive agricultural activity leads to a decrease
in SOM, weakening the entire ecosystem. Plant residues and microorganisms are the main
OM sources in cropland soils (Kögel-Knabner, 2002). However, the degradation and
stabilization processes, which turn fresh plant material into stabilised SOM remain unclear.
Management of soil, which has became an important issue over the last decades, requires a
better understanding of the composition and dynamics of SOM. Many studies attempted to
characterize SOM composition and to explain how primary OM turns into stable OM, storing
carbon for a long time (Kögel-Knabner, 2002). This stable OM pool often appears to be
enriched in aliphatic moieties (up to 40%) of unknown origin (Sollins et al., 1996). Two main
hypotheses can be put forward to explain the enrichment : (1) some plant components may be
selectively preserved from biodegradation, such as cutan and suberan (Tegelaar et al., 1989;
Augris et al., 1998) or cutin and suberin (Kögel-Knabner et al., 1992b), or (2) aliphatic
moieties may be by-products of biodegradation and/or condensation products of biomolecules
(Kögel-Knabner et al., 1992a; Riederer et al., 1993). Although cutin and suberin have been
recognized as potential sources of aliphatic SOM, their dynamics in soils are poorly known.
In order to elucidate the fate of the cutin and suberin biopolyesters in agricultural soil it is

50
necessary to quantitatively characterize them in plant and soil samples using the same
method.
Cutin and suberin in plants were largely studied using a wide range of chemical (Molina et al.,
2006), enzymatic (Rocha et al., 2001) and spectroscopic (Fang et al., 2001) methods. Several
chemical methods were used to depolymerise them, such as acid hydrolysis (Holloway et al.,
1981; Matas et al., 2004), base hydrolysis ( Ray et al, 1995; Graça et al., 2002) and reduction
(Velcheva et al., 1981). Enzymatic methods were also used to selectively depolymerise
polyesters but these approaches released much lower amounts of monomers than chemical
methods (Rocha et al., 2001) and cannot be applied to characterize the biopolyesters present
in a complex medium such as soil. Studies with plants are difficult to compare because of the
variation in structure and composition of biopolyesters among species, organs and plant
growth stage (Kolattukudy and Walton, 1973; Riederer and Schönherr, 1988; Goñi and
Hedges, 1990b). Furthermore, these studies were based on different depolymerisation
methods.
Different chemical depolymerisation methods are also used to elucidate the fate of these
biopolyesters in soil (Cardoso and Eglinton, 1975; Kögel-Knabner et al., 1989; Matzke and
Riederer, 1991; Otto et al., 2005; Otto and Simpson, 2006). However, the identification and
quantification of cutin and suberin monomers in agricultural soil remain difficult due to the
low amounts.
The lack of a standard method for analyzing biopolyesters in plants and soil makes it difficult
to compare studies concerning different plant species and different soil types. Three chemical
depolymerisation procedures are frequently used to identify and quantify the monomers in
plants and soils:
(1) Saponification with KOH/MeOH has been used for elucidating cutin monomeric
composition of plants and infer cutin contribution to soil (Cardoso and Eglinton, 1975; Kögel-
Knabner, 1992; Naafs and Van Bergen, 2002; Nierop et al., 2003) and sediments (Nip et al.,
1986).
(2) Transesterification with BF3/MeOH is a one step depolymerisation/methylation procedure.
The technique has been applied to plants and soil (Matzke and Riederer, 1991; Riederer et al.,
1993, Otto and Simpson, 2006) and is largely used for the identification and quantification of
the monomers of suberin in roots (Franke et al., 2005).
(3) CuO oxidation is mainly used to release phenol monomers (Hedges and Ertel, 1982). The
technique is generally applied to soil for lignin analysis (Kögel-Knabner, 1986) but has also
been used successfully to characterize plant cutin (Goñi and Hedges, 1990a) and soil (Dignac

51
and Rumpel, 2006; Rumpel et al., 2004).
Because of the high polarity of the monomers released, derivatisation of hydroxyl groups is a
prerequisite gas chromatography (GC) separation. Two methods are commonly used
(Christie, 1993): direct silylation and methylation-silylation.
The objectives of this study were to (i) to compare the information derived from these three
different methods combined with the two derivatisation procedures, and (ii) choose the most
appropriate method for identifying and quantifying biopolyester monomers in crops and in
agricultural soil. Bulk maize leaves, which contain a larger variety of monomers than other
plant organs (unpublished data) were used. The monomers released using the
depolymerisation methods are separated using GC, quantified with flame ionisation detection
(FID) and identified using gas chromatography-mass spectrometry (GC/MS). The selected
method was then applied to a maize cropped soil in order to evaluate whether the method
could be applied to a complex matrix or not.

52
3.2. Material and methods
3.2.1. Plant samples and pretreatment
Samples of maize plants were collected just before harvest at the INRA experimental field of
“Les Closeaux” in the “Parc du Château de Versailles”, France. Leaves were separated, air-
dried and ground at 100 µm. Lipids were isolated using dichloromethane (DCM) extraction (3
× 50 ml) with a sonication bath (Fisherbrand) at 25°C for 20 min (Peres et al., 2006).
3.2.2. Soil sampling and pretreatment
The experimental field, sampling procedure and soil characteristics have been described
(Dignac et al., 2005). Briefly, the field consists of a twelve year chronosequence of maize
replacing the previous wheat cropping. The above ground maize biomass is returned to the
soil after harvesting. For this study, the twelve year cropped soil was sampled at three points
in the plot, from 0 to 25 cm. The three replicates were combined to yield a composite sample.
The sample was sieved successively at 5 mm and 2 mm to remove coarse plant residue. It was
air-dried and ground at 200 µm. In order to remove free lipids before depolymerisation, an
aliquot (ca. 15 g) was extracted (x 3) using an accelerated solvent extractor (Dionex ASE 200)
with a 30 ml stainless steel vessel (Wiesenberg et al., 2004b). The first extraction was at 75°C
with DCM/MeOH (3:1 v/v). The extraction was repeated at 140°C. Finally, the sample was
extracted with DCM at 140°C. For each extraction, the heating time was 5 min, and the static
extraction lasted 20 min at 5 х 106 Pa.
3.2.3. Saponification
Lipid-free samples (ca. 50 mg for maize leaves and 1 g for soil) were refluxed for 18 h in
KOH (6%) in MeOH. These conditions were reported to be optimal for cutin
depolymerisation (Cardoso and Eglinton, 1975; Caldicott and Eglinton, 1976; Ray et al.,
1995). The solution was filtered and the residue washed (x 3) with MeOH. Deionised water
(150 ml) was added to the mixture and the solution was adjusted to pH 2 with 6N HCl in
order to extract acidic lipids (Naafs and Van Bergen, 2002). The aqueous solution was finally
extracted with DCM (50 ml х 3) and stirring at room temperature. The combined extracts
were concentrated using a rotary evaporator and transferred to a vial until the sample was
prepared for analysis.

53
3.2.4. Transesterification
Transesterification was carried out at 70°C in BF3 (10%) in MeOH, under N2 for 16 h using
50 mg of extracted leaves and 1 g of extracted soil (Kögel-Knabner et al., 1989; Ray et al.,
1995; Riederer et al., 1993). Deionised water was added to the suspension before filtration.
The residue was washed (x 3) with MeOH and the solution adjusted to pH 2 with 6N HCl.
The hydrolysis mixture was stirred in DCM (50 ml х 3) at room temperature. After reduction
of the volume of the recombined extracts, the final extract was transferred to a vial for
derivatisation and analysis.
3.2.5. CuO oxidation
The sample (50 mg extracted leaves and 1g extracted soil) was oxidized at 172°C for 2 h with
250 mg CuO, 50 mg [Fe(NH4)2(SO4)х(H2O)6] and 50 mg glucose in 2M NaOH under N2
(Schnitzer, 1973; Hedges and Mann, 1979). The suspension was filtered and the solution
adjusted to pH 2 with 6N HCl, completed to a constant volume (100 ml) and left overnight.
After centrifugation, the solution was purified through a C18 column according to the
procedure described by Kögel-Knabner and Bochter (1985), compounds being eluted with
ethyl acetate.
3.2.6. Derivatisation
Depolymerization extracts were dried under N2 and dissolved in DCM. The solution was
divided in two in order to compare the two derivatisation procedures. For the direct silylation,
the sample was dried and dissolved in 0.4 ml pyridine and 100 μl BSTFA (N,O-
bis(trimethylsilyl)trifluoroacetamide; Altech) was added. Silylation was carried out at 70°C
for 1 h. For methylation-silylation the sample was methylated prior to the silylation described
above: the sample was dissolved in MeOH and a few drops of acetyl chloride were added.
After refluxing for 1 h, the solvent was evaporated. Direct silylation transforms hydroxyl and
carboxylic acid functions to the trimethylsilyl ether and ester derivatives (TMS ether / TMS
ester) respectively, whereas the trimethylsilyl ether and methyl ester (TMS ether / methyl
ester) derivatives are formed with the methylation-silylation procedure.
3.2.7. Identification
Extracts obtained using the three wet chemical methods of depolymerisation were analyzed
using GC/MS after derivatisation. Separation and identification were performed with a HP
GC 6890 gas chromatograph equipped with a SGE BPX-5 column (50 m х 0.25 mm х 0.32

54
µm) coupled to an Agilent 5973 electronic ionisation (EI, 70 eV) mass spectrometer. The GC
oven temperature programme was:100°C (2 min), to 150 °C at 10°C min-1
, to 200 °C at 5 °C
min-1
, to 350 °C at 2o C (held 5 min). Compounds released by depolymerisation were assigned
from their MS fragmentation patterns, supported by comparison with published spectra and a
spectral library (Wiley).
3.2.8. Quantification
Separation and quantification were performed with a HP GC 6890 gas chromatograph
equipped with a SGE BPX-5 column (50 m х 0.25 mm х 0.32 µm) and coupled to a FID. The
GC oven temperature programme was as described above. Quantification was performed via
addition of an internal standard, nonadecanoic acid, prior to derivatisation. External
calibration with 10,16-dihydroxyhexadecanoic acid was used to calculate compound
concentrations. The response factor between nonadecanoic acid and 10,16-
dihydroxyhexadecanoic acid is close to 1, whatever the derivatisation method.
3.2.9. Thermochemolysis/TMAH
Extracted leaves or depolymerization residue (5 mg) were mixed with tetramethylammonium
hydroxyde (TMAH) in 25% water (w/w) in a 1:1 (w/w) proportion. The sample was freeze-
dried and loaded on to a ferromagnetic wire for pyrolysis. Thermochemolysis was performed
by inductively heating the wire to its Curie temperature of 650°C in 0.15 s (10 s hold) in a
pyrolysis unit (GSG Curie Point Pyrolyser 1040 PSC). The products were separated with a
HP-5890 Hewlett Packard chromatograph equipped with a CPSil5CB column (30 m х 0.25
mm, х 0.5 μm) for separation coupled to a 70 eV EI HP-5889A Hewlett Packard Mass
Spectrometer for compound identification. The GC oven was programmed from 100°C to
320°C at 3°C / min.

55
3.3. Results and discussion
3.3.1. Distribution of monomers from the three depolymerisation methods with maize leaves
The depolymerisation methods afforded a large variety of aliphatic compounds listed in Table
1. Monomers in the first part of Table 1 are compounds with a chain length of 16 or 18
carbons bearing one to three hydroxyls, unsaturation and/or additional carboxylic group.
Some, such as the (8,16-, 9,16- and/or 10,16-)-dihydroxyhexadecanoic acids, and 9,10,18-
trihydroxyoctadecanoic acid, have been described as specific for the cutin polymer in fruit
and leaf cuticles (Kolattukudy, 1984; Kögel-Knabner et al., 1989). A wider carbon number
range is observed for some of the series of products listed in the second part of Table 1. These
classes of aliphatic compounds, such as carboxylic acids or ω-hydroxy carboxylic acids, are
not specific for cutin, since they can also derive from cuticular waxes, which are tightly
associated with cutin in leaves, or from suberized layers (Kolattukudy and Walton, 1973).
3.3.1.1. Monomers specific for cutin
The 16-hydroxyhexadecanoic acid, x,16-dihydroxyhexadecanoic acid isomeric compounds (x
= 8, 9 or 10), 18-hydroxyoctadec-9-enoic acid and 9,10,18-trihydroxyoctadecanoic acid were
observed with all the methods (Table 1). These monomers are the most often cited in studies
of plant and fruit cutin and are considered as the major cutin monomers (Hunneman and
Eglinton, 1971; Ray et al., 1995). They are also used as indicators for the contribution of
vascular plant cuticular layers to sediments (Cardoso and Eglinton, 1983) and SOM (Kögel-
Knabner et al., 1989; Riederer et al., 1993; Hermosin and Saiz-Jimenez, 1999; Otto et al.,
2005) . They compounds have already been identified in the cuticle of maize leaves and
bundle sheaths by Espelie and Kolattukudy (1979).
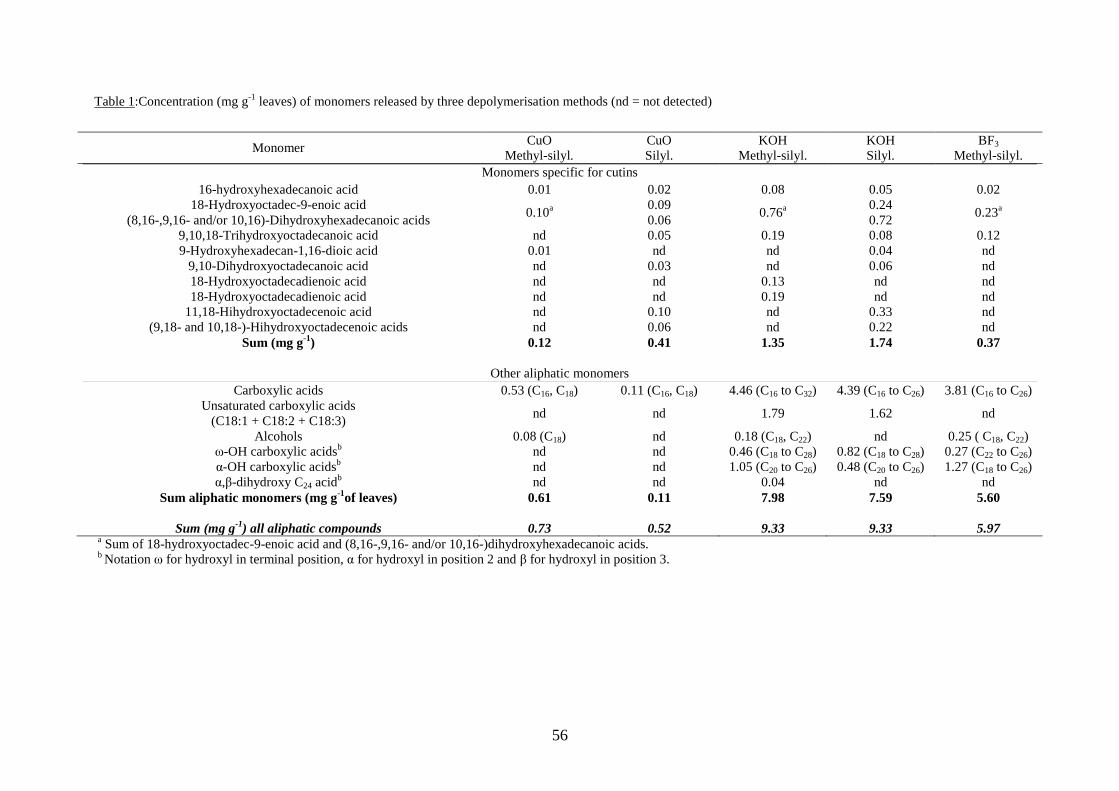
56
Table 1:Concentration (mg g-1
leaves) of monomers released by three depolymerisation methods (nd = not detected)
Monomer CuO
Methyl-silyl.
CuO
Silyl.
KOH
Methyl-silyl.
KOH
Silyl.
BF3
Methyl-silyl.
Monomers specific for cutins
16-hydroxyhexadecanoic acid 0.01 0.02 0.08 0.05 0.02
18-Hydroxyoctadec-9-enoic acid 0.10
a 0.09 0.76
a 0.24 0.23
a
(8,16-,9,16- and/or 10,16)-Dihydroxyhexadecanoic acids 0.06 0.72
9,10,18-Trihydroxyoctadecanoic acid nd 0.05 0.19 0.08 0.12
9-Hydroxyhexadecan-1,16-dioic acid 0.01 nd nd 0.04 nd
9,10-Dihydroxyoctadecanoic acid nd 0.03 nd 0.06 nd
18-Hydroxyoctadecadienoic acid nd nd 0.13 nd nd
18-Hydroxyoctadecadienoic acid nd nd 0.19 nd nd
11,18-Hihydroxyoctadecenoic acid nd 0.10 nd 0.33 nd
(9,18- and 10,18-)-Hihydroxyoctadecenoic acids nd 0.06 nd 0.22 nd
Sum (mg g-1
) 0.12 0.41 1.35 1.74 0.37
Other aliphatic monomers
Carboxylic acids 0.53 (C16, C18) 0.11 (C16, C18) 4.46 (C16 to C32) 4.39 (C16 to C26) 3.81 (C16 to C26)
Unsaturated carboxylic acids
(C18:1 + C18:2 + C18:3) nd nd 1.79 1.62 nd
Alcohols 0.08 (C18) nd 0.18 (C18, C22) nd 0.25 ( C18, C22)
ω-OH carboxylic acidsb
nd nd 0.46 (C18 to C28) 0.82 (C18 to C28) 0.27 (C22 to C26)
α-OH carboxylic acidsb
nd nd 1.05 (C20 to C26) 0.48 (C20 to C26) 1.27 (C18 to C26)
α,β-dihydroxy C24 acidb
nd nd 0.04 nd nd
Sum aliphatic monomers (mg g-1
of leaves) 0.61 0.11 7.98 7.59 5.60
Sum (mg g-1
) all aliphatic compounds 0.73 0.52 9.33 9.33 5.97
a Sum of 18-hydroxyoctadec-9-enoic acid and (8,16-,9,16- and/or 10,16-)dihydroxyhexadecanoic acids.
b Notation ω for hydroxyl in terminal position, α for hydroxyl in position 2 and β for hydroxyl in position 3.
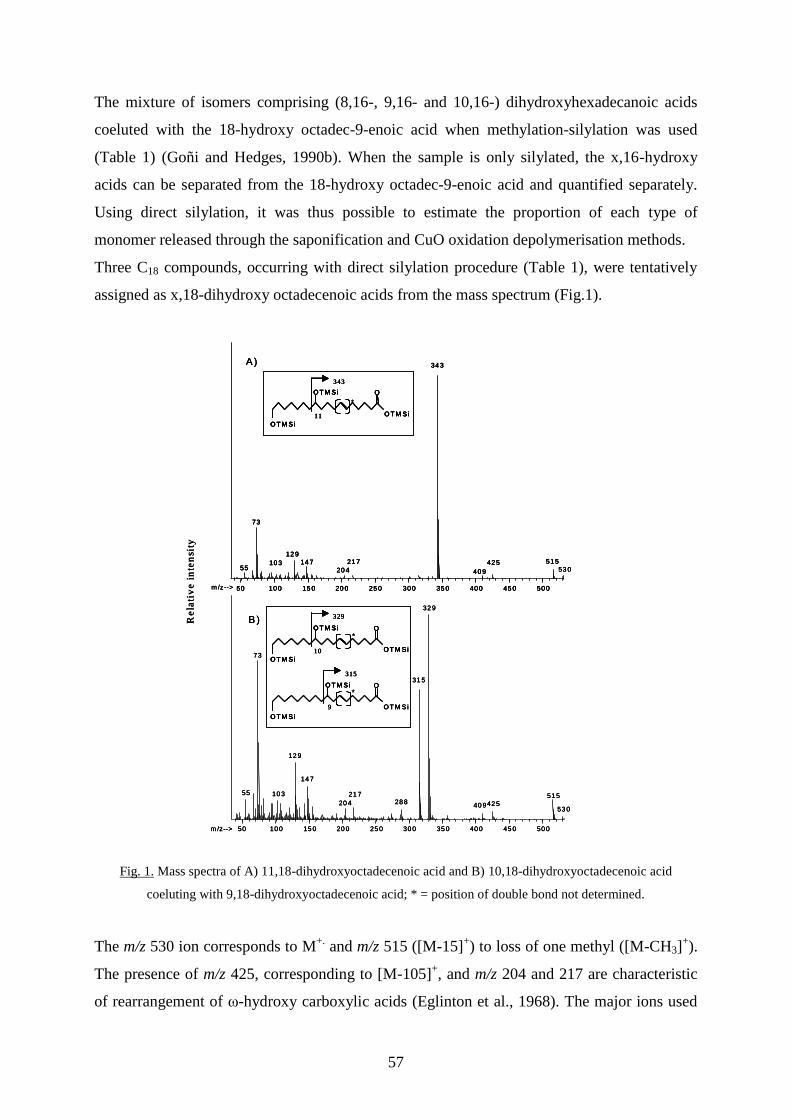
57
The mixture of isomers comprising (8,16-, 9,16- and 10,16-) dihydroxyhexadecanoic acids
coeluted with the 18-hydroxy octadec-9-enoic acid when methylation-silylation was used
(Table 1) (Goñi and Hedges, 1990b). When the sample is only silylated, the x,16-hydroxy
acids can be separated from the 18-hydroxy octadec-9-enoic acid and quantified separately.
Using direct silylation, it was thus possible to estimate the proportion of each type of
monomer released through the saponification and CuO oxidation depolymerisation methods.
Three C18 compounds, occurring with direct silylation procedure (Table 1), were tentatively
assigned as x,18-dihydroxy octadecenoic acids from the mass spectrum (Fig.1).
Fig. 1. Mass spectra of A) 11,18-dihydroxyoctadecenoic acid and B) 10,18-dihydroxyoctadecenoic acid
coeluting with 9,18-dihydroxyoctadecenoic acid; * = position of double bond not determined.
The m/z 530 ion corresponds to M+.
and m/z 515 ([M-15]+) to loss of one methyl ([M-CH3]
+).
The presence of m/z 425, corresponding to [M-105]+, and m/z 204 and 217 are characteristic
of rearrangement of ω-hydroxy carboxylic acids (Eglinton et al., 1968). The major ions used
50 10 0 15 0 20 0 25 0 30 0 35 0 40 0 45 0 50 0
34 3
73
12 951 542 521 7
40 9
14 7
20 410 3
55 53 0
A)
Re
lati
ve
in
ten
sity
m /z-->
50 10 0 15 0 20 0 25 0 30 0 35 0 40 0 45 0 50 0
32 9
73
12 9
51 510 3
14 7
21 728 8 42 5
55
20 453 0
31 5
40 9
m /z-->
B)
O T M S i
OO T M S i
O T M S i
11
343
O T M S i
OO T M S i
O T M S i
9
315
O T M S i
OO T M S i
O T M S i
10
329
*
*
*
50 10 0 15 0 20 0 25 0 30 0 35 0 40 0 45 0 50 0
34 3
73
12 951 542 521 7
40 9
14 7
20 410 3
55 53 0
A)
Re
lati
ve
in
ten
sity
m /z-->
50 10 0 15 0 20 0 25 0 30 0 35 0 40 0 45 0 50 0
32 9
73
12 9
51 510 3
14 7
21 728 8 42 5
55
20 453 0
31 5
40 9
m /z-->
B)
50 10 0 15 0 20 0 25 0 30 0 35 0 40 0 45 0 50 0
34 3
73
12 951 542 521 7
40 9
14 7
20 410 3
55
50 10 0 15 0 20 0 25 0 30 0 35 0 40 0 45 0 50 0
34 3
73
12 951 542 521 7
40 9
14 7
20 410 3
55 53 0
A)
Re
lati
ve
in
ten
sity
m /z-->
50 10 0 15 0 20 0 25 0 30 0 35 0 40 0 45 0 50 0
32 9
73
12 9
51 510 3
14 7
21 728 8 42 5
55
20 453 0
31 5
40 9
m /z-->
B)
O T M S i
OO T M S i
O T M S i
11
343
O T M S i
OO T M S i
O T M S i
11 O T M S i
OO T M S i
O T M S i
O T M S i
OO T M S iO T M S i
O T M S iO T M S i
11
343343
O T M S i
OO T M S i
O T M S i
9
315
O T M S i
OO T M S i
O T M S i
9 O T M S i
OO T M S iO T M S i
O T M S iO T M S i
9
315315
O T M S i
OO T M S i
O T M S i
10
329
O T M S i
OO T M S i
O T M S i
10 O T M S i
OO T M S i
O T M S i
O T M S i
OO T M S iO T M S i
O T M S iO T M S i
10
329329
*
*
*

58
to identify the monomers were respectively m/z 343, 329 and 315 (100%) corresponding to
cleavage at a carbon next to the mid-chain hydroxy group. Thus, these fragments correspond
to the hydroxy unsaturated carboxylic acid fragments [TMSiO-C10H17-COOTMSi]+, [TMSiO-
C9H15-COOTMSi]+ and [TMSiO-C8H13-COOTMSi]
+ respectively. The monomers are
probably 11,18-dihydroxyoctadecenoic acid and 10,18-dihydroxy octadecenoic acid coeluting
with 9,18-dihydroxyoctadecenoic acid. A dihydroxyoctadecenoic acid (with no indication of
the hydroxyl position) was previously cited as one of the major monomers from maize cuticle
(Espelie and Kolattukudy, 1979). These compounds also form part of leaf cutin monomers of
different plant species (Graça et al., 2002).
The 9-hydroxyhexadecan-1,16-dioic acid was identified after CuO and saponification
followed by direct silylation (Table 1). It is a major suberin monomer in the roots of
monocotyledons such as Aspidistra elatior, depolymerised using transmethylation (Zeier and
Schreiber, 1998). The 9,10-dihydroxyoctadecanoic acid was recognized by comparison of the
mass spectrum with that of the synthetic counterpart (Eglinton et al., 1968). The two isomers
of 18-hydroxyoctadecadienoic acid, only found in the saponification extract derivatised via
methylation-silylation, had been identified in apple cutin (Eglinton et al., 1968) and
Arabidopsis leaves (Franke et al., 2005). The position of the double bond could not be
assigned from the mass spectrum.
We have not detected any epoxy carboxylic acids in bulk maize leaves (Table 1), whereas
Espelie and Kolattukudy (1979) found the 18-hydroxy 9,10-epoxy octadecanoic acid after
depolymerisation of the cuticle of maize leaves. However, the three wet chemical methods
used in the present study are known to transform the epoxide function into two vicinal alcohol
functions (Newman and Hammock, 2001). The 9,10,18-trihydroxyoctadecanoic acid observed
after depolymerisation and derivatisation could be derived from moieties comprising either a
9,10,-trihydroxy pattern or a 9,10-epoxy--hydroxy one. Thus, the epoxy compound could
not be distinguished from preexisting trihydroxyoctadecanoic acid monomer under our
analytical procedure. Goñi and Hedges (1990a) checked this hypothesis by reacting
commercial 9,10-epoxyoctadecanoic acid using the CuO oxidation procedure. The major
compound released was 9,10-dihydroxyoctadecanoic acid and no epoxy acid was detected.
3.3.1.2. Other aliphatic monomers recovered from depolymerisations
Several classes of aliphatic compounds not specific for cutin are gathered in the second part
of Table 1. Carboxylic acids were released with the three methods. The CuO method released
only hexadecanoic and octadecanoic acids, whereas saponification and transesterification

59
yielded a much wider range of acids, with a distribution from C16 to C32 and C16 to C26
respectively. As for the C18 acid, counterparts with one to three unsaturations were released in
high concentration along with the saturated one through saponification. Two primary n-
alcohols could be identified and quantified with the different methods of depolymerisation
and derivatisation. Octadecanol was found with the three methods, whereas docosanol was
released only upon saponification and methylation-silylation and transmethylation. However,
no homologous series was found for these compound classes with any of the tested method.
Saponification and transmethylation yielded homologous series of 2-hydroxy carboxylic acids
(α-OH carboxylic acids) and ω-OH carboxylic acids (hydroxyl group in terminal position of
the aliphatic chain). The α-OH carboxylic acids ranged from C20 to C26 for saponification and
from C18 to C26 for transmethylation, with a maximum at C24 and a even/odd predominance.
The ω-OH carboxylic acids ranged from C18 to C28 for saponification and from C22 to C26 for
transmethylation, maximizing at C24 as in the case of the α-OH carboxylic acids. The ω-
hydroxy carboxylic acids, n-alcohols, and n-carboxylic acids released from maize leaves
(Table 1) were identified in maize bundle sheaths and maize cuticle by Espelie and
Kolattukudy (1979). Aliphatic monocarboxylic acids, α-hydroxy carboxylic acids, ω-hydroxy
carboxylic acids and n-alcohols are also major constituents of suberin in maize roots (Zeier et
al., 1999). In our study, these monomers could thus also derive from suberized cell walls
present in maize leaves. The 2,3-dihydroxytetracosanoic acid identified here in maize leaves
was previously detected in leaves and stems of eelgrass Zostera marina L. (de Leeuw et al.,
1995), where a series of compounds from C20 to C26 was identified with a predominance of
the C24 homologue. The experimental procedure used by de Leeuw et al. (1995), consisted of
soxhlet extraction, saponification and acid hydrolysis; the different extracts were methylated
and silylated, 2,3-dihydroxycarboxylic acid being released through saponification and in
higher amount through acid hydrolysis. In the present study, 2,3-dihydroxytetracosanoic acid
was released upon saponification, derivatised with the methylation-silylation procedure and
identified thanks to a previous mass spectrum (de Leeuw et al., 1995). No other homologues
could be detected even through selected ion detection due to detection threshold.
All the above compounds may be related to intracuticular waxes or suberized layers, thus
showing that the procedure used in this study could release monomers from more than one
type of lipid polymer.

60
3.3.2. Comparison of methods
Depolymerisation yield for transmethylation was ten times higher than for CuO oxidation,
reaching 5.97 mg g-1
of leaves, although it only released a few specific monomers (Table 1).
The saponification gave the highest concentration of total monomers of all the methods,
reaching 9.33 mg g-1
of leaves with the two derivatisation methods. The total amount of
monomers measured after CuO oxidation was 0.73 mg g-1
of leaves with methylation-
silylation and 0.52 mg g-1
of leaves with direct silylation. The strongest qualitative similarities
were observed between CuO oxidation and the saponification for the monomers specific for
cutin, presented in the first part of Table 1. Indeed, most of the aliphatic monomers were
identified through CuO oxidation and saponification. The saponification and
transesterification methods gave similar results for the monomers gathered in the second part
of Table 1. In the following, we compare first the cupric oxide oxidation and saponification
methods before comparing the saponification and transmethylation methods.
3.3.2.1. CuO oxidation vs. Saponification
The lack of some aliphatic monomers which are less specific for cutin and a lower
depolymerisation yield for all monomers are the strongest differences when CuO oxidation is
compared with saponification. Carboxylic acids were released in high concentration by
saponification, ranging from 4.39 to 4.46 mg g-1
of leaves whereas the depolymerisation yield
of the CuO oxidation for these compounds was very low, with 0.11 and 0.55 mg g-1
of leaves
for silylation and methylation-silylation respectively. No unsaturated carboxylic acids, either
ω-OH or α-OH carboxylic acids, were detected with this method.
The depolymerisation mechanism of CuO oxidation in NaOH is similar to that of
saponification (Goñi and Hedges, 1990a), and so cannot explain these differences. By
contrast, the experimental conditions used in the two methods are very different and could
influence the depolymerisation of the biopolymer. The CuO oxidation is achieved under
drastic conditions, with high temperature and oxidizing conditions. Such conditions tend to
oxidize terminal hydroxyl groups and, to a lesser extent, mid-chain hydroxyl groups.
Carboxylic acids with a terminal hydroxyl may thus be converted to diacids and
polyhydroxylated carboxylic acids to shorter chain diacids (Goñi and Hedges, 1990a).
Unsaturations are sensitive functions which may be degraded under these conditions. This
likely explains the lack of octadecenoic acids and 18-hydroxyoctadecadienoic acids after CuO
oxidation, and the low yields obtained for x,18-dihydroxyoctadecenoic acid isomers vs.

61
saponification. CuO oxidation also released 9-hydroxyhexadecan-1,16-dioic acid and 9,10-
dihydroxyoctadecanoic acid. As noted above, experimental conditions tend to oxidize
terminal hydroxyl functions and lead to diacids. Upon CuO oxidation, 9-hydroxyhexadecan-
1,16-dioic acid could thus derive at least partly from 9,16-dihydroxyoctadecanoic acid. Since
this monomer is present after both the cupric oxide oxidation and saponification methods, it
may also be present as such in the plant.
CuO oxidation was first compared with the more common methanolysis and base hydrolysis
methods with Malus pumila cutin, showing similarity in the released monomers (Goñi and
Hedges, 1990a). The distribution of the monomers after CuO oxidation of whole maize leaves
(Table 1) can be compared to that obtained by Espelie and Kolattukudy (1979) for the cuticle
of maize leaves after LiAlH4 reduction. Eight monomers specific for cutin were found but
their absolute abundances were not specified. The most abundant was 18-hydroxyoctadec-9-
enoic acid, followed by 18-hydroxy-9,10-epoxyoctadecanoic acid, twice less concentrated,
which was not detected with the chemical methods used in this study. The x,16-
dihydroxyhexadecanoic acid monomers were as abundant as 9,10-epoxy,18-
hydroxyoctadecanoic acid and the 18-dihydroxyoctadecenoic acid isomers. Finally 9,10,-
trihydroxy octadecanoic acid and the 16-hydroxyhexadecanoic acid were present in lower
concentration in cutin than the other monomers. In the present study, 9,10,18-
trihydroxyoctadecanoic acid was as concentrated as the x,16-dihydroxyhexadecanoic acids,
and no 18-hydroxy 9,10-epoxyoctadecanoic acid was detected. These results support the
hypothesis that a large part of the epoxy monomer is transformed to 9,10,18-
trihydroxyoctadecanoic acid. However in the present study, CuO oxidation possibly induced
degradation of a significant part of the monomers released during depolymerisation. Despite
the low yields, most of the monomers specific for cutin were identified with CuO and direct
silylation, but their concentrations were underestimated. Hence the CuO oxidation method
may be useful for identification of the monomers but is not suitable for their quantification.
3.3.2.2. Saponification vs. transesterification
Depolymerisation yield was higher when maize leaves were submitted to saponification than
transmethylation (Table 1), in agreement with the findings of Ray et al. (1995) using lime
cutin. The main differences between saponification and transmethylation are observed for the
monomers specific for cutin (Table 1). After saponification, when the two derivatisation
methods are considered, the (mono/di)-hydroxylated carboxylic acids and diacids such as 9-
hydroxyhexadecan-1,16-dioic acid, 9,10-dihydroxyoctadecanoic acid, the x,18-

62
dihydroxyoctadecenoic acid isomers and the isomers of 18-hydroxy octadecadienoic acid
were identified. The concentration of these (mono/di)-hydroxylated carboxylic acids and
diacids represented between 23% and 37% of the identified total monomers specific for cutin,
depending on the derivatisation method. These compounds may thus represent a high
proportion of the monomers specific for cutin and may be significant for its quantification.
Nevertheless, the monomers identified with the saponification method are not released after
transesterification. They are unsaturated compounds with or without two hydroxy functions
except for 9-hydroxy hexadecan-1,16-dioic acid which has two acid functions. The reactivity
of unsaturations could be a first explanation for not detecting these compounds with
transmethylation. The unsaturated monomers may be transformed on acid hydrolysis into
shorter chain compounds or other molecules which we could not identify. This hypothesis is
supported by the lack of unsaturated carboxylic acids after transmethylation, whereas upon
saponification they represented 21% of the total aliphatic class monomers.
The different reaction mechanisms of the two methods can also explain the differences in
depolymerisation efficiency. Saponification is a base hydrolysis involving hydroxide ion.
Transmethylation involves a Lewis acid, BF3, which acts as a catalyst, in a coordination
complex with methanol (Morrison and Smith, 1964). BF3/MeOH may not have access to
some of the depolymerisation sites due to steric exclusion. Polyhydroxylated acids have some
of their secondary alcohol groups involved in ester cross linking, which makes these
depolymerisation sites less accessible to the reagents. The efficiency of both reagents, KOH
and BF3, depends on the position of the monomer in the polymeric network, and thus upon the
degree of ester cross linking of the mid-chain hydroxy groups. Contrasting accessibility of the
depolymerisation sites to the reagents may explain the lack of poly(hydroxylated) carboxylic
acids or diacids after BF3/MeOH, since mid-chain hydroxy groups may create highly cross
linked regions (Fang et al., 2001).
The distributions of α-OH carboxylic acids obtained after transesterification and
saponification were similar. The monomer α-OH C24 was predominant for this family,
reaching 50% of the total α-OH carboxylic acids. Thus, both depolymerisation methods were
efficient in releasing α-OH acids, and the concentrations obtained might be representative for
this compound family in the polymer. The vicinity of the hydroxy and the carboxylic acid
functions in the compounds, and the similar concentrations obtained with transmethylation
and saponification, may mean that only one of these two functions is engaged in an ester
linkage. The α-OH acids are thus probably not responsible for highly cross linked regions.
Similarly, the depolymerisation yields of aliphatic acids and alcohols are close for the two

63
methods. These two classes of compounds have only one functional group and as cannot be
engaged in a highly cross linked region of the polymer. They probably form the external part
of the polyester structure and are easily depolymerised using saponification and
transmethylation.
The ω-OH acid family was underestimated with the transmethylation method compared to the
saponification. These components are probably more strongly engaged in the polymeric
edifice through both hydroxy and carboxylic functions. Due to steric exclusion of the reagent,
they may be less accessible to the transmethylation reagent.Transmethylation was efficient for
the monomers which were monofunctionals or not inserted deeply in the polymer. However,
the lack of specific cutin monomers such as poly(hydroxylated) acids and unsaturated
compounds, led to both an underestimation of cutin amount and to loss of information on
cutin monomeric composition. Therefore, saponification appeared to be the most efficient
method for the characterisation and quantification of the monomers of cutin in maize leaves.
Nierop et al. (2003) have already shown its efficiency for the study of suberin in roots and for
ester bound lipids in soils.
3.3.2.3. Derivatisation procedure
Apart from the depolymerisation method, the derivatisation procedure used to transform the
released monomer into GC amenable compounds may also influence the distribution of
monomers observed using GC (Table 1). Upon direct silylation, the separation of 18-
hydroxyoctadec-9-enoic acid from the isomers of x,16-dihydroxyhexadecanoic acid was
possible. The proportions of 18-hydroxyoctadec-9-enoic acid and x,16-dihydrohexadecanoic
acids could be assessed as 60%-40% for CuO oxidation and 25%-75% for saponification.
However, the efficiency of the derivatisation depends on the considered monomers.
Methylation-silylation seems to be more efficient for compounds such as α-OH acids and
9,10,18-trihydroxyoctadecanoic acid. By contrast, direct silylation enhanced two fold
concentrations of ω-OH acids when compared with the methylation-silylation derivatisation.
The α-OH acids and 9,10,18-trihydroxyoctadecanoic acid have hydroxyl and/or carboxylic
functions close to each other, whereas in ω-OH carboxylic acids, hydroxyl and carboxylic
functions are distant. The silylation reagent is large enough to be subject to steric exclusion.
This can explain why the α-OH carboxylic acid concentration reached 1.27 mg g-1
of leaves
for transmethylation and 1.05 mg g-1
of leaves for saponification and methylation-silylation,
whereas the concentration fell to 0.48 mg g-1
of leaves when saponification and direct
silylation were used. The first step methylation of the carboxylic function might reduce steric

64
exclusion, a methoxyl group being smaller than a siloxyl one. For the compounds where no
steric hindrance can be considered, silylation gave higher derivatisation yields, and so seems
more efficient. Additionally, methylation-silylation is a two step procedure, which may
induce some loss of monomers. Moreover, methylation of hydroxyl and carboxylic acid
groups leads to more volatile products. Some compounds could have been lost during the
evaporation of MeOH to dryness under N2 after methylation. This could explain why, with
direct silylation, quantification of minor compounds such as 9,10,18-trihydroxyoctadecanoic
acid released by CuO oxidation was possible, whereas they were not detected after
methylation-silylation. Taken together, the monomers specific for cutin are more abundant
when direct silylation is used for derivatisation (Table 1).
However, depolymerisation yields never reach 100%, and a macromolecular residue can
remain whatever the method used (Velcheva et al., 1981; Ray et al., 1995). Hence, the
occurrence of aliphatic molecules in the remaining residue was investigated using
thermochemolysis.
3.3.2.4. Thermochemolysis/TMAH
We tested the efficiency of thermochemolysis on extracted maize leaves. Most of the
compounds released were of lignin origin (Fig. 2). We also identified carboxylic acids from
C12 to C24 with a strong predominance of hexadecanoic acid. Octadecenoic acid and
octadecadienoic acid were identified, as with the saponification method, but all these acids are
not specific for cutin.

65
Fig. 2. Total ion chromatogram from thermochemolysis/TMAH of maize leaves;
●: phenolic compounds derived from lignin, (Cx:n): carboxylic compounds, x indicates number of carbons in
chain and n number of unsaturations.
Thermochemolysis is a rapid qualitative method for characterising polar macromolecules in
plants and their contribution to soil (Gobe et al., 2000; Nierop, 2001).
Thermochemolysis/TMAH methylates carboxylic and hydroxyl groups and so prevents
carboxylic acids from decarboxylation, increasing the volatility of most polar compounds and
making them GC amenable. It allows detection of compounds which cannot be detected
through conventional pyrolysis/GC/MS. Thermochemolysis/TMAH is often used to recognize
plant macromolecules, such as lignin in wood (Clifford et al., 1995; McKinney et al., 1995;
Klingberg et al., 2005; Ohra-aho et al., 2005). Hatcher et al., (1995) showed that it is more
efficient than CuO oxidation for routine analysis of lignin in gymnosperm wood and leads to
wider range of compounds derived from lignin. It was also used for the monomeric
elucidation of the suberin biopolymer in the cork of Quercus suber L. (Bento et al., 1998;
2001) and to characterize the contribution of root and leaf biopolymers in soil (Nierop, 2001).
It releases significant amounts of carboxylic acids, diacids and ω-hydroxy carboxylic acids, as
well as compounds such as 9,10-epoxy,18-hydroxyoctadecanoic acid, which was not found
with the wet chemical methods of depolymerisation used in the present study.
Thermochemolysis/TMAH was successfully applied to the elucidation of the monomeric
R etention tim e (m in)
10 20 30 40 50 60 70
Ab
un
da
nc
e
0,0
2,0e+5
4,0e+5
6,0e+5
8,0e+5
1,0e+6
1,2e+6
1,4e+6
1,6e+6
C1
2
C1
4
C2
4
C2
2C2
0
C1
8:2
C1
8C1
8:1
C1
6
R e tention tim e (m in)
10 20 30 40 50 60 70
Ab
un
da
nc
e
0,0
2,0e+5
4,0e+5
6,0e+5
8,0e+5
1,0e+6
1,2e+6
1,4e+6
1,6e+6
C1
2
C1
4
C2
4
C2
2C2
0
C1
8:2
C1
8C1
8:1
C1
6

66
composition of the cutin polyester in tomato, apple, papaya and lime or in the cuticle of Agave
Amaricana (del Rio and Hatcher, 1998; del Rio et al., 1998). The monomers produced
correspond to those usually released by chemical depolymerisation, such as (8,16-, 9,16-
and/or 10,16-)-dihydroxyhexadecanoic acids, or 9,10,18-trihydroxyoctadecanoic acid.
However, no mid chain hydroxylated carboxylic acids characteristic for polyester monomers
could be detected after thermochemolysis/TMAH on extracted maize leaves, although
thermochemolysis conditions used in the present experiment (TMAH, 25% water, 650°C)
were close to those used in previous studies. Gonzalez-Vila et al., (1996) analysed suberin in
potato tubers with 25% TMAH in water at a pyrolysis temperature of 500°C. Bento et al
(1998, 2001) used TMAH in water and Curie point pyrolysis of 610°C for characterisation of
the monomeric composition of suberin in cork. Nierop (2001) used experimental conditions
close to those we used to identified cutin and suberin monomers in leaves and roots. In
another study (Nierop et al., 2003), thermochemolysis was successfully applied to soil and
roots before and after base hydrolysis, showing the efficiency of base hydrolysis to recover
biopolyester monomers. Thus, the lack of compounds characteristic for cutin in the present
thermochemolysis analysis likely results from the low amount of cutin in maize leaves when
compared with other polymers such as lignin or cellulose and hemicellulose. Indeed, in most
of the above studies the cuticle was physically or enzymatically separated prior to pyrolysis
and/or the amounts of cutin and suberin in the samples were high. Under the
thermochemolysis and sample preparation conditions used in the present study, the monomers
specific for cutin were probably diluted in the background signal produced by the major
lignin-derived components. The thermochemolysis of the residues after transmethylation and
saponification treatment did not give any clear cut information on remaining cutin either,
probably due to the low quantity of remaining polymer. Thermochemolysis does not appear
suitable for characterising monomeric composition of cutin in bulk maize leaves and so could
not provide any information on the efficiency of the depolymerisation methods.
3.3.3. Bound lipids released by saponification of a soil sample.
Saponification followed by silylation being the most appropriate method for the analysis of
maize leaves, we choose this method to analyse a maize cropped soil sample (Table 2). To
evaluate the repeatability of the method on such a heterogeneous sample, the
depolymerisation method was repeated three times on the extracted soil. The standard error
ranged from 1.6% to 10% for single monomers (Table 2).

67
The same monomers, except 9,10-dihydroxyoctadecanoic acid, were found for both leaves
(Table 1) and soil (Table 2). However, a wider range is apparent in the former case. For
example, in maize leaves ω-hydroxy carboxylic acids ranged from C18 to C28 (Table 1),
whereas in soil they ranged from C20 to C26 (Table 2). This greater diversity of monomers in
leaves may be due to the low carbon content of the soil (12.9 ± 0.9 mg C g-1
soil). The amount
of total aliphatic monomers in the soil was 72.2 ± 4.6 µg g-1
soil, which represented only
0.6% of the organic carbon, while for plants the amount of the total aliphatics reached 9.33
mg g-1
, representing about 2% of the organic carbon. Some of the monomers identified in the
leaves must be under detection threshold in the soil.
Saponification of the soil released mid chain hydroxy compounds, identified as cutin
monomers in maize leaves, and shown in the first part of Table 2. The second part of Table 2
lists the aliphatic monomers which are not specific for cutin, such as those making up the
second part of Table 1, for maize leaves: saturated carboxylic acids from C16 to C26,
unsaturated octadecanoic acids, ω-hydroxy carboxylic acids from C20 to C26, the C24 and C26
α-hydroxy carboxylic acids, the C18 and C20 n-alcohols along with the C16, C22 and C24 α;ω-
diacids which were not identified in maize leaves. However, the latter compounds are
commonly considered as suberin markers for maize roots (Zeier et al., 1999)
Table2: monomers recovered from saponification and simple silylation of a 12 year maize cropping agricultural
soil. * SEM% = standard error of the mean (n= 3).
Soil
(µg g-1
) SEM (%)
a
Monomers specific for cutins
16-Hydroxyhexadecanoic acid 2.9 6.8
18-Hydroxyoctadec-9-enoic acid 2.4 8.3
(8,16-,9,16- and/or 10,16-)dihydroxyhexadecanoic
acids 8.1
2.1
9,10,18-Trihydroxyoctadecanoic acid 1.1 3.0
9-Hydroxyhexadecan 1,16 dioic acid 3.2 9.1
11,18-Dihydroxyoctadecenoic acid 1.3 7.0
(9,18- and 10,18-)Dihydroxyoctadecenoic acids 0.6 7.6
Sum (µg g-1
) 19.6 5.0
Other aliphatic monomers
Carboxylic acids 23.0 (C16 to C26) 3.1
Unsaturated
(C18:1 + C18:2 + C18:3) 6.4 2.1
Alcohols 2.7 (C18;C20) 2.0
ω-OH carboxylic acids 16.2 (C20 to C26) 1.6
α-OH carboxylic acids 1.9 (C24;C26) 3.6
Diacids 2.4 (C16;C22;C24) 5.1
Sum (µg g-1
) 52.6 1.2
Sum (µg g-1
) of all aliphatic compounds 72.2 2.1

68
3.3.3.1. Cutin-derived monomers
Except for 9,10-dihydroxyoctadecanoic acid, which was not found in the soil, all the
monomers recovered from the saponification of maize leaves were present in the soil (Tables
1 and 2). The distribution of monomers specific for cutin in maize leaves and soil is shown in
Fig. 3.
Fig. 3: Distribution of monomers specific for cutin in monomer class released by saponification of maize leaves
and soil under 12 years of maize cropping
In soil, the contribution of 16-hydroxyhexadecanoic acid, x,16-dihydroxyhexadecanoic acids,
9-hydroxyhexadecan-1,16-dioic acid and, to a lesser extent 9,10,18-trihydroxyoctadecanoic
acid, was higher than in leaves. The relative enrichment of the soil in 16-
hydroxyhexadecanoic acid compared to maize leaves can be explained by a root contribution.
Indeed, maize roots are known to contain ω-hydroxy carboxylic acids ranging from C16 to
C28, maximizing at C16 or C18:X and C24 (Zeier et al., 1999). The higher proportion of 9,10,18-
trihydroxyoctadecanoic acid, x,16-dihydroxyhexadecanoic acid and 9-hydroxyhexadecan-
1,16-dioic acid in the soil vs. maize leaves, can be explained via preservation from
microorganism degradation by microorganisms. The mid-chain hydroxy acids are, as
explained above, present in the highly cross linked network of the biopolyesters, where it
might be more difficult for microorganisms to gain access. It must be noted that two studies
reported opposite trends for the level of degradation of mid chain hydroxy acids. They have
been shown to be preferentially degraded (Otto and Simpson, 2006), while Riederer et al.,
(1993) showed that they were degraded to the same extent as other aliphatic compounds in
0
5
10
15
20
25
30
35
40
45
16-hydro
xyhexadec
anoic a
cid
18-hydro
xyoctadec
-9-e
noic a
cid
X,1
6-dih
ydroxyhex
adecan
oicac
ids
9 ,10,1
8-tri
hydroxyocta
decanoic
acid
9-hydro
xyhexadec
an-1
,16-d
ioic
dia
cid
11,18-d
ihydro
xyoctadec
enoic
aci
d
x,18-d
ihydro
xyoctadec
enoic
acid
s
%
m aize leaves
soil

69
forest soil during incubation of litters. When comparing our study with the aforementioned
two studies, the different trends observed might be related to differences in vegetation and
soil management compared to grassland and forest soil (in particular soil with respect to
ploughing), which probably affects the processes transforming fresh plant material into SOM
(Lal, 2002).
On the contrary, the proportion of the x,18-dihydroxyoctadecenoic acids, 11,18-
dihydroxyoctadecenoic acid and 18-hydroxyoctadecenoic acid in the soil were lower than in
maize leaves, indicating that they are preferentially degraded, in agreement with previous
reports on the lower stability of unsaturated monomers vs. saturated ones (Nierop et al.,
2003). Since contrasting behaviour is observed for specific monomers on cutin in soil, this
might indicate a selective degradation of the biopolyester by microorganisms.
3.3.3.2. Other aliphatic compounds non specific for cutin
The relative distribution of non-specific monomers for cutin in the soil was different from that
in maize leaves: (1) the proportion of ω-hydroxy carboxylic acids was higher in the soil
(≈22%) than the leaves (≈9%) and (2) the proportion of α-hydroxy carboxylic acids was
slightly lower in the soil (≈3%) than the leaves (≈5%) and 3) diacids and alcohols were absent
after saponification of the leaves.
The ω-hydroxy carboxylic acids are constituents of plant waxes (Otto and Simpson, 2006)
found in leaves but also constituents of roots (Kolattukudy, 1984; Zeier and Schreiber, 1998;
Zeier, et al., 1999). The higher contribution of ω-hydroxy carboxylic acids in soil compared to
maize leaves might thus originate from the input of suberin from roots, composed mostly of
ω-hydroxy carboxylic acids.
The presence in the soil of α-hydroxy carboxylic acids with an aliphatic chain length longer
than 20 carbon atoms (Table 2) might also be explained by an input of suberin from roots
(Zeier et al., 1999). Although α-hydroxy carboxylic acids in the soil can originate from both
leaves and from roots, their proportion in the soil was slightly lower than in the leaves, which
can be due to preferential degradation of their precursors in the soil. As already mentioned,
carboxylic acids and α-hydroxy carboxylic acids cannot be involved in the highly cross linked
region of the polymer, since only one hydroxy functional group is available to form an ester
link and might be more accessible than the ω-hydroxy carboxylic acids, which can involve
two hydroxyl groups in the biopolyester.
Saponification of the soil revealed the presence of diacids and alcohols, which were not
identified in maize leaves (Table 1). Diacids are also constitutive monomers of suberized

70
layers in maize roots (Zeier et al., 1999), and might be characteristic for suberin input to soil
(Riederer et al., 1993). Taken together, the differences between the monomer distribution in
leaves and soil underline the importance of the contribution of the biopolyester suberin to soil
polyester, as suggested by Rasse et al. (2005).
71
3.4. Conclusions
The three wet chemical methods used to characterise cutin of maize leaves released a
significant variety of monomers. Comparison showed they are complementary and raised
major mechanistic and experimental differences which could explain the difficulty in
comparing them. Cupric oxide oxidation released many compounds similar to those released
through saponification, but in lower concentration probably due to further degradation of
some monomers under the drastic experimental conditions. Cupric oxide oxidation thus does
not appear as a suitable procedure for the quantification of cutin monomers in maize leaves.
Transmethylation seems to be a powerful reagent for depolymerisation, but its action is
limited to the external part of the polymer, and/or to regions with a low degree of cross
linking. The method seems appropriate for depolymerisation of some hydroxy carboxylic
acids and carboxylic acids but polyhydroxylated carboxylic acids and unsaturated carboxylic
acids are either underestimated or not detected with this method. By contrast, the hydroxide
ion in base hydrolysis is able to penetrate deeper into the polymer, releasing inner monomers
not accessible to BF3/MeOH. Polyhydroxylated monomers may be under-represented with
BF3/MeOH, since they are the main constituents of the highly cross linked region
inaccessible to this depolymerisation reagent. Saponification gave a more correct idea of the
relative distribution of the monomers in the biopolymer and released more cutin-specific
compounds than the two other methods. Saponification thus appears the most appropriate for
quantification of biopolyesters through release of their monomers. No specific cutin
monomers could be detected through thermochemolysis/TMAH of whole maize leaves, likely
due to the low abundance of cutin with respect to other plant polymers, especially lignin.
Saponification was successfully applied to a soil sample with a standard error for the mean of
less than 10% for the concentration of each monomer. Ester-bound lipids released by
saponification of a soil showed a clear input of cutin from above ground biomass and of
suberin from below ground biomass. The monomeric composition of the biopolyesters in the
soil from saponification suggested a selective preservation of the highly cross linked region of
the cutin, possibly due to lower accessibility for microorganisms. On the other hand, the
higher proportion of ω-hydroxy carboxylic acids compared to plants, and the presence of
diacids showed a large input of suberin to the bound ester moieties evidenced for the soil via
saponification.

72

73
CHAPITRE 4
COMPOSITION MONOMERIQUE ET
SIGNATURE ISOTOPIQUE
DES CUTINES ET DES SUBERINES DANS LES
FEUILLES, TIGES ET RACINES DES PLANTES DE
BLE ET DE MAÏS

74

75
Composition monomerique et signature isotopique
des cutines et des subérines dans les feuilles, tiges et racines
des plantes de blé et de maïs
Monomer and 13
C composition of cutin and suberin of shoots and roots of a C3
(Triticum aestivum L.) and a C4 (Zea mays L.) plant
Soumis à Phytochemistry
4.1. Introduction
Cutins and suberins are biopolyesters which cover the above and belowground tissues of
plants. Their principal role is to act as a protective barrier against chemical, biological and
physical external attacks and to regulate plant water exchanges (Dean and Kolattukudy, 1976;
Kolattukudy, 1984; Bernards, 2002; Heredia, 2003). Cutins are amorphous biopolyesters
composed of carboxylic acids with 16 and 18 carbon atoms, bearing epoxy and alcohol
groups, interlinked through ester bonds (Kolattukudy and Walton, 1973). Cutins cover the
aerial parts of vascular plants (Hunneman and Eglinton, 1971; Goñi and Hedges, 1990a;
Riederer et al., 1993), fruits (Eglinton et al., 1968; Velcheva et al., 1981; Ray et al., 1995),
mosses and liverwort (Caldicott and Eglinton, 1976; Goñi and Hedges, 1990b). Cutins are
embedded within intracuticular waxes and covered with epicuticular waxes to form the plant
cuticle. Suberins are structured polyesters composed of an aliphatic and an aromatic domain
(Bernards, 2002). The aliphatic part of the biopolyester is usually made of carboxylic acids,
ω- or α-hydroxylated, of diacids and alcohols, characterised by chain length longer than 18
carbon atoms. Suberins are mostly present in roots and some suberized tissues of plants
(Kolattukudy, 1981). These two biopolyesters were largely studied among plants, attempting
to correlate chemical, physical, physiological and biological properties between them and
their changes with environmental conditions (Dean and Kolattukudy, 1976; Dean and
Kolattukudy, 1977; Kolattukudy, 1981; Lendzian and Schonherr, 1983; Stark and Garbow,

76
1992; Stark et al., 1994; Bolwell et al., 1997; Cordeiro et al., 1997; Zeier and Schreiber, 1998;
Zimmermann et al., 2000). Cutins and suberins were also deeply studied for their potential
use as geochemical markers of vegetation sources in soils and sediments (Cardoso and
Eglinton, 1975, 1983; Goñi and Hedges, 1990b; Almendros et al., 1999) and for their
contribution to soil organic matter (Kögel-Knabner et al., 1989; Dinel, 1996; Nierop et al.,
2001; Kögel-Knabner, 2002; Otto and Simpson, 2006). The qualitative and quantitative
description of the monomeric composition of the biopolyesters generally used in these studies
does not allow understanding their dynamics in plants or in soils. Indeed, understanding
synthesis pathways of plant biopolyesters synthesis and their contribution to soil organic
matter requires the use of 13
C isotope concentrations. The natural abundance of 13
C isotopes is
a powerful tool that opened new perspectives for the study of plant physiology and of the fate
of plant residues in ecosystems at the global and molecular scale. The global 13
C isotopic
signature of plants is directly correlated to its photosynthetic pathway and allows for the
differentiation between C3 and C4 plants (Smith and Epstein, 1971). Measuring the 13
C natural
abundance in plants and soils was used to evaluate the turnover of soil organic matter in
ecosystems that were initially under C3 (or C4) vegetation and changed to a C4 (or C3)
vegetation (Balesdent and Mariotti, 1996; Boutton, 1996). Furthermore isotopic signature of
plant biomarkers was used to infer vegetation sources in soils and sediments and thus to
reconstruct paleoclimatic conditions (Hayes et al., 1999; Chikaraishi and Naraoka, 2005;
Dümig et al., 2007).
In plants, molecules are submitted to isotopic fractionation during their biosynthesis (Park and
Epstein, 1961; Tcherkez et al., 2003). A better understanding of the fate of carbon in primary
and secondary plant products was obtained using 13
C isotopes as tracers measured in plant
molecules and in the CO2 respired by plants (Rossmann et al., 1991; Tcherkez et al., 2003;
Hobbie and Werner, 2004). The contrasted 13
C content in plant compounds can be related to
the partial pressure of CO2 in the atmosphere and in the plant stomates (Brugnoli et al., 1988),
to the plant water potential (Cernusak et al., 2003) and to environmental conditions like water
salinity (Brugnoli and Lauteri, 1991) or drought (Monti et al., 2006). Photorespiration and
isotopic fractionation at metabolic branch points, coupled to different allocation patterns
during metabolism for C3 and C4 plants, probably influence position-specific and compound-
specific isotopic differences. Differing 13
C content of mobile and immobile compounds (e.g.
sugars vs lignin) may then create isotopic differences among plant pools and along transport
pathways (Hobbie and Werner, 2004).
Molecular 13
C analyses of plants and soils were also used to study the dynamics and turnover

77
of carboxylic acids and alkanes (Wiesenberg et al., 2004a), lignins (Bahri et al., 2006) and
sugars (Derrien et al., 2006) in cropland soils. The 13
C abundance of the monomers
constitutive of the biopolyesters in plants has never been studied although it would allow for a
better understanding of monomer biosynthesis and of their dynamic in soils. These data are
necessary to investigate the fate of biopolyesters in agricultural soils using these molecules as
biomarkers of the aboveground or belowground biomass (Rasse et al., 2005).
The objective of this study was to acquire information on the quantities, distribution and
isotopic 13
C composition of the monomers released from different organs of cropped plant.
The carbon isotopic composition of bulk tissues and of monomers released from the
biopolyesters of leaves, stems and roots of a wheat plant: the Triticum aestivum L. (C3 plant)
and a maize plant: the Zea mays L. (C4 plant) are investigated in relation to plant metabolism
and biosynthesis pathway of monomers. The monomers constitutive of the biopolyesters were
released by saponification, which we previously showed to be the most appropriate analytical
method for these molecules (Mendez-Millan et al., submitted). The released monomers were
silylated and separated by gas chromatography (GC) and identified thanks to a mass
spectrometer (MS), quantified by flame ionisation detector. Their individual isotopic
signatures were measured by GC coupled to an isotopic ratio mass spectrometer (IRMS) via a
combustion interface.

78
4.2. Material and methods
4.2.1. Sampling and preparation of plant samples
Plant samples were collected just before harvest at the INRA experimental field of “Les
Closeaux” in the “Parc du Château de Versailles”, France. Leaves, stems and roots of Zea
mays L. and Triticum aestivun L. were separated, air-dried and ground at 100µm. In order to
remove free lipids before depolymerisation, about 2 g was extracted three times with an
accelerated solvent extractor Dionex ASE 200 in 30 ml stainless-steel extraction vessels. The
first extraction was carried out at 75°C and a solvent mixture 3:1 (V:V) dichloromethane /
methanol. The extraction was repeated changing the temperature to 140°C. Finally, the
sample was extracted with dichloromethane at 140°C. For each extraction, the heating time
was 5 min, the static extraction lasted 20 min at a pressure of 5 х 106 Pa (Wiesenberg et al.,
2004b).
4.2.2. Saponification
The extracted sample (100 mg) was refluxed for 18 h in an aqueous solution of potassium
hydroxide (KOH) 6% in methanol (Cardoso and Eglinton, 1975; Ray et al., 1995). The
solution was filtered and the residue washed with methanol/water (9:1) (V:V). 150 ml of
distilled water was added to the mixture and the solution was adjusted to pH 2 with HCl 6N in
order to extract acidic products (Naafs and Van Bergen, 2002). The aqueous solution was
finally extracted with dichloromethane (50 ml х 3). The volume of the recombined extracts
was reduced with a rotative evaporator under pressure and transferred into a vial until the
sample was prepared for analysis.
4.2.3. Derivatisation
Depolymerisation products were dried under nitrogen and redissolved in pyridine. Silylation
with BSTFA (N,O-Bis (trimethylsilyl)-Trifluoroacetamide) containing 1% of
trimethylchlorosilane (Altech) was performed at 70°C for 1h. Silylation transformed hydroxy
and carboxylic acid functions into their trimethylsilyl ether and ester derivatives (TMS ether /
TMS ester).

79
4.2.4. Identification
Saponification products were analyzed by GC/MS after silylation. Separation and
identification were performed with a HP GC 6890 gas chromatograph equipped with a SGE
BPX-5 column (50 m х 0.25 mm х 0.32 µm) and an Agilent 5973 Electronic Impact (70 eV)
mass spectrometer. The GC oven temperature was programmed at 100°C for 2min, then from
100°C to 150°C at 10°C/min, from 150°C to 200°C at 5°C/min, and finally at a rate of
2°C/min from 200°C to 350°C and 5 min at 350°C. Compounds were identified according to
their fragmentation pattern supported by comparison with published mass spectra and with a
mass spectra library (Wiley).
4.2.5. Quantification
Separation and quantification were performed with a HP GC 6890 gas chromatograph
equipped with a SGE BPX-5 column (50 m х 0.25 mm х 0.32 µm) and a flame ionisation
detector (FID). The GC oven temperature program was identical to the one used for
identification. The monomers were quantified by using an internal standard, the nonadecanoic
acid, added prior to derivatisation. An external calibration with the 10,16-
dihydroxyhexadecanoic acid was used to calculate the concentrations from the ratio of the
peak area of each compound to that of the internal standard. The response factor between the
nonadecanoic acid and the 10,16-dihydroxyhexadecanoic acid was close to 1.
4.2.6. Isotopic measurements
Isotopic analyses on individual compounds were carried out with a GC HP5890 coupled with
an Isochrom III Isotopic mass spectrometer (Micromass-GVI Optima). Samples were injected
in the splitless mode. The same column and chromatographic conditions were used as those
used for the identification and quantification. The δ13
C values were measured for the silylated
monomers of the molecules of interest. These values were corrected for the δ13
C of carbon
atoms introduced by silylation, measured off-line with Elemental Analyser (EA) coupled to
IRMS (Micromass NA 1500 NC).

80
4.3. Results and discussion
4.3.1. Monomeric composition of the biopolyesters in plants
The wheat plant contained a higher amount of total identified monomers compared to the
maize plant, whatever the part of the plant (Table 1). The depolymerisation of the leaves
released 3.5 mg g-1
leaves for wheat and 2.0 mg g-1
leaves for maize. Six classes of
compounds were released upon saponification of the leaves, stems and roots of wheat and
maize plants (table 2 and 3) and their monomeric composition varied greatly with the tissue
and the plant.
Table1: * Concentration mean (µg/g of dry sample) of the monomers released by depolymerisation of leaves,
stems and roots of maize and wheat.
1proportion (in %) of the monomer relative to the total monomers released in the plant tissue.
2Sd (%): Standard deviation of the mean calculated from triplicate analyses. nd for not detected
maize
leaves*
(%)1
sd2
(%)
maize
stems sd
maize
roots sd
wheat
leaves sd
wheat
stems sd
wheat
roots sd
sum of
diacids nd - nd -
255
(18.7) 1.5 nd - nd -
350
(18.3) 1.7
sum of
mid-chain
hydroxy
acids
770
(37.5) 1.6
42
(6.5) 7.4 5 (0.4) 6.6
2273
(64.3) 5.2
773
(58.0) 3.1
157
(8.2) 3.2
Sum of
others
aliphatic
compounds
1281
(62.5) 4.2
605
(93.5) 5.4
1105
(80.9) 1.2
1263
(35.7) 0.1
559
(42) 3.6
1409
(73.5) 2.1
TOTAL 2051 0,2 647 5,5 1365 1,3 3536 4,8 1332 2.5 1916 1.5
Carboxylic acids, n-alcohols, ω-hydroxy carboxylic acids and α-hydroxy carboxylic acids are
often encountered in cutins and suberins (Table2). They were also described in plant waxes
and thus are not specific for polyesters (Kolattukudy and Walton, 1973). These four classes of

81
molecules constituted a large part of the biopolymers, since their total contribution ranges
from 35.7% of the total monomers quantified in wheat leaves to 93.5% in maize stems
(Table1). This contribution is higher in maize than in wheat whatever the part of the plant.
Two additional monomer classes were identified, the diacids and the mid-chain hydroxy acids
with C16 and C18 carbon atoms (Table3). The diacids are characteristic for suberins (Espelie et
al., 1980; Franke et al., 2005) and were identified only in roots where their contribution is
similar in maize and wheat. The mid-chain hydroxy monomers are aliphatic acids or diacids
bearing 2 or 3 hydroxy groups and 0 or 1 unsaturation. These compounds are generally
considered as specific for cutins (Hunneman and Eglinton, 1971; del Rio et al., 1998).
4.3.1.1. Carboxylic acids
The carboxylic acids ranged from C16 to C24 and their distribution was different among plant
materials. The carboxylic acids represented 25.5% and 22.9% of the total released monomers
in maize leaves and roots respectively, and up to 54% in maize stems. In wheat, the relative
proportions of carboxylic acids, ranging from 15.3% to 15.8%, was lower than in maize.
Carboxylic acids were dominated in all the plant samples by the hexadecanoic acid, followed
by the unsaturated octadecanoic acids (C18:1, C18:2 and C18:3 labelled as C18:X). In maize stems
these two monomers represented 37.3% of the total monomers. Their concentrations and
relative proportions were lower in roots when compared to leaves (15.0% of the total
monomers in maize roots and 10.1% in wheat roots). Carboxylic acids with more than 20
carbon atoms were present in all plant tissues, except in wheat leaves. In maize, their
contributions to total monomers in the different parts of the plant were similar (2.4% to 3.2%)
and low compared to the C16 and C18:X carboxylic acids. It is usually considered that
compounds with an aliphatic chain comprising at least 20 carbon atoms are specific for
suberized tissues and particularly for roots. However in maize plant, they cannot be used as
tracers for biopolymers of belowground origin since they are also found in aboveground
tissues. Furthermore, aliphatic acids are ubiquitous compounds, found in plant biopolyesters
but also major components of plant waxes, usually ranging from C12 to C36 (Kolattukudy and
Walton, 1973). In soils and sediments, they may also originate from microorganisms (Fang et
al., 2006; Otto and Simpson, 2006).
Free carboxylic acids were previously studied in leaves, stems and roots of wheat and maize
(Wiesenberg et al., 2004; Jandl et al., 2005) and were shown to range from C13 to about C32,
with a high contribution of the C16 and C18:X compounds. In the present study, where free
lipids were preliminary extracted, no carboxylic acids with more than 20 carbon atoms were

82
detected in wheat leaves. Matzke and Riederer (1990) found higher proportions of carboxylic
acids after depolymerisation of cutin from Triticum aestivun L. (26.5% of the total
monomers) compared to the proportion we measured in extracted wheat leaves (15.6%, Table
2). Making the hypothesis that these compounds represent only a low contribution to the
bound lipids, the lack of carboxylic acids with a chain length longer than 20 carbon atoms and
the lower proportion of carboxylic acids in our study suggest that the ASE technique is
efficient to remove free lipids. Some waxes might nevertheless remain entrapped within the
polymers, but they should account for a small part of the released monomers, which are more
probably characteristic for non extractable lipids.
4.3.1.2. n-alcohols
Two n-alcohols were identified exclusively in maize roots (Table 2): the octadodecanol and
the dodecosanol. Their concentration were very low, with 21 and 11 μg / g roots representing
1.5% and 0.8% of the total aliphatic monomers released, respectively. No homologous series
could be detected after depolymerisation. The presence of these two monomers in low
concentration compared to the total monomers was already evidenced in suberin of maize
primary roots (Zeier et al., 1999).
As already noted for carboxylic acids, the n-alcohols are more probably present in the plant
waxes extracted prior to depolymerization. In waxes, alcohols are characterized by the
predominance of the C26 and C28 compounds (Bull et al., 2000; Kunst and Samuels, 2003),
which were not identified here supporting an efficient removal of free lipids, prior to
depolymerisation.
4.3.1.3. ω-hydroxy carboxylic acids
The distribution of ω-hydroxy carboxylic acids ranged from C16 to C26 depending on the
considered plant tissue (Table 2). They represented the largest class of monomers in maize
and wheat roots with 52.0% and 56.8% of the total monomers, respectively. They were also
abundant in leaves (32.3% of the total monomers in maize leaves and 18.1% in wheat leaves).
The ωC18:1 monomer was the major ω-hydroxy carboxylic acid in all the samples, except in
wheat roots where its abundance is just below that of ωC22, representing up to 22% of the
total monomers for maize leaves. Leaves of maize and wheat displayed a high concentration
of ωC18:1 and a low concentration of the ω-hydroxy carboxylic acids with aliphatic chains
longer than C20. This trend is less marked for stems especially in maize. In maize roots, the ω-
hydroxy carboxylic acids ranged from C16 to C26 maximizing at C18:1 and C24 (Table 2), with a

83
distribution close to that obtained by Zeier et al. (1999) in the suberin of cell walls of
developing maize primary roots. In wheat roots the ω-hydroxy carboxylic acids ranged from
C16 to C24. The major monomer was the ωC22 while the ωC26 was even not detected.
In cutins, the ωC16 and ωC18:1 monomers are commonly released by the different methods of
plant depolymerisation (Espelie et al., 1979; Holloway, 1973; Goñi and Hedges, 1990b).
Suberins are more specifically characterised by the presence of monomers with an aliphatic
chain length longer than 20 carbon atoms with the predominance of the ωC24 and ωC26
monomers (Franke et al., 2005; Matzke and Riederer, 1991). Accordingly, the concentration
of the ω-hydroxy carboxylic acids with an aliphatic chain ≥ to C20 was higher in roots than in
the aboveground parts and their monomeric distribution was different when comparing wheat
and maize organs (Table 2).
4.3.1.4. α-hydroxy carboxylic acids
Only one α-hydroxy carboxylic acid was identified in plant samples. The 2-hydroxy
tetradocosanoic acid accounted from 7.7% of the total monomers in maize stems to 1.4% in
maize roots. This compound was already identified as a cutin monomer in wheat leaves
(Matzke and Riederer, 1990), but was not detected in maize leaves by (Espelie and
Kolattukudy, 1979). Molina et al., 2006 suggested that the detection of the α-hydroxy
carboxylic acids in some studies is only dependent of the depolymerisation methods. Indeed,
acid-catalyzed methods released higher amounts of these monomers than base-catalysed
methods because of differences in depolymerisation kinetics. These latter compounds were
even not identified upon hydrgenolysis (AlLiH4) depolymerisation. Comparing different
results obtained with different methods, they suggested that these compounds are not present
in the samples as ester bound lipids but that they derive from N-acyl groups, characteristic for
sphingolipids.
In maize roots, several α-hydroxy carboxylic acids have already been identified (Zeier et al.,
1999; Zimmermann et al., 2000), with a distribution ranging from C18 to C26 maximizing at
C24, according to the age of the roots or the way they were cultivated. The α-hydroxy
carboxylic acids were often identified in bound lipids of eelgrass and plants (de Leeuw et al.,
1995; Franke et al., 2005). Franke et al. (2005), after depolymerisation of leaves and roots of
Arabidopsis Thaliana, found a distribution of α-hydroxy carboxylic acids from C16 to C28
with a clear predominance of the αC24 in leaves, whereas in roots only the αC24 was identified.
In the present study, we found only the αC24 monomer, which might be due either to the
sensitivity of the method or to differences in plant biopolyester composition.

84
Table2: * Concentration mean (µg/g of dry sample) of the monomers released by depolymerisation of leaves,
stems and roots of maize and wheat.
1proportion (in %) of the monomer relative to the total monomers released in the plant tissue.
2Sd (%): Standard deviation of the mean calculated from triplicates analyses. nd for not detected
maize
leaves*
(%)1
sd2
(%)
maize
stems sd
maize
roots sd
wheat
leaves sd
wheat
stems sd
wheat
roots sd
Carboxylic acids
C16 273
(13.3) 1,5
127
(19.6) 20,7
114
(8.5) 2,3
262
(7.4) 1,4
105
(7.9) 3.1
134
(7.0) 4.5
C18 51
(2.5) 3,8
87
(13.4) 15,2
67
(4.9) 0,5
93
(2.6) 15
48
(3.6) 16.2
51
(2.7) 15
C18:X 150
(7.3) 0,3
115
(17.7) 5,6
88
(6.5) 2,7
186
(5.2) 1,2
46
(3.5) 8.0
59
(3.1) 3.9
C20 17
(0.8) 0,1
6,5
(1.1) 3,1
18
(1.3) 1,7 nd - nd -
25
(1.3) 1.7
C24 33
(1.6) 3,1
15
(1.5) 4,6
26
(1.9) 1,3 nd -
12
(0.9) -
23
(1.2) 7.0
sum of carboxylic acids 524
(25.5) 0.1
350
(54.1) 9.2
313
(22.9) 1.8
541
(15.3) 3.6
211
(15.9) 5.8
294
(15.3) 3.8
Alcohols
AlC18 nd - nd - 21
(1.5) 2,4 nd - nd - nd -
AlC22 nd - nd - 11
(0.8) 3,0 nd - nd - nd -
sum of alcohols nd nd 32
(2.3) 2.6 nd - nd - nd -
ω-hydroxy carboxylic
acids
ωC16 54
(2.6) 1,9
52
(8.0) 12,0
150
(10.1) 0,6
57
(1.6) 2,3 nd -
164
(8.6) 2.7
ωC18 nd - nd - 32
(2.3) 1,6 nd - nd - nd -
ωC18:1 452
(22.0) 2,4
56
(8.6) 7,9
234
(17.1) 1,0
401
(11.3) 4,7
181
(13.6) 2.6
349
(18.2) 1.7
ωC20 nd - nd - 30
(2.2) 1,6 nd - nd -
59
(3.1) 2.6
ωC22 12
(0.5) 1,9
31
(4.8) 4,5
68
(5.0) 2,8
117
(3.3) 1,6
49
(3.7) 2.1
354
(18.5) 2.4
ωC24 70
(3.4) 6,8
39
(6.0) 6,7
134
(9.8) 2,7
67
(1.8) 6,5
86
(6.4) 10.4
192
(10.0) 10,2
ωC26 74
(3.6) 0,1
27
(4.2) 0,3
62
(4.5) 1,9 nd - nd - nd -
sum of ω-hydroxy
carboxylic acids
662
(32.3) 1.2
205
(31.7) 1.0
710
(52.0) 1.0
642
(18.1) 3.4
316
(23.7) 3.1
1088
(56.8) 3.4
α-hydroxy
carboxylic acids
αC24 95
(4.6) 0,2
50
(7.7) 3,3
50
(3.7) 2,9
80
(2.3) 3
32
(2.4) 3.4
27
(1.4) 2.3

85
4.3.1.5. Diacids
Four different diacids were identified in wheat and maize roots (Table 3). The DC18:1 was the
most abundant monomer and represented 15.1 % and 14.0 % of total monomers in maize and
wheat roots, respectively. It occurs along with and the DC16 and DC18 in maize roots and the
DC16 and the DC22 in wheat roots. The concentrations of the latter diacids were very low
compared to that of the DC18:1. These results are in accordance with the study of maize roots
by Zeier et al. (1999) and Zimmerman et al. (2000), who found that, whatever the age or the
part of the root, the DC18:1 was the major monomer, followed by the DC16 and DC18. Given
the lack of diacids in leaves and stems and their presence in roots, diacids and particularly the
DC18:1 can be regarded as markers for root tissues.
Table3: * Concentration mean (µg/g of dry sample) of the diacid and mid-chain hydroxy acid monomers
released by depolymerisation of leaves, stems and roots of maize and wheat.
1proportion (in %) of the monomer relative to the total monomers released in the plant tissue.
2Sd (%): Standard deviation of the mean calculated from triplicate analyses. nd for not detected
maize
leaves*
(%)1
S d2
(%)
maize
stems sd
maize
roots sd
wh eat
leaves sd
wh eat
stems sd
wh eat
roots sd
D iacids
D C 16 nd - nd - 42 (3.1) 0 .8 nd - nd - 50 (2.6) 7 .9
D C 18 nd - nd - 22 (1.6) 3 .3 nd - nd -
D C 18:1 nd - nd - 191 (14.1) 1 .8 nd - nd - 289 (15.1) 1 .1
D C 22 nd - nd - nd - nd - 12 (0.6) 8 .5
M id-cha in h ydroxy acids
x,16 d ihydroxy hexad ecanoic acid s
(x= 8, 9 and 10) (x,16 -D iO H C 16) 166 (8.1) 3 ,9 11 (1.7) 13,6 nd - 321 (9.1) 3 ,4 90 (6.8) 2 .6 27 (1.4) 5 .1
9-hyd roxy hexad ecaned ioic acid
(9-O H D C 16) 32 (1.6) 7 .4 16 (2.5) 8 ,4 nd - 32 (0.9) 1 ,9 130 (9.8) 9 .7- nd -
9, 10 d ihyd roxyoctad ecanoic acid
(9,10-D iO H C 18) nd - nd - nd - 54 (1.5) 3 ,3 nd - nd -
11, 18 d ihyd roxyoctad ecenoic acid
(11,18-D iO H C 18:1) 269 (13.1) 1 ,0 nd - 5 (0 .4) 6 .6 420 (11.9) 4 ,6 144 (10.8) 2 .0 29 (1.5) 4 .0
x, 18 d ihydroxyoctad ecenoic acid s
(x= 9 and 10) (x,18 D i-O H C 18:1) 139 (6.8) 0 ,9 nd - nd - 160 (4.5) 2 ,2 24 (1.8) 3 .8 nd -
9,10,18 trihydroxyoctad ecanoic acid
(9,10,18-T riO H C 18) 46 (2.2) 5 ,7 6 (0 .9) 2 ,0 nd - 368 (10.4) 7 ,2 123 (9.2) 6 .3 30 (1.6) 18.3
9,10 epoxy, 18 hyd roxyoctad ecanoic
acid
9,10-epoxy,18-O H C 18
118 (5.7) 0 ,5 9 (1 .4) 3 ,0 nd - 918 (26.0) 5 ,6 262 (19.7) 0 .3 70 (3.6) 1 .5
4.3.1.6. Mid-chain hydroxy acids
Seven mid-chain hydroxy acids were identified in the depolymerisate of plant samples (Table
3). Their total concentration is high in wheat leaves, where they represented 64.3% of the total
monomers. Wheat stems and maize leaves contained the same amount of mid-chain hydroxy
acids (770 µg g-1
of dry sample), which represented 58.0% and 37.5% of the total monomers
for wheat stems and maize leaves, respectively. Wheat roots as well as maize stems and roots
contained low amounts of mid-chain hydroxy compounds.

86
The isomeric mixture (x,16)-dihydroxy hexadecanoic acids (x=8, 9, and/or10) (x,16-DiOH
C16), the 18-hydroxy-9,10-epoxy octadecanoic acid (9,10-epoxy, 18-OH C18) and the 9,10,18-
trihydroxyoctadecanoic acid (9,10,18-TriOH C18) were detected in all the samples except in
maize roots (Table 1). The 9,10-epoxy, 18-OH C18 was quantified as the isomeric mixture of
the 9-methoxy,10,18-dihydroxyoctadecanoic and the 9-hydroxy,10-methoxy,18-
hydroxyoctadecanoic acids. When the epoxy acid is released through saponification, the
epoxy function reacts upon basic hydrolysis to be converted into vicinal diols and vicinal
methoxy-alcohol groups (Goñi and Hedges, 1990a; Holloway and Deas, 1973). Thus, the
9,10,18-TriOH C18 acid found in the present study probably results from the conversion of a
part of the 9,10-epoxy,18-OH C18 acid. Therefore, under our analytical procedure, the
9,10,18-TriOH C18 acid originating from the 9,10-epoxy,18-OH C18 acid could not be
distinguished from the preexisting 9,10,18-TriOH C18 acid and the 9,10-epoxy,18-OH C18
acid might be underestimated. These compounds are the most common monomers identified
in cutins ( Hunneman and Eglinton, 1971; Holloway, 1973; Espelie et al., 1979; del Rio and
Hatcher, 1998; Espelie et al., 1980; Matzke and Riederer, 1991).
The 9-hydroxyhexadecan 1,16 dioic acid (9-OH DC16) was present only in the stems and
leaves of wheat and maize (Table 1). This compound was previously identified as a major
suberin mid-chain hydroxylated monomer of the Aspidistra elatior roots (Zeier and Schreiber,
1998). The 9,10-dihydroxyoctadecanoic acid (9,10-DiOH C18), recognized thanks to the mass
spectrum of the corresponding synthetic product published in Eglinton et al. (1968), was only
detected in wheat leaves. Finally, three isomers of the dihydroxyoctadecenoic acid could also
be identified through their mass spectra: the 9,18-dihydroxyoctadecenoic acid which coeluted
with the 10,18-dihydroxyoctadecenoic acid (x,18-DiOH C18:1) and the 11,18-
dihydroxyoctadecenoic acid (11,18-DiOH C18:1). These compounds were already described in
cutins of different plant species (Graça et al., 2002). We will now examine the distribution, of
mid-chain hydroxy compounds in each plant organ so as to derive their specificity as markers
of above ground tissues.
4.3.1.7. Distribution of mid-chain hydroxy monomers in wheat leaves.
The highest concentrations of mid-chain hydroxy acids were obtained from the
depolymerisation of wheat leaves (2273 µg g-1
dry leaves). The most abundant compound was
the 9,10-epoxy, 18-OH C18 acid (25.9%) followed by the 11,18-DiOH C18:1 acid (11.9%),
9,10,18-TriOH C18 acid (10.4%) and the x,16-DiOH C16 acids (9.1%). The distribution of the
mid-chain hydroxy acids was different from that found in the cuticles of Triticum aestivun L.

87
by Matzke and Riederer (1990). In this latter study only two mid-chain hydroxy acids were
identified: the 9,10-epoxy,18-OH C18 acid and the x,16-DiOH C16 acids, accounting for
36.7% and 21.4% of the total released monomers, respectively.
These differences can be due to differences in the nature of plant samples and in the chemical
procedure. Concerning the first point, the monomeric composition of polyesters as cutins and
suberins is known to vary with the growth stage of a plant (Riederer and Schonherr, 1988),
the way plants are grown (Zimmermann et al., 2000), and the plant tissue examined (Espelie
et al., 1982; Zeier and Schreiber, 1997). Concerning the second point, in the present study, the
monomers were obtained from depolymerisation of total extracted leaves, which implies that
all the biopolyester types present in the different parts of the leaves were depolymerized. By
contrast, in the study of Matzke and Riederer (1990), the wheat cuticle was enzymatically
isolated. Furthermore, Matzke and Riederer (1990) depolymerized the samples using
transmethylation while we used saponification. These experimental differences could explain
the different distributions of the mid-chain hydroxy acids observed by Matzke and Riederer
(1990) in the cutins of wheat leaves.
4.3.1.8. Distribution of mid-chain hydroxy monomers in maize leaves.
All the mid-chain hydroxy carboxylic acids described in Table 3 were identified in maize
leaves, except the 9,10-DiOH C18 acid. The major monomers released were the 11,18-DiOH
C18:1 acid (13.1%), and the x,16-DiOH C16 acids (8.1%) (Table 1). The 9,10-epoxy,18-OH C18
acid, which was the most abundant monomer in wheat leaves accounted only for 5.7% of the
total monomers released from maize leaves. The contribution and distribution of the mid-
chain hydroxy acids in maize leaves were close to those found in maize cuticle by Espelie and
Kolattukudy (1979). They also quantified the dihydroxyoctadecenoic acid (with no detail on
the location of the hydroxy groups) and the x,16-x,16-DiOH C16 acids as major compounds of
maize cuticle, while the 9,10,18-TriOH C18 acid was a minor constituent, such as in the
present study. Nevertheless, the concentration of 9,10-epoxy,18-OH C18 acid is lower in the
present study than that found by Espelie and Kolattukudy (1979). As already explained for
wheat leaves, this difference might be due i) to the use of saponification as depolymerisation
method transforming a part of the 9,10-epoxy,18-OH C18 acid into the 9,10,18-TriOH C18
acid and ii) to the preparation of the sample prior to depolymerization. Espelie and
Kolattukudy (1979) analysed the maize cuticle and the bundle sheaths, enzymatically isolated
from maize leaves. In bundle sheaths the proportion of the 9,10-epoxy,18-OH C18 acid is
lower than in the cuticle. By contrast, we submitted the whole extracted maize leaves to

88
depolymerisation, which can explain, with the chemical transformation of monomer, the
lower proportion of the 9,10-epoxy,18-OH C18 when compared to the study of Espelie and
Kolattukudy (1979).
4.3.1.9. Mid-chain hydroxy monomers released from maize and wheat roots.
The contribution of mid-chain hydroxy acids to total root monomers was very low. In maize
roots only the 11,18-DiOH C18:1 could be detected, and represented 0.4% of the total released
monomers (Table 1 and 3). In wheat roots, four of the seven mid-chain hydroxy acids could
be identified, representing only 8.2% of the total monomers.
4.3.1.10. Distribution of mid-chain hydroxy monomers in maize and wheat stems.
Wheat stems contained a high proportion of mid-chain hydroxy acids (58% of the total
released monomers, Table 1). Their monomeric distribution was close to that of wheat leaves,
except for the 9-OH DC16 acid which concentration was higher in wheat stems. By contrast,
maize stems contained low amount of mid-chain hydroxy compounds (42 μg g-1
of dry stems,
representing only 6.5% of the total released monomers, Table 1), and their monomeric
composition was close to that of maize roots.
4.3.2. Specificity of the monomers and their possible use as biomarkers of below and above
ground tissues.
Diacids were only present in the polyesters of root samples, and can thus be regarded as
characteristics for the below ground plant biomass. Mid-chain hydroxy acids can be
considered as specific for above ground biomass and related to the presence of cutin. They
were abundant in wheat aboveground tissues and less in maize. Their abundance in wheat
stems suggests that these plant organs comprise a structure close to that of cutin. These mid-
chain hydroxyl acids are much less abundant in maize stems. Moreover, these plant organs
exhibit a substantial contribution of ω-hydroxy acids with an aliphatic chain ≥ to C20, thus
pointing to some suberin-like structure in addition to cutin for their biopolyesters although no
diacids could be detected,. Thus, the suberin is not specific for below ground tissues in non
woody plants.
When compared to leaves and stems, the higher proportion of ω-hydroxy carboxylic acids
observed in roots is especially due to the high concentration of the ωC22 and ωC24 monomers.
The release in high concentration of the latter monomers can be considered as characteristic

89
for root tissues. The other monomers are common to cutin or suberin biopolyesters and could
not strictly be related to the aboveground or the belowground biomass.
4.3.3. Isotopic composition
The table 4 shows the bulk 13
C isotopic signature in the different parts of the plants. These
results obtained in the present analysis are in adequacy with those previously published for
the same experimental fields (Dignac et al., 2005; Bahri et al., 2006). Maize leaves were 0.3
‰ depleted compared to stems and 0.9 ‰ depleted compared to roots. In wheat, the isotopic
signature of leaves was 1.0 ‰ lower than that of stems, and close to that of roots. Badeck et
al. (2005) compiled the data from literature to evidence differences in isotopic signatures
between plant organs, probably caused by post-photosynthetic fractionation processes, such as
respiration (Ghashghaie et al., 2003; Tcherkez et al., 2003; Nogués et al., 2004) or transport
of metabolites. The 13
C/12
C ratio shift between the bulk plant organs can also be due to
differences in the relative proportions of the different biomolecules (eg. lipids, cellulose…)
which have different 13
C signature (Gleixner et al., 1993). However this hypothesis was
rejected by Badeck et al (2005). So as to discriminate between post-photosynthetic
fractionation and molecular composition which is responsible for the relative isotopic
composition of leaves and roots in maize and wheat, we investigated the isotopic composition
of the monomers.
Table 4 : Bulk isotopic signature (δ13
C, ‰, VDPB) of the plant tissues, and estimated isotopic signature of their
biopolyesters, calculated as the weighted average of the monomers released by saponification balanced by their
concentration.( standard deviation for n = 3 repetitions)
* δ13
Caverage = (∑Ci δ13
Ci)/Ctot. The estimated isotopic signature was performed with 100% of the monomers for
wheat organs and 99.1% for maize leaves, 89.9% for maize stems and 96.6% for maize roots.
leaves
maize
stems
maize
roots
maize
leaves
wheat
stems
wheat
roots
wheat
Bulk δ13
C (‰) -12.8±0.5 -12.5±0.5 -11.9±0.5 -28.6±0.5 -27.6±0.5 -28.7±0.5
Estimated δ13
C (‰) of
the biopolyesters* -18,1±0.5 -16,0±0.5 -17,5±0.5 -33.0±0.5 -30,6±0.5 -33,1±0.5

90
4.3.3.1. 13
C depletion of biopolyesters compared to bulk organs
Thanks to the measurement of the isotopic signature of the different monomers released by
the depolymerisation of the plant organs (Table 5), we could estimate the isotopic signature of
plant biopolyesters by calculating the average isotopic signature of the monomers weighted
by their concentration in the considered plant organs (Table 4). The computed δ13
C values
evidenced that the biopolyesters are always depleted in 13
C compared to the bulk plant tissue.
Such isotopic depletion was already observed for the free lipid fraction of plants, and was
explained by the biosynthetic pathway of lipids in plant cells (Melzer and Schmidt, 1987;
Rossmann et al., 1991; Hobbie and Werner, 2004). In maize, the biopolyesters were depleted
relative to the total organ by 5.3 ‰ in leaves, 3.5 ‰ in stems and 5.6 ‰ in roots. In the wheat
plant, the depletion of biopolyesters compared to the bulk organ was slightly lower than for
maize, with 4.4 ‰ for leaves, 3.0 ‰ for stems and 4.4 ‰ for roots (Table 4). These results
are in accordance with those of Chikaraishi et al., (2004) who demonstrated that lipids in C3
plants are less depleted in 13
C relative to the bulk tissue than lipids in C4 plants. For both
maize and wheat, stems were enriched in 13
C compared to leaves and roots (Table 4), which
might be explained by a post-photosynthetic fractionation in bulk 13
C isotopes between plant
organs (Hobbie and Werner, 2004; Badeck et al., 2005). Differences in δ13
C of roots
compared to leaves can be accounted for different composition of monomers as estimated
δ13
C gives same trends as measured bulk values.
4.3.3.2. 13C values of monomers released from plant organs
The 13
C values of the monomers released from the saponification of the six samples of plant
tissues (Table 5) showed clear differences between maize and wheat organ and with a given
plant organ.
In maize, the isotopic signatures of mid-chain hydroxy carboxylic acids in stems and leaves
were less variable than those observed for carboxylic and ω-hydroxy carboxylic acids. By
contrast, in the wheat plant, the 13
C values of some mid-chain hydroxy carboxylic acids
greatly varied with the organ. For example, the 13
C of the 11,18-DiOH C18:1 was -34.6‰ in
leaves, -35.5‰ in stems and -38.2‰ in roots. Contrary to what is observed for maize plant,
the 13
C of ω-hydroxy carboxylic acids, except for the ωC24 monomer, were similar in all the
wheat organs.
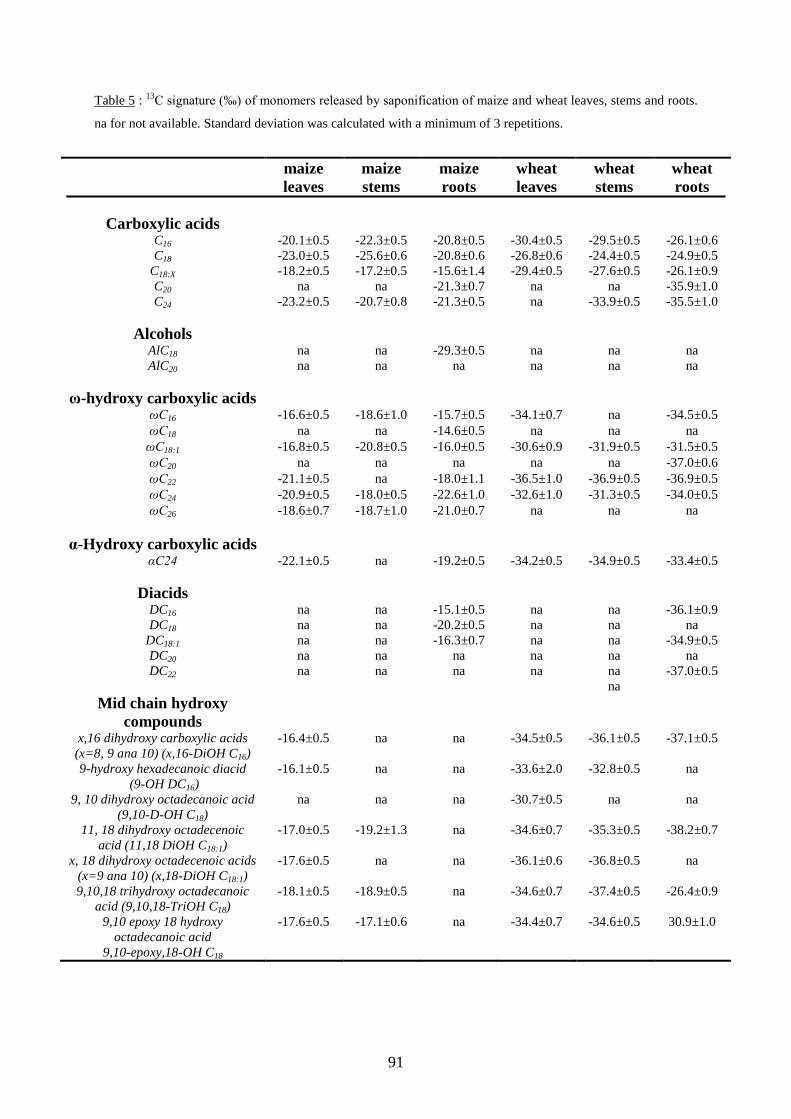
91
Table 5 : 13
C signature (‰) of monomers released by saponification of maize and wheat leaves, stems and roots.
na for not available. Standard deviation was calculated with a minimum of 3 repetitions.
maize
leaves
maize
stems
maize
roots
wheat
leaves
wheat
stems
wheat
roots
Carboxylic acids
C16 -20.1±0.5 -22.3±0.5 -20.8±0.5 -30.4±0.5 -29.5±0.5 -26.1±0.6
C18 -23.0±0.5 -25.6±0.6 -20.8±0.6 -26.8±0.6 -24.4±0.5 -24.9±0.5
C18:X -18.2±0.5 -17.2±0.5 -15.6±1.4 -29.4±0.5 -27.6±0.5 -26.1±0.9
C20 na na -21.3±0.7 na na -35.9±1.0
C24 -23.2±0.5 -20.7±0.8 -21.3±0.5 na -33.9±0.5 -35.5±1.0
Alcohols
AlC18 na na -29.3±0.5 na na na
AlC20 na na na na na na
ω-hydroxy carboxylic acids
ωC16 -16.6±0.5 -18.6±1.0 -15.7±0.5 -34.1±0.7 na -34.5±0.5
ωC18 na na -14.6±0.5 na na na
ωC18:1 -16.8±0.5 -20.8±0.5 -16.0±0.5 -30.6±0.9 -31.9±0.5 -31.5±0.5
ωC20 na na na na na -37.0±0.6
ωC22 -21.1±0.5 na -18.0±1.1 -36.5±1.0 -36.9±0.5 -36.9±0.5
ωC24 -20.9±0.5 -18.0±0.5 -22.6±1.0 -32.6±1.0 -31.3±0.5 -34.0±0.5
ωC26 -18.6±0.7 -18.7±1.0 -21.0±0.7 na na na
α-Hydroxy carboxylic acids
αC24 -22.1±0.5 na -19.2±0.5 -34.2±0.5 -34.9±0.5 -33.4±0.5
Diacids
DC16 na na -15.1±0.5 na na -36.1±0.9
DC18 na na -20.2±0.5 na na na
DC18:1 na na -16.3±0.7 na na -34.9±0.5
DC20 na na na na na na
DC22 na na na na na -37.0±0.5
na
Mid chain hydroxy
compounds
x,16 dihydroxy carboxylic acids
(x=8, 9 ana 10) (x,16-DiOH C16)
-16.4±0.5 na na -34.5±0.5 -36.1±0.5 -37.1±0.5
9-hydroxy hexadecanoic diacid
(9-OH DC16)
-16.1±0.5 na na -33.6±2.0 -32.8±0.5 na
9, 10 dihydroxy octadecanoic acid
(9,10-D-OH C18)
na na na -30.7±0.5 na na
11, 18 dihydroxy octadecenoic
acid (11,18 DiOH C18:1)
-17.0±0.5 -19.2±1.3 na -34.6±0.7 -35.3±0.5 -38.2±0.7
x, 18 dihydroxy octadecenoic acids
(x=9 ana 10) (x,18-DiOH C18:1)
-17.6±0.5 na na -36.1±0.6 -36.8±0.5 na
9,10,18 trihydroxy octadecanoic
acid (9,10,18-TriOH C18)
-18.1±0.5 -18.9±0.5 na -34.6±0.7 -37.4±0.5 -26.4±0.9
9,10 epoxy 18 hydroxy
octadecanoic acid
9,10-epoxy,18-OH C18
-17.6±0.5 -17.1±0.6 na -34.4±0.7 -34.6±0.5 30.9±1.0
92
As previously observed for bulk isotopic signature, the differences in the δ13
C of a specific
monomer between leave, stem and root organs can be explained by a post-photosynthetic
fractionation on the 13
C isotopes between plant organs (Hobbie and Werner, 2004; Badeck et
al., 2005). In plant, the bound lipid synthesis and turnover is probably slower than that of free
lipids. Monomers constitutive of a biopolyester are synthesized according to the plant
requirements in the course of time (Kolattukudy and Dean, 1974; Lendzian and Schonherr,
1983; Riederer and Schonherr, 1988). Furthermore, Ménot and Burns, (2001) and Skrzypek et
al., (2007) evidenced that different weather conditions induced high differences in isotopic
content of molecules in a same plant species. In laboratory experiments, high hydric and salt
stresses applied to plants led to an isotopic fractionation of the synthesised molecules
(Brugnoli and Lauteri, 1991; Monti et al., 2006). The combination of all these possible
sources of variation could lead to the high shifts in isotopic signatures of the monomers
observed in the present study since plant samples were collected just before harvest and were
subjected to environmental stresses.
In a same class of compounds, the monomers with a chain length longer than 20 carbon atoms
were generally depleted in 13
C when compared to the C16 and C18 monomers (Table 5).
Nevertheless, the ωC24 shows a significative enrichment in 13
C when compared to lower
homologues in wheat. In a monomer class, the depletion in 13
C with increasing chain length
was already observed for free alkanes and carboxylic acids in wheat and maize plant
(Chikaraishi et al., 2004; Wiesenberg et al., 2004a). The elongation of the carbon chain
involves the acetyl-CoA and the malonyl-CoA that are responsible for the 13
C depletion
(Melzer and Schmidt, 1987). The high variation in δ13
C can also be the result of the many
intermediate biomolecules formed during the C chain elongation process (Chikaraishi et al.,
2004).
Mid-chain hydroxy monomers are compounds with 16 and 18 carbon atom. Their
biosynthetic pathway had been deeply studied. According to Dean and Kolattukudy, (1977),
Kolattukudy, (1981) and Lendzian and Schonherr, (1983), all the compounds with a same
chain length originate from the same carboxylic acid. Since the biosynthesis pathway
transforming a molecule into another does not involve any change in the aliphatic carbon
chain, the molecules with the same number of carbon atoms should have the same isotopic
signatures, while significant variations were observed for all plant samples (Table 4). In
maize leaves, mid-chain hydroxy compounds were slightly enriched compared to the other

93
classes of monomers. Isotopic signatures of all the mid-chain hydroxy acids were similar,
except for the enrichment of the x,16-DiOH C16. Accordingly, in maize stems, the isotopic
signatures of mid-chain hydroxy monomers were close. On the opposite, in wheat leaves,
stems and roots, isotopic values of mid-chain hydroxy monomers showed high disparities.
These variations in 13
C content of the monomers could have several explanations. Chikaraishi
et al (2007) already reported differences in isotopic signatures of free carboxylic acids,
alcohols and alkanes from plant leaves of terrestrial higher plant. These three compound
families derive from the same alkyl precursor, meaning that, for example, the hexadecanol
and the hexadecanoic acid derived from the alkyl C16 precursor. Nevertheless, Chikaraishi et
al (2007) explained the isotopic differences by a 13
C fractionation occurring on the
biosynthetic branching point. In the present study, the differences between the monomers with
the same aliphatic chain length are higher than those observed by Chikaraishi et al (2004) and
could not be explained only by 13
C fractionation at the biosynthetic branching point.
Thus, photorespiration and isotopic fractionation at metabolic branch points, coupled to
different environmental stresses during metabolism for C3 and C4 plants, probably influence
13C content of cutin and suberin monomers. Differing
13C content of mobile (sugar) and
immobile (cutin and suberin monomers) compounds such may then create isotopic differences
among plant pools and along transport pathway (Hobbie and Werner, 2004). These are
probably the main causes of such high disparity in isotopic values at the organ scale, such as
at the plant scale.
94
4.4. Conclusion
This study allowed for a complete identification and quantification of biopolyesters in the
aboveground and the belowground of the two crop plants. Some biomarkers were specific for
leaves stems and roots. Mid-chain hydroxy acids could be related to the aboveground biomass
and to the presence of cutin. They were released in high concentration from leaves and from
wheat stems. By contrast, diacids were only present in the polyesters of root samples, and can
be regarded as characteristic for the belowground plant biomass Maize stems had a low
content in mid-chain hydroxy acids contrary to wheat stems which had a composition close to
that of wheat leaves. This clear difference in the biopolymer composition of the two plants
species suggests that maize stems contain more suberin-like biopolymers than wheat stems.
Isotopic signatures measured in each monomer released by saponification underline the
complexity of the plant physiology, which might be influenced by many factors, such as
environmental conditions.
Specificity in the monomeric and isotopic composition of above and belowground tissues
evidenced in this study will be useful to evaluate the specific dynamics of these tissues in
soils and to differentiate their contribution to SOM formation.

95
CHAPITRE 5
DYNAMIQUE DES MONOMÈRES SPÉCIFIQUES DES
CUTINES ET DES SUBÉRINES DANS UN SOL
AGRICOLE

96

97
Dynamique des monomères specifiques des cutines et des subérines dans un
sol agricole
Molecular dynamics of cutins and suberins in an agricultural soil estimated by
natural abundance 13
C labelling in a wheat/maize succession
Soumis à Organic Geochemistry
5.1. Introduction
Stabilization and degradation processes turning the fresh plant material into stabilised soil
organic matter (SOM) remain unclear. Differences in these mechanisms, when roots and
shoots of plants are considered, lead to contrasted contributions of above ground and below
ground plant residues to SOM (Rasse et al., 2005). Previous studies suggested that root
contribution to SOM is higher than that of above ground tissues despite the lower inputs of
below ground tissues (Balabane and Balesdent 1996). Cutin and suberin monomers can be
used to study the degradation and stabilization processes of roots vs shoots in the soil matrix,
for two main reasons (Rasse et al., 2005):
(1) They are plant biomarkers of above and below ground tissues. Cutin is an amorphous
polyester constituted of carboxylic acids with an aliphatic chain of 16 and 18 carbon atoms,
bearing epoxy and hydroxy groups. Cutins cover the above ground biomass of higher plants
and fruit (Hunneman and Eglinton, 1971; Holloway, 1973; Espelie et al., 1979; Schmidt and
Schönherr, 1982; Kolattukudy, 1984; Riederer and Schonherr, 1988; Tegelaar et al., 1989b;
Goñi and Hedges, 1990a,b; Matzke and Riederer, 1991; Ray et al., 1998; Heredia, 2003).
Suberin is a structured polyester mostly composed of carboxylic acids, ω-hydroxy carboxylic
acids and diacids especially located in roots of higher plants, in bark and some suberized
tissues of the above ground biomass tissues. The particularity of suberin is the large amount
of monomers with a carbon chain longer than 20 carbon atoms (Dean and Kolattukudy, 1976,
1977; Holloway, 1983; Cordeiro et al., 1997 Zeier and Schreiber, 1997, 1998; Cordeiro et al.,

98
1998; Bernards, 2002;).
(2) Cutin and suberin are known to significantly contribute to SOM, and their constitutive
monomers are often released from the hydrolysis of soils (Riederer et al., 1993; Kögel-
Knabner et al., 1989; Nierop, 1998; Kögel-Knabner, 2002; Nierop et al., 2003; Otto et al.,
2005; Otto and Simpson, 2006;). Their monomers are also encountered in sediments due to
their preservation during sedimentation and diagenesis (Cardoso et Eglinton, 1975, 1983; Nip
et al., 1986; Goñi and Hedges, 1990c; Gleixner, 2001).
Previous studies on cutin and suberin contribution to soils did not allow to follow the
dynamics of these biopolyesters. The latter can only be investigated through the use of isotope
labelling. In order to describe the fate of these macromolecules in situ in soils, and to precise
their degradation /stabilisation processes, we therefore used stable carbon isotope labelling at
natural abundance in a succession of C3 and C4 vegetation. C3 plants such as wheat and C4
plants such as maize have different 13
C contents (13
C ≈ -27 ‰ and -12‰, respectively), due
to different photosynthetic pathway (Smith and Epstein, 1971). The 13
C natural abundance in
plants and soils can be used to evaluate the turnover of SOM in ecosystems that were initially
under C3 (or C4) vegetation and changed to a C4 (or C3) vegetation (Balesdent and Mariotti,
1996; Boutton, 1996). At the molecular level, 13
C analyses were successfully applied to study
the dynamic of carboxylic acids and alkanes (Wiesenberg et al., 2004a; Quénéa et al., 2006),
lignins (Bahri et al., 2006) and sugars (Derrien et al., 2006) in cropland soils. The 13
C natural
abundance of the monomers constitutive of cutin and suberin biopolyesters in soil has never
been studied although it would allow for a better understanding of their dynamic in soils.
The aims of this work were to 1) identify cutin and suberin monomers in leaves, stems and
roots of wheat and maize and assess their specificity for above- and below ground biomass; 2)
quantify the specific monomers in plants and soils in order to evaluate their inputs from plants
to soil and their contribution to SOM; 3) estimate the incorporation of maize-derived above-
and below ground biomarkers in soils after 6 and 12 years of maize cropping after wheat.

99
5.2. Material and methods
5.2.1. Experimental site, sampling and sample preparation
Soil and plant samples were collected from the INRA experimental field of “les Closeaux”
near the Château de Versailles in France, described in details in Dignac et al. (2005). The site
consists in a 12 year chronosequence of maize (C4 plant) cropping, replacing previous C3
vegetation. The field was divided into 32 plots (6.4 m×15 m). When the experimentation
began in 1993, the soil was cropped with wheat. Each year, since 1993, three plots were
converted into maize and four control plots were left with wheat. Soils were sampled from 0
to 25 cm in three points of the diagonal for each plot farther from the borders and mixed
together. Soils collected in 2002 (9 years of maize cropping after wheat and control soil under
wheat) and 2005 (12 years) were used for this study. Soil samples were sieved successively at
5mm and 2mm to remove crop residues, air-dried and ground at 200µm.
Leaves, stems and roots of maize and wheat were collected just before harvest, air-dried and
ground at 100µm. Root sampling by separation from soil cores is described in Bahri et al.
(2006).
In order to remove free lipids before depolymerisation, about 2 g of plant tissue or soil was
extracted three times with an accelerated solvent extractor Dionex ASE 200 in 30 ml
stainless-steel extraction vessels. The first extraction was carried out at 75°C in a solvent
mixture 3:1 (V:V) dichloromethane / methanol. The extraction was repeated changing the
temperature to 140°C. Finally, the sample was extracted with dichloromethane at 140°C. For
each extraction, the heating time was 5 min, the static extraction lasted 20 min at a pressure of
5 х 106 Pa (Wiesenberg et al., 2004b).
5.2.2. Saponification
The extracted sample (100 mg for plants and 1g for soils) was refluxed for 18 h in an aqueous
solution of potassium hydroxide (KOH) 6% in methanol (Cardoso and Eglinton, 1975; Ray et
al., 1995), which we recently showed to be the most appropriate method for the quantification
and characterization of biopolyesters in plants and soils (Mendez-Millan et al., submitted).
The solution was filtered and the residue washed with methanol/water (9:1) (V:V). 150 ml of
distilled water was added to the mixture and the solution was adjusted to pH 2 with HCl 6N in
order to extract acidic lipids (Naafs and Van Bergen, 2002). The aqueous solution was finally

100
extracted with dichloromethane (50 ml х 3). The volume of the recombined extracts was
reduced with a rotative evaporator under pressure and transferred into a vial until the sample
was prepared for analysis.
5.2.3. Derivatisation
Depolymerisation extracts were dried under nitrogen and redissolved in pyridine. Silylation
with BSTFA (N,O-Bis (trimethylsilyl)-Trifluoroacetamide) containing 1% of
trimethylchlorosilane (Altech) was performed at 70°C for 1h. Silylation transformed hydroxy
and carboxylic acid functions into their trimethylsilyl ether and ester derivatives (TMS ether /
TMS ester).
5.2.4. Identification
Saponification extracts were analyzed by GC/MS after derivatisation. Separation and
identification were performed with a HP GC 6890 gas chromatograph equipped with a SGE
BPX-5 column (50 m х 0.25 mm х 0.32 µm) and an Agilent 5973 Electronic Impact (70 eV)
mass spectrometer. The GC oven temperature was programmed at 100°C for 2min, then from
100°C to 150°C at 10°C/min, from 150°C to 200°C at 5°C/min, and finally at a rate of
2°C/min from 200°C to 350°C and 5 min at 350°C. Compounds released by depolymerisation
were identified according to their fragmentation pattern supported by comparison with
published mass spectra and with a mass spectra library (Wiley).
5.2.5. Quantification
Separation and quantification were performed with a HP GC 6890 gas chromatograph
equipped with a SGE BPX-5 column (50 m х 0.25 mm х 0.32 µm) and a flame ionisation
detector (FID). The GC oven temperature program was identical to the one used for
identification. The monomers were quantified by using an internal standard, the nonadecanoic
acid, added prior to derivatisation. An external calibration with the 10,16-
dihydroxyhexadecanoic acid was used to calculate the concentrations from the ratio of the
peak area of each compound to that of the internal standard. The response factor between the
nonadecanoic acid and the 10,16-dihydroxyhexadecanoic acid was close to 1.
For quantification as well as for isotopic signature measurements, the 9,10-epoxy, 18-OH C18
was quantified as the isomeric mixture of the 9-methoxy,10,18-dihydroxyoctadecanoic and

101
the 9-hydroxy,10-methoxy,18-hydroxyoctadecanoic acids and the 9,10,18-TriOH C18 acid.
Indeed, the epoxy function reacts upon basic hydrolysis to be converted into vicinal diols and
vicinal methoxy-alcohol groups (Holloway and Deas, 1973). The 9,10,18-TriOH C18 acid can
also result from the partial conversion of the 9,10-epoxy,18-OH C18 acid.
The inputs of the monomers from plants were calculated by weighting the monomer contents
obtained for each part of the plants with the quantities of each part of the plants incorporated
into the soil after harvest (values given in Bahri et al., 2006).
5.2.6. Isotopic measurements
Isotopic analyses were carried out with a GC HP5890 coupled with an Isochrom III Isotopic
mass spectrometer (Micromass-GVI Optima). Samples were injected in the splitless mode.
The same column and chromatographic conditions were used as for the identification and
quantification. The δ13
C values were measured for the silylated monomers of the molecules of
interest. These values were corrected for the δ13
C of carbon atoms introduced by silylation,
measured off-line with Elemental Analyser (EA) coupled to isotopic ratio mass spectrometer
(Micromass NA 1500 NC). The proportion F of maize derived monomer in soil was
calculated for each monomer according to the simplified equation from ((Balesdent and
Mariotti, 1996), which was shown to be valid at the molecular level for the Closeaux
experiment in Dignac et al. (2005):
wheatmaize
wtF
where δt is the δ13
C of the monomer in soil cropped with maize for t= 6 or 12 years of maize
cropping, δw is the δ13
C of the monomer in control soil under wheat, δmaize is the δ13
C of the
monomer in the maize plant and δwheat is the δ13
C of the monomer in the wheat plant.

102
5.3. Results and discussion
5.3.1. Comparison between monomer inputs from plants with soil monomer distribution
Table 1 shows the total inputs of each monomer from wheat and maize plants and the
contribution of the different parts of the plant to this input. The inputs of the monomers were
similar for wheat (3.9 µg g-1
soil) and maize (3.7 µg g-1
soil). The contribution of the
biopolyesters deriving from leaves and stems was high, representing respectively 87% of the
total inputs for wheat and 81% for maize.
5.3.1.1 Specific root/shoot origin of the monomers present in soils
Six classes of compounds were released from the depolymerisation of leaves, stems and roots
of wheat and maize plants : carboxylic acids, one α-hydroxy carboxylic acid (αC24), ω-
hydroxy carboxylic acids, mid-chain hydroxy carboxylic acids, diacids and alcohols. These
compounds released from plant samples were previously identified in cutins of wheat and
maize leaves (Espelie et Kolattukudy, 1979; Matzke and Riederer, 1990) and in suberized
tissues of maize roots (Zeier et al., 1999). The same six classes of compounds as in the plant
samples (Table 1), were identified in the soil samples. They were also commonly released
from base hydrolysis of soils (Otto et al., 2005).
In the following, the relative inputs of these monomers from plants (Table 1) will be
discussed along with their potential use as markers of above ground (or below ground)
biopolyesters.
- carboxylic acids
The carboxylic acids are not specific for shoot or root polymers in plants as the same
compounds (C16, C18, C18:x, C20 and C24) are detected in both above ground and below ground
parts of the two plants (Table 1). Moreover, C16, C18 and C18:x carboxylic acids were shown to
also originate from microbes (Otto et al., 2005) or waxes (Kolattukudy and Walton, 1973).
The same carboxylic acids are identified in soils after depolymerisation (Fig.1). They
represent ≈ 40 % of the total monomers in soils (Table2), i. e. much more than in plants (16
and 30 % in wheat and maize, respectively), pointing to an additional source. As a result,
carboxylic acids cannot be used for estimating the dynamics of cutin/suberin biomarkers in
soils.

103
Table 1 : Annual input of monomers in soils from wheat and maize plants (in ng g-1
dry soil) (1) and contribution of the
different plant organs to this input (proportion of the total monomer incorporated into soil, %) (2). nd for not detected.
Total
wheat
input(1)
Wheat
leaves
(%)(2)
wheat
stems
(%)
Wheat
roots
(%)
Total
maize
input
maize
leaves
(%)
maize
stems
(%)
maize
roots
(%)
Carboxylic acids
C16 293 58 30 12 471 61 27 12
C18 114 53 35 12 181 33 48 19
C18:X 174 69 22 9 360 56 32 12
C20 7 0 0 100 35 55 19 27
C24 16 0 62 38 66 58 22 20
Alcohols
AlC18 nd nd nd nd 11 nd nd 100
AlC20 nd nd nd nd 5 nd nd 100
ω-hydroxy carboxylic acids
ωC16 73 51 0 49 189 32 27 41
ωC18 nd nd nd nd nd nd nd nd
ωC18:1 503 51 30 19 687 75 8 17
ωC20 16 nd nd 100 15 nd nd 100
ωC22 211 36 19 45 80 18 38 43
ωC24 166 26 43 31 180 40 22 38
ωC26 nd nd nd nd 135 57 20 23
α-Hydroxy carboxylic acids
αC24 71 72 18 10 176 58 28 14
Diacids
DC16 13 nd nd 100 21 nd nd 100
DC18 nd nd nd nd 11 nd nd 100
DC18:1 78 nd Nd 100 97 Nd nd 100
DC22 3 nd nd 100 nd nd nd nd
Mid chain hydroxy compounds
x,16 dihydroxy carboxylic acids
(x=8, 9 and 10) (x,16-DiOH C16) 289 72 26 3 204 95 5 nd
9-hydroxy hexadecanoic diacid
(9-OH DC16) 129 16 84 nd 51 68 32 nd
9, 10 dihydroxy octadecanoic acid
(9,10-DiOH C18) 35 100 nd nd nd nd nd nd
11, 18 dihydroxy octadecenoic
acid (11,18-DiOH C18:1) 398 68 30 2 324 94 5 nd
x, 18 dihydroxy octadecenoic
acids (x=9 and 10)
(x,18-DiOH C18:1)
123 84 16 nd 156 100 nd nd
9,10,18 trihydroxy octadecanoic
acid (9,10,18-TriOH C18) and
9,10 epoxy, 18 hydroxy
octadecanoic acid
9,10-epoxy,18-OH C18
1175 71 27 2 201 92 8 nd
Total 3886 59 28 13 3657 63 18 19

104
Table2: * Concentration mean (µg/g of dry soil) of the monomers released by depolymerisation of soil under
wheat, and the soils after 6 and 12 years of maize cropping. 1proportion (in %) of the monomer relative to the
total monomers released in soil. 2Sd : Standard deviation of the mean calculated from triplicates analyses. nd for
not detected
Soil under
wheat* (%)1
sd2
(%)
Soil after
6years of
maize
cropping
sd
Soil after 12
years of
maize
cropping
sd
Carboxylic acids
C16 14,4 (23.3) 0,2 10,8 (17.3) 0,7 13,7 (19.0) 0,7
C18 8,2 (13.3) 1,2 5,2 (8.4) 0,0 6,2 (8.6) 0,0
C18:X 2,4 (3.8) 0,0 3,8 (6.1) 1,6 6,4 (8.9) 1,6
C20 1,0 (1.7) 0,3 1,0 (1.7) 0,3 1,2 (1.6) 0,3
C22 1,6 (2.7) 0,1 1,8 (2.9) 0,2 1,9 (2.7) 0,2
C24 1,0 (1.7) 0,2 1,2 (1.9) 0,4 1,3 (1.9) 0,4
C26 0,3 (0.4) 0,0 0,6 (0.9) 0,2 0,8 (1.1) 0,2
sum of carboxylic acids 29,0 (47) 0,8 24,4 (39.2) 3,0 29,4 (40.8) 3,0
Alcohols
AlC18 1,9 (3.0) 0,3 1,7 (2.8) 0,8 1,5 (2.1) 0,8
AlC22 0,4 (0.7) 0,1 0,4 (0.7) 0,0 0,5 (0.7) 0,0
sum of alcohols 2,3 (3.7) 0,3 2,1 (3.5) 0,8 2,0 (2.8) 0,8
ω-hydroxy carboxylic acids
ωC16 1,9 (3.1) 0,4 2,7 (4.3) 0,6 2,9 (4.0) 0,6
ωC18:1 1,0 (1.7) 0,2 2,1 (3.4) 0,5 2,4 (3.3) 0,5
ωC20 1,3 (2.1) 0,3 1,3 (2.1) 0,3 1,4 (1.9) 0,3
ωC22 4,6 (7.4) 0,3 7,2 (11.6) 0,4 7,8 (10.8) 0,4
ωC24 3,5 (5.6) 0,9 4,5 (7.3) 1,7 6,7 (9.3) 1,7
ωC26 0,3 (0.4) 0,0 0,3 (0.5) 0,0 0,4 (0.5) 0,0
sum of ω-hydroxy carboxylic
acids 12,5 (20.3) 2,0 16,6 (26.7) 2,9 21,5 (29.9) 2,9
α-hydroxy carboxylic acids
αC24 1,6 (2.5) 0,2 0,7 (1.1) 0,1 1,7 (2.3) 0,1
αC26 0,3 (0.4) 0,0 0,2 (0.3) 0,0 0,2 (0.3) 0,0
sum of α-hydroxy carboxylic acids 1,8 (2.9) 0,2 0,9 (1.4) 0,1 1,9 (2.6) 0,1
Diacids
DC16 0,6 (1.0) 0,2 0,9 (1.5) 0,3 1,2 (1.6) 0,3
DC22 0,8 (1.2) 0,0 1,1 (1.8) 0,8 1,0 (1.4) 0,8
DC24 0,6 (1.0) 0,2 0,2 (0.3) 0,0 0,2 (0.3) 0,0
Sum of diacids 2,0 (3.2) 0,4 2,2 (3.6) 1,1 2,4 (3.3) 1,1
Mid-chain hydroxy acids
x,16-DiOH C16 (x=8, 9 and 10) 6,6 (10.6) 0,9 8,7 (14.0) 1,1 8,1 (11.2) 1,1
9-OH DC16 4,0 (6.5) 0,3 3,5 (5.7) 1,1 3,2 (4.4) 1,1
11,18-DiOH C18:1 1,1 (1.8) 0,3 1,1 (1.7) 0,3 1,3 (1.8) 0,3
x,18 Di-OH C18:1(x=9 and 10) 0,5 (0.8) 0,1 0,6 (0.8) 0,1
8,9,18-TriOH C18 and
9,10-epoxy,18-OH C18 2,4 (3.9) 0,4 2,2 (3.5) 0,6 1,7 (2.4) 0,6
sum of Mid-chain hydroxy acids 14,1 (22.9) 1,8 16,0 (25.7) 2,9 14,8 (20.6) 2,9
TOTAL 61,7 3,6 62,2 8,3 72,0 8,3

105
µg
g-1
dry
so
il
0
2
4
6
8
10
12
14
16
C1
6
C1
8
C1
8:X
C2
0
C2
2
C2
4
C2
6
AlC
18
AlC
20
ωC
16
ωC
18
:1
ωC
20
ωC
22
ωC
24
ωC
26
x,1
6-D
iOH
C1
6
9-O
H D
C1
6
11
,18
-DiO
H C
18
:1
x,1
8-D
iOH
C1
8:1
9,1
0 e
po
xy
an
d9
,10
-DiO
H
18
-OH
C
18
DC
16
DC
22
DC
24
αC
24
αC
26
Soil under w heat
Soil after 6 years of m aize cropping
Soil after 12 years of m aize cropping
Soil under w heat
Soil after 6 years of m aize cropping
Soil after 12 years of m aize cropping
- α-hydroxy carboxylic acid (αC24)
The C24 α-hydroxy carboxylic acid is identified in all the investigated plant materials in the
present study (Table 1). It was already identified in both suberin from maize roots (Zeier et
al., 1999; Zimmermann et al., 2000), and in cutin from wheat leaves (Matzke and Riederer,
1990). Moreover, apart from not being specific for roots or shoots, this monomer might not be
specific for biopolyesters either (Molina et al., 2006). As carboxylic acids, this monomer will
therefore not be taken into account to study the dynamics of cutin/suberin in soils.
Figure 1: Monomer concentrations (µg g-1
dry soil) in soils under wheat and soils having received 6 or 12 years
of maize cropping after wheat. Standard deviation for n = 3 repetitions
- ω-hydroxy carboxylic acids
In many studies, this class of compounds, and particularly the monomers with more than 20
carbon atoms, is univocally considered as root suberin moieties (Nierop, 1998; Otto et al.,
2005). Indeed, such monomers were shown to be major constituents of root suberin

106
(Kolattukudy, 1981, 1984; Zeier and Schreiber, 1997, 1998; Bernards et al., 2002). However,
in the present study, 61% of the ω-OH carboxylic acids longer than C20 originated from wheat
leaves and stems and 66 % from maize ones (Table 1). The presence of these monomers in
above ground tissues and particularly in leaves therefore suggests the occurrence of suberized
tissues in the above ground biomass, although they are often considered as specific for root
suberin. In the present agricultural soils, ω-OH carboxylic acids ranged from C16 to C26 with a
maximum at C22 and C24. The latter two monomers represented more than 65% of the ω-OH
carboxylic acids in soils, whereas they only accounted for 39 and 20 % of this class of
monomers in wheat and maize, respectively (Table 1). The increase from plants to soils of the
relative contribution of ω-OH carboxylic acids with more than 20 carbon atoms and especially
of the C22 and ωC24 monomers, suggests a higher contribution of suberin from roots, although
major inputs for this class arise from above ground polymers. Moreover, the concentration of
long chain ω-OH carboxylic acids (especially C22 and C24, which are the major root suberin
monomers) increases in soils from the wheat cropped soil to the maize ones. This is likely
related to root density of maize and wheat plant in the studied surface horizon as maize root
density is higher than that of wheat (Aggarwal et al., 2006; Ju et al., 2007) As a result, we will
consider the ω-OH carboxylic acids in the study of the dynamics of suberin.
- mid-chain hydroxy carboxylic acids
When the monomer classes are considered, mid-chain hydroxy carboxylic acids are the main
contributors (55 %) of wheat monomers (Table 1). Mid-chain hydroxy acids were not present
in the below ground biomass in maize, and they contribute to the wheat roots in trace amounts
(Table 1). Six mid-chain hydroxylated acids were identified in all the wheat and maize above
ground tissues (Table 1). Within this class of compounds, the contributions of the 9,10,18-
TriOH C18 and 9,10-epoxy,18-OH C18 monomers in wheat leaves and stems were particularly
high (30% of the total monomer input from wheat, Table 1). The lower contribution of these
two aforementioned monomers in maize when compared to wheat, is responsible for the
lower contribution of the mid-chain hydroxy acid class in maize (26% of the total maize
monomer input). This was the main difference between wheat and maize, which monomer
distributions were otherwise quite similar. In maize input, the major mid-chain hydroxy acid
was the 11,18-DiOH C18:1 acid (35% of this class) followed by the x,16-DiOH C16 acids
(22%) and the 9,10,18-TriOH C18 and 9,10-epoxy,18-OH C18 acids (21%). They can thus be
considered as specific for above ground biomass. The mid-chain hydroxy acids have never

107
been reported to come from other plant or microorganism sources (Kögel-Knabner et al.,
1989; Tegelaar et al., 1991; Kunst and Samuels, 2003; Nierop et al., 2006; Otto et al., 2005).
In soils, taken together, the mid-chain hydroxy acids account for 20-25% of the total
monomers. This class is dominated by the x,16-DiOH C16 acids (50% of the mid-chain
hydroxylated acids, Table 2), followed by the 9-OH DC16 acid (24 %) and the 9,10,18-TriOH
C18 and 9,10-epoxy,18-OH C18 acids (14 %).
- diacids
Three diacids were released exclusively from maize and wheat roots (DC16, DC18:1 and DC22
for wheat and DC16, DC18 and DC18:1 for maize) and they account for 2.4 and 3.5 % of the
monomers in wheat and maize, respectively (Table 1). The diacids were only released from
roots and could thus be specific for belowground biomass (Nierop and Buurman, 1999, Otto
et al., 2005; Otto and Simpsom, 2006). For both wheat and maize roots, the DC18:1 was the
major diacid representing 82 % and 75 % of the total diacid family. In soils, three monomers
were identified, DC16, DC22 and DC24 with a predominance of the first two monomers. The
DC24, was not identified in wheat or maize roots in the present study, but it may be under the
detection thershold, as this monomer was often reported in maize root suberized tissues (Zeier
et al., 1999; Zimmermann et al., 2000).
- alcohols
Two alcohols were identified in maize roots only. This would point to a specificity for below
ground biomass but, in soils, they can also originate from other sources than plant
biopolymers, such as microbial bound lipids and waxes (Otto et al., 2005). Thus, these two
alcohols cannot be considered as specific for root suberin in soils. The same two alcohols
were identified in soils (Table 1) and their abundance was similar in the soil under wheat and
in the soils after 6 and 12 years of maize cropping, although these monomers were not
identified in any of the wheat tissues analyzed, where they might be under the detection limit.
Such a constant occurrence in soils would more likely support a microbial origin.
Therefore, from all monomer classes released from plant samples and incorporated into the
soil, only three are specific markers for plant biopolymers in soil. Mid-chain hydroxy
monomers are specific from cutin above ground biomass whereas ω-OH carboxylic acids with

108
a chain length longer than C20 and diacids were considered as root suberin derived monomers.
5.3.1.2. Relative distributions of monomers and classes of monomers from plants to soils:
selective preservation and/or degradation in soils.
Relative inputs from the different plant monomers are now discussed in relation with their
relative abundance in soils. The concentrations of the monomers in soils after 0, 6 and 12
years of maize cropping after wheat are presented in the (Fig.1). Total monomer concentration
released from soils increased slightly along with years of maize cropping from 61.7 µg g-1
of
soil under wheat to 62.2 µg g-1
and 72.0 µg g-1
of soil after 6 and 12 years of maize cropping,
respectively.
Monomers with the higher inputs from plant biomass were not systematically the major
compounds in soil. Indeed, for example, the C18:1, which accounts for 13 % and 19 % of
plant inputs (Table 1) only represent from 1.7 % to 3.4 % of the soil monomers (Table 2).
Similarly, the 9, 10, 18 –trihydroxy octadecanoic acid and the 9, 10 epoxy, 18 hydroxy
octadecanoic acid, which together were by far the major compounds in wheat, represent less
than 3.9 % in soils. The differences observed in the relative proportions of monomers in plant
inputs and in soils and the fact that some monomers were identified only in soils can be
explained by several mechanisms:
1) Preferential degradation of unsaturated compounds: unsaturated monomers such as
the C18:1, ωC18:1, DC18:1, x,18-DiOH C18:1, and 11,18-DiOH C18:1 acids represent up to 33 % in
wheat and 44 % in maize of total monomer plant inputs. In soils, unsaturated monomers
represented only less than 15% of total monomers, likely reflecting the preferential
degradation of unsaturated monomers with respect to saturated counterparts. This general
tendency holds for the unsaturated compounds of all monomer families and was also verified
for the epoxy monomer, the epoxy function being as sensitive as unsaturations, easily
degraded by microorganisms. Preferential degradation of unsaturated compounds was already
suggested in other studies (Nierop et al., 2003).
2) limit of detection: some monomers like the DC24 or the ωC26 are observed in soils
although not detected in plants. In soils, their abundance is however lower than that of their
lower homologues suggesting they were below the limits of detection in plants. By contrast,
in soils, due to the selective degradation of other monomers, their relative contributions to the
total monomers increased, and allowed for their quantification.
3) protection within the polymer network: the position of some monomers in the
polymeric network can also be responsible for their selective preservation against microbial

109
attacks. Monomers with several hydroxy functions, such as the x,16-DiOH C16 and 9-OH
DC16 acids, might be involved in highly cross-linked regions, where they are protected from
biodegradation, which would explain the relative increase of their contribution to soils (from
15.6% to 19.7%) compared to plants inputs (from 6.9% to 10.1% of total monomers). The
x,16-DiOH C16 acids and 9-OH DC16 acid monomers, relatively less abundant than other
monomers in plants are dominant in soils. Monomers present deeply inside the polymer
network could also be protected against microbial attacks (Nierop, 1998).
4) selective preservation of root-derived versus shoot-derived monomers: specific
monomers deriving from roots (diacids and ω-hydroxy carboxylic acids ≥ωC20) represented
from 18.7% to 25.9% of the total monomers in soils, while shoot-derived monomers
represented from 20.6% to 25.7% contrasting with the high inputs of above ground biomass
(more than 80 %). Roots are closely linked to soil matrix and their constitutive monomers
might be more susceptible to physical protection against microbial degradation than shoot
monomers (Rasse et al, 2005). Furthemore, partial degradation of the suberin can lead to
solubilization of the monomers in soils allowing their protection into the soil matrix (Oades,
1995). At last, root tissues are more likely resistant to soil microbial degradation than shoot
tissues, inferring a higher chemical recalcitrance against microbial attacks.
The comparison of the relative distributions of monomers in leaves, stems and roots of wheat
and maize plants and in soils evidenced major trends in degradation and / or stabilization
processes of the cutin and suberin polymers added to soils through plant input. Nevertheless,
molecular isotopic signature of monomers in plants and soils are necessary to evaluate their
dynamics by estimating the proportion of each monomer originating from maize in soil.
5.3.2. Maize-derived monomers in soils after 6 and 12 year of maize cropping.
In order to compare the dynamics of the above and below ground tissues of the plants in soils,
we estimated the incorporation of the biomarkers specific for cutins in shoots and for suberins
in roots. As discussed above, plant analysis suggested that mid-chain hydroxy carboxylic
acids are specific for leaves and stems, whereas diacids are specific for roots. Furthermore,
soil analysis suggested that ω-hydroxy carboxylic acids with more than 20 carbon atoms may
be strongly related to the inputs of root suberized tissues.

110
5.3.2.1. Isotopic signature of monomers released from plants and soils
The 13
C contents of the biomarkers were measured in the leaves, stems and roots of the wheat
and maize plants. The isotopic signatures presented in table 3 for each monomer of the plant
inputs are the average isotopic signatures, obtained by weighting the isotopic content of each
tissue (leaves, stems, roots) by its contribution to total plant input. In order to distinguish the
specific input from roots, we also showed in the Table 3 the isotopic signatures of ω-hydroxy
carboxylic acids with more than 20 carbon atoms, which are characteristic for root suberized
tissues in soils.
In wheat, the C16, C18, and C18:x carboxylic acids monomers were enriched in 13
C, with a 13
C
ranging from -25.5 ‰ to -29.0 ‰., while the isotopic signatures of the other monomers
ranged from -30.7 ‰ to -37.0 ‰. In the maize, the 13
C isotopic signatures of the monomers
ranged from -14.6 ‰ to -29.3 ‰, although most of the values ranged from -16 ‰ to -21.5‰.
The biosynthetic pathway of the monomers constitutive of cutins and suberins involves the
same precursors (Kolattukudy, 1981, 1984) and an homogeneous 13
C content would be
expected for these monomers.The wide range of 13
C contents observed could be explained by
the fact that the monomers constitutive of cutins and suberins are synthesized according to the
plant requirements all along the growing season (Kolattukudy and Dean, 1974; Lendzian and
Schonherr, 1983; Riederer and Schonherr, 1988). The structure and composition of these
biopolyesters are known to largely vary according to the conditions of growth (Zimmermann
et al., 2000). Furthermore, the 13
C isotopic contents of the different molecules synthetized by
the same plant have been shown to highly vary with the climatic conditions (Ménot and
Burns, 2001; Skrzypek et al., 2007), or with the hydric and salt stresses applied to plants in
laboratory conditions (Brugnoli and Lauteri, 1991; Monti et al., 2006).
For maize and wheat, the 13
C isotopic signatures of the ω-hydroxy carboxylic acids of root
suberin (in bracket in the table 2) were lower than their isotopic signatures in the whole plant
input. Photorespiration and isotopic fractionation at metabolic branch points, coupled to
different allocation patterns during metabolism for C3 and C4 plants, probably influence
compound-specific isotopic differences and may then create isotopic differences among plant
pools and along transport pathways (Badeck et al., 2005; Hobbie and Werner, 2004).

111
Table3: * Isotopic signature average (‰ /VPDB) of the monomers released by depolymerisation of leaves, stems
and roots of maize and wheat. Standard deviation was calculated for a minimum of 3 repetitions
(1) For ω-hydroxy carboxylic acids with a chain length longer than 20 carbon atoms, the isotopic signature of the
monomer in roots is given in brackets.
Wheat* Soil under
wheat
Soil 6 YMC Soil 12
YMC
Maize*
Carboxylic acids
C16 -29.0±0.5 -25.7±0.1 -23.9±0.7 -22.9±0.5 -21.0±0.5
C18 -25.5±0.5 -25.5±0.8 -24.2±0.5 -23.2±0.5 -23.8±0.6
C18:X -28.3±0.6 -23.9±1.8 -21.7±1.2 -18.6±0.5 -16.7±0.6
C20 -35.9±1.0 -29.3±2.0 -30.3±0.8 nd -21.3±0.7
C22 nd -31.4±0.6 -29.4±0.7 nd nd
C24 -34.5±0.8 -28.8±0.5 -28.9±0.8 nd -22.3±0.6
Alcohols
AlC18 nd -25.3±0.5 -24.7±0.5 nd -29.3±0.5
AlC20 nd nd nd nd nd
ω-hydroxy
carboxylic acids
ωC16 -34.2±0.6 -31.2±2.0 -28.4±0.5 -27.0 ±0.5 -17.1±0.7
ωC18 nd nd nd nd -14.6±0.5
ωC18:1 -30.9±0.7 -29.3±0.6 -24.8±0.5 -26.5±0.5 -17.1±0.5
ωC20 -37.0±0.6 -35.9±2.0 -29.0±0.5 -30.3±3.6 nd
ωC22 -36.7±0.5
(-36.9±0.5)(1)
-36.9±0.5 -32.7±0.5 -33.8±0.6 -19.0±0.8
(-18.0±1.1)
ωC24 -32.9±0.7
(-34.0±0.5)
-34.0±0.7 -28.7±0.5 -29.6±0.6 -21.1±0.7
(-22.6±1.0)
ωC26 nd -30.9±0.5 -26.6±0.5 -26.9±2.0 -19.2±0.8
(-21.0±0.7)
α-Hydroxy
carboxylic acids
αC24 -34.0±0.5 -32.3±0.7 -28.6±1.4 -29.5±0.5 -21.5±0.5
αC26 nd nd nd nd nd
Diacids
DC16 -36.1±0.9 -32.1±0.5 nd -28.0±0.5 -15.1±0.5
DC18 nd nd nd nd -20.2±0.5
DC18:1 -34.9±0.5 nd -29.0±0.5 nd -16.3±0.7
DC22 -37.0±0.5 -36.9±0.5 -32.4±0.5 -33.2±0.5 nd
DC24 nd -39.1±0.5 -30.4±0.5 nd nd
Mid-chain hydroxy
acids
x,16-DiOH C16
(x=8, 9 and 10)
-34.3±0.5 -33.2±0.6 -34.4±0.6 -32.9±0.6 -16.4±0.5
9-OH DC16 -33.3±1.5 -32.6±0.9 -30.1±0.8 -33.2±0.5 -16.1±0.5
9,10-DiOH C18 -30.7±0.5 nd nd nd nd
11,18-DiOH C18:1 -34.6±0.7 -30.6±1.5 -28.9±1.0 -30.3±0.5 17.1±0.8
x,18-Di-OH C18:1
(x=9 and 10)
-35.7±0.7 nd nd nd -17.6±0.5
9,10,18-TriOH C18 and
9,10-epoxy, 18-OH C18
-34.6±0.7 -31.0±1.0 -31.7±1.6 -29.5±1.4 -18.5±0.5

112
When comparing the isotopic signature of wheat monomers and that of compounds released
from the soil under wheat, it appears that most of the monomers in the wheat soil were
slightly enriched in 13
C compared to the wheat monomers. A relative enrichment of organic
molecules in soils compared to plants has already been observed for lignins (Bahri et al.,
2006), and free carboxylic acids (Wiesenberg et al., 2004a) and might be explained by a
preferential degradation of the light molecules.
The monomers present in the soils after 6 and 12 years of maize cropping were generally
enriched in 13
C compared to the soil under wheat, except for the mid-chain hydroxy acids
where the δ13
C did not change during the 12 years of cultivation. The 13
C enrichment of most
of the monomers evidenced an incorporation of maize derived monomers into soils.
Carboxylic acids in soils were the most enriched (3.5‰) monomers, probably because of their
ubiquitous origin (plants and microorganisms).
5.3.3.2. Incorporation of monomers specifics for roots and shoots polymers
The proportion of maize-derived monomers in soils after 6 and 12 years of maize cropping
(fig.2) were only calculated for the monomers proposed as specific for shoots (mid-chain
hydroxy acids) or roots (diacids and long chain ω-hydroxy carboxylic acids).
Only low proportions of cutin monomers (mid-chain hydroxy acids) deriving from maize
above ground biomass were incorporated into the soils after 6 or 12 years of maize cropping,
suggesting that cutin polymers originating from maize are promptly degraded. Furthermore
concentration in soil of cutin monomers did not significantly vary over years of maize
cropping (Fig 1.). Kögel-Knabner et al (1992a) and Redierer et al (1993) reported from
incubations of leaves, that cutins are not selectively preserved in soils and that decomposition
rates of cutins are the same as those of the bulk organic matter of the litter. These two results
coupled together imply that cutin present in maize cropped soils originated from old C3
vegetation and can be related to a stable pool of carbon. The duration of the experimental field
is too short to determine the kinetics of incorporation of maize derived cutin, since a too low
amount of cutin is incorporated into the soil each year.

113
0
20
40
60
80
100
Inc
orp
ora
tio
n o
fm
aiz
ed
eri
ve
dm
on
om
ers
in
% Soil after 6 years of m aize cropping
Soil after 12 years of m aize cropping
ωC 1
6
ωC 1
8:1
ωC 2
0
ωC 2
2
ωC 2
4
ωC 2
6
x,1
6-D
iOH
C16
9-O
H D
C 16
11,1
8-D
iOH
C18:1
9,1
0 e
poxy
and
9,1
0-D
iOH
18-O
H C 1
8
DC 1
6
DC 2
2
DC 2
4
0
20
40
60
80
100
Inc
orp
ora
tio
n o
fm
aiz
ed
eri
ve
dm
on
om
ers
in
% Soil after 6 years of m aize cropping
Soil after 12 years of m aize cropping
Soil after 6 years of m aize cropping
Soil after 12 years of m aize cropping
ωC 1
6
ωC 1
8:1
ωC 2
0
ωC 2
2
ωC 2
4
ωC 2
6
x,1
6-D
iOH
C16
9-O
H D
C 16
11,1
8-D
iOH
C18:1
9,1
0 e
poxy
and
9,1
0-D
iOH
18-O
H C 1
8
DC 1
6
DC 2
2
DC 2
4
Fig
ure
2:
Inco
rpor
atio
n
rate
s of
cuti
n
and
sub
erin
mon
ome
rs
afte
r 6 and 12 years of maize cropping
By contrast, between 20 % and 62 % of the suberin monomers were derived from maize after
6 years of maize cropping. Furthermore, suberized tissues located in different parts of the
roots have different monomeric compositions, depending on the specific requirements of the
tissues (Zeier et al., 1999). These tissues in dead roots might be more or less easily degraded,
depending on their position in the outer or inner layers of the roots for example. These
reasons could explain the variations in incorporation rates between maize derived suberin
monomers in soils after 6 years of maize cropping.
Between 6 and 12 years of maize cropping, the proportion of suberin monomers originating
from maize were similar (Fig 2). The stabilisation in incorporation of suberin monomers after
6 years of maize cropping can be related with the stabilization of the monomer concentration.
Nevertheless, incorporation and concentration increase of monomers in soils are not
systematically correlated. For example, the ωC20 monomer is released in same concentration
from the three soils and its incorporation is of about 45% after 6 and 12 years of maize
cropping, whereas the ωC22 concentration increased from 4.6µg g-1
to 7.8 µg g-1
soil and its
incorporation only reaches 22%. Furthermore, the ωC24 monomer, which concentration trend
is similar to that of the ωC22, from 3.5 to 6.7 µg g-1
soil, is incorporated at 42% in maize soils,
close to that of the ωC20 monomer.
114
These results inferred several trends in degradation and stabilization processes of roots. If
maize root density is higher than that of wheat (Aggarwal et al., 2006; Ju et al. 2007), can be
responsible for a part of the incorporation of maize derived monomers in soils, discrepancy in
incorporation rates suggests that some monomers are selectively preserved from degradation.
This protection can be caused by the location of suberin in roots and also by the position of
the monomer into the polymer. Furthermore, soil matrix protection may play an important
role in root monomer degradation. The level off in incorporation of suberin monomers after 6
years of maize cropping also indicates the presence in soil of a stabilized pool for these
monomers.

115
5.4. Conclusion
This study allowed for a complete identification and quantification of cutins and suberins
monomers in plants and their contribution to soil bound lipids. From plants studies, diacids
and mid-chain hydroxy acids are specifics for below and above ground tissues. Monomer
inputs from above ground polymers represented more than 80% of total monomers returned
into the soils for the two plants studied. Despite of the high shoot polymer inputs, in soil,
concentration in cutins specifics monomers is equivalent to roots suberized tissues monomers
and indicate a selective degradation and stabilisation of polymers in soils. At molecular level
single monomer are not degraded in the same way implying that a macromolecule such as
cutin or suberin is not heterogeneously degraded by microorganisms. Macromolecular
structure and molecular composition of polymers directly impact microbial access to
decomposition sites. The contrasting behaviours of root suberized tissues and cutin from
shoots in soils might be explained by different physical and chemical processes leading to
selective degradation and stabilization of these tissues. Roots are closely linked to soil matrix
which confers a physical protection against microbial degradation. Furthermore, one of the
major roles of roots suberized tissues in the plant is to resist against soil microbial attacks.
Incorporation rates results also display varied behaviour among monomers. Cutin monomers
deriving from maize plant are poorly incorporated into SOM inferring that cutin bring to the
soil is promptly degraded and that monomers released from soils samples arise from old C3
vegetation. Soil suberin monomers incorporation rates underlined the higher contribution of
maize roots biomass when compared to wheat root. Stabilisation in incorporation after 6 years
of maize cropping suggest at least two kinetic pools of degradation and stabilisation.
In soil, many factors act for the stabilisation and the degradation of cutin and suberin
polymers. For both, macromolecular structure, monomeric composition play an important
role. In roots, the localisation of the suberized tissues also influence degradation trends.
Nevertheless, the higher maize roots density when compared to wheat roots and the soil
matrix protection are the main process leading to high incorporation of suberin monomers in
soil.

116

117
CHAPITRE 6
DYNAMIQUE DES CUTINES ET DES SUBÉRINES EN
PROFONDEUR LORS D’UN CHANGEMENT DE
CULTURE BLÉ / MAÏS.

118

119
Dynamique des cutines et des subérines en profondeur lors d’un
changement de culture blé / maïs.
6.1. Introduction
L’estimation de la dynamique des monomères spécifiques des parties aériennes et racinaires
des plantes dans la couche de labour (0-25 cm) a montré que les monomères spécifiques des
cutines contenus dans les parties aériennes de la plante de maïs ne sont pas ou peu incorporés
aux à la MOS (Chapitre 5). Au contraire, les monomères provenant des racines et spécifiques
des subérines sont incorporées à la MOS à hauteur de 20 % à 60 % selon le monomère après
12 ans de culture de maïs après blé. Les racines jouent donc un rôle important dans la
dynamique des MOS, en accord avec Rasse et al. (2005) qui suggèrent que le carbone
provenant des racines contribuerait 2,4 fois plus aux MOS que celui provenant de la biomasse
aérienne. La dynamique des MO des sols agricoles a surtout été étudiée dans les couches
superficielles, où l’accumulation ou la perte de carbone est très sensible à un changement de
culture ou de gestion des sols (labour, non-labour, restitution de la biomasse végétale dans les
sols) ( Rasmussen et al., 1980; Campbell et al., 1991; Prasad et Power, 1991; Clapp et al.,
2000; Reicosky et al., 2002).
Peu d’études ont été menées sur la dynamique des MOS en profondeur. Pourtant, c’est en
profondeur que la matière organique est la plus stable (Paul et al., 1997; Rumpel et al., 2002).
Les quantités de carbone présentes dans les horizons situés en dessous de 30 cm ne sont pas
négligeables (Deen et Kataki, 2003; Sisti et al., 2004). De plus la contribution des composés
aliphatiques à la MOS augmente en profondeur (Kögel-Knabner et al., 1992b; Nierop, 1998;
Rumpel et al., 2004) et les cutines et les subérines pourraient contribuer à cette aliphaticité
(Kögel-Knabner et al., 1989; Nierop et al., 2003). Dans les sols des Closeaux, Rasse et al.
(2006) ont montré que le carbone provenant du maïs contribuait au carbone organique du sol
jusqu’à 105 cm après 9 ans de culture de maïs. Plusieurs facteurs pourraient être à l’origine de
cette accumulation en profondeur du carbone provenant du maïs, dont la contribution du
carbone provenant des racines et de la rhizosphère. Dans ce chapitre nous nous proposons
d’évaluer l’impact de la culture de maïs sur la concentration et les teneurs isotopiques en
profondeur des sols des lipides liés en profondeur dans les sols. Dont les cutines et les
subérines font parties.

120
Nous avons vu dans le chapitre précédent que l’incorporation à la MOS des monomères
provenant de la subérine des racines de maïs était rapide pendant les 6 premières années de
culture de maïs, puis se stabilisait entre 6 et 12 ans. Nous avons choisi pour cette étude des
échantillons de deux sols, un sol sous blé et un sol après 9 ans de culture de maïs. Les sols ont
été échantillonnés tous les 15 cm sur une profondeur de 105 cm.
Sur ces échantillons de sols, nous avons quantifié les lipides liés totaux afin de déterminer
leur contribution à la MOS et leurs dynamiques dans les sols. Nous nous sommes plus
particulièrement intéressés aux monomères spécifiques des cutines et des subérines, dont la
signature isotopique a été déterminée afin d’estimer la contribution des monomères provenant
du maïs à la MOS en profondeur.

121
6.2. Résultats et discussions
6.2.1. Concentrations des monomères aliphatiques en profondeur dans les sols sous blé et sous
maïs.
La saponification des sols sous blé et sous maïs, nous a permis de libérer les six classes de
composés déjà identifiés dans les chapitres précédents: les acides carboxyliques, les acides
carboxyliques ω-hydroxylés, les acides carboxyliques α-hydroxylés, les alcools, les diacides,
ainsi que les acides hydroxylés en milieu de chaîne spécifiques des cutines.
Le changement de culture de blé à maïs influence la distribution de toutes les familles de
composés identifiés sur l’ensemble du profil. Nous avons comparé dans les sols sous blé et 9
ans de culture de maïs : (1) les concentrations dans les sols des lipides liés totaux qui
proviennent essentiellement des plantes et des microorganismes (figures 1, 2 et 4), (2) les
distributions des monomères spécifiques de la biomasse racinaire (figures 5 et 6) et des
monomères spécifiques des cutines (figures 7 et 8).
6.2.1.1. Concentration des lipides liés totaux dans les sols sous blé et sous maïs
Les concentrations des lipides liés totaux dans le sol sous blé ont été comparées sur 105 cm de
profondeur à celles du sol après 9 ans de maïs (figure 1). La concentration des lipides liés
diminue avec la profondeur pour les deux sols, à l’exception de la profondeur 90-105 cm du
sol sous blé où la concentration en lipides liés augmente légèrement mais de manière
significative.
Figure 1 : Concentration des lipides liés totaux en fonction de la profondeur (µg/gsol) dans le sol sous blé et le
après 9 ans de culture de maïs.
0
10
20
30
40
50
60
70
80
0-15 15-30 30-45 45-60 60-75 75-90 90-105
Profondeur (c m )
co
nc
en
tra
tio
n (
µg
/gso
l) Sol sou s blé
Sol sou s m ais
0
10
20
30
40
50
60
70
80
0-15 15-30 30-45 45-60 60-75 75-90 90-105
Profondeur (c m )
co
nc
en
tra
tio
n (
µg
/gso
l)
0
10
20
30
40
50
60
70
80
0-15 15-30 30-45 45-60 60-75 75-90 90-105
Profondeur (c m )
co
nc
en
tra
tio
n (
µg
/gso
l) Sol sou s blé
Sol sou s m ais

122
La concentration en lipides liés des 45 premiers centimètres est plus élevée pour le sol sous
maïs que pour le sol sous blé mais on n’observe pas de différence significative en dessous de
45 cm, sauf pour la profondeur 90-105 cm où la concentration en lipides liés est plus grande
pour le sol sous blé que le sol sous maïs. Les teneurs en C diminuant aussi avec la profondeur
(Chapitre 2, § 2.2.2.4), nous avons rapporté les concentrations en lipides liés totaux à la teneur
en carbone organique du sol pour chaque profondeur, afin de mieux comparer les
contributions des lipides liés à la MOS (figure 2).
Figure 2 : Concentration des lipides liés relativement au carbone organique su sol (µg/gCsol) en fonction de la
profondeur
La concentration des lipides liés relativement au C organique dans les profils est aussi
différente dans les deux sols. Au dessus de 30 cm et en dessous de 90 cm les concentrations
en lipides liés totaux par rapport au C organique sont plus élevées dans le sols ayant reçu 9
ans de maïs que dans le sol sous blé (figure 2). A l’exception de la profondeur 45-60 cm où le
sol sous blé à la plus forte teneur relative en lipides liés, on n’observe pas de différence
significative entre les deux sols entre 30 et 90 cm. Ces différences peuvent être expliquées à
priori soit par une hétérogénéité des sols au sein du site expérimental, soit par un effet de la
culture de maïs sur la composition de la MOS.
Afin d’estimer l’impact de la variabilité spatiale entre les mêmes profondeurs des sols sous
blé et sous maïs étudiés, nous avons effectué une analyse de variance à partir de données sur
les quantités de carbone organique dans chaque profondeur des quatre parcelles sous blé et
des trois parcelles après 9 ans de maïs du site expérimental. Le résultat de cette analyse de
variance montre qu’il n’y a pas de variabilité spatiale de la MOS totale entre les parcelles
ayant reçu le même traitement (P<0.001). Si l’on considère en première approximation que
0
1000
2000
3000
4000
5000
6000
7000
8000
0-15 15-30 30-45 45-60 60-75 75-90 90-105
Profondeur (c m )
Co
nc
en
tra
tio
n µ
g/g
C
Sol sou s blé
Sol sou s m ais
0
1000
2000
3000
4000
5000
6000
7000
8000
0-15 15-30 30-45 45-60 60-75 75-90 90-105
Profondeur (c m )
Co
nc
en
tra
tio
n µ
g/g
C
Sol sou s blé
Sol sou s m ais

123
les lipides liés varient de la même manière que la MOS, alors on peut considérer que la
variabilité analytique entre les deux parcelles étudiées est supérieure à la variabilité spatiale.
Dans la suite de la présentation des résultats nous considèrerons que la variabilité analytique
est supérieure à la variabilité spatiale. Si on élimine la source de variabilité due à
l’hétérogénéité spatiale, on peut considérer que les différences entre sols blé et sol maïs sont
dues au changement de végétation. Cependant, les hypothèses formulées ci-dessous seront à
prendre avec précaution. L’analyse des lipides liés totaux sur les autres parcelles ayant reçu le
même nombre d’années de maïs est indispensable pour affirmer sans équivoque que la
variabilité spatiale n’est pas la cause des différences entre les concentrations en lipides liés
obtenues pour chaque profondeur.
Les variations des concentrations relatives au C des lipides liés totaux dans les sols sont
largement expliquées par celles des acides carboxyliques (figure 3) dont les concentrations
représentent de 48 % à 78% de la concentration totale en lipides liés. 86 % à 96 % de cette
classe de monomère provient des acides ubiquistes C16, C18 et C18:X qui, dans les sols, peuvent
provenir en grande partie des microorganismes.
Fig
ure
3 :
con
cent
rati
on
des
acid
es
carb
oxyl
iques relativement au C organique des MOS en profondeur (µg/gC)
Or dans les sols étudiés, on observe une activité des microorganismes liées à la rhizosphère
sur tout le profil étudié (Rasse et al., 2006). Dans les 90 premiers centimètres du sol, les
concentrations en lipides liés totaux relativement au C organique du sol sous maïs sont
positivement corrélées avec l’apport de carbone provenant du maïs sur 0-90 cm de profondeur
évalué par Rasse et al. (2006) (figure 4).
0
500
1000
1500
2000
2500
3000
3500
4000
4500
5000
0-15 15-30 30-45 45-60 60-75 75-90 90-105
Profondeur (c m )
Co
nc
en
tra
tio
n µ
g/g
C
Sol sou s bléSol sou s m ais
0
500
1000
1500
2000
2500
3000
3500
4000
4500
5000
0-15 15-30 30-45 45-60 60-75 75-90 90-105
Profondeur (c m )
Co
nc
en
tra
tio
n µ
g/g
C
Sol sou s bléSol sou s m ais

124
Figure 4 : Relation entre carbone provenant du maïs (gC-maïs/m-2
) (données de Rasse et al., 2006) et la
concentration en lipides liés totaux pour le sol sous maïs (µg/gC) en fonction de la profondeur de 0 à 90 cm
(R2=0.72). (Pas de valeur pour le C-maïs à la profondeur 90-105 cm, dans les données de Rasse et al., 2006)
Si l’on ne considère que les 75 premiers centimètres du sol, le coefficient de corrélation entre
le carbone provenant du maïs et la concentration en lipides liés totaux est de 0,93 ce qui
indique une forte contribution de la biomasse racinaire du maïs et de la rhizosphère à la MOS
provenant du maïs sur la profondeur 0-75 cm. En dessous de 75 cm, la moins bonne
corrélation entre ces deux facteurs indique qu’il existe une autre source de carbone provenant
du maïs que le carbone directement produit par les racines et la rhizosphère, s’accumulant
dans les profondeurs 75-105 cm. L’accumulation de carbone provenant du maïs surtout dans
la profondeur 90-105 cm pourrait s’expliquer par une combinaison de mécanismes tel que le
transport de carbone provenant du maïs par le carbone organique dissout, ainsi qu’une
diminution de l’activité microbienne à cette profondeur favorisant l’accumulation de C du
maïs.
Rasse et al. (2006) ont montré que le carbone provenant du maïs était incorporé à la MOS sur
0 à 105 cm et que cette incorporation était proportionnelle au nombre d’années de culture de
maïs. La densité racinaire du blé est inférieure à celle du maïs à partir de la profondeur 15-30
cm (Aggarwal et al., 2006; Ju et al. 2007) et ce, sur tout le profil étudié. Si l’on considère
qu’il n’y a pas de variabilité spatiale, les différences observées entre les concentrations en
lipides liés totaux des sols sous blé et sous maïs sont essentiellement dues à la différence entre
la biomasse racinaire du blé et du maïs et de la rhizosphère associée. Pour mieux comprendre
les différences observées, nous avons comparé les concentrations par rapport au C organique
des monomères spécifiques de la biomasse racinaire (les acides carboxyliques ω-hydroxylés)
3000
3500
4000
4500
5000
5500
6000
6500
0 100 200 300 400 500 600 700 800
C arbone provena nt du ma ïs en profondeur en gC -m a ïs/m -2
Co
nc
en
tra
tio
n e
n l
ipid
es
lié
s to
tau
x
en
µg
/gC
3000
3500
4000
4500
5000
5500
6000
6500
0 100 200 300 400 500 600 700 800
C arbone provena nt du m a ïs en pro fondeur en gC -m a ïs/m -2
Co
nc
en
tra
tio
n e
n l
ipid
es
lié
s to
tau
x
en
µg
/gC
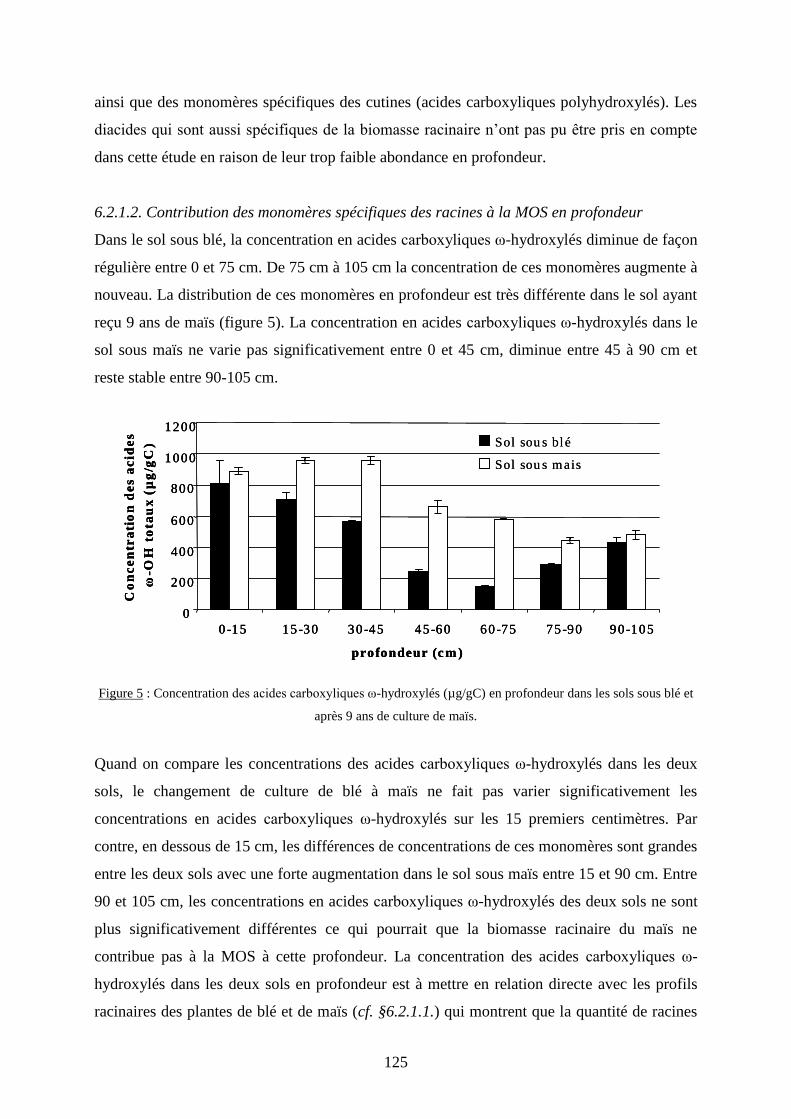
125
ainsi que des monomères spécifiques des cutines (acides carboxyliques polyhydroxylés). Les
diacides qui sont aussi spécifiques de la biomasse racinaire n’ont pas pu être pris en compte
dans cette étude en raison de leur trop faible abondance en profondeur.
6.2.1.2. Contribution des monomères spécifiques des racines à la MOS en profondeur
Dans le sol sous blé, la concentration en acides carboxyliques ω-hydroxylés diminue de façon
régulière entre 0 et 75 cm. De 75 cm à 105 cm la concentration de ces monomères augmente à
nouveau. La distribution de ces monomères en profondeur est très différente dans le sol ayant
reçu 9 ans de maïs (figure 5). La concentration en acides carboxyliques ω-hydroxylés dans le
sol sous maïs ne varie pas significativement entre 0 et 45 cm, diminue entre 45 à 90 cm et
reste stable entre 90-105 cm.
Figure 5 : Concentration des acides carboxyliques ω-hydroxylés (µg/gC) en profondeur dans les sols sous blé et
après 9 ans de culture de maïs.
Quand on compare les concentrations des acides carboxyliques ω-hydroxylés dans les deux
sols, le changement de culture de blé à maïs ne fait pas varier significativement les
concentrations en acides carboxyliques ω-hydroxylés sur les 15 premiers centimètres. Par
contre, en dessous de 15 cm, les différences de concentrations de ces monomères sont grandes
entre les deux sols avec une forte augmentation dans le sol sous maïs entre 15 et 90 cm. Entre
90 et 105 cm, les concentrations en acides carboxyliques ω-hydroxylés des deux sols ne sont
plus significativement différentes ce qui pourrait que la biomasse racinaire du maïs ne
contribue pas à la MOS à cette profondeur. La concentration des acides carboxyliques ω-
hydroxylés dans les deux sols en profondeur est à mettre en relation directe avec les profils
racinaires des plantes de blé et de maïs (cf. §6.2.1.1.) qui montrent que la quantité de racines
Co
nc
en
tra
tio
n d
es a
cid
es
ω-O
H t
ota
ux
(µ
g/g
C)
0
200
400
600
800
1000
1200
0-15 15-30 30-45 45-60 60-75 75-90 90-105
profondeur (c m )
Sol sou s blé
Sol sou s m ais
Co
nc
en
tra
tio
n d
es a
cid
es
ω-O
H t
ota
ux
(µ
g/g
C)
0
200
400
600
800
1000
1200
0-15 15-30 30-45 45-60 60-75 75-90 90-105
profondeur (c m )
Co
nc
en
tra
tio
n d
es a
cid
es
ω-O
H t
ota
ux
(µ
g/g
C)
0
200
400
600
800
1000
1200
0-15 15-30 30-45 45-60 60-75 75-90 90-105
profondeur (c m )
Sol sou s blé
Sol sou s m ais

126
de maïs dans le sol est très supérieure à celle du blé pour les profondeurs 15-90 cm. La
concentration en acides carboxyliques ω-hydroxylés des deux sols étudiés suit les
concentrations des monomères ωC22 et ωC24 qui représentent à eux deux de 46 % à 62% de
cette classe de composés (figure 6). Ces deux monomères font partis des monomères
caractéristiques des racines de blé et de maïs (chapitre 3).
0
50
100
150
200
250
300
350
400
450
0-15 15-30 30-45 45-60 60-75 75-90 90-105
P rofond eu r (cm)
Co
nc
en
tra
tio
n d
es m
on
om
èr
es d
’ac
ide
s ω
-OH
en
fo
nc
tio
n d
e l
a p
ro
fon
deu
r (
µg
/gC
)
0-15 15-30 30-45 45-60 60-75 75-90 90-105
p rofond eu r (cm)
ωC16
ωC18 :1
ωC20
ωC22
ωC24
ωC26
Sol sous b lé So l sous m aïs
0
50
100
150
200
250
300
350
400
450
0-15 15-30 30-45 45-60 60-75 75-90 90-105
P rofond eu r (cm)
Co
nc
en
tra
tio
n d
es m
on
om
èr
es d
’ac
ide
s ω
-OH
en
fo
nc
tio
n d
e l
a p
ro
fon
deu
r (
µg
/gC
)
0-15 15-30 30-45 45-60 60-75 75-90 90-105
p rofond eu r (cm)
ωC16
ωC18 :1
ωC20
ωC22
ωC24
ωC26
0
50
100
150
200
250
300
350
400
450
0-15 15-30 30-45 45-60 60-75 75-90 90-105
P rofond eu r (cm)
Co
nc
en
tra
tio
n d
es m
on
om
èr
es d
’ac
ide
s ω
-OH
en
fo
nc
tio
n d
e l
a p
ro
fon
deu
r (
µg
/gC
)
0-15 15-30 30-45 45-60 60-75 75-90 90-105
p rofond eu r (cm)
ωC16
ωC18 :1
ωC20
ωC22
ωC24
ωC26
Sol sous b lé So l sous m aïs
Figure 6 : Concentration des monomères d’acides ω-hydroxylés en fonction de la profondeur pour les sols sous
blé et maïs.
Par conséquent leur forte présence dans les sols en profondeur et l’augmentation de leur
concentration après 9 ans de culture de maïs confirme l’impact de la biomasse racinaire du
maïs sur les profondeurs 0-90 cm. On note que les plus grandes différences de concentration
entre les deux sols ont été mesurées pour les profondeurs 30-75 cm, précisément là ou la
densité racinaire du maïs est encore très importante (>0.9 cm3 de racines/cm
3 de sol) (Ju et al.,
2007) alors que la densité racinaire du blé est faible (<0.4 cm3 de racines/cm
3 de sol)
(Aggarwal et al. 2006). Enfin la concentration totale en acides carboxyliques ω-hydroxylés
ainsi que la distribution des monomères dans cette classe ne changent pas pour la profondeur
90-105 cm ce qui confirme que la biomasse racinaire du maïs ne semble pas contribuer à la
MOS à cette profondeur.
6.2.1.3. Contribution des monomères spécifiques desa cutines
Pour le sol sous blé, la contribution des monomères spécifiques de la cutine, ne varie pas
significativement entre 0 et 30 cm, puis diminue légèrement entre 30 et 75 cm, pour
augmenter fortement entre 75 et 105 cm (figure 7).
Dans le sol sous maïs, la quantité totale de monomères des cutines reste constante entre 0 et
30 cm augmente entre 30 et 45 cm puis diminue entre les profondeurs 30-45 cm et 45-60 cm.
En dessous de 45 cm la concentration des monomères des cutines se stabilise autour de

127
800µg/gC.
Les concentrations en monomères sont significativement plus grandes pour le sol sous maïs
entre 0 et 75 cm, mais cette tendance s’inverse pour les deux dernières profondeurs où la mise
en culture de maïs a provoqué une forte diminution de la quantité des monomères spécifiques
des cutines.
Figure 7 : Distribution des monomères totaux spécifiques de la cutine en fonction de la profondeur dans les sols
sous blé et sous maïs
Dans les sols sous blé et sous maïs, les monomères spécifiques des cutines sont largement
dominés par les acides x,16-dihydroxy hexadécanoïques (x=8,9,10) et le diacide 9-hydroxy
hexadécanoïque sur toute la profondeur (figure 8). La concentration totale des monomères
spécifiques des cutines pour les deux sols suit les concentrations de ces deux monomères qui
représentent de 66% à 94% des monomères totaux spécifiques des cutines.
Figure 8 : Distribution des monomères spécifiques des cutines en fonction de la profondeur pour les sols sous blé
et sous maïs.
0
500
1000
1500
2000
2500
0-15 15-30 30-45 45-60 60-75 75-90 90-105
profondeur (c m )
µg
/gC
Sol sou s blé
Sol sou s m ais
0
500
1000
1500
2000
2500
0-15 15-30 30-45 45-60 60-75 75-90 90-105
profondeur (c m )
µg
/gC
Sol sou s blé
Sol sou s m ais
0
200
400
600
800
1000
0-15 15-30 30-45 45-60 60-75 75-90 90-105
P rofond eu r (cm)
µg
/gC
0-15 15-30 30-45 45-60 60-75 75-90 90-105
p rofond eu r (cm)
x,16 -D iO H C 16
9-O H dia cide C 16
11 ,18 -D iO H C 18:1
x,18 -D iO H C 18 :1
18-O H , 9 ,10 -epoxy C 18
9 ,10 ,18 -T riO H C 18
Sol sou s blé Sol sou s m ais

128
Le changement de culture de blé à maïs influence la concentration de monomères des cutines
en profondeur. Or nous avons montré dans le chapitre précédent que les cutines présentes
dans les sols sur la profondeur 0-25 cm après 12 ans de culture de maïs proviennent en
majeure partie d’une végétation en C3 probablement antérieure à la mise en place du site
expérimental. Les temps de renouvellement des cutines plus longs que le temps de
l’expérience (9 ans de culture de maïs) peut expliquer l’absence de différences entre les
concentrations des cutines des deux sols. Sur cette échelle de temps, les cutines apparaissent
stabilisées.
Pour les profondeurs de 0 à 75 cm, on remarque que si les concentrations en monomères sont
légèrement plus élevées pour le sol sous maïs que pour celui sous blé, la distribution générale
des monomères en fonction de la profondeur reste similaire. En revanche, pour les deux
dernières profondeurs la diminution des monomères spécifiques des cutines est importante
puisque la concentration totale de ces monomères passe d’environ 1800 µg/gC pour le sol
sous blé à 750 µg/gC pour le sol ayant reçu 9 années de maïs à la profondeur 90-105 cm.
Plusieurs hypothèses peuvent expliquer ces changements aux différentes profondeurs. Tout
d’abord il est possible que ces variations soient simplement dues à la variabilité spatiale. Si
l’on fait l’hypothèse que la variabilité spatiale est inférieure à la variabilité analytique alors,
de 0 à 75 cm, la plus grande concentration de monomères spécifiques des cutines par rapport
dans le sol sous maïs peut s’expliquer par la dégradation de composés autres que les
monomères de cutines. De 75 à 105 cm, la tendance inverse observée pourrait provenir d’un
« priming effect », c'est-à-dire que l’activité microbienne est augmentée par l’apport d’une
nouvelle MO fraîche, provoquant la dégradation de la MOS en profondeur (Fontaine et al.,
2003; Fontaine et al., sous presse). L’effet d’une augmentation de l’activité microbienne sur la
minéralisation des cutines devrait se répercuter sur toute la profondeur, puisque l’apport de
biomasse racinaire est important sur les profondeurs 30-75 cm après 9 ans de culture sous
maïs. Pourtant, on n’observe cette diminution des concentrations des monomères des cutines
due à une minéralisation des cutines que pour les deux dernières profondeurs. Les
communautés microbiennes présentes à 1 mètre de profondeur ne sont pas les mêmes que
celles en surface. La dissemblance entre les populations microbiennes en surface et en
profondeur pourrait être à l’origine de la minéralisation sélective de la cutine pour les
profondeurs 75-90 cm et 90-105cm, alors qu’elle ne semble pas être affectée pour les
profondeurs supérieures à 75 cm.

129
6.2.2. Mesures des signatures isotopiques des monomères spécifiques des cutines et des
subérines en profondeur.
Nous avons vu dans cette première partie de chapitre les concentrations des lipides liés en
profondeurs dans un sol sous blé et après 9 ans de culture de maïs. Les signatures isotopiques
de certaines molécules caractéristiques des cutines et des subérines devraient permettre de
mieux comprendre leur dynamique en profondeur des sols. Seules les signatures isotopiques
des monomères les plus concentrés ont pu être déterminées, beaucoup des monomères
spécifiques étant présents en trop faible concentration en profondeur pour pouvoir mesurer
leur signature isotopique. Nous avons choisi les monomères ωC22 et ωC24 comme monomères
spécifiques des racines ainsi que les monomères x,16-DiOH C16 comme monomères
spécifiques des cutines.
6.2.2.1. δ13
C des monomères spécifiques des subérines racinaires en profondeur.
Les signatures isotopiques des monomères spécifiques des racines dans les sols sous blé et
sous maïs indiquent que les monomères provenant du maïs sont incorporés aux MOS sur toute
la profondeur, en accord avec les résultats publiés dans Rasse et al. (2006) (figure 9).
Figure 9 : δ13
C (‰, VDPB) des monomères ωC22 et ωC24 en fonction de la profondeur pour les sols cultivés en
blé et en maïs.
Rasse et al. (2006) estiment le taux d’incorporation du carbone provenant du maïs à la MOS à
environ 0.95 % par an pour les profondeurs de 0 à 45 cm et à 0.28% par an pour la profondeur
-40-35-30-25
0
20
40
60
80
100
120
pr
ofo
nd
eu
r (
cm
)
˜
ωC 24 so l sou s blé
ωC 24 so l sou s m a is
ωC 22 so l sou s blé
ωC 22 so l sou s m a ïs
-40-35-30-25˜
δ 13C (‰ )
-40-35-30-25
0
20
40
60
80
100
120
pr
ofo
nd
eu
r (
cm
)
˜
ωC 24 so l sou s blé
ωC 24 so l sou s m a is
ωC 22 so l sou s blé
ωC 22 so l sou s m a ïs
-40-35-30-25˜-40-35-30-25
0
20
40
60
80
100
120
pr
ofo
nd
eu
r (
cm
)
0
20
40
60
80
100
120
pr
ofo
nd
eu
r (
cm
)
˜
ωC 24 so l sou s blé
ωC 24 so l sou s m a is
ωC 22 so l sou s blé
ωC 22 so l sou s m a ïs
ωC 24 so l sou s blé
ωC 24 so l sou s m a is
ωC 24 so l sou s blé
ωC 24 so l sou s m a is
ωC 22 so l sou s blé
ωC 22 so l sou s m a ïs
-40-35-30-25˜
δ 13C (‰ )

130
75-90cm. Nous avons vu dans la première partie de ce chapitre que la concentration des
monomères ωC22 et ωC24 augmentait avec la profondeur jusqu’à 90 cm lors du changement de
culture de blé à maïs, impliquant une augmentation de la contribution des monomères
provenant de la subérine des racines de maïs aux MOS.
Pour la profondeur 90-105 cm la concentration totale en acides carboxyliques ω-hydroxylés
ainsi que la distribution des monomères étaient équivalentes pour les deux sols, indiquant
qu’à cette profondeur il n’y a pas d’augmentation du carbone provenant de la biomasse
racinaire. Or les signatures isotopiques des monomères ωC22 et ωC24 montrent que les
monomères issus de la subérine des racines de maïs sont aussi incorporés aux MOS à cette
profondeur, et qu’ils viennent remplacer des monomères de blé dégradés, sans provoquer de
variation de la concentration globale ni de la distribution de ces monomères.
6.2.2.1. δ13
C des monomères spécifiques des cutines des parties aériennes en profondeur.
Les signatures isotopiques des acides x,16 dihydroxyhexadécanoïques ne varient pas, ni en
fonction de la profondeur ni après changement de culture (figure 10), confirmant la faible
incorporation des monomères provenant des cutines des parties aériennes du maïs à la MOS
déjà suggérée pour la couche de labour au chapitre précédent. Les cutines retrouvées en
profondeur proviennent essentiellement d’une végétation en C3 antérieure à la mise en place
du site expérimental. Ce résultat confirme que la diminution de la quantité de ces monomères
en profondeur observée après changement de culture (figure 7) est due à la dégradation de la
cutine existante, alors que celle-ci paraissait être « stabilisée » en profondeur.
Figure 10 : δ13
C (‰, VDPB) des monomères d’acides x,16 dihydroxyhexadécanoïques en fonction de la
profondeur pour les sols cultivés en blé et en maïs
0
20
40
60
80
100
120
-36,0-34,0-32,0-30,0-28,0-26,0-24,0
Pr
ofo
nd
eu
r (
cm
)
Sol sou s blé
Sol sou s m ais
δ 13C (‰ )
0
20
40
60
80
100
120
-36,0-34,0-32,0-30,0-28,0-26,0-24,0
Pr
ofo
nd
eu
r (
cm
)
Sol sou s blé
Sol sou s m ais
δ 13C (‰ )

131
6.3. Conclusion
Le changement de culture de blé à maïs a induit une modification importante des
concentrations en lipides liés dans les sols. Cette modification est observée pour toutes les
familles de composés, mais de manière distincte. Les monomères spécifiques des subérines de
la biomasse racinaire représentent jusqu’à 20% des lipides liés dans le sol. Le changement de
culture de blé à maïs induit une forte augmentation de la quantité des ces monomères sur les
profondeur 30-75 cm. Cette augmentation est directement corrélée à la densité racinaire du
maïs en profondeur, qui est bien plus élevée que celle du blé. Les signatures isotopiques des
monomères majoritaires des subérines racinaires indiquent que les monomères du maïs sont
incorporés sur toute la profondeur. La proportion des monomères spécifiques des cutines est
importante dans les sols en profondeur puisqu’elle peut représenter jusqu’à 30% des lipides
liés totaux pour le sol sous blé. Nous avions montré dans le chapitre précédent qu’en surface,
après 12 ans de culture de maïs, ces monomères provenaient principalement d’une végétation
en C3 et que les cutines de la plante de maïs étaient peu ou pas incorporées aux MOS. Ce qui
est vrai en surface l’est d’autant plus en profondeur, où les signatures isotopiques des acides
x,16 dihydroxyhexadécanoïques ne varient ni en fonction de la profondeur ni en fonction des
années de culture de maïs. Par contre, les concentrations de ces monomères sont affectées par
le changement de culture sur toute la profondeur étudiée. L’apport de MO fraîches par les
racines de maïs pourrait augmenter l’activité microbienne en profondeur, conduisant à une
minéralisation des MOS les plus stables. Une étude des parcelles ayant reçu le même
traitement permettrait d’estimer la part de ces variations de concentrations due à la variabilité
spatiale et de vérifier les hypothèses formulées dans ce chapitre.
Cette étude montre que les cutines et les subérines présentent un réel potentiel pour l’étude de
la dynamique des MOS dans les sols, aussi bien en surface qu’en profondeur, bien que ces
monomères ne soient pas des composés majoritaires ni des plantes ni des MO dans les sols
agricoles. L’étude de leur devenir dans les sols nous a permis de mettre en évidence et de
hiérarchiser différents processus de dégradation et d’incorporation des MO fraîches provenant
des parties aériennes et racinaires des plantes dans les sols, et d’évaluer l’impact des MO
fraîches apportées par les racines sur la dynamique de la MOS déjà présentes.

132

133
CONCLUSION GÉNÉRALE ET PERSPECTIVES

134
135
Conclusion générale et perpectives
Nous avons développé au cours de ce travail un outil d’analyse permettant de mieux
comprendre la dynamique de la matière organique fraîche provenant des plantes incorporée au
sol, en fonction de sa provenance dans la plante (feuilles, tiges, racines). En effet, la
contribution des parties aériennes et souterraines des plantes à la matière organique des sols a
fait l’objet de nombreuses études, et il est souvent admis que les racines des plantes
contribuent plus à la matière organique des sols que les parties aériennes. Cependant, les
processus de dégradation et de stabilisation de la matière organique provenant des parties
aériennes et racinaires des plantes sont mal connus. Nous avons estimé la contribution à la
matière organique du sol des marqueurs des cutines et des subérines. Ces dernières sont des
biopolyesters spécifiques des parties aériennes et souterraines des plantes respectivement.
Nous avons décrit leur dynamique dans les sols grâce à la combinaison des caractérisations
moléculaires et isotopiques 13
C de leurs monomères dans les plantes et dans les sols.
Le site expérimental des Closeauxa a été choisi pour suivre la dynamique des marqueurs
provenant respectivement de la biomasse aérienne et racinaire des plantes. Dans les plantes, la
signature isotopique des monomères des cutines et des subérines était très variable à l’échelle
de l’organe et à l’échelle de la plante totale. Ces différences pouvaient être imputées à
plusieurs mécanismes agissant lors de la biosynthèse de ces marqueurs par la plante dont la
conjonction conduisait soit à l’appauvrissement soit à l’enrichissement en 13
C des
monomères.
Les marqueurs spécifiques des cutines n’étaient pas incorporés à la matière organique des sols
des Closeaux. Les cutines présentes dans ces sols sont probablement antérieures à la mise en
place du site expérimental et donc stabilisées alors que la cutine de maïs apportée au sol
chaque année est en grande partie dégradée. Une forte incorporation des marqueurs des
subérines des racines de maïs à la matière organique du sol est observée après les six
premières années de culture de maïs. La faible incorporation des marqueurs des subérines
racinaires du maïs entre 6 et 12 ans suggère l’existence d’au moins deux compartiments
cinétiques d’incorporation.
Le changement de culture de blé à maïs affecte les concentrations des biopolyesters en
profondeur, entraînant une forte augmentation de la quantité des monomères spécifiques des
subérines dans la zone 30-75 cm. La contribution des marqueurs des cutines au carbone
organique des sols diminue en profondeur à la suite du changement de végétation. L’apport de

136
MO fraîches par les racines plus important pour le maïs que pour le blé pourrait augmenter
l’activité microbienne en profondeur conduisant à une minéralisation des MOS les plus
stables.
Les marqueurs des cutines et des subérines ont un réel potentiel pour l’étude de la dynamique
des MOS dans les sols, aussi bien en surface qu’en profondeur. Si certains monomères des
cutines et subérines sont bien apparus dans cette étude comme des marqueurs d’origine
végétale aérienne ou souterraine des matières organiques des sols, la possibilité de les utiliser
comme des marqueurs de la dynamique de ces tissus doit être étudiée. Des expériences
d’incubation au laboratoire de feuilles et racines de plantes enrichies en 13
C permettraient de
vérifier si les dynamiques de ces marqueurs sont représentatives des dynamiques des racines
et des parties aériennes des plantes. Une comparaison des cinétiques de minéralisation des
biopolyesters spécifiques par rapport à celle de la matière organique totale de la plante
permettrait d’améliorer les connaissances sur les dynamiques de ces tissus dans les sols. De
telles données pourraient être utilisées pour mieux paramétrer les modèles sur la dynamique
du carbone dans les sols en définissant de nouveaux compartiments cinétiques correspondant
aux différents tissus incorporés.

137
REFERENCES

138

139
REFERENCES
A
Aggarwal, P., Choudhary, K.K., Singh, A.K., Chakraborty, D., 2006. Variation in soil
strength and rooting characteristics of wheat in relation to soil management.
Geoderma 136, 353-363.
Almendros, G., Dorado, J., Gonzalez-Vila, F.J., Martin, F., 1997. Pyrolysis of carbohydrate-
derived macromolecules: its potential in monitoring the carbohydrate signature of
geopolymers. J. Anal. Appl. Pyrolysis 40-41, 599-610.
Almendros, G., Dorado, J., Sanz, J., Alvarez-Ramis, C., Fernandez-Marron, M.T.,
Archangelsky, S., 1999. Compounds released by sequential chemolysis from cuticular
remains of the Cretaceous Gymnosperm Squamastrobus tigrensis (Patagonia, the
Argentine). Org. Geochem. 30, 623-634.
Ambles, A., Jacquesy, J.-C., Jambu, P., Joffre J., Maggi-Churin, R., 1991. Polar lipid fraction
in soil: a kerogen-like matter. Org. Geochem. 17, 341-349.
Ambles, A., Jambu, P., Jacquesy, J.-C., Parlanti, E., Secouet, B., 1993. Changes in the ketone
portion of lipidic components during the decomposition of plant debris in a
hydromorphic forest-podzol. Soil Science 156, 49-56.
Ambles, A., Jambu, P., Parlanti, E., Joffre J., Riffe, C., 1994. Incorporation of natural
monoacids from plant residues into an hydromorphic forest podzol. Eur. J. Soil Sci.
45, 175-182.
Amundson R., 2001. The carbon budget in soils. Annual review of earth planet science 29,
535-562.
Annabi, M., 2005. Thèse : Stabilisation de la structure d’un sol limoneux par des apports de
composts d’origine urbaine: relation avec les caractéristiques de leur matière
organique. INRA- Environnement et Grande Culture.
Augris, N., Balesdent, J., Mariotti, A., Derenne, S., Largeau, C., 1998. Structure and origin of
insoluble and non-hydrolyzable, aliphatic organic matter in a forest soil. Org.
Geochem. 28, 119-124.

140
B
Badeck, F.W., Tcherkez, G., Nogués, S., Piel, C., Ghashghaie, J., 2005. Post-photosynthetic
fractionation of stable carbon isotopes between plants organs - a widespread
phenomenon. Rapid Communications in Mass Spectrometry 19, 1381-1391.
Bahri, H., Dignac, M.-F., Rumpel, C., Rasse, D.P., Chenu, C., Mariotti, A., 2006. Lignin
turnover kinetics in an agricultural soil is monomer specific. Soil Biol. Biochem. 38,
1977-1988.
Baldock, J.A., Masiello, C.A., Gelinas, Y., Hedges, J.I., 2006. Cycling and composition of
organic matter in terrestrial and marine ecosystems. Mar. Biotechnol. In Press,
Corrected Proof.
Balesdent, J., Mariotti, A., 1996. Measurement of Soil Organic Matter Turnover Using 13
C
Natural Abundance. Mass Spectrometry of Soils 83-111.
Balesdent, J. Balabane, M., 1996. Major contribution of roots to soil carbon storage inferred
from maize cultivated soils. Soil Bio. Biochem. 28, 1261-1263.
Barber, S.A., 1979. Corn residue management and soil organic matter. Agron. J. 71, 625-627.
Barnabas, A.D., 1996. Casparian band-like structures in the root hypodermis of some aquatic
angiosperms. Aquat. Botany 55, 217-225.
Barral, M.T., Bujan, E., Devesa, R., Iglesias, M.L., Velasco-Molina, M., 2007. Comparison of
the structural stability of pasture and cultivated soils. Sci. Total Environ. 378, 174-
178.
Barrusio, E., Eklo, O.M., Iglesias, E., Houot, S. Modification de la mobilité des pesticides
dans les sols après addition de matières organiques éxogènes. 5ème
Journées nationales
de l’étude des sols, AFES, Rennes, 99-101.
Batjes, N.H., 1996. Total carbon and nitrogen in the soils of the world. Eur. J. Soil Sci. 47,
151-163.
Bento, M.F., Pereira, H., Cunha, M.A., Moutinho, A.M.C., Van den Berg, K.J., Boon, J.J.,
1998. Thermally Assisted Transmethylation Gas Chromatography-Mass Spectrometry
of Suberin Components in Cork from Quercus suber L. Phytochem. Anal. 9, 75-87.
Bento, M.F., Pereira, H., Cunha, M.A., Moutinho, A.M.C., van den Berg, K.J., Boon, J.J.,
2001. A study of variability of suberin composition in cork from Quercus suber L.
using thermally assisted transmethylation GC-MS. J. Anal. Appl. Pyrolysis 57, 45-55.
Bernards, M.A., Lewis, N.G., 1998. The macromolecular aromatic domain in suberized
tissue: A changing paradigm. Phytochemistry 47, 915-933.
141
Bernards, M.A., Razem, F.A., 2001. The poly(phenolic) domain of potato suberin: a non-
lignin cell wall bio-polymer. Phytochemistry 57, 1115-1122.
Bernards, M.A., 2002. Demystifying suberin. Can. J. Bot. 80, 227-240.
Bolwell, G.P., Gerrish, C., Salaun, J.-P., 1997. Changes in enzymes involved in suberisation
in elicitor-treated french bean cells. Phytochemistry 45, 1351-1357.
Borg-Olivier, O., Monties, B., 1993. Lignin, suberin, phenolic acids and tyramine in the
suberized, wound-induced potato periderm. Phytochemistry 32, 601-606.
Boutton, T.W., 1996 Stable carbon isotope ratios of soil organic matter and their use as
indicators of vegetation and climate change. Marcel Dekker Inc., New York.
Bruce J. P., Frome M., Haites E., Janzen H., Lal R. and Paustian K., 1999. Carbon
sequestration in soils. J. Soil Water Conserv. 5, 382-389.
Brugnoli, E., Hubick, K.T., Von Caemmerer, S., Wong, S.C., Farquhar, G.D., 1988.
Correlation between carbon isotope discrimination in leaf, starch and sugars of C3
plants and the ratio of intercellular and atmospheric partial pressures of carbon
dioxide. Plant Physiol. 88, 1418-1424.
Brugnoli, E., Lauteri, M., 1991. Effect of salinity on stomatal conductance, photosynthetic
capacity, and carbon isotope discrimination of salt-tolerant (Gossypium hirsutum L.)
and salt-sensitive (Phaseolus vulgaris L.) C3 Non-Halophytes. Plant Physiol. 95, 628-
635.
Bull, I.D., Nott, C.J., van Bergen, P.F., Poulton, P.R., Evershed, R.P., 2000. Organic
geochemical studies of soils from the Rothamsted classical experiments - VI. The
occurrence and source of organic acids in an experimental grassland soil. Soil Biol.
Biochem. 32, 1367-1376.
C
Caldicott, A.B., Eglinton, G., 1976. Cutin acids from bryophytes: An [omega]-1 hydroxy
alkanoic acid in two liverwort species. Phytochemistry 15, 1139-1143.
Campbell, C.A., Lafond, G.P., Zentner, R.P., Biederbeck, V.O., 1991. Influence of fertilizer
and straw baling on soil organic matter in thin black chemozem in western Canada.
Soil Biol. Biochem. 23, 443-446.
Capriel, P., Beck, T., borchert, H., Harter, P., 1990. Relationship between Soil Aliphatic
Fraction Extracted with Supercritical hexane, Soil Microbial Biomass, and Soil
Aggregate Stability. Soil Sci. Soc. Am. J. 54, 415-420.

142
Cardoso, J.N., Eglinton, G., 1975. The use of cutin acids in the recognition of higher plant
contribution to recent sediments. In: Advances in Organic Geochemistry, R. Campos
(Ed). pp. 273-287.
Cardoso, J.N., Eglinton, G., 1983. The use of hydroxyacids as geochemical indicators.
Geochim. Cosmochim. Acta 47, 723-730.
Cernusak, L.A., Arthur, D.J., Pate, J.S., Farquhar, G.D., 2003. Water relations link carbon and
oxygen isotope discrimination to phloem sap sugar concentration in Eucalyptus
globulus. Plant Physiol. 131, 1544-1554.
Chefetz, B., 2003. Sorption of phenanthrene and atrazine by plant cuticular fractions. Environ.
Tox. Chem. 22, 2492-2498.
Chefetz, B., 2007. Decomposition and sorption characterization of plant cuticles in soil. Plant
Soil 298, 21-30.
Chen, B., Johnston, E.J., Chefetz, B., Zhu, L., Xing, B., 2005. Sorption of polar and nonpolar
aromatic organic contaminants by plant cuticular materials: role of polarity and
accessbility. Environmental Science and Technology 39, 6138-6146.
Chikaraishi, Y., Naraoka, H., Simon, R.P., 2004. Hydrogen and carbon isotopic fractionations
of lipids biosynthesis among terrestrial (C3, C4 and CAM) and aquatic plants.
Phytochemistry 65, 1369-1381.
Chikaraishi, Y., Naraoka, H., 2005. δ13
C and δD identification of sources of lipids biomarkers
in sediments of Lake Haruna. Geochim. Cosmochim. Acta 69, 3285-3297.
Christensen, B.T., 1996. Carbon in primary and secondary organomineral complexes. In:
Structure and Organic Matter Storage in Agricultural Soils(Ed). Lewis.
Christie, W.W., 1993 Preparation of ester derivatives of fatty acids for chromatographic
analysis. W.W Christie, Oily press, Dundee.
Clapp, C.E., Allmaras, R.R., Layese, M.F., Linden, D.R., Dowdy, R.H., 2000. Soil organic
carbon and 13
C abundance as related to tillage, crop residue and nitrogen fertilization
under continuous corn management in Minnesota. Soil and Tillage Research 55, 127-
142.
Clausen, P.A., Wilkins, K., Wolkoff, P., 1998. Gas chromatographic analysis of free fatty
acids and fatty acid salts extracted with neutral and acidified dichloromethane from
office floor dust. J. Chromatogr., A 814, 161-170.
Clifford, D.J., Carson, D.M., McKinney, D.E., Bortiatynski, J.M., Hatcher, P.G., 1995. A new
rapid technique for the characterization of lignin in vascular plants: thermochemolysis
with tetramethylammonium hydroxide (TMAH). Org. Geochem. 23, 169-175.

143
Cordeiro, N., Aurenty, P., Belgacem, M.N., Gandini, A., Neto, C.P., 1997. Surface Properties
of Suberin. J. Colloid Interface Sci. 187, 498-508.
Cordeiro, N., Belgacem, M.N., Silvestre, A.J.D., Pascoal Neto, C., Gandini, A., 1998. Cork
suberin as a new source of chemicals: 1. Isolation and chemical characterization of its
composition. Int. J. Biol. Macromol. 22, 71-80.
D
de Leeuw, J.W., Largeau, C., 1993 A review of Macromolecular Organic Compounds That
Comprise Living Organisms and Their Role in Kerogen, Coal, and Petroleum
Formation. Plenun Press, New York.
de Leeuw, J.W., Irene, W., Rijpstra, C., Nienhuis, P.H., 1995. Free and bound fatty acids and
hydroxy fatty acids in the living and decomposing eelgrass Zostera marina L. Org.
Geochem. 23, 721-728.
Dean, B.B., Kolattukudy, P.E., 1976. Synthesis of Suberin during wound-healing in jade
leaves, tomato fruit, and bean pods. Plant Physiol. 58, 411-416.
Dean, B.B., Kolattukudy, P.E., 1977. Biochemistry of suberization. Plant Physiol. 59, 48-54.
Deen, W., Kataki, P.K., 2003. Carbon sequestration in a long-term conventional vs.
conservation tillage experiment. Soil and Tillage Research 74, 143-150.
del Rio, J.C., Hatcher, P.G., 1998. Analysis of aliphatic biopolymers using thermochemolysis
with tetramethylammonium hydroxide (TMAH) and gas chromatography-mass
spectrometry. Org. Geochem. 29, 1441-1451.
del Rio, J.C., McKinney, D.E., Knicker, H., Nanny, M.A., Minard, R.D., Hatcher, P.G., 1998.
Structural characterization of bio- and geo-macromolecules by off-line
thermochemolysis with tetramethylammonium hydroxide. J. Chromatogr., A 823,
433-448.
Derrien, D., Marol, C., Balesdent, J., 2006. Microbial Biosynthesis of individual neutral
sugars among sets of substrates and soils. Geoderma 139, 190-198.
Dignac, M.-F., Bahri, H., Rumpel, C., Rasse, D.P., Bardoux, G., Balesdent, J., Girardin, C.,
Chenu, C., Mariotti, A., 2005. Carbon-13 natural abundance as a tool to study the
dynamics of lignin monomers in soil: an appraisal at the Closeaux experimental field
(France). Geoderma 128, 3-17.
Dignac, M.-F., Rumpel, C., 2006. Relative distributions of phenol dimers and hydroxy acids
in a cultivated soil and above ground maize tissue. Org. Geochem. 37, 1634-1638.

144
Dinel H. and Schnitzer M., 1990. Soil lipids: Origin, nature, content, decomposition, and
effect on soil physical properties. In:J. M. Bollag and G. Stotzky (Ed.), Soil
biochemistry, Vol.6. Dekker, M., New york, pp.397-429.
Dinel, H., 1996. Soil lipids: Origin, nature, content, decomposition, and effect on soil
properties. Soil Biochem. 6, 398-429.
Dorado, J., Gonzalez-Vila, F.-J., Zancada, M.-C., Almendros, G., Lopez-Fando, C., 2003.
Pyrolytic descriptors responsive to changes in humic acid characteristics after long-
term sustainable management of dryland farming systems in Central Spain. J. Anal.
Appl. Pyrolysis 68-69, 299-314.
Dümig, A., Knicker, H., Schad, P., Rumpel, C., Dignac, M.-F., Kögel-Knabner, I., 2007.
Araucaria forest expansion on grassland in the southern Brazilian highlands as
revealed by 14
C and 13
C studies. Geoderma in press.
E
Eglinton, G., Hunneman, D.H., McCormick, 1968. Gas chromatographic-mass spectrometric
studies of long chain hydroxy acids. Org. Mass Spectrom. 1, 593-611.
Espelie, K.E., Dean, B.B., Kolattukudy, P.E., 1979. Composition of Lipid-derived Polymers
from Different Anatomical Regions of Several Plant Species. Plant Physiol. 64, 1089-
1093.
Espelie, K.E., Kolattukudy, P.E., 1979. Composition of the aliphatic component of 'suberin'
from the bundle sheaths of zea mays L. leaves. Plant Sci. Lett. 15, 225-230.
Espelie, K.E., Davis, R.W., Kolattukudy, P.E., 1980. Composition, ultrastructure and function
of the cutin- and suberin-contaning layers in the leaf, fruit peel, juice-sac and inner
seed coat of grapefruit (Citrus paradisi Macfed.). Planta 149, 498-551.
Espelie, K.E., Wattendorff, J., Kolattukudy, P.E., 1982. Composition and ultrastructure of the
suberized cell wall of isolated crystal idioblasts from Agave americana L. leaves.
Planta 155, 166-175.
Eswaran H., Van Den Berg E. and Reich P., 1993. Organic carbon in soils of the world. Soil
Sci. Soc. Am. J. 57, 192-194.

145
F
Fabbri D., Chiavari G. and Galletti G. C., 1996. Characterization of soil humin by pyrolysis
(/methylation)-gas chromatography/mass spectrometry: structural relationship with
humic acids. J. Anal. Appl. Pyrolysis 37, 161-172.
Fang, J., Chan, O., Joeckel, R.M., Huang, Y., Wang, Y., Bazylinski, D.A., Moorman, T.B.,
Clement, B.J.A., 2006. Biomarker analysis of microbial diversity in sediments of a
saline groundwater seep of Salt Basin, Nebraska. Org. Geochem. 37, 912-931.
Fang, X., Qiu, F., Yan, B., Wang, H., Mort, A.J., Stark, R.E., 2001. NMR studies of
molecular structure in fruit cuticle polyesters. Phytochemistry 57, 1035-1042.
Fontaine, S., Mariotti, A., Abbadie, L., 2003. The priming effect of organic matter: a question
of microbial competition. Soil Biol. Biochem. 35, 837-843.
Fontaine, S. et al. Nature, in press
Franke, R., Briesen, I., Wojciechowski, T., Faust, A., Yephremov, A., Nawrath, C., Schreiber,
L., 2005. Apoplastic polyesters in Arabidopsis surface tissues - A typical suberin and a
particular cutin. Phytochemistry 66, 2643-2658.
G
Ghashghaie, J., Badeck, F.W., Lanigan, G., Nogués, S., Tcherkez, G., Deléens, E., Cornic, G.,
Griffiths, H., 2003. Carbon isotope fractionation during dark respiration and
photorespiration in C3 plants. Phytochemistry Reviews 2, 145-161.
Gleixner, G., Danier, H.J., Werner, R.A., Schmidt, H.W., 1993. Correlation between the 13
C
content of primary and secondary plant products in different cell compartments and
that in decomposing basidiomycetes. Plant Physiol. 102, 1287-1290.
Gleixner, G., 2001. Plant compounds and their turnover and stabilisation as SOM. Global
Biogeochem. Cycles 201-215.
Gobe, V., Lemee, L., Ambles, A., 2000. Structure elucidation of soil macromolecular lipids
by preparative pyrolysis and thermochemolysis. Org. Geochem. 31, 409-419.
Goñi, M.A., Hedges, J.I., 1990a. Cutin-derived CuO reaction products from purified cuticles
and tree leaves. Geochim. Cosmochim. Acta 54, 3065-3072.
Goñi, M.A., Hedges, J.I., 1990b. Potential applications of cutin-derived CuO reaction
products for discriminating vascular plant sources in natural environments. Geochim.
Cosmochim. Acta 54, 3073-3081.

146
Goñi, M.A., Hedges, J.I., 1990c. The diagenetic behavior of cutin acids in buried conifer
needles and sediments from a coastal marine environment. Geochim. Cosmochim.
Acta 55, 3083-3093.
Gonzalez Perez, M., Martin-Neto, L., Saab, S.C., Novotny, E.H., Milori, B.M.B.P., Bagnato,
V.S., Colgnago, L.A., Melo, W.J., Knicker, H., 2004. Characterization of humic acids
from a Brazilian Oxisol under different tillage systems by EPR, 13
C NMR, FTIR and
fluorescence spectrocopy. Geoderma 118, 181-190.
Gonzalez-Vila, F.J., del Rio, J.C., Martin, F., Verdejo, T., 1996. Pyrolytic alkylation-gas
chromatography-mass spectrometry of model polymers. Further insights into the
mechanism and scope of the technique. J. Chromatogr., A 750, 155-160.
Gonzalez, J.A., Gonzalez-Vila, F.J., Almendros, G., Zancada, M.C., Polvillo, O., Martin, F.,
2003. Preferential accumulation of selectively preserved biomacromolecules in the
humus fractions from a peat deposit as seen by analytical pyrolysis and spectroscopic
techniques. J. Anal. Appl. Pyrolysis 68-69, 287-298.
Graça, J., Schreiber, L., Rodrigues, J., Pereira, H., 2002. Glycerol and glyceryl esters of ω-
hydroxyacids in cutins. Phytochemistry 61, 205-215.
Gupta, N.S., Michels, R., Briggs, D.E.G., Collinson, M.E., Evershed, R.P, Pancost, R.D,
2007a. Experimental evidence for the formation of geomacromolecules from plant leaf
lipids. Org. Geochem., 38, 28-36.
Gupta, N.S., Briggs, D.E.G., Collinson, M.E., Evershed, R.P., Michels, R., Jack, K.S.,
Pancost, R.D, 2007b. Evidence for the in situ polymerisation of organic compounds
during preservation of fossil leaves: implication for organic matter preservation. Org.
Geochem., 38, 499-522.
H
Hatcher, P.G., Nanny, M.A., Minard, R.D., Dible, S.D., Carson, D.M., 1995. Comparison of
two thermochemolytic methods for the analysis of lignin in decomposing gymnosperm
wood: the CuO oxidation method and the method of thermochemolysis with
tetramethylammonium hydroxide (TMAH). Org. Geochem. 23, 881-888.
Hayes, J.M., Strauss, H., Kaufman, A.J., 1999. The abundance of 13
C in marine organic
matter and isotopic fractionation in the global biogeochemical cycle of carbon during
the past 800 Ma. Chem. Geol. 161, 103-125.

147
Hedges, J.I., Mann, D.C., 1979. The characterization of plant tissues by their lignin oxidation
products. Geochim. Cosmochim. Acta 43, 1803-1807.
Hedges, J.I., Ertel, J.R., 1982. Characterisation of lignin by gas capillary chromatography of
cupric oxide oxidation products. Anal. Chem. 54, 174-178.
Hempfling, R., Ziegler, F., Zech, W., Schulten, H.-R., 1986. Litter decomposition and
humication in acidic forest soils studied by chemical degradation, IR and NMR
spectroscopy and pyrolysis field ionization mass spectrometry. Z. Pflanzenernahr.
Bodenk. 179-186.
Hempfling R. and Schulten H.-R., 1990. Chemical characterization of the organic matter in a
forest soils by Curie point pyrolysis-GC/MS and pyrolysis-field ionization mass
spectrometry. Org. geochem. 15, 131-145.
Heredia, A., 2003. Biophysical and biochemical characteristics of cutin, a plant barrier
biopolymer. Biochim. Biophys. Acta, Gen. Subj. 1620, 1-7.
Hermosin, B., Saiz-Jimenez, C., 1999. Thermally assisted hydrolysis and methylation of
milled beech leaf litter. J. Anal. Appl. Pyrolysis 49, 417-424.
Hobbie, A.E., Werner, R.A., 2004. Intramolecular, compound-specific, and bulk carbon
isotope patterns in C3 and C4 plants: a review and synthesis. New Phytol 161, 371-
385.
Holloway, P.J., 1973. Cutins of Malus Pumila fruits and leaves. Phytochemistry 12, 2913-
2920.
Holloway, P.J., Deas, A.H.B., 1973. Epoxyoctadecanoic acids in plant cutins and suberins.
Phytochemistry 12, 1721-1735.
Holloway, P.J., Grahame, A.B., Wattendorff, J., 1981. Ultrasonical detection of epoxides in
plant cuticular membranes. J. Exp. Bot. 32, 1051-1066.
Holloway, P.J., 1983. Some variations in the composition of suberin from the cork layers of
higher plants. Phytochemistry 22, 495-502.
Hooker, M.L., Herron, G.M., Penas, P., 1982. Effect of residue burning, removal and
incorporation on irrigated cereal crop yields and soil chemical properties. Soil Sci.
Soc. Am. J. 46, 122-126.
Houghton R. A., 1995. Balancing the global carbon cycle with terrestrial ecosystems. In:R. G.
Zepp and C. Sonntag (Ed.), The role of nonliving organic matter in the earth's carbon
cycle. Wiley, pp.133-152.

148
Huang, W., Peng, P., Yu, Z., Fu, J., 2003. Effects of organic matter heterogeneity on sorption
and desorption of organic contaminants by soils and sediments. Appl. Geochem. 18,
955-972.
Hunneman, D.H., Eglinton, G., 1971. The constituent acids gymnosperm cutins.
Phytochemistry 11, 1989-2001.
J
Jandl, G., Leinweber, P., Schulten, H.-R., Ekschmitt, K., 2005. Contribution of primary
organic matter to the fatty acid pool in agricultural soils. Soil Biol. Biochem. 37,
1033-1041.
Jean-Baptiste, P., Ducroux, R., 2003. Potentiel des méthodes de séparation et stockage du
CO2 dans la lutte contre l'effet de serre. C.R Geoscience 611-625.
Jiao, Y., Whalen, J.K., Hendershot, W.H., 2006. No-tillage and manure applications increase
aggregation and improve nutrient retention in a sandy-loam soil. Geoderma 134, 24-
33.
Ju, X.T., Gao, Q., Christie, P., Zhang, F.S., 2007. Interception of residual nitrate from a
calcareaous alluvial soil profile on the North China Plain by deep-rooted crops: A 15N
tracer study. Environm. Pollution 146, 534-542
K
Klingberg, A., Odermatt, J., Meier, D., 2005. Influence of parameters on pyrolysis-GC/MS of
lignin in the presence of tetramethylammonium hydroxide. J. Anal. Appl. Pyrolysis
74, 104-109.
Kögel-Knabner, I., Bochter, R., 1985. Characterization of lignin in forest humus layers by
high-performance liquid chromatography of cupric oxide oxidation products. Soil
Biol. Biochem. 17, 637-640.
Kögel-Knabner, I., 1986. Estimation and decomposition pattern of the lignin component in
forest humus layers. Soil Biol. Biochem. 589-594.
Kögel-Knabner, I., Ziegler, F., Riederer, M., Zech, W., 1989. Distribution and decomposition
pattern of cutin and suberin in forest soil. Z. Pflanzenernahr. Bodenk. 152, 409-413.
Kögel-Knabner, I., Hatcher, P.G., Tegelaar, E.W., de Leeuw, J.W., 1992a. Aliphatic

149
components of forest soil organic matter as determined by solid-state 13
C NMR and
analytical pyrolysis. The Sci. Total Environ. 113, 89-106.
Kögel-Knabner, I., De Leeuw, J.W., Hatcher, P.G., 1992b. Nature and distribution of alkyl
carbon in forest soil profiles: implications for the origin and humification of aliphatic
biomacromolecules. The Sci. Total Environ. 17, 175-185.
Kögel-Knabner, I., de Leeuw, J.W., Tegelaar, E.W., Hatcher, P.G., Kerp, H., 1994. Impact of
brown coal dust on the organic matter in particle-size fractions of a Mollisol
Org. Geochem. 25, 29-39.
Kögel-Knabner, I., 1997. 13
C and 15
N NMR as a tool in soil organic matter studies. Geoderma
80, 117-161.
Kögel-Knabner, I., 2002. The macromolecular organic composition of plant and microbial
residues as inputs to soil organic matter. Soil Biol. Biochem. 34, 139-162.
Kolattukudy, P.E., Walton, T.J., 1973. The biochemistry of plant cuticular lipids. Prog. Chem.
Fats Lipid. 13, 119-175.
Kolattukudy, P.E., Dean, B.B., 1974. Structure, gas chromatographic measurement, and
function of suberin synthesized by potato tuber tissue slices. Plant Physiol. 54, 116-
121.
Kolattukudy, P.E., 1981. Structure, Biosynthesis, and Biodegradation of Cutin and Suberin.
Annu. Rev. Plant. Physiol. 32, 539-567.
Kolattukudy, P.E., 1984. Biochemistry and function of cutin and suberin. Can. J. Bot. 62,
2918-2933.
Kunst, L., Samuels, A.L., 2003. Biosynthesis and secretion of plant cuticular wax. Prog. Lipid
Res. 42, 51-80.
Kuzyakov, Y., 2002. Factors affecting rhizosphere priming effects. J. Plant Nutr. Soil Sci.
165, 382-396.
L
Lal, R., 2002. Soil carbon dynamics in cropland and rangeland. Environ. Pollut. 116, 353-362.
Leinweber P. and Schulten H.-R., 1995. Composition, stability and turnover of soil organic
matter: investigations by off-line pyrolysis and direct pyrolysis-mass spectrometry. J.
of Anal. Appl. Pyrolysis 32, 91-110.

150
Leinweber, P., Schulten, H.R., 1999. Advances in analytical pyrolysis of soil organic matter.
J. Anal. Appl. Pyrolysis 49, 359-383.
Lendzian, K.J., Schonherr, J., 1983. In-vivo of cutin synthesis in leaves of Clivia miniata Reg.
Planta 158, 70-75.
M
Manlay, R.J., Feller, C., Swift, M.J., 2007. Historical evolution of soil organic matter
concepts and their relationships with the fertility and sustainability of cropping
systems. Agriculture, Ecosystems & Environment 119, 217-233.
Mariotti, A., 1991. Le carbone 13 en abondance naturelle, traceur dynamique de la matière
organique des sols et de l'évolution des paléoenvironnements continentaux. cah.
Orstm, ser. Pedol. 26, 299-313.
Matas, A.J., Cuartero, J., Heredia, A., 2004. Phase transition in the biopolyester cutin isolated
from tomato cuticle. Thermochim. Acta 409, 165-168.
Matzke, K., Riederer, M., 1990. The composition of the cutin of the caryopses and leaves of
Triticum aestivum L. Planta 182, 461-466.
Matzke, K., Riederer, M., 1991. A comparative study into the chemical constitution of cutins
and suberins from Picea abies (L.) Karst., Quercus robur L. and Fagus sylvatica L.
Planta 185, 233-245.
McKinney, D.E., Carson, D.M., Clifford, D.J., Minard, R.D., Hatcher, P.G., 1995. Off-line
thermochemolysis versus flash pyrolysis for the in situ methylation of lignin: Is
pyrolysis necessary? J. Anal. Appl. Pyrolysis 34, 41-46.
Melzer, E., Schmidt, H.W., 1987. Carbon isotope effects on the Pyruvate Dehydrogenase
Reaction and their importance for relative carbon-13 depletion in lipids. The J. Biol.
Chem. 262, 8159-8164.
Mendez-Millan, M., Dignac, M.-F., Rumpel, C. Depolymerisation of the aliphatic
macromolecular polyesters in maize leaves and soil: comparison of methods.
Submitted to Org. Geochem.
Ménot, G., Burns, S.J., 2001. Carbon isotopes in ombrogenic peat bog plants as climatic
indicators: calibration from an altitudinal transect in Switzerland. Org. Geochem. 32,
233-245.
Moire, L., Schmutz, A., Buchala, A., Yan, B., Stark, R.E., Ryser, U., 1999. Glycerol, Is a
Suberin Monomer?. New Experimental Evidence for an Old Hypothesis. Plant
Physiol. 119, 1137-1146.

151
Moldes, A., Cendon, Y., Barral, M.T., 2007. Evaluation of municipal solid waste compost as
a plant growing media component, by applying mixture design. Bioresource
Technology, 98, 3069-3075.
Molina, I., Bonaventure, G., Ohlrogge, J., Pollard, M., 2006. The lipid polyester composition
of Arabidopsis thaliana and Brassica napus seeds. Phytochemistry 67, 2597-2610.
Monti, A., Brugnoli, E., Scartazza, A., Amaducci, M.T., 2006. The effect of transient and
continuous drought on yield, photosynthesis and carbon isotope discrimination in
sugar beet (Beta vulgaris L.). J. Exp. Bot. 57, 1253-1262.
Morrison, W.R., Smith, L.M., 1964. Preparation of fatty acid methyl esters and
dimethylacetals from lipids with boron fluoride-methanol. J. Lipid Res. 3, 600-608.
Morrison R. I., 1969. Soil lipids. Organic Geochemistry: methods and results 558-575.
N
Naafs, D.F.W., Van Bergen, P.F., 2002. Effect of pH adjustments after Base Hydrolysis:
Implications for Understanding Organic Matter in Soils. Geoderma 106, 191-217.
Negrel, J., Pollet, B., Lapierre, C., 1996. Ether-linked ferulic acid amides in natural and
wound periderms of potato tuber. Phytochemistry 43, 1195-1199.
Newman, J.W., Hammock, B.D., 2001. Optimized thiol derivatizing reagent for the mass
spectral analysis of disubstituted epoxy fatty acids. J. Chromatogr., A 925, 223-240.
Nierop, K.G.J., 1998. Origin of aliphatic compounds in a forest soil. Org. Geochem. 29, 1009-
1016.
Nierop, K.G.J., Buurman, P., 1999. Insoluble organic matter fractions in incipient podzol B
horizon: preservation of aliphatic biopolymers from roots. Humic Subs. Environ. 1,
29-37.
Nierop, K.G.J., 2001. Temporal and vertical organic matter differentiation along a vegetation
succession as revealed by pyrolysis and thermally assisted hydrolysis and methylation.
J. Anal. Appl. Pyrolysis 61, 111-132.
Nierop, K.G.J., van Lagen, B., Buurman, P., 2001. Composition of plant tissues and soil
organic matter in the first stages of a vegetation succession. Geoderma 100, 1-24.
Nierop, K.G.J., Naafs, D.F.W., Verstraten, J.M., 2003. Occurrence and distribution of ester-
bound lipids in Dutch coastal dune soils along a pH gradient. Org. Geochem. 34, 719-
729.
Nierop, K.G.J., Jansen, B., Hageman, J.A., Verstraten, J.M., 2006. The complementarity of
152
extractable and ester-bound lipids in a soil profile under pine. Plant Soil 286, 269-285.
Nip, M., Tegelaar, E.W., Brinkhuis, H., De Leeuw, J.W., Schenck, P.A., Holloway, P.J.,
1986. Analysis of modern and fossil plant cuticles by Curie point Py-GC and Curie
point Py-GC-MS: Recognition of a new, highly aliphatic and resistant biopolymer.
Org. Geochem. 10, 769-778.
Nogués, S., Tcherkez, G., Cornic, G., Ghashghaie, J., 2004. Respiratory carbon Metabolism
following illumination in intact french bean leaves using 13
C/12
C isotope labeling.
Plant Physiol. 136, 3245-3254.
O
O'Brein, B.J., Stout, J.D., 1978. Movement and turnover of soil organic matter as indicated by
carbon isotope measurements. Soil Biol. Biochem. 10, 309-317.
Oades, J.M., 1995 An overview of processes affecting the cycling of organic carbon in soils.
John Wiley, New York.
Ohra-aho, T., Tenkanen, M., Tamminen, T., 2005. Direct analysis of lignin and lignin-like
components from softwood kraft pulp by Py-GC/MS techniques. J. Anal. Appl.
Pyrolysis 74, 123-128.
Odlare, M., Pell, M., Svensson, K., 2007. Changes in soil chemical and microbial properties
during 4 years of application of various organic residues. Waste Management, article
in press.
Otto, A., Shunthirasingham, C., Simpson, M.J., 2005. A comparison of plant and microbial
biomarkers in grassland soils from the Prairie Ecozone of Canada. Org. Geochem. 36,
425-448.
Otto, A., Simpson, M.J., 2006. Sources and composition of hydrolysable aliphatic lipids and
phenols in soils from western Canada. Org. Geochem. 37, 385-407.
P
Pare, T., Dinel, H., Moulin, A.P., Townley-Smith, L., 1999. Organic matter quality and
structural stability of a Black Chernozemic soil under different manure and tillage
practices. Geoderma 91, 311-326.
Park, R., Epstein, S., 1961. Metabolic fractionation of C13
& C12
in plants. Plant Physiol. 36,
133-138.

153
Paul, E.A., Follett, R.F., Leavitt, S.W., Halvorson, A., Peterson, G.A., Lyon, D.J., 1997.
Radiocarbon dating for determination of soil organic matter pool sizes and dynamics.
Soil. Sci. Soc. Am. J. 61, 1058-1067.
Peres, V.F., Saffi, J., Melecchi, M.I.S., Abad, F.C., de Assis Jacques, R., Martinez, M.M.,
Oliveira, E.C., Caramao, E.B., in press. Comparison of soxhlet, ultrasound-assisted
and pressurized liquid extraction of terpenes, fatty acids and Vitamin E from Piper
gaudichaudianum Kunth. J. Chromatogr., A In Press, Corrected Proof.
Prasad, R., Power, J.F., 1991. Crop residue management. Advances in Soil Science 15, 204-
252.
Q
Quénéa, K., Derenne, S., Largeau C., Rumpel C. and Mariotti, A., 2004. Variation in lipid
abundance and composition among different particle-size fractions of a forest soil.
Org. geochem. 35, 1355-1370.
Quénéa, K., Derenne, S., Gonzalez-Vila, F.J., Mariotti, A., Rouzaud, J.-N., Largeau C., 2005.
Study of the composition of the macromolecular refractory fraction from an acidic
sandy forest soil (Landes de Gascogne, France) using chemical degradation and
electron microscopy. Org. Geochem. 36, 1151-1162.
Quénéa, K., Largeau C., Derenne, S., Spaccini, R., Bardoux, G., and Mariotti, A., 2006.
Molecular and isotopic study of lipids in particle size fraction of a sandy cultivated
soil (Cestas cultivation sequence, southwest France): Sources, degradation and
comparison with Cestas forest soil. Org. geochem 37, 20-44.
R
Rasmussen, P.E., Allmaras, R.R., Rhode, C.R., Roager, N.C.J., 1980. Crop residue influences
on soil carbon and nitrogen in a wheat-fallow system. Soil Sci. Soc. Am. J. 44, 596-
600.
Rasse, P.D., Rumpel, C., Dignac, M.-F., 2005. In soil carbon mostly root carbon?
Mechanisms for a specific stabilisation. Plant Soil 269, 341-356.
Rasse, D.P., Mulder, J., Moni, C., Chenu, C., 2006. Carbon turnover kinetics with depth in a
French loamy soil. Soil Sci. Soc. Am. J. 70, 2097-2105.

154
Ray, A.K., Lin, Y.Y., Gerard, H., Chen, Z.-J., Osman, S.F., Fett, W.F., Moreau, R.A., Stark,
R.E., 1995. Separation and identification of lime cutin monomers by high performance
liquid chromatography and mass spectrometry. Phytochemistry 38, 1361-1369.
Ray, A.K., Chen, Z.-J., Stark, R.E., 1998. Chemical Depolymerization Studies Of The
Molecular Architecture Of Lime Fruit Cuticle. Phytochemistry 49, 65-70.
Reicosky, D.C., Evans, S.D., Cambardella, C.A., Allmaras, R.R., Wilts, A.R., Huggins, D.R.,
2002. Continuous corn with moldboard tillage: Residue and fertility effects on soil
carbon. J. Soil Water Conser. 57, 277-284.
Riederer, M., Schonherr, J., 1988. Development of plant cuticles: fine structure and cutin
composition of Clivia miniata Reg. leaves. Planta 174, 127-138.
Riederer, M., Matzke, K., Ziegler, F., Kögel-Knabner, I., 1993. Occurrence, distribution and
fate of the lipid plant biopolymers cutin and suberin in temperate forest soils. Org.
Geochem. 20, 1063-1076.
Robert, M., Saugier, B., 2003. Contribution des écosystèmes continentaux à la séquestration
du carbone. C.R Geoscience 577-595.
Rocha, S.M., Goodfellow, B.J., Delgadillo, I., Neto, C.P., Gil, A.M., 2001. Enzymatic
isolation and structural characterisation of polymeric suberin of cork from Quercus
suber L. Int. J. Biol. Macromol. 28, 107-119.
Rossmann, A., Butzenlechner, M., Schmidt, H.W., 1991. Evidence for a nonstatistical carbon
isotope distribution in natural glucose. Plant Physiol. 96, 609-614.
Rumpel, C., Kögel-Knabner, I., Bruhn, F., 2002. Vertical distribution, age, and chemical
composition of organic carbon in two forest soils of different pedogenesis. Org.
Geochem. 33, 1131-1142.
Rumpel, C., Eusterhues, K., Kögel-Knabner, I., 2004. Location and chemical composition of
stabilized organic carbon in topsoil and subsoil horizons of two acid forest soils. Soil
Biol. Biochem. 36, 177-190.
S
Sachleben, J.R., Chefetz, B., Deshmukh, A.P., Hatcher, P.G., 2004. Solid-state NMR
characterization of pyrene-cuticular matter interaction. Environ. Sci. Techno. 38,
4369-4376.

155
Saiz-Jimenez C. and de Leeuw J. W., 1985. Chemical characterization of soil organic matter
fractions by analytical pyrolysis-gas chromatography-mass spectrometry. J. Anal.
Appl. Pyrolysis 11, 437-450.
Saiz-Jimenez C. and de Leeuw J. W., 1987. Chemical structure of soil humic acid as revealed
by analytical pyrolysis. J. Ana. Appl. Pyrolysis 11, 367-376.
Saiz-Jimenez C., 1994. Analytical pyrolysis of humic substances: pitfalls, limitations and
possible solutions. Environ. Sci. Techno. 28, 1773-1780.
Santos Bento, M.F., Pereira, H., Cunha, M.A., Moutinho, A.M.C., van den Berg, K.J., Boon,
J.J., 2001. A study of variability of suberin composition in cork from Quercus suber
L. using thermally assisted transmethylation GC-MS. J. Ana. Appl. Pyrolysis 57, 45-
55.
Schmidt, H.W., Schönherr, J., 1982. Development of plant cuticles: occurence and role of
non-ester bonds in cutin of Clivia miniata Reg. leaves. Planta 156, 380-384.
Schnitzer, M., 1973. Alkaline cupric oxide oxidation of a methylated fulvic acid. Soil Biol.
Biochem. 6, 1-6.
Sisti, C.P.J., Dos Santos, H.P., Alves, B.J.R., Urquiga, S., Boddey, R.M., 2004. Change in
carbon and nitrogen stocks in soil under 13 years of conventional or zero tillage in
southern Brazil. Soil Till. Res. 76, 39-58.
Six, J., Conant, R.T., Paustian, K., 2002. Stabilisation mechanisms of soil organic matter:
Implications for C-saturation of soils. Plant Soil 241, 155-176.
Six, J., Jastrow, J.D., 2002. Oraganic matter turnover. In: Encyclopedia of Soil Science, R.
Lal (Ed). pp. 936-942. Marcel Dekker, New York.
Skrzypek, G., Kaluzny, A., Wojtun, B., Jedrysek, M.O., 2007. The carbon stable isotopic
composition of mosses: a record of temperature variation. Org. Geochem. Article in
press.
Smith, N.S., Epstein, S., 1971. Two categories of 13
C/12
C Ratio for higher plants. Plant
Physiol. 47, 380-384.
Sollins, P., Homann, P., Cadwell, B.A., 1996. Stabilisation and destabilisation of soil organic
matter mechanism and control. Geoderma 74, 65-105.
Stark, R.E., Garbow, J.R., 1992. Nuclear Magnetic Resonance Relaxation Studies of Plant
Polyester Dynamics. 2. Suberized Potato Cell Wall. Macromolecules 149-154.
Stark, R.E., Sohn, W., Pacchiano Jr, R.A., Al-Bashir, M., Garbow, J.R., 1994. Following
Suberization in Potato Wound Periderm by Histochemical and Solid-State 13
C Nuclear
Magnetic Resonance Methods. Plant Physiol. 104, 527-533.

156
Stevenson F. J., 1966. Lipids in soil. J. A. Oil Chem. Soc. 43, 203-210.
Stimler, K., Xing, B., Chefetz, B., 2006. Transformation of plant cuticles in soil: effect on
their sorptives capabilities. Soil Sci. Soc. Am. J. 70, 1101-1109.
T
Tcherkez, G., Nogués, S., Cornic, G., Badeck, F.W., Ghashghaie, J., 2003. Metabolic origin
of carbon isotope composition of leaf dark-repired CO2 in French Bean. Plant Physiol.
131, 237-244.
Tegelaar, E.W., de Leeuw, J.W., Largeau, C., Derenne, S., Schulten, H.-R., Muller, R., Boon,
J.J., Nip, M., Sprenkels, J.C.M., 1989a. Scope and limitations of several pyrolysis
methods in the structural elucidation of a macromolecular plant constituent in the leaf
cuticle of Agave americana L. J. Anal. Appl. Pyrolysis 15, 29-54.
Tegelaar, E.W., De Leeuw, J.W., Holloway, P.J., 1989b. Some mechanisms of flash pyrolysis
of naturally occuring higher plant polyesters. J. Anal. Appl. Pyrolysis 15, 289-295.
Tegelaar, E.W., de Leeuw, J.W., Saiz-Jimenez, C., 1989c. Possible origin of aliphatic
moieties in humic substances. The Sci. Total Environ. 81-82, 1-17.
Tegelaar, E.W., Kerp, H., Vissher, H., Schenk, P.A., 1990. Biais of the paleobotanical record
as a consequence of variations in the chemical composition of higher vascular plant
cuticles. Paleobiology 17, 133-144.
Tegelaar, E.W., Kerp, H., Vissher, H., Schenk, P.A., 1991. Biais of the paleobotanical record
as a consequence of variations in the chemical composition of higher vascular plant
cuticles. Paleobiology 17, 133-144.
V
Velcheva, M.P., Espelie, K.E., Ivanov, C.P., 1981. Aliphatic composition of cutin from inner
seed coat of apple. Phytochemistry 20, 2225-2227.

157
W
Wiesenberg, G.L.B., Schwarzbauer, J., Schmidt, M.W.I., Schwark, L., 2004a. Source and
turnover of organic matter in agricultural soils derived from n-alkane/n-carboxylic
acid compositions and C-isotope signatures. Org. Geochem. 35, 1371-1393.
Wiesenberg, G.L.B., Schwark, L., Schmidt, M.W.I, 2004b. Improved automated extraction
and separation procedure for soil lipid analyses. Eur. J. Soil Science 55, 349-356.
Z
Zeier, J., Schreiber, L., 1997. Chemical Composition of Hypodermal and Endodermal Cell
Walls and Xylem Vessels Isolated from Clivia miniata (Identification of the
Biopolymers Lignin and Suberin). Plant Physiol. 113, 1223-1231.
Zeier, J., Schreiber, L., 1998. Comparative investigation of primary and tertiary endodermal
cell walls isolated from the roots of five monocotyledonous species: chemical
composition in relation to fine structure. Planta 206, 349-361.
Zeier, J., Ruel, K., Ryser, U., Schreiber, L., 1999. Chemical analysis and immunolocalisation
of lignin and suberin in endodermal and hypodermal/rhizodermal cell walls of
developing maize (Zea mays L.) primary roots. Planta 209, 1-12.
Zimmermann, H.M., Hartmann, K., Schreiber, L., Steudle, E., 2000. Chemical composition of
apoplastic transport barriers in relation to radial hydraulic conductivity of corn roots
(Zea mays L.). Planta 210, 302-311.


![MENDEZ] [CARLOS - carlos mendez](https://img.pdfslide.us/doc/110x75/620652ca8c2f7b173006a76f/mendez-carlos-carlos-mendez.jpg)