Embed Size (px)
Citation preview
30 June 2015
MERCANTILE INVESTMENT COMPANY LIMITED
ABN 15 121 415 576
Annual Report
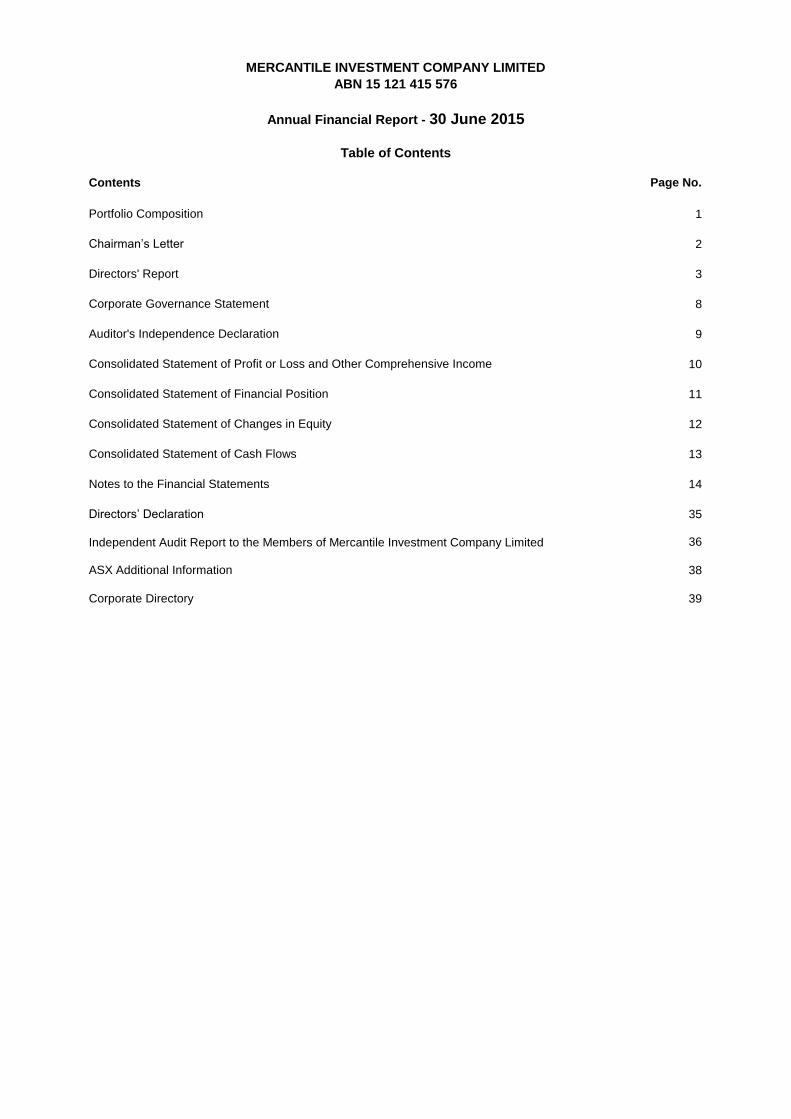
Contents Page No.
Portfolio Composition 1
Chairman’s Letter 2
Directors' Report 3
Corporate Governance Statement 8
Auditor's Independence Declaration 9
Consolidated Statement of Profit or Loss and Other Comprehensive Income 10
Consolidated Statement of Financial Position 11
Consolidated Statement of Changes in Equity 12
Consolidated Statement of Cash Flows 13
14
35
36
38
39
Independent Audit Report to the Members of Mercantile Investment Company Limited
Directors’ Declaration
Notes to the Financial Statements
ASX Additional Information
Corporate Directory
ABN 15 121 415 576
Table of Contents
MERCANTILE INVESTMENT COMPANY LIMITED
Annual Financial Report - 30 June 2015
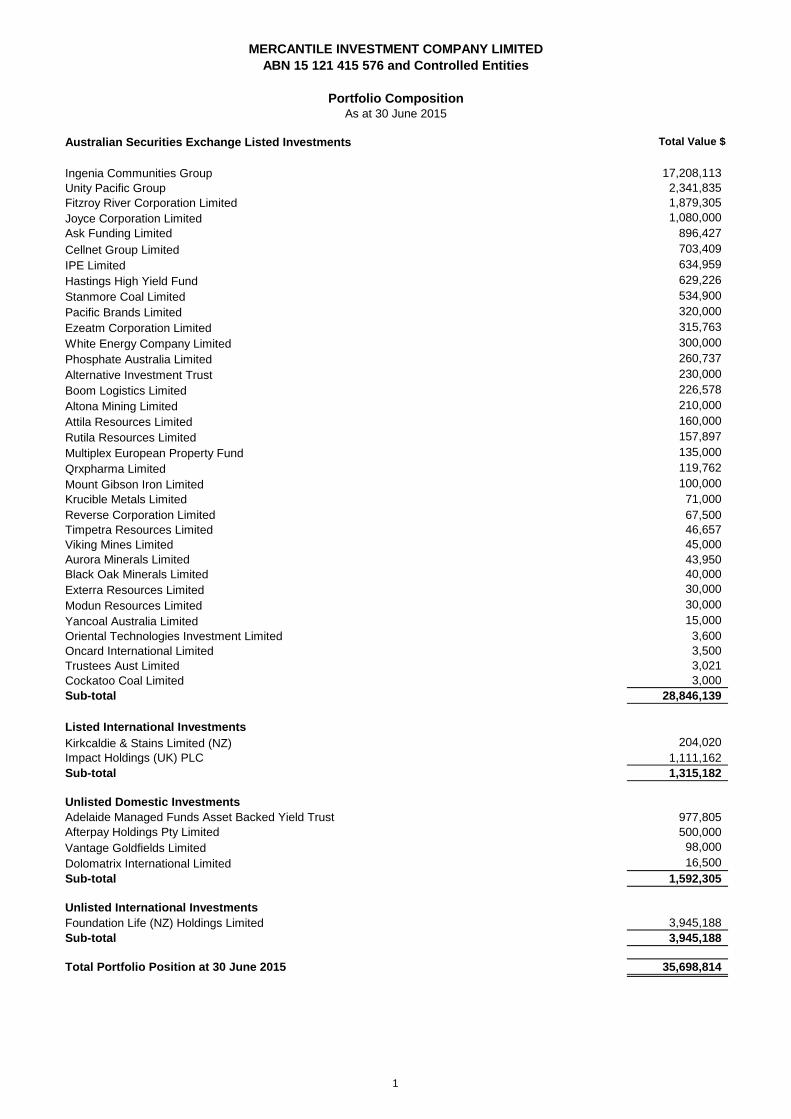
Australian Securities Exchange Listed Investments Total Value $
Ingenia Communities Group 17,208,113
Unity Pacific Group 2,341,835
Fitzroy River Corporation Limited 1,879,305
Joyce Corporation Limited 1,080,000
Ask Funding Limited 896,427
Cellnet Group Limited 703,409
IPE Limited 634,959
Hastings High Yield Fund 629,226
Stanmore Coal Limited 534,900
Pacific Brands Limited 320,000
Ezeatm Corporation Limited 315,763
White Energy Company Limited 300,000
Phosphate Australia Limited 260,737
Alternative Investment Trust 230,000
Boom Logistics Limited 226,578
Altona Mining Limited 210,000
Attila Resources Limited 160,000
Rutila Resources Limited 157,897
Multiplex European Property Fund 135,000
Qrxpharma Limited 119,762
Mount Gibson Iron Limited 100,000
Krucible Metals Limited 71,000
Reverse Corporation Limited 67,500
Timpetra Resources Limited 46,657
Viking Mines Limited 45,000
Aurora Minerals Limited 43,950
Black Oak Minerals Limited 40,000
Exterra Resources Limited 30,000
Modun Resources Limited 30,000
Yancoal Australia Limited 15,000
Oriental Technologies Investment Limited 3,600
Oncard International Limited 3,500
Trustees Aust Limited 3,021
Cockatoo Coal Limited 3,000
Sub-total 28,846,139
Listed International Investments
Kirkcaldie & Stains Limited (NZ) 204,020
Impact Holdings (UK) PLC 1,111,162
Sub-total 1,315,182
Unlisted Domestic Investments
Adelaide Managed Funds Asset Backed Yield Trust 977,805
Afterpay Holdings Pty Limited 500,000
Vantage Goldfields Limited 98,000
Dolomatrix International Limited 16,500
Sub-total 1,592,305
Unlisted International Investments
Foundation Life (NZ) Holdings Limited 3,945,188
Sub-total 3,945,188
Total Portfolio Position at 30 June 2015 35,698,814
MERCANTILE INVESTMENT COMPANY LIMITED
ABN 15 121 415 576 and Controlled Entities
Portfolio CompositionAs at 30 June 2015
1
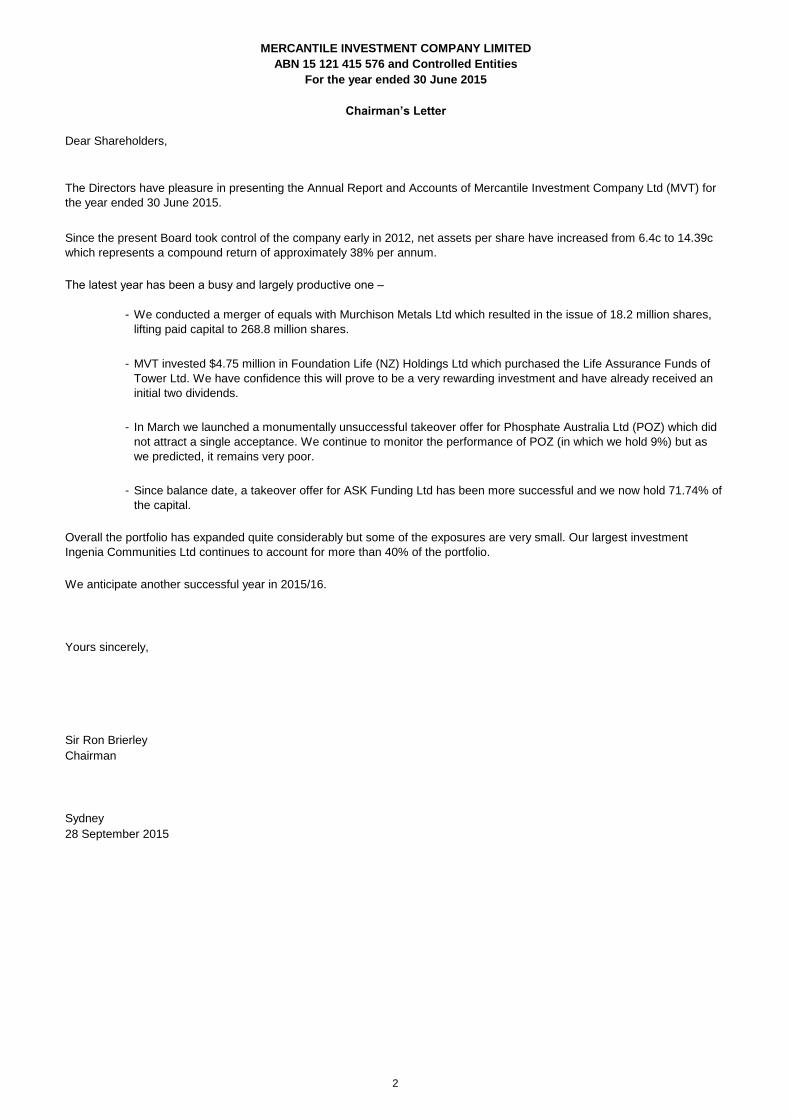
Dear Shareholders,
-
-
-
-
Yours sincerely,
Sir Ron Brierley
Chairman
Sydney
28 September 2015
We conducted a merger of equals with Murchison Metals Ltd which resulted in the issue of 18.2 million shares,
lifting paid capital to 268.8 million shares.
MVT invested $4.75 million in Foundation Life (NZ) Holdings Ltd which purchased the Life Assurance Funds of
Tower Ltd. We have confidence this will prove to be a very rewarding investment and have already received an
initial two dividends.
In March we launched a monumentally unsuccessful takeover offer for Phosphate Australia Ltd (POZ) which did
not attract a single acceptance. We continue to monitor the performance of POZ (in which we hold 9%) but as
we predicted, it remains very poor.
Since balance date, a takeover offer for ASK Funding Ltd has been more successful and we now hold 71.74% of
the capital.
Overall the portfolio has expanded quite considerably but some of the exposures are very small. Our largest investment
Ingenia Communities Ltd continues to account for more than 40% of the portfolio.
Chairman’s Letter
We anticipate another successful year in 2015/16.
MERCANTILE INVESTMENT COMPANY LIMITED
The Directors have pleasure in presenting the Annual Report and Accounts of Mercantile Investment Company Ltd (MVT) for
the year ended 30 June 2015.
ABN 15 121 415 576 and Controlled Entities
Since the present Board took control of the company early in 2012, net assets per share have increased from 6.4c to 14.39c
which represents a compound return of approximately 38% per annum.
The latest year has been a busy and largely productive one –
For the year ended 30 June 2015
2
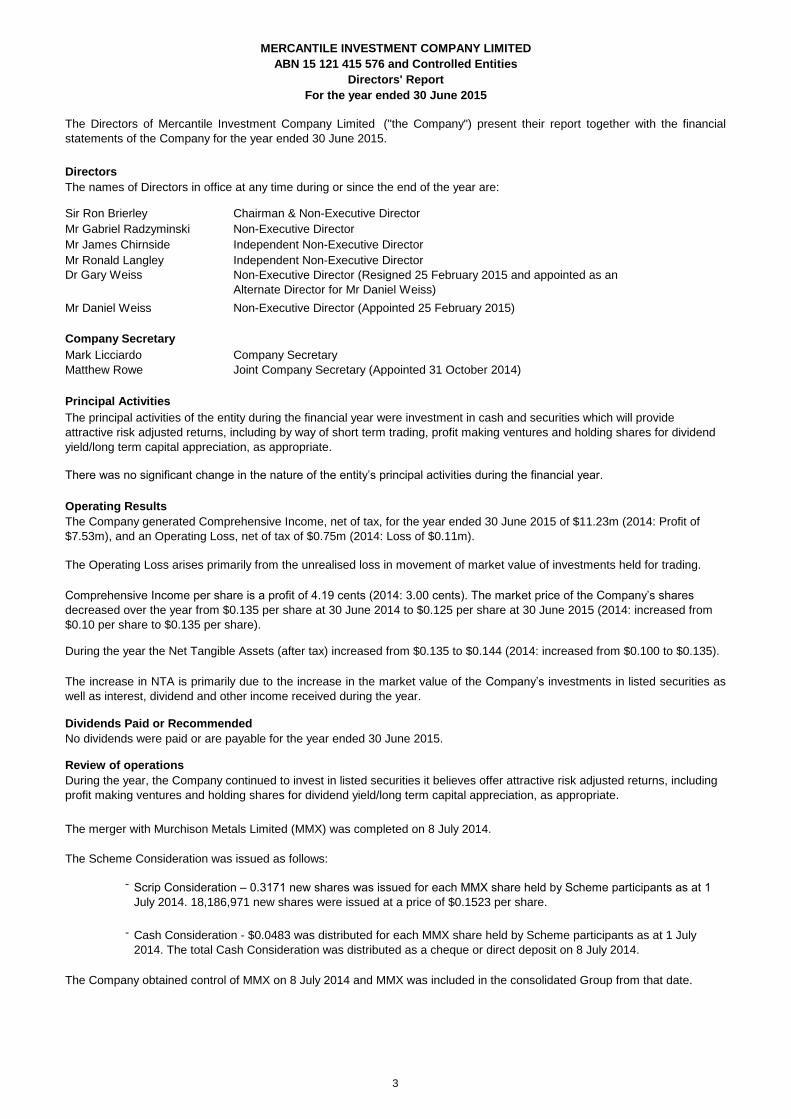
Directors
Sir Ron Brierley Chairman & Non-Executive Director
Mr Gabriel Radzyminski Non-Executive Director
Mr James Chirnside Independent Non-Executive Director
Mr Ronald Langley Independent Non-Executive Director
Dr Gary Weiss
Mr Daniel Weiss Non-Executive Director (Appointed 25 February 2015)
Company Secretary
Company Secretary
Joint Company Secretary (Appointed 31 October 2014)
Principal Activities
Operating Results
Dividends Paid or Recommended
No dividends were paid or are payable for the year ended 30 June 2015.
Review of operations
-
-
For the year ended 30 June 2015
There was no significant change in the nature of the entity’s principal activities during the financial year.
The Directors of Mercantile Investment Company Limited ("the Company") present their report together with the financial
statements of the Company for the year ended 30 June 2015.
MERCANTILE INVESTMENT COMPANY LIMITED
ABN 15 121 415 576 and Controlled Entities
The names of Directors in office at any time during or since the end of the year are:
Directors' Report
Non-Executive Director (Resigned 25 February 2015 and appointed as an
Alternate Director for Mr Daniel Weiss)
The principal activities of the entity during the financial year were investment in cash and securities which will provide
attractive risk adjusted returns, including by way of short term trading, profit making ventures and holding shares for dividend
yield/long term capital appreciation, as appropriate.
Mark Licciardo
Matthew Rowe
The Operating Loss arises primarily from the unrealised loss in movement of market value of investments held for trading.
During the year the Net Tangible Assets (after tax) increased from $0.135 to $0.144 (2014: increased from $0.100 to $0.135).
The Company generated Comprehensive Income, net of tax, for the year ended 30 June 2015 of $11.23m (2014: Profit of
$7.53m), and an Operating Loss, net of tax of $0.75m (2014: Loss of $0.11m).
Comprehensive Income per share is a profit of 4.19 cents (2014: 3.00 cents). The market price of the Company’s shares
decreased over the year from $0.135 per share at 30 June 2014 to $0.125 per share at 30 June 2015 (2014: increased from
$0.10 per share to $0.135 per share).
The increase in NTA is primarily due to the increase in the market value of the Company’s investments in listed securities as
well as interest, dividend and other income received during the year.
During the year, the Company continued to invest in listed securities it believes offer attractive risk adjusted returns, including
profit making ventures and holding shares for dividend yield/long term capital appreciation, as appropriate.
The merger with Murchison Metals Limited (MMX) was completed on 8 July 2014.
The Scheme Consideration was issued as follows:
Scrip Consideration – 0.3171 new shares was issued for each MMX share held by Scheme participants as at 1
July 2014. 18,186,971 new shares were issued at a price of $0.1523 per share.
Cash Consideration - $0.0483 was distributed for each MMX share held by Scheme participants as at 1 July
2014. The total Cash Consideration was distributed as a cheque or direct deposit on 8 July 2014.
The Company obtained control of MMX on 8 July 2014 and MMX was included in the consolidated Group from that date.
3
Directors' Report (continued)
Events occurring after the reporting period
Future Developments, Prospects and Business Strategies
Environmental regulations
Information on Directors and Company Secretary
Sir Ron Brierley (Chairman and Non-Executive Director)
Mr Gabriel Radzyminski - BA (Hons), MCom (Non-Executive Director)
Mr James Chirnside (Independent Non-Executive Director)
ABN 15 121 415 576 and Controlled Entities
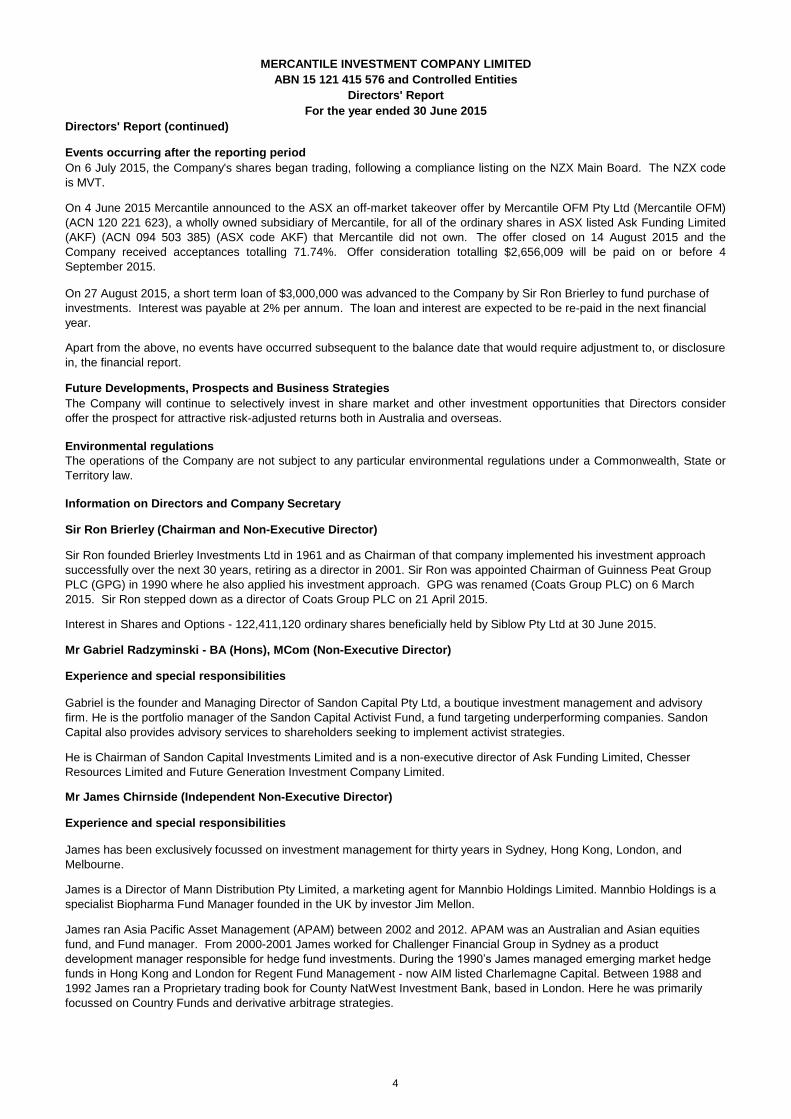
On 27 August 2015, a short term loan of $3,000,000 was advanced to the Company by Sir Ron Brierley to fund purchase of
investments. Interest was payable at 2% per annum. The loan and interest are expected to be re-paid in the next financial
year.
The operations of the Company are not subject to any particular environmental regulations under a Commonwealth, State or
Territory law.
James has been exclusively focussed on investment management for thirty years in Sydney, Hong Kong, London, and
Melbourne.
James is a Director of Mann Distribution Pty Limited, a marketing agent for Mannbio Holdings Limited. Mannbio Holdings is a
specialist Biopharma Fund Manager founded in the UK by investor Jim Mellon.
James ran Asia Pacific Asset Management (APAM) between 2002 and 2012. APAM was an Australian and Asian equities
fund, and Fund manager. From 2000-2001 James worked for Challenger Financial Group in Sydney as a product
development manager responsible for hedge fund investments. During the 1990’s James managed emerging market hedge
funds in Hong Kong and London for Regent Fund Management - now AIM listed Charlemagne Capital. Between 1988 and
1992 James ran a Proprietary trading book for County NatWest Investment Bank, based in London. Here he was primarily
focussed on Country Funds and derivative arbitrage strategies.
Experience and special responsibilities
Gabriel is the founder and Managing Director of Sandon Capital Pty Ltd, a boutique investment management and advisory
firm. He is the portfolio manager of the Sandon Capital Activist Fund, a fund targeting underperforming companies. Sandon
Capital also provides advisory services to shareholders seeking to implement activist strategies.
He is Chairman of Sandon Capital Investments Limited and is a non-executive director of Ask Funding Limited, Chesser
Resources Limited and Future Generation Investment Company Limited.
MERCANTILE INVESTMENT COMPANY LIMITED
Directors' Report
For the year ended 30 June 2015
On 6 July 2015, the Company's shares began trading, following a compliance listing on the NZX Main Board. The NZX code
is MVT.
Interest in Shares and Options - 122,411,120 ordinary shares beneficially held by Siblow Pty Ltd at 30 June 2015.
On 4 June 2015 Mercantile announced to the ASX an off-market takeover offer by Mercantile OFM Pty Ltd (Mercantile OFM)
(ACN 120 221 623), a wholly owned subsidiary of Mercantile, for all of the ordinary shares in ASX listed Ask Funding Limited
(AKF) (ACN 094 503 385) (ASX code AKF) that Mercantile did not own. The offer closed on 14 August 2015 and the
Company received acceptances totalling 71.74%. Offer consideration totalling $2,656,009 will be paid on or before 4
September 2015.
Experience and special responsibilities
Apart from the above, no events have occurred subsequent to the balance date that would require adjustment to, or disclosure
in, the financial report.
The Company will continue to selectively invest in share market and other investment opportunities that Directors consider
offer the prospect for attractive risk-adjusted returns both in Australia and overseas.
Sir Ron founded Brierley Investments Ltd in 1961 and as Chairman of that company implemented his investment approach
successfully over the next 30 years, retiring as a director in 2001. Sir Ron was appointed Chairman of Guinness Peat Group
PLC (GPG) in 1990 where he also applied his investment approach. GPG was renamed (Coats Group PLC) on 6 March
2015. Sir Ron stepped down as a director of Coats Group PLC on 21 April 2015.
4
Directors' Report (continued)
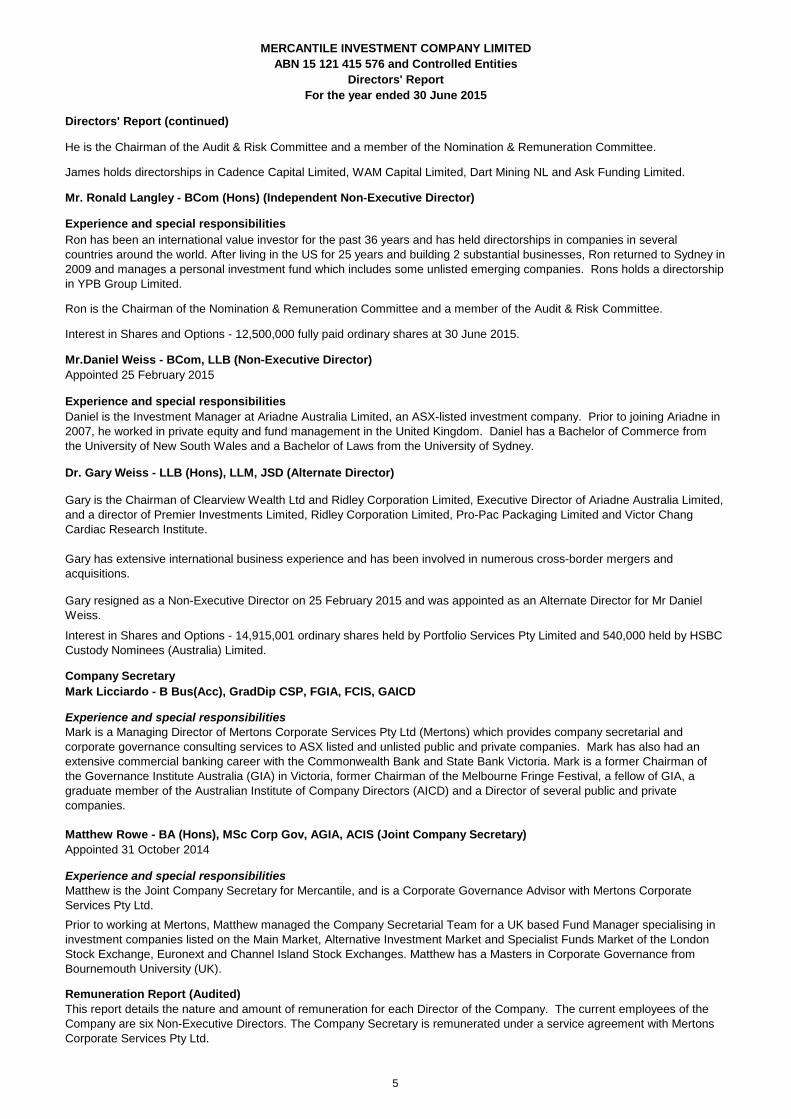
Mr. Ronald Langley - BCom (Hons) (Independent Non-Executive Director)
Mr.Daniel Weiss - BCom, LLB (Non-Executive Director)
Appointed 25 February 2015
Dr. Gary Weiss - LLB (Hons), LLM, JSD (Alternate Director)
Company Secretary
Mark Licciardo - B Bus(Acc), GradDip CSP, FGIA, FCIS, GAICD
Matthew Rowe - BA (Hons), MSc Corp Gov, AGIA, ACIS (Joint Company Secretary)
Appointed 31 October 2014
He is the Chairman of the Audit & Risk Committee and a member of the Nomination & Remuneration Committee.
James holds directorships in Cadence Capital Limited, WAM Capital Limited, Dart Mining NL and Ask Funding Limited.
Ron has been an international value investor for the past 36 years and has held directorships in companies in several
countries around the world. After living in the US for 25 years and building 2 substantial businesses, Ron returned to Sydney in
2009 and manages a personal investment fund which includes some unlisted emerging companies. Rons holds a directorship
in YPB Group Limited.
Experience and special responsibilities
Ron is the Chairman of the Nomination & Remuneration Committee and a member of the Audit & Risk Committee.
MERCANTILE INVESTMENT COMPANY LIMITED
ABN 15 121 415 576 and Controlled Entities
Mark is a Managing Director of Mertons Corporate Services Pty Ltd (Mertons) which provides company secretarial and
corporate governance consulting services to ASX listed and unlisted public and private companies. Mark has also had an
extensive commercial banking career with the Commonwealth Bank and State Bank Victoria. Mark is a former Chairman of
the Governance Institute Australia (GIA) in Victoria, former Chairman of the Melbourne Fringe Festival, a fellow of GIA, a
graduate member of the Australian Institute of Company Directors (AICD) and a Director of several public and private
companies.
Experience and special responsibilities
Directors' Report
For the year ended 30 June 2015
Remuneration Report (Audited)
Experience and special responsibilities
Gary resigned as a Non-Executive Director on 25 February 2015 and was appointed as an Alternate Director for Mr Daniel
Weiss.
Experience and special responsibilities
Matthew is the Joint Company Secretary for Mercantile, and is a Corporate Governance Advisor with Mertons Corporate
Services Pty Ltd.
Interest in Shares and Options - 12,500,000 fully paid ordinary shares at 30 June 2015.
Prior to working at Mertons, Matthew managed the Company Secretarial Team for a UK based Fund Manager specialising in
investment companies listed on the Main Market, Alternative Investment Market and Specialist Funds Market of the London
Stock Exchange, Euronext and Channel Island Stock Exchanges. Matthew has a Masters in Corporate Governance from
Bournemouth University (UK).
Gary is the Chairman of Clearview Wealth Ltd and Ridley Corporation Limited, Executive Director of Ariadne Australia Limited,
and a director of Premier Investments Limited, Ridley Corporation Limited, Pro-Pac Packaging Limited and Victor Chang
Cardiac Research Institute.
Gary has extensive international business experience and has been involved in numerous cross-border mergers and
acquisitions.
Interest in Shares and Options - 14,915,001 ordinary shares held by Portfolio Services Pty Limited and 540,000 held by HSBC
Custody Nominees (Australia) Limited.
Daniel is the Investment Manager at Ariadne Australia Limited, an ASX-listed investment company. Prior to joining Ariadne in
2007, he worked in private equity and fund management in the United Kingdom. Daniel has a Bachelor of Commerce from
the University of New South Wales and a Bachelor of Laws from the University of Sydney.
This report details the nature and amount of remuneration for each Director of the Company. The current employees of the
Company are six Non-Executive Directors. The Company Secretary is remunerated under a service agreement with Mertons
Corporate Services Pty Ltd.
5
Directors' Report (continued)
Remuneration Policy
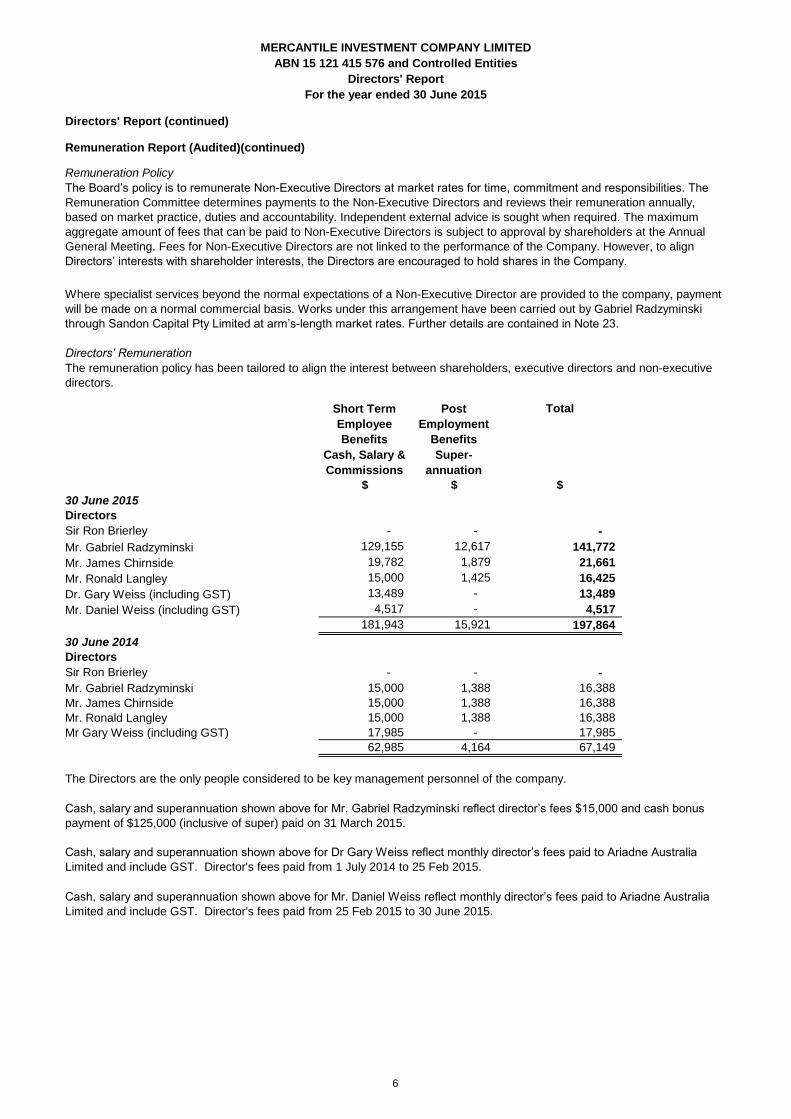
Directors’ Remuneration
Short Term
Employee
Benefits
Post
Employment
Benefits
Total
Cash, Salary &
Commissions
Super-
annuation
$ $ $
30 June 2015
Directors
Sir Ron Brierley - - -
Mr. Gabriel Radzyminski 129,155 12,617 141,772
Mr. James Chirnside 19,782 1,879 21,661
Mr. Ronald Langley 15,000 1,425 16,425
Dr. Gary Weiss (including GST) 13,489 - 13,489
Mr. Daniel Weiss (including GST) 4,517 - 4,517
181,943 15,921 197,864
30 June 2014
Directors
Sir Ron Brierley - - -
Mr. Gabriel Radzyminski 15,000 1,388 16,388
Mr. James Chirnside 15,000 1,388 16,388
Mr. Ronald Langley 15,000 1,388 16,388
Mr Gary Weiss (including GST) 17,985 - 17,985
62,985 4,164 67,149
MERCANTILE INVESTMENT COMPANY LIMITED
ABN 15 121 415 576 and Controlled Entities
Directors' Report
For the year ended 30 June 2015
Remuneration Report (Audited)(continued)
The remuneration policy has been tailored to align the interest between shareholders, executive directors and non-executive
directors.
The Directors are the only people considered to be key management personnel of the company.
Cash, salary and superannuation shown above for Mr. Gabriel Radzyminski reflect director’s fees $15,000 and cash bonus
payment of $125,000 (inclusive of super) paid on 31 March 2015.
Where specialist services beyond the normal expectations of a Non-Executive Director are provided to the company, payment
will be made on a normal commercial basis. Works under this arrangement have been carried out by Gabriel Radzyminski
through Sandon Capital Pty Limited at arm’s-length market rates. Further details are contained in Note 23.
Cash, salary and superannuation shown above for Dr Gary Weiss reflect monthly director’s fees paid to Ariadne Australia
Limited and include GST. Director's fees paid from 1 July 2014 to 25 Feb 2015.
Cash, salary and superannuation shown above for Mr. Daniel Weiss reflect monthly director’s fees paid to Ariadne Australia
Limited and include GST. Director's fees paid from 25 Feb 2015 to 30 June 2015.
The Board’s policy is to remunerate Non-Executive Directors at market rates for time, commitment and responsibilities. The
Remuneration Committee determines payments to the Non-Executive Directors and reviews their remuneration annually,
based on market practice, duties and accountability. Independent external advice is sought when required. The maximum
aggregate amount of fees that can be paid to Non-Executive Directors is subject to approval by shareholders at the Annual
General Meeting. Fees for Non-Executive Directors are not linked to the performance of the Company. However, to align
Directors’ interests with shareholder interests, the Directors are encouraged to hold shares in the Company.
6
Directors' Report (continued)
Meetings of Directors
Attendances by each director during the year were as follows:
Number of Eligible
Meetings to Attend
Number Attended Number of Eligible
Meeting to Attend
Number
Attended
3 3 2¹ 2
3 3 2¹ 2
3 3 2 2
3 3 2 2
2 2 1¹ 1
1 1 1¹ 1
¹ Directors were attended Audit & Risk Committee Meetings by invitation.
Indemnifying Officers or Auditor
Proceedings on Behalf of Company
Non-Audit Services
•
•
Auditor’s Independence Declaration
Signed in accordance with a resolution of the Board of Directors.
Director
28 September 2015
The Board of Directors, in accordance with advice from the Audit & Risk Committee, is satisfied that the provision of non-audit
services during the year is compatible with the general standard of independence for auditors imposed by the Corporations
Act 2001. The Directors are satisfied that the services disclosed below did not compromise the external auditor’s
independence for the following reasons:
Mr. James Chirnside
Mr. Ronald Langley
The nature of the services provided do not compromise the general principles relating to auditor independence in
accordance with the Corporations Act 2001 and APES 110: Code of Ethics for Professional Accountants set by
the Accounting Professional and Ethical Standards Board.
The lead auditor’s independence declaration as required under s.307c of the Corporations Act 2001 for the year ended 30
June 2015 is set out on page 9.
During or since the end of the financial period the Company has given an indemnity or entered into an agreement to
indemnify, or paid or agreed to pay insurance premiums.
All non-audit services are reviewed and approved by the Audit and Risk Committee prior to commencement to
ensure they do not adversely affect the integrity and objectivity of the auditor; and
Details of the amount of the premium paid in respect of the insurance policies are not disclosed.
The Company was not a party to any such proceedings during the period.
No non-audit services were performed by the current auditors during the year ended 30 June 2015 (2014: Nil).
Gabriel Radzyminski
Dr. Gary Weiss
Mr. Daniel Weiss
The Company has paid premiums to insure each of the Directors against liabilities for costs and expenses incurred by them in
defending any legal proceedings arising out of their conduct while acting in the capacity of director of the Company, other than
conduct involving a wilful breach of duty in relation to the Company or the improper use by the Directors of their position.
No person has applied for leave of Court to bring proceedings on behalf of the Company or intervene in any proceedings to
which the Company is a party for the purpose of taking responsibility on behalf of the Company for all or any part of those
proceedings.
Sir Ron Brierley
Mr. Gabriel Radzyminski
Audit & Risk
For the year ended 30 June 2015
Directors'
Meetings
Committee Meetings
Directors' Report
ABN 15 121 415 576 and Controlled Entities
MERCANTILE INVESTMENT COMPANY LIMITED
7

ABN 15 121 415 576 and Controlled Entities
Introduction
Accordingly, a copy of the Company’s CGS is available on the Company’s website at www.mercantileinvestment.com.au
under the Governance section.
Corporate Governance Statement
The Board of Directors of Mercantile Investment Company Limited (`MVT’ or `the Company’) is responsible for the corporate
governance of the Company. The Board has chosen to prepare the Corporate Governance Statement (“CGS”) in accordance
with the third edition of the ASX Corporate Governance Council’s Principles and Recommendations under which the CGS may
be made available on a company’s website.
MERCANTILE INVESTMENT COMPANY LIMITED
8
Note 30 June 2015 30 June 2014
Revenue $ $
Investment Related Income 2 1,812,284 398,143
Other Income 2 104,331 75,514
Realised (Loss) / Gains on Trading Portfolio (26,882) (184)
Unrealised (Loss)/Gains on Market Value Movement - Trading Portfolio (1,436,524) 451,175
453,209 924,648
Expenses
Fund Administration Expenses (18,756) (4,432)
3 (199,179) (67,324)
Listed Company Expenses 3 (858,750) (717,444)
Marketing & Development Expenses (16,013) (5,387)
Occupancy Expenses (14,562) (13,673)
Depreciation 13 (2,765) (5,010)
Finance Costs (46,982) (84,589)
(1,157,007) (897,859)
Profit / (Loss) Before Income Tax (703,798) 26,789
Income Tax Benefit / (Expense) 4 (46,843) (135,351)
Loss for the period (750,641) (108,562)
Other Comprehensive Income
Gain on Revaluation of Available-for-sale Financial Assets
Items that will not be reclassified to profit or loss:
Gain on disposal of investments available for sale 6,955,730 3,150,200
Fair Value Adjustment 1e 7,185,385 6,407,883
Deferred Tax Impact relating to items that will not be reclassified 1c (2,155,617) (1,922,365)
Other Comprehensive Income for the Year, Net of Tax 11,985,498 7,635,718
Total Comprehensive Income for the Year 11,234,857 7,527,156
Loss Attributable to:
Members of the Parent Entity (750,641) (108,562)
Non-Controlling Interest - -
(750,641) (108,562)
Total Comprehensive Income Attributable to:
Members of the Parent Entity 11,234,857 7,527,156
Non-Controlling Interest - -
11,234,857 7,527,156
From Continuing Operations
- Basic loss per share (cents per share) 8 (0.28) (0.04)
- Diluted loss per share (cents per share) 8 (0.28) (0.04)
From Comprehensive Income
- Basic earnings per share (cents per share) 8 4.19 3.00
- Diluted earnings per share (cents per share) 8 4.19 3.00
The above statement should be read in conjunction with the accompanying notes.
MERCANTILE INVESTMENT COMPANY LIMITED
Remuneration Expenses
For the year ended 30 June 2015
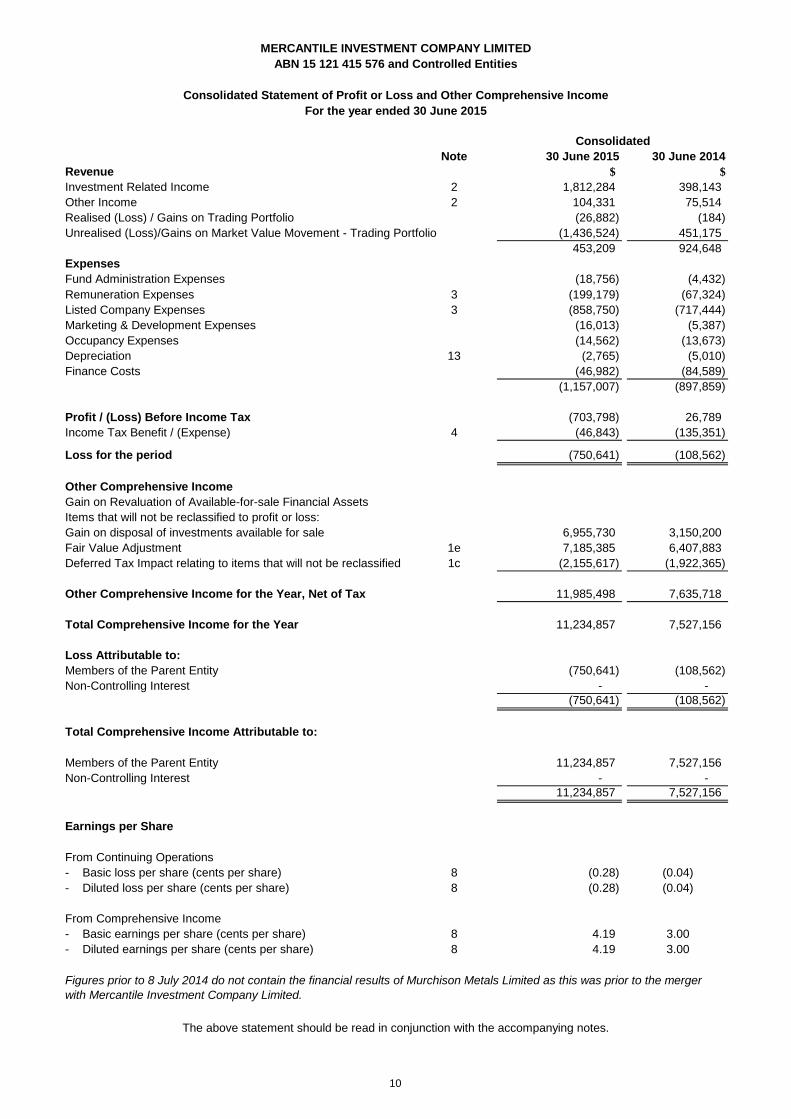
Consolidated Statement of Profit or Loss and Other Comprehensive Income
ABN 15 121 415 576 and Controlled Entities
Figures prior to 8 July 2014 do not contain the financial results of Murchison Metals Limited as this was prior to the merger
with Mercantile Investment Company Limited.
Earnings per Share
Consolidated
10
Notes 30 June 2015 30 June 2014
$ $
Assets
Current Assets
Cash and Cash Equivalents 9 6,117,624 1,129,258
Trade and Other Receivables 10 84,098 34,924
Financial Assets - Fair Value through profit or loss 11 3,278,374 4,866,296
Other Assets 12 43,582 193,120
Tax Assets - 59
Total Current Assets 9,523,678 6,223,657
Non - Current Assets
Financial Assets - Available for Sale 11 32,420,440 34,449,927
Trade and Other Receivables 10 713,558 871,534
Property, Plant & Equipment 13 3,065 5,830
Deferred Tax Assets 15 243,861 36,218
Total Non-Current Assets 33,380,924 35,363,509
Total Assets 42,904,602 41,587,166
Liabilities
Current Liabilities
Trade and Other Payables 16 1,764,491 138,318
Borrowings 17 - 2,912,241
Tax Liability 473,096 -
Total Current Liabilities 2,237,587 3,050,559
Non‑Current Liabilities
Deferred Tax Liabilities 15 2,455,990 4,830,215
Total Non‑Current Liabilities 2,455,990 4,830,215
Total Liabilities 4,693,577 7,880,774
Net assets 38,211,025 33,706,392
Equity
Issued Capital 18 27,404,109 24,773,530
Reserves 19 18,486,985 16,561,023
Retained Earnings (7,680,069) (7,628,161)
Total Equity 38,211,025 33,706,392
The above statement should be read in conjunction with the accompanying notes.
MERCANTILE INVESTMENT COMPANY LIMITED
ABN 15 121 415 576 and Controlled Entities
Consolidated
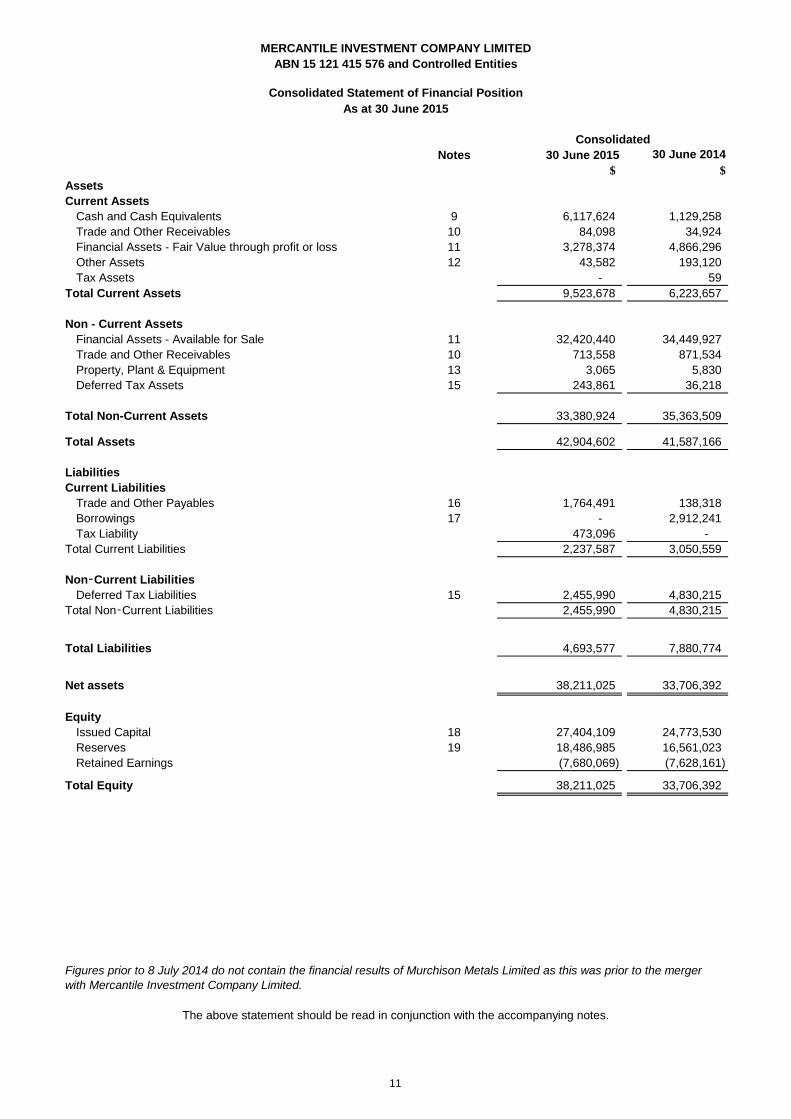
Figures prior to 8 July 2014 do not contain the financial results of Murchison Metals Limited as this was prior to the merger
with Mercantile Investment Company Limited.
Consolidated Statement of Financial Position
As at 30 June 2015
11
Consolidated Notes
Issued
Share
Capital -
Ordinary
$
Retained
Earnings
$
Realised
Capital
Profits
Reserve
$
Asset
Revaluation
Reserve
$
Total
$
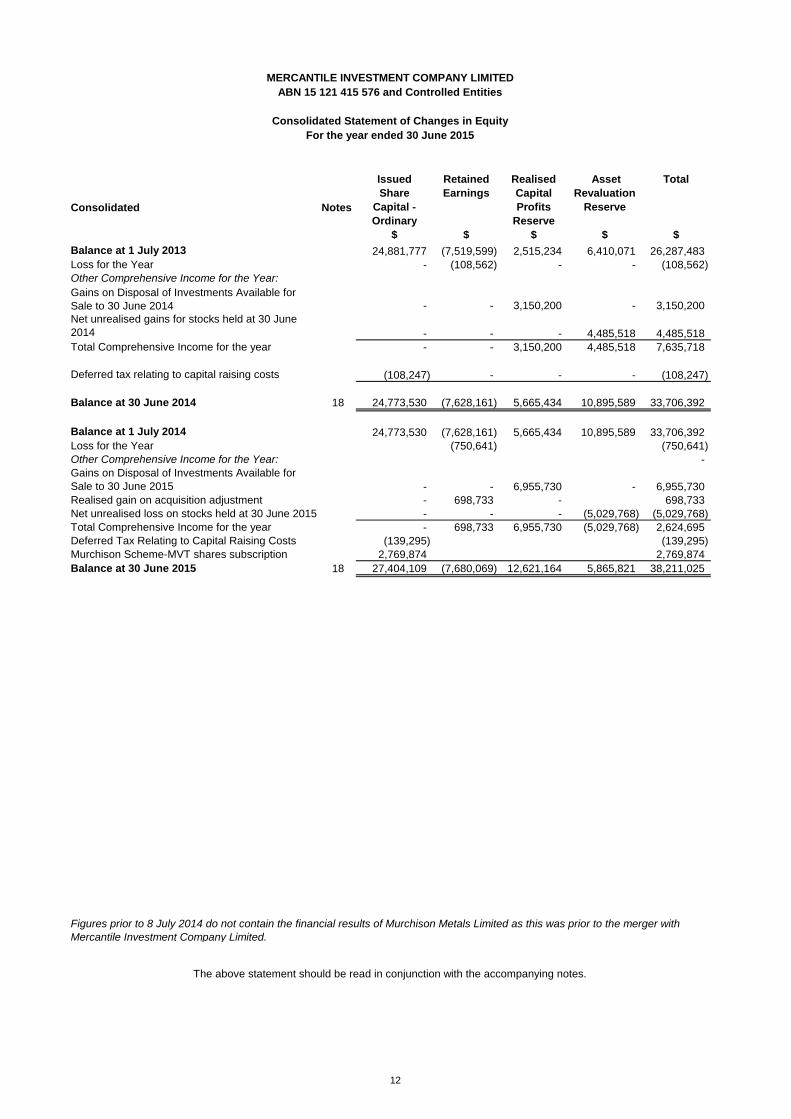
24,881,777 (7,519,599) 2,515,234 6,410,071 26,287,483
- (108,562) - - (108,562)
Other Comprehensive Income for the Year:
Gains on Disposal of Investments Available for
Sale to 30 June 2014 - - 3,150,200 - 3,150,200
Net unrealised gains for stocks held at 30 June
2014 - - - 4,485,518 4,485,518
- - 3,150,200 4,485,518 7,635,718
(108,247) - - - (108,247)
Balance at 30 June 2014 18 24,773,530 (7,628,161) 5,665,434 10,895,589 33,706,392
24,773,530 (7,628,161) 5,665,434 10,895,589 33,706,392
(750,641) (750,641)
-
Gains on Disposal of Investments Available for
Sale to 30 June 2015 - - 6,955,730 - 6,955,730
Realised gain on acquisition adjustment - 698,733 - 698,733
- - - (5,029,768) (5,029,768)
- 698,733 6,955,730 (5,029,768) 2,624,695
(139,295) (139,295)
2,769,874 2,769,874
Balance at 30 June 2015 18 27,404,109 (7,680,069) 12,621,164 5,865,821 38,211,025
Loss for the Year
Total Comprehensive Income for the year
Deferred tax relating to capital raising costs
The above statement should be read in conjunction with the accompanying notes.
Balance at 1 July 2014
Loss for the Year
Other Comprehensive Income for the Year:
Net unrealised loss on stocks held at 30 June 2015
Total Comprehensive Income for the year
Deferred Tax Relating to Capital Raising Costs
Murchison Scheme-MVT shares subscription
Figures prior to 8 July 2014 do not contain the financial results of Murchison Metals Limited as this was prior to the merger with
Mercantile Investment Company Limited.
MERCANTILE INVESTMENT COMPANY LIMITED
ABN 15 121 415 576 and Controlled Entities
Consolidated Statement of Changes in Equity
For the year ended 30 June 2015
Balance at 1 July 2013
12
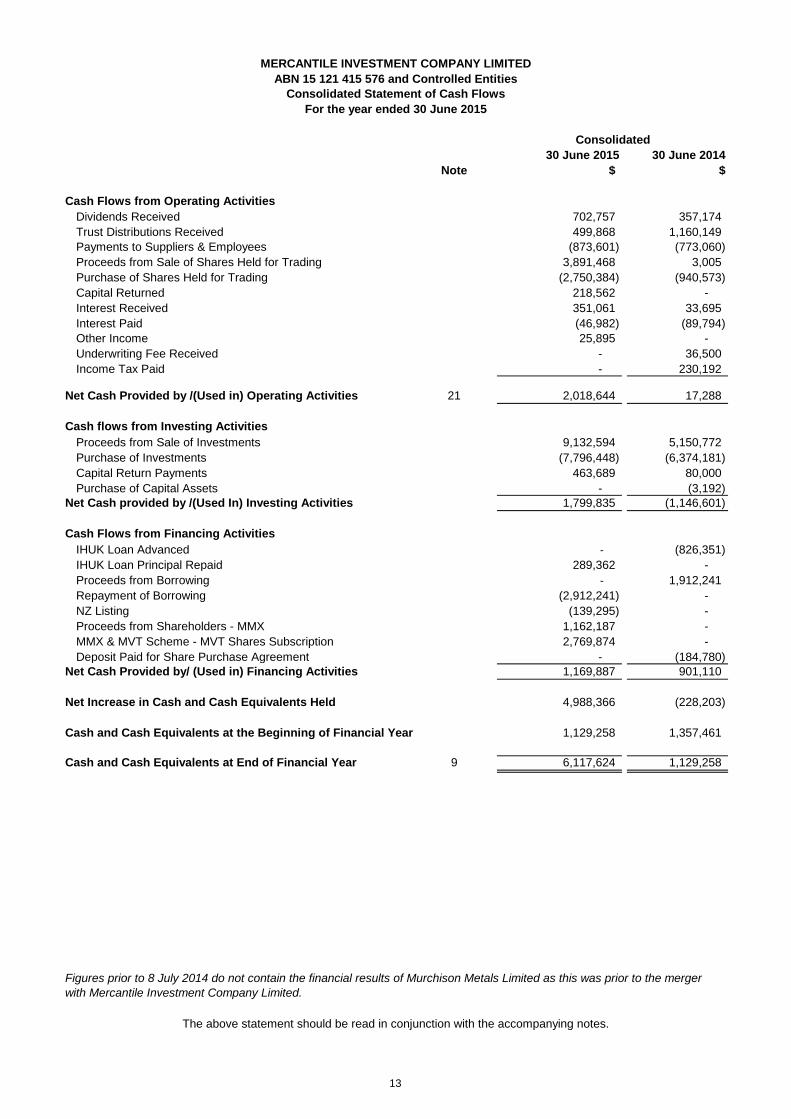
30 June 2015 30 June 2014
Note $ $
Cash Flows from Operating Activities
702,757 357,174
Trust Distributions Received 499,868 1,160,149
(873,601) (773,060)
Proceeds from Sale of Shares Held for Trading 3,891,468 3,005
Purchase of Shares Held for Trading (2,750,384) (940,573)
Capital Returned 218,562 -
Interest Received 351,061 33,695
Interest Paid (46,982) (89,794)
Other Income 25,895 -
Underwriting Fee Received - 36,500
Income Tax Paid - 230,192
Net Cash Provided by /(Used in) Operating Activities 21 2,018,644 17,288
Cash flows from Investing Activities
Proceeds from Sale of Investments 9,132,594 5,150,772
Purchase of Investments (7,796,448) (6,374,181)
Capital Return Payments 463,689 80,000
Purchase of Capital Assets - (3,192)
Net Cash provided by /(Used In) Investing Activities 1,799,835 (1,146,601)
Cash Flows from Financing Activities
IHUK Loan Advanced - (826,351)
IHUK Loan Principal Repaid 289,362 -
Proceeds from Borrowing - 1,912,241
Repayment of Borrowing (2,912,241) -
NZ Listing (139,295) -
Proceeds from Shareholders - MMX 1,162,187 -
MMX & MVT Scheme - MVT Shares Subscription 2,769,874 -
Deposit Paid for Share Purchase Agreement - (184,780)
Net Cash Provided by/ (Used in) Financing Activities 1,169,887 901,110
Net Increase in Cash and Cash Equivalents Held 4,988,366 (228,203)
Cash and Cash Equivalents at the Beginning of Financial Year 1,129,258 1,357,461
Cash and Cash Equivalents at End of Financial Year 9 6,117,624 1,129,258
MERCANTILE INVESTMENT COMPANY LIMITED
Payments to Suppliers & Employees
Dividends Received
Figures prior to 8 July 2014 do not contain the financial results of Murchison Metals Limited as this was prior to the merger
with Mercantile Investment Company Limited.
Consolidated
Consolidated Statement of Cash Flows
For the year ended 30 June 2015
The above statement should be read in conjunction with the accompanying notes.
ABN 15 121 415 576 and Controlled Entities
13
NOTE 1: STATEMENT OF SIGNIFICANT ACCOUNTING POLICIES
Intercompany transactions, balances and unrealised gains or losses on transactions between group entities are fully
eliminated on consolidation. Accounting policies of subsidiaries have been changed and adjustments made where necessary
to ensure uniformity of the accounting policies adopted by the Group. Equity interests in a subsidiary not attributable, directly
or indirectly, to the Group are presented as "non-controlling interests". The Group initially recognises non-controlling interests
that are present ownership interests in subsidiaries and are entitled to a proportionate share of the subsidiary's net assets on
liquidation at either fair value or at the non-controlling interests' proportionate share of the subsidiary's net assets. Subsequent
to initial recognition, non-controlling interests are attributed their share of profit or loss and each component of other
comprehensive income. Non-controlling interests are shown separately within the equity section of the statement of financial
position and statement of profit or loss and other comprehensive income.
Business Combinations
Material accounting policies adopted in the preparation of this financial report are presented below and have been consistently
applied, unless otherwise stated.
Reporting Basis and Conventions
Accounting Policies
(a) Principles of Consolidation
The financial report was authorised for issue by the Board of Directors on 28 September 2015.
MERCANTILE INVESTMENT COMPANY LIMITED
For the year ended 30 June 2015
ABN 15 121 415 576 and Controlled Entities
The financial report is a general purpose financial report that has been prepared in accordance with the Corporations Act
2001, Australian Accounting Standards and Interpretations of the Australian Accounting Standards Board and International
Financial Reporting Standards as issued by the International Accounting Standard Board. Mercantile Investment company
Limited is a for-profit entity for financial reporting purposes under Australian Accounting Standards.
The financial report includes the consolidated financial statements and notes of Mercantile Investment Company Limited and
controlled entities (‘Consolidated Group’ or ‘Group’ or ‘Company’). Mercantile Investment Company Limited is a listed public
company, incorporated and domiciled in Australia.
Except for cash flow information, the financial report has been prepared on an accruals basis and is based on historical costs,
modified, where applicable, by the measurement at fair value of selected non-current assets, financial assets and financial
liabilities. All amounts are presented in Australian dollars unless otherwise stated.
In preparing this financial report, the significant judgements made by management in applying the accounting policies and the
key sources of estimates or uncertainty were the same as those that applied historically.
The separate financial statements of the parent entity, the Company, have not been presented within this financial report as
permitted by the Corporations Act 2001.
Notes to the Financial Statements
Business combinations occur where control over another business is obtained and results in the consolidation of its assets
and liabilities. All business combinations, including those involving entities under common control, are accounted for by
applying the acquisition method.
The acquisition method requires the acquirer of the business to be identified. The business combination will be accounted for
as at acquisition date, which is the date that control over the acquiree, is obtained by the parent entity. At that date, the parent
entity shall recognise in the consolidated accounts, and subject to certain limited exceptions, the fair value of the identifiable
assets acquired and liabilities assumed. In addition contingent liabilities of the acquiree will be recognised where a present
obligation has been incurred and its fair value can be measured reliably.
The consolidated financial report incorporates the assets, liabilities and results of entities controlled by the Company at the
end of the reporting period. A controlled entity is any entity over which the Company has the ability and right to govern the
financial and operating policies so as to obtain benefits from the entity’s activities. In assessing the power to govern, the
existence and effect of holdings of actual and potential voting rights are considered.
Where controlled entities have entered or left the Group during the year, the financial performance of those entities is included
only for the period of the year that they were controlled.
A list of controlled entities is contained in Note 14 to the financial statements.
14
Goodwill arising on acquisition is recognised initially at the excess of cost of the business combination over the acquirer’s
interest in the net fair value of the identifiable assets, liabilities and contingent liabilities recognised. If the fair value of the
acquirer’s interest is greater than cost, the surplus is immediately recognised in profit or loss.
For the year ended 30 June 2015
NOTE 1: STATEMENT OF SIGNIFICANT ACCOUNTING POLICIES (Continued)
MERCANTILE INVESTMENT COMPANY LIMITED
ABN 15 121 415 576 and Controlled Entities
Deferred tax assets and liabilities are calculated at the tax rates that are expected to apply to the period when the asset is
realised or the liability is settled and their measurement also reflects the manner in which management expects to recover or
settle the carrying amount of the related asset or liability. With respect to non-depreciable items of property, plant and
equipment measured at fair value and items of investment property measured at fair value, the related deferred tax liability or
deferred tax asset is measured on the basis that the carrying amount of the asset will be recovered entirely through sale.
Current and deferred income tax expense/ (income) is charged or credited outside profit or loss when the tax relates to items
that are recognised outside profit or loss. Except for business combinations, no deferred income tax is recognised from the
initial recognition of an asset or liability where there is no effect on accounting or taxable profit or loss.
Deferred income tax expense reflects movements in deferred tax asset and deferred tax liability balances during the year as
well as unused tax losses.
Notes to the Financial Statements
Current tax assets and liabilities are offset where a legally enforceable right of set-off exists and it is intended that net
settlement or simultaneous realisation and settlement of the respective asset and liability will occur. Deferred tax assets and
liabilities are offset where a legally enforceable right of set-off exists, and the deferred tax assets and liabilities relate to
income taxes levied by the same taxation authority on either the same taxable entity or different taxable entities where it is
intended that net settlement or simultaneous realisation and settlement of the respective asset and liability will occur in future
periods in which significant amounts of deferred tax assets or liabilities are expected to be recovered or settled.
(d) Property, Plant and Equipment
Each class of property, plant and equipment is carried at cost or fair value as indicated less, where applicable, any
accumulated depreciation and impairment losses.
Plant and Equipment
The carrying amount of plant and equipment is reviewed annually by directors to ensure it is not in excess of the recoverable
amount from these assets. The recoverable amount is assessed on the basis of the expected net cash flows that will be
received from the asset’s employment and subsequent disposal. The expected net cash flows have been discounted to their
present values in determining recoverable amounts.
Subsequent costs are included in the asset’s carrying amount or recognised as a separate asset, as appropriate, only when it
is probable that future economic benefits associated with the item will flow to the Group and the cost of the item can be
measured reliably. All other repairs and maintenance are recognised as expenses in profit or loss during the financial period in
which they are incurred.
Cost is determined as the aggregate of fair values of assets given, equity issued and liabilities assumed in exchange for
control together with costs directly attributable to the business combination. Any deferred consideration payable is discounted
to present value using the entities incremental borrowing rate.
(b) Trade and Other Payables
Trade and other payables represent the liabilities for services received by the entity that remain unpaid at the end of the
reporting period. The balance is unsecured and is recognised as a current liability with the amounts normally paid within 30
days of recognition of the liability.
(c) Income Tax
The income tax expense/ (income) for the year comprises current income tax expense/ (income) and deferred tax expense/
(income).Current income tax expense charged to profit or loss is the tax payable on taxable income. Current tax liabilities/
(assets) are measured at the amounts expected to be paid to/ (recovered from) the relevant taxation authority.
Accounting Policies (Continued)
Deferred tax assets relating to temporary differences and unused tax losses are recognised only to the extent that it is
probable that future taxable profit will be available against which the benefits of the deferred tax asset can be utilised.
15
e) Financial instruments
Financial instruments are initially measured at fair value plus transaction costs, except where the instrument is classified ‘at
fair value through profit or loss’, in which case transaction costs are expensed to profit or loss immediately.
Financial instruments are subsequently measured at fair value, amortised cost using the effective interest rate method, or
cost.
Amortised cost is calculated as the amount at which the financial asset or financial liability is measured at initial recognition
less principal repayments and any reduction for impairment, and adjusted for any cumulative amortisation of the difference
between that initial amount and the maturity amount calculated using the effective interest method.
The Group does not designate any interests in subsidiaries, associates or joint venture entities as being subject to the
requirements of Accounting Standards specifically applicable to financial instruments.
Financial assets are classified at ‘fair value through profit or loss’ when they are held for trading for the purpose of short-term
profit taking, derivatives not held for hedging purposes, or when they are designated as such to avoid an accounting mismatch
or to enable performance evaluation where a group of financial assets is managed by key management personnel on a fair
value basis in accordance with a documented risk management or investment strategy. Such assets are subsequently
measured at fair value with changes in carrying amount being included in profit or loss.
Financial assets at fair value through profit or loss
Loans and receivables are non-derivative financial assets with fixed or determinable payments that are not quoted in an active
market and are subsequently measured at amortised cost. Gains or losses are recognised in profit or loss through the
amortisation process and when the financial asset is derecognised.
Loans and receivables
Classification and Subsequent Measurement
Available-for-sale investments are non-derivative financial assets that are either not capable of being classified into other
categories of financial assets due to their nature or they are designated as such by management. They comprise investments
in the equity of other entities where there is neither a fixed maturity nor fixed or determinable payments.
Available-for-sale investments
They are subsequently measured at fair value with any remeasurements other than impairment losses and foreign exchange
gains and losses recognised in other comprehensive income. When the financial asset is derecognised, the cumulative gain
or loss pertaining to that asset previously recognised in other comprehensive income is reclassified into profit or loss.
Financial assets and financial liabilities are recognised when the entity becomes a party to the contractual provisions to the
instrument. For financial assets, this is equivalent to the date that the company commits itself to either the purchase or sale of
the asset (ie trade date accounting is adopted).
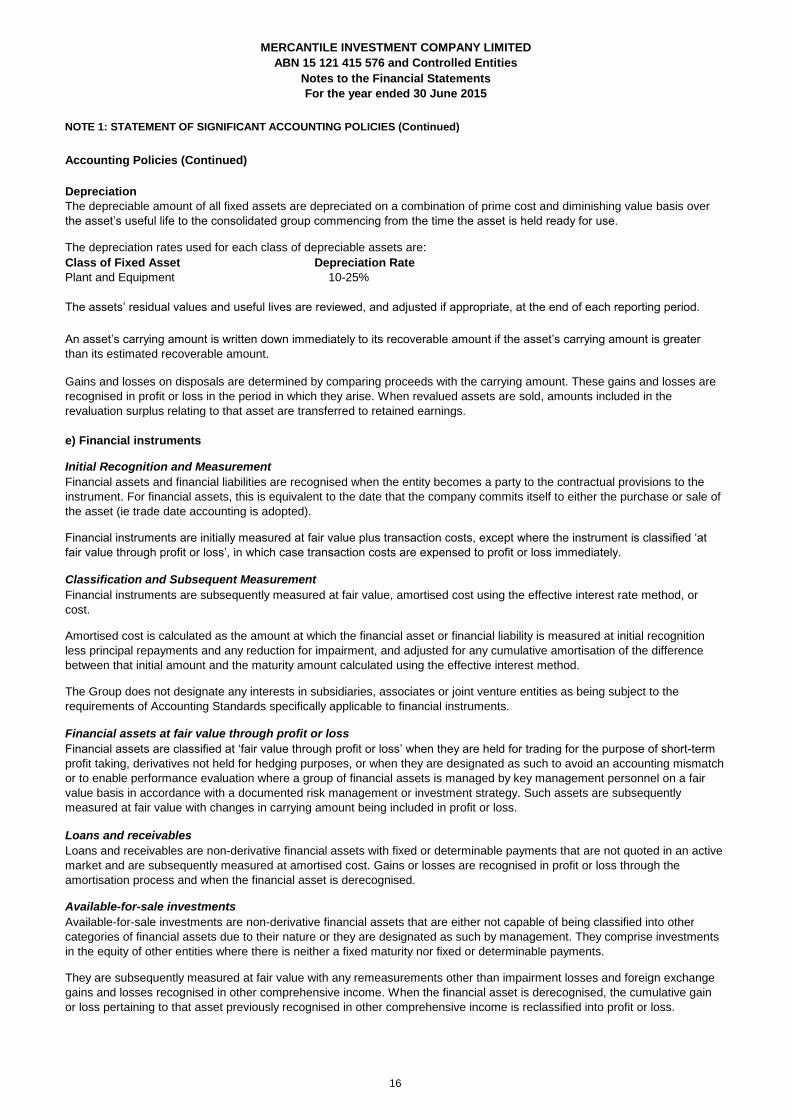
The depreciation rates used for each class of depreciable assets are:
Class of Fixed Asset Depreciation Rate
Plant and Equipment 10-25%
The assets’ residual values and useful lives are reviewed, and adjusted if appropriate, at the end of each reporting period.
For the year ended 30 June 2015
NOTE 1: STATEMENT OF SIGNIFICANT ACCOUNTING POLICIES (Continued)
Accounting Policies (Continued)
Gains and losses on disposals are determined by comparing proceeds with the carrying amount. These gains and losses are
recognised in profit or loss in the period in which they arise. When revalued assets are sold, amounts included in the
revaluation surplus relating to that asset are transferred to retained earnings.
Initial Recognition and Measurement
MERCANTILE INVESTMENT COMPANY LIMITED
ABN 15 121 415 576 and Controlled Entities
An asset’s carrying amount is written down immediately to its recoverable amount if the asset’s carrying amount is greater
than its estimated recoverable amount.
Notes to the Financial Statements
Depreciation
The depreciable amount of all fixed assets are depreciated on a combination of prime cost and diminishing value basis over
the asset’s useful life to the consolidated group commencing from the time the asset is held ready for use.
16
e) Financial instruments (continued)
When an available-for-sale investment is disposed of, the cumulative gain or loss, net of tax thereon, is transferred from the
asset revaluation reserve to the realised capital profits reserve.
Impairment
Determination of fair value
Details of investment in subsidiaries are provided in Note 14.
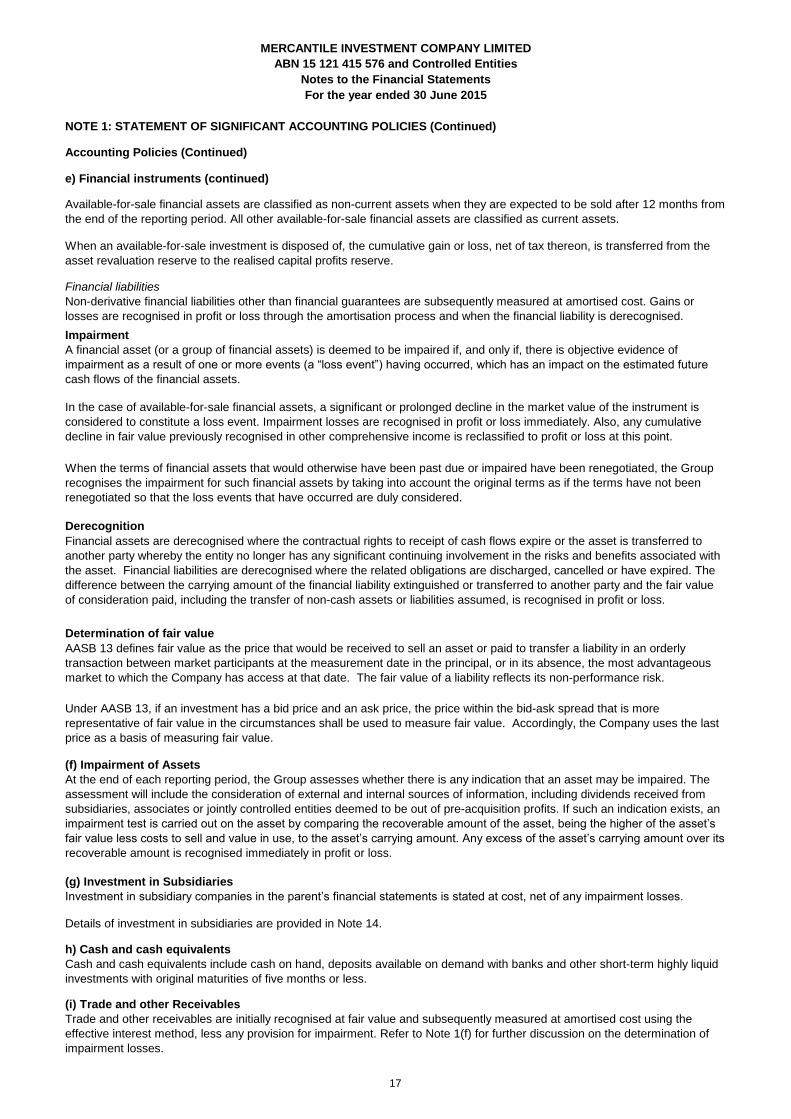
h) Cash and cash equivalents
Cash and cash equivalents include cash on hand, deposits available on demand with banks and other short-term highly liquid
investments with original maturities of five months or less.
(i) Trade and other Receivables
Trade and other receivables are initially recognised at fair value and subsequently measured at amortised cost using the
effective interest method, less any provision for impairment. Refer to Note 1(f) for further discussion on the determination of
impairment losses.
(f) Impairment of Assets
At the end of each reporting period, the Group assesses whether there is any indication that an asset may be impaired. The
assessment will include the consideration of external and internal sources of information, including dividends received from
subsidiaries, associates or jointly controlled entities deemed to be out of pre-acquisition profits. If such an indication exists, an
impairment test is carried out on the asset by comparing the recoverable amount of the asset, being the higher of the asset’s
fair value less costs to sell and value in use, to the asset’s carrying amount. Any excess of the asset’s carrying amount over its
recoverable amount is recognised immediately in profit or loss.
Available-for-sale financial assets are classified as non-current assets when they are expected to be sold after 12 months from
the end of the reporting period. All other available-for-sale financial assets are classified as current assets.
For the year ended 30 June 2015
NOTE 1: STATEMENT OF SIGNIFICANT ACCOUNTING POLICIES (Continued)
Accounting Policies (Continued)
Notes to the Financial Statements
ABN 15 121 415 576 and Controlled Entities
MERCANTILE INVESTMENT COMPANY LIMITED
In the case of available-for-sale financial assets, a significant or prolonged decline in the market value of the instrument is
considered to constitute a loss event. Impairment losses are recognised in profit or loss immediately. Also, any cumulative
decline in fair value previously recognised in other comprehensive income is reclassified to profit or loss at this point.
(g) Investment in Subsidiaries
Investment in subsidiary companies in the parent’s financial statements is stated at cost, net of any impairment losses.
Derecognition
Financial liabilities
Non-derivative financial liabilities other than financial guarantees are subsequently measured at amortised cost. Gains or
losses are recognised in profit or loss through the amortisation process and when the financial liability is derecognised.
A financial asset (or a group of financial assets) is deemed to be impaired if, and only if, there is objective evidence of
impairment as a result of one or more events (a “loss event”) having occurred, which has an impact on the estimated future
cash flows of the financial assets.
When the terms of financial assets that would otherwise have been past due or impaired have been renegotiated, the Group
recognises the impairment for such financial assets by taking into account the original terms as if the terms have not been
renegotiated so that the loss events that have occurred are duly considered.
Financial assets are derecognised where the contractual rights to receipt of cash flows expire or the asset is transferred to
another party whereby the entity no longer has any significant continuing involvement in the risks and benefits associated with
the asset. Financial liabilities are derecognised where the related obligations are discharged, cancelled or have expired. The
difference between the carrying amount of the financial liability extinguished or transferred to another party and the fair value
of consideration paid, including the transfer of non-cash assets or liabilities assumed, is recognised in profit or loss.
AASB 13 defines fair value as the price that would be received to sell an asset or paid to transfer a liability in an orderly
transaction between market participants at the measurement date in the principal, or in its absence, the most advantageous
market to which the Company has access at that date. The fair value of a liability reflects its non-performance risk.
Under AASB 13, if an investment has a bid price and an ask price, the price within the bid-ask spread that is more
representative of fair value in the circumstances shall be used to measure fair value. Accordingly, the Company uses the last
price as a basis of measuring fair value.
17
(o) Comparative Figures
When required by Accounting Standards, comparative figures have been adjusted to conform to changes in presentation for
the current financial period.
(p) New Accounting Standards for Application in Future Periods
Accounting Standards and Interpretations issued by the AASB that are not yet mandatory applicable to the Group, together
with an assessment of the potential impact of such pronouncements on the Group when adopted in future periods, are
discussed below:
Receivables and payables are stated inclusive of GST. The net amount of GST recoverable from, or payable to the ATO is
included as part of receivables or payables in the Statement of Financial Position.
Key Estimates – Impairment
The financial assets available-for-sale and held-for-trading of the Company are valued at fair value. The Directors assess
impairment of all other assets at each reporting date by evaluating conditions specific to the Group that may lead to
impairment of these assets. Where an impairment trigger exists, the recoverable amount of the assets is determined.
In accordance with AASB 112 Income Taxes, deferred tax assets/liabilities have been recognised for unrealised losses/gains
in the investment portfolio at current tax rates to the point that management believes that they will be utilised.
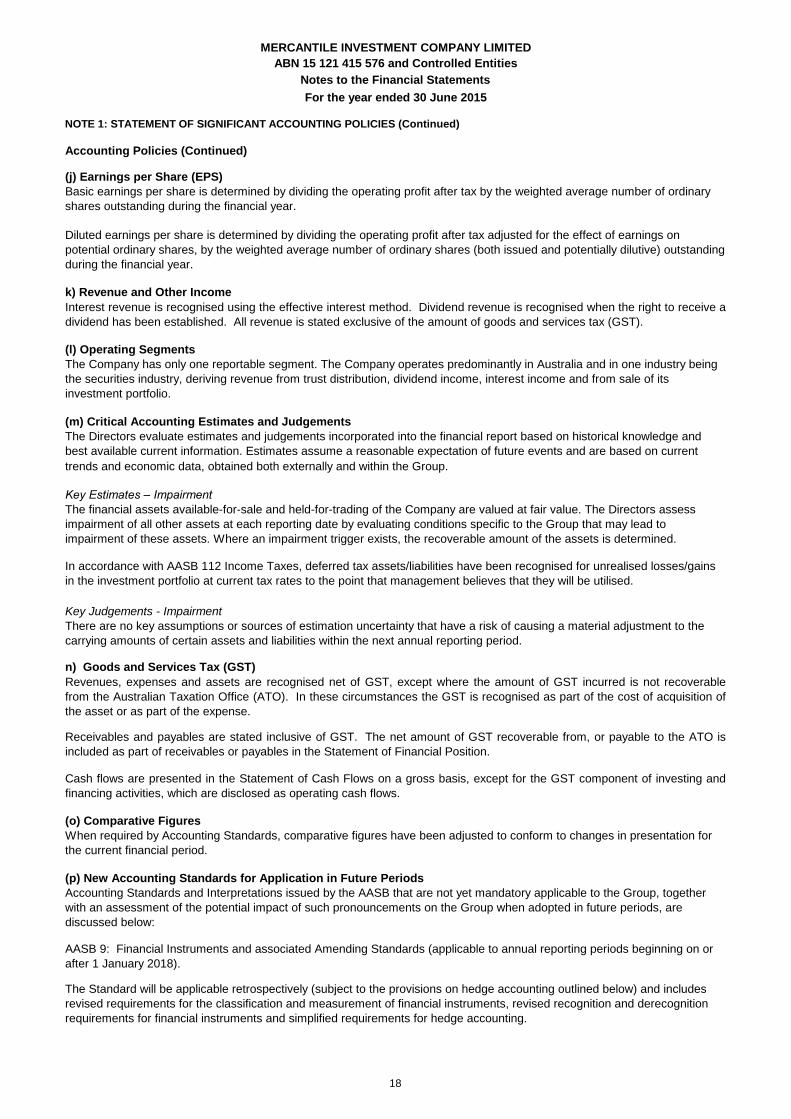
Interest revenue is recognised using the effective interest method. Dividend revenue is recognised when the right to receive a
dividend has been established. All revenue is stated exclusive of the amount of goods and services tax (GST).
Notes to the Financial Statements
k) Revenue and Other Income
(l) Operating Segments
The Company has only one reportable segment. The Company operates predominantly in Australia and in one industry being
the securities industry, deriving revenue from trust distribution, dividend income, interest income and from sale of its
investment portfolio.
Accounting Policies (Continued)
NOTE 1: STATEMENT OF SIGNIFICANT ACCOUNTING POLICIES (Continued)
(m) Critical Accounting Estimates and Judgements
The Directors evaluate estimates and judgements incorporated into the financial report based on historical knowledge and
best available current information. Estimates assume a reasonable expectation of future events and are based on current
trends and economic data, obtained both externally and within the Group.
Key Judgements - Impairment
There are no key assumptions or sources of estimation uncertainty that have a risk of causing a material adjustment to the
carrying amounts of certain assets and liabilities within the next annual reporting period.
ABN 15 121 415 576 and Controlled Entities
For the year ended 30 June 2015
AASB 9: Financial Instruments and associated Amending Standards (applicable to annual reporting periods beginning on or
after 1 January 2018).
(j) Earnings per Share (EPS)
Basic earnings per share is determined by dividing the operating profit after tax by the weighted average number of ordinary
shares outstanding during the financial year.
Diluted earnings per share is determined by dividing the operating profit after tax adjusted for the effect of earnings on
potential ordinary shares, by the weighted average number of ordinary shares (both issued and potentially dilutive) outstanding
during the financial year.
MERCANTILE INVESTMENT COMPANY LIMITED
n) Goods and Services Tax (GST)
Revenues, expenses and assets are recognised net of GST, except where the amount of GST incurred is not recoverable
from the Australian Taxation Office (ATO). In these circumstances the GST is recognised as part of the cost of acquisition of
the asset or as part of the expense.
The Standard will be applicable retrospectively (subject to the provisions on hedge accounting outlined below) and includes
revised requirements for the classification and measurement of financial instruments, revised recognition and derecognition
requirements for financial instruments and simplified requirements for hedge accounting.
Cash flows are presented in the Statement of Cash Flows on a gross basis, except for the GST component of investing and
financing activities, which are disclosed as operating cash flows.
18
30 June 2015 30 June 2014
$ $
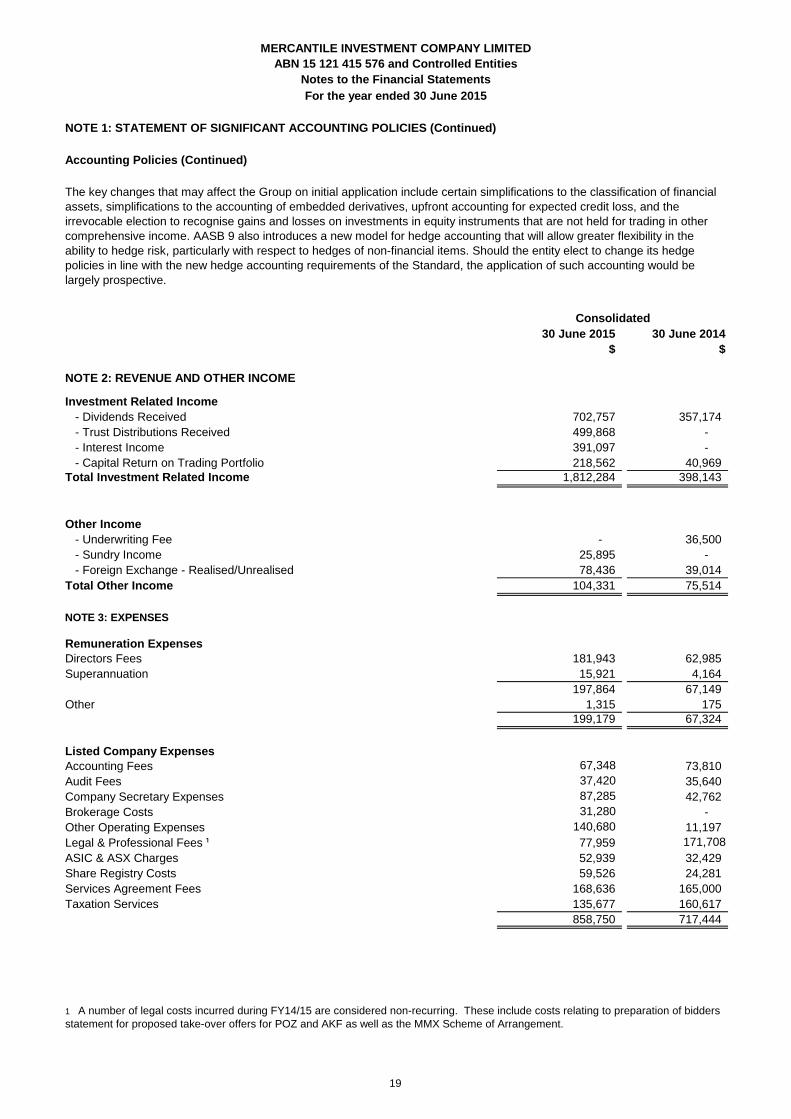
NOTE 2: REVENUE AND OTHER INCOME
Investment Related Income
702,757 357,174
499,868 -
391,097 -
218,562 40,969
1,812,284 398,143
Other Income
- Underwriting Fee - 36,500
- Sundry Income 25,895 -
- Foreign Exchange - Realised/Unrealised 78,436 39,014
Total Other Income 104,331 75,514
NOTE 3: EXPENSES
Directors Fees 181,943 62,985
Superannuation 15,921 4,164
197,864 67,149
Other 1,315 175
199,179 67,324
67,348 73,810
Audit Fees 37,420 35,640
Company Secretary Expenses 87,285 42,762
Brokerage Costs 31,280 -
Other Operating Expenses 140,680 11,197
77,959 171,708
ASIC & ASX Charges 52,939 32,429
Share Registry Costs 59,526 24,281
Services Agreement Fees 168,636 165,000
Taxation Services 135,677 160,617
858,750 717,444
NOTE 1: STATEMENT OF SIGNIFICANT ACCOUNTING POLICIES (Continued)
1 A number of legal costs incurred during FY14/15 are considered non-recurring. These include costs relating to preparation of bidders
statement for proposed take-over offers for POZ and AKF as well as the MMX Scheme of Arrangement.
- Interest Income
For the year ended 30 June 2015
Legal & Professional Fees ¹
Listed Company Expenses
Accounting Fees
Notes to the Financial Statements
- Dividends Received
- Trust Distributions Received
Consolidated
Remuneration Expenses
MERCANTILE INVESTMENT COMPANY LIMITED
Total Investment Related Income
- Capital Return on Trading Portfolio
The key changes that may affect the Group on initial application include certain simplifications to the classification of financial
assets, simplifications to the accounting of embedded derivatives, upfront accounting for expected credit loss, and the
irrevocable election to recognise gains and losses on investments in equity instruments that are not held for trading in other
comprehensive income. AASB 9 also introduces a new model for hedge accounting that will allow greater flexibility in the
ability to hedge risk, particularly with respect to hedges of non-financial items. Should the entity elect to change its hedge
policies in line with the new hedge accounting requirements of the Standard, the application of such accounting would be
largely prospective.
Accounting Policies (Continued)
ABN 15 121 415 576 and Controlled Entities
19
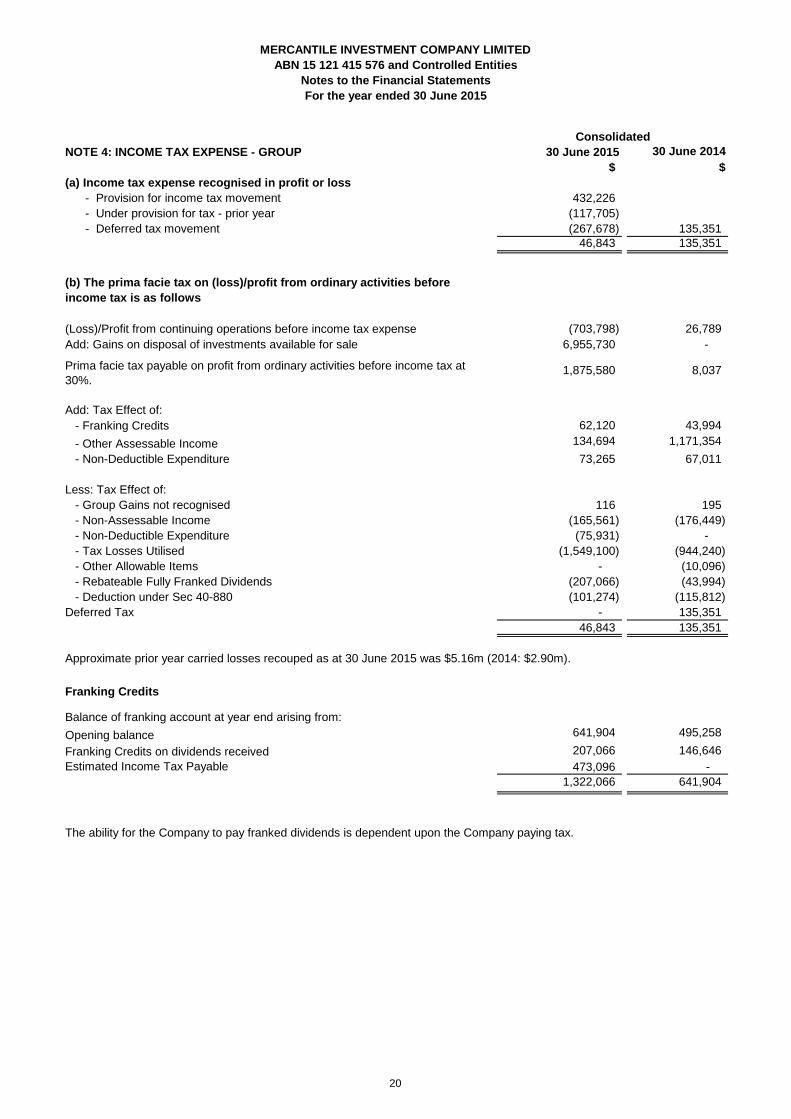
30 June 2015 30 June 2014
$ $
(a) Income tax expense recognised in profit or loss
- Provision for income tax movement 432,226
- Under provision for tax - prior year (117,705)
(267,678) 135,351
46,843 135,351
(703,798) 26,789
Add: Gains on disposal of investments available for sale 6,955,730 -
1,875,580 8,037
62,120 43,994
134,694 1,171,354
73,265 67,011
Less: Tax Effect of:
- Group Gains not recognised 116 195
- Non-Assessable Income (165,561) (176,449)
(75,931) -
- Tax Losses Utilised (1,549,100) (944,240)
- Other Allowable Items - (10,096)
- Rebateable Fully Franked Dividends (207,066) (43,994)
- Deduction under Sec 40-880 (101,274) (115,812)
Deferred Tax - 135,351
46,843 135,351
641,904 495,258
207,066 146,646
473,096 -
1,322,066 641,904
ABN 15 121 415 576 and Controlled Entities
(b) The prima facie tax on (loss)/profit from ordinary activities before
income tax is as follows
Prima facie tax payable on profit from ordinary activities before income tax at
30%.
Consolidated
Franking Credits
- Non-Deductible Expenditure
(Loss)/Profit from continuing operations before income tax expense
Franking Credits on dividends received
Balance of franking account at year end arising from:
The ability for the Company to pay franked dividends is dependent upon the Company paying tax.
- Other Assessable Income
NOTE 4: INCOME TAX EXPENSE - GROUP
Notes to the Financial Statements
For the year ended 30 June 2015
MERCANTILE INVESTMENT COMPANY LIMITED
Estimated Income Tax Payable
- Deferred tax movement
Opening balance
Approximate prior year carried losses recouped as at 30 June 2015 was $5.16m (2014: $2.90m).
- Non-Deductible Expenditure
Add: Tax Effect of:
- Franking Credits
20
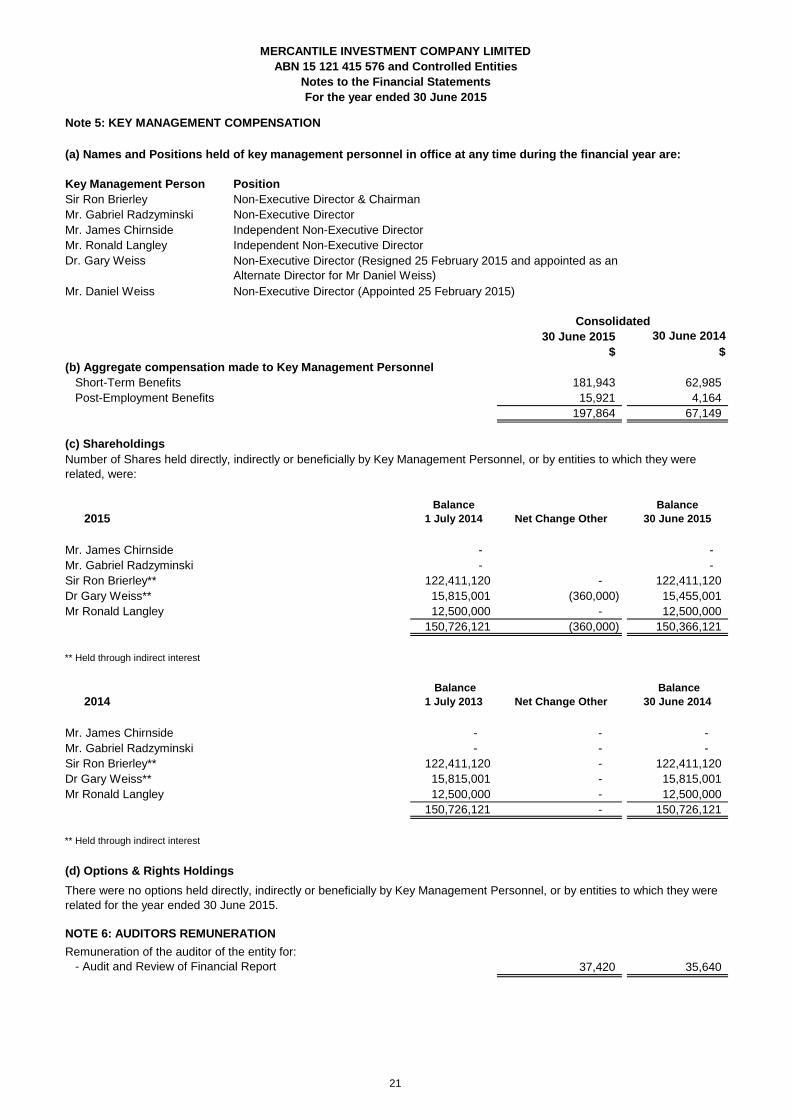
Note 5: KEY MANAGEMENT COMPENSATION
Key Management Person Position
Sir Ron Brierley Non-Executive Director & Chairman
Mr. Gabriel Radzyminski Non-Executive Director
Mr. James Chirnside Independent Non-Executive Director
Mr. Ronald Langley Independent Non-Executive Director
Dr. Gary Weiss
Mr. Daniel Weiss Non-Executive Director (Appointed 25 February 2015)
30 June 2015 30 June 2014
$ $
(b) Aggregate compensation made to Key Management Personnel
Short-Term Benefits 181,943 62,985
Post-Employment Benefits 15,921 4,164
197,864 67,149
(c) Shareholdings
2015
Balance
1 July 2014 Net Change Other
Balance
30 June 2015
- -
- -
122,411,120 - 122,411,120
15,815,001 (360,000) 15,455,001
12,500,000 - 12,500,000
150,726,121 (360,000) 150,366,121
2014
Balance
1 July 2013 Net Change Other
Balance
30 June 2014
- - -
- - -
122,411,120 - 122,411,120
15,815,001 - 15,815,001
12,500,000 - 12,500,000
150,726,121 - 150,726,121
37,420 35,640
Consolidated
** Held through indirect interest
Mr. James Chirnside
MERCANTILE INVESTMENT COMPANY LIMITED
Mr Ronald Langley
NOTE 6: AUDITORS REMUNERATION
Remuneration of the auditor of the entity for:
- Audit and Review of Financial Report
Sir Ron Brierley**
Dr Gary Weiss**
Notes to the Financial Statements
(a) Names and Positions held of key management personnel in office at any time during the financial year are:
Number of Shares held directly, indirectly or beneficially by Key Management Personnel, or by entities to which they were
related, were:
Mr. Gabriel Radzyminski
Mr. James Chirnside
Dr Gary Weiss**
Mr. Gabriel Radzyminski
Sir Ron Brierley**
Mr Ronald Langley
** Held through indirect interest
(d) Options & Rights Holdings
There were no options held directly, indirectly or beneficially by Key Management Personnel, or by entities to which they were
related for the year ended 30 June 2015.
Non-Executive Director (Resigned 25 February 2015 and appointed as an
Alternate Director for Mr Daniel Weiss)
ABN 15 121 415 576 and Controlled Entities
For the year ended 30 June 2015
21
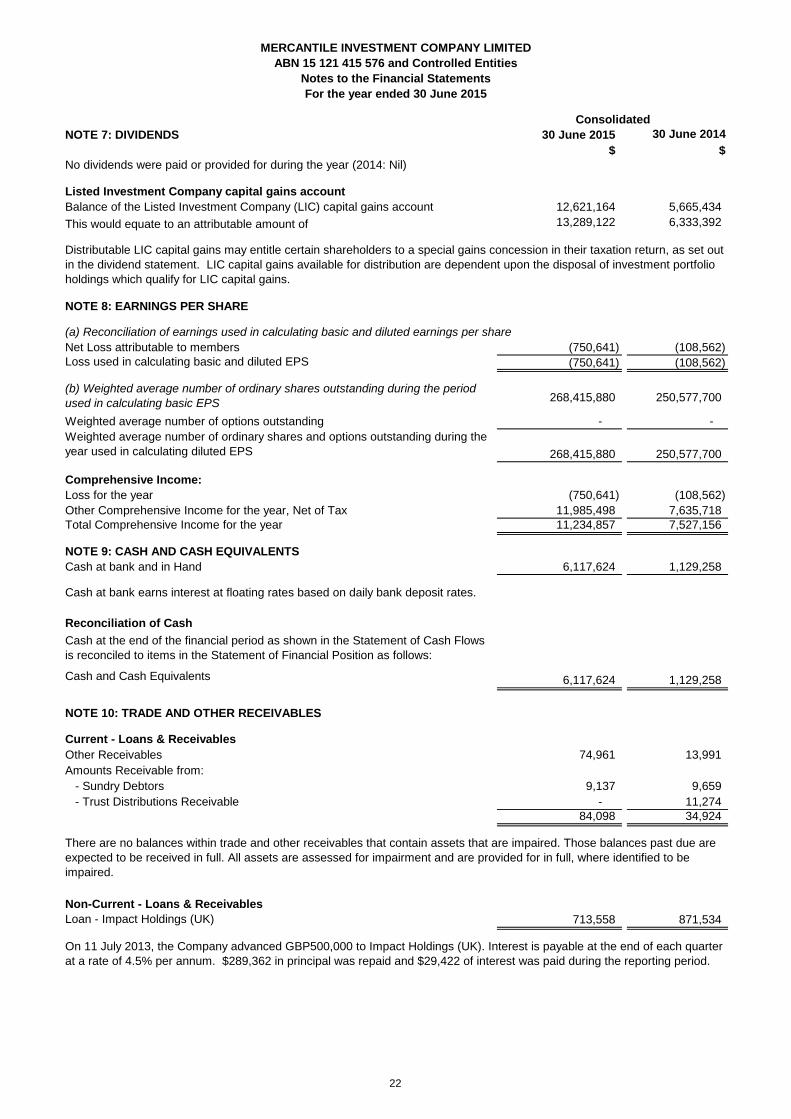
NOTE 7: DIVIDENDS 30 June 2015 30 June 2014
$ $
Listed Investment Company capital gains account
Balance of the Listed Investment Company (LIC) capital gains account 12,621,164 5,665,434
13,289,122 6,333,392
NOTE 8: EARNINGS PER SHARE
(a) Reconciliation of earnings used in calculating basic and diluted earnings per share
Net Loss attributable to members (750,641) (108,562)
Loss used in calculating basic and diluted EPS (750,641) (108,562)
268,415,880 250,577,700
- -
268,415,880 250,577,700
Comprehensive Income:
Loss for the year (750,641) (108,562)
Other Comprehensive Income for the year, Net of Tax 11,985,498 7,635,718
Total Comprehensive Income for the year 11,234,857 7,527,156
NOTE 9: CASH AND CASH EQUIVALENTS
6,117,624 1,129,258
Cash at bank earns interest at floating rates based on daily bank deposit rates.
Reconciliation of Cash
Cash and Cash Equivalents 6,117,624 1,129,258
NOTE 10: TRADE AND OTHER RECEIVABLES
Current - Loans & Receivables
Other Receivables 74,961 13,991
Amounts Receivable from:
- Sundry Debtors 9,137 9,659
- Trust Distributions Receivable - 11,274
84,098 34,924
713,558 871,534
Consolidated
There are no balances within trade and other receivables that contain assets that are impaired. Those balances past due are
expected to be received in full. All assets are assessed for impairment and are provided for in full, where identified to be
impaired.
Cash at the end of the financial period as shown in the Statement of Cash Flows
is reconciled to items in the Statement of Financial Position as follows:
Weighted average number of options outstanding
Weighted average number of ordinary shares and options outstanding during the
year used in calculating diluted EPS
Cash at bank and in Hand
This would equate to an attributable amount of
Distributable LIC capital gains may entitle certain shareholders to a special gains concession in their taxation return, as set out
in the dividend statement. LIC capital gains available for distribution are dependent upon the disposal of investment portfolio
holdings which qualify for LIC capital gains.
No dividends were paid or provided for during the year (2014: Nil)
For the year ended 30 June 2015
MERCANTILE INVESTMENT COMPANY LIMITED
ABN 15 121 415 576 and Controlled Entities
Notes to the Financial Statements
(b) Weighted average number of ordinary shares outstanding during the period
used in calculating basic EPS
On 11 July 2013, the Company advanced GBP500,000 to Impact Holdings (UK). Interest is payable at the end of each quarter
at a rate of 4.5% per annum. $289,362 in principal was repaid and $29,422 of interest was paid during the reporting period.
Non-Current - Loans & Receivables
Loan - Impact Holdings (UK)
22
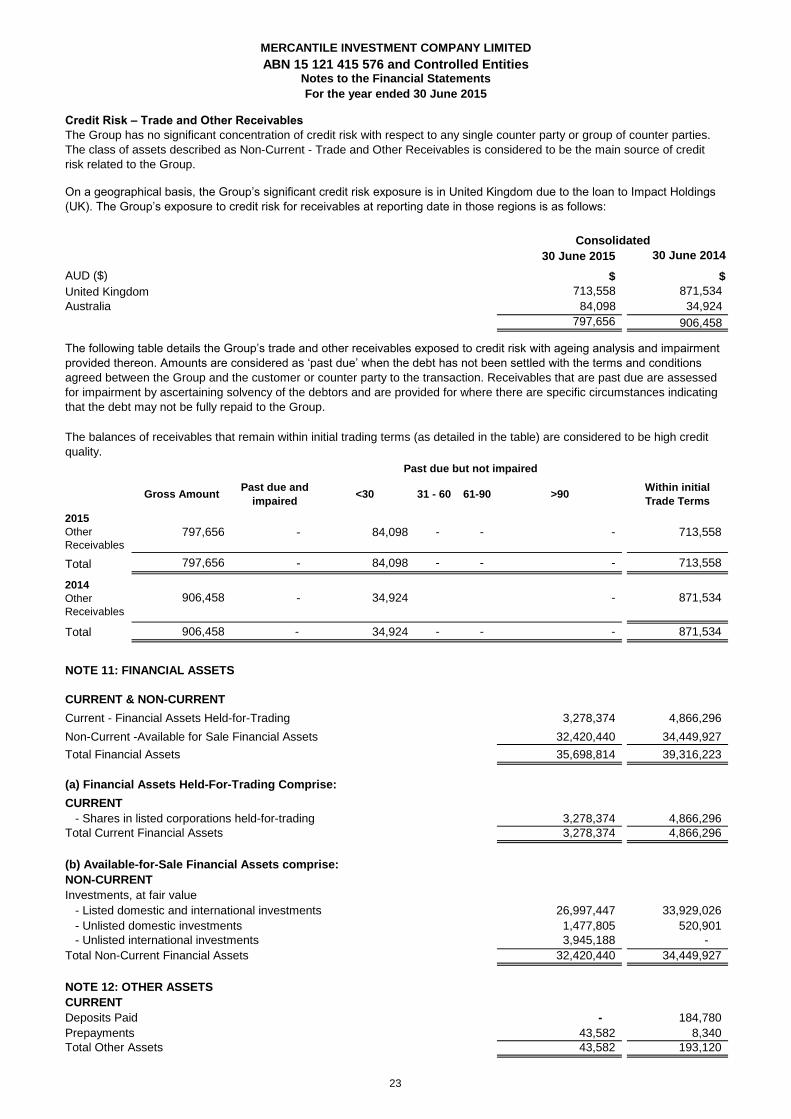
30 June 2015 30 June 2014
AUD ($) $ $
713,558 871,534
Australia 84,098 34,924
797,656 906,458
Gross AmountPast due and
impaired<30 31 - 60 61-90 >90
Within initial
Trade Terms
2015
Other
Receivables
797,656 - 84,098 - - - 713,558
Total 797,656 - 84,098 - - - 713,558
2014
Other
Receivables
906,458 - 34,924 - 871,534
Total 906,458 - 34,924 - - - 871,534
NOTE 11: FINANCIAL ASSETS
CURRENT & NON-CURRENT
Current - Financial Assets Held-for-Trading 3,278,374 4,866,296
Non-Current -Available for Sale Financial Assets 32,420,440 34,449,927
Total Financial Assets 35,698,814 39,316,223
(a) Financial Assets Held-For-Trading Comprise:
CURRENT
- Shares in listed corporations held-for-trading 3,278,374 4,866,296
Total Current Financial Assets 3,278,374 4,866,296
(b) Available-for-Sale Financial Assets comprise:
NON-CURRENT
Investments, at fair value
- Listed domestic and international investments 26,997,447 33,929,026
- Unlisted domestic investments 1,477,805 520,901
- Unlisted international investments 3,945,188 -
Total Non-Current Financial Assets 32,420,440 34,449,927
NOTE 12: OTHER ASSETS
CURRENT
Deposits Paid - 184,780
Prepayments 43,582 8,340
Total Other Assets 43,582 193,120
Consolidated
MERCANTILE INVESTMENT COMPANY LIMITED
ABN 15 121 415 576 and Controlled Entities
For the year ended 30 June 2015
Credit Risk – Trade and Other Receivables
The Group has no significant concentration of credit risk with respect to any single counter party or group of counter parties.
The class of assets described as Non-Current - Trade and Other Receivables is considered to be the main source of credit
risk related to the Group.
On a geographical basis, the Group’s significant credit risk exposure is in United Kingdom due to the loan to Impact Holdings
(UK). The Group’s exposure to credit risk for receivables at reporting date in those regions is as follows:
United Kingdom
The following table details the Group’s trade and other receivables exposed to credit risk with ageing analysis and impairment
provided thereon. Amounts are considered as ‘past due’ when the debt has not been settled with the terms and conditions
agreed between the Group and the customer or counter party to the transaction. Receivables that are past due are assessed
for impairment by ascertaining solvency of the debtors and are provided for where there are specific circumstances indicating
that the debt may not be fully repaid to the Group.
The balances of receivables that remain within initial trading terms (as detailed in the table) are considered to be high credit
quality.
Notes to the Financial Statements
Past due but not impaired
23
30 June 2015 30 June 2014
$ $
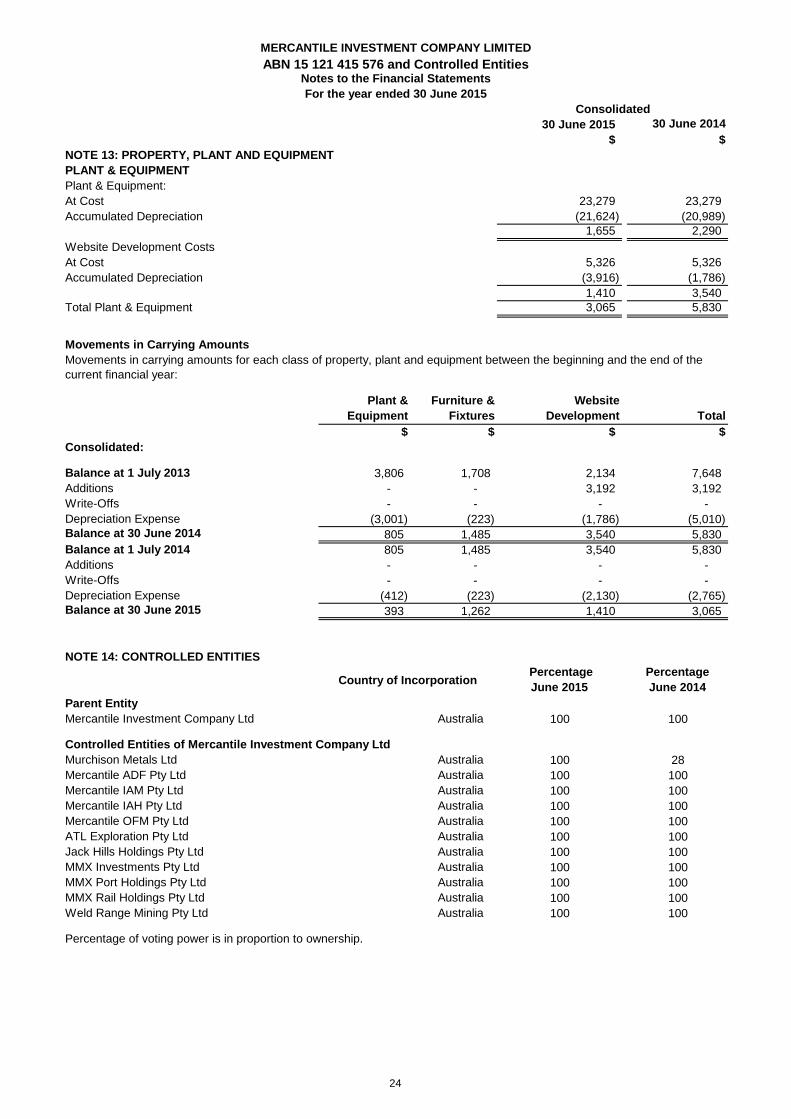
NOTE 13: PROPERTY, PLANT AND EQUIPMENT
PLANT & EQUIPMENT
Plant & Equipment:
At Cost 23,279 23,279
Accumulated Depreciation (21,624) (20,989)
1,655 2,290
Website Development Costs
At Cost 5,326 5,326
Accumulated Depreciation (3,916) (1,786)
1,410 3,540
Total Plant & Equipment 3,065 5,830
Plant &
Equipment
Furniture &
Fixtures
Website
Development Total
$ $ $ $
Consolidated:
Balance at 1 July 2013 3,806 1,708 2,134 7,648
Additions - - 3,192 3,192
Write-Offs - - - -
Depreciation Expense (3,001) (223) (1,786) (5,010)
Balance at 30 June 2014 805 1,485 3,540 5,830
Balance at 1 July 2014 805 1,485 3,540 5,830
Additions - - - -
Write-Offs - - - -
Depreciation Expense (412) (223) (2,130) (2,765)
Balance at 30 June 2015 393 1,262 1,410 3,065
NOTE 14: CONTROLLED ENTITIES
Percentage
June 2015
Percentage
June 2014
Parent Entity
Mercantile Investment Company Ltd 100 100
Controlled Entities of Mercantile Investment Company Ltd
Murchison Metals Ltd 100 28
Mercantile ADF Pty Ltd 100 100
Mercantile IAM Pty Ltd 100 100
Mercantile IAH Pty Ltd 100 100
Mercantile OFM Pty Ltd 100 100
ATL Exploration Pty Ltd 100 100
Jack Hills Holdings Pty Ltd 100 100
MMX Investments Pty Ltd 100 100
MMX Port Holdings Pty Ltd 100 100
MMX Rail Holdings Pty Ltd 100 100
Weld Range Mining Pty Ltd 100 100
Percentage of voting power is in proportion to ownership.
ABN 15 121 415 576 and Controlled Entities
MERCANTILE INVESTMENT COMPANY LIMITED
Australia
Australia
Australia
Australia
For the year ended 30 June 2015
Consolidated
Notes to the Financial Statements
Australia
Australia
Australia
Movements in Carrying Amounts
Movements in carrying amounts for each class of property, plant and equipment between the beginning and the end of the
current financial year:
Country of Incorporation
Australia
Australia
Australia
Australia
Australia
24
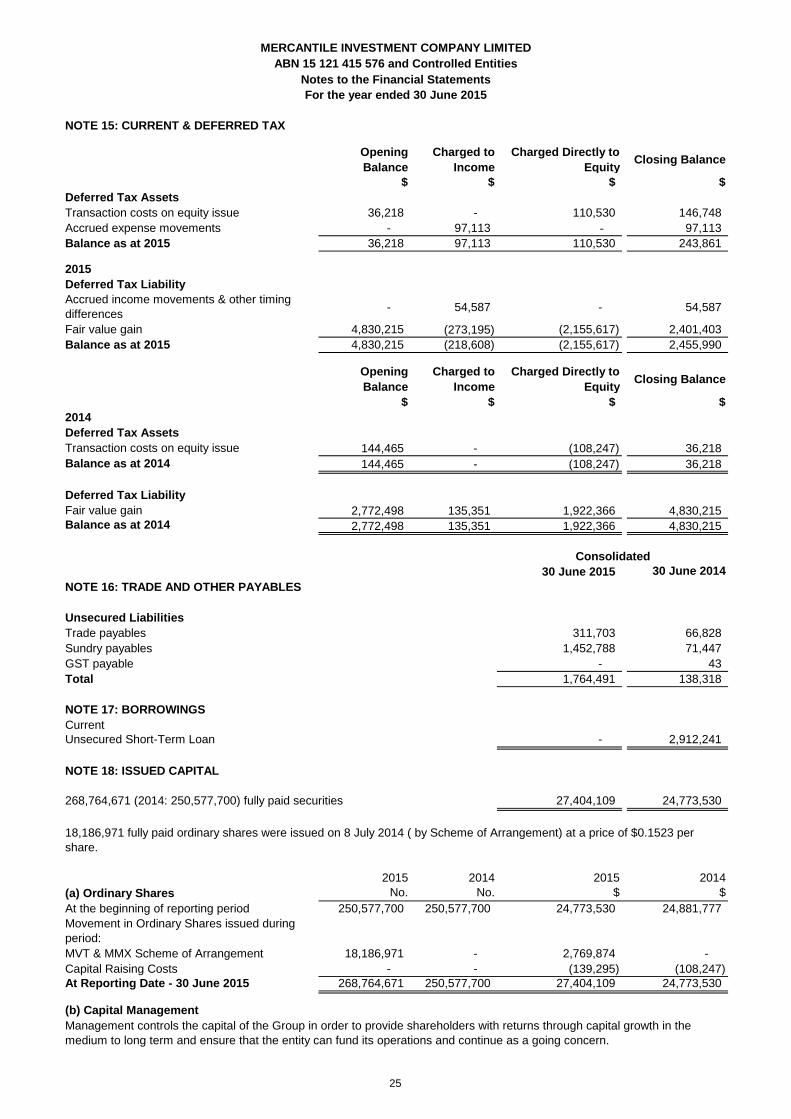
NOTE 15: CURRENT & DEFERRED TAX
Opening
Balance
Charged to
Income
Charged Directly to
Equity Closing Balance
$ $ $ $
Deferred Tax Assets
36,218 - 110,530 146,748
- 97,113 - 97,113
Balance as at 2015 36,218 97,113 110,530 243,861
2015
Deferred Tax Liability
- 54,587 - 54,587
Fair value gain 4,830,215 (273,195) (2,155,617) 2,401,403
Balance as at 2015 4,830,215 (218,608) (2,155,617) 2,455,990
Opening
Balance
Charged to
Income
Charged Directly to
Equity Closing Balance
$ $ $ $
2014
Deferred Tax Assets
144,465 - (108,247) 36,218
Balance as at 2014 144,465 - (108,247) 36,218
Deferred Tax Liability
Fair value gain 2,772,498 135,351 1,922,366 4,830,215
Balance as at 2014 2,772,498 135,351 1,922,366 4,830,215
30 June 2015 30 June 2014
NOTE 16: TRADE AND OTHER PAYABLES
Unsecured Liabilities
Trade payables 311,703 66,828
Sundry payables 1,452,788 71,447
GST payable - 43
Total 1,764,491 138,318
NOTE 17: BORROWINGS
Current
Unsecured Short-Term Loan - 2,912,241
NOTE 18: ISSUED CAPITAL
268,764,671 (2014: 250,577,700) fully paid securities 27,404,109 24,773,530
(a) Ordinary Shares
2015
No.
2014
No.
2015
$
2014
$
250,577,700 250,577,700 24,773,530 24,881,777
18,186,971 - 2,769,874 -
Capital Raising Costs - - (139,295) (108,247)
268,764,671 250,577,700 27,404,109 24,773,530
(b) Capital Management
MERCANTILE INVESTMENT COMPANY LIMITED
Transaction costs on equity issue
Accrued income movements & other timing
differences
Transaction costs on equity issue
For the year ended 30 June 2015
ABN 15 121 415 576 and Controlled Entities
18,186,971 fully paid ordinary shares were issued on 8 July 2014 ( by Scheme of Arrangement) at a price of $0.1523 per
share.
At the beginning of reporting period
Movement in Ordinary Shares issued during
period:
MVT & MMX Scheme of Arrangement
At Reporting Date - 30 June 2015
Management controls the capital of the Group in order to provide shareholders with returns through capital growth in the
medium to long term and ensure that the entity can fund its operations and continue as a going concern.
Notes to the Financial Statements
Consolidated
Accrued expense movements
25
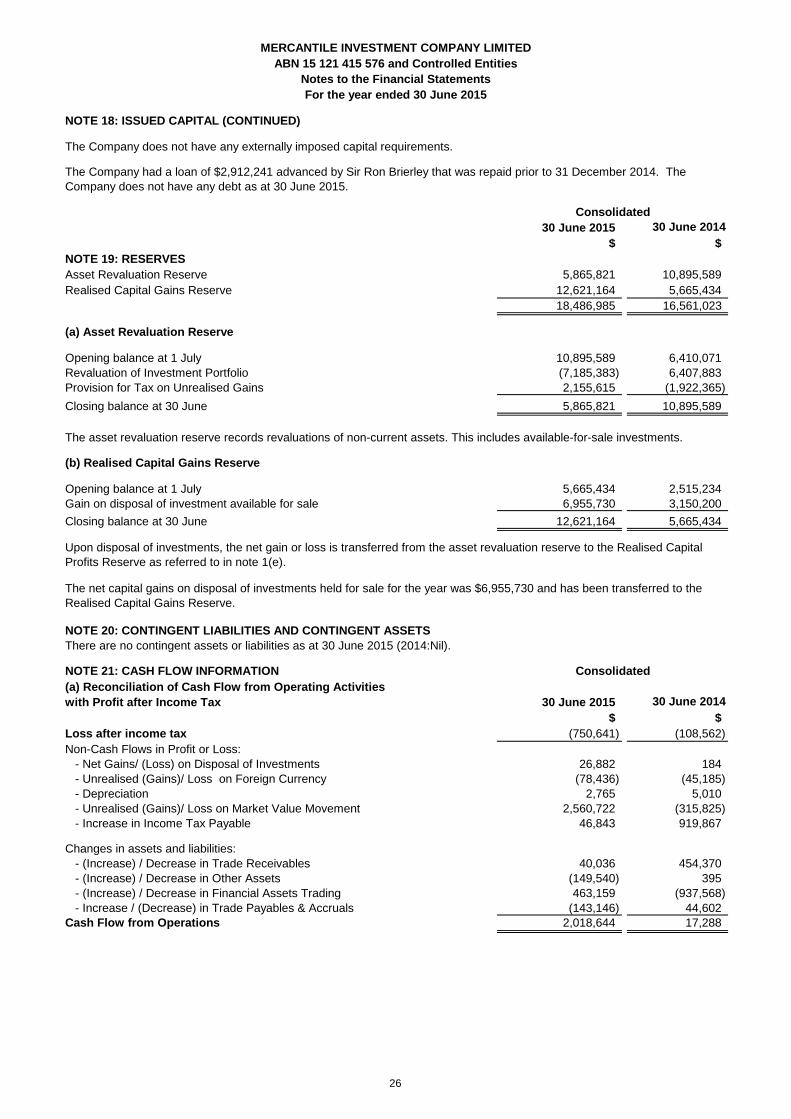
NOTE 18: ISSUED CAPITAL (CONTINUED)#REF!
30 June 2015 30 June 2014
$ $
NOTE 19: RESERVES
Asset Revaluation Reserve 5,865,821 10,895,589
Realised Capital Gains Reserve 12,621,164 5,665,434
18,486,985 16,561,023
(a) Asset Revaluation Reserve
Opening balance at 1 July 10,895,589 6,410,071
Revaluation of Investment Portfolio (7,185,383) 6,407,883
Provision for Tax on Unrealised Gains 2,155,615 (1,922,365)
Closing balance at 30 June 5,865,821 10,895,589
-
(b) Realised Capital Gains Reserve
Opening balance at 1 July 5,665,434 2,515,234
Gain on disposal of investment available for sale 6,955,730 3,150,200
Closing balance at 30 June 12,621,164 5,665,434
NOTE 21: CASH FLOW INFORMATION
30 June 2015 30 June 2014
$ $
Loss after income tax (750,641) (108,562)
Non-Cash Flows in Profit or Loss:
- Net Gains/ (Loss) on Disposal of Investments 26,882 184
- Unrealised (Gains)/ Loss on Foreign Currency (78,436) (45,185)
- Depreciation 2,765 5,010
- Unrealised (Gains)/ Loss on Market Value Movement 2,560,722 (315,825)
- Increase in Income Tax Payable 46,843 919,867
Changes in assets and liabilities:
- (Increase) / Decrease in Trade Receivables 40,036 454,370
- (Increase) / Decrease in Other Assets (149,540) 395
- (Increase) / Decrease in Financial Assets Trading 463,159 (937,568)
- Increase / (Decrease) in Trade Payables & Accruals (143,146) 44,602
Cash Flow from Operations 2,018,644 17,288
-
Consolidated
For the year ended 30 June 2015
MERCANTILE INVESTMENT COMPANY LIMITED
ABN 15 121 415 576 and Controlled Entities
The net capital gains on disposal of investments held for sale for the year was $6,955,730 and has been transferred to the
Realised Capital Gains Reserve.
Notes to the Financial Statements
NOTE 20: CONTINGENT LIABILITIES AND CONTINGENT ASSETS
There are no contingent assets or liabilities as at 30 June 2015 (2014:Nil).
Consolidated
(a) Reconciliation of Cash Flow from Operating Activities
with Profit after Income Tax
The Company had a loan of $2,912,241 advanced by Sir Ron Brierley that was repaid prior to 31 December 2014. The
Company does not have any debt as at 30 June 2015.
The Company does not have any externally imposed capital requirements.
The asset revaluation reserve records revaluations of non-current assets. This includes available-for-sale investments.
Upon disposal of investments, the net gain or loss is transferred from the asset revaluation reserve to the Realised Capital
Profits Reserve as referred to in note 1(e).
26
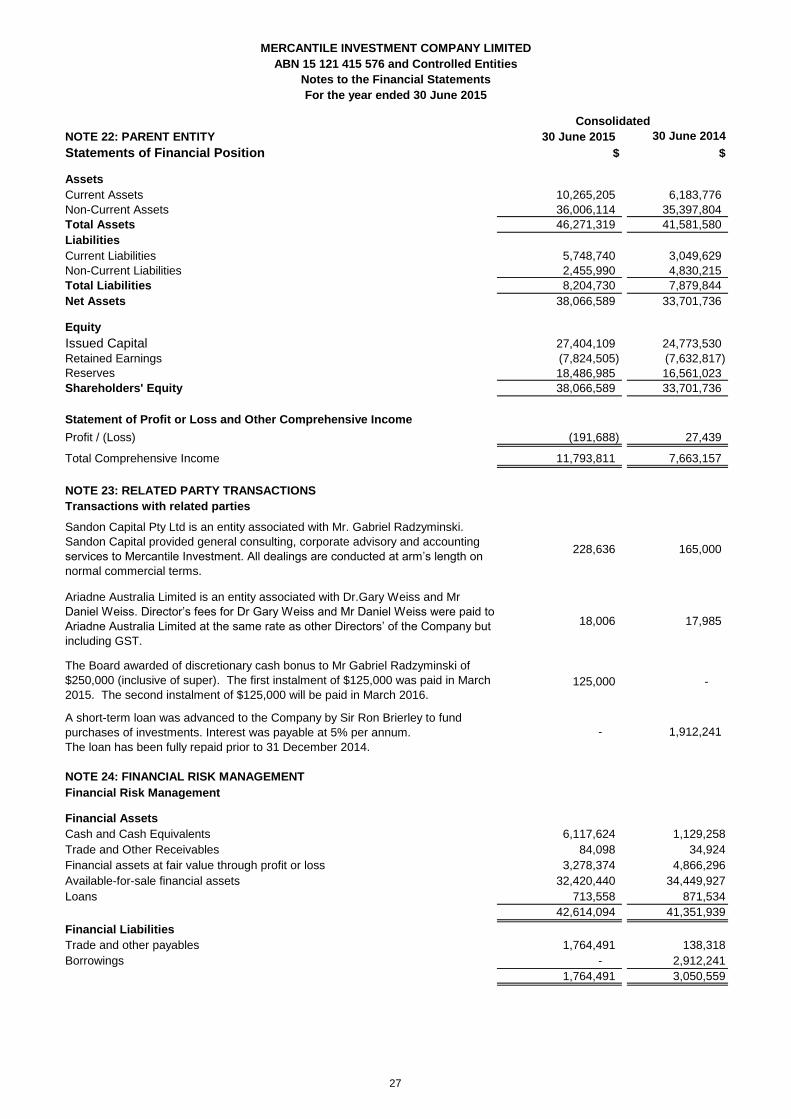
NOTE 22: PARENT ENTITY 30 June 2015 30 June 2014
Statements of Financial Position $ $
Assets
Current Assets 10,265,205 6,183,776
Non-Current Assets 36,006,114 35,397,804
Total Assets 46,271,319 41,581,580
Liabilities
Current Liabilities 5,748,740 3,049,629
Non-Current Liabilities 2,455,990 4,830,215
Total Liabilities 8,204,730 7,879,844
Net Assets 38,066,589 33,701,736
Equity
Issued Capital 27,404,109 24,773,530
Retained Earnings (7,824,505) (7,632,817)
Reserves 18,486,985 16,561,023
Shareholders' Equity 38,066,589 33,701,736
Statement of Profit or Loss and Other Comprehensive Income
Profit / (Loss) (191,688) 27,439
Total Comprehensive Income 11,793,811 7,663,157
NOTE 23: RELATED PARTY TRANSACTIONS
Transactions with related parties
228,636 165,000
18,006 17,985
125,000 -
- 1,912,241
NOTE 24: FINANCIAL RISK MANAGEMENT
Financial Assets
Cash and Cash Equivalents 6,117,624 1,129,258
Trade and Other Receivables 84,098 34,924
Financial assets at fair value through profit or loss 3,278,374 4,866,296
Available-for-sale financial assets 32,420,440 34,449,927
Loans 713,558 871,534
42,614,094 41,351,939
Financial Liabilities
Trade and other payables 1,764,491 138,318
Borrowings - 2,912,241
1,764,491 3,050,559
Sandon Capital Pty Ltd is an entity associated with Mr. Gabriel Radzyminski.
Sandon Capital provided general consulting, corporate advisory and accounting
services to Mercantile Investment. All dealings are conducted at arm’s length on
normal commercial terms.
Ariadne Australia Limited is an entity associated with Dr.Gary Weiss and Mr
Daniel Weiss. Director’s fees for Dr Gary Weiss and Mr Daniel Weiss were paid to
Ariadne Australia Limited at the same rate as other Directors’ of the Company but
including GST.
The Board awarded of discretionary cash bonus to Mr Gabriel Radzyminski of
$250,000 (inclusive of super). The first instalment of $125,000 was paid in March
2015. The second instalment of $125,000 will be paid in March 2016.
A short-term loan was advanced to the Company by Sir Ron Brierley to fund
purchases of investments. Interest was payable at 5% per annum.
The loan has been fully repaid prior to 31 December 2014.
Financial Risk Management
Consolidated
For the year ended 30 June 2015
MERCANTILE INVESTMENT COMPANY LIMITED
ABN 15 121 415 576 and Controlled Entities
Notes to the Financial Statements
27
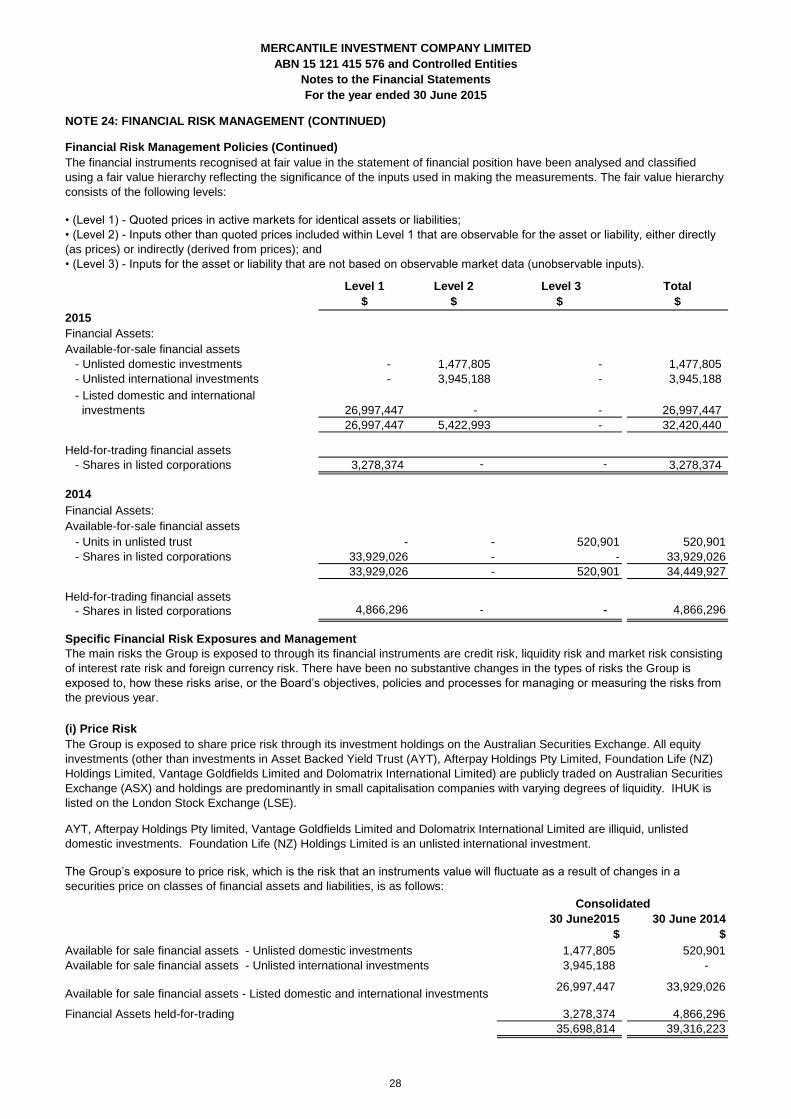
NOTE 24: FINANCIAL RISK MANAGEMENT (CONTINUED)
Level 1
$
Level 2
$
Level 3
$
Total
$
2015
Financial Assets:
Available-for-sale financial assets
- Unlisted domestic investments - 1,477,805 - 1,477,805
- Unlisted international investments - 3,945,188 - 3,945,188
26,997,447 - - 26,997,447
26,997,447 5,422,993 - 32,420,440
Held-for-trading financial assets
- Shares in listed corporations 3,278,374 - - 3,278,374
2014
Financial Assets:
Available-for-sale financial assets
- Units in unlisted trust - - 520,901 520,901
- Shares in listed corporations 33,929,026 - - 33,929,026
33,929,026 - 520,901 34,449,927
Held-for-trading financial assets 4,866,296 - - 4,866,296
30 June2015
$
30 June 2014
$
1,477,805 520,901
3,945,188 -
26,997,447 33,929,026
3,278,374 4,866,296
35,698,814 39,316,223
The financial instruments recognised at fair value in the statement of financial position have been analysed and classified
using a fair value hierarchy reflecting the significance of the inputs used in making the measurements. The fair value hierarchy
consists of the following levels:
• (Level 1) - Quoted prices in active markets for identical assets or liabilities;
• (Level 2) - Inputs other than quoted prices included within Level 1 that are observable for the asset or liability, either directly
(as prices) or indirectly (derived from prices); and
• (Level 3) - Inputs for the asset or liability that are not based on observable market data (unobservable inputs).
Specific Financial Risk Exposures and Management
The main risks the Group is exposed to through its financial instruments are credit risk, liquidity risk and market risk consisting
of interest rate risk and foreign currency risk. There have been no substantive changes in the types of risks the Group is
exposed to, how these risks arise, or the Board’s objectives, policies and processes for managing or measuring the risks from
the previous year.
Held-for-trading Financial Assets
- Shares in listed corporations
- Listed domestic and international
investments
AYT, Afterpay Holdings Pty limited, Vantage Goldfields Limited and Dolomatrix International Limited are illiquid, unlisted
domestic investments. Foundation Life (NZ) Holdings Limited is an unlisted international investment.
(i) Price Risk
The Group’s exposure to price risk, which is the risk that an instruments value will fluctuate as a result of changes in a
securities price on classes of financial assets and liabilities, is as follows:
Financial Assets held-for-trading
Consolidated
The Group is exposed to share price risk through its investment holdings on the Australian Securities Exchange. All equity
investments (other than investments in Asset Backed Yield Trust (AYT), Afterpay Holdings Pty Limited, Foundation Life (NZ)
Holdings Limited, Vantage Goldfields Limited and Dolomatrix International Limited) are publicly traded on Australian Securities
Exchange (ASX) and holdings are predominantly in small capitalisation companies with varying degrees of liquidity. IHUK is
listed on the London Stock Exchange (LSE).
Financial Risk Management Policies (Continued)
Available for sale financial assets - Unlisted domestic investments
Available for sale financial assets - Unlisted international investments
Available for sale financial assets - Listed domestic and international investments
MERCANTILE INVESTMENT COMPANY LIMITED
ABN 15 121 415 576 and Controlled Entities
For the year ended 30 June 2015
Notes to the Financial Statements
28
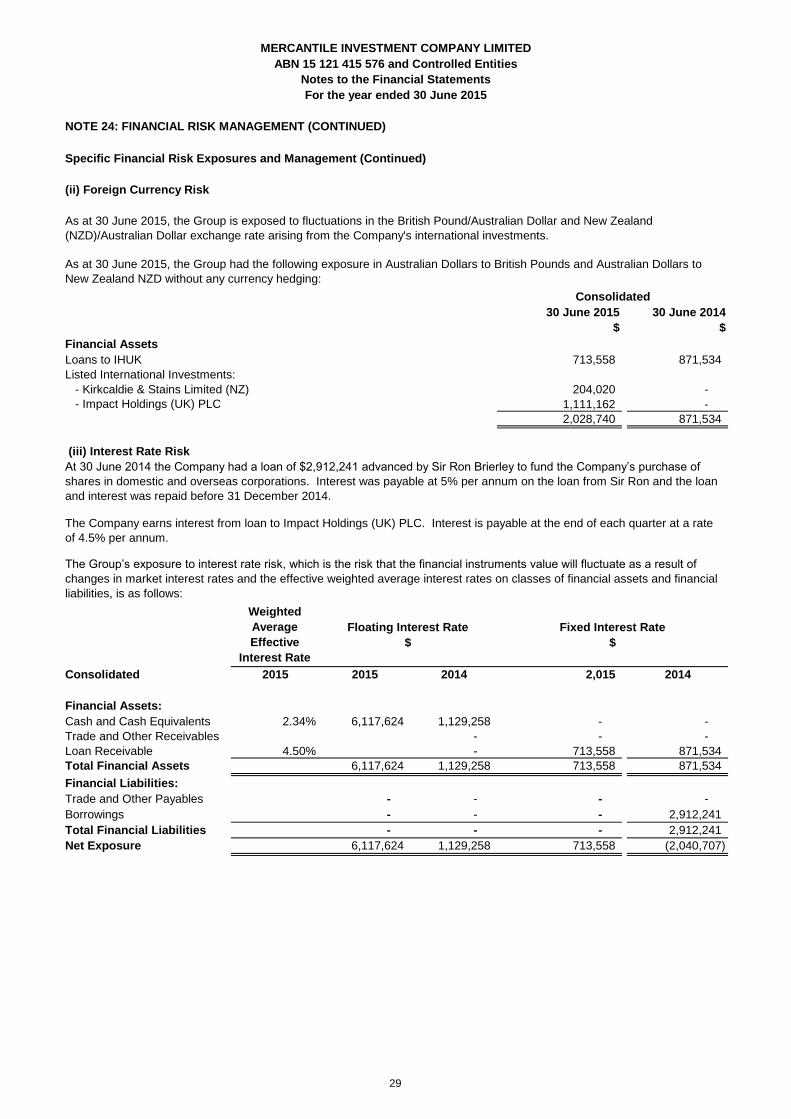
NOTE 24: FINANCIAL RISK MANAGEMENT (CONTINUED)
Specific Financial Risk Exposures and Management (Continued)
(ii) Foreign Currency Risk
30 June 2015
$
30 June 2014
$
Financial Assets
Loans to IHUK 713,558 871,534
Listed International Investments:
- Kirkcaldie & Stains Limited (NZ) 204,020 -
- Impact Holdings (UK) PLC 1,111,162 -
2,028,740 871,534
(iii) Interest Rate Risk
Weighted
Average
Effective
Interest Rate
2015 2015 2014 2,015 2014
Financial Assets:
Cash and Cash Equivalents 2.34% 6,117,624 1,129,258 - -
Trade and Other Receivables - - -
Loan Receivable 4.50% - 713,558 871,534
Total Financial Assets 6,117,624 1,129,258 713,558 871,534
Financial Liabilities:
Trade and Other Payables - - - -
Borrowings - - - 2,912,241
Total Financial Liabilities - - - 2,912,241
Net Exposure 6,117,624 1,129,258 713,558 (2,040,707)
As at 30 June 2015, the Group had the following exposure in Australian Dollars to British Pounds and Australian Dollars to
New Zealand NZD without any currency hedging:
Floating Interest Rate
$
For the year ended 30 June 2015
Notes to the Financial Statements
At 30 June 2014 the Company had a loan of $2,912,241 advanced by Sir Ron Brierley to fund the Company’s purchase of
shares in domestic and overseas corporations. Interest was payable at 5% per annum on the loan from Sir Ron and the loan
and interest was repaid before 31 December 2014.
As at 30 June 2015, the Group is exposed to fluctuations in the British Pound/Australian Dollar and New Zealand
(NZD)/Australian Dollar exchange rate arising from the Company's international investments.
Consolidated
The Company earns interest from loan to Impact Holdings (UK) PLC. Interest is payable at the end of each quarter at a rate
of 4.5% per annum.
Consolidated
The Group’s exposure to interest rate risk, which is the risk that the financial instruments value will fluctuate as a result of
changes in market interest rates and the effective weighted average interest rates on classes of financial assets and financial
liabilities, is as follows:
ABN 15 121 415 576 and Controlled Entities
Fixed Interest Rate
$
MERCANTILE INVESTMENT COMPANY LIMITED
29
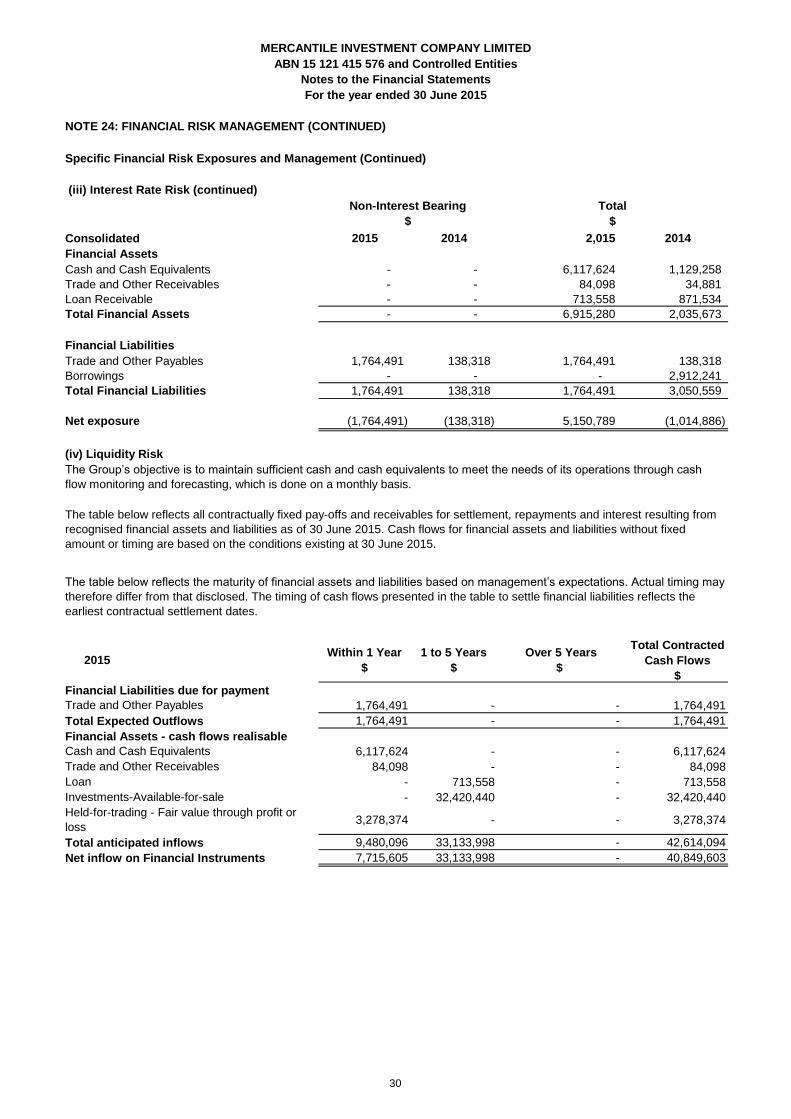
NOTE 24: FINANCIAL RISK MANAGEMENT (CONTINUED)
Specific Financial Risk Exposures and Management (Continued)
(iii) Interest Rate Risk (continued)
2015 2014 2,015 2014
Financial Assets
Cash and Cash Equivalents - - 6,117,624 1,129,258
Trade and Other Receivables - - 84,098 34,881
Loan Receivable - - 713,558 871,534
Total Financial Assets - - 6,915,280 2,035,673
Financial Liabilities
Trade and Other Payables 1,764,491 138,318 1,764,491 138,318
Borrowings - - - 2,912,241
Total Financial Liabilities 1,764,491 138,318 1,764,491 3,050,559
Net exposure (1,764,491) (138,318) 5,150,789 (1,014,886)
(iv) Liquidity Risk
2015Within 1 Year
$
1 to 5 Years
$
Over 5 Years
$
Total Contracted
Cash Flows
$
1,764,491 - - 1,764,491
1,764,491 - - 1,764,491
6,117,624 - - 6,117,624
84,098 - - 84,098
- 713,558 - 713,558
- 32,420,440 - 32,420,440
3,278,374 - - 3,278,374
9,480,096 33,133,998 - 42,614,094
7,715,605 33,133,998 - 40,849,603 Net inflow on Financial Instruments
The table below reflects all contractually fixed pay-offs and receivables for settlement, repayments and interest resulting from
recognised financial assets and liabilities as of 30 June 2015. Cash flows for financial assets and liabilities without fixed
amount or timing are based on the conditions existing at 30 June 2015.
The table below reflects the maturity of financial assets and liabilities based on management’s expectations. Actual timing may
therefore differ from that disclosed. The timing of cash flows presented in the table to settle financial liabilities reflects the
earliest contractual settlement dates.
MERCANTILE INVESTMENT COMPANY LIMITED
ABN 15 121 415 576 and Controlled Entities
Consolidated
Financial Assets - cash flows realisable
Cash and Cash Equivalents
Trade and Other Receivables
Financial Liabilities due for payment
Total Expected Outflows
The Group’s objective is to maintain sufficient cash and cash equivalents to meet the needs of its operations through cash
flow monitoring and forecasting, which is done on a monthly basis.
Non-Interest Bearing
$
Investments-Available-for-sale
Trade and Other Payables
Total anticipated inflows
Loan
For the year ended 30 June 2015
Total
$
Notes to the Financial Statements
Held-for-trading - Fair value through profit or
loss
30
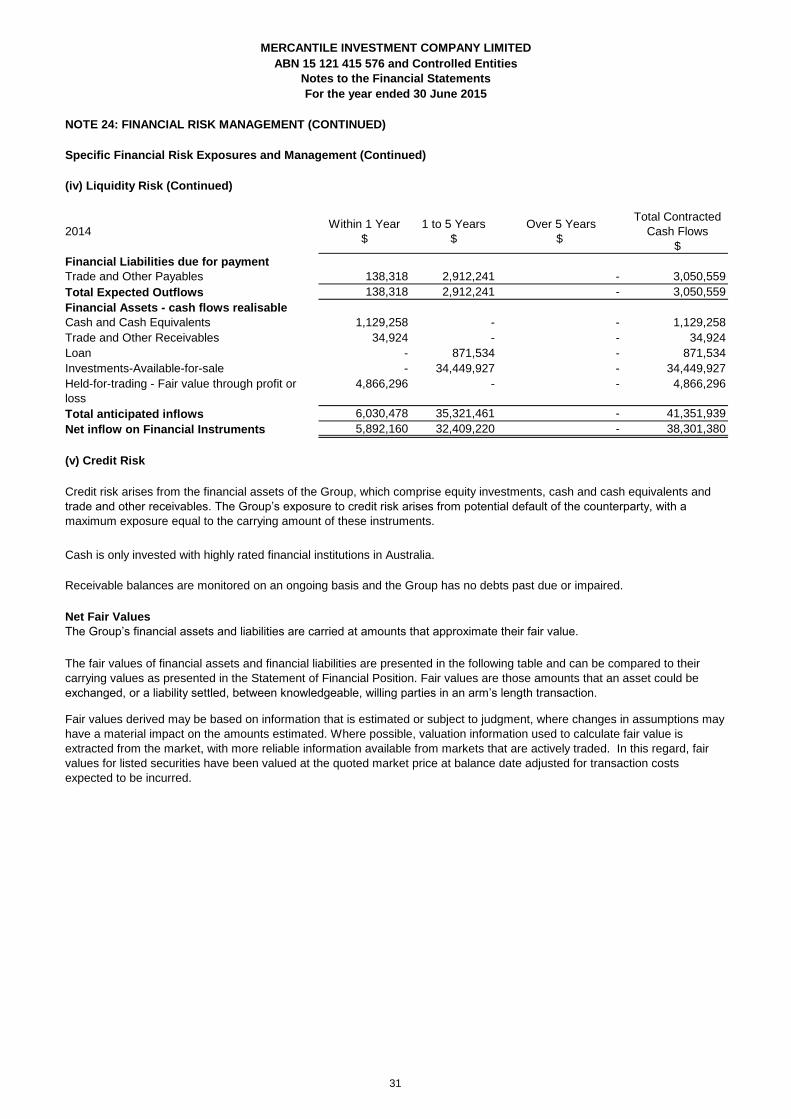
NOTE 24: FINANCIAL RISK MANAGEMENT (CONTINUED)
Specific Financial Risk Exposures and Management (Continued)
(iv) Liquidity Risk (Continued)
2014Within 1 Year
$
1 to 5 Years
$
Over 5 Years
$
Total Contracted
Cash Flows
$
138,318 2,912,241 - 3,050,559
138,318 2,912,241 - 3,050,559
1,129,258 - - 1,129,258
34,924 - - 34,924
- 871,534 - 871,534
- 34,449,927 - 34,449,927
4,866,296 - - 4,866,296
6,030,478 35,321,461 - 41,351,939
5,892,160 32,409,220 - 38,301,380
(v) Credit Risk
Fair values derived may be based on information that is estimated or subject to judgment, where changes in assumptions may
have a material impact on the amounts estimated. Where possible, valuation information used to calculate fair value is
extracted from the market, with more reliable information available from markets that are actively traded. In this regard, fair
values for listed securities have been valued at the quoted market price at balance date adjusted for transaction costs
expected to be incurred.
Cash and Cash Equivalents
Financial Liabilities due for payment
For the year ended 30 June 2015
Receivable balances are monitored on an ongoing basis and the Group has no debts past due or impaired.
Net Fair Values
The Group’s financial assets and liabilities are carried at amounts that approximate their fair value.
MERCANTILE INVESTMENT COMPANY LIMITED
ABN 15 121 415 576 and Controlled Entities
Trade and Other Payables
Total Expected Outflows
Financial Assets - cash flows realisable
Net inflow on Financial Instruments
Held-for-trading - Fair value through profit or
loss
Total anticipated inflows
The fair values of financial assets and financial liabilities are presented in the following table and can be compared to their
carrying values as presented in the Statement of Financial Position. Fair values are those amounts that an asset could be
exchanged, or a liability settled, between knowledgeable, willing parties in an arm’s length transaction.
Notes to the Financial Statements
Credit risk arises from the financial assets of the Group, which comprise equity investments, cash and cash equivalents and
trade and other receivables. The Group’s exposure to credit risk arises from potential default of the counterparty, with a
maximum exposure equal to the carrying amount of these instruments.
Cash is only invested with highly rated financial institutions in Australia.
Trade and Other Receivables
Loan
Investments-Available-for-sale
31
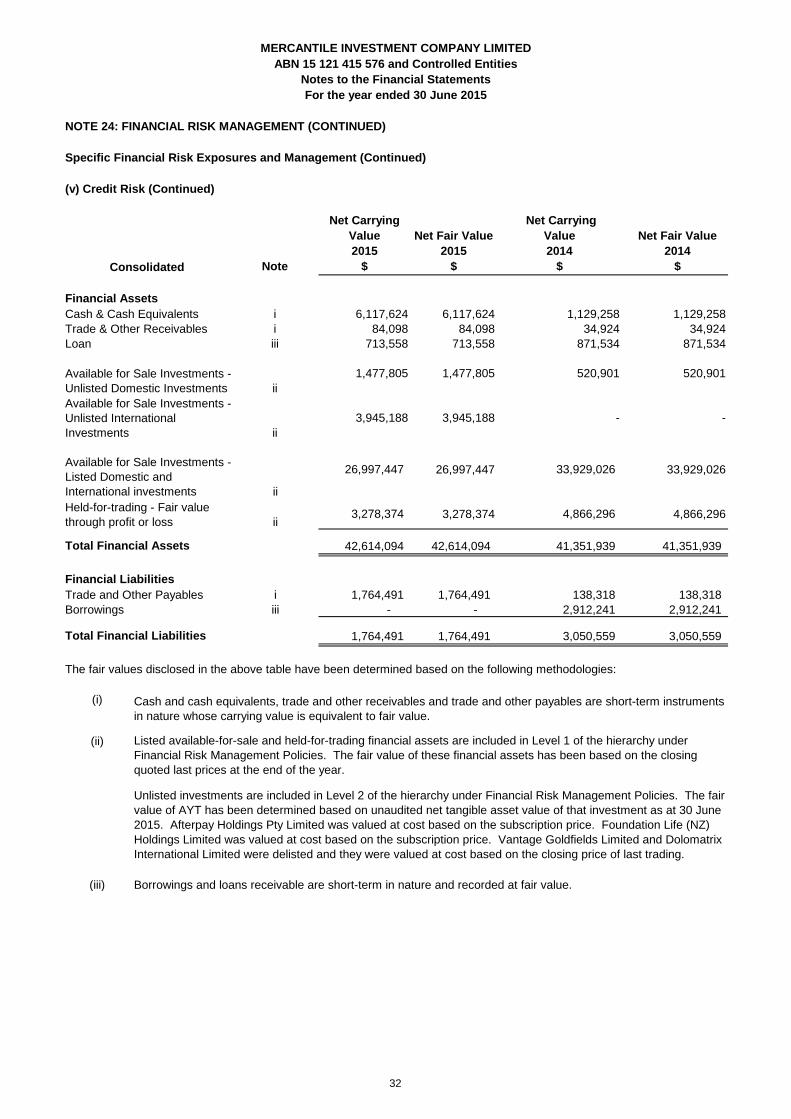
NOTE 24: FINANCIAL RISK MANAGEMENT (CONTINUED)
Specific Financial Risk Exposures and Management (Continued)
(v) Credit Risk (Continued)
Note
Net Carrying
Value
2015
$
Net Fair Value
2015
$
Net Carrying
Value
2014
$
Net Fair Value
2014
$
i 6,117,624 6,117,624 1,129,258 1,129,258
i 84,098 84,098 34,924 34,924
iii 713,558 713,558 871,534 871,534
ii
1,477,805 1,477,805 520,901 520,901
ii
3,945,188 3,945,188 - -
ii
26,997,447 26,997,447 33,929,026 33,929,026
ii3,278,374 3,278,374 4,866,296 4,866,296
42,614,094 42,614,094 41,351,939 41,351,939
i 1,764,491 1,764,491 138,318 138,318
iii - - 2,912,241 2,912,241
1,764,491 1,764,491 3,050,559 3,050,559
(i)
(ii)
(iii)
Available for Sale Investments -
Unlisted International
Investments
Available for Sale Investments -
Listed Domestic and
International investments
Held-for-trading - Fair value
through profit or loss
Trade and Other Payables
MERCANTILE INVESTMENT COMPANY LIMITED
ABN 15 121 415 576 and Controlled Entities
For the year ended 30 June 2015
Consolidated
Financial Assets
Cash & Cash Equivalents
Trade & Other Receivables
Loan
Available for Sale Investments -
Unlisted Domestic Investments
Borrowings
Total Financial Liabilities
The fair values disclosed in the above table have been determined based on the following methodologies:
Cash and cash equivalents, trade and other receivables and trade and other payables are short-term instruments
in nature whose carrying value is equivalent to fair value.
Listed available-for-sale and held-for-trading financial assets are included in Level 1 of the hierarchy under
Financial Risk Management Policies. The fair value of these financial assets has been based on the closing
quoted last prices at the end of the year.
Total Financial Assets
Financial Liabilities
Borrowings and loans receivable are short-term in nature and recorded at fair value.
Unlisted investments are included in Level 2 of the hierarchy under Financial Risk Management Policies. The fair
value of AYT has been determined based on unaudited net tangible asset value of that investment as at 30 June
2015. Afterpay Holdings Pty Limited was valued at cost based on the subscription price. Foundation Life (NZ)
Holdings Limited was valued at cost based on the subscription price. Vantage Goldfields Limited and Dolomatrix
International Limited were delisted and they were valued at cost based on the closing price of last trading.
Notes to the Financial Statements
32
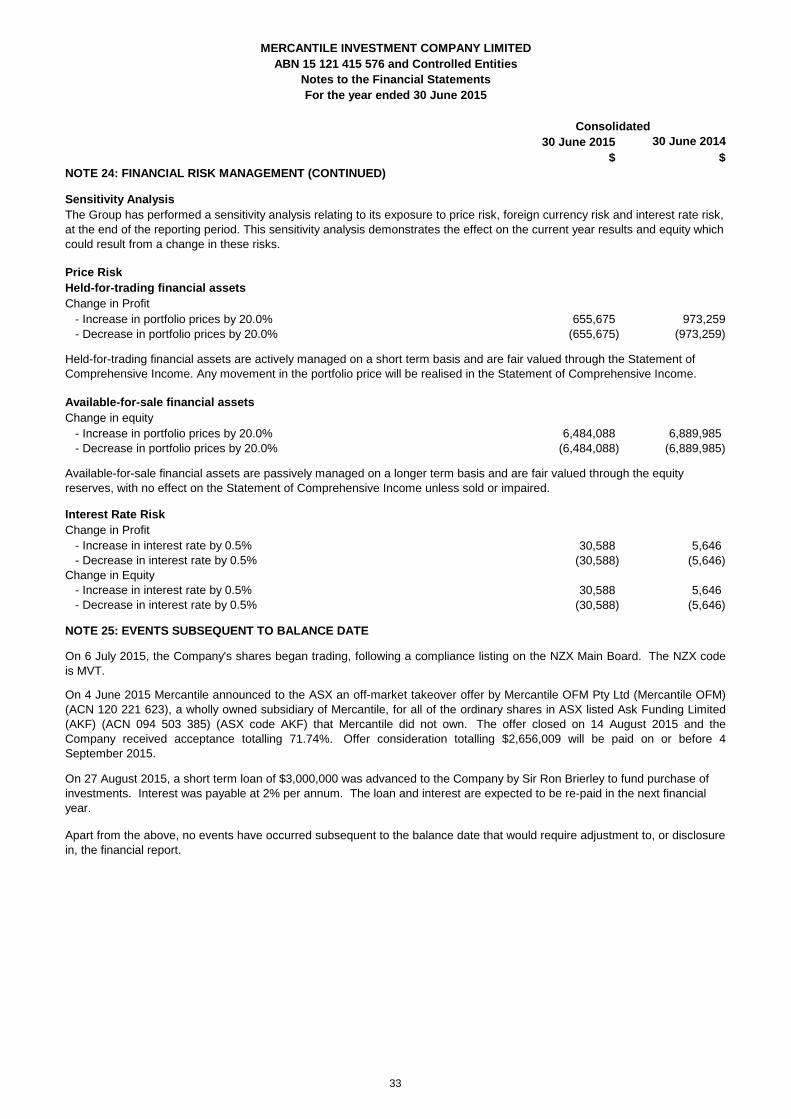
30 June 2015 30 June 2014
$ $
NOTE 24: FINANCIAL RISK MANAGEMENT (CONTINUED)
Sensitivity Analysis
Price Risk
Held-for-trading financial assets
Change in Profit
- Increase in portfolio prices by 20.0% 655,675 973,259
- Decrease in portfolio prices by 20.0% (655,675) (973,259)
Available-for-sale financial assets
Change in equity
- Increase in portfolio prices by 20.0% 6,484,088 6,889,985
- Decrease in portfolio prices by 20.0% (6,484,088) (6,889,985)
Interest Rate Risk
Change in Profit
30,588 5,646
(30,588) (5,646)
30,588 5,646
(30,588) (5,646)
Apart from the above, no events have occurred subsequent to the balance date that would require adjustment to, or disclosure
in, the financial report.
On 27 August 2015, a short term loan of $3,000,000 was advanced to the Company by Sir Ron Brierley to fund purchase of
investments. Interest was payable at 2% per annum. The loan and interest are expected to be re-paid in the next financial
year.
Available-for-sale financial assets are passively managed on a longer term basis and are fair valued through the equity
reserves, with no effect on the Statement of Comprehensive Income unless sold or impaired.
On 6 July 2015, the Company's shares began trading, following a compliance listing on the NZX Main Board. The NZX code
is MVT.
On 4 June 2015 Mercantile announced to the ASX an off-market takeover offer by Mercantile OFM Pty Ltd (Mercantile OFM)
(ACN 120 221 623), a wholly owned subsidiary of Mercantile, for all of the ordinary shares in ASX listed Ask Funding Limited
(AKF) (ACN 094 503 385) (ASX code AKF) that Mercantile did not own. The offer closed on 14 August 2015 and the
Company received acceptance totalling 71.74%. Offer consideration totalling $2,656,009 will be paid on or before 4
September 2015.
- Increase in interest rate by 0.5%
- Decrease in interest rate by 0.5%
Change in Equity
- Increase in interest rate by 0.5%
- Decrease in interest rate by 0.5%
NOTE 25: EVENTS SUBSEQUENT TO BALANCE DATE
Held-for-trading financial assets are actively managed on a short term basis and are fair valued through the Statement of
Comprehensive Income. Any movement in the portfolio price will be realised in the Statement of Comprehensive Income.
MERCANTILE INVESTMENT COMPANY LIMITED
The Group has performed a sensitivity analysis relating to its exposure to price risk, foreign currency risk and interest rate risk,
at the end of the reporting period. This sensitivity analysis demonstrates the effect on the current year results and equity which
could result from a change in these risks.
For the year ended 30 June 2015
Consolidated
ABN 15 121 415 576 and Controlled Entities
Notes to the Financial Statements
33

NOTE 26: COMPANY DETAILS
The registered office of the Company:
Mercantile Investment Company Limited
Level 11, 139 Macquarie Street
SYDNEY NSW 2000
The principal place of business:
Mercantile Investment Company Limited
Level 11, 139 Macquarie Street
SYDNEY NSW 2000
MERCANTILE INVESTMENT COMPANY LIMITED
ABN 15 121 415 576 and Controlled Entities
For the year ended 30 June 2015
Notes to the Financial Statements
34
DIRECTORS' DECLARATION
(a)
(b)
Director
28 September 2015
1. the financial statements and notes, as set out on pages 10 to 34, are in accordance with the Corporations Act 2001, and:
comply with Australian Accounting Standards, which, as stated in accounting policy Note 1 to the financial
statements, constitutes compliance with International Financial Reporting Standards (IFRS); and
give a true and fair view of the financial position as at 30 June 2015 and of the performance for the year ended
on that date of the consolidated group;
2. in the Directors' opinion there are reasonable grounds to believe that the Company will be able to pay its debts as and
when they become due and payable.
3. the Directors have been given the declarations required by S295A of the Corporations Act 2001 from the Chief Executive
Officer and Chief Financial Officer.
This declaration is made in accordance with a resolution of the Board of Directors.
Gabriel Radzyminski
MERCANTILE INVESTMENT COMPANY LIMITED
ABN 15 121 415 576 and Controlled Entities
For the year ended 30 June 2015
In accordance with a resolution of the Directors of Mercantile Investment Company Limited, the Directors of the Company
declare that:
35
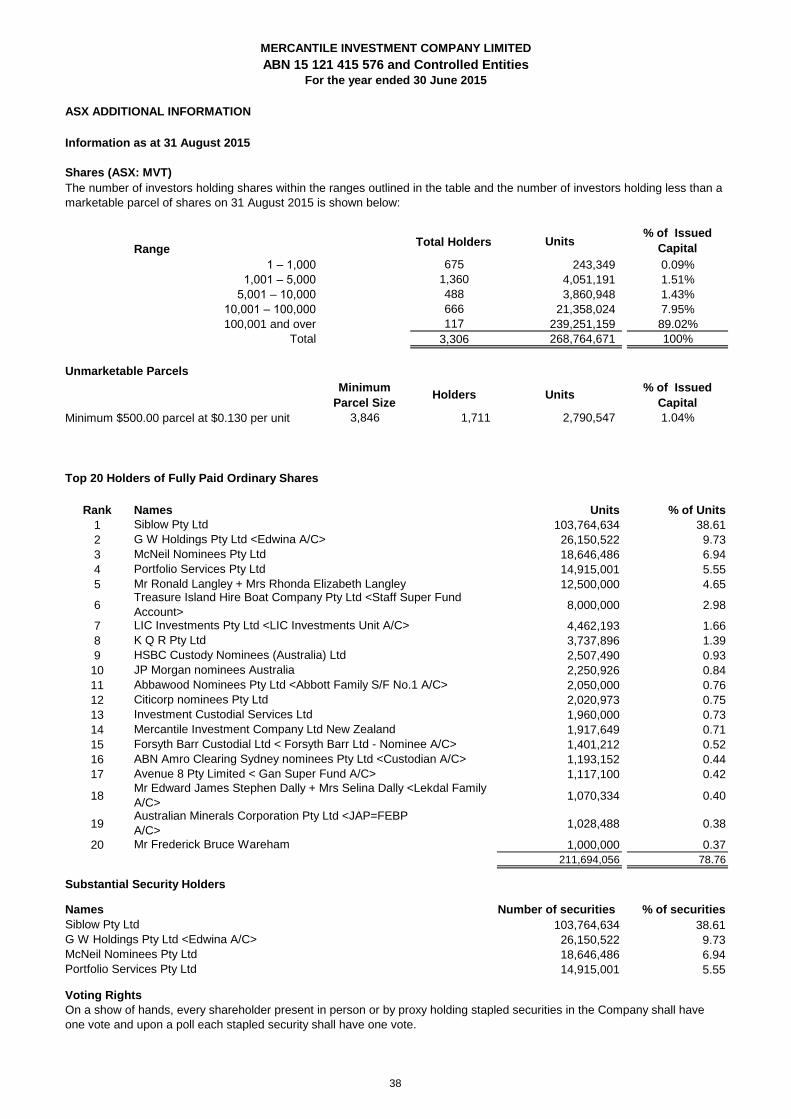
ASX ADDITIONAL INFORMATION
Information as at 31 August 2015
RangeTotal Holders Units
% of Issued
Capital
1 – 1,000 675 243,349 0.09%
1,001 – 5,000 1,360 4,051,191 1.51%
5,001 – 10,000 488 3,860,948 1.43%
10,001 – 100,000 666 21,358,024 7.95%
100,001 and over 117 239,251,159 89.02%
Total 3,306 268,764,671 100%
Unmarketable Parcels
Minimum
Parcel SizeHolders Units
% of Issued
Capital
Minimum $500.00 parcel at $0.130 per unit 3,846 1,711 2,790,547 1.04%
Top 20 Holders of Fully Paid Ordinary Shares
Rank Names Units % of Units
1 103,764,634 38.61
2 26,150,522 9.73
3 18,646,486 6.94
4 14,915,001 5.55
5 12,500,000 4.65
6 8,000,000 2.98
7 4,462,193 1.66
8 3,737,896 1.39
9 2,507,490 0.93
10 2,250,926 0.84
11 2,050,000 0.76
12 2,020,973 0.75
13 1,960,000 0.73
14 1,917,649 0.71
15 1,401,212 0.52
16 1,193,152 0.44
17 1,117,100 0.42
18 1,070,334 0.40
19 1,028,488 0.38
20 1,000,000 0.37
211,694,056 78.76
Substantial Security Holders
Names Number of securities % of securities
103,764,634 38.61
26,150,522 9.73
18,646,486 6.94
14,915,001 5.55
Siblow Pty Ltd
MERCANTILE INVESTMENT COMPANY LIMITED
ABN 15 121 415 576 and Controlled Entities
Australian Minerals Corporation Pty Ltd <JAP=FEBP
A/C>
Avenue 8 Pty Limited < Gan Super Fund A/C>
For the year ended 30 June 2015
Citicorp nominees Pty Ltd
HSBC Custody Nominees (Australia) Ltd
McNeil Nominees Pty Ltd
Portfolio Services Pty Ltd
Mr Frederick Bruce Wareham
G W Holdings Pty Ltd <Edwina A/C>
The number of investors holding shares within the ranges outlined in the table and the number of investors holding less than a
marketable parcel of shares on 31 August 2015 is shown below:
Siblow Pty Ltd
G W Holdings Pty Ltd <Edwina A/C>
Portfolio Services Pty Ltd
Shares (ASX: MVT)
Mr Edward James Stephen Dally + Mrs Selina Dally <Lekdal Family
A/C>
Treasure Island Hire Boat Company Pty Ltd <Staff Super Fund
Account>
Mr Ronald Langley + Mrs Rhonda Elizabeth Langley
LIC Investments Pty Ltd <LIC Investments Unit A/C>
Mercantile Investment Company Ltd New Zealand
ABN Amro Clearing Sydney nominees Pty Ltd <Custodian A/C>
K Q R Pty Ltd
Abbawood Nominees Pty Ltd <Abbott Family S/F No.1 A/C>
Forsyth Barr Custodial Ltd < Forsyth Barr Ltd - Nominee A/C>
McNeil Nominees Pty Ltd
JP Morgan nominees Australia
Investment Custodial Services Ltd
Voting Rights
On a show of hands, every shareholder present in person or by proxy holding stapled securities in the Company shall have
one vote and upon a poll each stapled security shall have one vote.
38
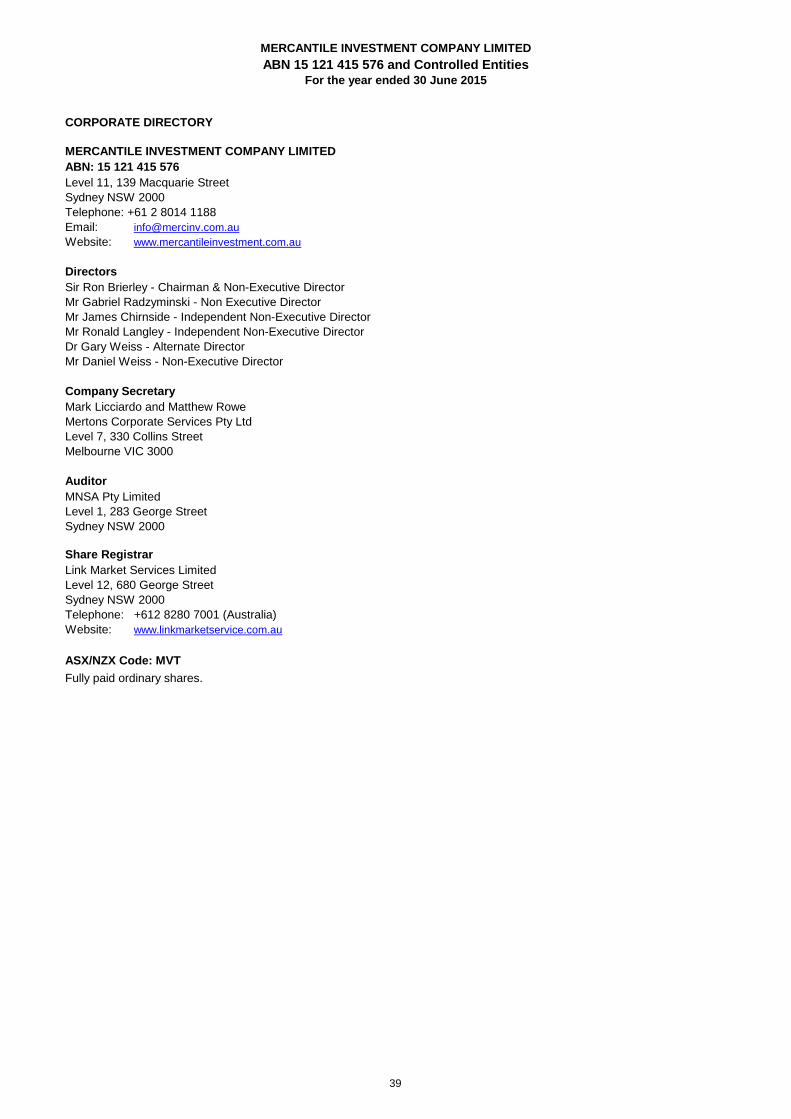
CORPORATE DIRECTORY
MERCANTILE INVESTMENT COMPANY LIMITED
ABN: 15 121 415 576
Level 11, 139 Macquarie Street
Sydney NSW 2000
Telephone: +61 2 8014 1188
Email: [email protected]
Website: www.mercantileinvestment.com.au
Directors
Sir Ron Brierley - Chairman & Non-Executive Director
Mr Gabriel Radzyminski - Non Executive Director
Mr James Chirnside - Independent Non-Executive Director
Mr Ronald Langley - Independent Non-Executive Director
Dr Gary Weiss - Alternate Director
Mr Daniel Weiss - Non-Executive Director
Company Secretary
Mark Licciardo and Matthew Rowe
Mertons Corporate Services Pty Ltd
Level 7, 330 Collins Street
Melbourne VIC 3000
Auditor
MNSA Pty Limited
Level 1, 283 George Street
Sydney NSW 2000
Share Registrar
Link Market Services Limited
Level 12, 680 George Street
Sydney NSW 2000
Telephone: +612 8280 7001 (Australia)
Website: www.linkmarketservice.com.au
ASX/NZX Code: MVT
Fully paid ordinary shares.
For the year ended 30 June 2015
MERCANTILE INVESTMENT COMPANY LIMITED
ABN 15 121 415 576 and Controlled Entities
39