Embed Size (px)
Citation preview

Menu of Indicators on Management and Leadership Capacity Development
Leadership, Management, and Sustainability Program Management Sciences for Health
Monitoring, Evaluation, and Communication Team
2006 The Leadership, Management and Sustainability (LMS) Program is funded by the U.S. Agency for International
Development (USA The Leadership, Management and Sustainability (LMS) Program is funded by the U.S. Agency
for International Development (USAID), under cooperative agreement number GPO-A-00-05-00024-00. ID),
under cooperative agreement number GPO-A-00-05-00024-00.
Funding provided by the U.S. Agency for International Development under the Leadership, Management and Sustainability Program, cooperative agreement number GPO-A-00-05-00024-00. The information provided in this document is not official U.S. Government information and does not represent the views or positions of the U.S. Agency for International Development or the U.S. Government.

TABLE OF CONTENTS
Introduction.......................................................................................................................................................................... 1
How to Use This Menu ...................................................................................................................................................... 1
How the Menu is Organized.............................................................................................................................................. 2
Additional Indicator References........................................................................................................................................ 3
Selecting Indicators.............................................................................................................................................................. 4
Features of a Good Indicator ............................................................................................................................................ 5
Interpretation of Responses ............................................................................................................................................... 6
1) INDICATORS OF ORGANIZATIONAL MANAGEMENT CAPACITY..........................................7 1.1 INDICATORS FOR INDIVIDUAL MANAGEMENT SYSTEMS ................................................................. 7 1.1.1 Planning................................................................................................................................................................ 8
Indicator: A clear mission statement exists .................................................................................................................... 8
Indicator: The mission statement is understood and applied by staff, partners, and client organizations........... 9
Indicator: A clear statement of values exists ................................................................................................................ 10
Indicator: The statement of values is understood and applied by staff, partners, and client organizations ......11
Indicator: A well-aligned strategic plan exists and is disseminated........................................................................... 12
Indicator: The current strategic plan was developed with broad staff participation.............................................. 13
Indicator: The strategic plan has a performance monitoring plan with clear targets and indicators .................. 14
Indicator: An annual operational plan exists for the current year ............................................................................ 15
Indicator: The annual operational plan is used to monitor activities and outputs ................................................. 16
Indicator: An evaluation plan exists that is aligned with the goals of the annual operational plan..................... 17
Indicator: Percent of organizational planning units using MIS data as a basis for annual input/output projections........................................................................................................................................................................... 18
Indicator: Percent of annual objectives achieved by the organization ..................................................................... 19
Indicator: Availability of logical and explicit organizational structure ..................................................................... 20
1.1.2 Human Resource Management ...................................................................................................................... 21
Indicator: The organization has an adequate number of experienced human resource staff............................... 21
Indicator: A current human resource plan exists......................................................................................................... 22
Indicator: Human resource activities are carried out according to the current human resource plan................ 23
Indicator: An organizational chart exists, is current, and has been disseminated to staff .................................... 24
Indicator: A personnel policy manual exists and is accessible to all staff................................................................ 25
Indicator: Managers and supervisors consistently use the personnel policy manual to resolve staff personnel issues .................................................................................................................................................................................... 26
Indicator Menu October 2006 ii

Indicator: An employee data system exists and is regularly updated........................................................................ 27
Indicator: An employee data system is used for human resource planning ............................................................ 28
Indicator: A performance management system exists and includes all essential components............................. 29
Indicator: Percent of employees who have completed their annual performance reviews with their supervisors for the last performance period. ...................................................................................................................................... 30
Indicator: Written guidelines for the performance planning and review processes exist...................................... 31
Indicator: Percent of supervisors trained in how to use guidelines for supervision and performance review..32
Indicator: A financially feasible staff training plan exists for the current fiscal year ............................................. 33
Indicator: The staff training plan is monitored for effectiveness ............................................................................. 34
Indicator: Percent of staff who have up-to-date job descriptions ............................................................................ 35
Indicator: Lines of supervision are documented in job descriptions ....................................................................... 36
Indicator: Communication mechanisms are used to share information across organizational units and among staff at different levels. ...................................................................................................................................................... 37
Indicator: Procedures for the identification, hiring, and supervision of consultants exist ................................... 38
Indicator: A written HIV/AIDS workplace policy exists, is disseminated, and is updated regularly. ................ 39
Indicator: Percent of service delivery points visited by a trained supervisor .......................................................... 40
Indicator: Percent of service delivery points receiving a feedback report............................................................... 41
Indicator: Percent of key positions filled ...................................................................................................................... 42
Indicator: Staff turnover rate .......................................................................................................................................... 43
1.1.3 Management Information................................................................................................................................ 44
Indicator: Organizational units collect data reflecting health status, services provided, and the use of human, material, and financial resources...................................................................................................................................... 45
Indicator: Organizational units submit required routine MIS reports on time....................................................... 46
Complementary Indicator: MIS reports are received and filed in the appropriate organizational office........... 47
Indicator: Percent of data elements reported accurately in MIS reports .................................................................. 48
Indicator: Organizational units systematically use information to plan and monitor performance.................... 49
Indicator: A surveillance and outbreak control task checklist exists ........................................................................ 50
Indicator: Percent of health centers that perform surveillance and outbreak control tasks as measured by a checklist ............................................................................................................................................................................... 51
1.1.4 Quality Assurance ............................................................................................................................................. 52
Indicator: A system for quality assurance has been institutionalized ........................................................................ 52
1.1.5 Financial and Resource Management Systems............................................................................................. 54
Indicator: The accounting system generates regular reports tracking expenditures against the budget and noting variances.................................................................................................................................................................. 54
Indicator Menu October 2006 iii
Indicator: The budget is linked to the annual operational plan for the current year ............................................. 55
Indicator: The financial management system produces accurate, timely information on expenditures............. 56
Indicator: The information gained from the financial management system is used to make management decisions .............................................................................................................................................................................. 57
Indicator: Percent of regions/provinces/districts/municipalities using planning and budgeting procedures to strengthen service delivery performance........................................................................................................................ 58
Indicator: The organization prepares budgets using Activity Based Costing (ABC). ............................................. 59
Indicator: The organization prepares monthly financial reports using Activity Based Costing (ABC). .............. 60
1.1.6 Logistics Management...................................................................................................................................... 61
Indicator: Percent of facilities that experience stockouts of essential drugs and FP commodities ..................... 62
Indicator: Recorded stock inventory levels are consistent with actual levels.......................................................... 63
Indicator: Percent of unexpired index drugs/commodities available at service delivery points.......................... 64
Indicator: Average percent time out of stock for a set of indicator drugs .............................................................. 65
Indicator: Percent improvement in the availability of drugs, contraceptives, and related medical surgical commodities at the central, provincial, or district health facility level ...................................................................... 66
Indicator: Percent of facilities that maintain acceptable storage conditions ........................................................... 67
Indicator: Percent of average international price paid for last regular procurement of index drugs, commodities, and supplies................................................................................................................................................ 68
Indicator: Percent of clinics and health centers that experience deceasing stock-outs of essential drugs or other supplies...................................................................................................................................................................... 69
Indicator: Inventory records are accurate and up-to-date.......................................................................................... 70
1.1.7 Monitoring and Evaluation System................................................................................................................ 71
Indicator: Organization has developed performance monitoring plans with clear targets and process and impact indicators for each of the technical areas.......................................................................................................... 71
Indicator: Organization regularly collects monitoring data from all grantees.......................................................... 72
Indicator: Organization regularly prepares and disseminates progress reports. ...................................................... 73
2) INDICATORS OF WORK GROUP AND ORGANIZATIONAL LEADERSHIP CAPACITY.......74 2.1 INDICATORS FOR LEADERSHIP DEVELOPMENT AT THE WORK GROUP LEVEL ... 75
Scanning............................................................................................................................................................................. 75
Indicator: The work group can provide valid and relevant evidence about the nature of its internal and external environment, the quality and extent of its performance, the resources available on best practices and can identify challenges within and facing the team. ..................................................................................................... 75
Focusing ............................................................................................................................................................................ 77
Indicator: The work group has identified priority challenges and selected actions that address barriers to achieving results ................................................................................................................................................................. 77
Indicator Menu October 2006 iv
Aligning and Mobilizing ............................................................................................................................................... 79
Indicator: Work group responsibilities and resources are internally aligned and work group goals are externally aligned in order to address selected challenges and meet stated objectives ........................................... 79
Inspiring............................................................................................................................................................................. 81
Indicator: The work groups is committed to the organization’s mission and to continuous learning, improvement and innovation........................................................................................................................................... 81
2.2 INDICATORS FOR LEADERSHIP DEVELOPMENT AT THE ORGANIZATIONAL LEVEL83
Developing Future Leaders from Within................................................................................................................. 83
Indicator: A deliberate process is used to identify and develop potential leaders from within the organization............................................................................................................................................................................................... 83
Organizational Coaching/ Mentoring Practices................................................................................................... 84
Indicator: The organization uses a process of coaching and mentoring to support the development of potential leaders.................................................................................................................................................................. 84
2.3 INTERMEDIATE INDICATORS FOR LEADERSHIP DEVELOPMENT....................................... 85
Workgroup Climate ........................................................................................................................................................ 85
Indicator: Work groups experience their climate as positive..................................................................................... 85
Employee Satisfaction ................................................................................................................................................... 89
Indicator: Employees express satisfaction with key aspects of their work.............................................................. 89
Indicator: Percent of plans to address work climate that are successfully completed........................................... 91
3) INDICATORS OF ORGANIZATIONAL SUSTAINABILITY.........................................................92 3.1 PLANNING FOR SUSTAINABILITY.......................................................................................................... 93
Indicator: A business plan exists and accurately projects revenue............................................................................ 93
Indicator: The organization has a contingency plan in anticipation of external shocks........................................ 94
Indicator: The organization has a manual for institutional marketing ..................................................................... 95
Indicator: Indicators exist and are defined for monitoring the market, competition, and sales value................ 96
3.2 FINANCIAL SUSTAINABILITY.................................................................................................................... 97
Indicator: The organization uses diversified funding sources to support its programs ........................................ 97
Indicator: Percent of annual revenues generated from diverse sources................................................................... 98
Indicator: Percent of the annual operating budget that is partly covered by income generated through service delivery................................................................................................................................................................................. 99
Indicator: Organization has submitted at least one proposal for external funding within the last 12 months ...............................................................................................................................................................................100
3.3 CAPACITY TO INCREASE SUSTAINABILITY THROUGH INVOLVEMENT IN NATIONAL POLICY PROCESSES AND STRATEGIC PARTNERSHIPS ...........................................................................101
Indicator Menu October 2006 v

Indicator: The organizational leadership ensures that relevant external policy issues are included in discussions on organizational strategy ..........................................................................................................................101
Indicator: Input provided by the organization has been considered in the design of health policy at broader levels...................................................................................................................................................................................102
Indicator: The organization’s strategic plan includes partnership objectives and outlines steps needed for their achievement. .....................................................................................................................................................................103
Indicator: The organization has signed at least one partnership agreement during the past year, in accordance with its organizational objectives...................................................................................................................................104
4) PROGRAM SPECIFIC INDICATORS ............................................................................................ 105 3.4 The remaining sections provide indicators for specific programs offered by LMS or MSH, such as the Virtual Leadership Development Program, the Business Planning Program for Health, the Management Organizational Sustainability Tool, or different virtual networks and programs. .................................................105
3.4 .......................................................................................................................................................................................106
4.1 LMS PROGRAM PERFORMANCE MONITORING PLAN INDICATORS .....................................106
4.2 USAID OFFICE OF POPULATION/REPRODUCTIVE HEALTH INDICATORS ...........110
Indicator: Percent of Leadership Development Program (LDP) or Virtual Leadership Development Program (VLDP) teams that have made progress in achieving their desired performance according to indicators in their action plans within six months of completing the program. ....................................................................................112
Indicator: Percent of Leadership Development Program (LDP) or Virtual Leadership Development Program (VLDP) teams reporting improved integration, collaboration, and communication immediately following the program and after 6 months of completing the program. ........................................................................................113
Indicator: Percent of teams that experience an increase in Work Climate Assessment (WCA) scores at the conclusion of the LDP or VLDP..................................................................................................................................114
Indicator: Total number of facilitators trained for the Leadership Development Program (LDP) or Virtual Leadership Development Program (VLDP). ..............................................................................................................115
4.4 ELECTRONIC NETWORKS AND COMMUNITIES .....................................................................116
Indicator: Number of network members actively participating in network activities or events........................116
Indicator: Percent of network members sharing information, tools, resources, and best practices with each other ...................................................................................................................................................................................117
Indicator: Number of network members applying and adopting best practices in leadership and management acquired through the network........................................................................................................................................118
Indicator: Total number of new members who have joined the networks within the past year. .......................119
4.5 TECHNICAL COOPERATION NETWORK ......................................................................................120
Indicator: Total number of new business opportunities (grant, consultancy, contract) available to the Technical Cooperation Network by number and type of donors and clients........................................................120
Indicator: Number and type of alternative forms of funding obtained by the Technical Cooperation Network..............................................................................................................................................................................................121
Indicator: Technical Cooperation Network finances are managed by the Technical Cooperation Network...122
Indicator Menu October 2006 vi

Indicator: Number of new internal partnerships formed by the Technical Cooperation Network members. 123
Indicator: Number of new external partnerships formed by the Technical Cooperation Network. .................124
Indicator: Number and type of new tools made available to members through the Technical Cooperation Network.............................................................................................................................................................................125
Indicator: Number and type of tools available through the Technical Cooperation Network that are used by members of the Technical Cooperation Network......................................................................................................126
4.6 BUSINESS PLANNING PROGRAM FOR HEALTH......................................................................127
Indicator: Percent of organizations that produce a business plan meeting the criteria of a sound business plan..............................................................................................................................................................................................127
Indicator: Percent of a business plan that is completely or partially funded within 6-12 months of program completion ........................................................................................................................................................................128
Indicator: A new product or service is launched as outlined in the business plan within 12 months of securing funding...............................................................................................................................................................................129
Indicator: Number of program replications using the Business Planning Program for Health in any period following completion of the first program. .................................................................................................................130
Indicator: Number of times a program partner offers the Business Planning Program for Health. ................131
4.7 MANAGEMENT AND ORGANIZATIONAL SUSTAINABILITY TOOL (MOST).......................................132
Indicator: A MOST action plan is developed and the participating organization has made progress implementing the plan within 6-12 months following the workshop. ....................................................................132
4.8 RESPONSIBILITY AND AUTHORITY MAPPING PROCESS (RAMP) .................................133
Indicator: A RAMP action plan is developed and the government institution(s) has made progress implementing the plan within 6-12 months following RAMP’s application..........................................................133
APPENDIX A: LEADING AND MANAGING FRAMEWORK ......................................................... 134 REFERENCES ...................................................................................................................................... 135
Indicator Menu October 2006 vii
Introduction Monitoring and evaluation are fundamental management practices essential to improving performance of program planning, management, and implementation, to identifying and documenting results, and to contributing to knowledge exchange. To underscore this importance, LMS has fully integrated monitoring and evaluation into its planning processes as well as routine systems for technical support in the field. This Menu was originally developed under the Management and Leadership (M&L) Program in 2003. It has been revised to include additional indicators validated during the implementation of the M&L Program and developed to monitor LMS program performance. How to Use This Menu The Menu is recommended for use at the earliest stages of program design and planning, when thinking of indicators can be a valuable aid in defining expected outcomes and outputs of activities. The proposed indicators focus on the extent to which performance objectives or results are reached. The indicators may be applied to or adapted for different organizational levels within a health system: from local service delivery points to broader organizational structures at local, regional or national levels. At the heart of any evaluative activity lies the indicator, which provides evidence that the desired performance improvement has actually occurred. The purpose of this Menu is to serve as a reference tool to guide the selection of indicators in the areas of management and leadership capacity development. The Indicator Menu offers examples that can be adapted to the specific circumstances of users. Intended users are LMS program managers and technical staff, including LMS partners, and by extension, their clients. The indicators may well have wider application, but they do correspond to MSH’s “Leading and Managing for Results Model” (see page 4) and its “Leading and Managing Framework” (see Appendix A). LMS has tried to identify indicators that can be measured using information readily available from the client organization's currently existing data sources, such as routine management information systems (MIS), financial management systems, routine organizational documents, on-going surveys, etc. Occasionally it may be necessary to select an indicator that would be measured by quantitative or qualitative methods not routinely used by the client. In that case, special data collection tools should be designed and developed with the client and incorporated into the client institution's ongoing monitoring and evaluation processes. There are two approaches to measuring management and leadership capacity within health programs. The first approach is to use a set of criteria based on national or international norms and standards. The second approach is to develop indicators from actual experience with health programs in developing countries, rather than from rigid standards that are applied internationally. The indicators in this menu were developed using the second approach, drawing on MSH's decades of experience working with health organizations in developing countries. The Monitoring, Evaluation, and Communications (MEC) Team of the LMS Program is prepared to coordinate closely with country and sub-project teams to facilitate the process of selection and adaptation of appropriate indicators.
Indicator Menu October 2006 1

How the Menu is Organized The Menu is organized into four sections: Indicators of Organizational Management Capacity Within this section there are sub-sections corresponding to management components defined by MSH as essential internal systems for effective organizational performance: planning (includes mission, strategy, and structure), human resource management, management information system, quality assurance, financial and resource management, logistics management, and monitoring and evaluation system. The indicators in this section cover both the immediate outcome of a given intervention, such as the existence of a management procedure or practice, and its use. Indicators of Organizational and Work Group Leadership Capacity Within this section there are sub-sections corresponding to immediate and intermediate results of leadership capacity development at the work group and organizational levels. MSH measures results of leadership capacity development at the team, not the individual, level. Moreover, MSH believes there is a common set of leadership practices that can be developed and used by managers and workgroup members at any level of an organization to address their workplace challenges. These are the four key leading practices: scan, focus, align and mobilize, and inspire. The ability of a team to apply these leadership practices in the workplace is the immediate result (output) of a leadership development process. These indicators attempt to measure the extent to which workgroups engage in these practices as a matter of organizational routine, no matter what specific challenges they may face. The indicators are designed as a simple self-assessment tool that a team can apply periodically to monitor its use of the leading practices. At the organizational level, there are indicators to measure the extent to which an organization routinely addresses and supports ongoing leadership capacity building. The primary team-level intermediate result of leadership capacity development is workgroup climate, defined as the prevailing workplace atmosphere that is experienced by the members of a given workgroup. Workgroup climate is an outcome measure that is sensitive to change as a result of a leadership development process involving managers and their teams. Indicators of Organizational Sustainability This section provides indicators that go beyond organizational and work group capacity at the operational level to organizational performance in the face of change, internal and external change being the greatest test of organizational sustainability from the perspectives of managerial and financial capacities. Program Specific Indicators This section focuses on indicators directly related to the LMS Program. The first sub-section provides the list and definitions of process indicators from the LMS Program Performance Monitoring Plan (PMP). The second section provides a selection of indicators from the USAID Office of Population/Reproductive Health that are relevant for reporting on LMS program and project activities. The remaining sections provide specific, validated indicators that may be used to measure the immediate and longer term results of technical approaches and tools used to develop management and leadership capacity (e.g., the Virtual Leadership Development Program, the Management and Organizational Sustainability Tool) as well as mechanisms to scale-up knowledge and use of leadership and management practices (e.g., networks and communities of practice).
Indicator Menu October 2006 2
Additional Indicator References Recognizing that improved management and leadership capacity is a means to the goal of improved health service delivery, this Menu does not include measurement indicators at the service delivery and health outcome levels since there are many indicator reference materials widely available from MEASURE Evaluation, WHO, and for HIV/AIDS programs, from PEPFAR. The challenge and objective of this Menu is to provide indicators that measure immediate and intermediate results of technical support interventions in management and leadership capacity development that we consider prerequisites to the improved potential of serving the health needs of target populations.
The following indicator reference materials are available in the LMS Monitoring, Evaluation and Communications e-Room at: http://eroom.msh.org/eRoom/L/SD4
Indicators for Management and Leadership Strengthening of Programs Funded by the Global Fund for AIDS, Tuberculosis, and Malaria, LMS, 2006 Compendium of Indicators for Evaluating Reproductive Health Programs, Measure Evaluation, 2002 Compendium of Indicators for TB Programs, Stop TB Partnership, 2004 Emergency Plan Indicators Guide, PEPFAR, July 2005 Monitoring and Evaluation Toolkit: HIV, TB and Malaria, WHO et al., January 2006 A Guide for Monitoring and Evaluating Child Health Programs, Measure Evaluation, WHO, et al., September 2005 Handbook of Democracy and Governance Program Indicators, USAID, 1998
Additional indicator reference materials will be added to this e-Room as they become available. For example, a USAID-CA Task Force, in which LMS participates, is preparing a “Guide to Monitoring and Evaluating Information Products and Services” which may be published later this year.
Indicator Menu October 2006 3

Selecting Indicators The process of selecting indicators can be daunting, especially where context and outcomes are complex, as is often the case in the field of social development. It is important to keep in mind that indicators are not intended to provide “scientific proof” or exhaustive descriptions of the targeted organizational performance or behavior. As the UNDP puts it, indicators are “signposts of change along the path to development.” The essential challenge in selecting indicators is to find measures that can meaningfully capture key changes – combining what is substantively relevant with what is practical and realistic.1 Because the process of selecting indicators can help define and clarify what one hopes to achieve, it should be associated as closely as possible with the design and planning process. And it should use a team approach involving as many stakeholders as is feasible. Indicators that are not thoroughly grounded in the context and objectives of the project, representing all relevant perspectives, are not likely to render the desired credibility with stakeholders. Indicators can signal change at different points in a project’s implementation or performance improvement process, from inputs and activities to outputs and outcomes. The critical indicators are clearly those that measure performance change. In LMS, we distinguish between the immediate outcomes of technical support (improved management systems, workgroup climate, ability to manage change) and the longer term performance outcomes in organizational ability to deliver improved health services. The following diagram of the Leading and Managing Results Model highlights the three critical areas selected for performance measurement: management systems, workgroup climate, and an improved capacity to respond to, and self-sustain within, changing environments. These are the three Intermediate Results (IRs) of the LMS Program. While the three IR domains are presented separately in the sections of this Menu, it is important to remember that they are highly interlinked in non-linear ways. Attempts to isolate them during the implementation of activities will be forcing an artificiality that is not intended by the model.
1 United Nations Development Program, Handbook on Monitoring and Evaluating for Results, (New York: Evaluation Office, 2001)
Indicator Menu October 2006 4
Features of a Good Indicator Standard features of a good indicator are widely accepted in the development community. Below is a list of features drawn up by the World Health Organization (WHO) that is most relevant and critical to our needs. A good indicator:
• Actually measures the phenomenon it is intended to measure (valid) • Produces the same results when used more than once to measure precisely the same
phenomenon (reliable) • Pertains to the final outcomes, objectives, and results sought (relevant) • Measures only the phenomenon intended to be measured (specific, clear) • Reflects changes in the state of the phenomenon under examination (sensitive) • Requires only data and resources which are readily available (economical) • Is measurable or quantifiable with developed and tested definitions and reference
standards (operational) • Requires data that can be rapidly collected, with relative ease (timely, time-bound) • Acts as a measure of progress toward specified process goals (useful) • Is simple to define and its value easy to interpret (understandable) • Uses data that are already available or relatively easy to acquire by feasible methods that
have been validated in field trials (accessible)
Corresponding questions that help to guide the development of an indicator include: • What am I counting or measuring? • Are there a numerator and denominator I can identify? • If I were displaying this information, what would it look like in a graph or table? • Is the indicator oriented toward the targeted results (objective) and is it at the right level (process, output,
outcome)? • How available is the information, at what frequency, and from what sources? And what is the quality of
the data available? • How responsive to change is the indicator? The indicators selected for this menu range from very tangible and measurable observations, such as documented outputs, to qualitative assessments of less tangible behaviors, attitudes and practices, to descriptions of more comprehensive concepts, such as quality assurance. While the application of many indicators in this menu is straightforward, some, especially among those in the last two latter categories, may require the support of an evaluator who is well-versed in the subject matter.
Indicator Menu October 2006 5
Interpretation of Responses
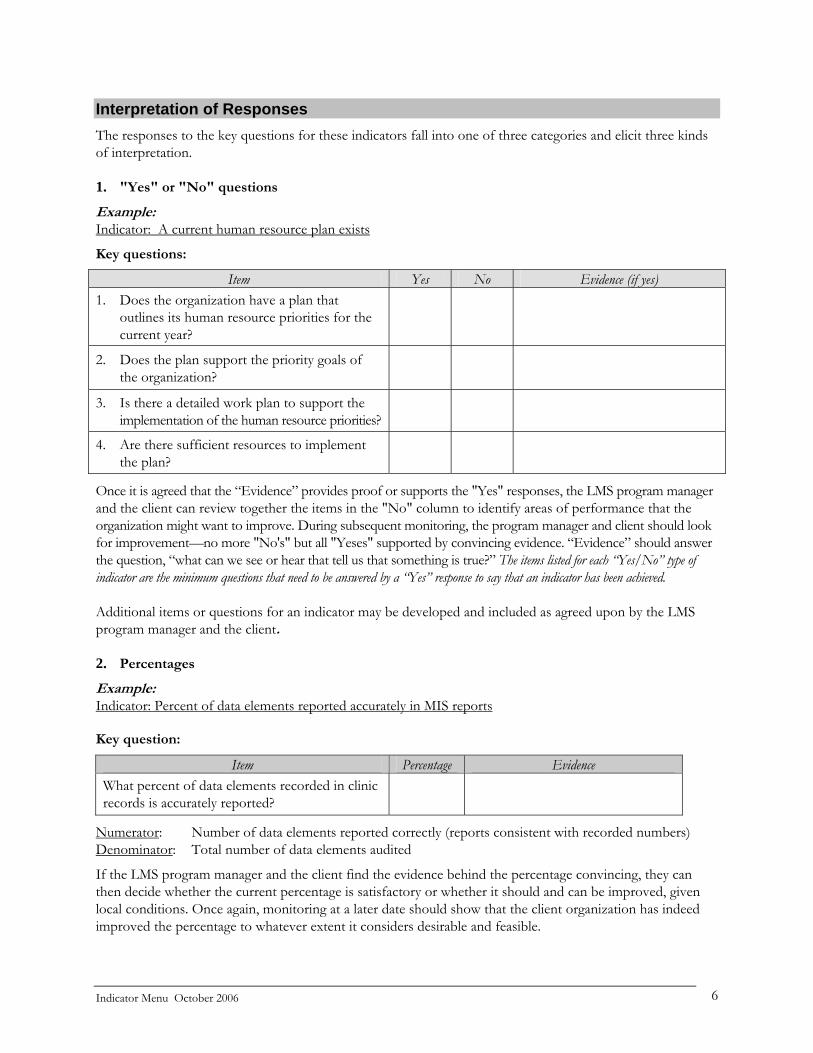
The responses to the key questions for these indicators fall into one of three categories and elicit three kinds of interpretation. 1. "Yes" or "No" questions
Example: Indicator: A current human resource plan exists
Key questions:
Item Yes No Evidence (if yes) 1. Does the organization have a plan that
outlines its human resource priorities for the current year?
2. Does the plan support the priority goals of the organization?
3. Is there a detailed work plan to support the implementation of the human resource priorities?
4. Are there sufficient resources to implement the plan?
Once it is agreed that the “Evidence” provides proof or supports the "Yes" responses, the LMS program manager and the client can review together the items in the "No" column to identify areas of performance that the organization might want to improve. During subsequent monitoring, the program manager and client should look for improvement—no more "No's" but all "Yeses" supported by convincing evidence. “Evidence” should answer the question, “what can we see or hear that tell us that something is true?” The items listed for each “Yes/No” type of indicator are the minimum questions that need to be answered by a “Yes” response to say that an indicator has been achieved. Additional items or questions for an indicator may be developed and included as agreed upon by the LMS program manager and the client. 2. Percentages
Example: Indicator: Percent of data elements reported accurately in MIS reports Key question:
Item Percentage Evidence What percent of data elements recorded in clinic records is accurately reported?
Numerator: Number of data elements reported correctly (reports consistent with recorded numbers) Denominator: Total number of data elements audited
If the LMS program manager and the client find the evidence behind the percentage convincing, they can then decide whether the current percentage is satisfactory or whether it should and can be improved, given local conditions. Once again, monitoring at a later date should show that the client organization has indeed improved the percentage to whatever extent it considers desirable and feasible.
Indicator Menu October 2006 6
1) INDICATORS OF ORGANIZATIONAL MANAGEMENT CAPACITY
1.1 INDICATORS FOR INDIVIDUAL MANAGEMENT SYSTEMS The indicators in this section focus on each of the following management systems:
• Planning • Human Resource Management • Management Information System • Quality Assurance • Financial and Resource Management • Logistics • Monitoring and Evaluation
Indicators are provided for two levels: a) existence of a process or procedure, and b) its use or application.
Indicator Menu October 2006 7

1.1.1 Planning Indicator: A clear mission statement exists Definition of terms: “An organization’s mission is its purpose, the reason it exists. The mission provides guidance, consistency, and meaning to decisions and activities at all levels.”2
Purpose for tracking indicator: This indicator measures the existence of a clear sense of direction in the form of a written mission statement. Having a clear mission statement facilitates strategic thinking about organizational priorities such as client needs. While organizations without a formal mission statement may perform effectively, a mission statement helps to keep staff focused on the accomplishment of long-term objectives and gives the organization a sense of identity. Although the basic mission of an organization may remain the same for an extended period, the language of the mission statement must provide a clear focus and a priority for organizational strategies and activities. It should also be reviewed periodically with staff to verify its continued relevance to organizational goals and values and to the external environment.
Key questions:
Item Yes No Evidence (if yes)
1. Does an organizational mission statement exist?
If so: 2. Does it define the organization’s purpose?
3. Does it define organization’s intended clients?
4. Is it reviewed periodically (e.g., during the past 12 months) to assure that it provides a vision for the future and continues to reflect fundamental organizational goals and values?
Proposed data sources: Organizational documents including plans, staff orientation materials, policy manuals and statements, and marketing materials
Frequency of measure: Annually
2 Management Sciences for Health, Management and Organizational Susatinibility Tool: A Guide for Users and Facilitators, 2nd edition (Boston: Management Sciences for Health, 2004), 4.
Indicator Menu October 2006 8

Indicator: The mission statement is understood and applied by staff, partners, and client organizations Definition of terms: “Understood and applied” means that staff, partners and clients can explain the mission statement and use it to guide their work.
Purpose of tracking indicator: It is important for the mission statement to guide the work of the organization in planning, developing strategies, and forming partnerships.
Key questions:
Item Yes No Evidence (if yes)
1. Can staff explain the mission statement?
2. Is the mission statement used in proposal development?
3. Is the mission statement used to develop strategy?
Proposed data sources: Review of proposals, strategic plans, and marketing materials; interviews with staff Frequency of measure: Annually
Indicator Menu October 2006 9

Indicator: A clear statement of values exists Definition of terms: A “statement of values” is a written document that defines the ethical principles of an organization. “Values” “are the beliefs and ethical principles that underlie [an organization’s] mission. These values give meaning to an organization’s work and form the basis of staff commitment.”3
Purpose for tracking indicator: This indicator measures the existence of a clear set of principles to guide staff behavior and attitudes.
Key questions:
Item Yes No Evidence (if yes)
1. Does a values statement exist?
If so: 2. Does it define organization’s values and ethical principles?
Proposed data sources: Organizational/program documents including plans, staff orientation materials, policy manuals and statements, and marketing materials
Frequency of measure: Annually
3 Management Sciences for Health, Management and Organizational Susatinibility Tool: A Guide for Users and Facilitators, 2nd edition (Boston: Management Sciences for Health, 2004), 4.
Indicator Menu October 2006 10

Indicator: The statement of values is understood and applied by staff, partners, and client organizations Definition of terms: A “statement of values” is a written document that defines ethical principles of an organization. “Understood and applied” means that staff, partners and clients can explain the statement of values and use it to guide their work.
Purpose of tracking indicator: It is important for the values statement to guide employees’ conduct.
Key questions:
Item Yes No Evidence (if yes)
1. Can staff explain the statement of values?
2. Do staff frequently cite the organizations’ values?
3. Are the organizations’ values reflected in the conduct (i.e., behavior, attitude) of its employees?
Proposed data sources: Interviews with staff Frequency of measure: Annually
Indicator Menu October 2006 11
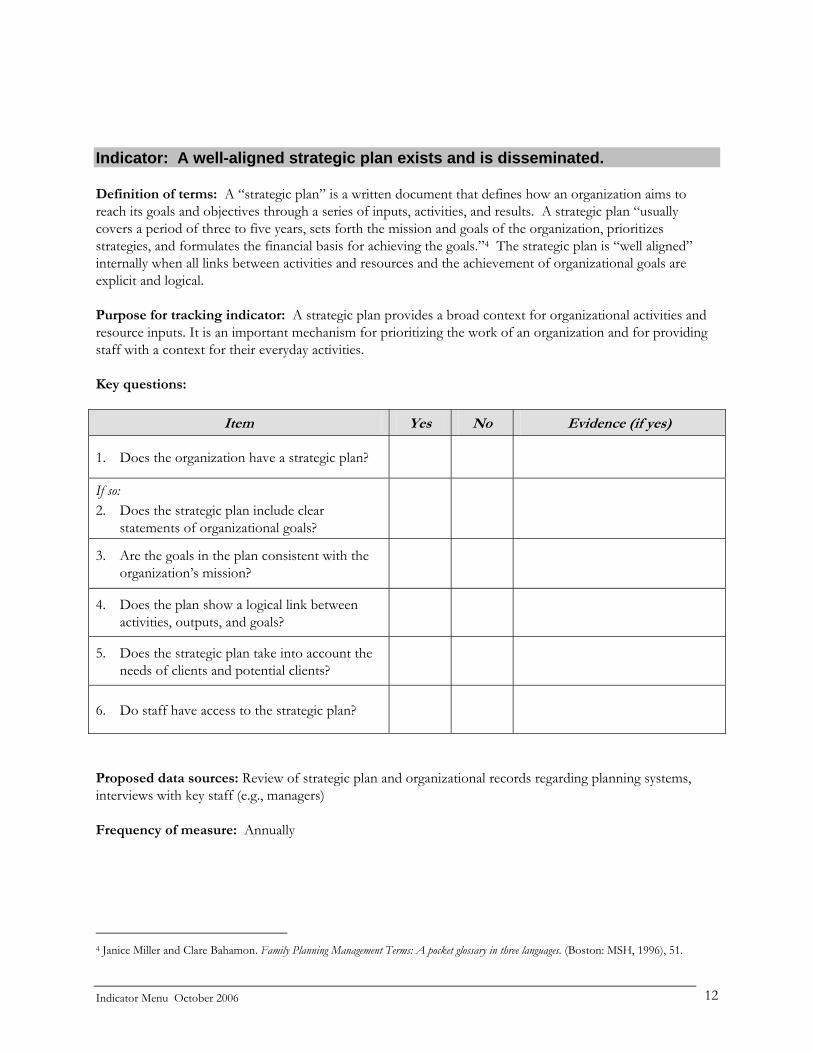
Indicator: A well-aligned strategic plan exists and is disseminated.
Definition of terms: A “strategic plan” is a written document that defines how an organization aims to reach its goals and objectives through a series of inputs, activities, and results. A strategic plan “usually covers a period of three to five years, sets forth the mission and goals of the organization, prioritizes strategies, and formulates the financial basis for achieving the goals.”4 The strategic plan is “well aligned” internally when all links between activities and resources and the achievement of organizational goals are explicit and logical.
Purpose for tracking indicator: A strategic plan provides a broad context for organizational activities and resource inputs. It is an important mechanism for prioritizing the work of an organization and for providing staff with a context for their everyday activities.
Key questions:
Item Yes No Evidence (if yes)
1. Does the organization have a strategic plan?
If so: 2. Does the strategic plan include clear
statements of organizational goals?
3. Are the goals in the plan consistent with the organization’s mission?
4. Does the plan show a logical link between activities, outputs, and goals?
5. Does the strategic plan take into account the needs of clients and potential clients?
6. Do staff have access to the strategic plan?
Proposed data sources: Review of strategic plan and organizational records regarding planning systems, interviews with key staff (e.g., managers) Frequency of measure: Annually
4 Janice Miller and Clare Bahamon. Family Planning Management Terms: A pocket glossary in three languages. (Boston: MSH, 1996), 51.
Indicator Menu October 2006 12

Indicator: The current strategic plan was developed with broad staff participation Definition of terms: "Broad participation" means that all units of the organization and staff at different levels contributed to the development of the current strategic plan. Purpose of tracking indicators: Broad participation is important to ensuring that there is buy-in and commitment to the strategic plan by all staff responsible for its implementation. Key questions:
Item Yes No Evidence (if yes)
1. During the development of the current strategic plan, did the organization ensure the participation of staff at all levels?
2. Was their input taken into account?
Proposed data sources: Group and individual interviews with staff; minutes of staff meetings that dealt with strategic planning Frequency: Every 3–5 years
Indicator Menu October 2006 13
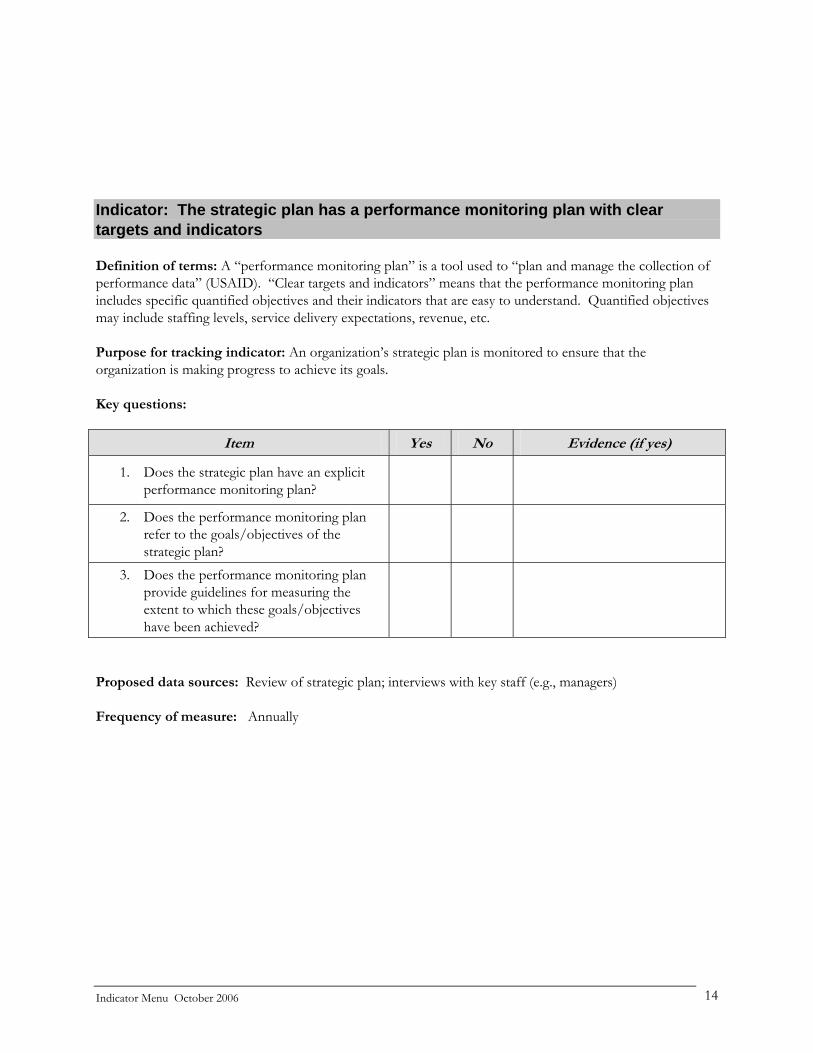
Indicator: The strategic plan has a performance monitoring plan with clear targets and indicators
Definition of terms: A “performance monitoring plan” is a tool used to “plan and manage the collection of performance data” (USAID). “Clear targets and indicators” means that the performance monitoring plan includes specific quantified objectives and their indicators that are easy to understand. Quantified objectives may include staffing levels, service delivery expectations, revenue, etc. Purpose for tracking indicator: An organization’s strategic plan is monitored to ensure that the organization is making progress to achieve its goals.
Key questions:
Item Yes No Evidence (if yes)
1. Does the strategic plan have an explicit performance monitoring plan?
2. Does the performance monitoring plan refer to the goals/objectives of the strategic plan?
3. Does the performance monitoring plan provide guidelines for measuring the extent to which these goals/objectives have been achieved?
Proposed data sources: Review of strategic plan; interviews with key staff (e.g., managers)
Frequency of measure: Annually
Indicator Menu October 2006 14
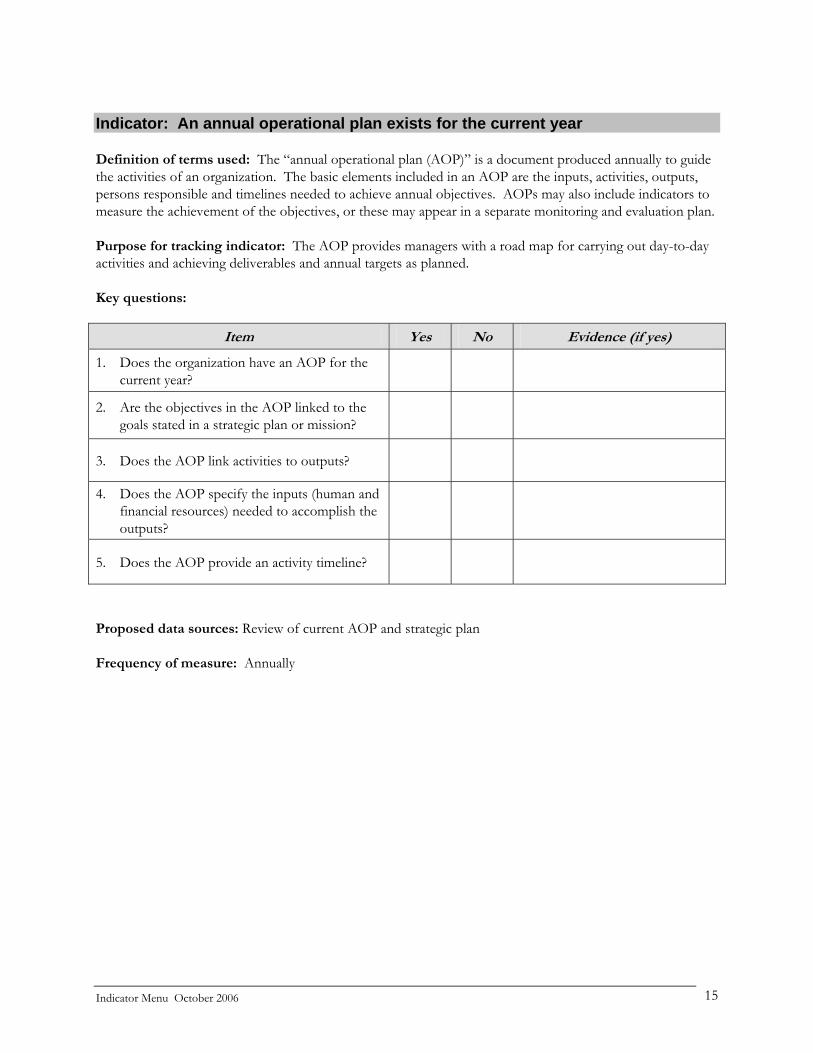
Indicator: An annual operational plan exists for the current year
Definition of terms used: The “annual operational plan (AOP)” is a document produced annually to guide the activities of an organization. The basic elements included in an AOP are the inputs, activities, outputs, persons responsible and timelines needed to achieve annual objectives. AOPs may also include indicators to measure the achievement of the objectives, or these may appear in a separate monitoring and evaluation plan.
Purpose for tracking indicator: The AOP provides managers with a road map for carrying out day-to-day activities and achieving deliverables and annual targets as planned.
Key questions:
Item Yes No Evidence (if yes)
1. Does the organization have an AOP for the current year?
2. Are the objectives in the AOP linked to the goals stated in a strategic plan or mission?
3. Does the AOP link activities to outputs?
4. Does the AOP specify the inputs (human and financial resources) needed to accomplish the outputs?
5. Does the AOP provide an activity timeline?
Proposed data sources: Review of current AOP and strategic plan
Frequency of measure: Annually
Indicator Menu October 2006 15
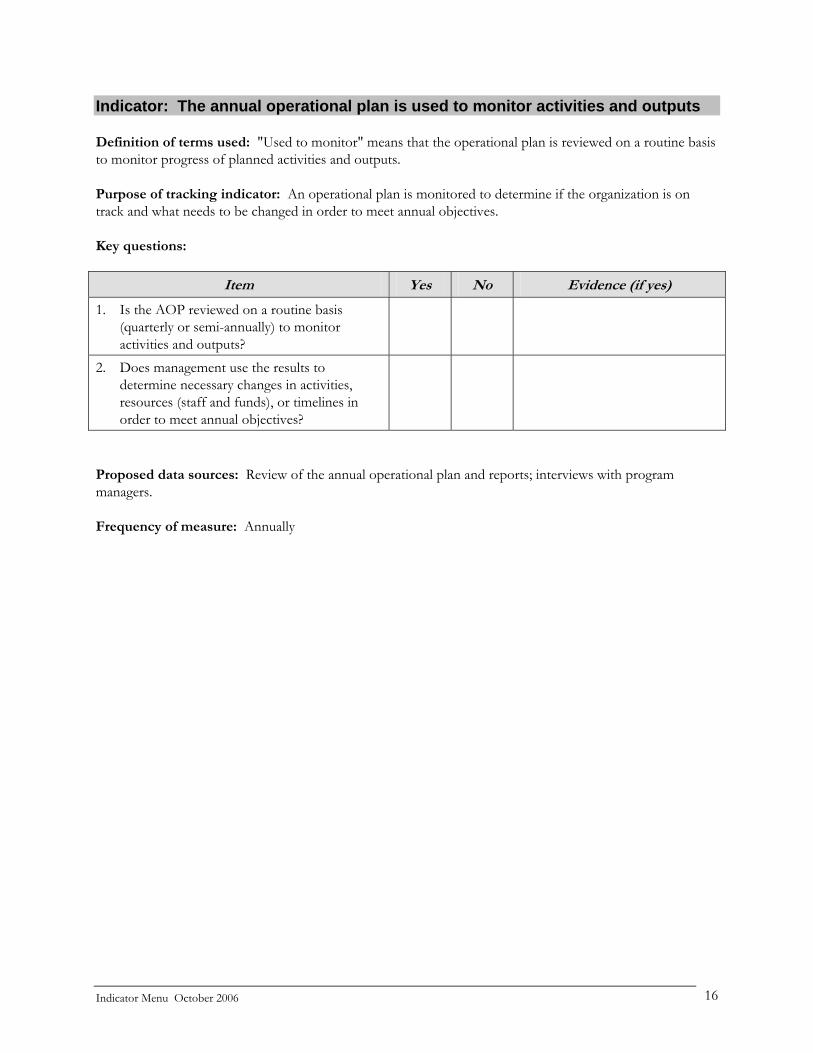
Indicator: The annual operational plan is used to monitor activities and outputs Definition of terms used: "Used to monitor" means that the operational plan is reviewed on a routine basis to monitor progress of planned activities and outputs.
Purpose of tracking indicator: An operational plan is monitored to determine if the organization is on track and what needs to be changed in order to meet annual objectives.
Key questions:
Item Yes No Evidence (if yes)
1. Is the AOP reviewed on a routine basis (quarterly or semi-annually) to monitor activities and outputs?
2. Does management use the results to determine necessary changes in activities, resources (staff and funds), or timelines in order to meet annual objectives?
Proposed data sources: Review of the annual operational plan and reports; interviews with program managers. Frequency of measure: Annually
Indicator Menu October 2006 16

Indicator: An evaluation plan exists that is aligned with the goals of the annual operational plan
Definition of terms used: An “evaluation plan” is a written document, incorporated into the annual operational plan or a separate document that identifies the targets and indicators needed to measure the achievement of annual objectives.
Purpose for tracking indicator: The evaluation plan demonstrates management’s commitment to achieving the goals and objectives and accountability to their stakeholders for expected results. Key questions:
Item Yes No Evidence (if yes)
1. Does the annual plan have an explicit evaluation plan incorporated or attached?
2. Does the evaluation plan refer to the goals/objectives of the annual plan?
3. Does the evaluation plan provide guidelines for measuring the extent to which these goals/objectives have been achieved?
Proposed data sources: Review of the annual operational plan and reports; review of the evaluation plan; interviews with program managers.
Frequency of measure: Annually
Indicator Menu October 2006 17

Indicator: Percent of organizational planning units using MIS data as a basis for annual input/output projections
Note: This indicator is linked to the general indicators for MIS found on pgs 46–48. Definition of terms: “Organizational planning units” are departments or divisions of the organization that are required to submit annual projections for inputs and outputs. They will vary with the sector and the nature of the organization, but might include service delivery points (SDPs), branch, regional and headquarter offices. “Use MIS data” means the review data in routine reports on staffing, service delivery, finances, commodities, etc. as a basis for making input/output projections.
Purpose for tracking indicator: This indicator provides evidence of the extent to which concrete and verifiable data are used as a basis for planning across organizational units.
Key questions:
Item Percentage Evidence
1. What percent of unit managers had access to data for their planning activities during the last planning cycle?
2. What percent of unit managers used MIS data to prepare their annual input/output projections during the last planning cycle?
Proposed measure: Percentage
Numerator: Number of organizational units having access to and using MIS data as a basis for annual plans during the last planning cycle Denominator: Total number of organizational units that prepared annual plans during the last planning cycle.
Proposed data sources: Review of organizational records regarding the planning processes and plans themselves; interviews with managers and MIS staff
Frequency of measure: Annually
Indicator Menu October 2006 18

Indicator: Percent of annual objectives achieved by the organization Definition of terms: Organizations set annual planning objectives at the beginning of the annual planning period and document them in an annual operational plan. Annual objectives should explicitly link to the broader strategic objectives and be achievable within the annual framework. Annual objectives can include quantifiable outputs (e.g., number of HIV clients counseled) to higher-level outcomes involving behavioral or procedural change (e.g., new ways of tapping into funding sources or improved monitoring techniques). For the purposes of this measure, use the plan for the last completed annual or fiscal cycle. Purpose for tracking indicator: This indicator provides a results-oriented measure of organizational performance. The indicator is based on the premise that an overarching measure of good management and leadership is whether or not the organization achieves its stated objectives. This indicator can only provide a general picture of overall functioning of the organization; further in-depth analysis of the reasons for failing to obtain stated objectives is required. Key question:
Item Percentage Evidence
1. What percent of objectives was achieved during the most recently completed annual or fiscal cycle?
Proposed measure: Percentage
Numerator: Number of objectives achieved during the most recently completed annual or fiscal cycle Denominator: Total number of objectives in the plan for the most recent annual or fiscal cycle
Proposed data sources: Annual planning document; organizational strategy or other multi-annual planning document; semi-annual and/or annual progress reports (e.g., to stakeholders); assessment by external evaluator or internal facilitator. Frequency of measure: Annually
Indicator Menu October 2006 19

Indicator: Availability of logical and explicit organizational structure Definition of terms: The structure of an organization refers to the staffing and decision-making framework that assigns personnel according to their authority and level of responsibility. The structure is clearly articulated when it provides clear lines of authority and accountability, distribution of responsibilities, and lines of communication. Purpose for tracking indicator: This indicator measures whether an organization has a clearly defined structure — roles, responsibilities, and authority — both “on paper” and in practice. Evidence can be collected by reviewing whether the organization has:
• An organizational chart (organigram) illustrating authority and communication lines; • A policy manual clearly defining roles and responsibilities for staff (and board members) as well as
the formal system of delegation; • Job descriptions detailing responsibilities and supervisory lines; and • A written, defined process to review the structure periodically to ensure consistency with the
organization’s current strategies. Organizational decision-making processes may or may not conform to those embodied in the formally defined organizational structure. To make this determination, one can assess the appropriateness of staff for the positions they fill and the extent to which they actually make decisions called for in the “formal” document (e.g., by interviewing staff to determine how one or more recent important decisions were made). Key questions:
Item Yes No Evidence (if yes)
1. Does the organization have an organizational chart or equivalent document depicting the organizational structure?
2. Does the organization have a policy manual clearly defining roles and responsibilities for staff (and board members) as well as the formal system of delegation?
3. Do staff have job descriptions detailing responsibilities and supervisory lines?
4. Does the organization have a written, defined process to review the structure periodically to ensure consistency with the organization’s current strategies?
Proposed data sources: Review of organizational documents; interviews with a sample of key personnel. Frequency of measure: Annually
Indicator Menu October 2006 20

1.1.2 Human Resource Management
Indicator: The organization has an adequate number of experienced human resource staff Definition of terms used: “Adequate” means that there are sufficient numbers of staff to manage the human resource functions of the organization. “Experienced” means that these staff have carried out professional responsibilities in the various functions of a human resource management system, i.e., recruitment, hiring, benefits, policy, training. “Authority” means that the human resource staff are consulted on, and have input into, organizational strategy and policy. Purpose for tracking indicator: In order to be effective a human resource management system requires professional staff whose main responsibility is human resources and who have input into organizational decision-making. Key questions:
Item Yes No Evidence (if yes)
1. In this program/organization, are there staff assigned full time with responsibility for HR?
2. Do senior HR staff have professional HR experience?
3. Are the following HR functions fulfilled: recruitment/hiring; compensation; benefits; data tracking systems; performance management and supervision; personnel policy, training and staff development
4. Is there an HR person with authority who has input into organizational decisions?
Proposed data sources: Review of organizational chart (organigram); interviews with human resource staff and other managers Frequency of measure: Annually
Indicator Menu October 2006 21

Indicator: A current human resource plan exists Definition of terms used: “Human resource plan” means a plan for providing the human capacity required to meet the organization's goals. The plan should include objectives and a work plan that support the organizational priorities. These can include both internal and external objectives. An example of an external objective might be: “Recruitment strategies and hiring goals exist for new staff.” Examples of internal objectives might be: “A training plan to update the skills of current staff exists” and “A strategy exists for addressing personnel issues that impact on performance, including compensation and benefits, supervision, data management, and a prevention program for HIV/AIDS in the workplace.” “Current” means the human resource plan supports the goals and objectives defined in the organization's most recent strategic or operational plans. Purpose of tracking indicator: The overall purpose of the human resource plan is to ensure that there are adequate numbers of staff with the right skills in the organization to support the organization’s priority strategies. The plan should be linked to the current organizational goals and contain an implementation plan. Key questions:
Item Yes No Evidence (if yes)
1. Does the organization have a plan that outlines its human resource priorities for the current year?
2. Does the plan support the priority goals of the organization?
3. Is there a detailed work plan to support the implementation of the human resource priorities?
4. Are there sufficient resources to implement the plan?
Proposed data sources: Review of human resource plan or other planning documents, and organizational strategic or operational plan; interviews with human resource staff Frequency of measure: Annually
Indicator Menu October 2006 22

Indicator: Human resource activities are carried out according to the current human resource plan Definition of terms used: “Human resource activities” are activities related to the basic human resource functions. These functions include: recruitment/hiring; compensation; benefits; data tracking systems; performance management and supervision; personnel policy, training and staff development. Purpose of tracking indicator: To determine the extent to which the organization executes its human resource plan. This indicator presupposes the existence of a human resource plan and monitoring procedures. It requires the review of monitoring documents and related evidence. Key questions:
Item Yes No Evidence (if yes)
Are the following activities carried out according to the current human resource plan?
recruitment/hiring
compensation
benefits
data tracking systems
performance management and supervision
personnel policy
training and staff development Proposed data sources: Review of human resource plan; review of human resource records and data; discussions with supervisors and managers Frequency of measure: Annually
Indicator Menu October 2006 23
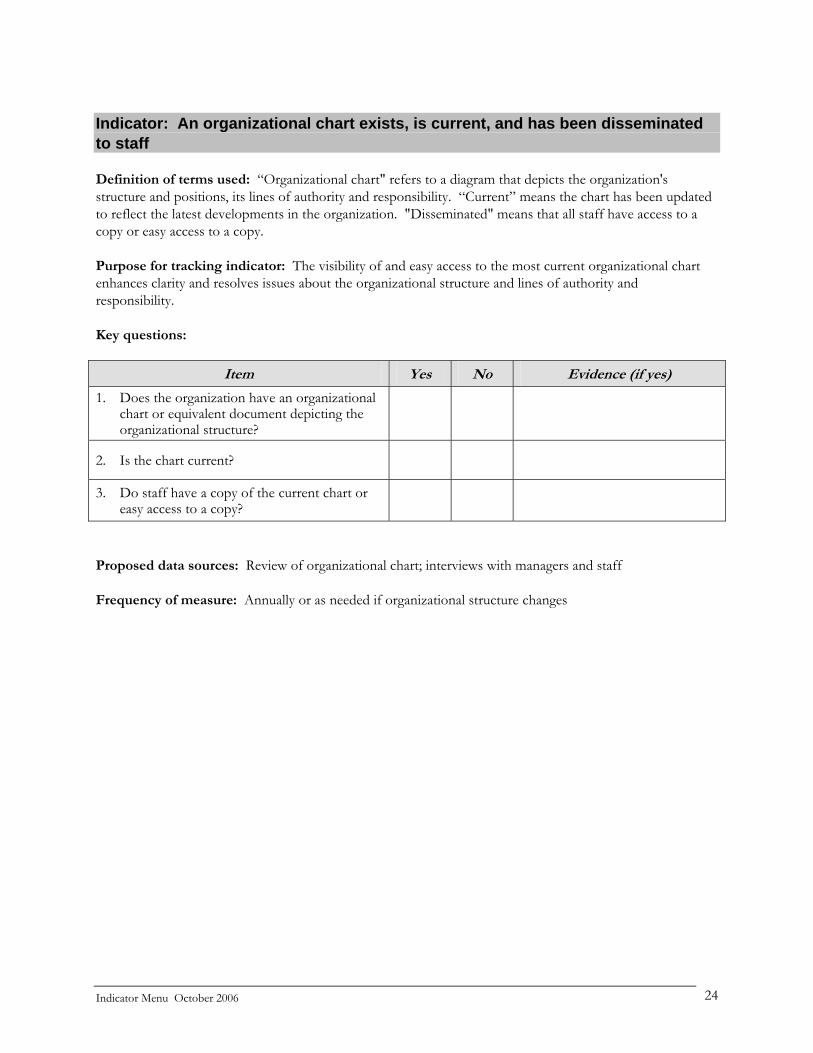
Indicator: An organizational chart exists, is current, and has been disseminated to staff Definition of terms used: “Organizational chart" refers to a diagram that depicts the organization's structure and positions, its lines of authority and responsibility. “Current” means the chart has been updated to reflect the latest developments in the organization. "Disseminated" means that all staff have access to a copy or easy access to a copy. Purpose for tracking indicator: The visibility of and easy access to the most current organizational chart enhances clarity and resolves issues about the organizational structure and lines of authority and responsibility. Key questions:
Item Yes No Evidence (if yes)
1. Does the organization have an organizational chart or equivalent document depicting the organizational structure?
2. Is the chart current?
3. Do staff have a copy of the current chart or easy access to a copy?
Proposed data sources: Review of organizational chart; interviews with managers and staff
Frequency of measure: Annually or as needed if organizational structure changes
Indicator Menu October 2006 24
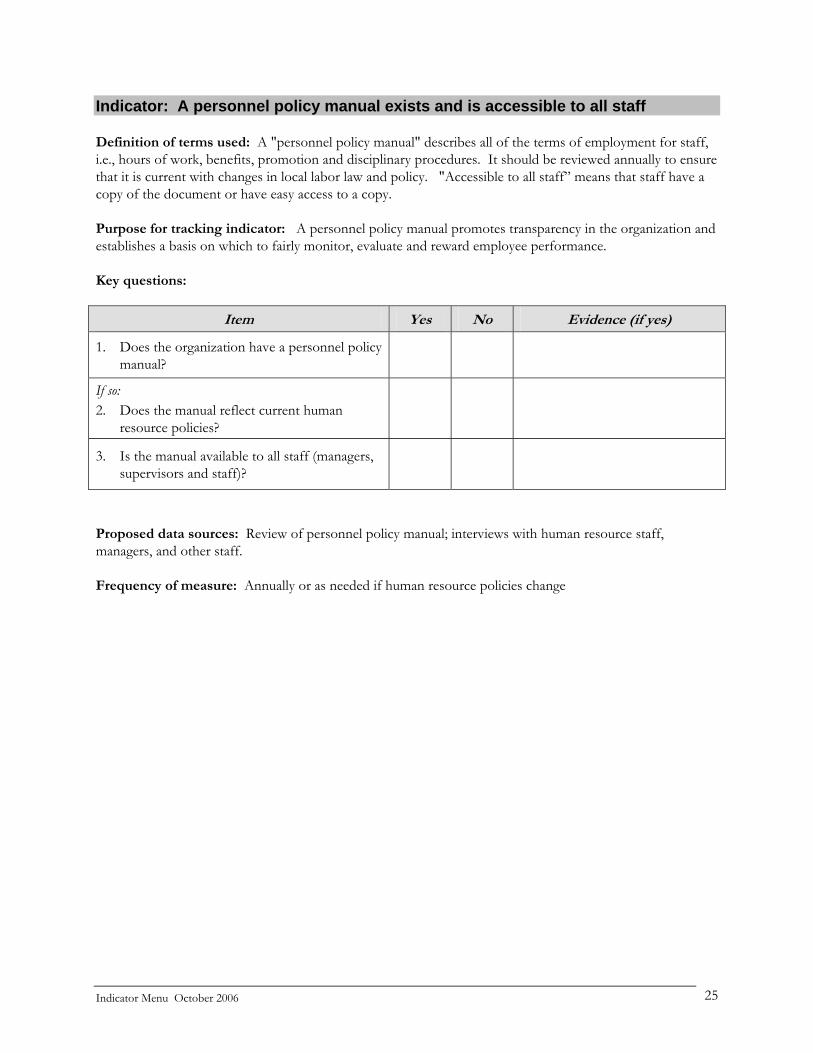
Indicator: A personnel policy manual exists and is accessible to all staff Definition of terms used: A "personnel policy manual" describes all of the terms of employment for staff, i.e., hours of work, benefits, promotion and disciplinary procedures. It should be reviewed annually to ensure that it is current with changes in local labor law and policy. "Accessible to all staff” means that staff have a copy of the document or have easy access to a copy. Purpose for tracking indicator: A personnel policy manual promotes transparency in the organization and establishes a basis on which to fairly monitor, evaluate and reward employee performance. Key questions:
Item Yes No Evidence (if yes)
1. Does the organization have a personnel policy manual?
If so: 2. Does the manual reflect current human
resource policies?
3. Is the manual available to all staff (managers, supervisors and staff)?
Proposed data sources: Review of personnel policy manual; interviews with human resource staff, managers, and other staff. Frequency of measure: Annually or as needed if human resource policies change
Indicator Menu October 2006 25
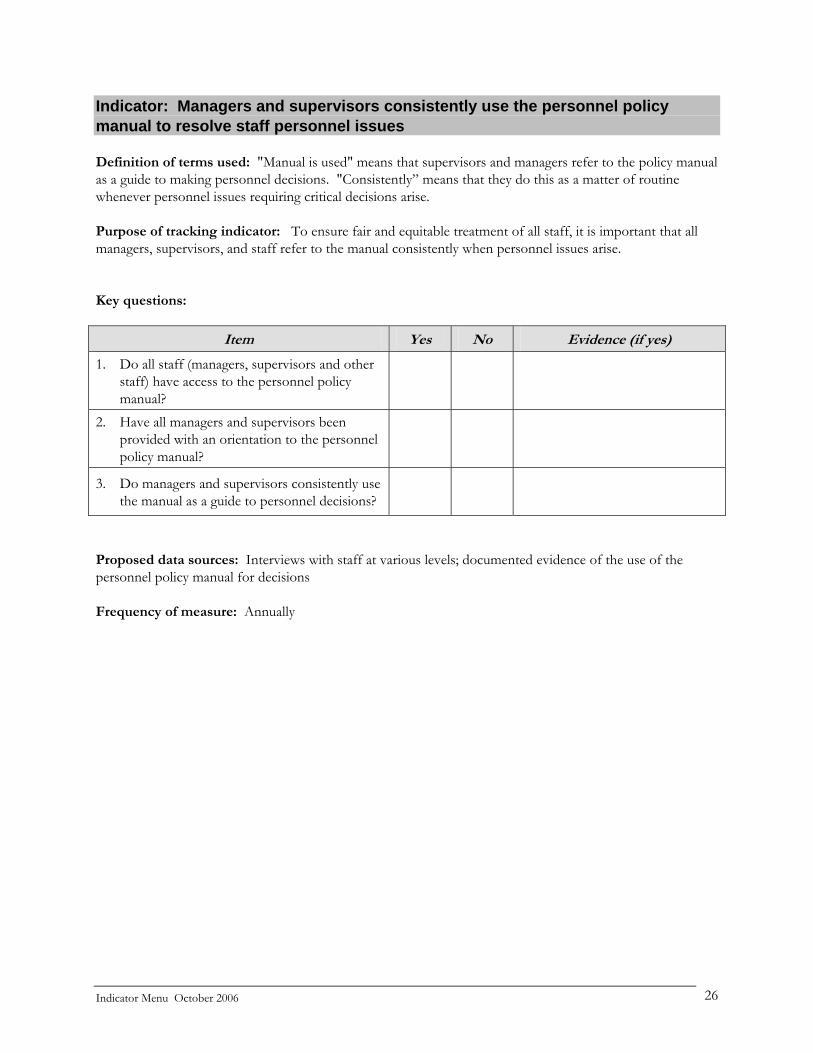
Indicator: Managers and supervisors consistently use the personnel policy manual to resolve staff personnel issues Definition of terms used: "Manual is used" means that supervisors and managers refer to the policy manual as a guide to making personnel decisions. "Consistently” means that they do this as a matter of routine whenever personnel issues requiring critical decisions arise. Purpose of tracking indicator: To ensure fair and equitable treatment of all staff, it is important that all managers, supervisors, and staff refer to the manual consistently when personnel issues arise. Key questions:
Item Yes No Evidence (if yes)
1. Do all staff (managers, supervisors and other staff) have access to the personnel policy manual?
2. Have all managers and supervisors been provided with an orientation to the personnel policy manual?
3. Do managers and supervisors consistently use the manual as a guide to personnel decisions?
Proposed data sources: Interviews with staff at various levels; documented evidence of the use of the personnel policy manual for decisions Frequency of measure: Annually
Indicator Menu October 2006 26

Indicator: An employee data system exists and is regularly updated Definition of terms used: An "employee data system" describes and tracks the total number of staff, their job title/work location, their skill/education level, gender, age, year of hire, and salary. It is used to keep management abreast of employee information and to provide a reliable basis for staff allocation and planning for the future. Purpose of tracking indicator: The existence of a regularly updated employee data system is essential to an appropriate and efficient allocation of staff, the determination of training needs, and tracking of personnel costs. Key questions:
Item Yes No Evidence (if yes)
1. Does the organization have an employee data system?
If so: 2. Does it include the following essential
information?
total number of staff
job title
work location
skill/education level
gender
age
year of hire
salary
3. Is the system updated regularly?
Proposed data sources: Review of existing employee data system; interviews with human resource and other staff Frequency of measure: Annually
Indicator Menu October 2006 27

Indicator: An employee data system is used for human resource planning Definition of terms used: “Used for human resource planning” means that the human resource staff use data from the system as a basis for allocating staff, establishing training needs, tracking personnel costs and making hiring projections. For a definition of an "employee data system" see the preceding indicator. Purpose for tracking indicator: This indicator determines the extent to which management uses the existing employee data system for human resource planning purposes. Regular use of the data indicates that human resource management decisions are evidence-based. Key questions:
Item Yes No Evidence (if yes)
1. Was the employee data system used in preparing the current annual operational plan?
Proposed data sources: Interviews with human resource staff and managers Frequency of measure: Annually
Indicator Menu October 2006 28

Indicator: A performance management system exists and includes all essential components Definition of terms used: A “performance management system” includes three essential components: up-to-date job descriptions, lines of supervision, and joint work planning and performance review. A “work plan” describes what the employee is expected to accomplish over a given period of time (i.e., 6 months). A “performance review” is a formal review of the employee's performance with regard to the activities projected in the work plan. Purpose of the tracking indicator: A performance management system is critical to define and monitor the work that staff do and to ensure that the tasks and priorities of employees support the mission and goals of the organization. Key questions:
Item Yes No Evidence (if yes)
1. Do employee job descriptions accurately reflect employees' current responsibilities?
2. Are lines of supervision clearly outlined?
3. Are performance review procedures consistently followed?
4. Does the performance planning system include individual work plans for a designated time period?
Proposed data sources: Human resource documents; job descriptions; organizational chart; human resource manual; discussions with human resource staff, managers, and other staff Frequency of measure: Annually
Indicator Menu October 2006 29
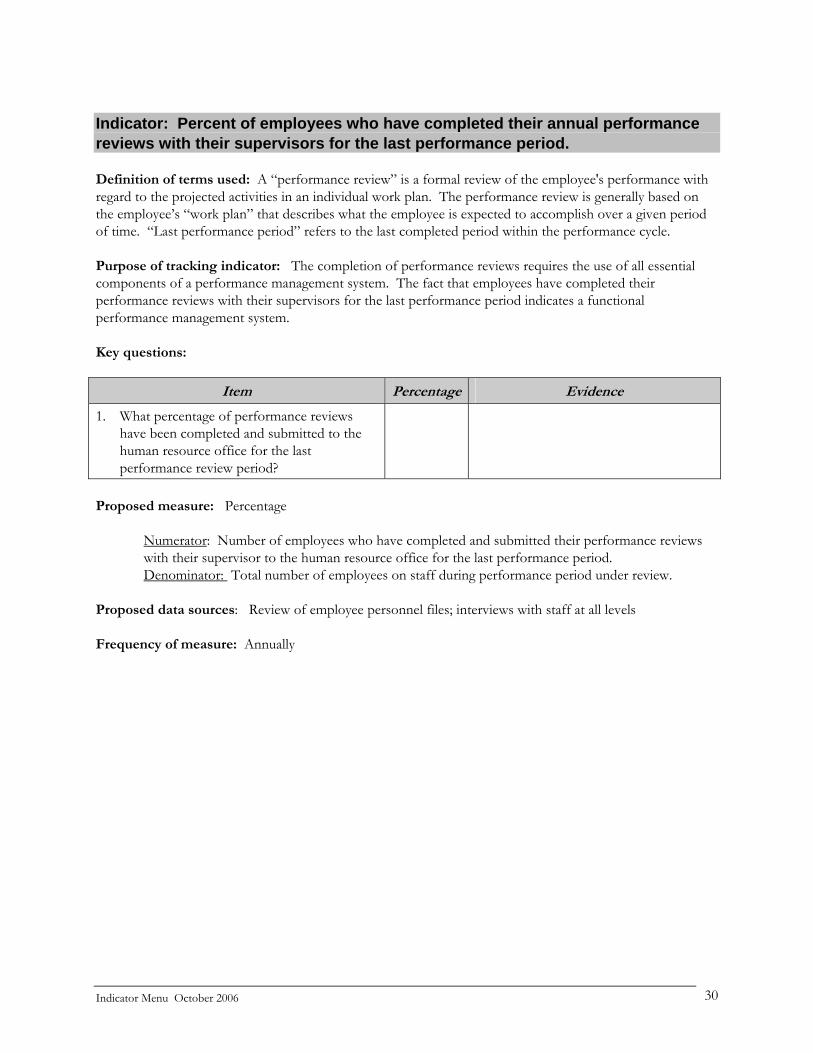
Indicator: Percent of employees who have completed their annual performance reviews with their supervisors for the last performance period. Definition of terms used: A “performance review” is a formal review of the employee's performance with regard to the projected activities in an individual work plan. The performance review is generally based on the employee’s “work plan” that describes what the employee is expected to accomplish over a given period of time. “Last performance period” refers to the last completed period within the performance cycle. Purpose of tracking indicator: The completion of performance reviews requires the use of all essential components of a performance management system. The fact that employees have completed their performance reviews with their supervisors for the last performance period indicates a functional performance management system. Key questions:
Item Percentage Evidence
1. What percentage of performance reviews have been completed and submitted to the human resource office for the last performance review period?
Proposed measure: Percentage
Numerator: Number of employees who have completed and submitted their performance reviews with their supervisor to the human resource office for the last performance period.
Denominator: Total number of employees on staff during performance period under review. Proposed data sources: Review of employee personnel files; interviews with staff at all levels Frequency of measure: Annually
Indicator Menu October 2006 30

Indicator: Written guidelines for the performance planning and review processes exist Definition of terms used: A “performance review” is a formal review of the employee's performance with regard to the projected activities in an individual work plan. The performance review is generally based on the employee’s “work plan” that describes what the employee is expected to accomplish over a given period of time. “Written guidelines for performance planning and review” is a written document that outlines the frequency and content of performance planning and review. It may also include the definition of supervisory responsibilities and behavior expected of supervisors. Purpose of the tracking indicator: Documented guidelines for performance review and supervision practices are an important component of a functioning human resources management system. Key questions:
Item Yes No Evidence (if yes)
1. Do written guidelines for the performance planning and review process exist?
Proposed data sources: Human resource documents; personnel policy or employee manual Frequency of measure: Annually
Indicator Menu October 2006 31
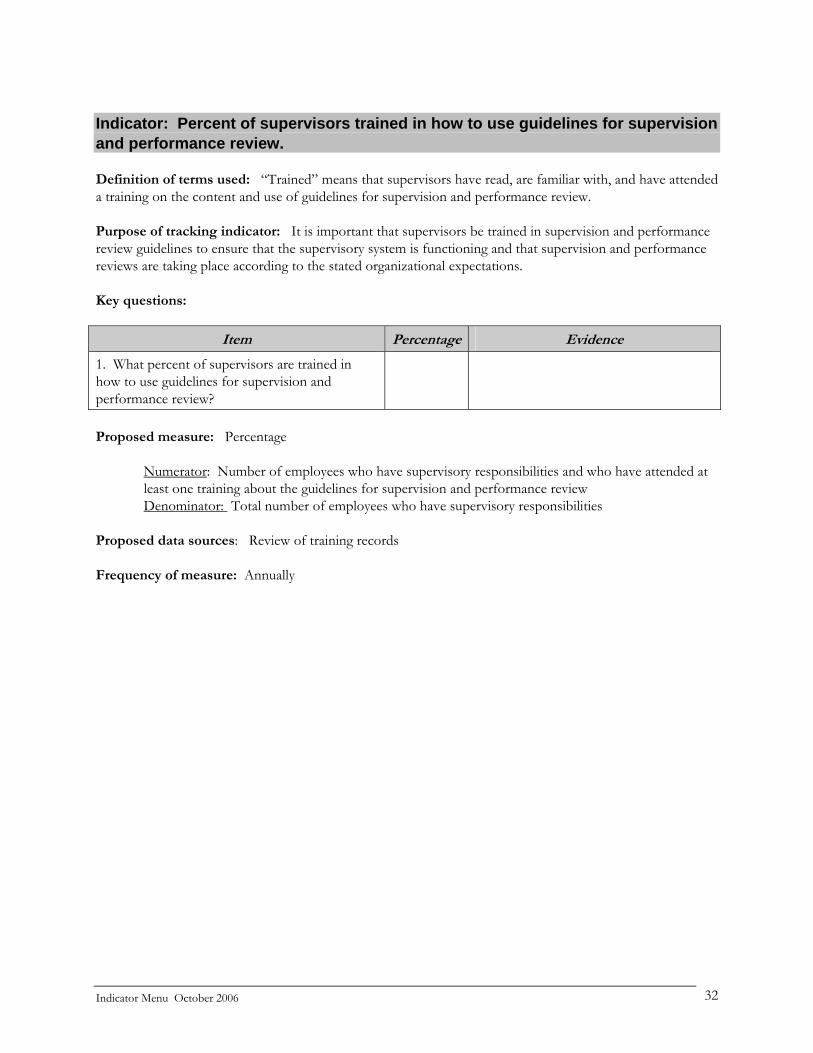
Indicator: Percent of supervisors trained in how to use guidelines for supervision and performance review. Definition of terms used: “Trained” means that supervisors have read, are familiar with, and have attended a training on the content and use of guidelines for supervision and performance review. Purpose of tracking indicator: It is important that supervisors be trained in supervision and performance review guidelines to ensure that the supervisory system is functioning and that supervision and performance reviews are taking place according to the stated organizational expectations. Key questions:
Item Percentage Evidence
1. What percent of supervisors are trained in how to use guidelines for supervision and performance review?
Proposed measure: Percentage
Numerator: Number of employees who have supervisory responsibilities and who have attended at least one training about the guidelines for supervision and performance review
Denominator: Total number of employees who have supervisory responsibilities Proposed data sources: Review of training records Frequency of measure: Annually
Indicator Menu October 2006 32

Indicator: A financially feasible staff training plan exists for the current fiscal year Definition of terms used: A “staff training plan” details the skills and knowledge needed by staff to stay up to date in their field and to develop new skills. It is based on the needs of the organization, provides opportunity to all staff and is supported by an adequate budget. "Financially feasible” means that there is enough funding to support the training plan. Purpose for tracking indicator: Training and staff development are essential for the achievement of the organization's goals and for staff motivation. The development of a training plan is critical to organizational needs assessment and the efficient use of human resources. Key questions:
Item Yes No Evidence (if yes)
1. Does a training plan exist for the current fiscal year?
If yes: 2. Is the plan based on an organizational needs
assessment?
3. Does the plan address the training needs of staff at all levels?
4. Is there an approved budget for implementing the plan?
Proposed data sources: Review of training plan; interviews with human resource staff Frequency of measure: Annually
Indicator Menu October 2006 33

Indicator: The staff training plan is monitored for effectiveness Definition of terms used: “Monitored for effectiveness” means that the training plan is being reviewed on an ongoing basis to ensure it is in accordance with the accomplishment of expected goals. Purpose for tracking indicator: Training is an important component of employee performance. It provides an opportunity for staff development and possibly promotions. It needs to be realistically planned and budgeted in order to deliver what it promises to employees. Since the organization is accountable for identifying and developing the appropriate skills needed in the organization, the training plan should be carefully monitored. Key questions:
Item Yes No Evidence (if yes)
1. Is the staff training plan being implemented according to schedule?
2. Are mechanisms for monitoring the training plan in use?
3. Does the human resource team have an evaluation plan for its annual training program?
Proposed data sources: Review of training plan; interviews with human resource staff Frequency of measure: Annually
Indicator Menu October 2006 34

Indicator: Percent of staff who have up-to-date job descriptions Definition of terms: A “job description” is a document that “at a minimum states the job title and provides a description of the tasks and responsibilities of the position, direct supervisory relationships with other staff, and the skills and qualifications required for the position.”5 An “up-to-date job description” is a job description that accurately reflects an employee’s current responsibilities and is revised when an employee’s responsibilities change.
Purpose for tracking indicator: The existence of up-to-date job descriptions creates clarity for the supervisor and supervisee about the responsibilities and expectations for a position and on which performance plans and reviews can be developed. It also assists in overall human resources management as a way to ensure that across positions and departments, all essential tasks and responsibilities are fairly and equally communicated and assigned.
Key questions:
Item Percentage Evidence
1. What percent of staff have job descriptions that accurately reflect their current responsibilities?
Proposed measure: Percentage
Numerator: Number of employees who have job descriptions that accurately reflect their current responsibilities
Denominator: Total number of employees on staff during the period under review Proposed data sources: Review of job descriptions, interviews with employees
Frequency of measure: Annually
5 Miller and Bahamon, Family Planning Management Terms: A pocket glossary in three languages, 28.
Indicator Menu October 2006 35
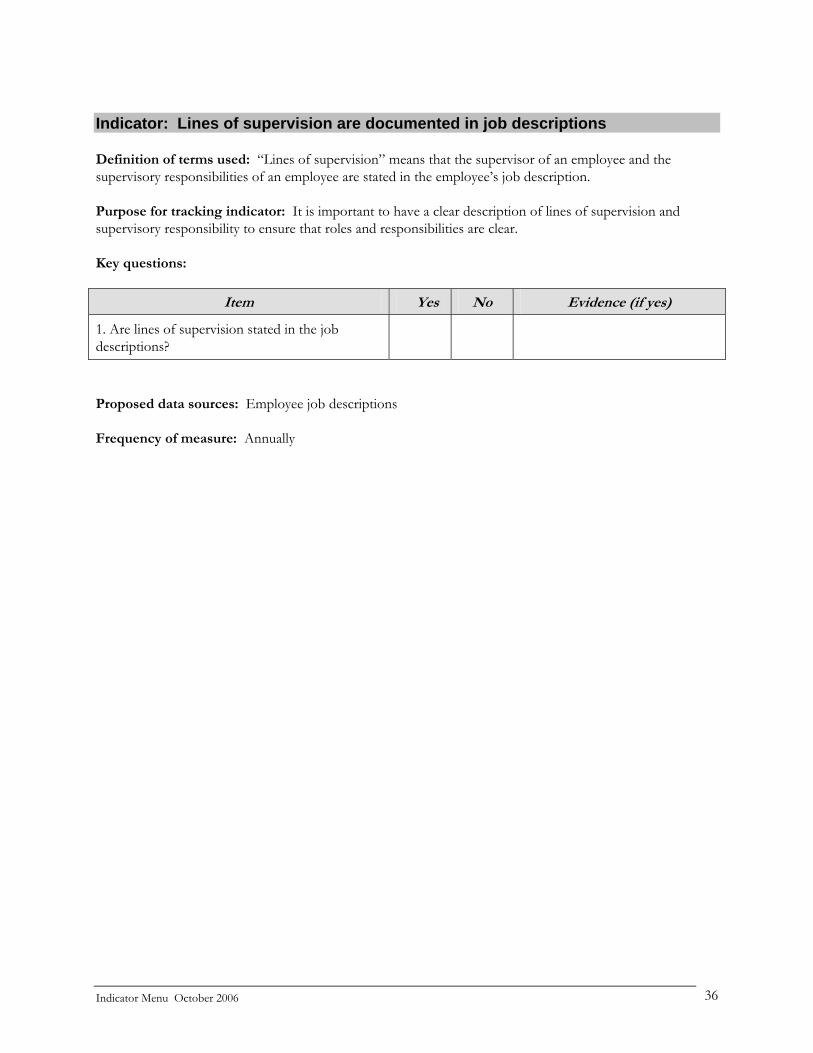
Indicator: Lines of supervision are documented in job descriptions Definition of terms used: “Lines of supervision” means that the supervisor of an employee and the supervisory responsibilities of an employee are stated in the employee’s job description. Purpose for tracking indicator: It is important to have a clear description of lines of supervision and supervisory responsibility to ensure that roles and responsibilities are clear. Key questions:
Item Yes No Evidence (if yes)
1. Are lines of supervision stated in the job descriptions?
Proposed data sources: Employee job descriptions Frequency of measure: Annually
Indicator Menu October 2006 36
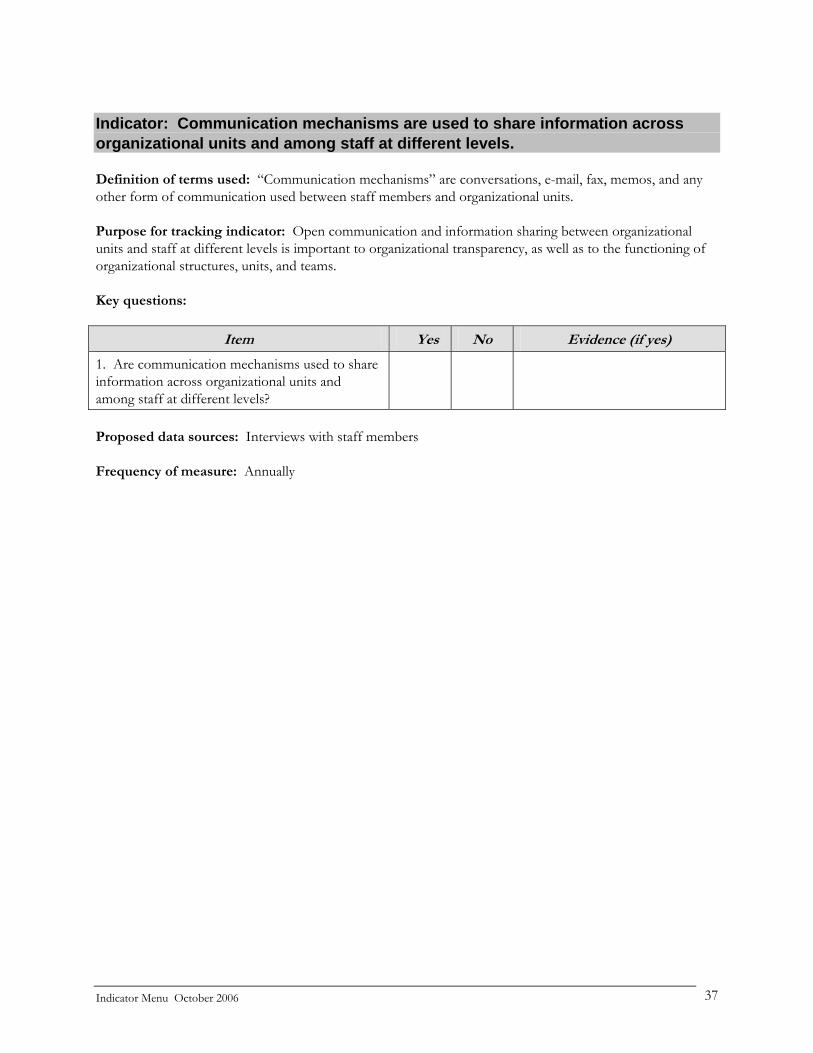
Indicator: Communication mechanisms are used to share information across organizational units and among staff at different levels. Definition of terms used: “Communication mechanisms” are conversations, e-mail, fax, memos, and any other form of communication used between staff members and organizational units. Purpose for tracking indicator: Open communication and information sharing between organizational units and staff at different levels is important to organizational transparency, as well as to the functioning of organizational structures, units, and teams. Key questions:
Item Yes No Evidence (if yes)
1. Are communication mechanisms used to share information across organizational units and among staff at different levels?
Proposed data sources: Interviews with staff members Frequency of measure: Annually
Indicator Menu October 2006 37

Indicator: Procedures for the identification, hiring, and supervision of consultants exist Definition of terms used: Procedures for the identification, hiring, and supervision of consultants describe the process for recruitment and assessment that candidates are qualified and have appropriate experience and expertise relative to the assignment for which they are being considered. “Procedures for supervision” describe how the organization provides support, background materials, and information, as well as monitors the amount of time the consultant charges against the amount of work assigned, completed, and deliverables submitted. Purpose for tracking indicator: Effective identification, hiring, and supervision of consultants can help an organization to more effectively carry out its work and effectively and efficiently use the resources available. Key questions:
Item Yes No Evidence (if yes)
1. Does the organization identify candidates for consultancies according to their experience and expertise?
2. Does the organization hire consultants who are qualified and have substantial experience and expertise relative to the assignment?
3. Does the organization provide support, background materials, and information to the consultant?
4. Does the organization monitor the amount of time the consultant charges against the amount of work assigned, completed, and deliverables submitted?
Proposed data sources: Consultant files; human resources records Frequency of measure: Annually
Indicator Menu October 2006 38
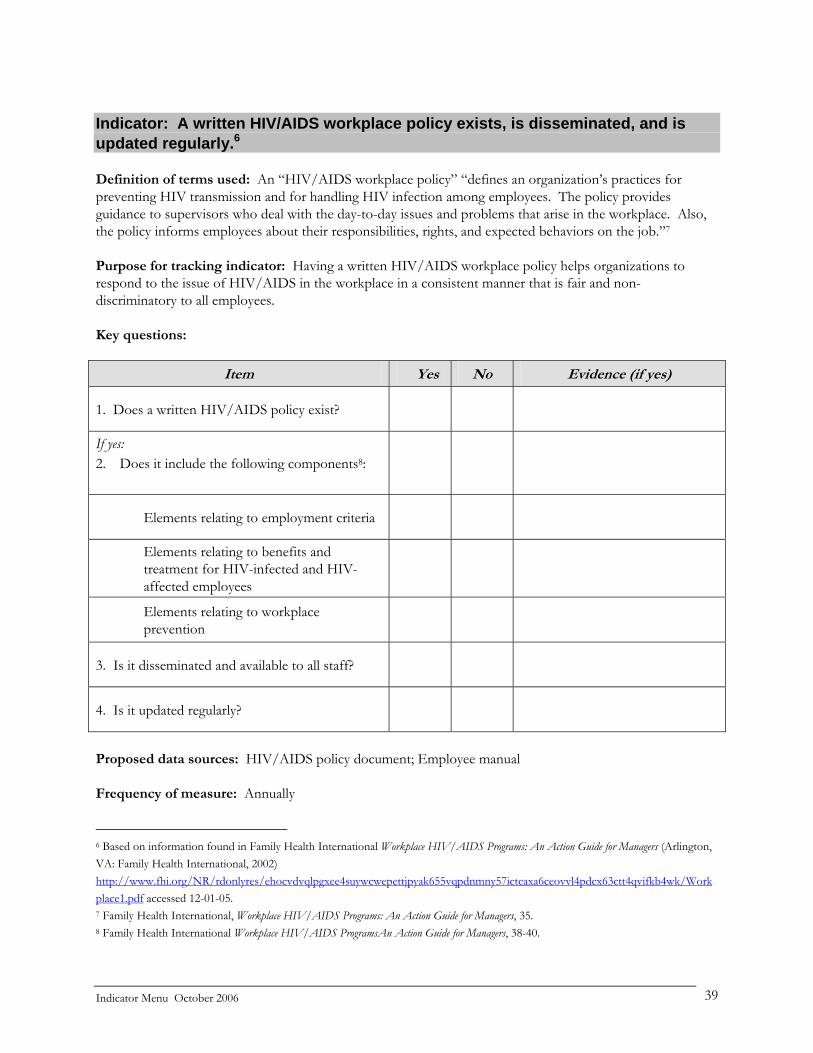
Indicator: A written HIV/AIDS workplace policy exists, is disseminated, and is updated regularly.6 Definition of terms used: An “HIV/AIDS workplace policy” “defines an organization’s practices for preventing HIV transmission and for handling HIV infection among employees. The policy provides guidance to supervisors who deal with the day-to-day issues and problems that arise in the workplace. Also, the policy informs employees about their responsibilities, rights, and expected behaviors on the job.”7
Purpose for tracking indicator: Having a written HIV/AIDS workplace policy helps organizations to respond to the issue of HIV/AIDS in the workplace in a consistent manner that is fair and non-discriminatory to all employees. Key questions:
Item Yes No Evidence (if yes)
1. Does a written HIV/AIDS policy exist?
If yes: 2. Does it include the following components8:
Elements relating to employment criteria
Elements relating to benefits and treatment for HIV-infected and HIV-affected employees
Elements relating to workplace prevention
3. Is it disseminated and available to all staff?
4. Is it updated regularly?
Proposed data sources: HIV/AIDS policy document; Employee manual Frequency of measure: Annually
6 Based on information found in Family Health International Workplace HIV/AIDS Programs: An Action Guide for Managers (Arlington, VA: Family Health International, 2002) http://www.fhi.org/NR/rdonlyres/ehocvdvqlpgxee4suywcwepettjpyak655vqpdnmny57ictcaxa6ceovvl4pdcx63ctt4qvifkb4wk/Workplace1.pdf accessed 12-01-05. 7 Family Health International, Workplace HIV/AIDS Programs: An Action Guide for Managers, 35. 8 Family Health International Workplace HIV/AIDS ProgramsAn Action Guide for Managers, 38-40.
Indicator Menu October 2006 39

Indicator: Percent of service delivery points visited by a trained supervisor Definition of terms: A “service delivery point” is any location where health services are provided to the population served, such as a health clinic, a hospital, a pharmacy, or in the community.
Purpose for tracking indicator: Regular supervision of service delivery points indicates a functional supervisory system and helps to ensure quality control at the service delivery level.
Key questions:
Item Percentage Evidence
1. What percent of service delivery points were visited by a trained supervisor during the last 12 months?
Proposed measure: Percentage Numerator: Number of service delivery points visited by a trained supervisor during the last 12 months Denominator: Total number of service delivery points Proposed data sources: Supervisory records, supervisory reports, and other organizational records.
Frequency of measure: Every six months
Indicator Menu October 2006 40
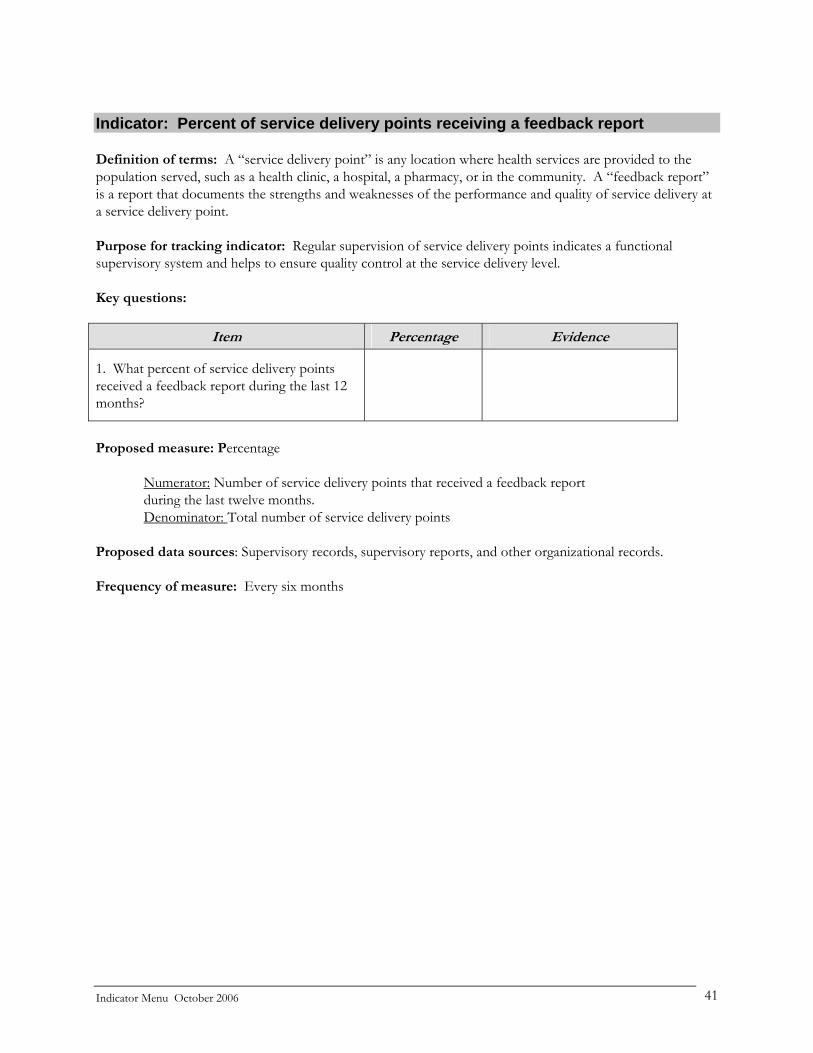
Indicator: Percent of service delivery points receiving a feedback report Definition of terms: A “service delivery point” is any location where health services are provided to the population served, such as a health clinic, a hospital, a pharmacy, or in the community. A “feedback report” is a report that documents the strengths and weaknesses of the performance and quality of service delivery at a service delivery point.
Purpose for tracking indicator: Regular supervision of service delivery points indicates a functional supervisory system and helps to ensure quality control at the service delivery level.
Key questions:
Item Percentage Evidence
1. What percent of service delivery points received a feedback report during the last 12 months?
Proposed measure: Percentage Numerator: Number of service delivery points that received a feedback report during the last twelve months. Denominator: Total number of service delivery points Proposed data sources: Supervisory records, supervisory reports, and other organizational records.
Frequency of measure: Every six months
Indicator Menu October 2006 41
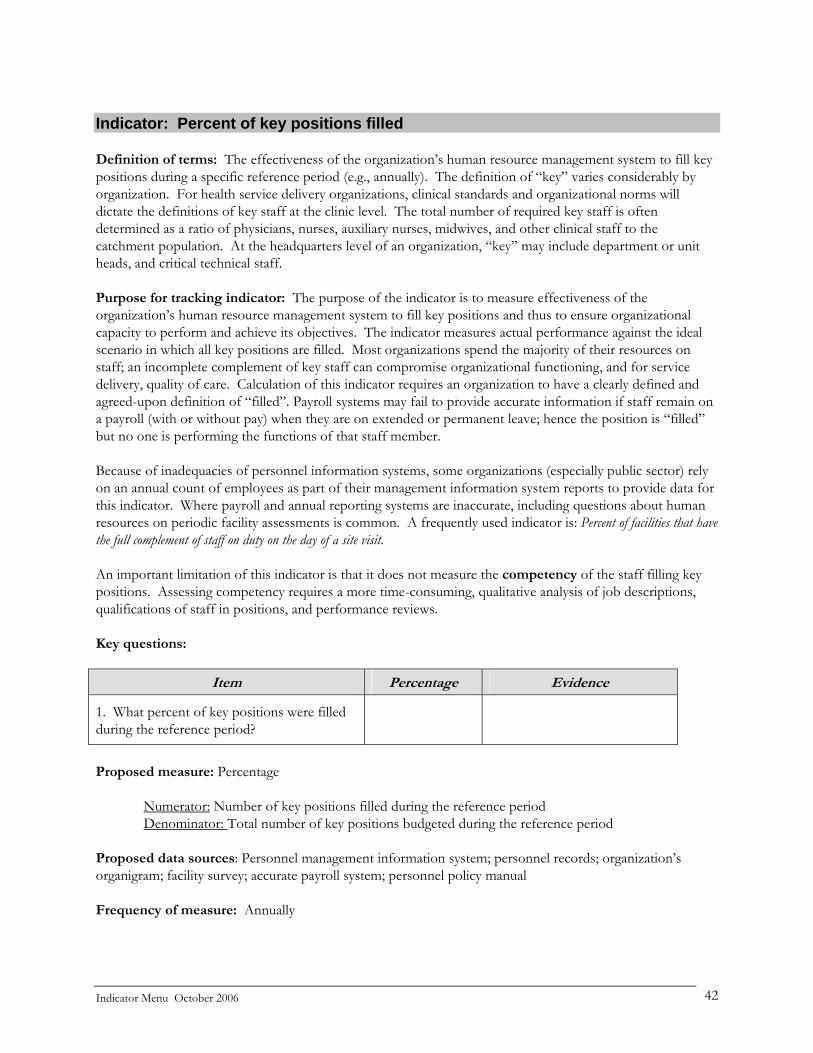
Indicator: Percent of key positions filled Definition of terms: The effectiveness of the organization’s human resource management system to fill key positions during a specific reference period (e.g., annually). The definition of “key” varies considerably by organization. For health service delivery organizations, clinical standards and organizational norms will dictate the definitions of key staff at the clinic level. The total number of required key staff is often determined as a ratio of physicians, nurses, auxiliary nurses, midwives, and other clinical staff to the catchment population. At the headquarters level of an organization, “key” may include department or unit heads, and critical technical staff. Purpose for tracking indicator: The purpose of the indicator is to measure effectiveness of the organization’s human resource management system to fill key positions and thus to ensure organizational capacity to perform and achieve its objectives. The indicator measures actual performance against the ideal scenario in which all key positions are filled. Most organizations spend the majority of their resources on staff; an incomplete complement of key staff can compromise organizational functioning, and for service delivery, quality of care. Calculation of this indicator requires an organization to have a clearly defined and agreed-upon definition of “filled”. Payroll systems may fail to provide accurate information if staff remain on a payroll (with or without pay) when they are on extended or permanent leave; hence the position is “filled” but no one is performing the functions of that staff member. Because of inadequacies of personnel information systems, some organizations (especially public sector) rely on an annual count of employees as part of their management information system reports to provide data for this indicator. Where payroll and annual reporting systems are inaccurate, including questions about human resources on periodic facility assessments is common. A frequently used indicator is: Percent of facilities that have the full complement of staff on duty on the day of a site visit. An important limitation of this indicator is that it does not measure the competency of the staff filling key positions. Assessing competency requires a more time-consuming, qualitative analysis of job descriptions, qualifications of staff in positions, and performance reviews. Key questions:
Item Percentage Evidence
1. What percent of key positions were filled during the reference period?
Proposed measure: Percentage Numerator: Number of key positions filled during the reference period Denominator: Total number of key positions budgeted during the reference period Proposed data sources: Personnel management information system; personnel records; organization’s organigram; facility survey; accurate payroll system; personnel policy manual
Frequency of measure: Annually
Indicator Menu October 2006 42
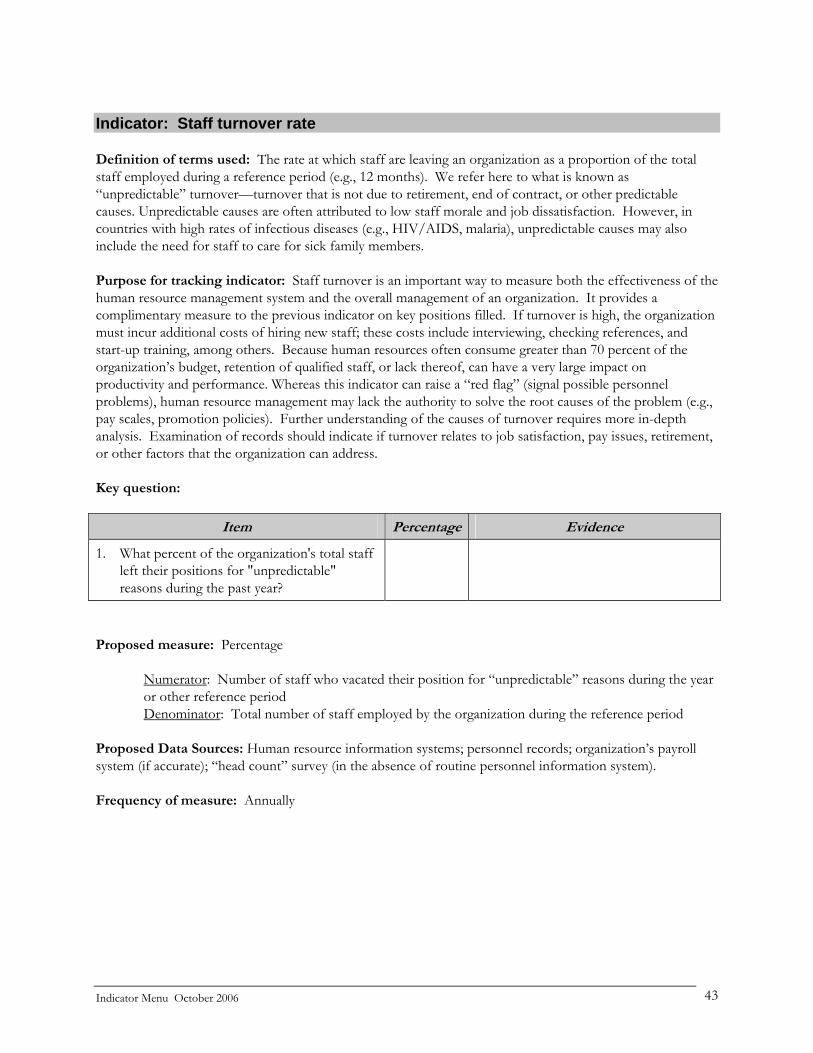
Indicator: Staff turnover rate Definition of terms used: The rate at which staff are leaving an organization as a proportion of the total staff employed during a reference period (e.g., 12 months). We refer here to what is known as “unpredictable” turnover—turnover that is not due to retirement, end of contract, or other predictable causes. Unpredictable causes are often attributed to low staff morale and job dissatisfaction. However, in countries with high rates of infectious diseases (e.g., HIV/AIDS, malaria), unpredictable causes may also include the need for staff to care for sick family members. Purpose for tracking indicator: Staff turnover is an important way to measure both the effectiveness of the human resource management system and the overall management of an organization. It provides a complimentary measure to the previous indicator on key positions filled. If turnover is high, the organization must incur additional costs of hiring new staff; these costs include interviewing, checking references, and start-up training, among others. Because human resources often consume greater than 70 percent of the organization’s budget, retention of qualified staff, or lack thereof, can have a very large impact on productivity and performance. Whereas this indicator can raise a “red flag” (signal possible personnel problems), human resource management may lack the authority to solve the root causes of the problem (e.g., pay scales, promotion policies). Further understanding of the causes of turnover requires more in-depth analysis. Examination of records should indicate if turnover relates to job satisfaction, pay issues, retirement, or other factors that the organization can address. Key question:
Item Percentage Evidence
1. What percent of the organization's total staff left their positions for "unpredictable" reasons during the past year?
Proposed measure: Percentage
Numerator: Number of staff who vacated their position for “unpredictable” reasons during the year or other reference period Denominator: Total number of staff employed by the organization during the reference period
Proposed Data Sources: Human resource information systems; personnel records; organization’s payroll system (if accurate); “head count” survey (in the absence of routine personnel information system).
Frequency of measure: Annually
Indicator Menu October 2006 43
1.1.3 Management Information A management information system (MIS) is an organized assembly of resources and procedures required to collect, process, and distribute data for use in decision making. The indicators in this section are based on six essential characteristics of an adequately functioning management information system for a service delivery organization:
• Data are collected on services provided and the availability and use of resources (finance, supplies/equipment, and human resources).
• Data are reported in a timely manner. • Data are reported accurately. • Data are complete or representative. • Data are used to review performance and make decisions by staff at all levels of an organization. • Reporting units receive feedback.
Indicator Menu October 2006 44
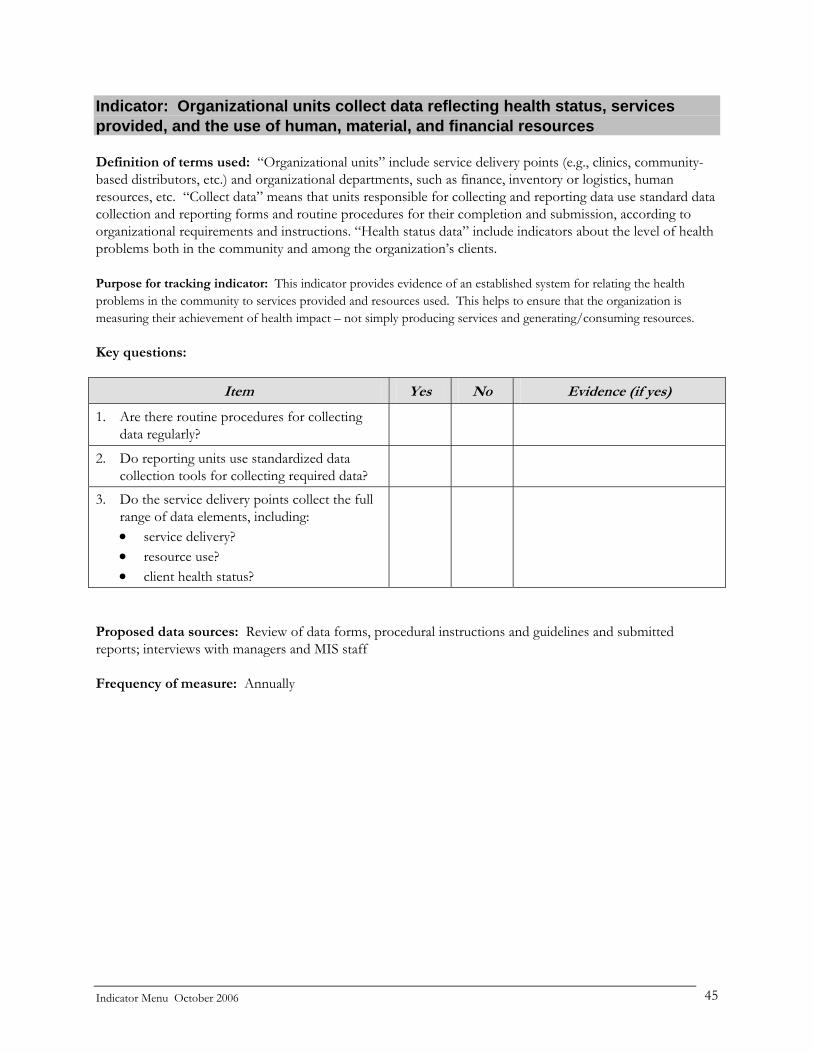
Indicator: Organizational units collect data reflecting health status, services provided, and the use of human, material, and financial resources Definition of terms used: “Organizational units” include service delivery points (e.g., clinics, community-based distributors, etc.) and organizational departments, such as finance, inventory or logistics, human resources, etc. “Collect data” means that units responsible for collecting and reporting data use standard data collection and reporting forms and routine procedures for their completion and submission, according to organizational requirements and instructions. “Health status data” include indicators about the level of health problems both in the community and among the organization’s clients. Purpose for tracking indicator: This indicator provides evidence of an established system for relating the health problems in the community to services provided and resources used. This helps to ensure that the organization is measuring their achievement of health impact – not simply producing services and generating/consuming resources. Key questions:
Item Yes No Evidence (if yes)
1. Are there routine procedures for collecting data regularly?
2. Do reporting units use standardized data collection tools for collecting required data?
3. Do the service delivery points collect the full range of data elements, including: • service delivery? • resource use? • client health status?
Proposed data sources: Review of data forms, procedural instructions and guidelines and submitted reports; interviews with managers and MIS staff Frequency of measure: Annually
Indicator Menu October 2006 45

Indicator: Organizational units submit required routine MIS reports on time Definition of terms used: “Required” refers to those reports that conform to a set of instructions for content and format. An “MIS” (management information system) is an organized assembly of resources and procedures required to collect, process, and distribute data for use in decision making. “On time” means the report is received within a specified time from the end of the reporting period, as required by the organization. To be defined as “on time” a report must be received well before information is required for decision-making. Purpose for tracking indicator: The existence of timely information is a pre-condition for taking timely action. The qualifier “on time” highlights the need to monitor activities and outcomes at a pace consistent with the timeframe that leaders and managers set for planning, monitoring, evaluating performance, and decision-making. In addition, data that are collected routinely, and at the required intervals, simplify comparisons over time for monitoring purposes. However, deadlines for submitting routine reports must be reasonable given the particular challenges to their delivery. Experience in several countries has shown that pressure to submit monthly reports on time can lead workers to omit or falsify information leading to data that are not only incomplete but also cannot be compared to data from other institutions submitting figures for a full month. This indicator can be applied to any type of report critical to the management of health services: quarterly or annual performance reports (which draw on data from multiple sources), drug stock-out reports, notifiable disease or event reports, or periodic population-based reports.
Key Question:
Item Percentage Evidence
1. What percent of the required MIS reports received have been submitted on time over the past 12 months, by organizational unit?
Proposed Measure: Percentage
Numerator: Number of organizational units submitting reports on time over the past 12 months (or other
defined period of time) Denominator: Total number of organizational units assessed during period being measured
Proposed data sources: Records or monitoring logs indicating exact dates when reports were sent from a collection point and received at a unit or office where they are aggregated; stamped and dated reports; computerized MIS databases. Frequency of measure: Annually. This indicator can be calculated on a cross-section of reports (i.e. all reports for one specific month) or for all reports due during the course of a year. If the former is used, it is important to take into account seasonal factors that might affect reporting (e.g. vacation months when staff may not be available to process data or end-of financial year periods when clerical staff may be extremely busy with other tasks).
Indicator Menu October 2006 46

Complementary Indicator: MIS reports are received and filed in the appropriate organizational office Definition of terms used: This indicator describes what is generally referred to as the “reporting rate.” Purpose for tracking indicator: In some organizations it is difficult to determine the timeliness of reports because report forms are not systematically time-stamped, and document transmission/receipt is not logged. The reporting rate is much simpler to calculate since it relies only on the availability of copies of reports that are frequently filed at several levels within an organizational or health system structure. This measure can also be helpful for evaluating the completeness and quality of data – particularly in organizations where figures are aggregated and the aggregate data then reported to other levels. If the reporting rate is known, such aggregate figures can sometimes be adjusted to provide a more realistic estimate of a particular indicator. Key question:
Item Percentage Evidence
1. What percent of the required MIS reports expected during the past 12 months are on file in the appropriate organizational office?
Proposed measure: Percentage Numerator: Number of reports received during period being measured Denominator: Total number of reports expected during period being measured Example: Annual reporting rate for quarterly health service reports from 6 reporting units. Numerator: Number of reports on file from all facilities for the year 2006 = 22 Denominator: 6 health facilities x 4 quarterly reports expected = 24 22/24 X 100 = 92% Proposed data sources: Hard copies of reports transmitted/received that can be found at the service delivery point or in higher level administrative offices. Or if reports are entered in the computer, the number of reports received can be calculated by counting the number of reports entered. Frequency of measure: Baseline and annually. This information is typically assessed by administrative units that receive reports at the end of each reporting period in order to determine the completeness of reporting and issue reminders to those who are late. If used to monitor the progress of improvements to an organizational MIS, it is probably sufficient to measure this at the end of each year.
Indicator Menu October 2006 47

Indicator: Percent of data elements reported accurately in MIS reports Definition of terms used: A “data element” is a single datum input into an MIS. This term can refer to a single cell on a routine MIS report or in a data entry screen for automated MIS. The technique used to gather this data is often referred to as a "data audit."
Purpose for tracking indicator: This indicator is used in health programs to measure accuracy of reporting and aggregation. Inaccuracies can occur when data are recorded, tallied, transposed onto reporting forms, aggregated, or calculated in some way.
Key question:
Item Percentage Evidence
1. What percent of data elements recorded in clinic records is accurately reported?
Proposed measure: Evaluators can select a number of sample data elements and determine the extent of agreement between (1) data recorded in service registers, patient files, tally sheets, inventory records, or financial reports, and (2) data reported on MIS forms.
Numerator: Numbers of data elements reported correctly (reports consistent with recorded numbers) Denominator: Total numbers of data elements audited
For example: Report from Service Delivery Point #1
Item # Recorded # Reported Consistent?
Pill cycles 36 32 No IUDs 5 5 Yes New antenatal visits 18 18 Yes
% accuracy 2/3 or 66%
To measure accuracy of aggregation, organizations frequently compare a sample of data elements from the raw data reported from multiple service delivery points or reporting organizational units to the aggregated total reported to higher levels.
Numerator: Numbers of audited data elements aggregated correctly (aggregated reports consistent with individual service delivery point reports) Denominator: Total numbers of data elements audited
For example: Reports from 3 service delivery points, aggregated at district level
Item SDP 1 SDP 2 SDP 3 Actual Total
Reported Total
Consistent?
Pill cycles 32 84 14 130 130 Yes IUDs 5 10 7 22 20 No New antenatal visits 18 21 23 62 49 No % accuracy 1/3 or 33%
Note: Program or facility managers may inflate or under-report data for many reasons. A more sophisticated indicator would measure the absolute or relative difference between recorded and reported data to determine if the problem is over- or under-reporting of data. The absolute difference would be the most sensitive indicator, it would overcome the problem of under-reporting canceling out over-reporting, but it would be more time-consuming and tedious to calculate.
Indicator Menu October 2006 48
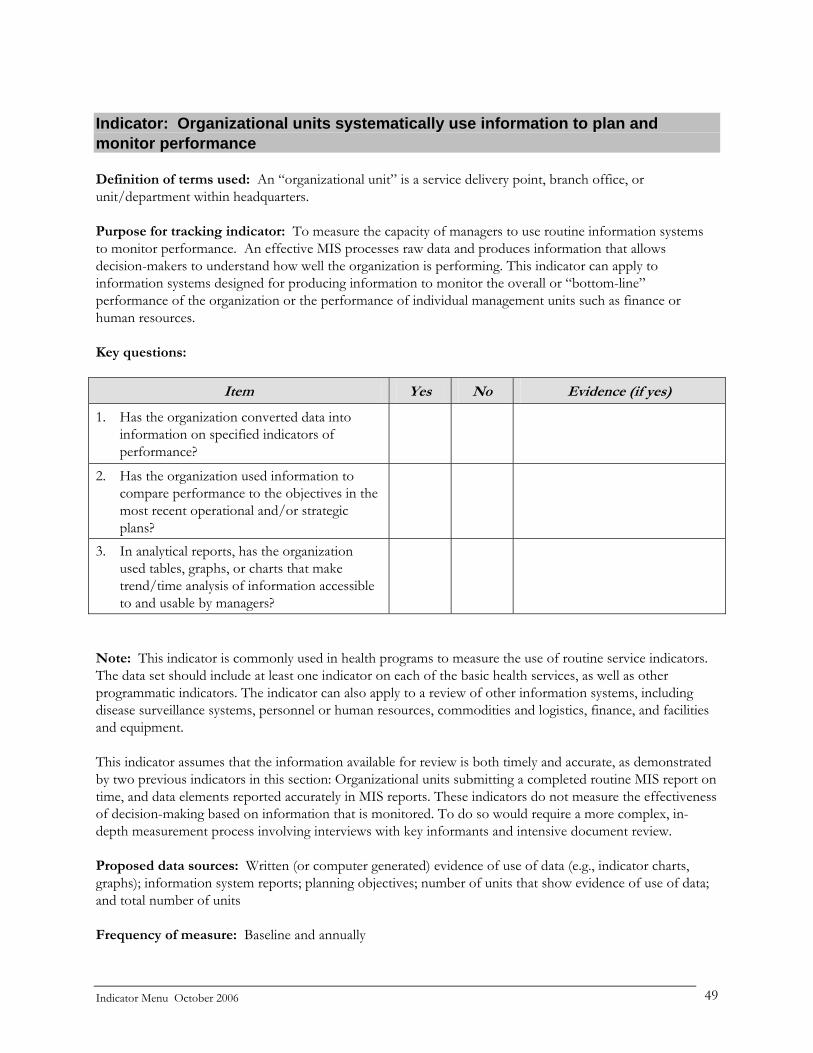
Indicator: Organizational units systematically use information to plan and monitor performance Definition of terms used: An “organizational unit” is a service delivery point, branch office, or unit/department within headquarters. Purpose for tracking indicator: To measure the capacity of managers to use routine information systems to monitor performance. An effective MIS processes raw data and produces information that allows decision-makers to understand how well the organization is performing. This indicator can apply to information systems designed for producing information to monitor the overall or “bottom-line” performance of the organization or the performance of individual management units such as finance or human resources. Key questions:
Item Yes No Evidence (if yes)
1. Has the organization converted data into information on specified indicators of performance?
2. Has the organization used information to compare performance to the objectives in the most recent operational and/or strategic plans?
3. In analytical reports, has the organization used tables, graphs, or charts that make trend/time analysis of information accessible to and usable by managers?
Note: This indicator is commonly used in health programs to measure the use of routine service indicators. The data set should include at least one indicator on each of the basic health services, as well as other programmatic indicators. The indicator can also apply to a review of other information systems, including disease surveillance systems, personnel or human resources, commodities and logistics, finance, and facilities and equipment. This indicator assumes that the information available for review is both timely and accurate, as demonstrated by two previous indicators in this section: Organizational units submitting a completed routine MIS report on time, and data elements reported accurately in MIS reports. These indicators do not measure the effectiveness of decision-making based on information that is monitored. To do so would require a more complex, in-depth measurement process involving interviews with key informants and intensive document review. Proposed data sources: Written (or computer generated) evidence of use of data (e.g., indicator charts, graphs); information system reports; planning objectives; number of units that show evidence of use of data; and total number of units Frequency of measure: Baseline and annually
Indicator Menu October 2006 49
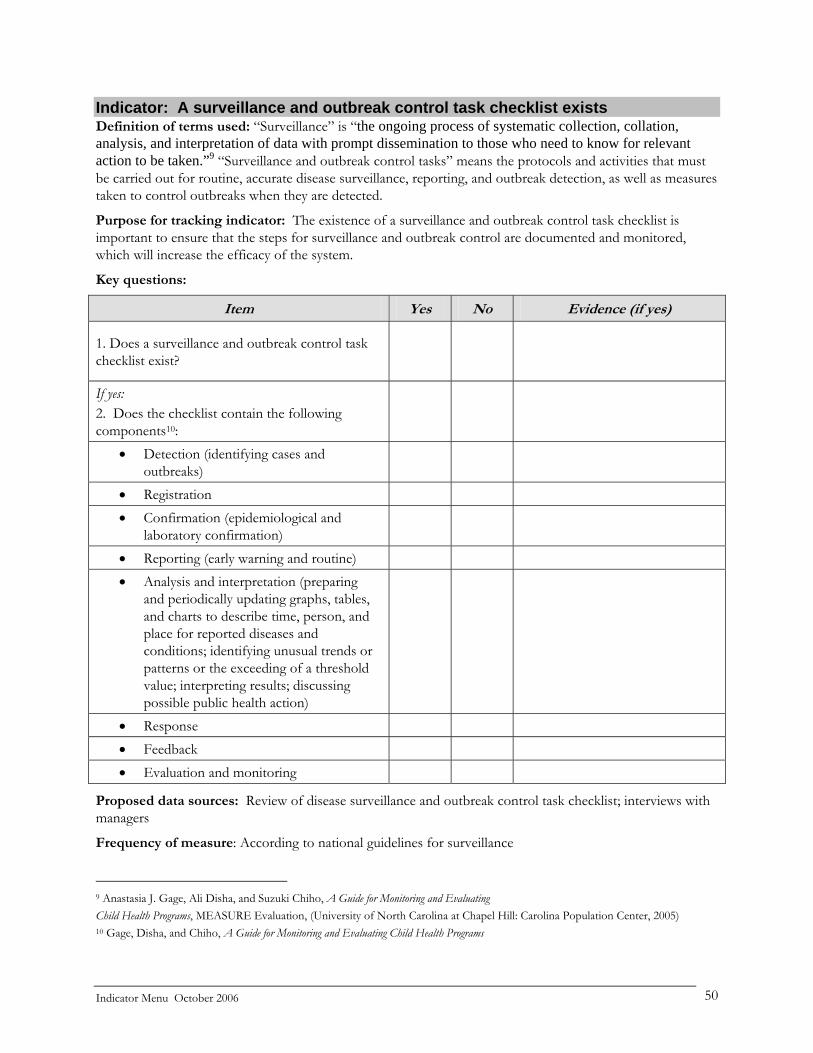
Indicator: A surveillance and outbreak control task checklist exists Definition of terms used: “Surveillance” is “the ongoing process of systematic collection, collation, analysis, and interpretation of data with prompt dissemination to those who need to know for relevant action to be taken.”9 “Surveillance and outbreak control tasks” means the protocols and activities that must be carried out for routine, accurate disease surveillance, reporting, and outbreak detection, as well as measures taken to control outbreaks when they are detected.
Purpose for tracking indicator: The existence of a surveillance and outbreak control task checklist is important to ensure that the steps for surveillance and outbreak control are documented and monitored, which will increase the efficacy of the system.
Key questions:
Item Yes No Evidence (if yes)
1. Does a surveillance and outbreak control task checklist exist?
If yes: 2. Does the checklist contain the following components10:
• Detection (identifying cases and outbreaks)
• Registration • Confirmation (epidemiological and
laboratory confirmation)
• Reporting (early warning and routine) • Analysis and interpretation (preparing
and periodically updating graphs, tables, and charts to describe time, person, and place for reported diseases and conditions; identifying unusual trends or patterns or the exceeding of a threshold value; interpreting results; discussing possible public health action)
• Response • Feedback • Evaluation and monitoring
Proposed data sources: Review of disease surveillance and outbreak control task checklist; interviews with managers
Frequency of measure: According to national guidelines for surveillance
9 Anastasia J. Gage, Ali Disha, and Suzuki Chiho, A Guide for Monitoring and Evaluating Child Health Programs, MEASURE Evaluation, (University of North Carolina at Chapel Hill: Carolina Population Center, 2005) 10 Gage, Disha, and Chiho, A Guide for Monitoring and Evaluating Child Health Programs
Indicator Menu October 2006 50

Indicator: Percent of health centers that perform surveillance and outbreak control tasks as measured by a checklist Definition of terms used: “Surveillance” is “the ongoing process of systematic collection, collation, analysis, and interpretation of data with prompt dissemination to those who need to know for relevant action to be taken.”11
“Surveillance and outbreak control tasks” means the protocols and activities that must be carried out for routine, accurate disease surveillance, reporting, and outbreak detection, as well as measures taken to control outbreaks when they are detected. Purpose for tracking indicator: Participation of health centers is an essential component of disease surveillance and outbreak control. The percent of health centers that perform surveillance and outbreak control tasks according to a checklist is an important indicator of the functioning of the disease surveillance and outbreak control system. Key question:
Item Percentage Evidence
1. What percent of health centers perform surveillance and outbreak control tasks?
2. What percent of health centers perform surveillance and outbreak control tasks as measured by a checklist?
Proposed measures: Percentage 1. Numerator: health centers that perform surveillance and outbreak control tasks Denominator: total number of health centers in the area being monitored 2. Numerator: health centers that perform surveillance and outbreak control tasks according to a
checklist Denominator: total number of health centers in the area being monitored Proposed data sources: Health center records Frequency of measure: According to national guidelines for surveillance
11 Gage, Disha, and Chiho, A Guide for Monitoring and Evaluating Child Health Programs
Indicator Menu October 2006 51

1.1.4 Quality Assurance Since there are many indicators and indicator reference materials addressing quality of care in service delivery, this brief section includes a single indicator addressing the existence and use of a quality assurance system by an organization. Indicator: A system for quality assurance has been institutionalized Definition of terms used: “Quality” refers to offering a service or product in a way that consistently meets each client’s needs. “Quality assurance” (QA) is a generic term describing a number of management approaches (Continuous Quality Improvement [CQI], Total Quality Management [TQM]), all of which recognize that many organizational problems result from systems and processes, as well as from a lack of clear performance expectations, rather than from negligence on the part of individuals. Purpose for tracking indicator: This indicator measures organizational commitment to QA; more detailed indicators can be found at the site listed below12 and in many of the indicator reference materials listed on p. 3 of this Menu. QA, as it applies to the management of health programs, generally involves the encouragement of staff members at all levels to analyze systems and processes, to use information to identify the nature and size of each problem, and to design and implement activities to improve services and client satisfaction.
Key questions:
Item Yes No Evidence (if yes)
1. Does the organization have clearly stated quality standards and protocols for service delivery?
2. Does the organization have clearly stated quality standards and protocols for management?
3. Is quality assurance built into the organization's mission and strategy?
4. Are there budget allocations for QA activities?
5. In the course of the past year, have there been reviews of the providers’ adherence to both service delivery and management standards?
6. Does the organization collect feedback data on client satisfaction?
7. Does the organization obtain and use staff feedback on existing quality initiatives?
12 Gutierrez, Maria, "Indicators for Assessing CQI Efforts," The Manager's Electronic Resource Center, (Boston: MSH) <http://erc.msh.org/mainpage.cfm?file=2.2.6.htm&module=quality&language=English> (accessed July 6, 2001).
Indicator Menu October 2006 52

Note: These key questions summarize the many dimensions that comprise an organizational commitment to quality assurance. These dimensions are detailed below. • Availability of quality standards or protocols. These items are easy to assess but require identification of
protocols for both service delivery (e.g., clinical protocols, counseling) and management (e.g., supervision, storage of supplies, infection prevention, MIS reporting) for each major type of service.
• Integration of quality assurance into the organization’s mission and strategy. This item indicates whether an
environment or organizational culture of quality improvement exists. • Integration of quality assurance into the organization’s plans and budget. Not all quality assurance activities will
require a separate line item budget; some of them are combined with other activities and are done only at marginal cost. Assessment of budget allocation can be difficult unless the budget is highly detailed and annotated.
• Performance/provider review of adherence to standards. As with the previous item, this aspect requires
measurement according to service delivery and management standards for each health service. It requires direct observation of staff (such as by a supervisor or mystery client); measurement can therefore be time consuming depending on the volume of services at a given facility.
• Mechanisms for obtaining client satisfaction feedback on quality. Measuring client satisfaction is the principal
means of knowing whether quality assurance initiatives are reaping any benefits. Among the numerous methodologies for measurement, the most common is the client exit interview. One of the weaknesses of exit interviews is that clients sometimes forget details of a visit or do not know what practices are acceptable. Clients may also fear impact of negative responses on availability of and access to services.
• Mechanisms for collecting staff perspectives on quality. Measurement in this area can reveal gaps between client
and provider understandings of quality. It can also help managers understand the extent to which providers feel encouraged or rewarded for taking initiative to address quality issues.
Proposed data sources: Organizational documents including service delivery guidelines; interviews with managers, supervisors, and other staff at all levels; budget; staff performance reviews; training curricula; client satisfaction surveys; suggestion boxes
Frequency of measure: Annually
Indicator Menu October 2006 53

1.1.5 Financial and Resource Management Systems Indicator: The accounting system generates regular reports tracking expenditures against the budget and noting variances Definition of terms used: “Generates regular reports” means that the accounting system tracks expenditures against the budget and produces through data summaries, information, and analyses on a periodic basis, consistent with the organization's fiscal year. A “budget” is a document that projects the costs, and in many cases, the revenues of a defined activity, program, project, or organization. It is also a financial plan that quantifies programmatic goals and objectives by guiding the allocation of financial and human resources. Purpose for tracking indicator: An effective accounting system demonstrates capacity to provide appropriate information needed for managerial control over and decisions about the use of funds. Key questions:
Item Percentage Evidence
1. What percent of organizational units submitted required financial reports as scheduled during the most recent reporting period?
2. What percent of the most recently submitted reports tracked expenditures against the budget and explained all variances?
Proposed measure: Percentage Item 1
Numerator: Number of units submitting financial reports on schedule Denominator: Number of units expected to submit financial reports
Item 2 Numerator: Number of units whose reports tracked expenditures against the budget and explained variances Denominator: Number of units submitting financial reports
Proposed data sources: Review of accounting and other financial management documents; key informant interviews Frequency of measure: Annually
Indicator Menu October 2006 54
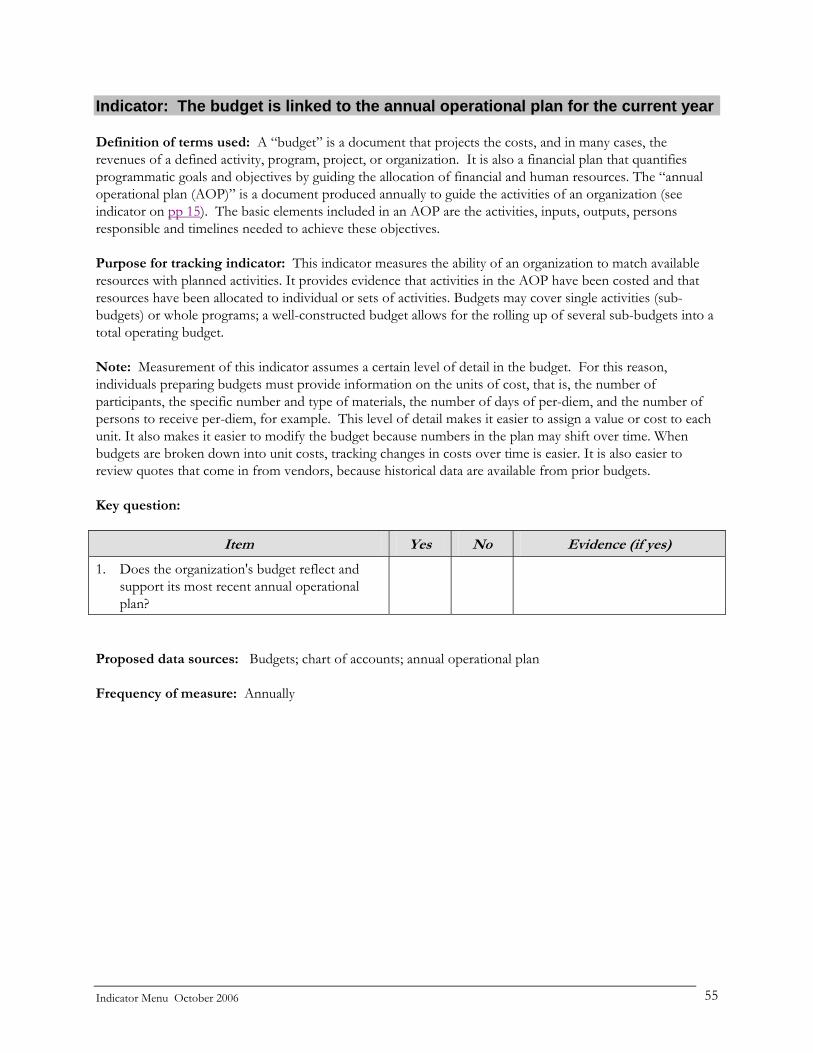
Indicator: The budget is linked to the annual operational plan for the current year Definition of terms used: A “budget” is a document that projects the costs, and in many cases, the revenues of a defined activity, program, project, or organization. It is also a financial plan that quantifies programmatic goals and objectives by guiding the allocation of financial and human resources. The “annual operational plan (AOP)” is a document produced annually to guide the activities of an organization (see indicator on pp 15). The basic elements included in an AOP are the activities, inputs, outputs, persons responsible and timelines needed to achieve these objectives. Purpose for tracking indicator: This indicator measures the ability of an organization to match available resources with planned activities. It provides evidence that activities in the AOP have been costed and that resources have been allocated to individual or sets of activities. Budgets may cover single activities (sub-budgets) or whole programs; a well-constructed budget allows for the rolling up of several sub-budgets into a total operating budget. Note: Measurement of this indicator assumes a certain level of detail in the budget. For this reason, individuals preparing budgets must provide information on the units of cost, that is, the number of participants, the specific number and type of materials, the number of days of per-diem, and the number of persons to receive per-diem, for example. This level of detail makes it easier to assign a value or cost to each unit. It also makes it easier to modify the budget because numbers in the plan may shift over time. When budgets are broken down into unit costs, tracking changes in costs over time is easier. It is also easier to review quotes that come in from vendors, because historical data are available from prior budgets. Key question:
Item Yes No Evidence (if yes)
1. Does the organization's budget reflect and support its most recent annual operational plan?
Proposed data sources: Budgets; chart of accounts; annual operational plan Frequency of measure: Annually
Indicator Menu October 2006 55
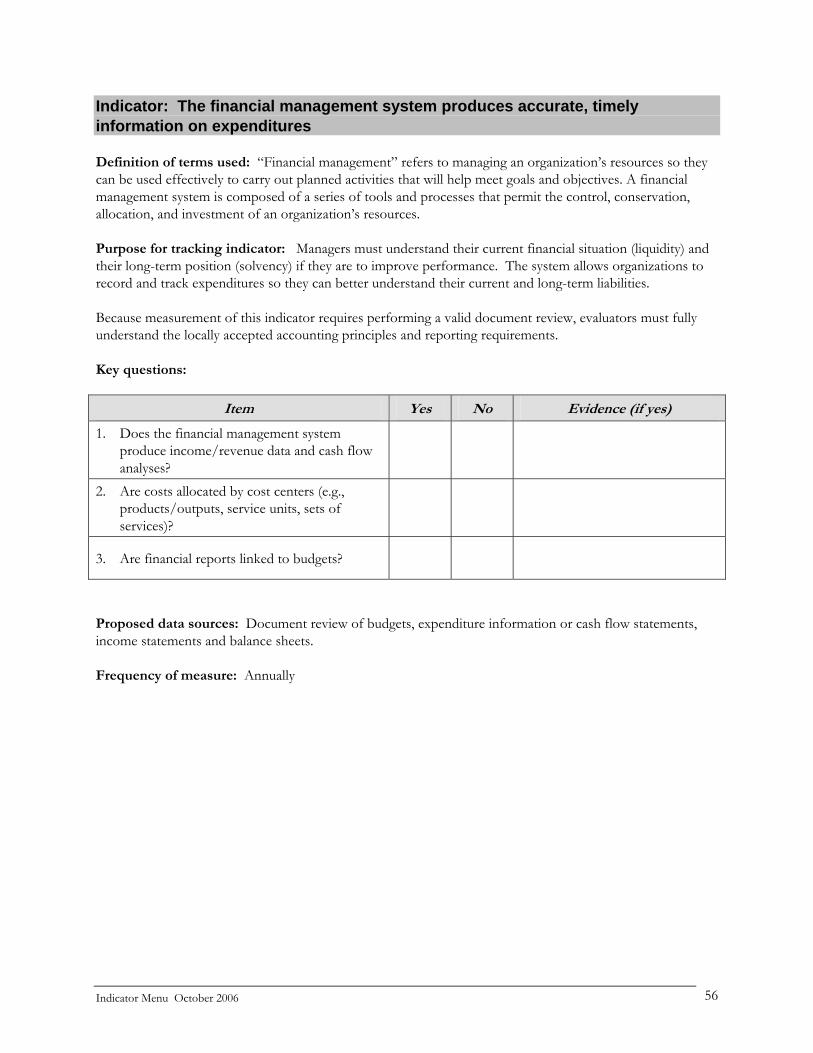
Indicator: The financial management system produces accurate, timely information on expenditures Definition of terms used: “Financial management” refers to managing an organization’s resources so they can be used effectively to carry out planned activities that will help meet goals and objectives. A financial management system is composed of a series of tools and processes that permit the control, conservation, allocation, and investment of an organization’s resources. Purpose for tracking indicator: Managers must understand their current financial situation (liquidity) and their long-term position (solvency) if they are to improve performance. The system allows organizations to record and track expenditures so they can better understand their current and long-term liabilities. Because measurement of this indicator requires performing a valid document review, evaluators must fully understand the locally accepted accounting principles and reporting requirements. Key questions:
Item Yes No Evidence (if yes)
1. Does the financial management system produce income/revenue data and cash flow analyses?
2. Are costs allocated by cost centers (e.g., products/outputs, service units, sets of services)?
3. Are financial reports linked to budgets?
Proposed data sources: Document review of budgets, expenditure information or cash flow statements, income statements and balance sheets. Frequency of measure: Annually
Indicator Menu October 2006 56
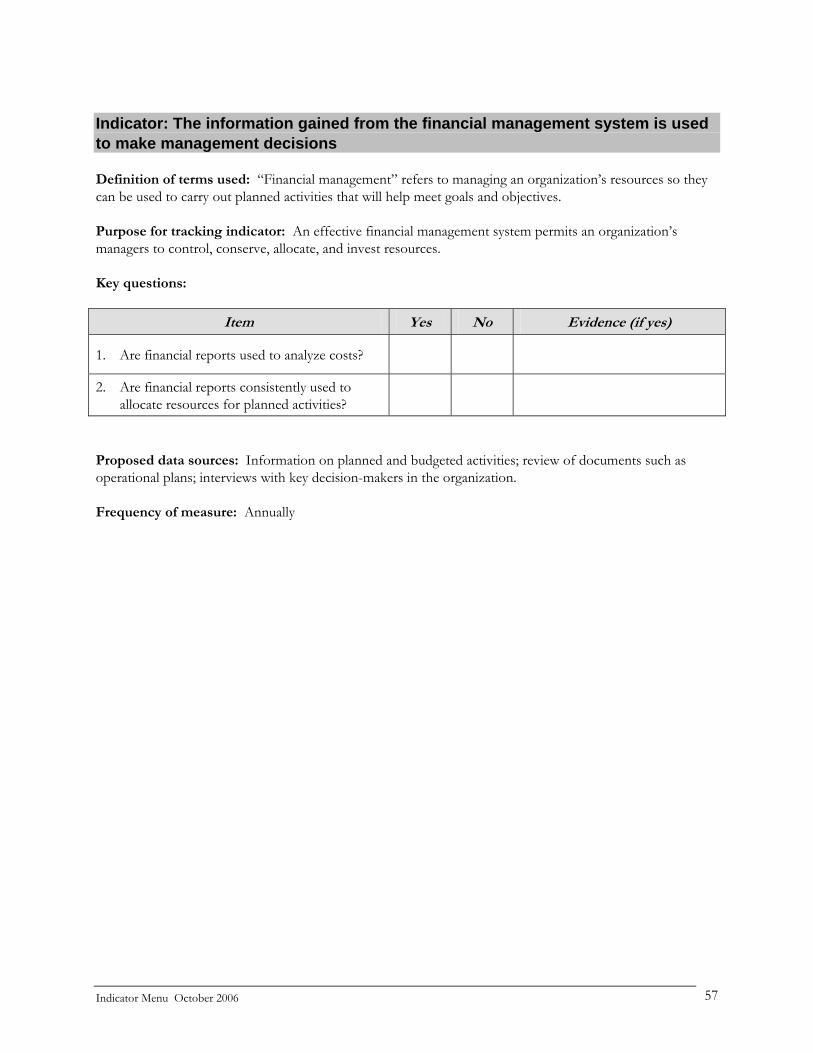
Indicator: The information gained from the financial management system is used to make management decisions
Definition of terms used: “Financial management” refers to managing an organization’s resources so they can be used to carry out planned activities that will help meet goals and objectives. Purpose for tracking indicator: An effective financial management system permits an organization’s managers to control, conserve, allocate, and invest resources.
Key questions:
Item Yes No Evidence (if yes)
1. Are financial reports used to analyze costs?
2. Are financial reports consistently used to allocate resources for planned activities?
Proposed data sources: Information on planned and budgeted activities; review of documents such as operational plans; interviews with key decision-makers in the organization. Frequency of measure: Annually
Indicator Menu October 2006 57

Indicator: Percent of regions/provinces/districts/municipalities using planning and budgeting procedures to strengthen service delivery performance.
Definition of terms used: “Planning and budgeting procedures” refer to annual activity planning and associated budgeting mandated by the government, NGO, or donor funded project. Purpose for tracking indicator: Planning and budgeting are important components of effective health service delivery.
Key questions:
Item Percentage Evidence
1. What percent of regions/ provinces/ districts/ or municipalities are using planning and budgeting procedures to strengthen service delivery performance?
Proposed measure: Percentages
Numerator: Number of regions/provinces/districts/municipalities using planning and budgeting procedures to strengthen service delivery performance Denominator: Number of regions/provinces/districts/municipalities mandated to use planning and budgeting procedures
Proposed data sources: Organizational records Frequency of measure: Annually
Indicator Menu October 2006 58
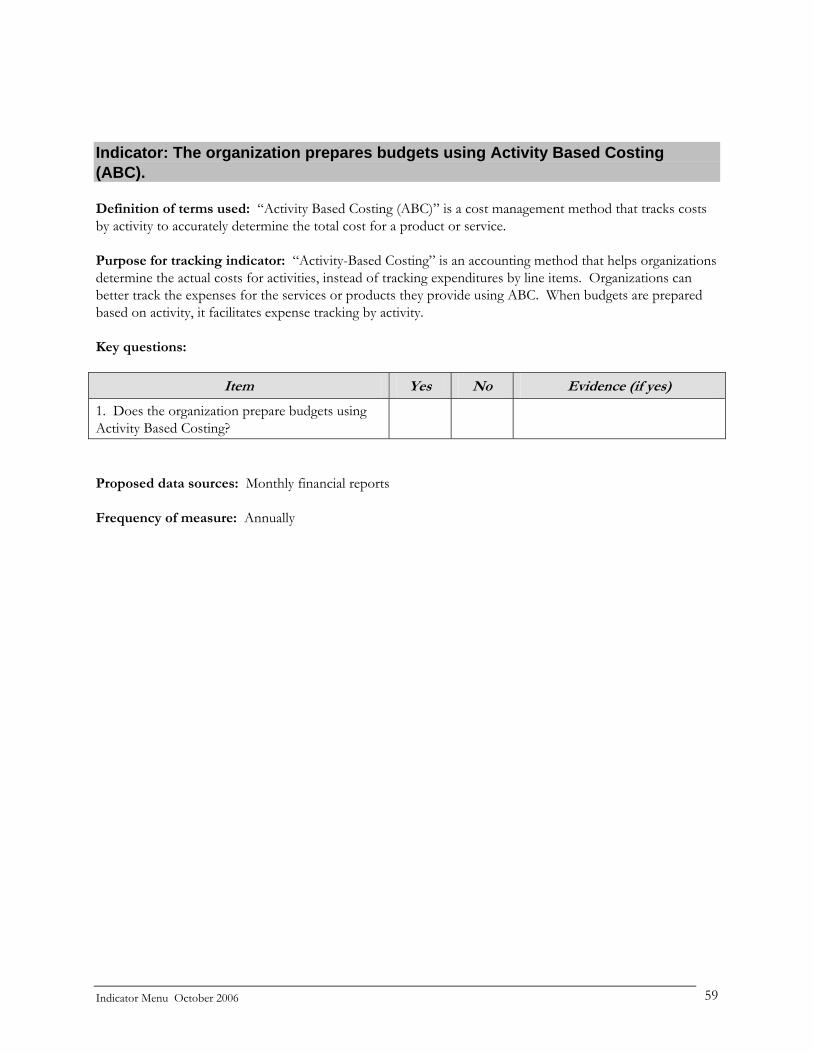
Indicator: The organization prepares budgets using Activity Based Costing (ABC).
Definition of terms used: “Activity Based Costing (ABC)” is a cost management method that tracks costs by activity to accurately determine the total cost for a product or service. Purpose for tracking indicator: “Activity-Based Costing” is an accounting method that helps organizations determine the actual costs for activities, instead of tracking expenditures by line items. Organizations can better track the expenses for the services or products they provide using ABC. When budgets are prepared based on activity, it facilitates expense tracking by activity.
Key questions:
Item Yes No Evidence (if yes)
1. Does the organization prepare budgets using Activity Based Costing?
Proposed data sources: Monthly financial reports Frequency of measure: Annually
Indicator Menu October 2006 59
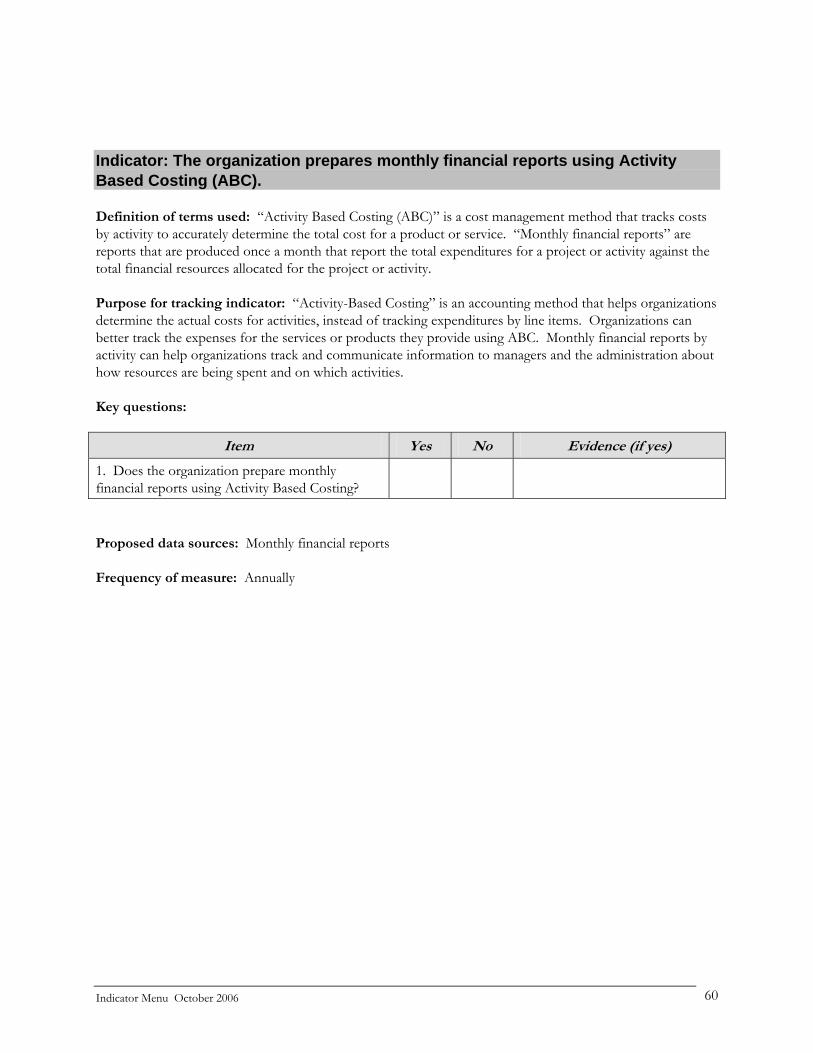
Indicator: The organization prepares monthly financial reports using Activity Based Costing (ABC).
Definition of terms used: “Activity Based Costing (ABC)” is a cost management method that tracks costs by activity to accurately determine the total cost for a product or service. “Monthly financial reports” are reports that are produced once a month that report the total expenditures for a project or activity against the total financial resources allocated for the project or activity. Purpose for tracking indicator: “Activity-Based Costing” is an accounting method that helps organizations determine the actual costs for activities, instead of tracking expenditures by line items. Organizations can better track the expenses for the services or products they provide using ABC. Monthly financial reports by activity can help organizations track and communicate information to managers and the administration about how resources are being spent and on which activities.
Key questions:
Item Yes No Evidence (if yes)
1. Does the organization prepare monthly financial reports using Activity Based Costing?
Proposed data sources: Monthly financial reports Frequency of measure: Annually
Indicator Menu October 2006 60
1.1.6 Logistics Management The indicators in this section have been used in recent years by programs in the MSH Center for Leadership and Management. Additional logistics management indicators are provided in: Compendium of Indicators for Evaluating Reproductive Health Programs, Measure Evaluation, August 2002. http://www.cpc.unc.edu/measure/publications/html/ms-02-06.html Rapid Pharmaceutical Management Assessment: An Indicator-based Approach, Management Sciences for Health and the Latin American and Caribbean Health and Nutrition and Sustainability Project, July 1995. Available on the MSH Health Manager’s Toolkit at: http://erc.msh.org/mainpage.cfm?file=4.31.htm&module=toolkit&language=English
Indicator Menu October 2006 61
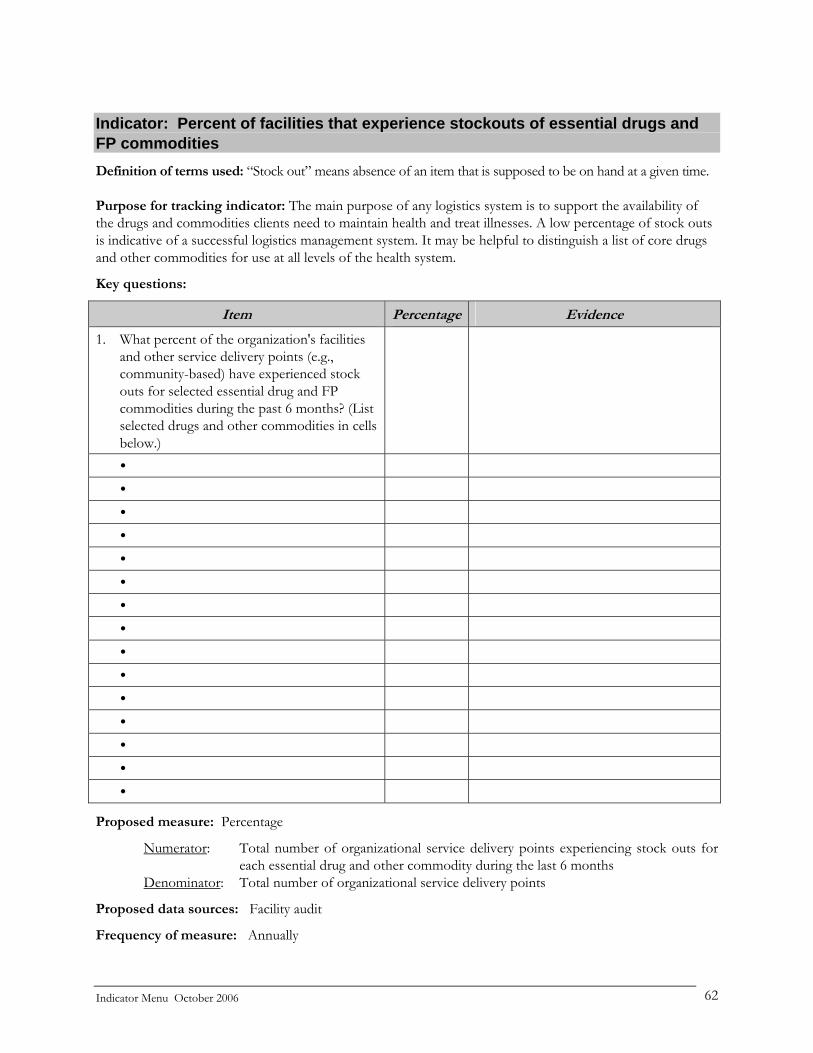
Indicator: Percent of facilities that experience stockouts of essential drugs and FP commodities
Definition of terms used: “Stock out” means absence of an item that is supposed to be on hand at a given time. Purpose for tracking indicator: The main purpose of any logistics system is to support the availability of the drugs and commodities clients need to maintain health and treat illnesses. A low percentage of stock outs is indicative of a successful logistics management system. It may be helpful to distinguish a list of core drugs and other commodities for use at all levels of the health system.
Key questions:
Item Percentage Evidence
1. What percent of the organization's facilities and other service delivery points (e.g., community-based) have experienced stock outs for selected essential drug and FP commodities during the past 6 months? (List selected drugs and other commodities in cells below.)
Proposed measure: Percentage
Numerator: Total number of organizational service delivery points experiencing stock outs for each essential drug and other commodity during the last 6 months
Denominator: Total number of organizational service delivery points
Proposed data sources: Facility audit
Frequency of measure: Annually
Indicator Menu October 2006 62

Indicator: Recorded stock inventory levels are consistent with actual levels
Purpose for tracking indicator: An organization's stock records must be accurate and current for effective inventory management, especially for making decisions regarding re-supply, procurement, and distribution. This indicator shows the discrepancies between stock records and physical counts for each item in the inventory Key questions:
Item Yes No Evidence (if yes)
1. Are stock records current and accurate at various levels of the system?
2. Are the staff of service delivery points using stock cards correctly?
3. Do stock records correspond to physical counts?
4. Are there written explanations of variances between recorded figures and physical counts?
Proposed data sources: Physical inventory counts; inventory stock records at various levels of the system; other inventory management system records Frequency of measure: Annually
Indicator Menu October 2006 63
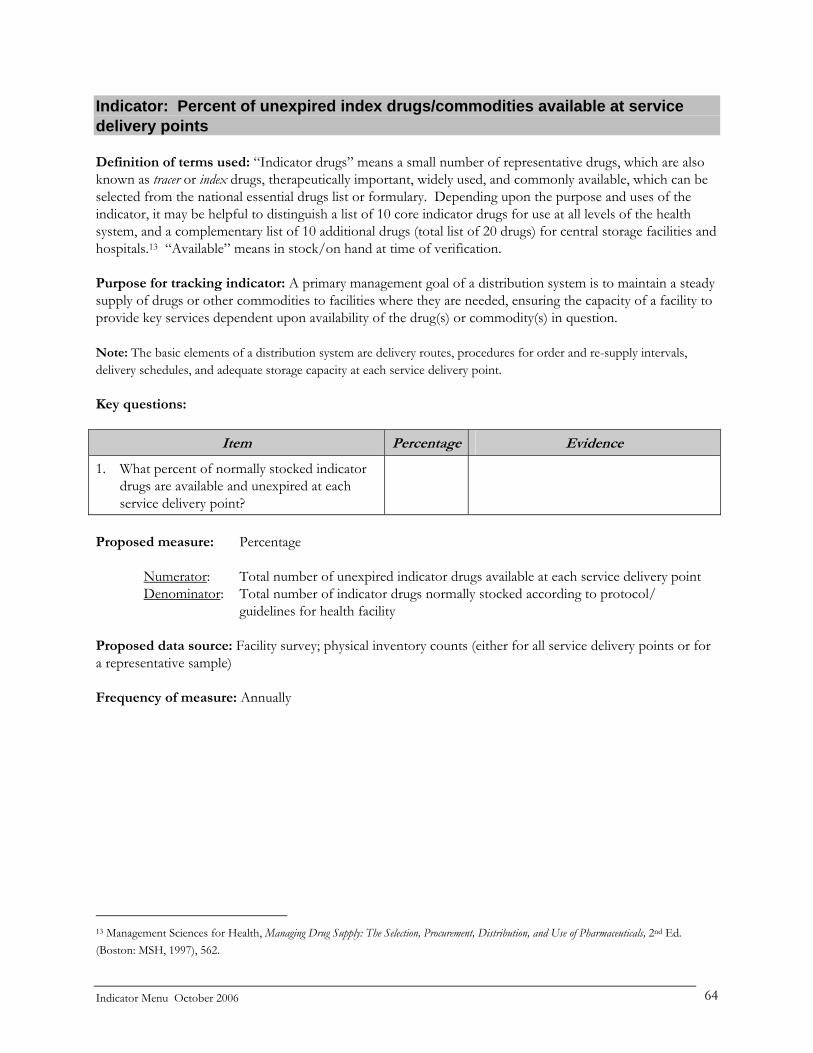
Indicator: Percent of unexpired index drugs/commodities available at service delivery points
Definition of terms used: “Indicator drugs” means a small number of representative drugs, which are also known as tracer or index drugs, therapeutically important, widely used, and commonly available, which can be selected from the national essential drugs list or formulary. Depending upon the purpose and uses of the indicator, it may be helpful to distinguish a list of 10 core indicator drugs for use at all levels of the health system, and a complementary list of 10 additional drugs (total list of 20 drugs) for central storage facilities and hospitals.13 “Available” means in stock/on hand at time of verification.
Purpose for tracking indicator: A primary management goal of a distribution system is to maintain a steady supply of drugs or other commodities to facilities where they are needed, ensuring the capacity of a facility to provide key services dependent upon availability of the drug(s) or commodity(s) in question. Note: The basic elements of a distribution system are delivery routes, procedures for order and re-supply intervals, delivery schedules, and adequate storage capacity at each service delivery point. Key questions:
Item Percentage Evidence
1. What percent of normally stocked indicator drugs are available and unexpired at each service delivery point?
Proposed measure: Percentage
Numerator: Total number of unexpired indicator drugs available at each service delivery point Denominator: Total number of indicator drugs normally stocked according to protocol/
guidelines for health facility Proposed data source: Facility survey; physical inventory counts (either for all service delivery points or for a representative sample) Frequency of measure: Annually
13 Management Sciences for Health, Managing Drug Supply: The Selection, Procurement, Distribution, and Use of Pharmaceuticals, 2nd Ed. (Boston: MSH, 1997), 562.
Indicator Menu October 2006 64
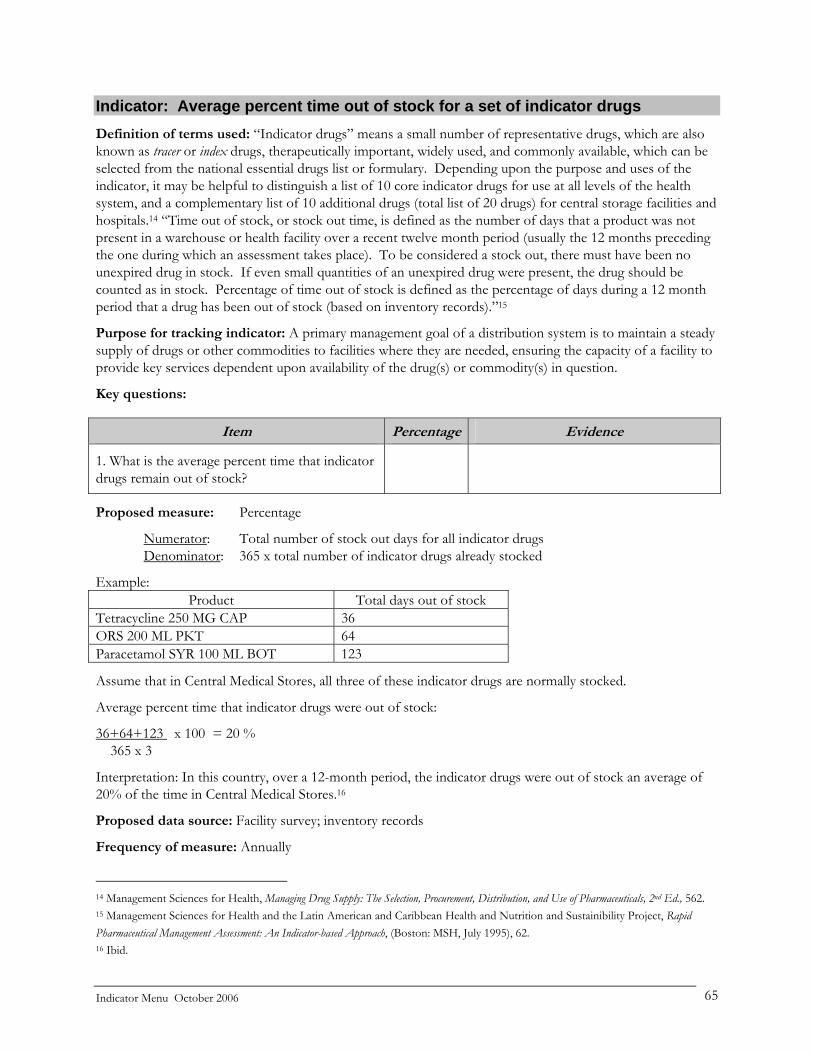
Indicator: Average percent time out of stock for a set of indicator drugs
Definition of terms used: “Indicator drugs” means a small number of representative drugs, which are also known as tracer or index drugs, therapeutically important, widely used, and commonly available, which can be selected from the national essential drugs list or formulary. Depending upon the purpose and uses of the indicator, it may be helpful to distinguish a list of 10 core indicator drugs for use at all levels of the health system, and a complementary list of 10 additional drugs (total list of 20 drugs) for central storage facilities and hospitals.14 “Time out of stock, or stock out time, is defined as the number of days that a product was not present in a warehouse or health facility over a recent twelve month period (usually the 12 months preceding the one during which an assessment takes place). To be considered a stock out, there must have been no unexpired drug in stock. If even small quantities of an unexpired drug were present, the drug should be counted as in stock. Percentage of time out of stock is defined as the percentage of days during a 12 month period that a drug has been out of stock (based on inventory records).”15
Purpose for tracking indicator: A primary management goal of a distribution system is to maintain a steady supply of drugs or other commodities to facilities where they are needed, ensuring the capacity of a facility to provide key services dependent upon availability of the drug(s) or commodity(s) in question.
Key questions:
Item Percentage Evidence
1. What is the average percent time that indicator drugs remain out of stock?
Proposed measure: Percentage
Numerator: Total number of stock out days for all indicator drugs Denominator: 365 x total number of indicator drugs already stocked
Example: Product Total days out of stock
Tetracycline 250 MG CAP 36 ORS 200 ML PKT 64 Paracetamol SYR 100 ML BOT 123
Assume that in Central Medical Stores, all three of these indicator drugs are normally stocked.
Average percent time that indicator drugs were out of stock:
36+64+123 x 100 = 20 % 365 x 3
Interpretation: In this country, over a 12-month period, the indicator drugs were out of stock an average of 20% of the time in Central Medical Stores.16
Proposed data source: Facility survey; inventory records
Frequency of measure: Annually
14 Management Sciences for Health, Managing Drug Supply: The Selection, Procurement, Distribution, and Use of Pharmaceuticals, 2nd Ed., 562. 15 Management Sciences for Health and the Latin American and Caribbean Health and Nutrition and Sustainibility Project, Rapid Pharmaceutical Management Assessment: An Indicator-based Approach, (Boston: MSH, July 1995), 62. 16 Ibid.
Indicator Menu October 2006 65
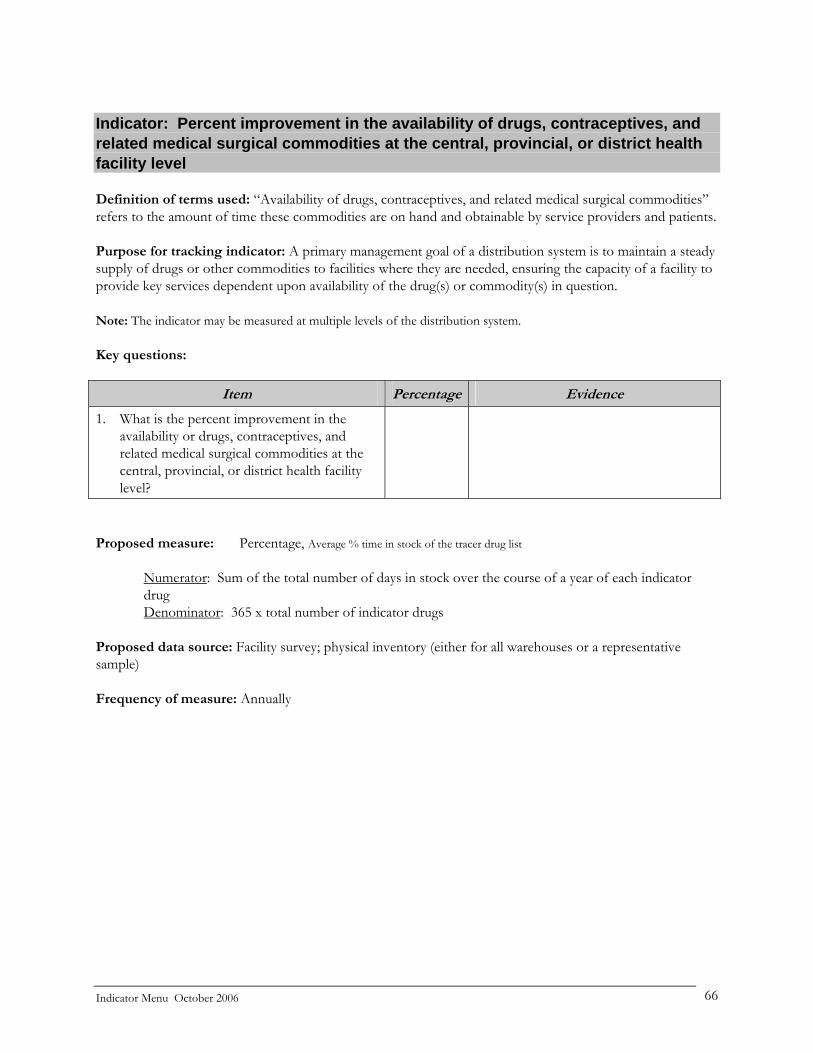
Indicator: Percent improvement in the availability of drugs, contraceptives, and related medical surgical commodities at the central, provincial, or district health facility level Definition of terms used: “Availability of drugs, contraceptives, and related medical surgical commodities” refers to the amount of time these commodities are on hand and obtainable by service providers and patients. Purpose for tracking indicator: A primary management goal of a distribution system is to maintain a steady supply of drugs or other commodities to facilities where they are needed, ensuring the capacity of a facility to provide key services dependent upon availability of the drug(s) or commodity(s) in question. Note: The indicator may be measured at multiple levels of the distribution system. Key questions:
Item Percentage Evidence
1. What is the percent improvement in the availability or drugs, contraceptives, and related medical surgical commodities at the central, provincial, or district health facility level?
Proposed measure: Percentage, Average % time in stock of the tracer drug list
Numerator: Sum of the total number of days in stock over the course of a year of each indicator drug Denominator: 365 x total number of indicator drugs
Proposed data source: Facility survey; physical inventory (either for all warehouses or a representative sample) Frequency of measure: Annually
Indicator Menu October 2006 66

Indicator: Percent of facilities that maintain acceptable storage conditions Definition of terms used: "Acceptable" refers to the international standards for acceptable storage conditions:17 These standards are:
• Adequate ventilation of the storage area • Adequate lighting • Dry storage area • Use of shelves and pallets for storing commodities • Regular cleaning of the storage area • Pest-free • Properly stacked supplies • Storage area is safe and secure • Good record keeping • Adequate stock levels • Assurance of quality • Adequate workspace
Purpose for tracking indicator: This indicator measures the conditions of storage facilities compared to a list of conditions required to protect the integrity of products. Evaluators can apply the indicator at each level of the logistics system to identify facilities that need improvement. Key question:
Item Percentage Evidence
What percent of the organization's storage facilities meet all the standards cited in The Family Planning Manager’s Handbook or some other reputable source?
Proposed measure: Percentage
Numerator: Number of storage facilities meeting all the conditions for acceptable storage (or some agreed sub-set of those conditions) Denominator: Total number of storage facilities examined
Proposed data sources: Facility survey/site visits (either for all facilities or for a representative sample), by a highly knowledgeable observer, using a checklist of acceptable storage conditions Frequency of measure: Annually
17 See MSH’s The Family Planning Manager’s Handbook, page 252, for complete definitions of these terms.
Indicator Menu October 2006 67
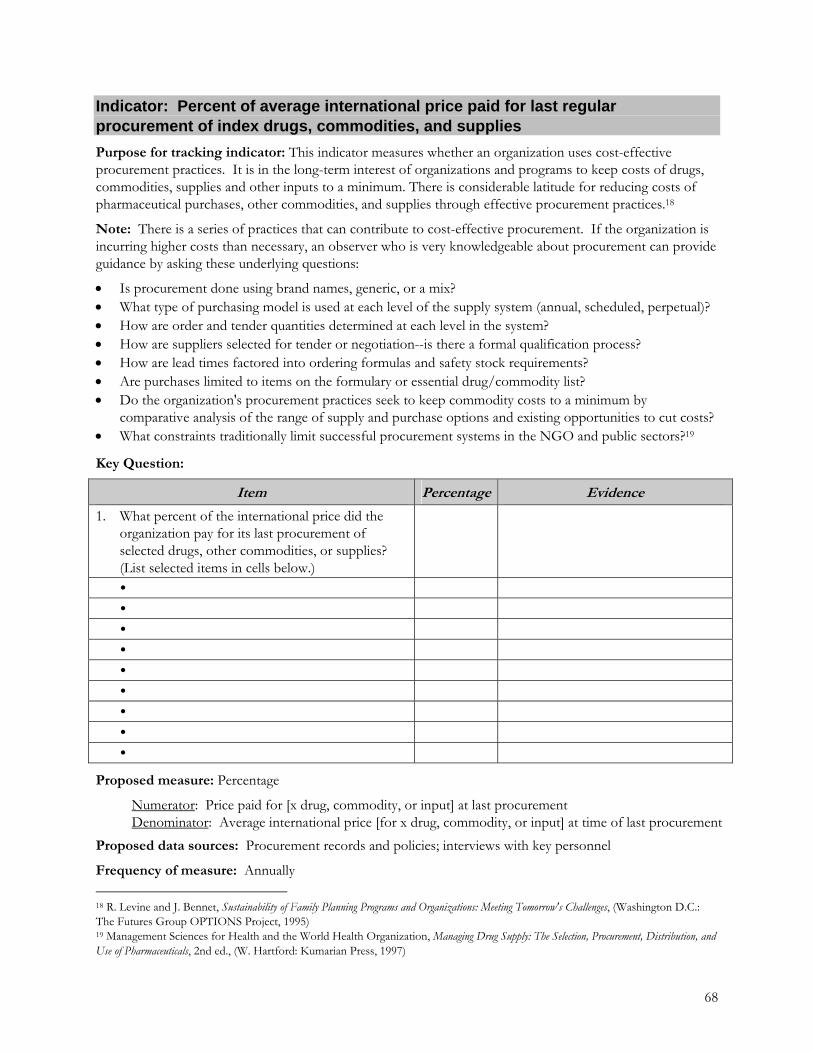
Indicator: Percent of average international price paid for last regular procurement of index drugs, commodities, and supplies
Purpose for tracking indicator: This indicator measures whether an organization uses cost-effective procurement practices. It is in the long-term interest of organizations and programs to keep costs of drugs, commodities, supplies and other inputs to a minimum. There is considerable latitude for reducing costs of pharmaceutical purchases, other commodities, and supplies through effective procurement practices.18
Note: There is a series of practices that can contribute to cost-effective procurement. If the organization is incurring higher costs than necessary, an observer who is very knowledgeable about procurement can provide guidance by asking these underlying questions:
• Is procurement done using brand names, generic, or a mix? • What type of purchasing model is used at each level of the supply system (annual, scheduled, perpetual)? • How are order and tender quantities determined at each level in the system? • How are suppliers selected for tender or negotiation--is there a formal qualification process? • How are lead times factored into ordering formulas and safety stock requirements? • Are purchases limited to items on the formulary or essential drug/commodity list? • Do the organization's procurement practices seek to keep commodity costs to a minimum by
comparative analysis of the range of supply and purchase options and existing opportunities to cut costs? • What constraints traditionally limit successful procurement systems in the NGO and public sectors?19
Key Question:
Item Percentage Evidence
1. What percent of the international price did the organization pay for its last procurement of selected drugs, other commodities, or supplies? (List selected items in cells below.)
Proposed measure: Percentage
Numerator: Price paid for [x drug, commodity, or input] at last procurement Denominator: Average international price [for x drug, commodity, or input] at time of last procurement
Proposed data sources: Procurement records and policies; interviews with key personnel
Frequency of measure: Annually 18 R. Levine and J. Bennet, Sustainability of Family Planning Programs and Organizations: Meeting Tomorrow's Challenges, (Washington D.C.: The Futures Group OPTIONS Project, 1995) 19 Management Sciences for Health and the World Health Organization, Managing Drug Supply: The Selection, Procurement, Distribution, and Use of Pharmaceuticals, 2nd ed., (W. Hartford: Kumarian Press, 1997)
68

Indicator: Percent of clinics and health centers that experience deceasing stock-outs of essential drugs or other supplies. Definition of terms used: “Essential drugs” include all drugs that are necessary to have in stock to respond to the most common and most pressing health needs of the population. “Stock-outs of essential drugs or other supplies” are when essential drugs or products expected to be provided by that site are not in stock during a certain period. Purpose for tracking indicator: The decrease in the number of health centers experiencing stock-outs of essential drugs indicates a functioning drug management system. Key question:
Item Percentage Evidence
What percent of the organization's clinics and health centers experience decreasing stock-outs of essential drugs or other supplies?
Proposed measure: percentage
Numerator: Number of clinics and health centers assessed that experienced a decrease in stock-outs of essential drugs. Denominator: Total number of clinics and health centers operated by the organization.
Proposed data sources: Reports on drug procurement and usage from clinics and health centers. Frequency of measure: Annually.
69

Indicator: Inventory records are accurate and up-to-date. Definition of terms used: “Accurate” means that the records correctly reflect the inventory that is currently in-stock. “Up-to-date” means that the records have been recently updated. Purpose for tracking indicator: Accurate inventory records are an important component of a functioning drug management system. Key question:
Item Yes No Evidence (if yes)
1. Are inventory records accurate and up-to-date?
Proposed data sources: Review of inventory records; physical inventory counts. Frequency of measure: Monthly
70
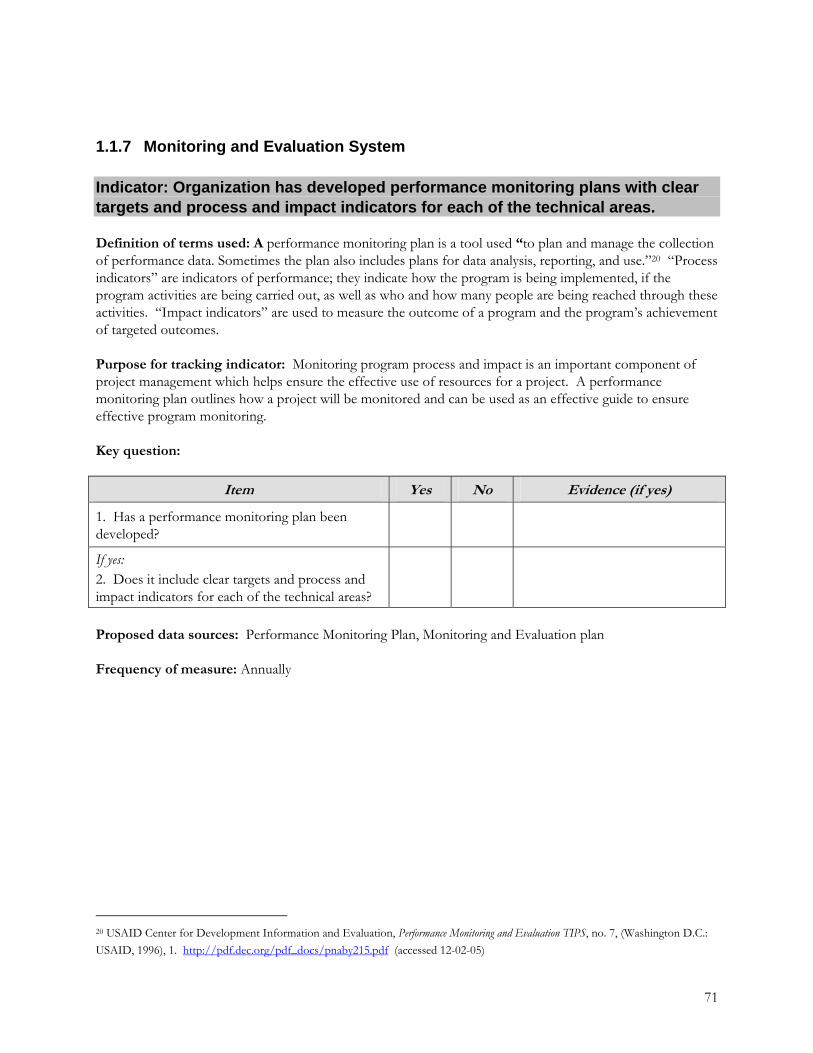
1.1.7 Monitoring and Evaluation System Indicator: Organization has developed performance monitoring plans with clear targets and process and impact indicators for each of the technical areas. Definition of terms used: A performance monitoring plan is a tool used “to plan and manage the collection of performance data. Sometimes the plan also includes plans for data analysis, reporting, and use.”20 “Process indicators” are indicators of performance; they indicate how the program is being implemented, if the program activities are being carried out, as well as who and how many people are being reached through these activities. “Impact indicators” are used to measure the outcome of a program and the program’s achievement of targeted outcomes. Purpose for tracking indicator: Monitoring program process and impact is an important component of project management which helps ensure the effective use of resources for a project. A performance monitoring plan outlines how a project will be monitored and can be used as an effective guide to ensure effective program monitoring. Key question:
Item Yes No Evidence (if yes)
1. Has a performance monitoring plan been developed?
If yes: 2. Does it include clear targets and process and impact indicators for each of the technical areas?
Proposed data sources: Performance Monitoring Plan, Monitoring and Evaluation plan Frequency of measure: Annually
20 USAID Center for Development Information and Evaluation, Performance Monitoring and Evaluation TIPS, no. 7, (Washington D.C.: USAID, 1996), 1. http://pdf.dec.org/pdf_docs/pnaby215.pdf (accessed 12-02-05)
71
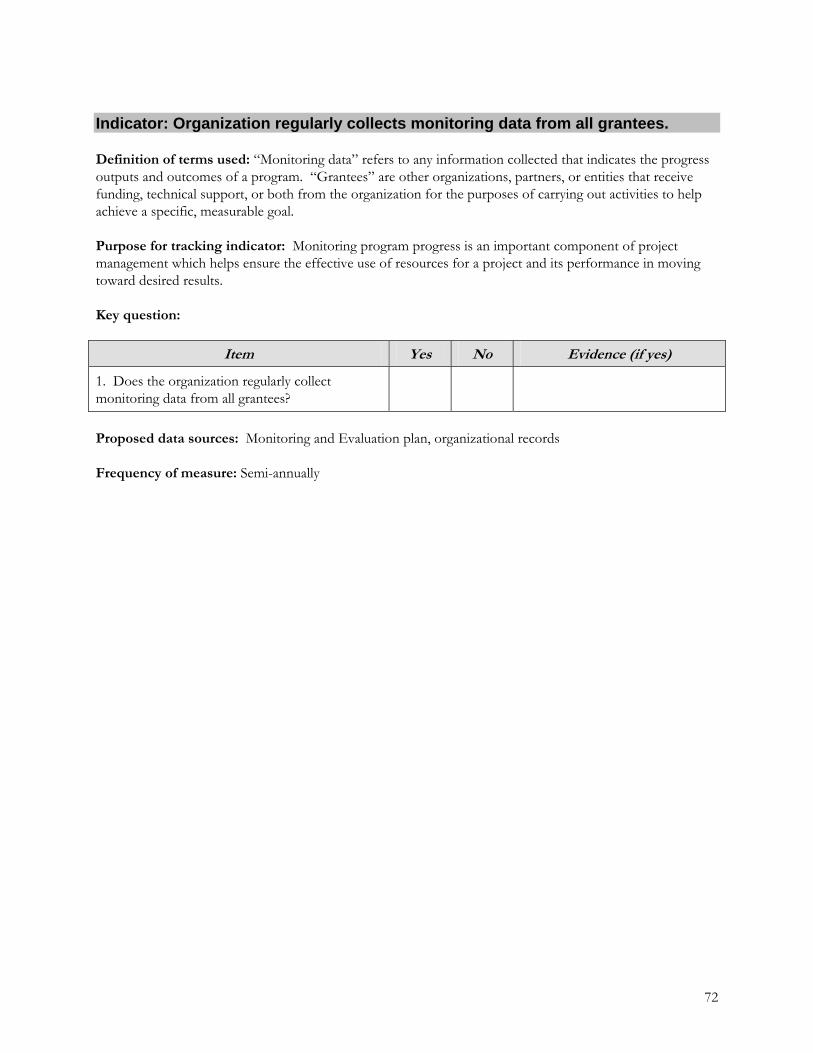
Indicator: Organization regularly collects monitoring data from all grantees. Definition of terms used: “Monitoring data” refers to any information collected that indicates the progress outputs and outcomes of a program. “Grantees” are other organizations, partners, or entities that receive funding, technical support, or both from the organization for the purposes of carrying out activities to help achieve a specific, measurable goal. Purpose for tracking indicator: Monitoring program progress is an important component of project management which helps ensure the effective use of resources for a project and its performance in moving toward desired results. Key question:
Item Yes No Evidence (if yes)
1. Does the organization regularly collect monitoring data from all grantees?
Proposed data sources: Monitoring and Evaluation plan, organizational records Frequency of measure: Semi-annually
72
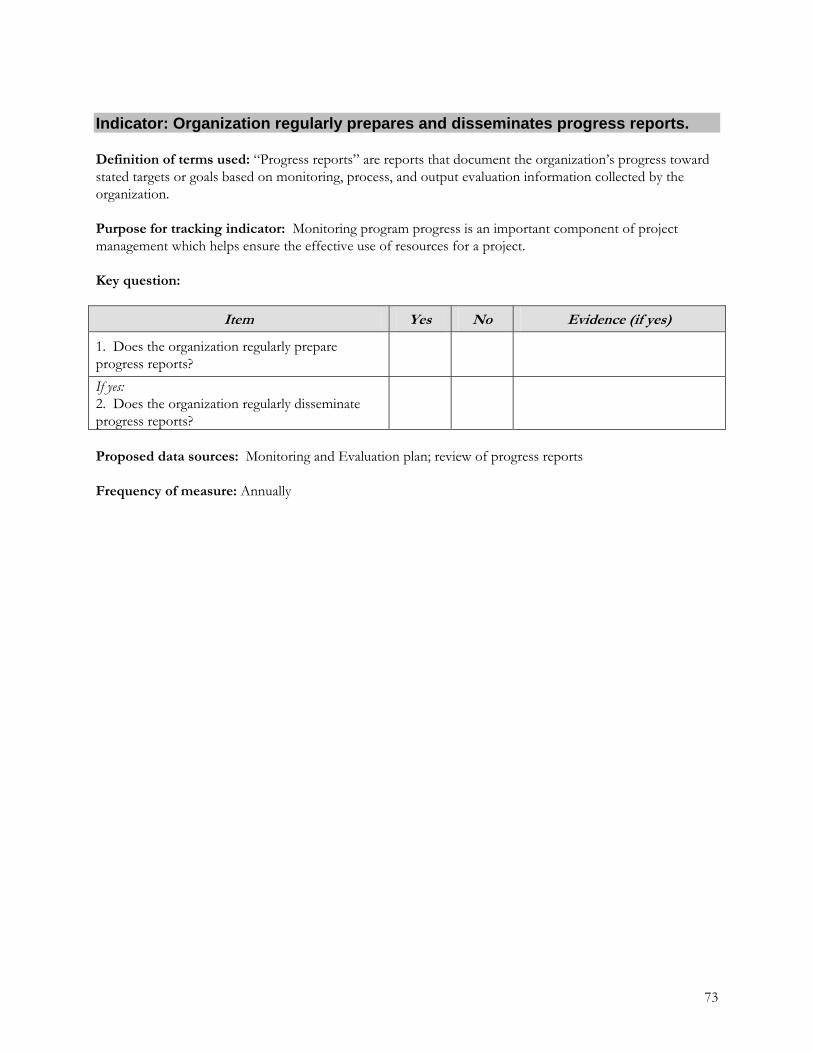
Indicator: Organization regularly prepares and disseminates progress reports. Definition of terms used: “Progress reports” are reports that document the organization’s progress toward stated targets or goals based on monitoring, process, and output evaluation information collected by the organization. Purpose for tracking indicator: Monitoring program progress is an important component of project management which helps ensure the effective use of resources for a project. Key question:
Item Yes No Evidence (if yes)
1. Does the organization regularly prepare progress reports?
If yes: 2. Does the organization regularly disseminate progress reports?
Proposed data sources: Monitoring and Evaluation plan; review of progress reports Frequency of measure: Annually
73

2) INDICATORS OF WORK GROUP AND ORGANIZATIONAL LEADERSHIP CAPACITY The MSH approach to the measurement of leadership is guided by its framework of leading and managing practices (see Appendix A). This section of the Guide focuses on indicators for leading, defined as “enabling others to face challenges and achieve results under complex conditions.”21
The framework includes four interrelated practices that are considered critical to the capacity for leading: scanning, focusing, aligning/mobilizing, and inspiring. Together these practices form an approach to leadership development that improves team effectiveness as a means to achieving organizational goals. And while inputs in leadership development often begin with the individual, the indicators in this section focus on the work group and organizational levels. With regard to the four recommended practices, the indicators measure the extent to which work groups and organizations engage in these practices as a matter of routine, no matter what specific challenges they may face. The organization of indicators in this section is as follows: Indicators for Leadership Development
Application of leadership practices at the work group level:
• Scanning • Focusing • Aligning and Mobilizing • Inspiring
Development and use of leadership processes at the organizational level:
• Process to develop future leaders from within the organization or program • Organizational coaching and mentoring
Intermediate Indicator for Leadership Development
• Work group climate
21 Management Sciences for Health, Managers Who Lead: A Handbook for Improving Health Services, (Boston: MSH, 2005)
74
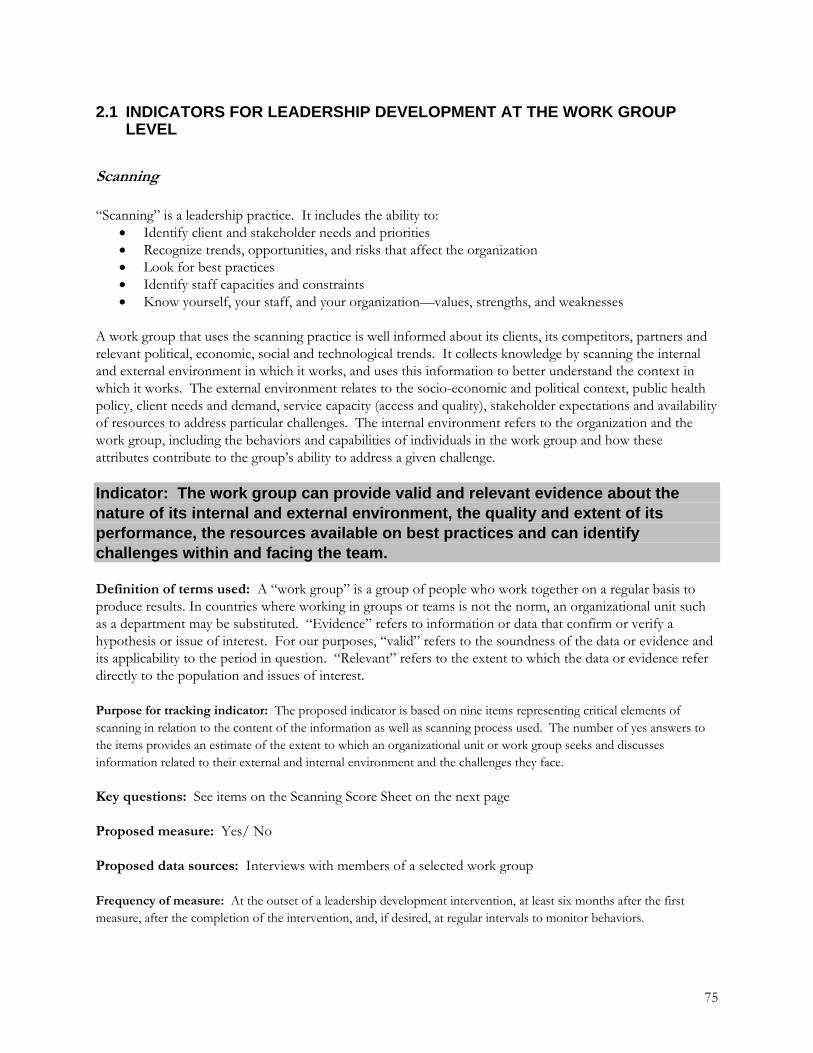
2.1 INDICATORS FOR LEADERSHIP DEVELOPMENT AT THE WORK GROUP LEVEL
Scanning “Scanning” is a leadership practice. It includes the ability to:
• Identify client and stakeholder needs and priorities • Recognize trends, opportunities, and risks that affect the organization • Look for best practices • Identify staff capacities and constraints • Know yourself, your staff, and your organization—values, strengths, and weaknesses
A work group that uses the scanning practice is well informed about its clients, its competitors, partners and relevant political, economic, social and technological trends. It collects knowledge by scanning the internal and external environment in which it works, and uses this information to better understand the context in which it works. The external environment relates to the socio-economic and political context, public health policy, client needs and demand, service capacity (access and quality), stakeholder expectations and availability of resources to address particular challenges. The internal environment refers to the organization and the work group, including the behaviors and capabilities of individuals in the work group and how these attributes contribute to the group’s ability to address a given challenge. Indicator: The work group can provide valid and relevant evidence about the nature of its internal and external environment, the quality and extent of its performance, the resources available on best practices and can identify challenges within and facing the team. Definition of terms used: A “work group” is a group of people who work together on a regular basis to produce results. In countries where working in groups or teams is not the norm, an organizational unit such as a department may be substituted. “Evidence” refers to information or data that confirm or verify a hypothesis or issue of interest. For our purposes, “valid” refers to the soundness of the data or evidence and its applicability to the period in question. “Relevant” refers to the extent to which the data or evidence refer directly to the population and issues of interest. Purpose for tracking indicator: The proposed indicator is based on nine items representing critical elements of scanning in relation to the content of the information as well as scanning process used. The number of yes answers to the items provides an estimate of the extent to which an organizational unit or work group seeks and discusses information related to their external and internal environment and the challenges they face. Key questions: See items on the Scanning Score Sheet on the next page Proposed measure: Yes/ No Proposed data sources: Interviews with members of a selected work group Frequency of measure: At the outset of a leadership development intervention, at least six months after the first measure, after the completion of the intervention, and, if desired, at regular intervals to monitor behaviors.
75

SCANNING SCORE SHEET Key Questions:
In the past 3 months has the work group...
Item Yes No Evidence (if yes)
1. Reviewed and discussed information from the following sources:
Service statistics?
Client satisfaction surveys?
Community-based surveys?
Policy related issues/statements?
Other, please specify _______________
2. Reviewed and discussed the strengths, weaknesses and/or needs of the work group members?
3. Exchanged ideas and/or information with external or internal partners?
4. Requested input and participation from all work group members during regular meetings?
5. Reviewed best practices related to work group goals and objectives?
76
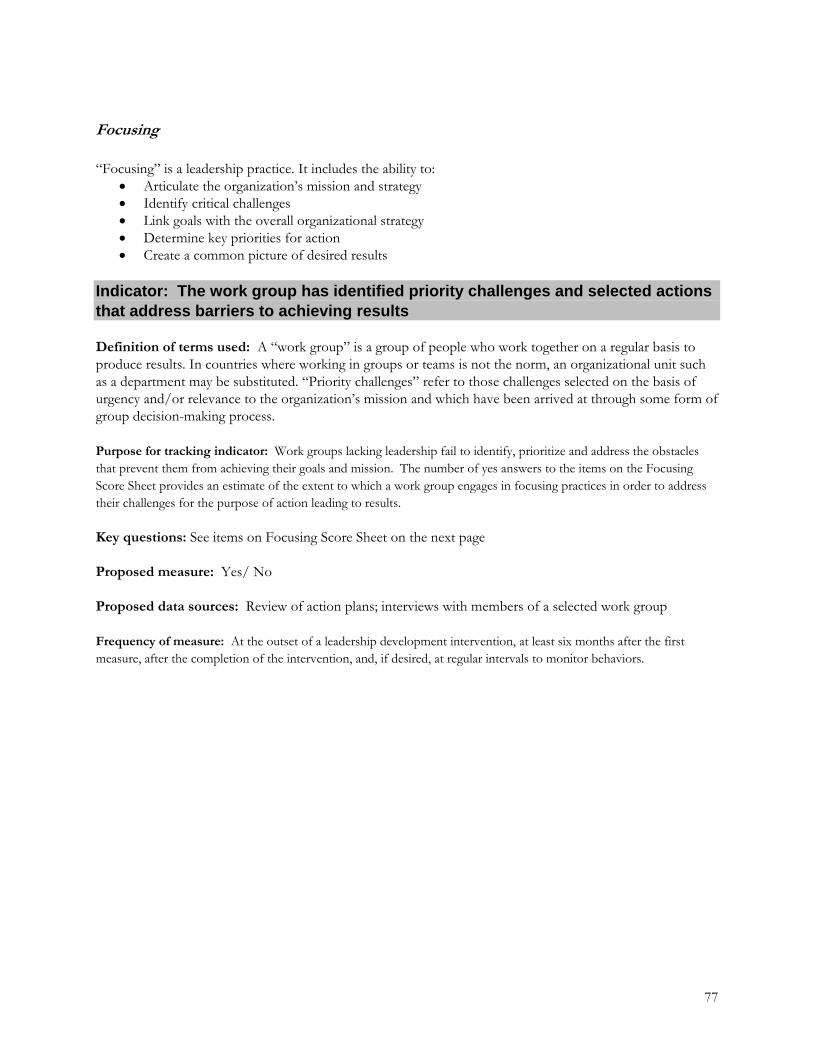
Focusing “Focusing” is a leadership practice. It includes the ability to:
• Articulate the organization’s mission and strategy • Identify critical challenges • Link goals with the overall organizational strategy • Determine key priorities for action • Create a common picture of desired results
Indicator: The work group has identified priority challenges and selected actions that address barriers to achieving results Definition of terms used: A “work group” is a group of people who work together on a regular basis to produce results. In countries where working in groups or teams is not the norm, an organizational unit such as a department may be substituted. “Priority challenges” refer to those challenges selected on the basis of urgency and/or relevance to the organization’s mission and which have been arrived at through some form of group decision-making process. Purpose for tracking indicator: Work groups lacking leadership fail to identify, prioritize and address the obstacles that prevent them from achieving their goals and mission. The number of yes answers to the items on the Focusing Score Sheet provides an estimate of the extent to which a work group engages in focusing practices in order to address their challenges for the purpose of action leading to results. Key questions: See items on Focusing Score Sheet on the next page Proposed measure: Yes/ No Proposed data sources: Review of action plans; interviews with members of a selected work group Frequency of measure: At the outset of a leadership development intervention, at least six months after the first measure, after the completion of the intervention, and, if desired, at regular intervals to monitor behaviors.
77

FOCUSING SCORE SHEET Key Questions:
In the past 3 months has the work group...
Item Yes No Evidence (if yes)
1. Collectively reviewed or developed a mission and/or vision?
2. Prioritized critical challenges?
3. Developed strategies to overcome barriers to achieving results?
4. Linked work group goals with overall organizational strategy?
5. Referred to their plans when faced with important decisions or new challenges?
6. Clarified individual roles and responsibilities of members within the team in relation to the team’s work objectives?
78

Aligning and Mobilizing “Aligning and mobilizing” are leadership practices. They include the ability to:
• Ensure congruence of values, mission, strategy, structure, systems, and daily actions • Facilitate teamwork • Unite key stakeholders around an inspiring vision • Link goals with rewards and recognition • Enlist stakeholders to commit resources
Indicator: Work group responsibilities and resources are internally aligned and work group goals are externally aligned in order to address selected challenges and meet stated objectives Definition of terms used: A “work group” is a group of people who work together on a regular basis to produce results. In countries where working in groups or teams is not the norm, an organizational unit such as a department may be substituted. Work group goals that are “externally aligned” are in line with the organizational mission, vision and strategy. An “internally aligned” work group means tasks are assigned to each member of the work group according to their capabilities and interests.
Purpose for tracking indicator: Clear alignment of activities and goals is an important element in the effective mobilization and use of resources. The number of yes answers to the items on the Aligning and Mobilizing Score Sheet provides an estimate of the extent to which a work group shares goals and aspirations, is well organized, and has access to the necessary resources to get the job done. Key questions: See items on Aligning/Mobilizing Score Sheet on the next page Proposed measure: Yes/ No Proposed data sources: Interviews with members of a selected team or work group Frequency of measure: At the outset of a leadership development intervention, at least six months after the first measure, after the completion of the intervention, and, if desired, at regular intervals to monitor behaviors.
79
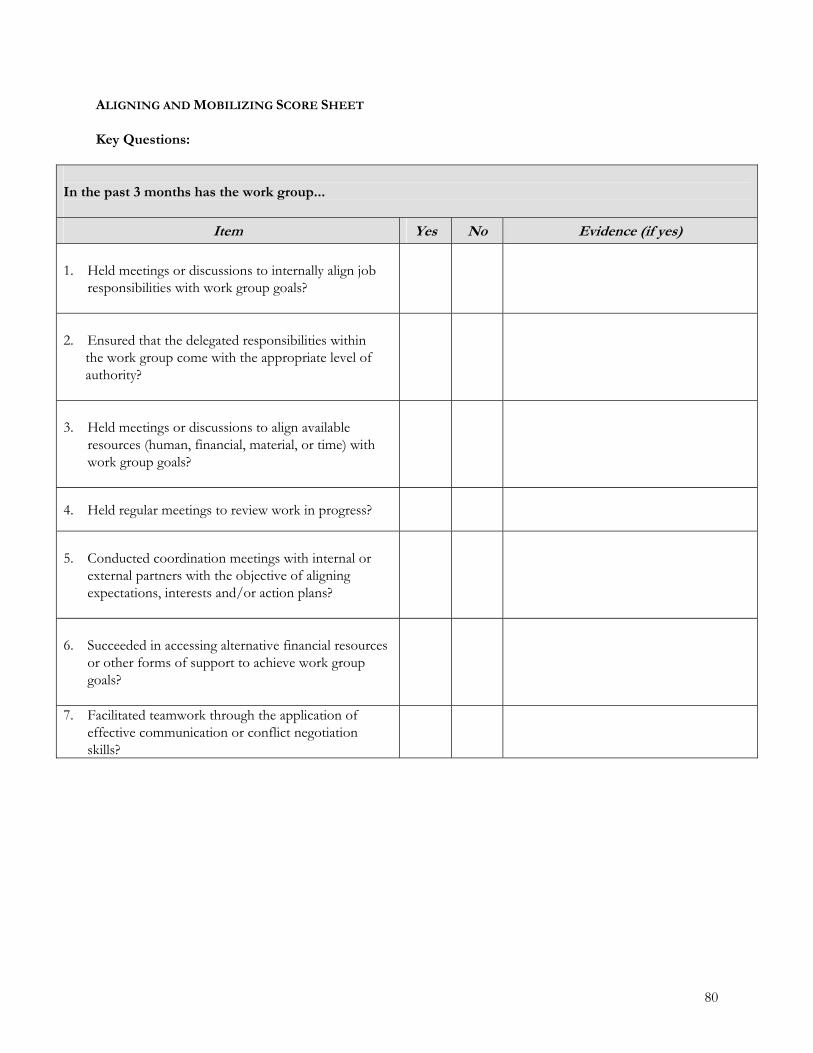
ALIGNING AND MOBILIZING SCORE SHEET Key Questions:
In the past 3 months has the work group...
Item Yes No Evidence (if yes)
1. Held meetings or discussions to internally align job
responsibilities with work group goals?
2. Ensured that the delegated responsibilities within the work group come with the appropriate level of authority?
3. Held meetings or discussions to align available
resources (human, financial, material, or time) with work group goals?
4. Held regular meetings to review work in progress?
5. Conducted coordination meetings with internal or
external partners with the objective of aligning expectations, interests and/or action plans?
6. Succeeded in accessing alternative financial resources
or other forms of support to achieve work group goals?
7. Facilitated teamwork through the application of effective communication or conflict negotiation skills?
80

Inspiring
Inspiring is a leadership practice. It includes the ability to:
• Ensure congruence of values, mission, strategy, structure, systems, and daily actions • Facilitate teamwork • Unite key stakeholders around an inspiring vision • Link goals with rewards and recognition • Enlist stakeholders to commit resources
Indicator: The work groups is committed to the organization’s mission and to continuous learning, improvement and innovation Definition of terms used: A “work group” is a group of people who work together on a regular basis to produce results. The organizational “mission” is a written expression of the purpose of an organization or the reason it exists. Purpose for tracking indicator: Inspiration is what sets one work group apart from others in the ability to achieve results in the face of obstacles, constraints and adversity. The evidence of an inspired staff is not easily measured, but can be found in their degree of commitment to the organizational objectives and goals and in their willingness to learn, improve and innovate in order to achieve these. Key questions: See items on Inspiring Score Sheet on the next page Proposed measure: Yes/ No Proposed data sources: Interviews with members of a selected work group; observations of work group interactions; interviews with supervisors or facilitators of leadership development programs. Frequency of measure: At the outset of a leadership development intervention, at least six months after the first measure, after the completion of the intervention, and, if desired, at regular intervals to monitor behaviors.
81
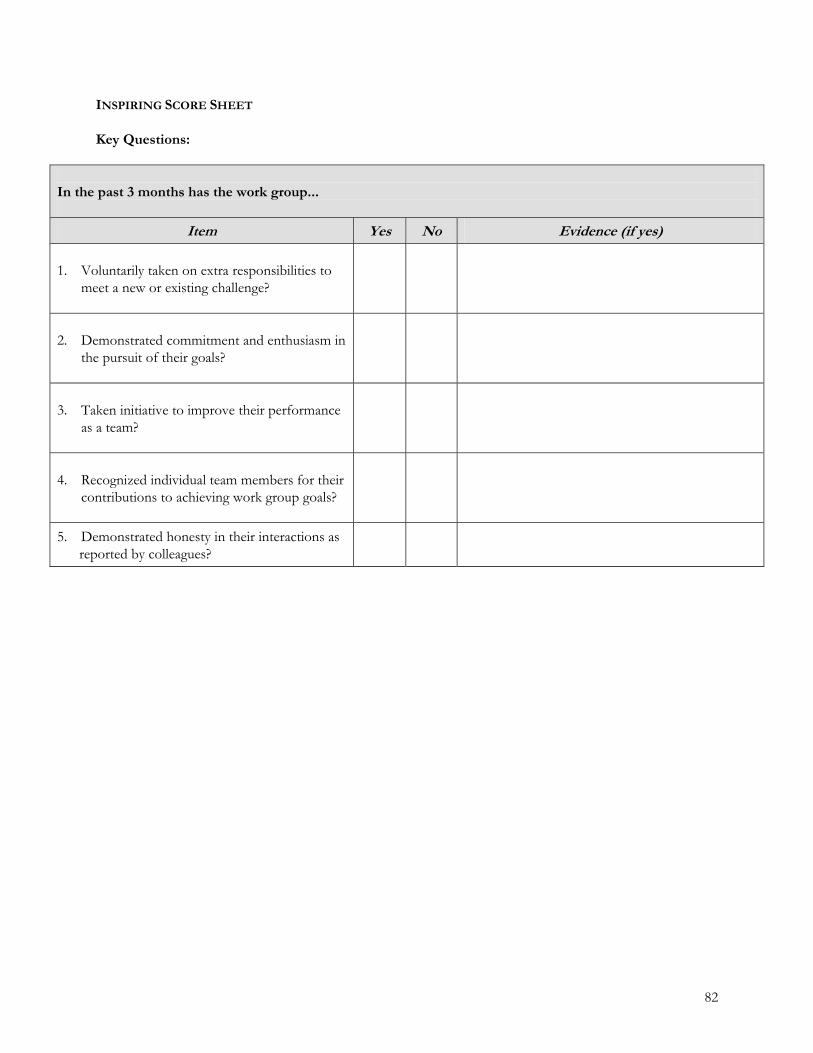
INSPIRING SCORE SHEET
Key Questions:
In the past 3 months has the work group...
Item Yes No Evidence (if yes)
1. Voluntarily taken on extra responsibilities to
meet a new or existing challenge?
2. Demonstrated commitment and enthusiasm in
the pursuit of their goals?
3. Taken initiative to improve their performance
as a team?
4. Recognized individual team members for their
contributions to achieving work group goals?
5. Demonstrated honesty in their interactions as reported by colleagues?
82

2.2 INDICATORS FOR LEADERSHIP DEVELOPMENT AT THE ORGANIZATIONAL LEVEL
Developing Future Leaders from Within Indicator: A deliberate process is used to identify and develop potential leaders from within the organization Definition of terms used: “A deliberate process” is one that is guided by an explicit policy. Purpose for tracking indicator: "An organization's long-term success and viability depend, to a great extent, on its capacity to develop a strong leadership base within its ranks, not just at the top layer." 22
Key questions:
Item Yes No Evidence (if yes)
1. Does the organization place emphasis on "growing" new talent from within (as opposed to "buying" it from outside the organization)?
2. Does the organization have a written policy to identify and develop leaders at all levels?
3. Does the organization have a process in place to implement the leadership development policy?
4. Is there evidence of the development of leaders from all levels of the organization?
Proposed data sources: Key informant interviews; review of organizational policy statements Frequency of measure: Annually
22 Management Sciences for Health, "Planning for Leadership Transition," The Manager vol. 10, no. 1 2001.
83
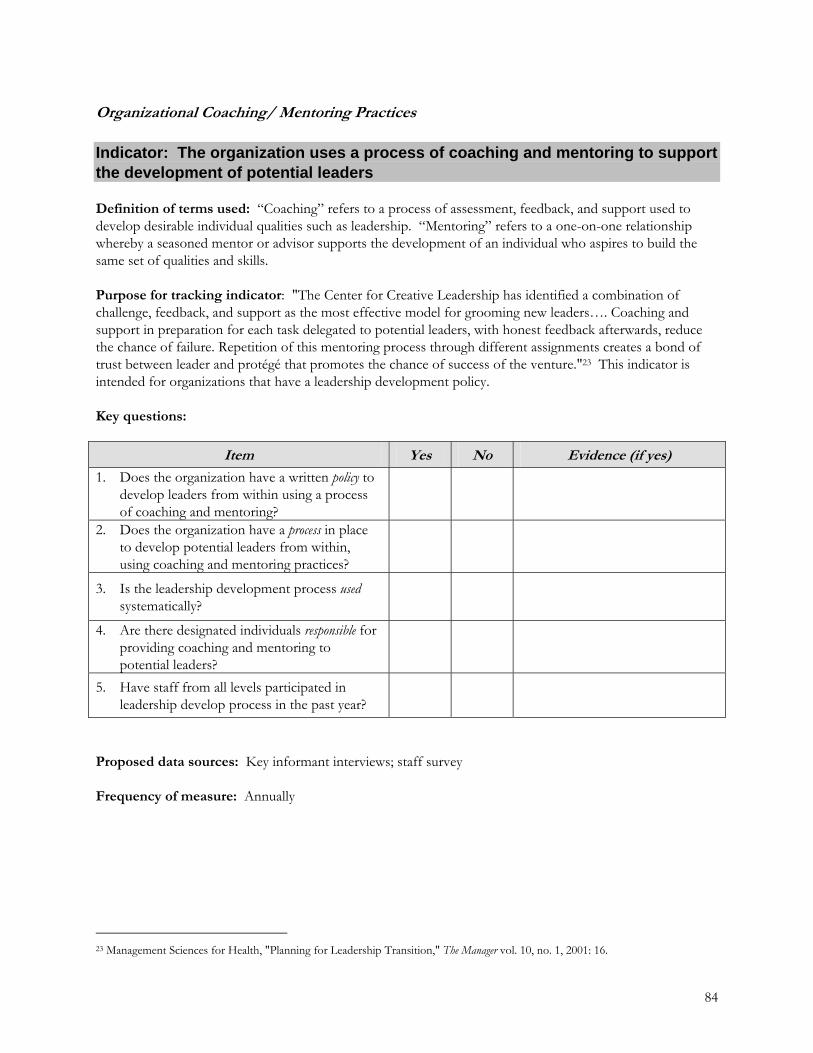
Organizational Coaching/ Mentoring Practices Indicator: The organization uses a process of coaching and mentoring to support the development of potential leaders Definition of terms used: “Coaching” refers to a process of assessment, feedback, and support used to develop desirable individual qualities such as leadership. “Mentoring” refers to a one-on-one relationship whereby a seasoned mentor or advisor supports the development of an individual who aspires to build the same set of qualities and skills. Purpose for tracking indicator: "The Center for Creative Leadership has identified a combination of challenge, feedback, and support as the most effective model for grooming new leaders…. Coaching and support in preparation for each task delegated to potential leaders, with honest feedback afterwards, reduce the chance of failure. Repetition of this mentoring process through different assignments creates a bond of trust between leader and protégé that promotes the chance of success of the venture."23 This indicator is intended for organizations that have a leadership development policy. Key questions:
Item Yes No Evidence (if yes)
1. Does the organization have a written policy to develop leaders from within using a process of coaching and mentoring?
2. Does the organization have a process in place to develop potential leaders from within, using coaching and mentoring practices?
3. Is the leadership development process used systematically?
4. Are there designated individuals responsible for providing coaching and mentoring to potential leaders?
5. Have staff from all levels participated in leadership develop process in the past year?
Proposed data sources: Key informant interviews; staff survey Frequency of measure: Annually
23 Management Sciences for Health, "Planning for Leadership Transition," The Manager vol. 10, no. 1, 2001: 16.
84
2.3 INTERMEDIATE INDICATORS FOR LEADERSHIP DEVELOPMENT Workgroup Climate Indicator: Work groups experience their climate as positive
Definition of terms used: A “work group” is a group of people who work together on a regular basis to produce results. In a Ministry of Health, this includes work groups or teams at the local (clinic) level all the way up to work groups at the central level. For a nongovernmental organization (NGO) this includes technical and administrative teams as well as the executive management teams. “Work group climate” is the prevailing workplace atmosphere as experienced by employees. Put simply, it is “what it feels like to work here.” A positive work climate leads to and sustains employee motivation and high performance. This occurs because a positive work climate increases the discretionary effort—the extra effort that employees exert above and beyond job expectations. Purpose for tracking indicator: Research indicates that the leadership and management styles used by a supervisor have a direct impact on the climate in a work group. The literature also describes a correlation between positive work group climate and productivity. Measuring work group climate permits an organization to compare the climates of different work groups, track the changes in one work group’s climate over time, or examine differences among individuals’ perceptions of work group climate. Measurement of climate before and after a leadership development process can help work groups to hold a discussion about current climate and select a target for improvement. Key questions: See items on Workgroup Climate Assessment (WCA) on the next page. The Facilitator’s Guide to the WCA may be downloaded from MSH’s Health Manager’s Toolkit at: http://erc.msh.org/mainpage.cfm?file=96.9htm&module=toolkit&language=English
85
Proposed measure: Average scores on the WCA. The WCA consists of eight climate perceptions which, together, measure the group’s climate. The tool also has two additional items that capture perceptions of productivity and quality within the workgroup. The tool was validated with teams from different administrative levels in three countries to ensure it measures climate across gender, culture and language.24 The WCA process is best undertaken with a facilitator. The facilitator can be either someone who works within or outside the organization, but should be someone whom the staff trusts, so they are more likely to respond honestly. The process requires confidentiality and to obtain a valid measure of workgroup climate, all members of the intact workgroup should fill out the WCA. The WCA is not appropriate for teams that are newly formed because they do not have a history of working together and therefore team members will find it difficult to respond to the items in the survey. Method of Tabulation and Analysis
1. Record the score for each of the 8 climate items, moving horizontally across the chart for each team member. Calculate the average score for each team member in the far right column, and then calculate the overall climate score by averaging all of the “individual scores.”
2. Do the same for the two items on productivity and quality. 3. Once all of the necessary data has been input in the tabulations sheet, record the average
Individual Climate scores. 4. Once this form is completed, make copies of the sheet for the workgroup participants. 5. Focus on the trends of the average individual scores with teams: Are they uniformly high,
uniformly low, or are some individuals experiencing their work climate more positively than others?
6. Ask teams to brainstorm practices to improve the average scores of all team members. 7. Record the difference between average scores pre and post leadership development
program. Proposed data source: Responses to the Work group Climate Assessment (WCA) Frequency of measure: Climate change takes time. Climate should be measured at baseline and during a final assessment at the completion of a leadership development intervention. If desired, climate may be measured at regular intervals to monitor changes.
24 Carry Pery, Nancy LeMay, Greg Rodway, Allison Tracy and Joan Galer, “Validating a work group climate assessment tool for improving the performance of public health organizations.” Human Resources for Health vol 3, no. 10, 2005.
86

WWoorrkkggrroouupp CClliimmaattee AAsssseessssmmeenntt -- PPaarrtt AA
Please read each item below and indicate your selection by circling the appropriate number in the shaded column.
Workgroup Climate Assessment – Part A
I feel that in my workgroup…..
How are things now in your workgroup? Please rate each item on a scale from 1 to 5 where:- 1 = Not at All 2 = To a Small Degree 3 = To a Moderate Degree 4 = To a Great Degree 5 = To a Very Great Degree
1. We feel our work is important 1 2 3 4 5
2. We strive to achieve successful outcomes 1 2 3 4 5
3. We pay attention to how well we are working together 1 2 3 4 5
4. We understand the relevance of the job of each member in our group 1 2 3 4 5
5. We have a plan which guides our activities 1 2 3 4 5
6. We understand each other’s capabilities 1 2 3 4 5
7. We seek to understand the needs of our clients 1 2 3 4 5
8. We take pride in our work 1 2 3 4 5
87

WWoorrkkggrroouupp CClliimmaattee AAsssseessssmmeenntt -- PPaarrtt BB This section is an assessment of your feelings about whether your workgroup is known for quality work and whether it is productive. What does being known for quality work mean? It means that our workgroup:
• is known for meeting our clients’ needs • receives positive feedback from our clients or supervisors
What does being productive mean? It means that our workgroup:
• consistently meets our work objectives, such as monthly or annual objectives • is recognized by others as a group that gets the job done
Please read each item and then decide how things are in your workgroup. Using the same scale as in Part A, indicate your selection by circling the appropriate number in the shaded column.
Workgroup Climate Assessment – Part B
I feel that …..
How are things now in your workgroup? Please rate each item on a scale from 1 to 5 where: 1 = Not at All 2 = To a Small Degree 3 = To a Moderate Degree 4 = To a Great Degree 5 = To a Very Great Degree
9. Our workgroup is known for quality work 1 2 3 4 5
10. Our workgroup is productive 1 2 3 4 5
Thank you for completing the assessment.
88
Employee Satisfaction Indicator: Employees express satisfaction with key aspects of their work
Definition of terms used: "Employee satisfaction" refers to the employee’s sense of well-being within his or her work environment. It is the result of a combination of extrinsic rewards, such as remuneration and benefits, and intrinsic rewards, such as respect and appreciation. The main elements that are considered critical in contributing to employee satisfaction include: remuneration that is fair in relation to skill and responsibility, opportunities for career development, workload, respect, communication with superiors and an appropriate level of challenge.
Purpose for tracking indicator: Employee satisfaction is a critical source of employee motivation and provides the basis for developing a sense of leadership with regard to one’s own tasks and related team efforts and objectives. Key questions: See items on Employee Satisfaction Instrument on the next page Proposed measure: Average score on the items in the Employee Satisfaction instrument Proposed data source: Responses to the Employee Satisfaction Instrument Frequency of measure: At the outset of a leadership development intervention, at least six months after the first measure or at the completion of the intervention. If desired, at regular intervals to monitor changes.
89
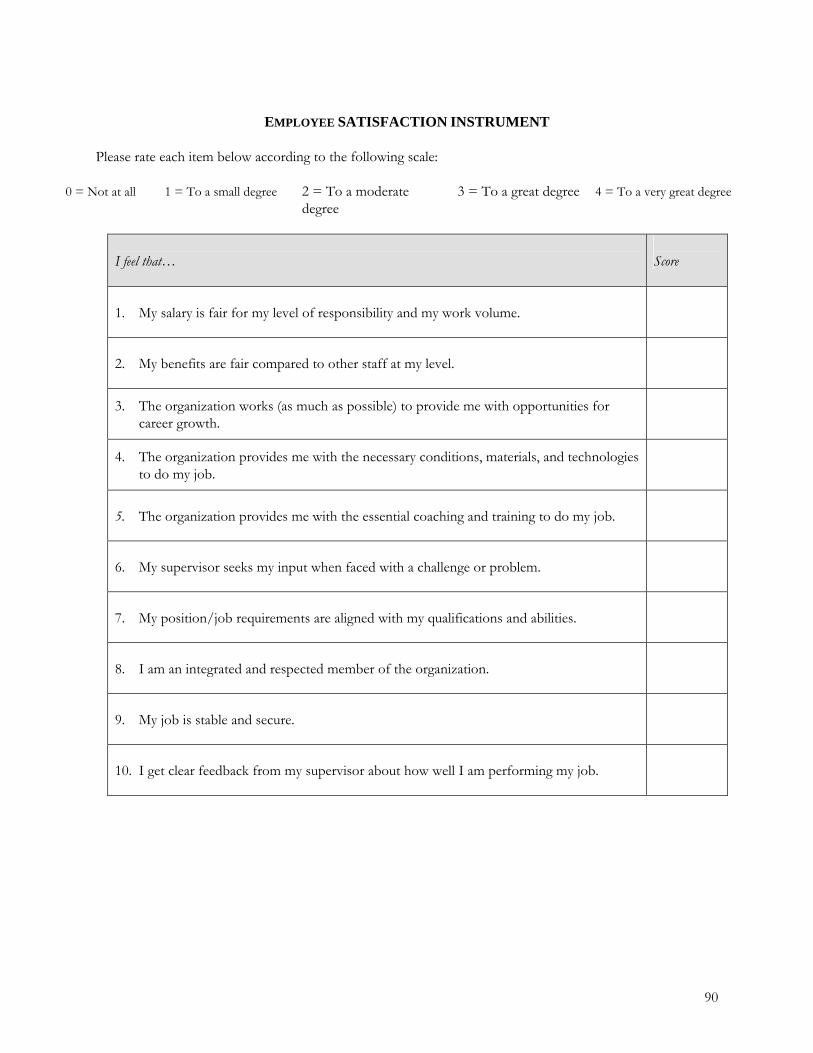
EMPLOYEE SATISFACTION INSTRUMENT
Please rate each item below according to the following scale:
0 = Not at all 1 = To a small degree 2 = To a moderate degree
3 = To a great degree 4 = To a very great degree
I feel that…
Score
1. My salary is fair for my level of responsibility and my work volume.
2. My benefits are fair compared to other staff at my level.
3. The organization works (as much as possible) to provide me with opportunities for career growth.
4. The organization provides me with the necessary conditions, materials, and technologies to do my job.
5. The organization provides me with the essential coaching and training to do my job.
6. My supervisor seeks my input when faced with a challenge or problem.
7. My position/job requirements are aligned with my qualifications and abilities.
8. I am an integrated and respected member of the organization.
9. My job is stable and secure.
10. I get clear feedback from my supervisor about how well I am performing my job.
90

Indicator: Percent of plans to address work climate that are successfully completed Definition of terms used: A plan to address work climate includes any of the following:
Incorporating steps to improve work climate into an existing action plan for performance improvement
Including steps to improve work climate in an organization’s annual operational plan Developing a plan specifically focused on improving work climate within specific work group(s)
Purpose for tracking indicator: The implementation of plans is one way to measure the result of a leadership development program. Key questions:
Item Percentage Evidence
What percent of the plans developed to address work group climate were completed?
Proposed measure: Percentage Numerator: Number of plans completed Denominator: Total number of plans developed Proposed data source: Data collected following the leadership development program Frequency of measure: 6-12 months after a leadership development program
91

3) INDICATORS OF ORGANIZATIONAL SUSTAINABILITY Sections 1 and 2 focus on indicators of organizational capacity in management systems and leadership practices. Section 3 addresses organizational sustainability by focusing on three specific dimensions or capacities: • To plan for organizational sustainability; • To strengthen financial sustainability thorough the diversification of funding sources and the improved
generation of revenues from services and service delivery; • To strengthen sustainability through involvement in national policy processes to influence the
formulation and implementation of policy and through strategic partnerships. The central issue across various definitions or dimensions of sustainability is future performance. From a monitoring and evaluation perspective, we try to identify those activities that increase the likelihood of effective future performance, or that reflect a preoccupation with future capacity. While such a preoccupation may well be part of all ongoing management and leadership activities, the following indicators provide evidence of a more formalized concern with future capacity and performance.
92

3.1 PLANNING FOR SUSTAINABILITY Indicator: A business plan exists and accurately projects revenue
Definition of terms: A “business plan” is used to secure funding and project financial (or social) return for the start-up of an organization, or for the development and introduction of a new product or service being offered by a more established organization.25
Purpose for tracking indicator: For an existing service provider, a business plan can serve as a means to establish a more diversified funding base through the development of new programs in response to donor/client needs. As such, its existence provides evidence of a preoccupation with the organization’s future performance and sustainability.26
Key questions:
Item Yes No Evidence (if yes)
1. Does the organization have a goal of diversifying its funding streams?
2. Does the organization draft business plans when developing a new product or service to attract new funding sources?
3. Does the business plan include information about the human resource needs required to design and launch the new product or service?
4. Does the business plan include information about the financial requirements for designing and launching the new product or service?
5. Does the business plan include data and projections on financial and social return on investment?
Proposed data sources: Review of organizational documents, including any business plans or proposals; interviews with key informants
Frequency of measure: Annually
25 Management Sciences for Health, The Art of Crafting a Business Plan for Social Return on Investment: A Pocket Guide to the Business Planning Program, (Boston: MSH, 2003) 26 USAID, Matching Grants Program, Office of Private and Voluntary Cooperation, “Non-Profit Business Planning: Notes and Sample Formats for Matching Grant PVOs to Prepare a Sustainability / Business Plan," (Washington, D.C: USAID, 1999)
93

Indicator: The organization has a contingency plan in anticipation of external shocks
Definition of terms used: A "contingency plan" is a plan or procedure that takes effect if an emergency occurs. “External shocks” refer to events or changes that lie outside the control of the organization, such as withdrawal of donor funds, economic and political crises, etc. In environments that are particularly vulnerable to external shocks, strategic planning should include some degree of contingency or emergency planning.
Purpose for tracking indicator: The ability to plan for contingencies is strongly associated with organizational or program sustainability. “The likelihood that programmatic performance will be sustained depends, generally, on three factors: contingency planning, access to alternative resources, system durability.”27
Key questions:
Item Yes No Evidence (if yes)
1. Does the strategic planning process include an examination of the assumptions under which organizational objectives can be achieved?
2. Are there attempts to identify potential emergencies and other obstacles to the achievement of organizational objectives?
3. Does the organizational leadership have plans and/or procedures in place in case of emergencies?
4. Are these plans known by all supervisory staff in the organization?
5. Is there evidence of planning for changes and adjustments in deployment of key organizational resources—human, financial, or logistical—in response to anticipated changes in the external environment?
6. Has the organization considered providing alternative services or providing services to alternative markets?
Proposed data sources: Key informant interviews; review of strategic plans and any contingency or emergency plan
Frequency of measure: Annually
27 R. Bulatao, Dissecting Family Planning Sustainability, (Univerisity of North Carolina Chapel Hill: MEASURE Evaluation, Dec. 1995)
94

Indicator: The organization has a manual for institutional marketing
Definition of terms used: “Institutional marketing” is “the practice of learning about target populations, adjusting services to better satisfy their needs and preferences, and persuading these populations to continue their use or support of a specific organization. Marketing practices can influence the level, timing, and composition of demand for services.”28 A “manual” is a document that captures strategies, processes, and systems for marketing.
Purpose for tracking indicator: The ability to market the organization and its services helps an organization “to mobilize demand for its services and use its resources efficiently and at full capacity, so it can maximize its income and better ensure its long-term sustainability.”29
Key questions:
Item Yes No Evidence (if yes)
1. Does a manual for institutional marketing exist?
2. If yes, is it used? Proposed data sources: Manual for institutional marketing
Frequency of measure: Annually
28 Management Sciences for Health, "Marketing Your Organization's Services." The Manager vol. 8, no. 2, 1999 : 1-22. 29 Ibid.
95
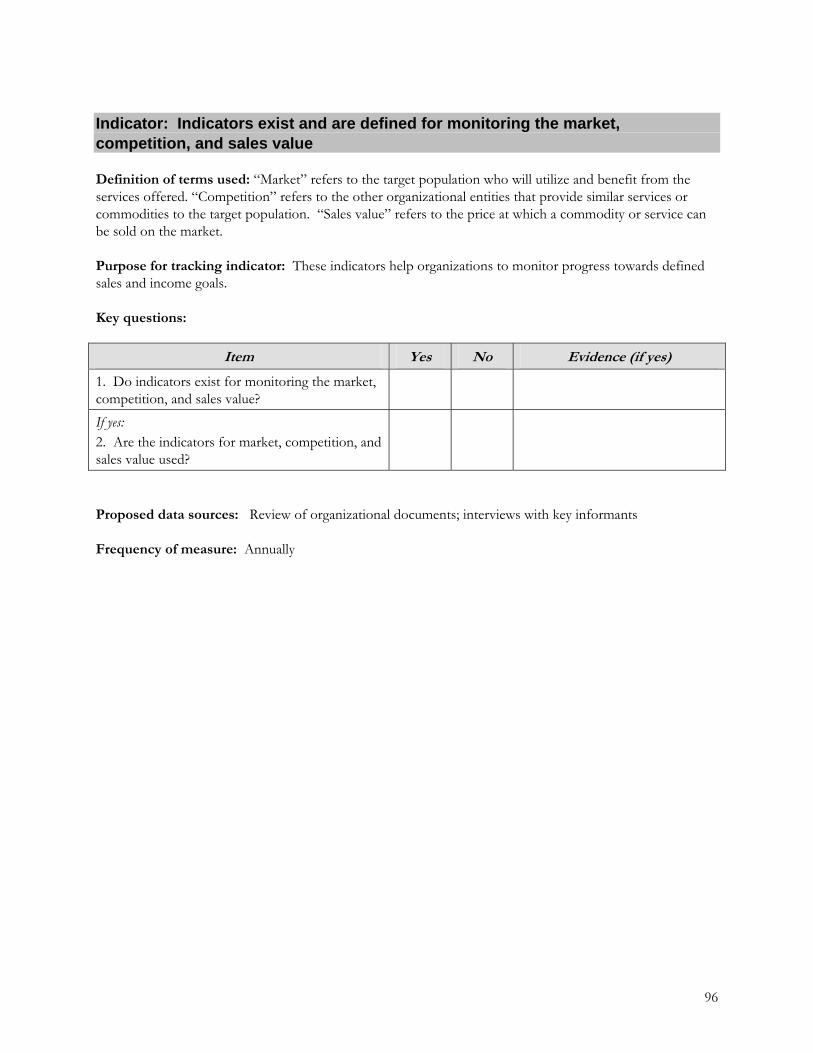
Indicator: Indicators exist and are defined for monitoring the market, competition, and sales value
Definition of terms used: “Market” refers to the target population who will utilize and benefit from the services offered. “Competition” refers to the other organizational entities that provide similar services or commodities to the target population. “Sales value” refers to the price at which a commodity or service can be sold on the market.
Purpose for tracking indicator: These indicators help organizations to monitor progress towards defined sales and income goals.
Key questions:
Item Yes No Evidence (if yes)
1. Do indicators exist for monitoring the market, competition, and sales value?
If yes: 2. Are the indicators for market, competition, and sales value used?
Proposed data sources: Review of organizational documents; interviews with key informants
Frequency of measure: Annually
96
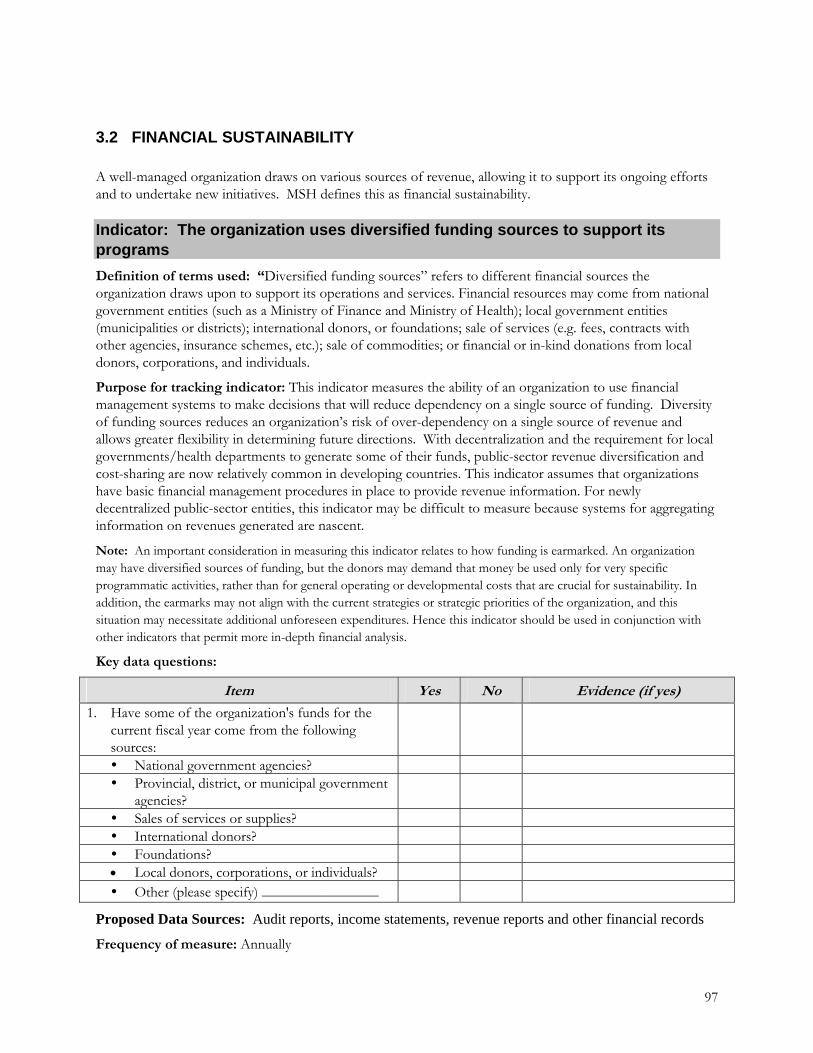
3.2 FINANCIAL SUSTAINABILITY
A well-managed organization draws on various sources of revenue, allowing it to support its ongoing efforts and to undertake new initiatives. MSH defines this as financial sustainability. Indicator: The organization uses diversified funding sources to support its programs
Definition of terms used: “Diversified funding sources” refers to different financial sources the organization draws upon to support its operations and services. Financial resources may come from national government entities (such as a Ministry of Finance and Ministry of Health); local government entities (municipalities or districts); international donors, or foundations; sale of services (e.g. fees, contracts with other agencies, insurance schemes, etc.); sale of commodities; or financial or in-kind donations from local donors, corporations, and individuals.
Purpose for tracking indicator: This indicator measures the ability of an organization to use financial management systems to make decisions that will reduce dependency on a single source of funding. Diversity of funding sources reduces an organization’s risk of over-dependency on a single source of revenue and allows greater flexibility in determining future directions. With decentralization and the requirement for local governments/health departments to generate some of their funds, public-sector revenue diversification and cost-sharing are now relatively common in developing countries. This indicator assumes that organizations have basic financial management procedures in place to provide revenue information. For newly decentralized public-sector entities, this indicator may be difficult to measure because systems for aggregating information on revenues generated are nascent.
Note: An important consideration in measuring this indicator relates to how funding is earmarked. An organization may have diversified sources of funding, but the donors may demand that money be used only for very specific programmatic activities, rather than for general operating or developmental costs that are crucial for sustainability. In addition, the earmarks may not align with the current strategies or strategic priorities of the organization, and this situation may necessitate additional unforeseen expenditures. Hence this indicator should be used in conjunction with other indicators that permit more in-depth financial analysis.
Key data questions:
Item Yes No Evidence (if yes)
1. Have some of the organization's funds for the current fiscal year come from the following sources:
National government agencies? Provincial, district, or municipal government
agencies?
Sales of services or supplies? International donors? Foundations? • Local donors, corporations, or individuals? Other (please specify) ________________
Proposed Data Sources: Audit reports, income statements, revenue reports and other financial records
Frequency of measure: Annually
97

Indicator: Percent of annual revenues generated from diverse sources Definition of terms used: “Revenues” are monies or the equivalent received from sales, services, fees, donations, and grants. In the case of grants, only the portion actually spent is considered revenue; the balance may have to be returned to the donor. Typically, the sources of funds available health organizations include: national governmental entities (e.g., Ministry of Finance, Ministry of Health), local governmental entities (e.g., municipalities or districts); international donors or foundations; sales of services (e.g., fees, contracts with other agencies, insurance schemes); sales of supplies such as commodities; and donations from local donors, corporations or individuals.
Purpose for tracking indicator: This indicator reflects the ability of an organization to generate revenues from multiple funding sources. Different revenue sources reduce the organization dependency on a single source of funding, and allows the organization greater flexibility in determining future directions. Many NGOs find diversification critical to their sustainability over the long term. In addition, with decentralization and the subsequent requirement for local governments/health departments to generate some of their funds, public sector revenue diversification and cost sharing are now relatively common in developing country settings.
Note: This indicator assumes that organizations have basic financial management procedures in place to provide revenue information. For newly decentralized public-sector entities, this indicator may be difficult to measure because systems for aggregating information on revenues generated from service delivery fees, for example, are nascent.
An important consideration in measuring this indicator relates to how funding is earmarked. An organization may have diversified sources of funding, but the donors may demand that money be used only for very specific programmatic activities, rather than for general operating or developmental costs that are crucial for sustainability. In addition, the earmarks may not align with the current strategic directions of the organization, and this situation may necessitate additional unforeseen expenditures. Hence this indicator should be used in conjunction with other indicators that permit more in-depth financial analysis.
Key questions:
Item Percentage Evidence
1. What percentage of annual revenues (funds or in-kind contributions) is generated from each of the following sources?
National government agencies? Provincial, district, or municipal government
agencies?
Sales of services or supplies? International donors? Foundations? Local donors, corporations, or individuals?
Other (please specify) ______________
Proposed measure: Percentage
Numerator: Annual contribution (funds or in-kind) from each source Denominator: Total annual revenues
Proposed data sources: Income statements, revenue reports, audit reports or other financial records
Frequency of measure: Annually
98
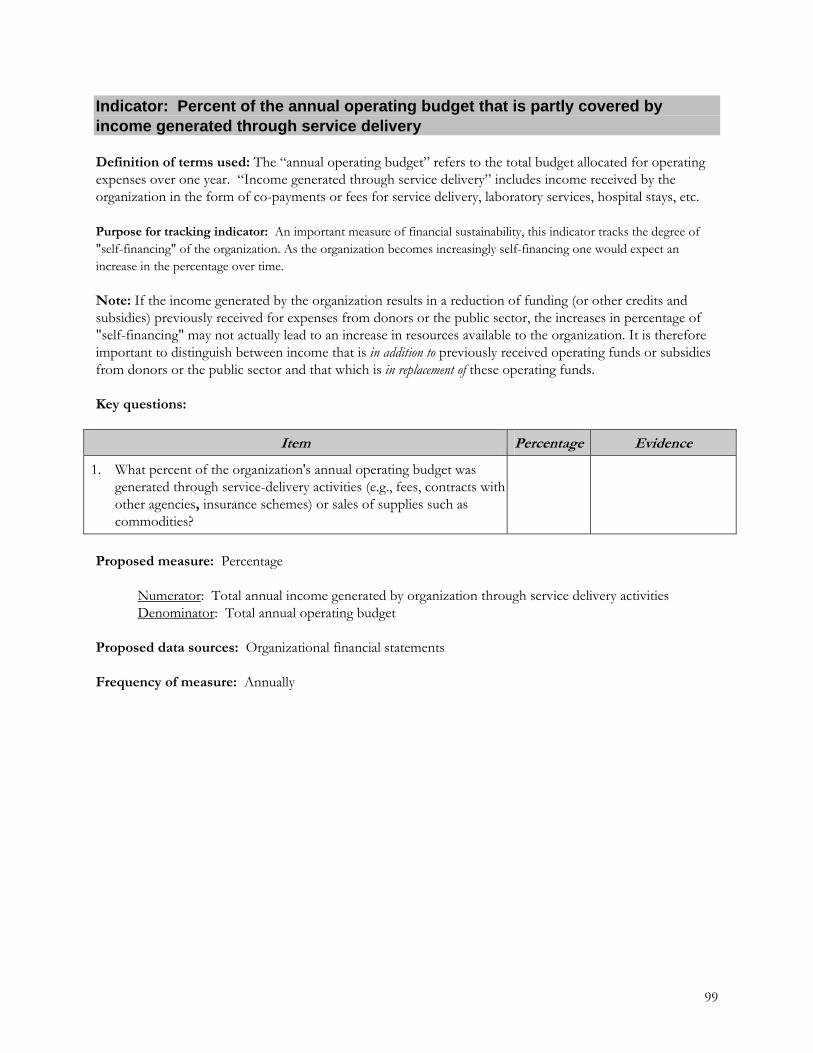
Indicator: Percent of the annual operating budget that is partly covered by income generated through service delivery Definition of terms used: The “annual operating budget” refers to the total budget allocated for operating expenses over one year. “Income generated through service delivery” includes income received by the organization in the form of co-payments or fees for service delivery, laboratory services, hospital stays, etc. Purpose for tracking indicator: An important measure of financial sustainability, this indicator tracks the degree of "self-financing" of the organization. As the organization becomes increasingly self-financing one would expect an increase in the percentage over time. Note: If the income generated by the organization results in a reduction of funding (or other credits and subsidies) previously received for expenses from donors or the public sector, the increases in percentage of "self-financing" may not actually lead to an increase in resources available to the organization. It is therefore important to distinguish between income that is in addition to previously received operating funds or subsidies from donors or the public sector and that which is in replacement of these operating funds.
Key questions:
Item Percentage Evidence
1. What percent of the organization's annual operating budget was generated through service-delivery activities (e.g., fees, contracts with other agencies, insurance schemes) or sales of supplies such as commodities?
Proposed measure: Percentage
Numerator: Total annual income generated by organization through service delivery activities Denominator: Total annual operating budget
Proposed data sources: Organizational financial statements Frequency of measure: Annually
99
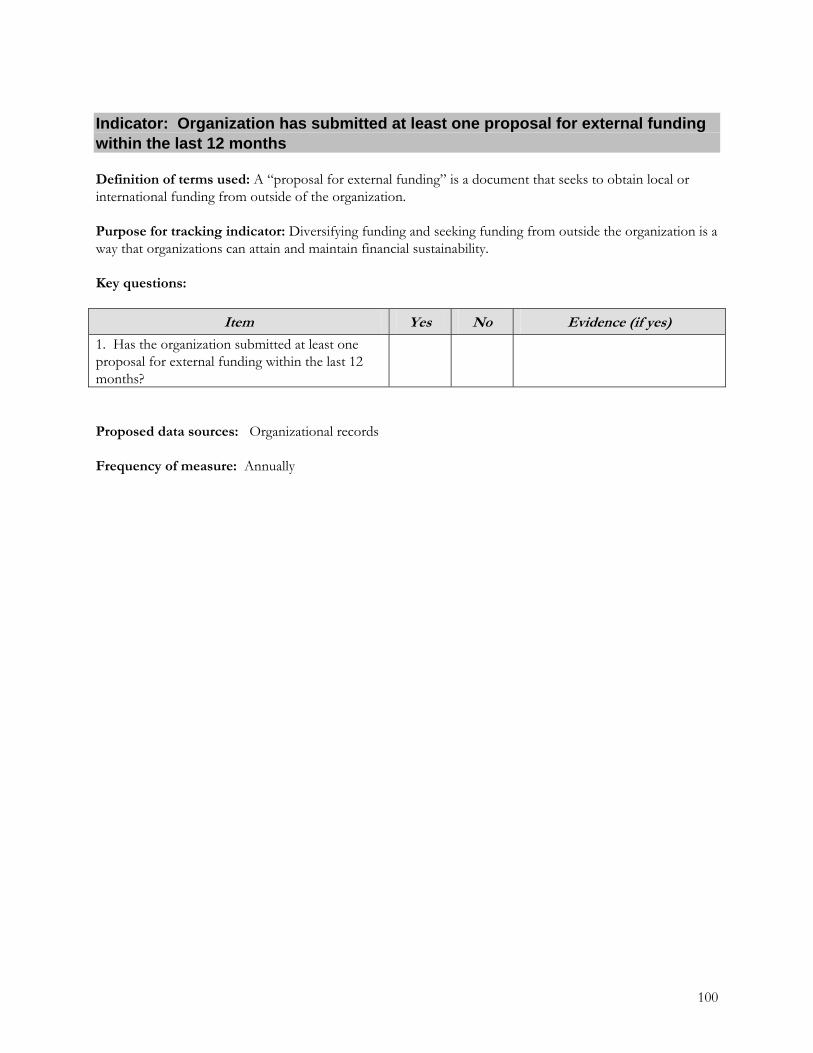
Indicator: Organization has submitted at least one proposal for external funding within the last 12 months
Definition of terms used: A “proposal for external funding” is a document that seeks to obtain local or international funding from outside of the organization. Purpose for tracking indicator: Diversifying funding and seeking funding from outside the organization is a way that organizations can attain and maintain financial sustainability.
Key questions:
Item Yes No Evidence (if yes)
1. Has the organization submitted at least one proposal for external funding within the last 12 months?
Proposed data sources: Organizational records
Frequency of measure: Annually
100

101
3.3 CAPACITY TO INCREASE SUSTAINABILITY THROUGH INVOLVEMENT IN NATIONAL POLICY PROCESSES AND STRATEGIC PARTNERSHIPS
Indicator: The organizational leadership ensures that relevant external policy issues are included in discussions on organizational strategy Definition of terms: “Organizational leadership” is the primary decision-making authority, including the chief executive, his/her senior staff, and Board members, if relevant. “Relevant external policy” refers to policy that is articulated outside the organization, but which has a direct bearing upon its objectives and activities. For example, the government may determine to offer select priority health services for free or may otherwise develop policy which impacts upon an organization’s ability to generate local revenue. Purpose for tracking indicator: Organizational leadership should be abreast of all policy developments and priorities related to their organization’s objectives. The indicator measures the extent to which the organizational leadership is informed on policy issues and integrates this information into its own strategic planning process. This indicator is also related to the leadership practice of scanning the internal and external environment. Key questions:
Item Yes No Evidence (if yes)
1. Is the organizational leadership familiar with the current policies at the national and donor levels that affect the organization's objectives?
2. Does the organizational leadership have a way of continually updating his or her information on these policies?
3. Does the leadership use this information to inform the work of the organization?
4. Does the organization's most recent strategic plan (if any) reflect knowledge of national and donor policies?
Proposed data sources: Interviews with organizational leaders; review of strategic plan Frequency of measure: Annually

102
Indicator: Input provided by the organization has been considered in the design of health policy at broader levels Definition of terms used: “Broader levels” refers to agencies that determine policy outside the organization.
Purpose for tracking indicator: This indicator measures the organization’s will and capacity to participate in and contribute to the formulation of health policies. Key questions:
Item Yes No Evidence (if yes)
1. Has the organizational leadership and/or senior managers participated in policy-making with national agencies, regulatory boards, commissions, or donor agencies?
If yes: 2. Have any policy recommendations issued over
the past year included the organization's concerns and suggestions?
Proposed data sources: Records of meetings and decisions of Boards, regulatory agencies, or commissions; policy actions, laws or budgets passed; interviews with key informants from the organization Frequency of measure: Annually

103
Indicator: The organization’s strategic plan includes partnership objectives and outlines steps needed for their achievement. Definition of terms used: “Partnership objectives” refer to a clearly stated intent to form one or more partnerships as a means to achieving long-term organizational goals. Purpose for tracking indicator: The inclusion of a partnership objective in the organization’s strategic plan indicates that the organization has taken a pro-active and documented initiative in considering partnerships as part of its organizational strategy.
Key questions:
Item Yes No Evidence (if yes)
1. Does the organization have a strategic plan?
If yes: 2. Does the plan include a clearly stated partnership
objective?
3. Does the plan specify the steps needed to reach the objective?
Proposed data sources: The organizational strategic plan; key informant interviews.
Frequency of measure: Annually

104
Indicator: The organization has signed at least one partnership agreement during the past year, in accordance with its organizational objectives. Definition of terms used: A “partnership agreement” is a jointly signed, formal agreement, contractual or non-contractual, that specifies the roles, responsibilities, commitments, and goals of all parties concerned.30
Purpose for tracking indicator: When linked to a partnership objective in its strategic plan, this indicator provides evidence of the organization’s capacity to act upon its commitment to partnering. Key questions:
Item Yes No Evidence (if yes)
1. Has the organization signed a partnership agreement during the past year?
If yes: 2. Was this agreement consistent with the
organization’s strategic objectives?
Proposed data sources: The partnership agreement; the organization’s strategic plan; key informant interviews.
Frequency of measure: Annually
30 Management Sciences for Health, "Forming Partnerships to Improve Public Health”. The Manager, vol 7, no 4, Winter 1998/99.

105
4) PROGRAM SPECIFIC INDICATORS
The first section provides the specific indicators included in the Performance Monitoring Plan of the Leadership, Management and Sustainability (LMS) Program. These indicators may be used as written or adapted for use in monitoring and evaluation plans prepared for annual workplans for LMS sub-project activities funded with USAID core or field support funds. The second section provides a selection of indicators relevant to LMS Programs and used by the USAID Office of Population/Reproductive Health for tracking contributions of USAID-funded Cooperating Agencies (CAs) to the Office’s Strategic Objective and broader Global Health Bureau goals. Again, these indicators may be used as written or adapted for use in monitoring and evaluation plans prepared for annual workplans for LMS sub-project activities funded with USAID core or field support funds.
The remaining sections provide indicators for specific programs offered by LMS or MSH, such as the Virtual Leadership Development Program, the Business Planning Program for Health, the Management Organizational Sustainability Tool, or different virtual networks and programs.

106
4.1 LMS PROGRAM PERFORMANCE MONITORING PLAN INDICATORS The following is the list of indicators and their definitions included in the Performance Monitoring Plan (PMP) for the LMS Program approved by USAID and organized by the three Results defined in the LMS Cooperative Agreement. The indicators are relevant to both core and field support funded activities. They are also relevant for programs implemented with funding leveraged by LMS, where an LMS program (e.g., the Virtual Leadership Development Program) is implemented in a USAID funded bilateral or project funded by other donors. LMS is responsible for tracking these indicators and progress against pre-determined targets for its Program Years 3 and 5.
Indicator Definition Result 1: Improved management and leadership of priority health programs
1. No. of organizations applying management and leadership practices to address challenges in improving organizational performance and health service delivery
Organization refers to health and non-health public and private sector institutions (NGOs, FBOs, PVOs, CBOs, networks, and Country Coordinating Mechanisms [CCMs]) and specifically sub-units (division/department, region/province/district, etc.) that directly benefit from LMS assistance in leadership and management. Apply leadership and management practices refers to the use of specific technical tools and approaches (e.g., Leadership Development Program, MOST) with or without LMS technical assistance.
1.1 a. No. of senior health leaders trained and/or recipient of technical assistance, disaggregated by gender
Senior health leaders: The Collaborative for Quality Assurance defines a senior leader as, “The executive in the organization who supports the team and controls the resources employed in the processes to be changed. This person is usually at the administrator level or higher.” For the purposes of LMS reporting, a senior leader is a manager who holds the title of Director, Assistant Director, Minister, Vice-Minister, President, Vice-President, Senior Advisor, or Chief Officer of any one of the following types of health and non-health institutions: Ministry at the central and regional levels, a private sector organization, a not- for-profit organization (PVO, NGO, FBO, CBO), CCMs or a network of organizations. Senior elected officials such as mayors, congressmen, and senators are also included in this definition.
1.1.b. No. of organizations institutionalizing leadership and management development as a standard organizational procedure
Institutionalize is defined in one of the following ways: 1) A deliberate process for leadership and management development is in an organization’s annual operational plan and/or budget (e.g., Nicaragua Leadership Development Program-MOH); 2) Managers within an organization replicate all or part of a leadership and management approach independently or with limited technical assistance (e.g., Egypt Leadership Development Program); 3) An organization mandates the use of tools or programs to strengthen management and leadership (e.g., MOST as a requirement for Provincial level Strategic Planning in the Mozambique MOH).
1.2 a No. of pre-service programs conducted / No. of participants in
Pre-Service Programs are any Medical, Nursing, Midwifery, Community Health Worker, public health, or teacher training program

107
Indicator Definition pre-service programs, disaggregated by gender
that is offered by an accredited training institution within a country.
1.2 a. (cont.) Management and leadership capacity development integrated into pre-service programs
Integrated into a pre-service program is defined in one of the following ways: offered in the curriculum or added as a component of a clinical rotation or internship.
1.2 b. No. of participants in face-to-face, blended learning, etc. programs by country, type of organization (public, NGO, FBO, CBO, etc.), disaggregated by gender and management level
Participants include personnel from counterpart organizations, donors, colleague Cooperating Agencies (CA), etc. who formally register in an organized program (as opposed to observe or attend the program periodically). Management level could include senior leaders (see definition above), mid-level managers, or service delivery personnel. Mid-level managers report to a senior leader (see earlier definition) and have responsibility for supervising other employees. Included in this definition are District level managers, and nurses and medical technicians who manage programs or units within a health facility.
1.3.a. No. of CA staff, partners, TA providers, TCNetwork members actively participating in the Developing Managers Who Lead Community of Practice and other virtual discussions
Actively participating in virtual discussions is defined as: registering to participate in the discussions and logging in to the website at least once.
1.3. a. (cont.) Leadership and management tools and approaches integrated or incorporated into program interventions of CAs:
Integrated or incorporated into program interventions of a Cooperating Agency is defined as: 1) Delivered by the Cooperating Agency as part of technical assistance to a client organization; or 2) Included in printed, web-based or other materials
1.3.b. No. of professional exchange programs on developing managers who lead conducted by LeaderNet, the Global Exchange Network, VSPP
Professional exchange programs include formally organized virtual conferences as well as focused discussions among participants on management and leadership challenges, practices, and development opportunities initiated by LMS or a Community of Practice member.
1.3.b. (cont.) No. of publications Publications: Materials (print and electronic) produced for the purpose of sharing or reinforcing learning that have undergone a technical review process.
Result 2: Improved management systems in health organizations and priority programs
2.a. No. of organizations addressing management challenges to improve organizational performance
Organizations that address management challenges scan their internal environment for information about the performance of management structures and systems; focus on critical performance factors that can be improved; align and mobilize resources; inspire key stakeholders; plan using SMART objectives; organize and implement planned activities; and monitor and evaluate progress towards objectives.
2.1.a. No. of organizational Organizational performance assessment. An organizational

108
Indicator Definition performance assessments conducted, including gender assessments
performance assessment evaluates the ability of an organization to use its resources efficiently to achieve desired outputs and outcomes consistent with its mission. This could include the use of a formal tool or informal qualitative interviews to measure the impact of programs and services, and cultural attitudes and practices concerning gender that may enhance or serve as barriers to organizational performance. Also included are assessments of country-wide systems such as human capacity development and Country Coordinating Mechanisms.
2.2.a. No. of organizations that implement action plans addressing priority organizational development needs
Action plan. An action plan has the following components: • the desired outcome(s) and measurable indicators for
achieving the outcome(s) • the actions or activities that will be implemented • who will be responsible for carrying out each action
Implemented an action plan: Organizations will be considered as having implemented their action plan if they have completed all or any part of its steps.
2.3.a. No. of organizations or teams that develop a plan to improve workplace climate
Work Climate is the prevailing workplace atmosphere as experienced by employees. It is what it feels like to work together in a group.
Develop a plan to address work climate includes any of the following: • Incorporating steps to improve work climate into an existing
action plan for performance improvement • Including steps to improve work climate in an organization’s
annual operational plan • Developing a plan specifically focused on improving work climate
2.4.a. No. of CAs in different sectors, counterparts, and donors using LMS organizational performance assessment tools, performance improvement processes to address gaps
CA refers to a USAID and other donor-funded organization providing technical assistance in the health or non-health sector. Using LMS tools is defined as using organizational performance assessments tools, performance improvement processes to address gaps, and the Workgroup Climate Assessment tool: Use of the tools may be with or without LMS funded technical assistance.
Result 3: Increased sustainability and ability to manage change
3.a. No. of NGOs, public sector institutions, multi-sectoral bodies, and international organizations applying management and leadership practices
Multi-sectoral bodies include CCMs or other formal partnerships organized to address priority health or non-health issues. International agencies include bilateral and multi-lateral donors, USAID or other donor funded CAs, PVOs, and other TA providers working on an international basis.
3.1.a. No. of organizations by type (public, NGO, FBO, CBO, etc.) applying tools and technical resources
Applying refers to the use of specific technical tools and approaches (e.g., Leadership Development Program, MOST) with or without LMS technical assistance.
3.2.a. No. of multi-sectoral bodies Multi-sectoral bodies include CCMs or other formal partnerships
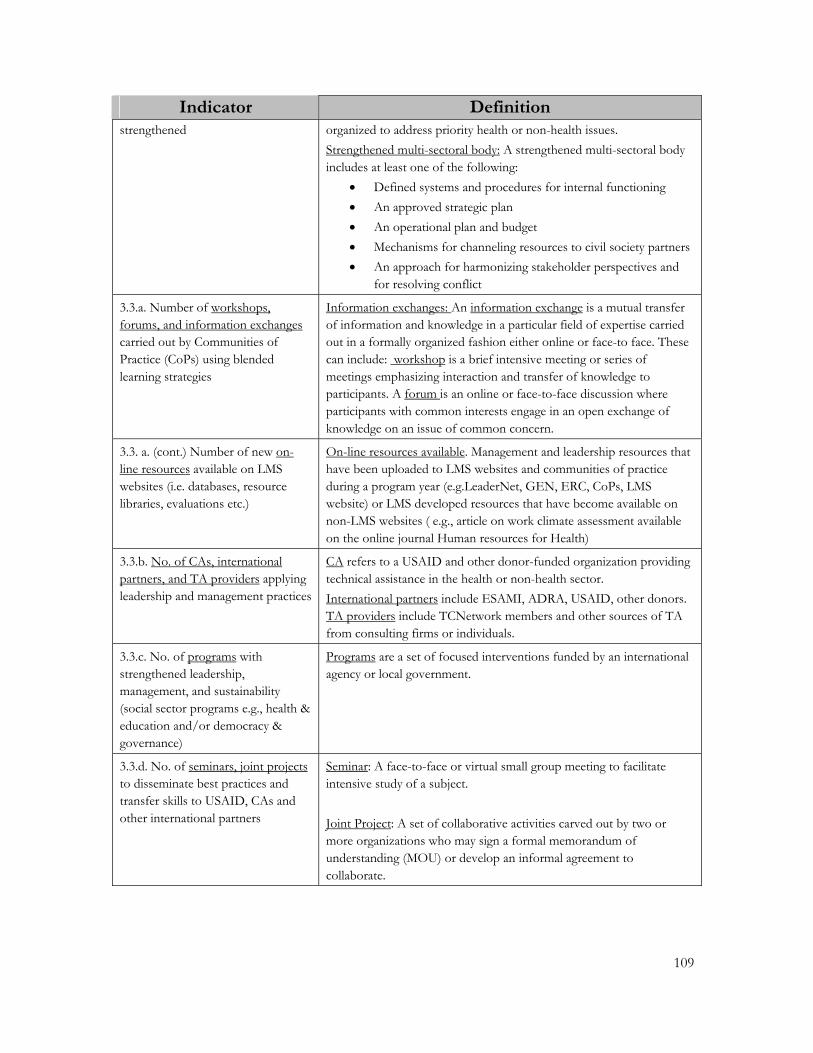
109
Indicator Definition strengthened organized to address priority health or non-health issues.
Strengthened multi-sectoral body: A strengthened multi-sectoral body includes at least one of the following:
• Defined systems and procedures for internal functioning • An approved strategic plan • An operational plan and budget • Mechanisms for channeling resources to civil society partners • An approach for harmonizing stakeholder perspectives and
for resolving conflict
3.3.a. Number of workshops, forums, and information exchanges carried out by Communities of Practice (CoPs) using blended learning strategies
Information exchanges: An information exchange is a mutual transfer of information and knowledge in a particular field of expertise carried out in a formally organized fashion either online or face-to face. These can include: workshop is a brief intensive meeting or series of meetings emphasizing interaction and transfer of knowledge to participants. A forum is an online or face-to-face discussion where participants with common interests engage in an open exchange of knowledge on an issue of common concern.
3.3. a. (cont.) Number of new on-line resources available on LMS websites (i.e. databases, resource libraries, evaluations etc.)
On-line resources available. Management and leadership resources that have been uploaded to LMS websites and communities of practice during a program year (e.g.LeaderNet, GEN, ERC, CoPs, LMS website) or LMS developed resources that have become available on non-LMS websites ( e.g., article on work climate assessment available on the online journal Human resources for Health)
3.3.b. No. of CAs, international partners, and TA providers applying leadership and management practices
CA refers to a USAID and other donor-funded organization providing technical assistance in the health or non-health sector. International partners include ESAMI, ADRA, USAID, other donors. TA providers include TCNetwork members and other sources of TA from consulting firms or individuals.
3.3.c. No. of programs with strengthened leadership, management, and sustainability (social sector programs e.g., health & education and/or democracy & governance)
Programs are a set of focused interventions funded by an international agency or local government.
3.3.d. No. of seminars, joint projects to disseminate best practices and transfer skills to USAID, CAs and other international partners
Seminar: A face-to-face or virtual small group meeting to facilitate intensive study of a subject. Joint Project: A set of collaborative activities carved out by two or more organizations who may sign a formal memorandum of understanding (MOU) or develop an informal agreement to collaborate.

110
4.2 USAID OFFICE OF POPULATION/REPRODUCTIVE HEALTH INDICATORS
Beginning in 2002, the USAID Office of Population and Reproductive Health (PRH) held a series of meetings with its staff and separate meetings with senior staff to develop its new Strategic Objective (SO) — Advance and support voluntary family planning and reproductive health programs worldwide. Also in September of that year, PRH senior staff began to develop the Intermediate Results (IRs) for this SO. In early 2004, work began to develop the indicators for each of the IRs. The office held internal and external brainstorming meetings, facilitated by the Measure Evaluation Project, to develop a set of indicators for each IR. The indicators were approved during a PRH senior staff retreat in March 2004 and were finalized in mid-2005 following their initial use by CAs in reporting to PRH.
The following are a selection of the PRH indicators and their definitions that are most relevant for use in LMS Programs, whether core or field support funded.
Intermediate Result 1.0: Global leadership demonstrated in FP/RH policy, advocacy and services.
IR1.0 is intended to cover PRH’s role in influencing the worldwide FP/RH agenda, creating global partnerships, influencing other donor programs, and helping to set sectoral priorities within USAID.
Indicator 1.1: Tools, protocols, procedures, systems, methodologies, guides, curricula, indices and/or key actionable findings incorporated into the work of other organizations.
Definition: Organizations are defined to include other sectors of USAID, other USG agencies, international organizations, foundations
Unit of Measurement: To be counted here, the tools, etc. must have demonstrated programmatic value, i.e. contribute to improving FP/RH programs in developing countries, and have been developed using PRH resources (core funds)
Indicator 1.2: Resources leveraged globally for FP/RH activities from non-USAID sources by core or field support funds
Definition: Includes resources leveraged to meet cost-share requirements
Unit of Measurement: Dollar amount leveraged
Indicator 1.3: Number of partnerships with organizations that do not traditionally focus on FP/RH
Definition: Organizations are defined to include other sectors of USAID, other USG agencies, international organizations, foundations that do not traditionally focus on FP/RH
Unit of Measurement: To be counted here, the partnership must have led to incorporation of tools, etc. (indicator 1.1) and/or leveraged resources (indicator 1.2) stemming from use of core funds or action by PRH staff
Intermediate Result 2.0: Knowledge generated, organized and communicated in response to program needs
IR2.0 encompasses the development, testing, and dissemination of new technologies (including new and improved contraceptive methods) and methodologies that contribute to successful field program implementation, as well as demographic data collection and evaluation and summative research.

111
Indicator 2.1: Tools, protocols, procedures, systems, methodologies, guides, curricula or indices with demonstrated programmatic value developed, validated, scaled up, and/or replicated in contexts other than where they were originally developed
Definition: Testing new tools, procedures, models etc., and initial replication for further validation is included here. In addition, testing approaches for scaling up is included here. Any routine scaling up (with no research component) or transfer to another setting should be included in indicator 3.1. Results must have programmatic value, i.e. contribute to improving FP/RH programs in developing countries.
Unit of Measurement: Evidence-based narrative
Indicator 2.2: Key actionable findings and experiences identified, generated, pooled, or summarized and their lessons extracted
Definition: Findings from research or program experience that can be applied effectively in developing country FP/RH programs.
Unit of Measurement: Evidence-based narrative
Indicator 2.3: Target audiences reached with tools, protocols, procedures, systems, methodologies, guides, curricula, indices, key actionable findings (i.e., the products reported in indicators 2.1 and/or 2.2):
Definition: None provided
Unit of Measurement: Evidence-based narrative
Intermediate Result 3.0: Support provided to the field to implement effective and sustainable FP/RH programs.
IR3.0 reflects the Global Health (GH) Bureau’s field-driven and field-centered approach. Sub-results and activities under this IR include the availability of mechanisms for the field to use to access FP/RH services, technical assistance provided by cooperating agencies and GH staff, partnerships with field programs, and the procurement and distribution of contraceptive commodities.
Indicator 3.1: Contraceptive methods, tools, protocols, procedures, systems, methodologies, guides, curricula, indices, and/or key actionable findings incorporated into mission or country programs (incorporation may be core or field support-funded, bilateral, host country government or other donor funded) or adopted/applied by other CAs
Definition: None provided
Unit of Measurement: To be counted here, the tools, etc. must have demonstrated programmatic value, i.e., contribute to improving FP/RH programs in developing countries, and have been developed using PRH resources (core funds)
Indicator 3.3 Level of organizational capacity to undertake activity as measured on a continuum from: - implementing w/significant TA - implementing/replicating with limited TA - implementing/replicating independently; - serving as a resource for others/leveraging resources
Definition: None provided
Unit of Measurement: Evidence-based narrative
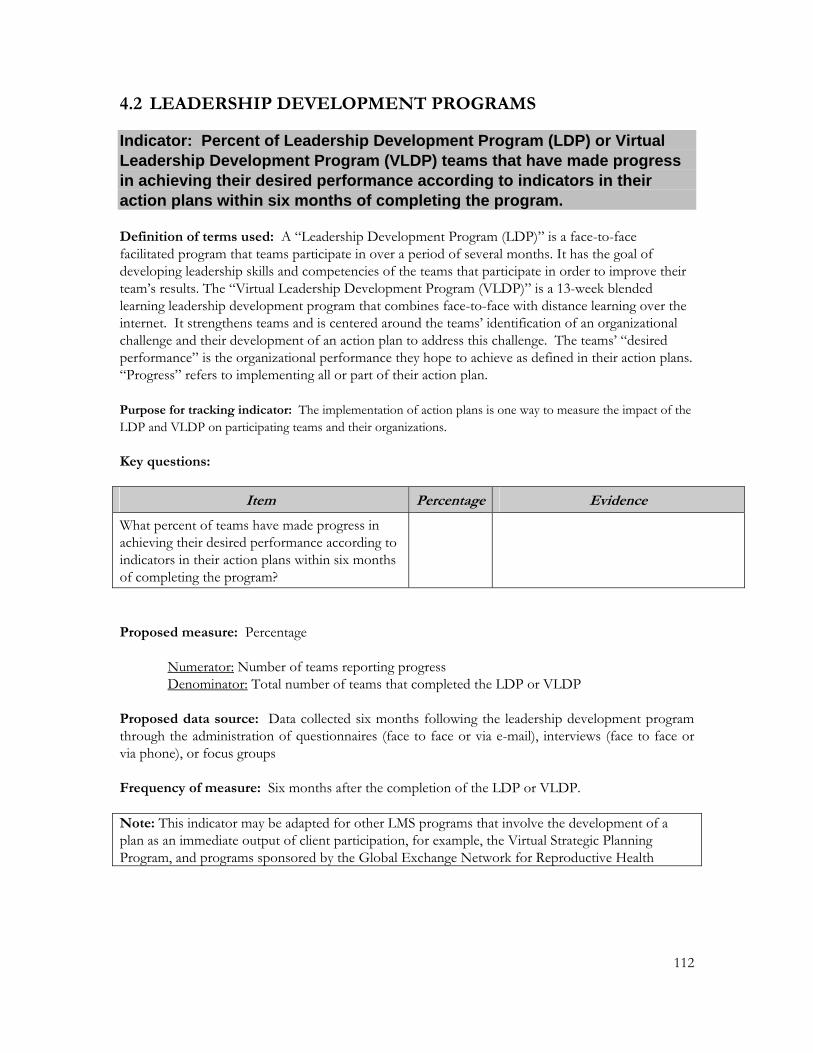
112
4.2 LEADERSHIP DEVELOPMENT PROGRAMS Indicator: Percent of Leadership Development Program (LDP) or Virtual Leadership Development Program (VLDP) teams that have made progress in achieving their desired performance according to indicators in their action plans within six months of completing the program. Definition of terms used: A “Leadership Development Program (LDP)” is a face-to-face facilitated program that teams participate in over a period of several months. It has the goal of developing leadership skills and competencies of the teams that participate in order to improve their team’s results. The “Virtual Leadership Development Program (VLDP)” is a 13-week blended learning leadership development program that combines face-to-face with distance learning over the internet. It strengthens teams and is centered around the teams’ identification of an organizational challenge and their development of an action plan to address this challenge. The teams’ “desired performance” is the organizational performance they hope to achieve as defined in their action plans. “Progress” refers to implementing all or part of their action plan.
Purpose for tracking indicator: The implementation of action plans is one way to measure the impact of the LDP and VLDP on participating teams and their organizations. Key questions:
Item Percentage Evidence
What percent of teams have made progress in achieving their desired performance according to indicators in their action plans within six months of completing the program?
Proposed measure: Percentage Numerator: Number of teams reporting progress Denominator: Total number of teams that completed the LDP or VLDP Proposed data source: Data collected six months following the leadership development program through the administration of questionnaires (face to face or via e-mail), interviews (face to face or via phone), or focus groups Frequency of measure: Six months after the completion of the LDP or VLDP. Note: This indicator may be adapted for other LMS programs that involve the development of a plan as an immediate output of client participation, for example, the Virtual Strategic Planning Program, and programs sponsored by the Global Exchange Network for Reproductive Health
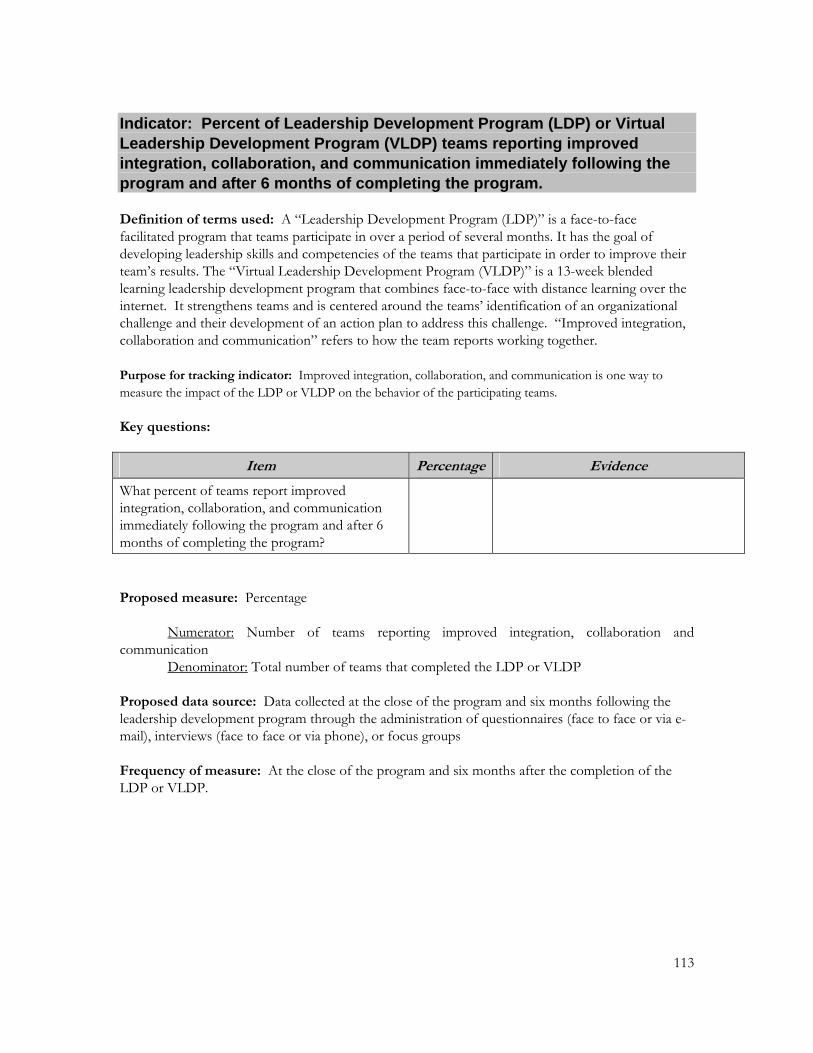
113
Indicator: Percent of Leadership Development Program (LDP) or Virtual Leadership Development Program (VLDP) teams reporting improved integration, collaboration, and communication immediately following the program and after 6 months of completing the program. Definition of terms used: A “Leadership Development Program (LDP)” is a face-to-face facilitated program that teams participate in over a period of several months. It has the goal of developing leadership skills and competencies of the teams that participate in order to improve their team’s results. The “Virtual Leadership Development Program (VLDP)” is a 13-week blended learning leadership development program that combines face-to-face with distance learning over the internet. It strengthens teams and is centered around the teams’ identification of an organizational challenge and their development of an action plan to address this challenge. “Improved integration, collaboration and communication” refers to how the team reports working together.
Purpose for tracking indicator: Improved integration, collaboration, and communication is one way to measure the impact of the LDP or VLDP on the behavior of the participating teams. Key questions:
Item Percentage Evidence
What percent of teams report improved integration, collaboration, and communication immediately following the program and after 6 months of completing the program?
Proposed measure: Percentage Numerator: Number of teams reporting improved integration, collaboration and communication Denominator: Total number of teams that completed the LDP or VLDP Proposed data source: Data collected at the close of the program and six months following the leadership development program through the administration of questionnaires (face to face or via e-mail), interviews (face to face or via phone), or focus groups Frequency of measure: At the close of the program and six months after the completion of the LDP or VLDP.
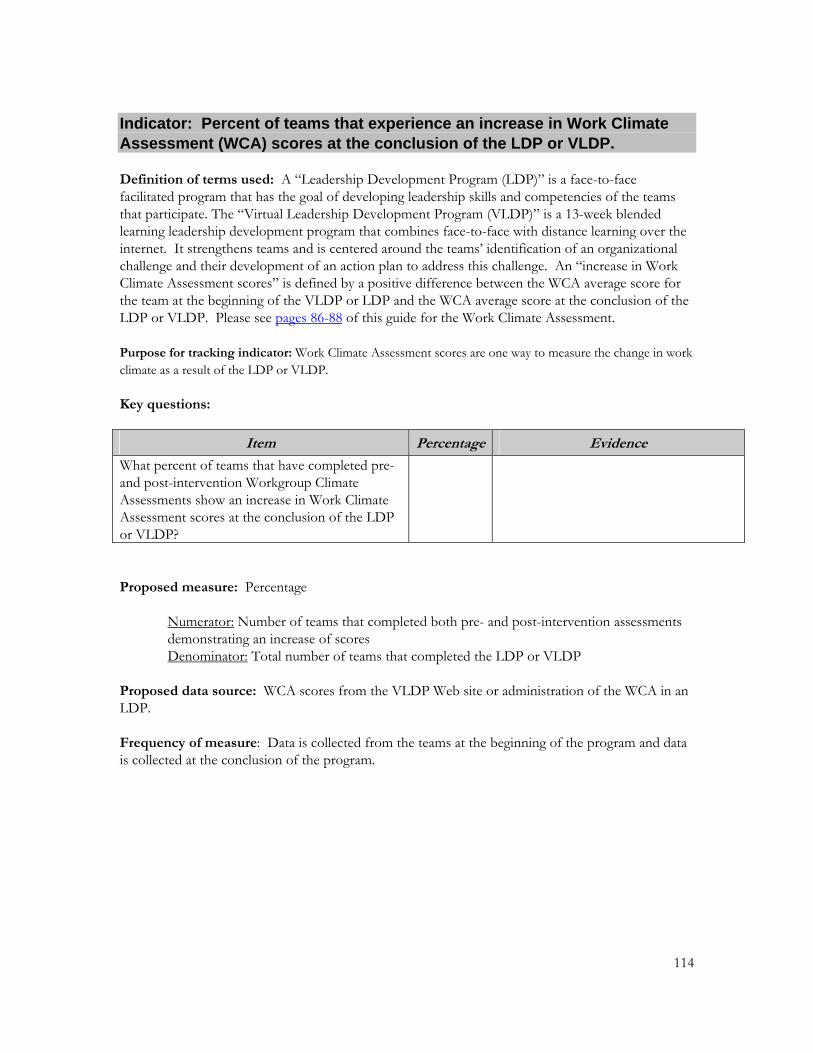
114
Indicator: Percent of teams that experience an increase in Work Climate Assessment (WCA) scores at the conclusion of the LDP or VLDP. Definition of terms used: A “Leadership Development Program (LDP)” is a face-to-face facilitated program that has the goal of developing leadership skills and competencies of the teams that participate. The “Virtual Leadership Development Program (VLDP)” is a 13-week blended learning leadership development program that combines face-to-face with distance learning over the internet. It strengthens teams and is centered around the teams’ identification of an organizational challenge and their development of an action plan to address this challenge. An “increase in Work Climate Assessment scores” is defined by a positive difference between the WCA average score for the team at the beginning of the VLDP or LDP and the WCA average score at the conclusion of the LDP or VLDP. Please see pages 86-88 of this guide for the Work Climate Assessment.
Purpose for tracking indicator: Work Climate Assessment scores are one way to measure the change in work climate as a result of the LDP or VLDP. Key questions:
Item Percentage Evidence
What percent of teams that have completed pre- and post-intervention Workgroup Climate Assessments show an increase in Work Climate Assessment scores at the conclusion of the LDP or VLDP?
Proposed measure: Percentage
Numerator: Number of teams that completed both pre- and post-intervention assessments demonstrating an increase of scores
Denominator: Total number of teams that completed the LDP or VLDP Proposed data source: WCA scores from the VLDP Web site or administration of the WCA in an LDP. Frequency of measure: Data is collected from the teams at the beginning of the program and data is collected at the conclusion of the program.
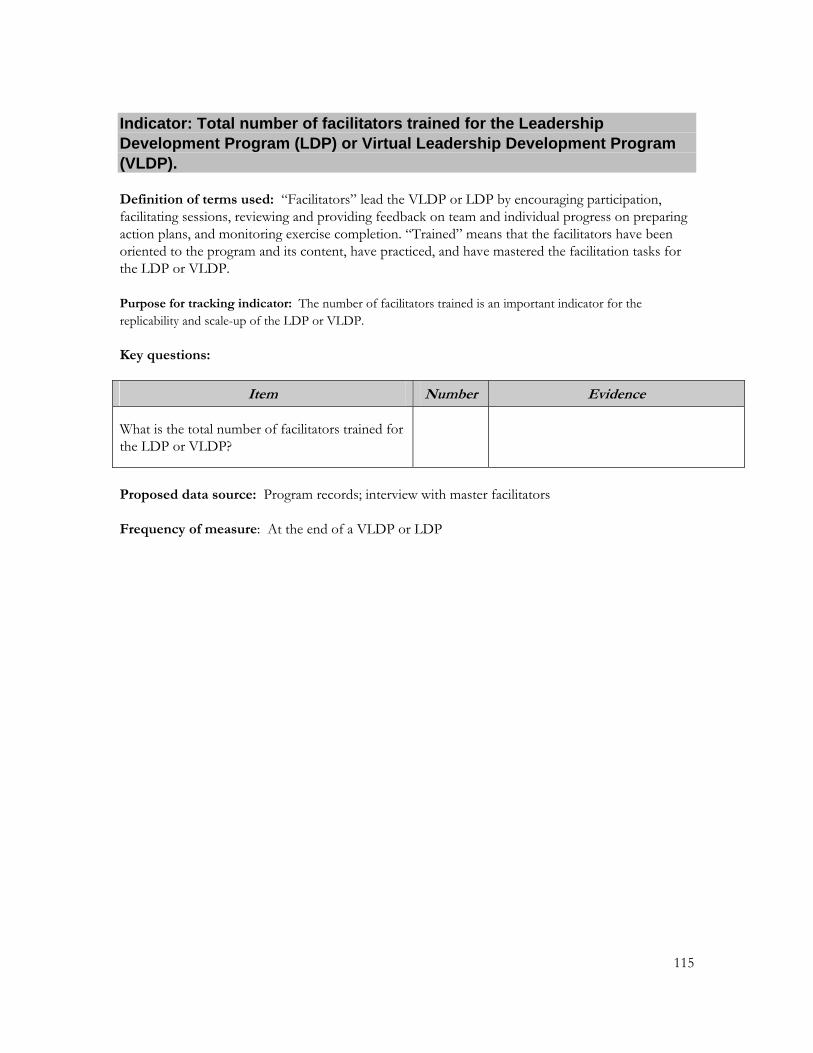
115
Indicator: Total number of facilitators trained for the Leadership Development Program (LDP) or Virtual Leadership Development Program (VLDP). Definition of terms used: “Facilitators” lead the VLDP or LDP by encouraging participation, facilitating sessions, reviewing and providing feedback on team and individual progress on preparing action plans, and monitoring exercise completion. “Trained” means that the facilitators have been oriented to the program and its content, have practiced, and have mastered the facilitation tasks for the LDP or VLDP. Purpose for tracking indicator: The number of facilitators trained is an important indicator for the replicability and scale-up of the LDP or VLDP. Key questions:
Item Number Evidence
What is the total number of facilitators trained for the LDP or VLDP?
Proposed data source: Program records; interview with master facilitators Frequency of measure: At the end of a VLDP or LDP

116
4.4 ELECTRONIC NETWORKS AND COMMUNITIES Indicator: Number of network members actively participating in network activities or events. Definition of terms used: “Actively participating” means that a network member registers to participate in an online network event and/or logs onto the website at least once during the event. “Network activities or events” refer to forums, virtual conferences, and any other virtual event held for network members. Purpose for tracking indicator: A way to measure the effectiveness of a network is to measure the percentage of network members actively participating in network activities or events. Key questions:
Item Number Evidence
What number of network members actively participate in network activities or events?
Proposed measure: Number Proposed data source: Analysis of network website exchanges, website records Frequency of measure: Annually
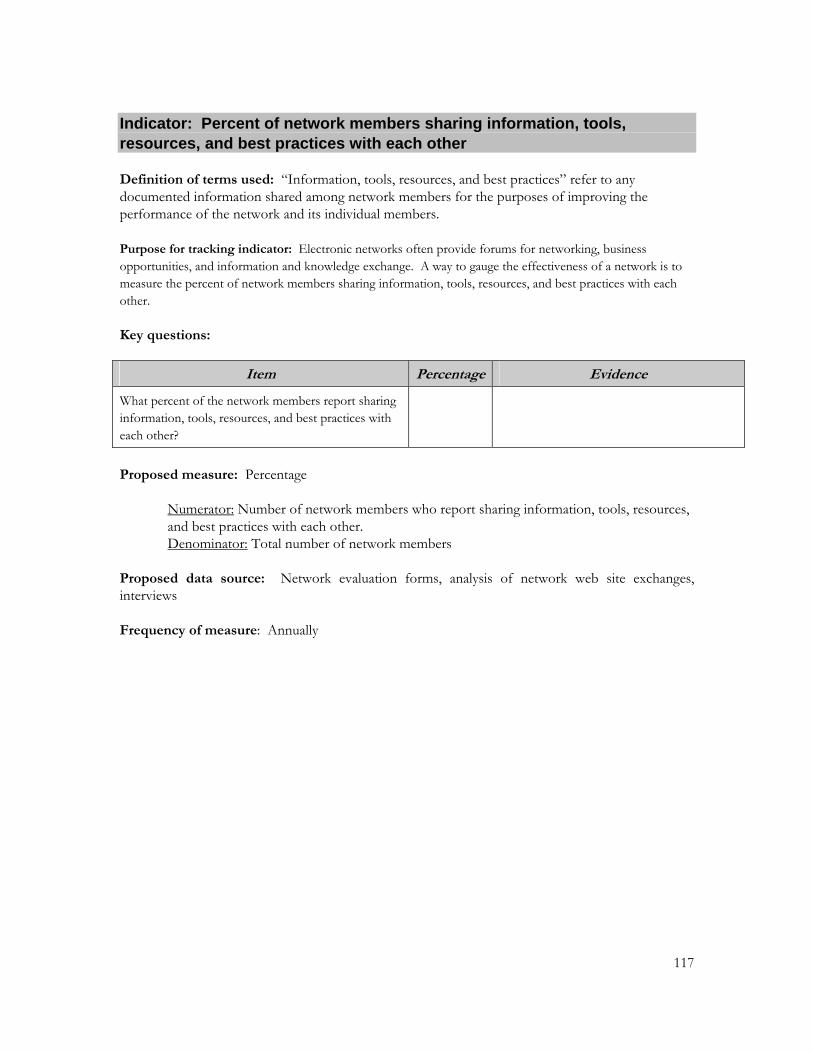
117
Indicator: Percent of network members sharing information, tools, resources, and best practices with each other Definition of terms used: “Information, tools, resources, and best practices” refer to any documented information shared among network members for the purposes of improving the performance of the network and its individual members. Purpose for tracking indicator: Electronic networks often provide forums for networking, business opportunities, and information and knowledge exchange. A way to gauge the effectiveness of a network is to measure the percent of network members sharing information, tools, resources, and best practices with each other. Key questions:
Item Percentage Evidence
What percent of the network members report sharing information, tools, resources, and best practices with each other?
Proposed measure: Percentage Numerator: Number of network members who report sharing information, tools, resources,
and best practices with each other. Denominator: Total number of network members Proposed data source: Network evaluation forms, analysis of network web site exchanges, interviews Frequency of measure: Annually
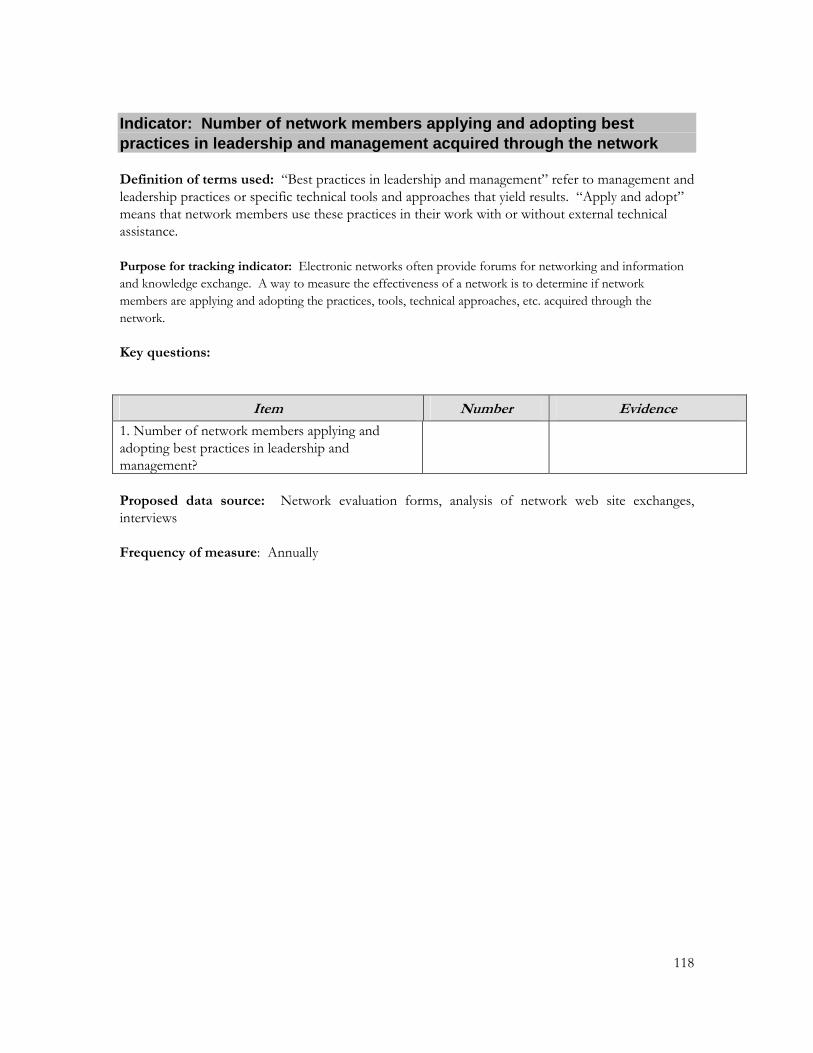
118
Indicator: Number of network members applying and adopting best practices in leadership and management acquired through the network Definition of terms used: “Best practices in leadership and management” refer to management and leadership practices or specific technical tools and approaches that yield results. “Apply and adopt” means that network members use these practices in their work with or without external technical assistance. Purpose for tracking indicator: Electronic networks often provide forums for networking and information and knowledge exchange. A way to measure the effectiveness of a network is to determine if network members are applying and adopting the practices, tools, technical approaches, etc. acquired through the network. Key questions:
Item Number Evidence
1. Number of network members applying and adopting best practices in leadership and management?
Proposed data source: Network evaluation forms, analysis of network web site exchanges, interviews Frequency of measure: Annually
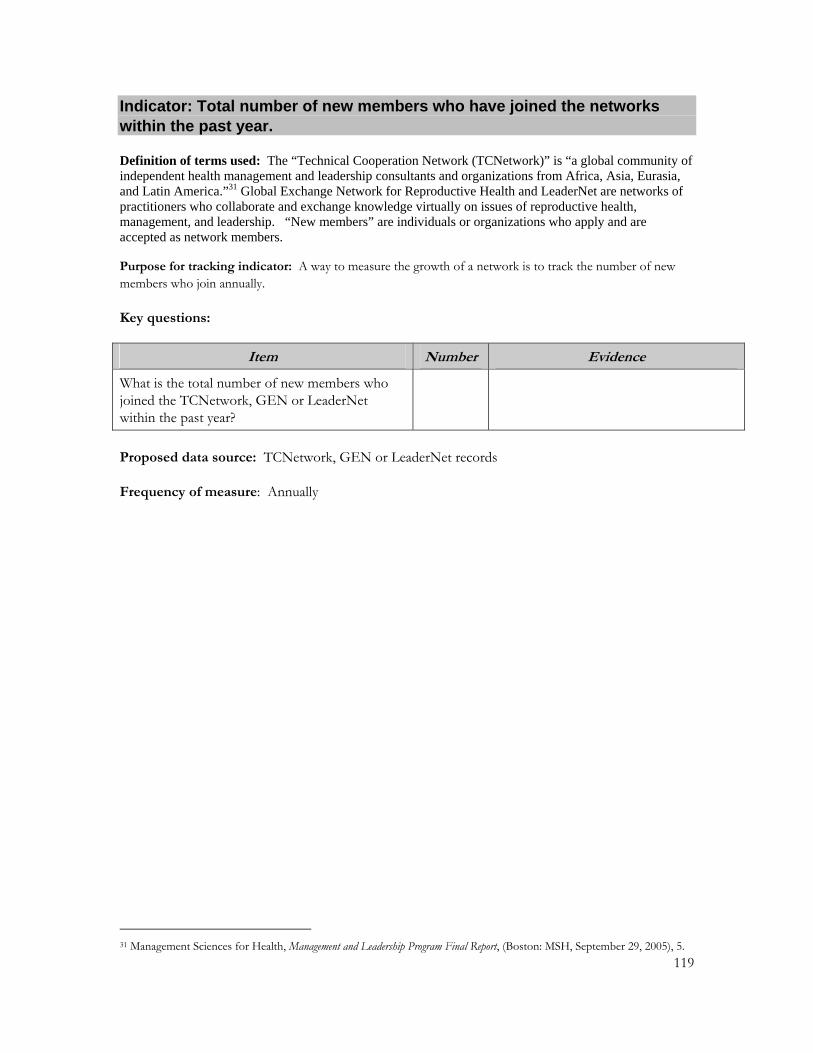
119
Indicator: Total number of new members who have joined the networks within the past year. Definition of terms used: The “Technical Cooperation Network (TCNetwork)” is “a global community of independent health management and leadership consultants and organizations from Africa, Asia, Eurasia, and Latin America.”31 Global Exchange Network for Reproductive Health and LeaderNet are networks of practitioners who collaborate and exchange knowledge virtually on issues of reproductive health, management, and leadership. “New members” are individuals or organizations who apply and are accepted as network members.
Purpose for tracking indicator: A way to measure the growth of a network is to track the number of new members who join annually. Key questions:
Item Number Evidence
What is the total number of new members who joined the TCNetwork, GEN or LeaderNet within the past year?
Proposed data source: TCNetwork, GEN or LeaderNet records Frequency of measure: Annually
31 Management Sciences for Health, Management and Leadership Program Final Report, (Boston: MSH, September 29, 2005), 5.

120
4.5 TECHNICAL COOPERATION NETWORK Indicator: Total number of new business opportunities (grant, consultancy, contract) available to the Technical Cooperation Network by number and type of donors and clients. Definition of terms used: The “Technical Cooperation Network (TCNetwork)” is “a global community of independent health management and leadership consultants and organizations from Africa, Asia, Eurasia, and Latin America.”32 “New business opportunities” refers to grants, consultancies, contracts, and any other business opportunity made available through the network. Purpose for tracking indicator: Electronic networks often provide the means for networking and business opportunities. A way to measure the effectiveness of a network is to track the number of business opportunities available to the network. Key questions:
Item Number Type of donors &
clients
Evidence
What is the total number of new business opportunities available to the TCNetwork by number and type of donors and clients within the last year?
Proposed data source: Network website records Frequency of measure: Annually
32 Management Sciences for Health, Management and Leadership Program Final Report, (Boston: MSH, September 29, 2005), 5.

121
Indicator: Number and type of alternative forms of funding obtained by the Technical Cooperation Network. Definition of terms used: The “Technical Cooperation Network (TCNetwork)” is “a global community of independent health management and leadership consultants and organizations from Africa, Asia, Eurasia, and Latin America.”33 “Alternative forms of funding” refer to financing that comes from sources besides the historical primary donor (MSH) for the management and oversight of the Network by its secretariat. Purpose for tracking indicator: A way to measure the sustainability of a network is to track the number and type of alternative forms of funding obtained to support the Network secretariat, which oversees the management of the Network. Key questions:
Item Number Type of alternative
funding forms
Evidence
What is the total number and type of alternative forms of funding (besides MSH funds) obtained by the TCNetwork within the last year?
Proposed data source: Network financial records, questionnaire Frequency of measure: Annually
33 Management Sciences for Health, Management and Leadership Program Final Report, (Boston: MSH, September 29, 2005), 5.
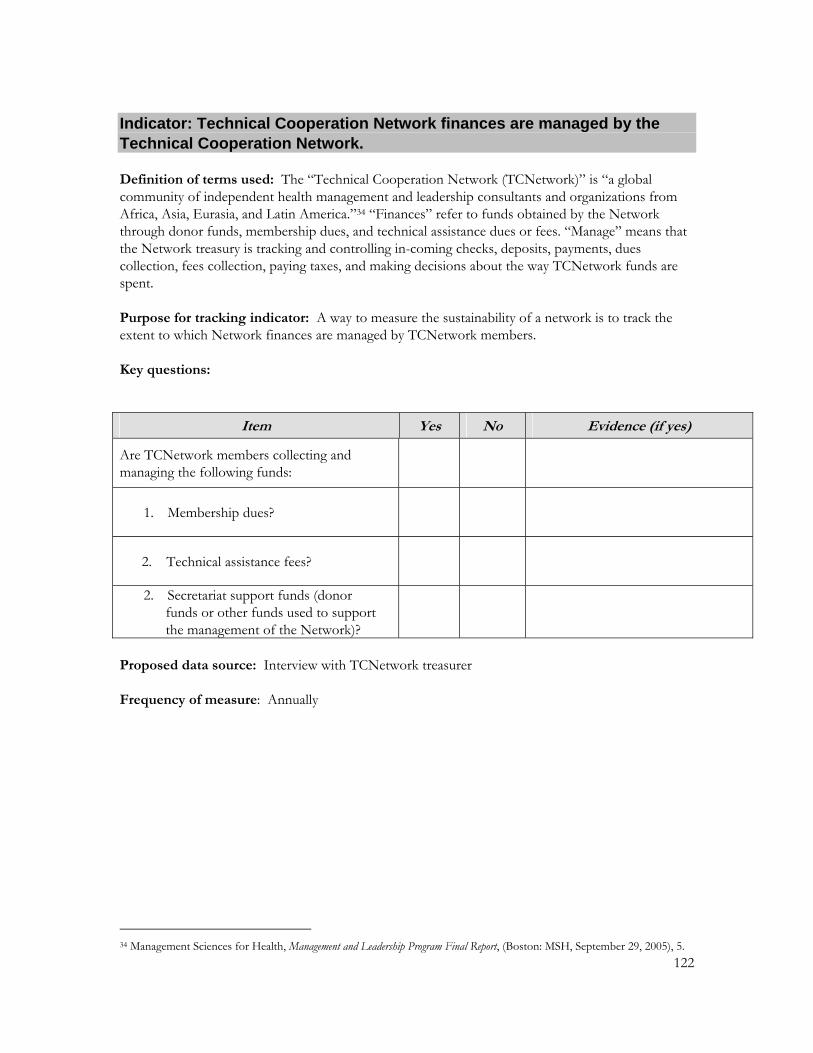
122
Indicator: Technical Cooperation Network finances are managed by the Technical Cooperation Network. Definition of terms used: The “Technical Cooperation Network (TCNetwork)” is “a global community of independent health management and leadership consultants and organizations from Africa, Asia, Eurasia, and Latin America.”34 “Finances” refer to funds obtained by the Network through donor funds, membership dues, and technical assistance dues or fees. “Manage” means that the Network treasury is tracking and controlling in-coming checks, deposits, payments, dues collection, fees collection, paying taxes, and making decisions about the way TCNetwork funds are spent. Purpose for tracking indicator: A way to measure the sustainability of a network is to track the extent to which Network finances are managed by TCNetwork members. Key questions:
Item Yes No Evidence (if yes)
Are TCNetwork members collecting and managing the following funds:
1. Membership dues?
2. Technical assistance fees?
2. Secretariat support funds (donor funds or other funds used to support the management of the Network)?
Proposed data source: Interview with TCNetwork treasurer Frequency of measure: Annually
34 Management Sciences for Health, Management and Leadership Program Final Report, (Boston: MSH, September 29, 2005), 5.
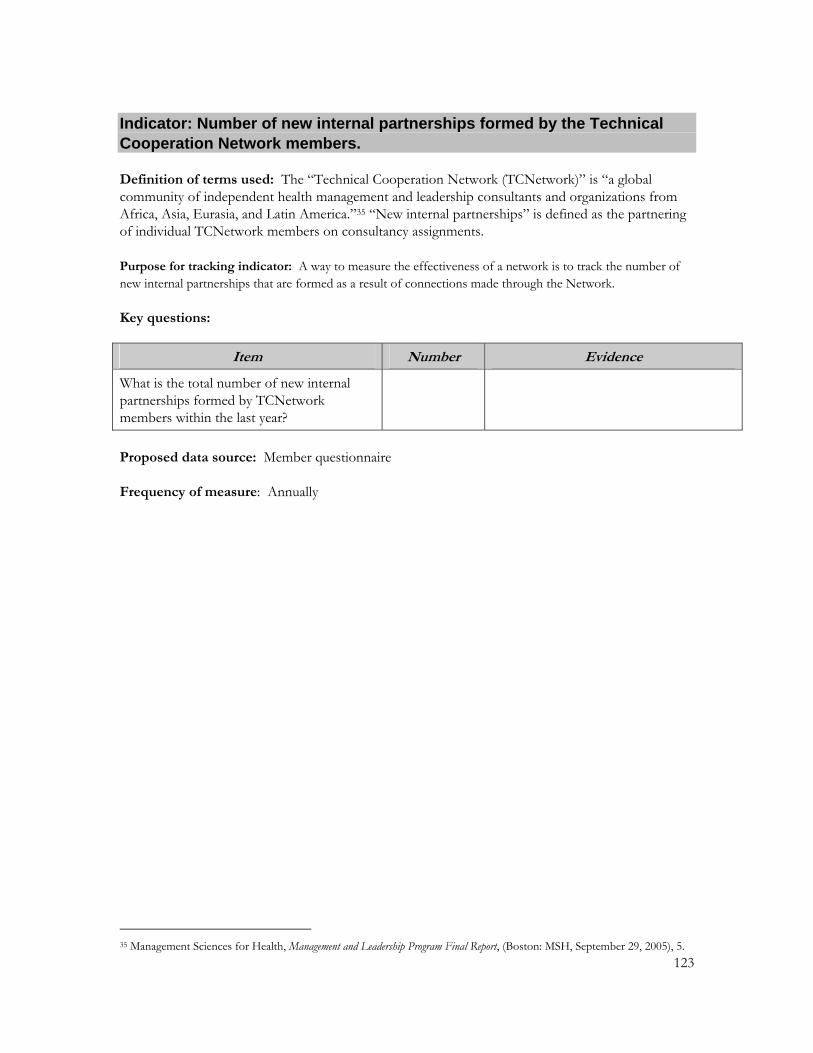
123
Indicator: Number of new internal partnerships formed by the Technical Cooperation Network members. Definition of terms used: The “Technical Cooperation Network (TCNetwork)” is “a global community of independent health management and leadership consultants and organizations from Africa, Asia, Eurasia, and Latin America.”35 “New internal partnerships” is defined as the partnering of individual TCNetwork members on consultancy assignments. Purpose for tracking indicator: A way to measure the effectiveness of a network is to track the number of new internal partnerships that are formed as a result of connections made through the Network. Key questions:
Item Number Evidence
What is the total number of new internal partnerships formed by TCNetwork members within the last year?
Proposed data source: Member questionnaire Frequency of measure: Annually
35 Management Sciences for Health, Management and Leadership Program Final Report, (Boston: MSH, September 29, 2005), 5.

124
Indicator: Number of new external partnerships formed by the Technical Cooperation Network. Definition of terms used: The “Technical Cooperation Network (TCNetwork)” is “a global community of independent health management and leadership consultants and organizations from Africa, Asia, Eurasia, and Latin America.”36 “New external partnerships” is defined as the partnering of the TCNetwork with external organizations to bid on a project. Purpose for tracking indicator: A way to measure the effectiveness and success of a network is to track the number of new external partnerships that are formed with outside organizations in order to obtain new business for the Network. Key questions:
Item Number Evidence
What is the total number of new external partnerships formed by the TCNetwork with other organizations within the last year?
Proposed data source: Network program and financial records, Council Questionnaire Frequency of measure: Annually
36 Management Sciences for Health, Management and Leadership Program Final Report, (Boston: MSH, September 29, 2005), 5.
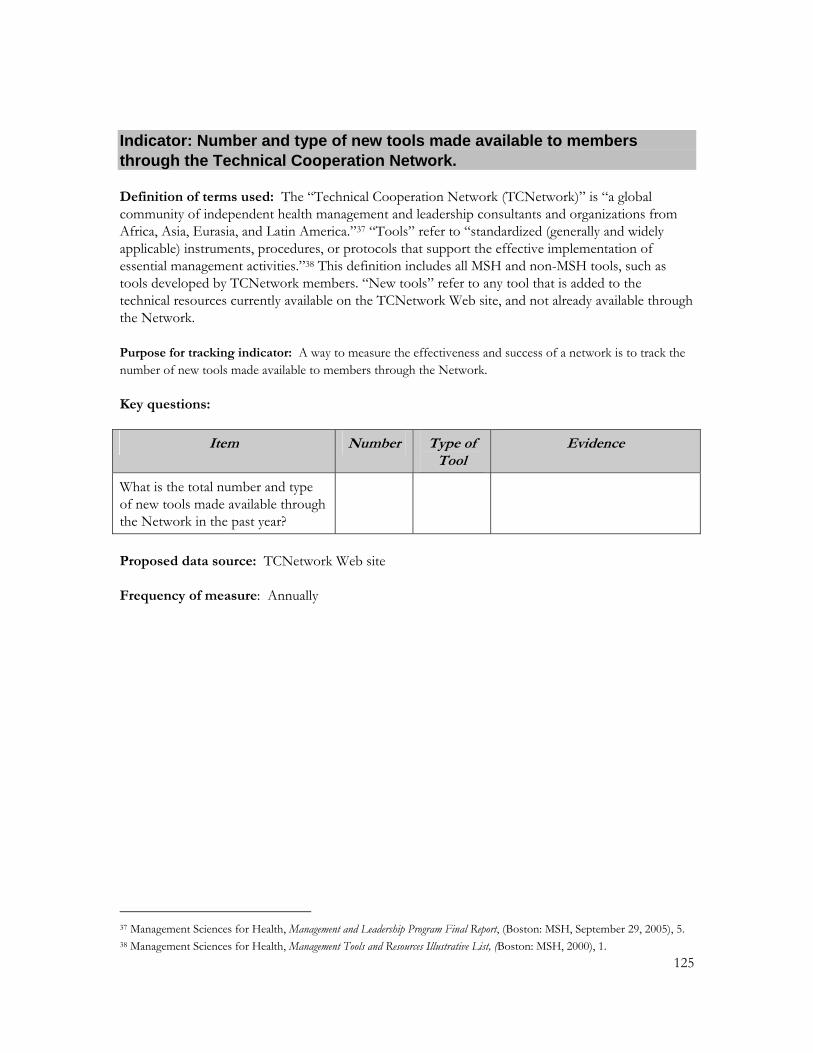
125
Indicator: Number and type of new tools made available to members through the Technical Cooperation Network. Definition of terms used: The “Technical Cooperation Network (TCNetwork)” is “a global community of independent health management and leadership consultants and organizations from Africa, Asia, Eurasia, and Latin America.”37 “Tools” refer to “standardized (generally and widely applicable) instruments, procedures, or protocols that support the effective implementation of essential management activities.”38 This definition includes all MSH and non-MSH tools, such as tools developed by TCNetwork members. “New tools” refer to any tool that is added to the technical resources currently available on the TCNetwork Web site, and not already available through the Network. Purpose for tracking indicator: A way to measure the effectiveness and success of a network is to track the number of new tools made available to members through the Network. Key questions:
Item Number Type of Tool
Evidence
What is the total number and type of new tools made available through the Network in the past year?
Proposed data source: TCNetwork Web site Frequency of measure: Annually
37 Management Sciences for Health, Management and Leadership Program Final Report, (Boston: MSH, September 29, 2005), 5. 38 Management Sciences for Health, Management Tools and Resources Illustrative List, (Boston: MSH, 2000), 1.

126
Indicator: Number and type of tools available through the Technical Cooperation Network that are used by members of the Technical Cooperation Network. Definition of terms used: The “Technical Cooperation Network (TCNetwork)” is “a global community of independent health management and leadership consultants and organizations from Africa, Asia, Eurasia, and Latin America.”39 “Tools” refer to “standardized (generally and widely applicable) instruments, procedures, or protocols that support the effective implementation of essential management activities.”40 This definition includes all tools, including non-MSH tools and tools developed by TCNetwork members. “Used” means that TCNetwork members have applied a tool at least once in their consultancies and assignments. Purpose for tracking indicator: A way to measure the effectiveness and success of a network is to track the number of tools available through the Network that have been used by members of the Network. Key questions:
Item Number Type of Tool
Evidence
What is the total number and type of tools available through TCNetwork that have been used by TCNetwork members in the past six months?
Proposed data source: Questionnaire to TCNetwork members Frequency of measure: Every six months
39 Management Sciences for Health, Management and Leadership Program Final Report, (Boston: MSH, September 29, 2005), 5. 40 Management Sciences for Health, Management Tools and Resources Illustrative List, (Boston: MSH, 2000), 1.
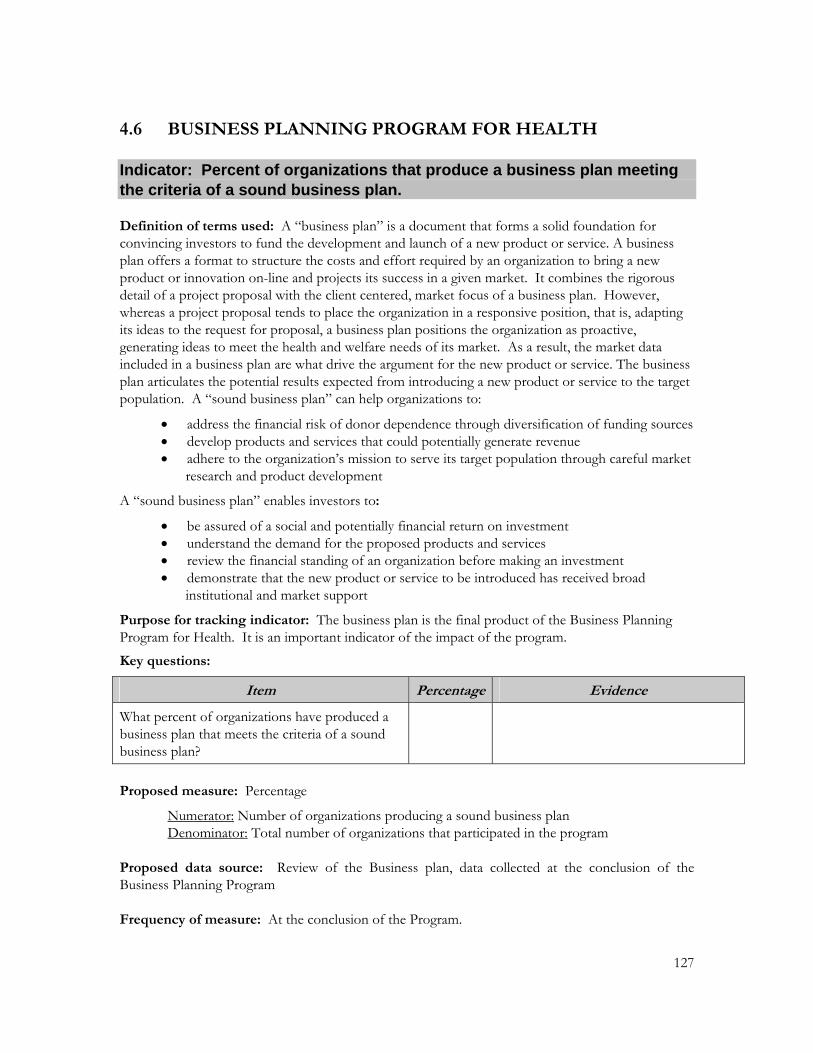
127
4.6 BUSINESS PLANNING PROGRAM FOR HEALTH Indicator: Percent of organizations that produce a business plan meeting the criteria of a sound business plan. Definition of terms used: A “business plan” is a document that forms a solid foundation for convincing investors to fund the development and launch of a new product or service. A business plan offers a format to structure the costs and effort required by an organization to bring a new product or innovation on-line and projects its success in a given market. It combines the rigorous detail of a project proposal with the client centered, market focus of a business plan. However, whereas a project proposal tends to place the organization in a responsive position, that is, adapting its ideas to the request for proposal, a business plan positions the organization as proactive, generating ideas to meet the health and welfare needs of its market. As a result, the market data included in a business plan are what drive the argument for the new product or service. The business plan articulates the potential results expected from introducing a new product or service to the target population. A “sound business plan” can help organizations to:
• address the financial risk of donor dependence through diversification of funding sources • develop products and services that could potentially generate revenue • adhere to the organization’s mission to serve its target population through careful market
research and product development
A “sound business plan” enables investors to:
• be assured of a social and potentially financial return on investment • understand the demand for the proposed products and services • review the financial standing of an organization before making an investment • demonstrate that the new product or service to be introduced has received broad
institutional and market support
Purpose for tracking indicator: The business plan is the final product of the Business Planning Program for Health. It is an important indicator of the impact of the program.
Key questions:
Item Percentage Evidence
What percent of organizations have produced a business plan that meets the criteria of a sound business plan?
Proposed measure: Percentage
Numerator: Number of organizations producing a sound business plan Denominator: Total number of organizations that participated in the program Proposed data source: Review of the Business plan, data collected at the conclusion of the Business Planning Program Frequency of measure: At the conclusion of the Program.

128
Indicator: Percent of a business plan that is completely or partially funded within 6-12 months of program completion Definition of terms used: A “business plan” is a document that forms a solid foundation for convincing investors to fund the development and launch of a new product or service. A business plan offers a format to structure the costs and effort required by an organization to bring a new product or innovation on-line and projects its success in a given market. It combines the rigorous detail of a project proposal with the client centered, market focus of a business plan. However, whereas a project proposal tends to place the organization in a responsive position, that is, adapting its ideas to a request for proposal, a business plan positions the organization as proactive, generating ideas to meet the health and welfare needs of its market. As a result, the market data included in a business plan are what drive the argument for the new product or service. The business plan articulates the potential results expected from introducing a new product or service to the target population.
Purpose for tracking indicator: The purpose of producing a business plan is to attract funding from non-traditional sources or investors. The percent of a business plan that is completely or partially funded within 6-12 months of program completion is an indicator of the success of the program. Key questions:
Item Percentage Evidence
What percent of a business plan is funded within 6-12 months of program completion?
Proposed measure: Percentage Numerator: Amount funding obtained for a business plan Denominator: Total budget of the business plan Proposed data source: Financial records, data from the organization Frequency of measure: Data collected 6-12 months after the conclusion of the program
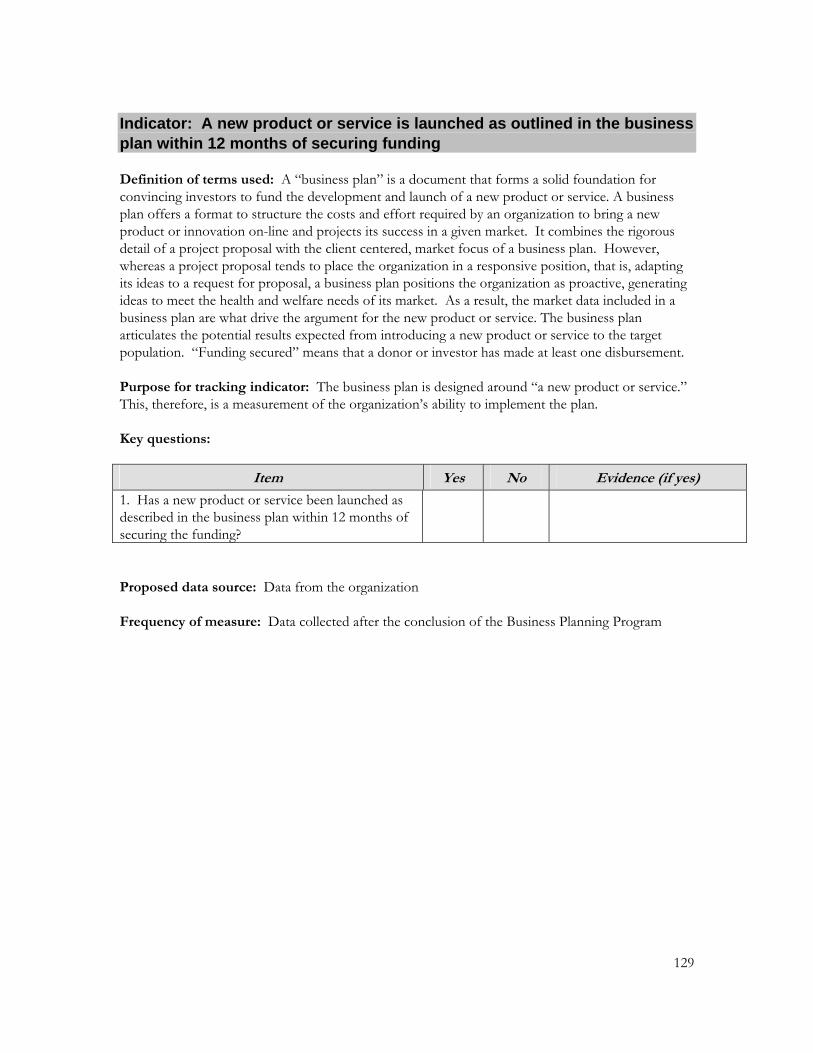
129
Indicator: A new product or service is launched as outlined in the business plan within 12 months of securing funding Definition of terms used: A “business plan” is a document that forms a solid foundation for convincing investors to fund the development and launch of a new product or service. A business plan offers a format to structure the costs and effort required by an organization to bring a new product or innovation on-line and projects its success in a given market. It combines the rigorous detail of a project proposal with the client centered, market focus of a business plan. However, whereas a project proposal tends to place the organization in a responsive position, that is, adapting its ideas to a request for proposal, a business plan positions the organization as proactive, generating ideas to meet the health and welfare needs of its market. As a result, the market data included in a business plan are what drive the argument for the new product or service. The business plan articulates the potential results expected from introducing a new product or service to the target population. “Funding secured” means that a donor or investor has made at least one disbursement. Purpose for tracking indicator: The business plan is designed around “a new product or service.” This, therefore, is a measurement of the organization’s ability to implement the plan. Key questions:
Item Yes No Evidence (if yes)
1. Has a new product or service been launched as described in the business plan within 12 months of securing the funding?
Proposed data source: Data from the organization Frequency of measure: Data collected after the conclusion of the Business Planning Program

130
Indicator: Number of program replications using the Business Planning Program for Health in any period following completion of the first program. Definition of terms used: “Program replications” refers to when an organization replicates the 6 module Business Planning Program internally.
Purpose for tracking indicator: While not a requirement of the Program, its replication internally, to prepare a new plan, is an indicator of the Program’s relevance and effectiveness. Key questions:
Item Number Evidence
How many times has the Business Planning Program for Health been used internally in any period following completion of the first program?
Proposed data source: Data from the organization Frequency of measure: Twelve or more months after the conclusion of the first Business Planning Program

131
Indicator: Number of times a program partner offers the Business Planning Program for Health. Definition of terms used: The Business Planning Program for Health (BPPH) is a blended learning program designed to enable NGOs, faith-based organizations (FBOs), and government entities to write business plans to launch new products or services. “BPPH program partners” are organizations that have been formally trained to deliver the BPPH to other organizations and have a formal agreement with MSH to provide information on their activities offering this Program.
Purpose for tracking indicator: One of the strategies for scale-up of the Business Planning Program for Health is to develop the capacity of program partners to offer the Program independent of MSH technical assistance. Key questions:
Item Number Evidence
1. How many times has a BPPH program partner offered the Program?
2. To how many organizations has the program been offered?
Proposed data source: Data from the program partner Frequency of measure: Annually

132
4.7 MANAGEMENT AND ORGANIZATIONAL SUSTAINABILITY TOOL (MOST)
Indicator: A MOST action plan is developed and the participating organization has made progress implementing the plan within 6-12 months following the workshop. Definition of terms used: The Management Organizational Sustainability Tool (MOST) is a structured, participatory process that allows an organization to assess its own management performance and develop a concrete action plan for improvement. The cornerstone of the MOST process is a 3-day workshop during which the organizational leadership and selected staff build consensus about the stages of development of the organization’s management systems, and priority improvements needed. Agreements are documented in an action plan which identifies the objective, indicators, activities, resource needs and a timeline. “Developed” means that the action plan is written and agreed upon by the group. “Progress” refers to implementing all or part of the action plan.
Purpose for tracking indicator: The implementation of the action plan is a way to measure the impact of the MOST process on organizational performance. Key questions:
Item Yes No Evidence (if yes)
1. Did the organization produce an action plan during the MOST workshop or thereafter?
If yes: 2. Has the organization made progress in implementing all or part of its action plan 6-12 months following the MOST workshop?
Proposed data source: Update report prepared by the organization. Frequency of measure: 6–12 months after the conclusion of the MOST exercise.

133
4.8 RESPONSIBILITY AND AUTHORITY MAPPING PROCESS (RAMP)
Indicator: A RAMP action plan is developed and the government institution(s) has made progress implementing the plan within 6-12 months following RAMP’s application Definition of terms used: RAMP is a practical management method designed for policymakers and senior managers to help them identify those health management functions for which responsibility and management authority are most ambiguous. The underlying premise to the development of the RAMP is that managers or other stakeholders who do not perceive that they have power over particular management actions (even if on paper they possess this power) are unlikely to take the responsibility or authority for them. Similarly, managers or other stakeholders who do believe that they have been allocated such powers are likely to act, even if those powers are not formally theirs. It is important to understand clearly how managers and stakeholders perceive their powers in order to foster appropriate action and reduce conflict. Purpose for tracking indicator: The implementation of the action plan is a way to measure the impact of the RAMP tool on the implementation of decentralization in the health system. Key questions:
Item Yes No Evidence (if yes)
1. Did the government institution(s) produce an action plan during the application of RAMP or thereafter?
If yes: 2. Has the government institution(s) made progress in implementing all or part of its action plan 6-12 months following the application of RAMP?
Proposed data source: Update report prepared by the lead government institution. Frequency of measure: 6-12 months after the conclusion of the RAMP exercise.
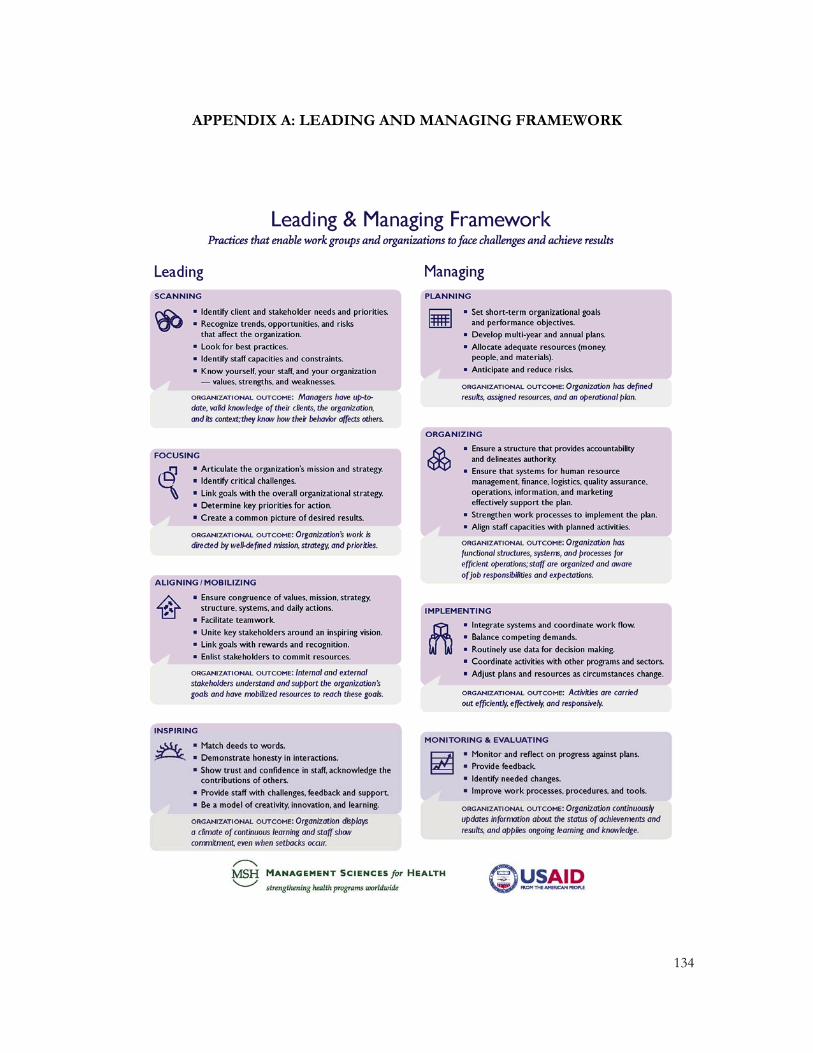
APPENDIX A: LEADING AND MANAGING FRAMEWORK
134
135
REFERENCES Bertrand, J.T., Gariela Escudero. “Compendium of Indicators for Evaluating Reproductive Health
Programs.” MEASURE Evaluation Manual Series, No 6. University of North Carolina at Chapel Hill: Carolina Population Center, August 2002.
Bulatao, R. "Dissecting Family Planning Sustainability." MEASURE Evaluation Project. University
of North Carolina at Chapel Hill: Carolina Population Center, December. 1995. Family Health International. “Workplace HIV/AIDS Programs: An Action Guide for Managers.”
Arlington, VA: Family Health International, 2002. Gage, Anastasia J., Disha Ali, and Chiho Suzuki. “A Guide for Monitoring and Evaluating Child
Health Programs.” MEASURE Evaluation Project, University of North Carolina at Chapel Hill: Carolina Population Center, 2005.
Gutierrez, Maria. "Indicators for Assessing CQI Efforts." Boston: Management Sciences for Health,
http://erc.msh.org/mainpage.cfm?file=2.2.6.htm&language=english&module=quality (accessed 10/20/2006).
Levine, R., J. Bennett. “Sustainability of Family Planning Programs and Organizations: Meeting
Tomorrow's Challenges.” The Futures Group OPTIONS Project. Washington, D.C: Futures Group, January 1995.
Management Sciences for Health. “The Art of Crafting a Business Plan for Social Return on
Investment: A Pocket Guide to the Business Planning Program.” Boston: Management Sciences for Health, 2003.
Management Sciences for Health. "Forming Partnerships to Improve Public Health.” The Manager
(Boston) vol. 7, no.4, 1998/99. Management Sciences for Health. “Management and Leadership Program Final Report- Sept 29,
2005.” Management and Leadership Project. Boston: Management Sciences for Health, Sept, 2005.
Management Sciences for Health. Management and Organizational Sustainability Tool: A Guide for Users and
Facilitators 2nd edition. Boston: Managements Sciences for Health, 2004 http://erc.msh.org/mainpage.cfm?file=95.40.htm&module=toolkit&language=English (accessed 10/20/2006).
Management Sciences for Health. “Management Tools and Resources Illustrative List.” Boston:
Management Sciences for Health, 2000. Management Sciences for Health. Managers Who Lead: A Handbook for Improving Health Services. Boston:
Management Sciences for Health, 2005.
136
Management Sciences for Health and the World Health Organization. Managing Drug Supply: The Selection, Procurement, Distribution, and Use of Pharmaceuticals. 2nd ed., rev. and exp. W. Hartford, CT: Kumarian Press, 1997.
Management Sciences for Health. "Marketing Your Organization's Services." The Manager (Boston)
vol. 8, no. 2, 1999. Management Sciences for Health. "Planning for Leadership Transition." The Manager (Boston) vol.
10, no. 1, 2001. Management Sciences for Health and the Latin American and Caribbean Health and Nutrition and
Sustainability Project. Rapid Pharmaceutical Management Assessment: An Indicator-based Approach. Boston: Management Sciences for Health, 1995.
Miller, J and C. Bahamon. Family Planning Management Terms: A pocket glossary in three languages Boston:
Management Sciences for Health, 1996. Perry, Cary, Nancy LeMay, Greg Rodway, Allison Tracy and Joan Galer. “Validating a work group
climate assessment tool for improving the performance of public health organizations.” Human Resources for Health, vol. 3, no. 1, 2005.
United Nations Development Program. Handbook on Monitoring and Evaluating for Results. New York:
Evaluation Office, 2002. U.S. Agency for International Development, Matching Grants Program, Office of Private and
Voluntary Cooperation. “Non-Profit Business Planning: Notes and Sample Formats for Matching Grant PVOs to Prepare a Sustainability / Business Plan." Washington, D.C: USAID, 1999.
USAID Center for Development Information and Evaluation. Performance Monitoring and Evaluation
TIPS, no 7. Washington, D.C: USAID, 1996.