Embed Size (px)
Citation preview

Mental Representations 1
Running head: MENTAL REPRESENTATIONS
The Nature of Information Loss Across a Range of Tasks
Jordan M. Province, April R. Swagman, Jeffrey N. Rouder
University of Missouri
Jordan Province
Mental Representations 2
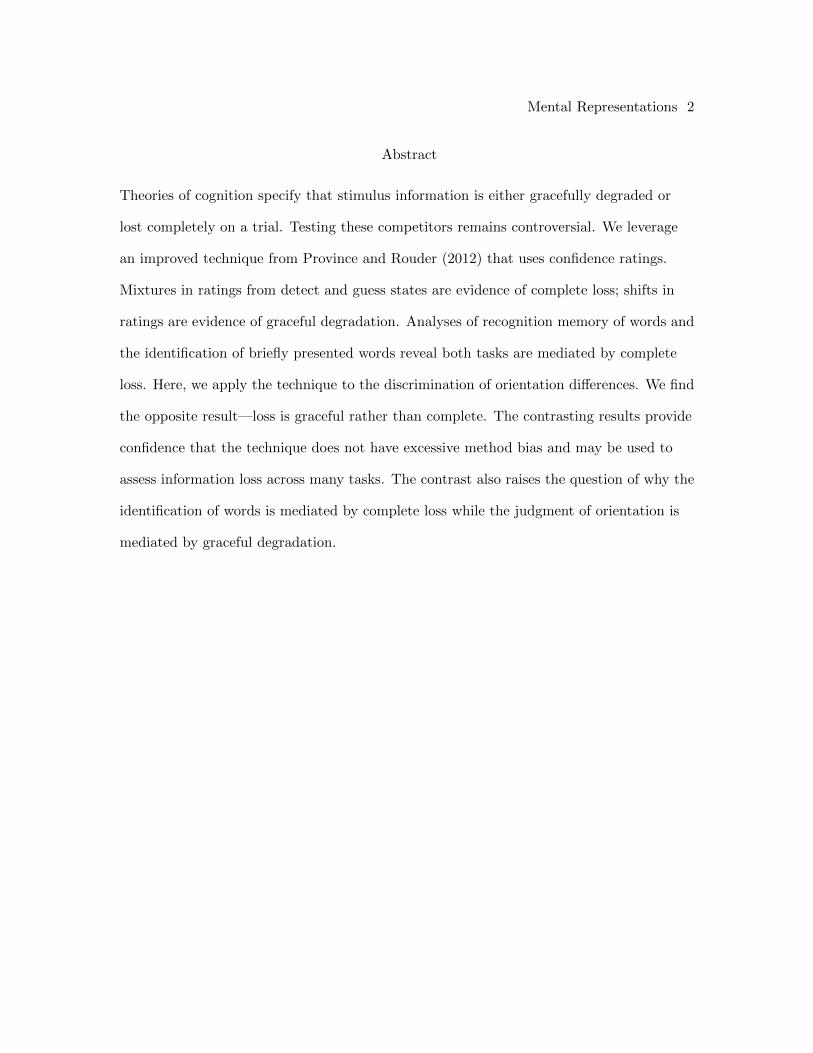
Abstract
Theories of cognition specify that stimulus information is either gracefully degraded or
lost completely on a trial. Testing these competitors remains controversial. We leverage
an improved technique from Province and Rouder (2012) that uses confidence ratings.
Mixtures in ratings from detect and guess states are evidence of complete loss; shifts in
ratings are evidence of graceful degradation. Analyses of recognition memory of words and
the identification of briefly presented words reveal both tasks are mediated by complete
loss. Here, we apply the technique to the discrimination of orientation differences. We find
the opposite result—loss is graceful rather than complete. The contrasting results provide
confidence that the technique does not have excessive method bias and may be used to
assess information loss across many tasks. The contrast also raises the question of why the
identification of words is mediated by complete loss while the judgment of orientation is
mediated by graceful degradation.
Mental Representations 3
The Nature of Information Loss Across a Range of Tasks
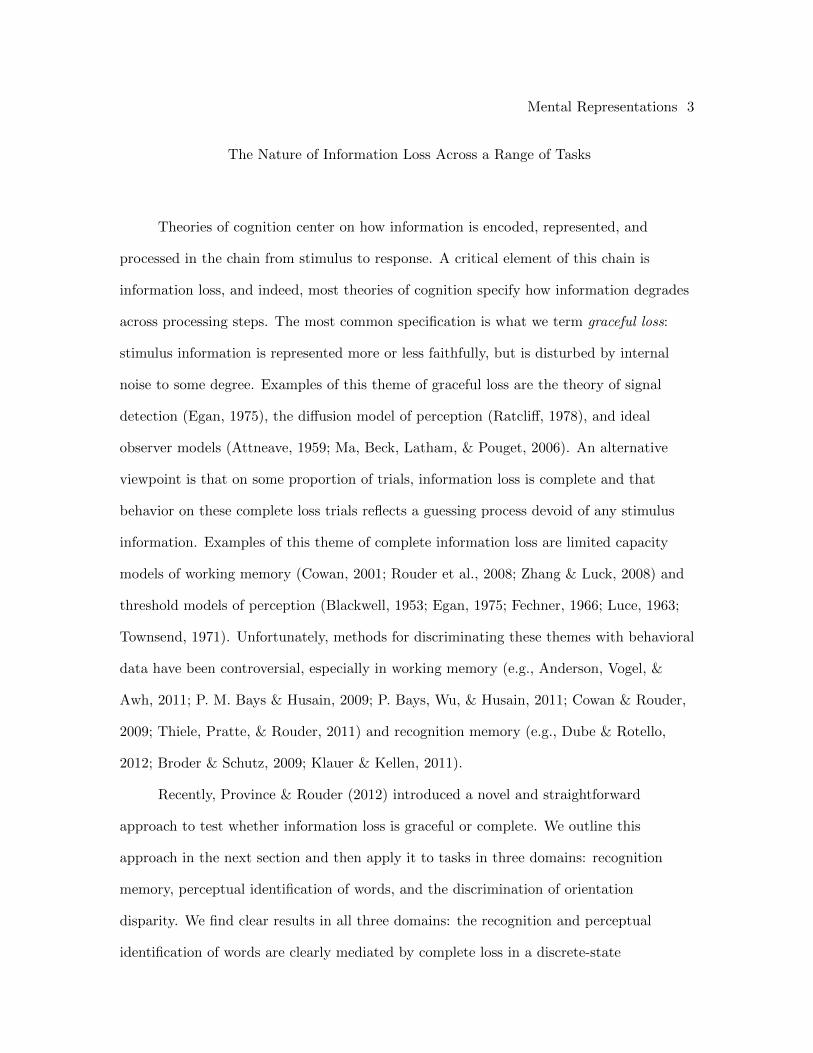
Theories of cognition center on how information is encoded, represented, and
processed in the chain from stimulus to response. A critical element of this chain is
information loss, and indeed, most theories of cognition specify how information degrades
across processing steps. The most common specification is what we term graceful loss:
stimulus information is represented more or less faithfully, but is disturbed by internal
noise to some degree. Examples of this theme of graceful loss are the theory of signal
detection (Egan, 1975), the diffusion model of perception (Ratcliff, 1978), and ideal
observer models (Attneave, 1959; Ma, Beck, Latham, & Pouget, 2006). An alternative
viewpoint is that on some proportion of trials, information loss is complete and that
behavior on these complete loss trials reflects a guessing process devoid of any stimulus
information. Examples of this theme of complete information loss are limited capacity
models of working memory (Cowan, 2001; Rouder et al., 2008; Zhang & Luck, 2008) and
threshold models of perception (Blackwell, 1953; Egan, 1975; Fechner, 1966; Luce, 1963;
Townsend, 1971). Unfortunately, methods for discriminating these themes with behavioral
data have been controversial, especially in working memory (e.g., Anderson, Vogel, &
Awh, 2011; P. M. Bays & Husain, 2009; P. Bays, Wu, & Husain, 2011; Cowan & Rouder,
2009; Thiele, Pratte, & Rouder, 2011) and recognition memory (e.g., Dube & Rotello,
2012; Broder & Schutz, 2009; Klauer & Kellen, 2011).
Recently, Province & Rouder (2012) introduced a novel and straightforward
approach to test whether information loss is graceful or complete. We outline this
approach in the next section and then apply it to tasks in three domains: recognition
memory, perceptual identification of words, and the discrimination of orientation
disparity. We find clear results in all three domains: the recognition and perceptual
identification of words are clearly mediated by complete loss in a discrete-state
Mental Representations 4
architecture. In contrast, the discrimination of orientation disparity is mediated by
graceful loss as described by the theory of signal detection. The presence of these
opposing results has three ramifications: First, they show it is possible to discriminate
between these theories of loss. Second, they demonstrate that the type of loss is task and
stimulus dependent. Third, they motivate the question of what overarching principles may
determine which domains are characterized by complete loss and graceful loss. We
speculate here that words are subject to complete loss because they are inherently
categorical in nature while orientation disparities are not.
Complete Information Loss Predictions
Province & Rouder (2012) introduced a test of discrete-state models of complete
information loss. The test is most easily explained in the context of an example, and we
discuss it here in the context of a recognition memory task. In our task, participants first
study a list of words. Then, at test, they are presented both a studied word and a novel
word, one on the left and the other on the right. Participants place a slider somewhere
between the two words to indicate simultaneously which is old and how confident they are
in the judgment. Stimulus strength is also manipulated, and in the recognition memory
task, some words are repeated once at study, and others are repeated four times at study.
Additionally, on a small minority of trials participants are presented two new words at
test so that the behavior under guessing may be localized should participants guess. We
refer to these perhaps euphemistically as zero-repetition trials as the target word was
studied no times.
Figure 1A-F shows predictions for a discrete-state model in this paradigm. Let’s
suppose a participant has previously studied the word STATUE and at test is presented
STATUE, the target, and MIRROR, the lure. The top row, Panels A & B, show
respectively hypothetical confidence-rating distributions when the participant is guessing
Mental Representations 5
and when the participant has correctly detected that STATUE rather than MIRROR was
studied. The hypothetical confidence ratings under guessing are centered to show a lack of
overall bias toward the target or lure (Figure 1A). This pattern differs from the
hypothetical confidence ratings under detection (Figure 1B), which are shifted toward the
target item. In the discrete-state model, observed responses are trial-by-trial mixtures of
detect and guessing states. For the zero-repetition trials, where two new items are shown,
participants must guess, and the observed responses reflect solely the guessing state
(Figure 1C). For one repetition of the studied item, there is a more balanced mixture, and
Figure 1D shows the case where half the responses are from guessing and the other half
are from detection. For four repetitions of the studied items, more responses are from
detection than guessing (Figure 1E).
The key characteristic of these predictions is that while repetition at study certainly
affects the probability of entering either a guess or detect state, the guess and detect
components of the observed mixture distributions remain stable across repetition
conditions. This key characteristic is termed conditional independence: conditional on a
mental state, the probability distribution over responses is independent of the number of
repetitions, or more generally, of the stimulus strength manipulation. Conditional
independence imposes clear and testable constraints on the distributions of confidence
ratings. Figure 1F shows these constraints—all three distributions from the previous
mixtures are represented here in a single plot to aid comparison. The confidence ratings
for the zero-repetition and the four-repetition conditions are presented in the usual
orientation; the confidence rating distribution for the one-repetition condition is projected
downward to reduce clutter. The conditional independence property guarantees that the
global gestalt will be a lining up of components, much like looking at two mountain peaks
reflected in a lake. The predictions of the discrete-state model of complete loss may be
contrasted to a signal-detection model of graceful loss. Figure 1G shows the predictions of
Mental Representations 6
this competitor. The distributions shift toward the target response with increasing
repetitions, or more generally, with increasing strength. The global gestalt violates this
vertical symmetry. Because the contrast between these two predictions is visually salient,
we present confidence ratings across strength conditions in the format of Figures 1F and
1G, with distributions from extreme conditions projected upward and those from
intermediate conditions projected downward.
Figure 1 show the case where the target is on the right. If the target is on the left,
the predictions follow a mirror symmetry where the detection component is on the left
under complete loss (cf., Figure 1F) and shifts leftward with increasing strength under
graceful loss (cf., Figure 1G). We will present all data as if the target is on the right, and
when the target is on the left, we will reverse the confidence ratings such that Figures 1F
and 1G describe the differential predictions.
Results from Word Recognition and Word Identification
Province and Rouder (2012) collected confidence ratings across repetition conditions
in the recognition memory task just described and found that participants by-and-large
obeyed the complete information loss predictions. Figure 2A shows patterns from two
selected participants. The patterns here are most like those in Figure 1F in that the
components line up and the mixture is obvious. To quantify the evidence across all
participants, Province and Rouder (2012) fit typical discrete-state and signal-detection
models to individuals’ uncollapsed data. Each model had the same number of parameters,
and consequently difference in fit is an appropriate model comparison statistic. This
statistic is shown in Figure 3. Here, 75 of 89 participants (84%) were better fit by the
discrete-state model than by the signal detection alternative. Hence, Province and Rouder
(2012) provide strong support for the complete information loss account in recognition
memory.

Mental Representations 7
Swagman et al. (submitted) employed the above methodology to assess whether
perceptual identification of briefly-presented-and-subsequently-masked words, a perceptual
task, was better accounted for by complete or graceful loss. In their experiment, words
were presented at three brief durations or not at all, analogous to the repetition conditions
of Province & Rouder (2012). In one of Swagman et al.’s tasks, participants responded in
the two-alternative paradigm with confidence ratings analogous to those in Province and
Rouder, and the data from this condition are germane here. Figure 2B shows the
confidence-rating histograms for two representative participants, and these patterns
support the discrete-state model of complete loss much like those from Province and
Rouder. The results of these two participants are typical, and Figure 3 shows
model-comparison results across two experiments that encompass 50 participants. As can
be seen, the discrete-state model fit better for 45 of the 50 participants (90%).
Orientation Discrimination
In this paper, we employ the same methodology to the identification of low-level
perceptual information, namely orientation disparity. Orientation disparity is a critical
domain because the physiological underpinnings are relatively well understood.
Orientation is mediated by cells in the primary visual cortex that are differentially tuned
to varying degrees of orientations for salient segments in the visual field. The perception
of the orientation of these segments reflects the summed activation of these tuned cells
(Hubel & Wiesel, 1962; Ringach, Hawken, & Shapley, 1997; Ben-Yishai, Bar-Or, &
Sompolinsky, 1995), and overall performance is modeled as reflecting small errors in firing
rates, which is an instantiation of graceful loss. Hence, if responses reflect these neural
dynamics, confidence ratings should be better described by graceful loss as exemplified by
Figure 1G than by complete loss as exemplified by Figure 1F.
To test these competing accounts, participants in Experiments 1 and 2 were
Mental Representations 8
presented with Gabor patches that had slight tilts from vertical. Participants indicated
their relative confidence by moving a slider anchored by “Sure Left,” indicating they
believe surely the tilt at the top of the Gabor was leftward, and “Sure Right,” indicating
they believe surely the tilt at the top was rightward. The magnitude of the tilt angle is
analogous to repetition in Province and Rouder (2012). The analog of the zero-repetition
condition was the presentation of a Gabor at the exact vertical orientation, and for this
stimulus we assume participants always enter a guessing state. With these analogs to the
previous experiments, the data may be analyzed as before.
Experiment 1
Method
Participants. Thirty students in an introductory psychology course at the
University of Missouri served as participants in exchange for course credit.
Stimuli. Stimuli were the supposition of Gabor patches and pixelated noise (see
Figure 4). The Gabor patches were 400×400 pixel arrays comprised of 2-D sinusoidal
gratings with a wavelength of 50 pixels oriented at ±0.23◦, ±0.46◦, and ±1.37◦ from
vertical. These gratings were attenuated by a 2-D Gaussian envelope which had full width
at half maximum dispersion of 100 pixels in each direction from center. The pixelated
noise was generated on each trial by sampling a 400×400 array of independent,
zero-centered normal random variables with standard deviation equal to 1/4 the
peak-to-peak amplitude of the gratings. These stimuli were displayed at center on a
1440×900 resolution monitor which had a height and width of 23 and 37 centimeters,
respectively, and was placed approximately 50 centimeters away from participants.
Design. The experiment was a 2×4 within-subject factorial design with magnitude
(4 levels) and direction of tilt (left/right) serving as factors. There were 55 trials for each
Mental Representations 9
non-vertical tilt magnitude-by-direction combination and 30 trials for the exact vertical
orientation. The order of these trials was randomized across the session. Each participant
performed a total of 360 trials which were evenly divided into 6 blocks of 60 trials.
Procedure. The experiment was run on Mac OS-X computers with the display
controlled by the Psychophysical Toolbox (Kleiner, Brainard, & Pelli, 2007) running under
Octave. Each trial began with the presentation of a 1-second centered fixation cross. This
cross was followed by a display of pixelated noise for an additional second. The Gabor
patch was then superimposed onto this noise and remained visible until a
confidence-ratings judgment was made, which ended the trial. The time between
subsequent trials was 500 milliseconds. Responses were made by sliding a mouse cursor
across a horizontal rating scale with anchors labeled by “sure left” and “sure right”
designations. Participants rated their confidence by wagering points in the following
manner: For each position x on the rating scale (−1 ≤ x ≤ +1), subjects would gain
100|x| for correct responses and lose 100|x|+ 400|x|5 for incorrect responses. This point
structure was first used in Province & Rouder (2012). At the end of each trial, the gained
or lost points were displayed, and this display served as feedback.
Results
Confidence-ratings histograms for two representative participants are shown in
Figure 2C. As before, we display the histograms as if the correct answer is on the right
side, and for leftward tilted gratings we reversed the confidence ratings around zero before
collapsing. The blue histograms are data from the vertical Gabor display trials, the red
histograms are data from the easiest 1.37 degree trials, and the purple histograms,
projected downward, are combined data from the harder 0.46 and 0.23 degree trials. The
data patterns are in stark contrast to those from select participants in word recognition
and identification shown in Figure 2A and B. For this experiment, the components of the
Mental Representations 10
histograms from the intermediate condition do not line up with those from the other
conditions. Instead, we see a gradual shift in confidence ratings from one condition to the
next. This gradual shift is not only disconfirmatory of complete loss, it is supportive of
graceful loss.
To quantify the evidence across all participants, we fit the ten-parameter
discrete-state and signal-detection models presented in Province and Rouder (2012) and in
the supplement of Swagman et al. (submitted). These models were fit to all 30
participants by maximizing likelihood, and maximum values were confirmed by use of
multiple random starting points. Deviance comparisons for each participant in
Experiment 1 is plotted in Figure 3. The signal-detection model was preferred for 25 of 30
participants (83%). Such a result is a dramatic reversal of those from our prior work in
the recognition and identification of words.
Experiment 2
Experiment 1 provides a rich contrast to our previous work. One of the potential
issues in Experiment 1, however, is that participants may not have been using the
confidence-ratings scale as intended. It is plausible that instead of reporting confidence,
they were reporting the perceived orientation of the grating. Clearly, if they were using
the confidence scale in this manner, then the graded results are easily explained as
noise-prone orientation disparity estimates. We think that misuse of the scale is plausible
in this task because both the ratings scale and the stimuli use the same salient horizontal
dimension. In fact, in our experience it is easy and natural to see this correspondence
when performing the task as a participant.
To help mitigate the possibility that the confidence scale was used as a disparity
scale, we placed the confidence-ratings scale in a vertical rather than horizontal
configuration, and the anchor “Sure Left” was placed below the anchor “Sure Right.”
Mental Representations 11
Figure 4B shows the display. In our experience as participants, it is far less natural to use
this scale for disparity and doing so requires attention and effort. Therefore, we expect
that if there is a misuse of the scale for disparity, this misuse will be less probable. If the
graceful loss result in Experiment 1 reflects a misuse of the confidence-rating scale, then
the support for graceful loss will be less in Experiment 2. In fact, as is discussed below, we
find strong support for the signal-detection model of graceful loss even with the vertical
confidence-ratings scale, indicating to us that the graceful-loss finding is robust and not
likely due to a misuse of the scale.
The method for Experiment 2 was identical to Experiment 1 in all regards except
that the vertical confidence-ratings scale was used instead of the horizontal
confidence-ratings scale, and that a new set of twenty-four University of Missouri students
served as participants.
Figure 2D shows confidence-ratings histograms for two select participants, and these
patterns are largely the same as those from Experiment 1. They contradict the
discrete-state model of complete loss and support the signal-detection model of graceful
loss. Model fittings across all 24 participants (see Figure 3) are also largely the same as
before, again supporting graceful loss. The concordance of these results with those in
Experiment 1 indicate that the graceful loss result is likely not due to a misuse of the
confidence-ratings scale. Taken together, the results from the two experiments provide
clear and convincing evidence that these orientation disparity judgments are not mediated
by complete loss but by graceful loss.
General Discussion
The current results obtained here, that the discrimination of near-vertical
orientation disparities are mediated by graceful loss, while anticipated by most perceptual
decision-making approaches, stands in sharp contrast with our prior results on the

Mental Representations 12
perceptual identification and mnemonic recognition of words. This contrast affords a few
noteworthy conclusions: First, the method we promote based on the comparison of
confidence ratings distributions across strength conditions does not appear to have
excessive bias. The contrast shows that both signal-detection and discrete-state
conclusions may be reached depending on the data. Second, the lack of obvious method
bias strengthens our previous claims that word identification and word recognition are
mediated by discrete states with complete loss. The current data, especially the patterns
exhibited by the four selected participants in Figure 2, provide a salient graphical view of
graceful loss. None of our participants in our word identification and in our word
recognition tasks have data patterns that resemble graceful loss. Hence, the contrast
strengthens our prior claims about discrete states in these domains.
The current results in conjunction with the prior results motivate a new question:
Why is it that word recognition and identification are mediated by complete loss while
orientation disparity discrimination is mediated by graceful loss? There are a number of
procedural differences between the orientation experiments reported here and the prior
experiments. We speculate, however, that the main difference is the nature of the stimuli
themselves. Words are inherently categorical and likely have fairly discrete representation
while the orientation of lines is inherently continuous and likely corresponds to a
continuously varying representation. We suspect this difference rather than any particular
procedural difference is most salient in accounting for the disparate loss results.
Mental Representations 13
References
Anderson, D., Vogel, E., & Awh, E.(2011). Precision in visual working memory reaches a
stable plateau when individual item limits are exceeded. Journal of Neuroscience, 31,
1128-1138.
Attneave, F.(1959). Applications of information theory to psychology A summary of basic
concepts, methods, and results. New York: Holt, Rinehart and Winston.
Bays, P., Wu, E., & Husain, M.(2011). Storage and binding of object features in visual
working memory. Neuropsychologia, 49, 1622-1631.
Bays, P. M., & Husain, M.(2009). Response to Comment on “Dynamic shifts of limited
working memory resources in human vision”. Science, 323 (5916), 877.
Ben-Yishai, R., Bar-Or, R. L., & Sompolinsky, H.(1995). Theory of orientation tuning in
visual cortex. Proceedings of the National Academy of Sciences, 92 (9), 3844-3848.
Blackwell, H. R.(1953). Psychological thresholds: Experimental studies of methods of
measurement. Bulletin of the Engineering Research Institute of the University of
Michigan, No. 36.
Broder, A., & Schutz, J.(2009). Recognition ROCs are curvilinear - or are they? On
premature arguments against the two-high-threshold model of recognition. Journal of
Experimental Psychology: Learning, Memory, and Cognition, 35 (3), 587-606.
Cowan, N.(2001). The magical number 4 in short-term memory: A reconsideration of
mental storage capacity. Behavioral and Brain Sciences, 24, 87-114.
Cowan, N., & Rouder, J. N.(2009). Comment on ”Dynamic shifts of limited working
memory resources in human vision”. Science, 323 (5916), 877.
Mental Representations 14
Dube, C., & Rotello, C. M.(2012). Binary ROCs in perception and recognition memory
are curved. Journal of Experimental Psychology: Learning, Memory, and Cognition, 38,
130-151.
Egan, J. P.(1975). Signal detection theory and ROC analysis. New York: Academic Press.
Fechner, G. T.(1966). Elements of psychophysics. New York: Holt, Rinehart and Winston.
Hubel, D. H., & Wiesel, T. N.(1962). Receptive fields, binocular interaction and functional
architecture in the cat’s visual cortex. Journal of Physiology, 160 (1), 106-154.
Klauer, K., & Kellen, D.(2011). The flexibility of models of recognition memory: An
analysis by the minimum-description length principle. Journal of Mathematical
Psychology, 55 (6), 430-450.
Kleiner, M., Brainard, D., & Pelli, D.(2007). What’s new in Psychtoolbox-3? Perception,
36. (ECVP Abstract Supplement)
Luce, R. D.(1963). A threshold theory for simple detection experiments. Psychological
Review, 70, 61-79.
Ma, W., Beck, J., Latham, P., & Pouget, A.(2006). Bayesian inference with probabilistic
population codes. Nature Neuroscience, 9 (11), 1432-1438.
Province, J. M., & Rouder, J. N.(2012). Evidence for discrete-state processing in
recognition memory. Proceedings of the National Academy of Sciences.
Ratcliff, R.(1978). A theory of memory retrieval. Psychological Review, 85, 59-108.
Ringach, D., Hawken, M., & Shapley, R.(1997). Dynamics of orientation tuning in
macaque primary visual cortex. Nature, 387, 281-284.

Mental Representations 15
Rouder, J. N., Morey, R. D., Cowan, N., Zwilling, C. E., Morey, C. C., & Pratte, M. S.
(2008). An assessment of fixed-capacity models of visual working memory. Proceedings
of the National Academy of Sciences, 105, 5976-5979.
Swagman, A., Province, J., & Rouder, J.(n.d.). Evidence for discrete-state processing in
perceptual word identification.
Thiele, J., Pratte, M., & Rouder, J.(2011). On perfect working-memory performance with
large numbers of items. Psychonomic Bulletin & Review, 18 (5), 958-963.
Townsend, J. T.(1971). Alphabetic confusion: A test for models of individuals. Perception
& Psychophysics, 9, 449-454.
Zhang, W., & Luck, S. J.(2008). Discrete fixed-resolution representations in visual
working memory. Nature, 453, 233-235.

Mental Representations 16
Figure Captions
Figure 1. Predictions for a discrete-state model of complete information loss in a
two-alternative recognition memory paradigm. The top row shows hypothetical
distributions conditional on mental states. The middle row shows mixtures of these states
for the strength conditions. The bottom row shows the differential predictions of the
discrete-state model and a signal-detection alternative. A. Hypothetical distributions of
confidence ratings conditional on guessing. B. Hypothetical distributions of confidence
ratings conditional on detection. C.-E. Discrete-state predictions for the distribution of
confidence ratings for the zero, one, and four repetition conditions, respectively. F. A
discrete-state model predicts that confidence ratings are a mixture of ratings from detect
and guess states. Increases in study repetition increases the probability that a judgment is
from the detect state distribution. G. A latent-strength model predicts that as the
stimulus is repeated more often, the distribution of confidence ratings shifts towards high
confidence correct responses. Ratings for the zero-repetition and four-repetition condition
are shown upright; ratings for the one-repetition condition are projected downward to
reduce clutter.
Figure 2. Individual histograms of confidence ratings for selected participants across all
three tasks. A. Confidence ratings for two participants from Province and Rouder’s
(2012) recognition memory task. Blue, purple, and red histograms denote distributions
from zero-repetition, 1-repetition, and 4-repetition conditions, respectively. B. Confidence
ratings for two participants from Swagman et al.’s word identification task. Blue, purple,
and red histograms denote distributions from a no-time presentation, a quick-duration
presentation, and a slow-duration presentation, respectively. C-D. Confidence ratings for
two participants each in Experiments 1 and 2, respectively. Blue and red histograms
denote distributions for disparity magnitudes, measured from vertical, of 0◦ and 1.37◦,
Mental Representations 17
respectively. The purple histograms denote the combined distributions for disparity
magnitudes of 0.23◦ and 0.46◦. As can be seen, the patterns for word recognition and
word identification conform to the discrete-state predictions of Figure 1F while the
patterns for orientation disparity conform to the signal-detection predictions of Figure 1G.
Figure 3. Model comparison results across three recognition memory experiments from
Province & Rouder (2012); two word-identification experiments from Swagman, Province,
& Rouder (submitted); and the two orientation disparity tasks reported here. Each
observation is the result of a participant with 89, 50, and 54 participants contributing to
the recognition memory, word identification, and orientation disparity discrimination
tasks, respectively. Scores are differences in deviance values (badness of fit as indicated by
-2 times the log of likelihood evaluated at the maximum likelihood estimates); positive
scores indicate better fit for the discrete-state model of complete loss while negative values
indicate better fit for a signal-detection model of graceful loss.
Figure 4. Displays for Experiments 1 and 2. On each trial, the participant moves the slider
toward either the “Sure Left” or “Sure Right” anchor to make a response for the displayed
stimulus and the distance from the center of the scale indicates their confidence. As the
slider moves across the scale, the positive and negative numbers represent the amount of
points gained and lost for correct and incorrect responses, respectively. The number at the
top of the display indicates the current number of points up to the present trial. In both
Experiments 1 and 2, each participant started with 100 points on the first trial. A.
Display for Experiment 1 in which the confidence scale was displayed horizontally. B.
Display for Experiment 2 in which the confidence rating scale was displayed vertically.

Mental Representations, Figure 1
Guess State
SureMirror
SureStatue
A.Detect State
SureMirror
SureStatue
B.
0 Repetitions
SureMirror
SureStatue
C.1 Repetition
SureMirror
SureStatue
D.4 Repetitions
SureMirror
SureStatue
E.
Discrete−State PredictionF.
Latent−Strength PredictionG.

Mental Representations, Figure 2
A. Recognition Memory
B. Perceptual Identification
C. Orientation DisparityExperiment 1
D. Orientation DisparityExperiment 2

Mental Representations, Figure 3
−100
−50
0
50
Dev
ianc
e C
ompa
rison
Favo
rs S
igna
l−D
etec
tion
Favo
rs D
iscr
ete−
Sta
te
−100
−50
0
50
Recognition MemoryPerceptual IdentificationOrientation Disparity

Mental Representations, Figure 4


![8: Cognitive Capabilities: Mental …itm/688/Wk5 - Mental Models...8: Cognitive Capabilities: Mental Representations, Problem Solving, and Decision Making [Ritter] There are several](https://img.pdfslide.us/doc/110x75/5b854d3e7f8b9aea498e1feb/8-cognitive-capabilities-mental-itm688wk5-mental-models8-cognitive-capabilities.jpg)