Embed Size (px)
Citation preview

Men’s Ochre Day
Aboriginal men’s Sexual Health
Darwin 2017
A/Prof James Ward

• Acknowledgements
• Overview of Presentation
– Sexually transmissible infections (why do we worry)
– HIV (everything is different)
– Hepatitis C (everything has changed)
– Strategies for addressing STIs and keeping HIV out

STIs- why do we worry
• Chlamydia, gonorrhoea, syphilis ( bacteria or bugs)
• STIs happen despite best intentions
• Takes 2 to tango
• STIs including HIV often don’t have no signs or symptoms
• Mostly occur in young people (15-29 years)
• Regional and remote communities particularly affected
• STIs generally are easily tested and treated and yet we have a major burden of disease

STIs why do we worry
• Outcomes for most STIs- shame, stigma, if untreated for men- pain, epididymitis, proctitis, infertility
• For women- no good in pregnancy- loss of babies during pregnancy, infertility, deformities
• Link between STIs and HIV if you have an STI and HIV comes into play– increases chance of HIV being transmitted by 2-5 times

Leading incident conditions
Indigenous 10 – 24 years

Chlamydia and gonorrhoea by
remoteness
0
500
1000
1500
2000
2500
3000
Major cities Innerregional
Outerregional
Remote Veryremote
Area of residence
Chlamydia
0
500
1000
1500
2000
2500
3000
Major
cities
Inner
regional
Outer
regional
Remote Very
remote
Ra
te p
er
10
0 0
00
Aboriginal and Torres Strait Islander
Non-Indigenous
Gonorrhoea

Notification rates of gonorrhoea infection in 2014 by Aboriginal and Torres Strait Islander status1, sex and age group
Source: State/Territory health authorities
0
500
1000
1500
2000
2500
0-14 15-19 20-29 30-39 40-49 50-59 60+
Age
sp
eci
fic
rate
pe
r 1
00
00
0
Age group
Male Female
0
300
600
900
1200
1500
1800
2100
2400
2700
3000
0-14 15-19 20-29 30-39 40-49 50-59 60+
Age group
Aboriginal and Torres Strait Islander Non-Indigenous
1 Jurisdictions (NT, QLD, SA, TAS, VIC, ACT & WA) in which Aboriginal and Torres Strait Islander status was reported for more than 50% of diagnoses each year in the past 5 years

STRIVE STI co-infections in remote Aboriginal
communities: females
0
10
20
30
40
50
60
16-19 20-24 25-29 30-34 35+
Females
Po
sit
ivit
y (
%)
CT, % with NG NG, % with CT CT, % with TV NG, % with TV
Guy et al STI 2014

STRIVE: STI co-infections in remote Aboriginal
communities: males
0
10
20
30
40
50
60
16-19 20-24 25-29 30-34 35+
Males
Po
sit
ivit
y (
%)
CT, % with NG NG, % with CT CT, % with TV NG, % with TV
Guy et al STI 2014

Syphilis outbreak in northern Australia 2011-2015:
the epidemiology and public health response

Syphilis outbreak northern Australia by
jurisdiction

ACCESS to HEALTH SERVICES

STI testing
Clinical guidelines
1. Guidelines recommend annual testing of 15-29 year olds for STIs
2. Test for reinfection
3. Full STI screening after a positive diagnosis

SHIMMER: Health care attendance over 3
years, 4 regional AMS in NSW
32
19
28 29
40
52
0
10
20
30
40
50
60
females males
Pro
po
rtio
n
every year 2 of 3 years 1 of 3 years

Health care access NSW sites
0
1
2
3
4
5
6
7
8
9
15-19 20-24 15-19 20-24
Males Females
Aboriginal sexual and reproductive program, NSW
2010 2011 2012 2013
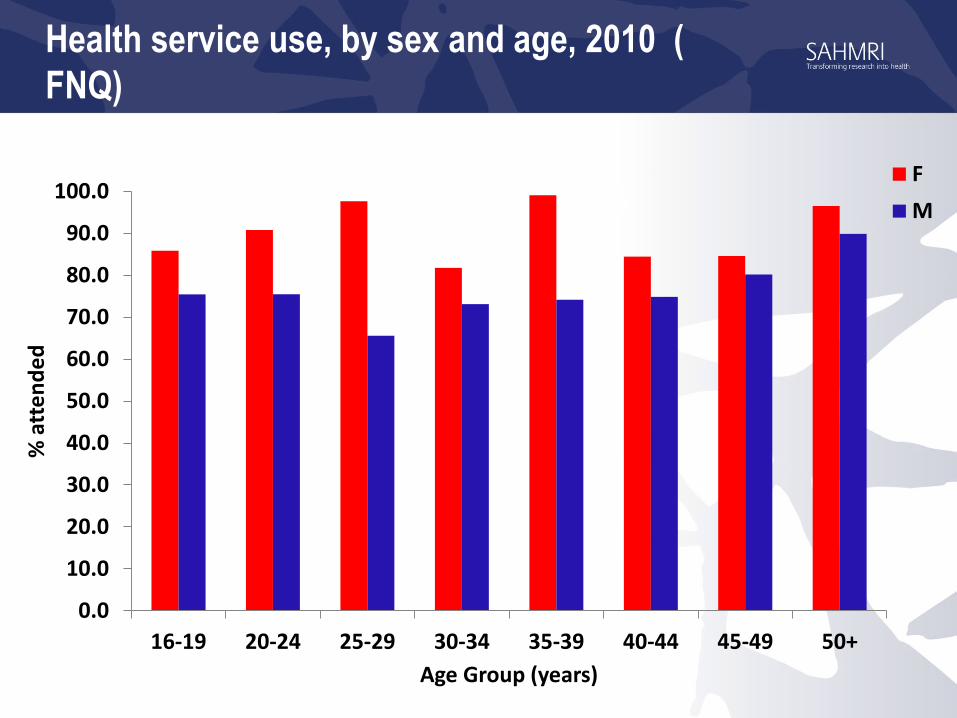
Health service use, by sex and age, 2010 (
FNQ)
0.0
10.0
20.0
30.0
40.0
50.0
60.0
70.0
80.0
90.0
100.0
16-19 20-24 25-29 30-34 35-39 40-44 45-49 50+
% a
tte
nd
ed
Age Group (years)
F
M

Total STI testing by calendar year
9,83010,660
12,73313,855
6,452
8,861
10,386 10,853
0
2,000
4,000
6,000
8,000
10,000
12,000
14,000
16,000
2010 2011 2012 2013
Nu
mb
er
of
test
s
Year
Chlamydia Gonorrhoea Trichomonas

Retesting at 2-12 months after a positive Dx
0.0
10.0
20.0
30.0
40.0
50.0
60.0
70.0
80.0
90.0
100.0
16-19 20-24 25-29 30+ 16-19 20-24 25-29 30+ 16-19 20-24 25-29 30+
Overall Males Females
Pro
po
rtio
n r
ete
ste
d
Age group (yrs) and sex
n=2054 1288 females 15% within recommended 2-4 month period
Garton et al 2016

Repeat positivity at 2-12 months, by infection type and sex
0.0
10.0
20.0
30.0
40.0
50.0
60.0
70.0
80.0
90.0
100.0
CT orNG
CT only NG only CT andNG
CT orNG
CT only NG only CT andNG
M F
Pro
po
rtio
n r
ete
sted
Infection type and sex
Garton et al 2016

STI and HIV/syphilis testing
Any +
STI test
HIV and syphilis testing within
30 days of any positive STI test
(incl. same day)
HIV and syphilis testing within 30
days of any positive STI test
(excl. same day)
N HIV test <30
days
n (%)
Syphilis test
<30 days n (%)
HIV test <30
days n (%)
Syphilis test <30
days n (%)
Overall15260 4,858 (32%) 6727 (44%) 854 (6%) 1099 (7%)
Sex
Male 4190 2035 (49%) 2355 (56%) 208 (5%) 209 (5%)
Female 11055 2815 (25%) 4361 (39%) 646 (6%) 889 (8%)
Ward et al MJA 2016

Barriers and facilitators of STI testing in remote Australian
Aboriginal communities
• Distance to laboratories
• Patient recall system management
• Gender
• At one stage there were only two female nurses for a few weeks [while the male nurse and health worker were away]. You’ll find that they’re [men] asking for the men and if they’re not here they’ll just leave. They’d rather go in pain for 2 weeks and wait for one of the boys to comeback (RN20, female, worked remotely <1 year).

• Health centre layout
• Living and working in small communities-trust, but also mistrust (non-disclosure)
• High staff turnover
• Strategies to overcome kinship and small community issues

Xpert® (Cepheid) Molecular POC Test
for CT & NG
Laptop
Xpert machine
Xpert cartridge
Single use test cartridge
Urine specimen
Swab specimen

One final thing- STIs and CSA
• STIs being related to sexual abuse? - T/F
• STIs in <16 yo is a sensitive issue
• From 2010 – 2014, a total of 3 428 and 6 670 cases of chlamydia were reported among Aboriginal and Torres Strait Islander and the non-Indigenous populations aged less than 16 years respectively.
• In the same period 1983 and 362 cases of gonorrhoea and 68 and 2 cases of infectious syphilis were reported in the Aboriginal and Torres Strait Islander and non-Indigenous populations aged less than 16 years respectively.

STIs and CSA
• Among Aboriginal and Torres Strait Islander population, the majority of these notifications (95% for chlamydia, 94% for gonorrhoea and 93% for infectious syphilis) were among people aged 13 to 15 years. Similar proportions among non Indigenous people
• The majority of diagnoses of STIs in the young Aboriginal and Torres Strait Islander population occurred in areas of known high endemicity of STIs, and where screening for STIs is routinely carried out.
• Caution should be taken in describing these data as related to child sexual assault; as it is likely that a significant proportion of these notifications are the result of early sexual debut and/or sex with peer-aged partners.

HIV Everything’s changed
• HIV rates are increasing
• They are being diagnosed in areas where we have never seen HIV before
• We have high rates of STIs- that make it easier for HIV to be transmitted
• However testing and treatment and prevention has changed
• HIV is still not curable
• However the medication has changed

0
10
20
30
40
50
60
70
80
Number of HIV diagnoses since 1992 by 2 year periods among Aboriginal & Torres Strait Islander People

HIV notification rate in the Australian-born population, 2006-
2015
3.1
6.8
0
1
2
3
4
5
6
7
8
2006 2007 2008 2009 2010 2011 2012 2013 2014 2015
Age
sta
nd
ard
ise
d r
ate
pe
r 1
00
00
0
YearAustralian born non-Indigenous Aboriginal and Torres Strait IslanderSource: State and Territory health authorities

Lessons from Canada
Aboriginal and First
Nations, Metis and Inuit
make up 4% of the
population
Where reported
Aboriginal peoples
make up ~20% of HIV
diagnosis


Saskatchewan- Canada
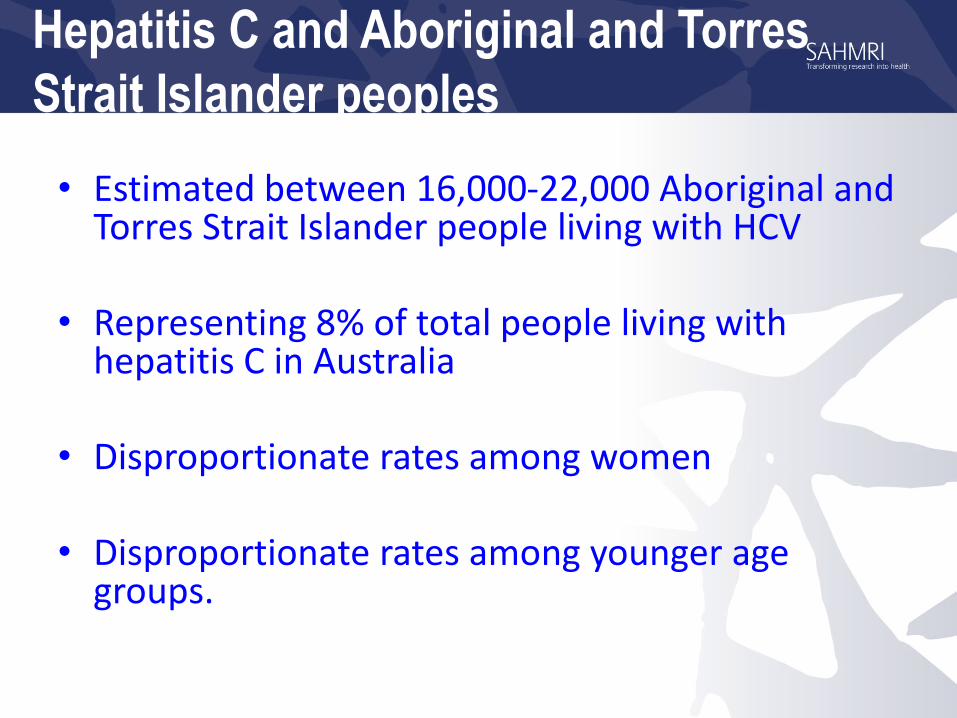
Hepatitis C and Aboriginal and Torres
Strait Islander peoples
• Estimated between 16,000-22,000 Aboriginal and Torres Strait Islander people living with HCV
• Representing 8% of total people living with hepatitis C in Australia
• Disproportionate rates among women
• Disproportionate rates among younger age groups.

Hepatitis C notification rate, 2011-2015, by Aboriginal & Torres
Strait Islander status
33
2011 2012 2013 2014 2015
Non-Indigenous 44.4 42.0 43.1 39.5 40.4
Aboriginal and Torres StraitIslander
115.3 128.5 139.2 158.0 164.9
0
20
40
60
80
100
120
140
160
180
Ag
e s
tan
da
rdis
ed
ra
te p
er
10
0 0
00
Year

Hepatitis C notification rate, 2011-2015, by age group
and Aboriginal and Torres Strait Islander status
34
2011 2012 2013 2014 2015
0-14 0.0 3.2 1.6 4.8 3.2
15-24 155.5 177.7 197.2 247.2 247.2
25-39 258.4 281.4 273.7 350.5 350.5
40+ 107.3 125.5 152.9 139.2 148.4
0
50
100
150
200
250
300
350
400
Rat
e p
er 1
00
00
0
Year
Aboriginal and Torres Strait Islander
2011 2012 2013 2014 2015
0-14 0.4 1.3 0.2 0.7 0.5
15-24 33.5 38.8 40.2 33.3 30.4
25-39 82.4 74.6 76.2 69.0 68.5
40+ 48.1 44.7 46.5 43.5 46.2
0
50
100
150
200
250
300
350
400
Rat
e p
er 1
00
00
0
Year
Non-Indigenous

Hepatitis C
• Mostly acquired in Australia through injecting drugs and in prison
• Treatment has changed in the last year
• Cure rates 90-95%
• 8-12 weeks couse
• Can be prescribed by GPs ( ACCHS)
• People living with disease can be free of HCV

Translating our work


youngdeadlyfree.org.au

www.atsihiv.org.au

Education-
Health literacyCommunity empowerment
NSPsOST
Detox/rehab
Adequate PHC –BBV testing treatment
Much more in the toolbox- combination
prevention
TasPART and
DAAsPEP and
PrEP
Drug reform

Key points
• Test test, test for STIs 16-24 but not at expense of none in 25-39 for CT, NG and TV
• Encourage young men and those who don’t come to clinic
• Be alert for syphilis
• HIV testing after a positive diagnosis
• HIV testing
• Alert for injecting drug use (IDU, meth, other)

• Finally STIS and BBVs absolutely need to be included in both local and national Aboriginal and Torres Strait Islander Mens Health Strategies.
• We cant rely solely on mainstream approaches to address this issue.

A/Prof James Ward Head Infectious Disease Research Aboriginal Health [email protected] 0881284270 0439605227