Embed Size (px)
Citation preview

Memory Selection
Guidelines for High
Performance Computing
with Dell™ PowerEdge™
11G Servers
A Dell Technical White Paper
By Garima Kochhar and Jacob Liberman
High Performance Computing Engineering
Dell Product Group
October 2009

2
THIS WHITE PAPER IS FOR INFORMATIONAL PURPOSES ONLY, AND MAY CONTAIN TYPOGRAPHICAL
ERRORS AND TECHNICAL INACCURACIES. THE CONTENT IS PROVIDED AS IS, WITHOUT EXPRESS OR
IMPLIED WARRANTIES OF ANY KIND.
© 2009 Dell Inc. All rights reserved. Reproduction of this material in any manner whatsoever without
the express written permission of Dell Inc. is strictly forbidden. For more information, contact Dell.
Dell, the DELL logo, EqualLogic, PowerEdge, PowerConnect, OpenManage and the DELL badge are
trademarks of Dell Inc.; Microsoft, Outlook, and Windows are either trademarks or registered
trademarks of Microsoft Corporation in the United States and/or other countries. Intel, Core, Xeon, and
Pentium are either registered trademarks or trademarks of Intel Corporation in the U.S. and other
countries; Red Hat and Enterprise Linux are registered trademarks of Red Hat, Inc. in the United States
and other countries.

3
Contents Executive Summary ....................................................................................................................................... 4
Introduction ................................................................................................................................................. 5
PowerEdge 11G Memory Overview ....................................................................................................... 5
Test Methodology .................................................................................................................................... 6
Performance Evaluation ............................................................................................................................. 7
Memory Type: UDIMMs versus RDIMMs............................................................................................... 8
Memory Frequency: 1066 versus 1333 ............................................................................................... 10
Memory Population: 1 DPC versus 2 DPC ........................................................................................... 13
Memory Population: Balanced versus Unbalanced ............................................................................ 15
Conclusion .................................................................................................................................................. 19
Appendix A – Summary of Key Findings ................................................................................................. 21
Appendix B – Test Cluster ......................................................................................................................... 22
Appendix C – Benchmark Descriptions ................................................................................................... 23

4
Executive Summary High Performance Computing Clusters (HPCCs) link together commodity servers with high-speed
networks in order to achieve supercomputer-like performance. Dell’s 11th Generation (11G) PowerEdge
servers are suitable building blocks for HPCC due to the excellent price for performance they can deliver.
However, architectural enhancements to the 11G memory subsystem can complicate cluster design.
This paper provides memory subsystem design recommendations for optimizing 11G servers as HPCC
nodes. These recommendations are based on the measured performance and power consumption of
clusters and individual servers running a suite of common High Performance Computing (HPC)
applications. Comparisons are made between memory controller frequencies, DIMM types, DIMM
frequencies, and DIMM population schemes. The measured results demonstrate that the theoretical
differences between memory subsystems do not translate directly into improved performance. Memory
subsystem design decisions must be based on measured application data rather than theoretical results
or synthetic benchmarks. The paper concludes with memory selection guidelines for optimizing
performance, energy efficiency, or value.

5
Introduction
High Performance Computing Clusters (HPCCs) link together commodity servers with high-speed
networks in order to achieve supercomputer-like performance. Dell’s 11th Generation (11G) PowerEdge
servers are suitable building blocks for HPCC due to the excellent price for performance they can deliver.
11G servers feature Double Data Rate-3 (DDR-3) SDRAM, Second Generation PCI-E expansion slots, and
Intel® Xeon® 5500 series processors1. Xeon 5500 series processors are based on the Nehalem-EP micro-
architecture, the latest revision of the Intel Xeon processor family. Nehalem-EP’s memory subsystem is
fundamentally different than those of its predecessors. With Nehalem-EP, Intel abandoned the Front
Side Bus architecture in favor of memory controllers integrated directly onto the processors. Nehalem-
EP also supports a broad range of memory configurations that include new DIMM types, additional
DIMM speeds, and several DIMM population schemes that can affect performance. This modular design
allows users to select memory subsystem components tailored to specific needs such as maximizing
performance, expandability, or energy efficiency. However, it also complicates server design for those
who are unsure how their choices will affect the systems.
This paper provides memory subsystem design recommendations for optimizing 11G servers as HPCC
nodes. The recommendations are based on the measured performance and power consumption of
clusters and individual servers running a suite of common High Performance Computing (HPC)
applications. Comparisons are made between memory controller frequencies, DIMM types, DIMM
frequencies, and DIMM population schemes. This paper begins with an overview of the Intel Nehalem
micro-architecture with a focus on the memory subsystem, then details the test methodology and
performance impact of the various memory options across typical HPC workloads and concludes with
memory selection guidelines derived from the performance results.
PowerEdge 11G Memory Overview Xeon 5500 series processors have DDR-3 memory controllers integrated directly on the processor chips.
DDR3 SDRAM2 is a random access memory technology used for high bandwidth storage. DDR3 supports
twice the bandwidth rate of its predecessor – DDR2 – without a latency increase. DDR3 also supports
higher capacities and lower power consumption than DDR2. Each Xeon 5500 processor socket has three
DDR3 SDRAM channels. 11G servers support two or three DIMMS per channel, depending on the server
model.
Accesses to the memory channel directly
connected to the processor are called “local”.
Access to the memory channels connected to
the other processor are called “remote”.
Remote accesses traverse a high-speed bus
between the sockets called the Quick Path
Interconnect (QPI) link. Local accesses are
faster than remote accesses, which makes
Nehalem-EP a Non-Uniform Memory Access
(NUMA) architecture. Figure 1 depicts the Nehalem-EP memory subsystem layout. On the Xeon 5500
Figure 1 – Nehalem-EP block diagram

6
series, the processor clock frequency determines the maximum bandwidth of the integrated memory
controller. The theoretical differences between local and remote memory bandwidths by processor type
are described in Table 13, 4.
Table 1 - Theoretical Memory Bandwidth
This table points out that remote memory
accesses are slower than local accesses on
NUMA architectures. HPC users should
enforce policies where processes only access
local memory whenever possible. For local
applications running in Linux, this can be done with the numactl utility. For distributed memory
applications, CPU and memory affinity can be enforced through MPI runtime parameters.
There are two situations where remote memory accesses are unavoidable. First, processes that require
more memory than what is available to a single processor. Second, processes that spawn more threads
than available cores within the local socket. CPU and memory affinity are not appropriate in either case.
11G servers have a BIOS feature called Node Interleaving that stripes data across both memory
controllers when enabled. Interleaved accesses are slower than local-only accesses because every other
operation traverses the QPI link. However, this feature prevents the worst case scenario where a
process is forced to access remote memory at every operation. Additional 11G BIOS features are
described in the Dell HPC engineering whitepaper entitled Optimal BIOS Settings for High Performance
Computing with PowerEdge 11G Servers5.
11G servers are not only based on a new micro-architecture, they also allow users to select new DIMM
types, speeds, and population schemes. 11G servers support two types of DDR3 SDRAM – Unbuffered
Dual Inline Memory Modules (UDIMMs) and Registered Dual Inline Memory Modules (RDIMMs) 3. Both
DIMM types will be discussed in greater detail in subsequent sections. RDIMMS and UDIMMs both
support DIMMs of varied capacities further complicating the choice. At the time of writing, the
maximum supported memory capacity per DIMM is 16GB for RDIMMs but only 2GB for UDIMMs. The
Xeon 5500 series memory controller operates at speeds of 800, 1066 or 1333 MHz depending on
processor model, DIMM speed, and DIMM population.
11G servers offer a modular memory sub-system design that encourages users to select components
tailored to their workloads. However, the additional choices afforded by the architecture can complicate
the server design process. Users who may be accustomed to selecting RAM solely based on capacity are
confronted with considerations that affect performance and energy efficiency. In the following sections,
this paper compares these choices and establishes recommendations for HPC workloads.
Test Methodology Intel Xeon 5500 based servers add an extra layer of complexity to the memory sub-system by providing
a variety of choices. This paper quantifies these choices in order to derive guidelines for maximizing
performance and energy efficiency in an HPC context. To do this, each memory configuration was
CPU GHz QPI Link Mem. Ctl. QPI BW
2.66 - 3.20 6.40 GT/s 31.99 GB/s 25.60 GB/s
2.26 - 2.53 5.86 GT/s 25.58 GB/s 23.44 GB/s
1.86 - 2.13 4.80 GT/s 19.20 GB/s 19.20 GB/s
7
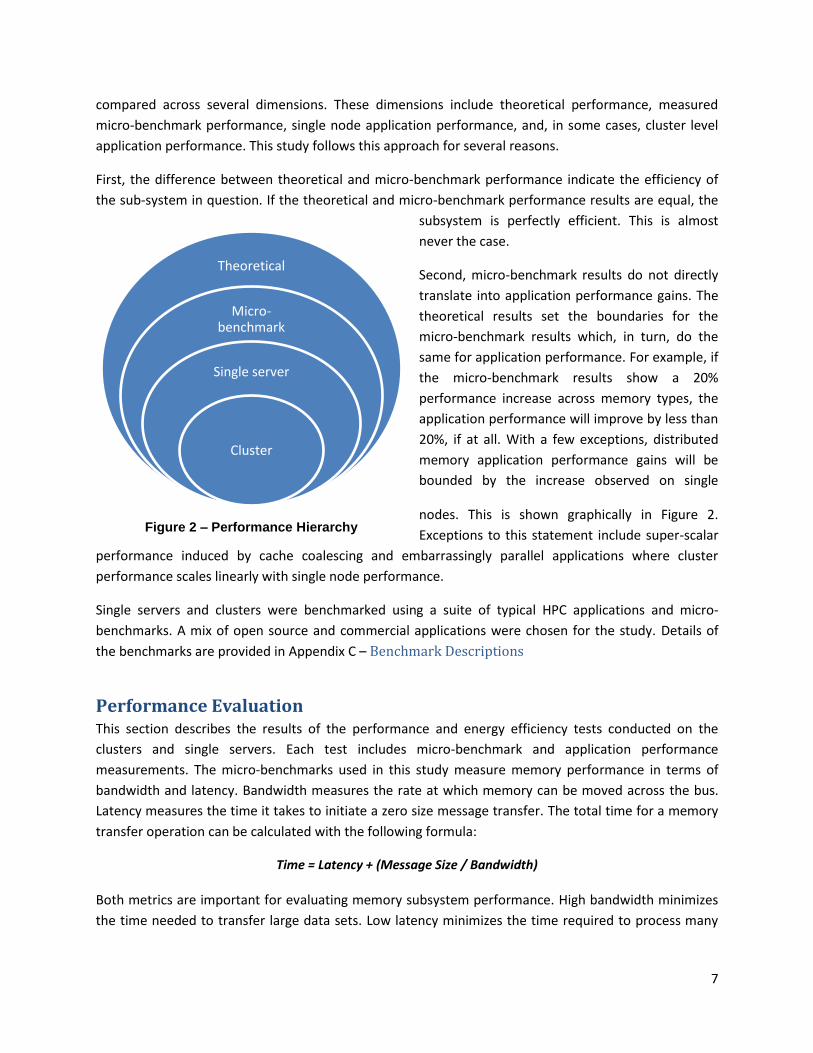
compared across several dimensions. These dimensions include theoretical performance, measured
micro-benchmark performance, single node application performance, and, in some cases, cluster level
application performance. This study follows this approach for several reasons.
First, the difference between theoretical and micro-benchmark performance indicate the efficiency of
the sub-system in question. If the theoretical and micro-benchmark performance results are equal, the
subsystem is perfectly efficient. This is almost
never the case.
Second, micro-benchmark results do not directly
translate into application performance gains. The
theoretical results set the boundaries for the
micro-benchmark results which, in turn, do the
same for application performance. For example, if
the micro-benchmark results show a 20%
performance increase across memory types, the
application performance will improve by less than
20%, if at all. With a few exceptions, distributed
memory application performance gains will be
bounded by the increase observed on single
nodes. This is shown graphically in Figure 2.
Exceptions to this statement include super-scalar
performance induced by cache coalescing and embarrassingly parallel applications where cluster
performance scales linearly with single node performance.
Single servers and clusters were benchmarked using a suite of typical HPC applications and micro-
benchmarks. A mix of open source and commercial applications were chosen for the study. Details of
the benchmarks are provided in Appendix C – Benchmark Descriptions
Performance Evaluation This section describes the results of the performance and energy efficiency tests conducted on the
clusters and single servers. Each test includes micro-benchmark and application performance
measurements. The micro-benchmarks used in this study measure memory performance in terms of
bandwidth and latency. Bandwidth measures the rate at which memory can be moved across the bus.
Latency measures the time it takes to initiate a zero size message transfer. The total time for a memory
transfer operation can be calculated with the following formula:
Time = Latency + (Message Size / Bandwidth)
Both metrics are important for evaluating memory subsystem performance. High bandwidth minimizes
the time needed to transfer large data sets. Low latency minimizes the time required to process many
Theoretical
Micro-benchmark
Single server
Cluster
Figure 2 – Performance Hierarchy
8
small transactions. Memory bandwidth and latency measurements are supplemented by processor
micro-benchmark results that measure the rate at which the system can solve floating point operations.
Application performance is measured across a range of HPC applications at both the single server and
cluster levels. In order to compare performance across applications, performance results are converted
to a ‘rating’ that specifies the number of times the application can be run per day. A lower run time
translates to a higher rating. Energy efficiency is measured as performance divided by power consumed.
All results were gathered in Dell’s HPCC engineering lab. The test cluster configuration is described in
Appendix B – Test Cluster. Specific configuration details for each benchmark are also noted where
appropriate.
The following sections examine the impact of the different DIMM types, DIMM frequencies and DIMM
population schemes on the performance of the system while taking power consumption into account as
well.
HPC workloads require balanced architectures where no individual subsystem dominates execution
time. These performance guidelines may be inappropriate for enterprise workloads such as databases or
mail servers.
Memory Type: UDIMMs versus RDIMMs 11G servers support two types of DDR3 SDRAM – Unbuffered Dual Inline Memory Modules (UDIMMs)
and Registered Dual Inline Memory Modules (RDIMMs) 3. 11G servers support UDIMMs and RDIMMs of
both 1333 and 1066 MHz frequencies. The primary differences between UDIMMs and RDIMMs are:
RDIMMs have a register used as a pass through for address and command signals. This allows
servers to support more RDIMMs per channel than UDIMMs.
RDIMMs consume more power than UDIMMs but are available in larger capacities and higher
ranks.
RDIMMs also provide additional data protection and reliability features.
At the time of writing, RDIMMs were available up to 16GB in capacity and quad-rank while UDIMMs
were available up to 2GB and dual rank. 11G servers support up to 2 UDIMMs per channel versus up to 3
RDIMMs per channel.
Figure 3 shows RDIMM performance relative to UDIMM performance on four single server HPCC
application benchmarks. Values higher than 1.0 indicate RDIMMs outperformed UDIMMs by that
amount.

9
Figure 3 – Single server RDIMM vs. UDIMM performance, PowerEdge R610, Dual Intel Xeon X5570, 6 * 4GB 1066MHz RDIMMs and UDIMMs
Figure 3 shows that the performance difference between UDIMMs and RDIMMs was within 4% across
all benchmarks. Benchmarks that are not bandwidth sensitive – such as HPL – performed within 1%
across DIMM types. Eclipse is a bandwidth sensitive benchmark, but it’s performance improved by only
2% across DIMM types. Ansys Mechanical V12cg-3, where UDIMMs were 4% faster than RDIMMs, is not
statistically significant as this improvement is within the variation between multiple runs of the same
job.
Table 2 compares server power consumption across these DIMM types during the benchmark tests.
RDIMMs consume 2.4W to 5.2W more per DIMM. UDIMMs are more energy efficient than RDIMMs by
4-10% on HPC applications.
Table 2 – RDIMM and UDIMM power consumption
Benchmark RDIMM power UDIMM power Power delta per DIMM
Ansys Mechanical - V12sp5 308.15 W 291.90 W 2.71 W
Eclipse - FOURMILL 319.34 W 287.89 W 5.24 W
HPL 322.58 W 308.15 W 2.41 W
Fluent – truck_poly_14m 319.41 W 294.72 W 4.11 W
0.90
0.92
0.94
0.96
0.98
1.00
1.02
1.04
V1
2cg
-3
V1
2sp
-1
V1
2sp
-2
V1
2sp
-3
V1
2sp
-4
V1
2sp
-5
edd
y_4
17
k
airc
raft
_2m
tru
ck_p
oly
_14
m
sed
an_4
m
ON
EM1
FOU
RM
ILL
Ansys Fluent Eclipse HPL
Rel
ativ
e p
erfo
rman
ce o
f R
DIM
M t
o U
DIM
MSingle server - RDIMM vs UDIMM

10
At 1 DIMM per channel and equal capacities, RDIMM and UDIMM performance is within 2% for most
HPC applications. On a cluster – where communication overhead and application scalability are the
largest bottlenecks – the performance difference would be smaller. RDIMMs also consumed between 4
and 10% more power than UDIMMs during the energy efficiency benchmarks. Therefore, for the same
memory capacity, UDIMMs are recommended for HPC clusters over RDIMMs due to the savings in
power. RDIMMs must be used when UDIMMs cannot meet the necessary memory capacity or when RAS
features are required. Data protection features such as mirroring entail significant performance
overhead and are not recommended for HPC customers.
Memory Frequency: 1066 versus 1333 11G servers support 1066 MHz and 1333 MHz DDR-3 SDRAM. The memory frequency, at which the
system operates, however, is determined by a minimization function of three factors:
1) DIMM frequency
2) Memory controller speed
3) Channel population scheme
System memory speed = MIN (Memory Controller speed, DIMM frequency, population)
First, the operating memory speed is dictated by the DIMM frequency. 1066 MHz DIMMs cannot run at
1333 MHz, but 1333 MHz and 1066 MHz can both run at lower frequencies. Different speed memory
DIMMs should not be mixed within the same server.
Memory controller speed is limited by the processor type. Xeon 5500 ‘X’ series processors run at a
maximum speed of 1333 MHz. ‘L’ and ‘E’ series processors run at either 1066 or 800 MHz depending on
the CPU clock frequency.
Finally, memory population rules dictate that 1 DIMM-Per-Channel (DPC) or 2 DPC can run at either
1066 or 1333 MHz, depending on server model and DIMM type6. Populating 3 DPC will force the
operating memory speed to 800 MHz. These factors are summarized in Table 3.
Table 3 – System Memory Speed
System Operating Speed Memory controller speed DIMM speed DIMM population
1333 MHz 1333 MHz 1333MHz 1 or 2 DPC
1066 MHz 1066 MHz 1066 or 1333 MHz 1 or 2 DPC
1333MHz 1066MHz 1 or 2 DPC
800 MHz 800 MHz 1066 or 1333 MHz 1, 2 or 3 DPC
1066 or 1333 MHz 1066 or 1333 MHz 3 DPC

11
For example, a PowerEdge R610 with six 1333 MHz DIMMs (1 DPC) and the E5540 processor will run at
1066 MHz because the processor memory controller frequency is limited to 1066 MHz. Upgrading to an
X5550 processor with a 1333 MHz memory controller will boost the operating memory frequency to
1333 MHz because all three requirements have been met.
The theoretical memory bandwidth for 1333 MHz memory is 25% faster than 1066 MHz memory. The
micro-benchmark performance difference between DIMM speeds is bounded by this amount. Table 4
shows the measured micro-benchmark performance differences between DIMM of different speeds on
a PowerEdge R410, with six 4GB RDIMMs and an X-series Xeon 5500 processor with a 1333 MHz
memory controller.
Table 4 – Micro-benchmark Performance - 1066MHz vs. 1333MHz
Benchmark 1333 MHz 1066 MHz Relative Performance
Stream - Triad 41286 GB/s 35676 GB/s 1.16
Lat_mem_rd 52.771 us 51.618 us 1.02
DGEMM 88.97 GFLOP/s 90.35 GFLOP/s 0.98
Table 4 shows a 16% memory bandwidth difference between 1333 and 1066 MHz DIMMs as measured
by Stream. The memory latency and floating point rate benchmarks show a performance difference of
only 1-2%. Therefore, although the theoretical memory bandwidth difference between the DIMM
speeds is 25%, single server and clustered applications should show no more than 16% performance
improvement with the faster DIMMs.
Figure 4 – Single node Performance - 1066MHz vs. 1333MHz, PowerEdge R610 with dual Intel Xeon X5550, six 2GB 1066 and 1333MHz UDIMMs
0.50
0.60
0.70
0.80
0.90
1.00
1.10
eddy_417k aircraft_2m sedan_4m V12cg-1 V12cg-2 V12cg-3 V12ln-1 V12sp-1 V12sp-2 ONEM1 FOURMILL
Fluent Ansys Eclipse HPL
Per
form
ance
of
13
33
MH
z re
lati
ve t
o 1
06
6M
Hz
(hig
her
is b
ette
r)
Single node - 1333MHz performance improvement over 1066MHz

12
Figure 4 shows the difference in application performance on a single PowerEdge R610 server. These
tests were run with six 2GB UDIMMs at 1333 MHz and 1066 MHz. The data shows that 1333 MHz
DIMMs perform better than 1066 MHz by up to 4% for all tests except Ansys V12cg-2 and HPL. For these
two tests, the performance difference between 1333 MHz and 1066 MHz was within a percentage point
and not statistically significant. As expected, memory bound applications including Eclipse benefit most
from the faster memory with performance gains of ~6%.
1333MHz DIMMs perform better than 1066 MHz but also consume more power. Figure 5 evaluates the
performance/power consumption tradeoff between DIMM speeds on a 16-node cluster. This figure
charts the power consumption and performance decline of using 1066 MHz memory instead of 1333
MHz memory in all the nodes. Power consumption values lower than 1.0 indicates that 1066 MHz
DIMMs consumed less power by the corresponding amount. For example, ECLIPSE-FOURMILL shows a
Power Consumption value of .92 which means the 1066 MHz DIMMs consumed 8% less power than the
1333 MHz DIMMs. Performance values lower than 1.0 indicates the amount performance decreased
with 1066MHz DIMMs.
Figure 5 also includes energy efficiency data denoted within the circles above the power and
performance values. Energy efficiency is derived by dividing the performance by the power consumed. It
is measured in units of performance/Watt. Higher values mean better energy efficiency. Improvements
can be due to decreased power usage, increased performance, or both.
Figure 5 – Cluster-level Performance - 1066MHz vs. 1333MHz, 16-node PowerEdge M610 cluster with dual Intel Xeon X5570, 6 * 4GB 1333 and 1066 MHz RDIMMs
This figure shows that 1066 MHz DIMMs were 2 to-4% slower than 1333 MHz DIMMs across the four
applications. 1066 MHz DIMMs consumed 6-9% less power than the 1333 MHz DIMMs. Because the
1.04 1.04 1.05 1.04
0.80
0.84
0.88
0.92
0.96
1.00
1.04
1.08
ECLIPSE - FOURMILL FLUENT -truck_poly_14m
LU - class D WRF - Conus 12kmPo
we
r, p
erf
. an
d e
ne
rgy
eff
icie
ncy
of
10
66
MH
z (r
ela
tive
to
13
33
MH
z)
Cluster power and performance - 1066MHz vs. 1333MHz
Power consumed Performance drop Energy Efficieny gains

13
power consumption reductions were greater than the performance losses, cluster level energy efficiency
increased by up to 5% with 1066 MHz DIMMs.
Although the theoretical and micro-benchmark performance differences between 1066 MHz and 1333
MHz DIMMs are sizeable, measured application performance differences were modest. Hence 1066
MHz DIMMs are recommended for all but the most memory intensive applications. This is particularly
true for large clusters where the energy efficiency advantage of 1066 MHz DIMMs is expected to grow.
Memory Population: 1 DPC versus 2 DPC Memory controller speed, DIMM frequency, and DIMM population combine to determine the operating
memory speed for 11G servers. There are instances where equal system capacity can be achieved by
populating 2 DPC or by using 1 DPC with double-capacity DIMMs. This section of the paper compares the
performance and energy efficiency of populating 1DPC versus 2DPC at equal capacity in balanced
configurations.
11G servers with the Xeon 5500 processors support three DDR-3 memory channels per processor
socket. A “balanced” memory configuration has all three memory channels identically populated. For
example, a dual-socket server with 6 identical DIMMs with 1DPC would be balanced. A server with 12
identical DIMMs and 2 DPC would also be balanced. Figure 6 depicts a balanced configuration with 1
DPC and Figure 7 depicts a balanced configuration with 2 DPC.
Figure 6 – Balanced Memory at 1DPC Figure 7 – Balanced Memory at 2DPC
With Xeon 5500 series processors, balanced configurations provide the best performance and this is
discussed further in the next section. All 1 DPC versus 2 DPC comparisons in this section are based on
balanced configurations. Table 5 compares 1 DPC versus 2 DPC micro-benchmark results. The results
were obtained on a PowerEdge R610, with dual Intel Xeon X5570, 1066 MHz RDIMM in six 4GB DIMM
(1DPC) and 12 2GB DIMM (2DPC) configurations. Micro-benchmark performance across both population
schemes are within 1%.
Table 5 – Micro-benchmark Performance – 1 DPC versus 2 DPC
Benchmark 1 DPC 2 DPC Perf Delta
Stream - Triad 34549 GB/s 34369 GB/s 1.01
Lat_mem_rd 51.618 us 51.272 us 1.01
DGEMM 90346.54 GFLOP/s 90317.71 GFLOP/s 1.00

14
Although performance remained constant between population schemes at 1066 MHz, populating 2 DPC
improves memory bandwidth at 1333 MHz. The difference is shown in Table 6.
Table 6 – Micro-benchmark memory bandwidth performance – 1 DPC versus 2 DPC @ 1333 MHz
Benchmark 1 DPC 2 DPC Perf Delta
Stream - Triad 41864 GB/s 43594 GB/s 1.04
At 1333 MHz, 2 DPC memory bandwidth improves by 4% over 1 DPC. As shown in Table 4 and Figure 5,
the 16% memory bandwidth improvement between 1066 and 1333 MHz DIMMs at 1 DPC helped cluster
application performance by only 4%. Therefore, it is unlikely that the additional 4% bandwidth provided
by 2 DPC at 1333 MHz will improve cluster level performance by more than an additional 1%. This
modest improvement will come at the cost of additional power consumption. For these reasons, the 1
DPC versus 2 DPC performance comparison focused on 1066 MHz DIMMs.
Figure 8 compares single server application benchmark results between 1 DPC and 2 DPC memory
configurations. Numbers higher than 1.0 mean 1 DPC outperformed 2 DPC by the corresponding
amount.
Figure 8 – Single server performance – 1 DIMM per channel vs. 2 DIMMs per channel, PowerEdge R610 with dual Intel Xeon X5570, 1066MHz RDIMMs, 6 * 4GB and 12 * 2GB
For the majority of the single server application benchmarks, the performance difference between 1
DPC and 2 DPC was within 1% up or down. Applications that showed differences greater than 1% across
population schemes were within the expected deviation across benchmark runs.
Table 7 shows the power consumption differences during single server benchmarks across the two
DIMM population schemes. 2 DPC consumed more power than 1 DPC across all four benchmarks.
ECLIPSE – the most memory bound application of the four – consumed nearly 5% more power at 2 DPC
than 1 DPC.
0.50
0.60
0.70
0.80
0.90
1.00
1.10
Ansys Fluent Eclipse HPL
1D
PC
per
form
ance
rel
ativ
e to
2D
PC
(hig
her
is
bet
ter)
Single server - 1DPC vs 2DPC
15
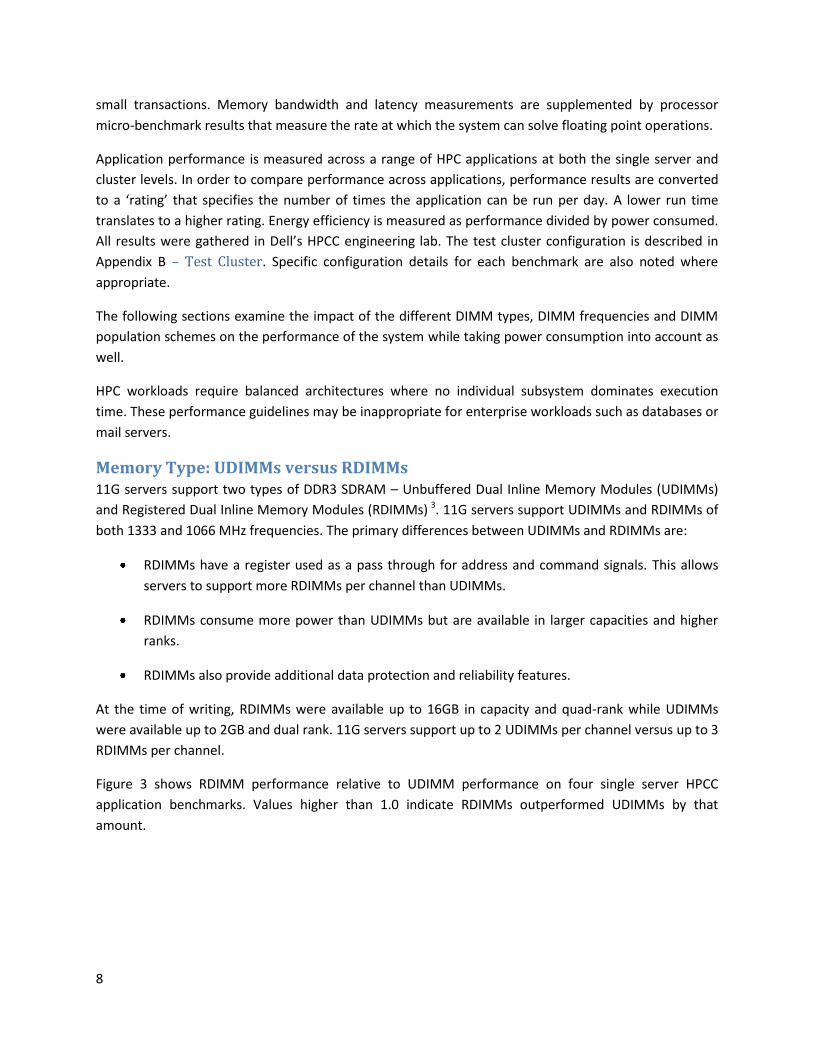
Table 7 – 1DPC and 2DPC power consumption
Benchmark 1 DPC power (W) 2 DPC power (W) Power delta
Ansys Mechanical - V12sp5 308.15 317.61 2.98%
ECLIPSE - FOURMILL 319.34 334.43 4.51%
HPL 322.58 333.50 3.27%
Fluent – truck_poly_14m 319.41 324.56 1.59%
The performance differences between 1 DPC and 2 DPC at 1066 MHz were slight across both the micro-
benchmarks and single server application benchmarks. From a performance standpoint, the population
schemes are identical. 1 DPC consumed less power than 2 DPC across all of the server benchmarks. 2
DPC consumed 5% more power for the most memory intensive benchmark. Therefore, 1 DPC is more
energy efficient than 2 DPC. 1 DPC also allows for future expansion. For these reasons, 1 DPC is the
recommended population scheme for HPC cluster nodes with 1066 MHz DIMMs.
Memory Population: Balanced versus Unbalanced As described in the previous section, a balanced memory configuration is one that has some multiple of
six identical DIMMs populated evenly across both processor sockets. For example, a dual-socket server
with 6 identical DIMMs, 1 DIMM per channel (DPC) using each of the three channels per socket would
be in a balanced configuration. Similarly, a server with 12 identical DIMMs at 2 DPC would also be in a
balanced configuration.
An unbalanced configuration is one where not all channels are populated, not populated similarly, or
populated similarly but with different capacity DIMMs. For example, a dual-socket server with 8 DIMMs,
4 DIMMs per socket would have 2 DIMMs in the first channel and 2 DIMMs each in the other two
channels and would be in an unbalanced configuration. With the Intel 5500 series, a balanced
configuration provides the best performance, because of the memory interleaving patterns.
Memory interleaving maximizes memory performance by allowing the memory controller to efficiently
load balance requests across memory channels. Memory interleaving organizes memory contents so
that adjacent sections are physically located on different memory channels. Interleaving helps
performance because DRAM needs to be “pre-charged.” If data is continually read from the same
channel, pre-charging will introduce periodic contention. Interleaving memory across channels hides the
pre-charging latency. Data is accessed from alternating channels, which allows pre-charging to occur
while the memory is not being accessed. Pre-charging latency decreases as the number of interleaved
channels grows. During power on, the server BIOS determines the optimal memory interleaving scheme
depending on how the memory is populated.
This section of the study compares performance and energy efficiency across the three memory
population schemes depicted in Figure 9. The left-most image depicts a processor socket populated with
1 DIMM per memory channel. This is a balanced configuration with one 3-way interleave. The middle
image shows a processor socket with an additional DIMM in the first memory channel. This unbalanced

16
configuration is configured with two 2-way interleaves. The right-most processor socket has an
unbalanced configuration with only two DIMMs configured in one 2-way interleave. In all three cases
the server BIOS interleaves memory in a manner that allows similar performance for all memory regions.
Figure 9 – Memory interleaving in balanced and unbalanced configurations
Figure 10 shows the micro-benchmark performance difference between the balanced and unbalanced
configurations depicted in Figure 9. Although Figure 9 depicts population schemes across single sockets,
both server sockets were identically populated during this study.
Figure 10 – Memory bandwidth and latency in balanced and unbalanced configurations, Single PowerEdge M610 with dual Intel Xeon E5540, 4GB 1066MHz RDIMMs
The 6-DIMM memory bandwidth was higher than the unbalanced configurations’ memory bandwidth by
22 to 29%. The latency was within 1% across all three population schemes. Although both unbalanced
configurations used two-way memory interleaving, the 4-DIMM bandwidth was 6% higher than the 8-
DIMM bandwidth. The results are not pictured, but DGEMM showed no performance difference across
DIMM population schemes, which is expected since DGEMM is floating point intensive and not memory
sensitive.
0
5000
10000
15000
20000
25000
30000
35000
stream - triad
Ban
dw
idth
(M
B/s
)
Memory Bandwidth
6-DIMMs 4-DIMMs 8-DIMMs
0
15
30
45
60
75
90
-10.0 -5.8 -4.5 -3.3 -2.1 -0.8 0.5 1.7 2.9 4.2 5.5 6.7
Late
ncy
(n
ano
seco
nd
s)
Log2(array size)
Memory latency
6-DIMMs 4-DIMMs 8-DIMMs

17
In fact, populating memory in a balanced configuration is more critical to performance than adding
faster speed DIMMs or more memory capacity. This is shown in Figure 11 where a balanced 6 DIMM
1066 MHz configuration is compared to a faster configuration that has 1333 MHz DIMMs and also more
memory capacity with 8 DIMMs. Four application benchmarks were run on a single server. Figure 11
shows the relative performance of the two configurations. A value higher than 1.0 indicates the
balanced configuration out-performed the faster unbalanced one by the corresponding amount. With
the Fluent benchmarks, the balanced configuration performed better by 3-10%. Eclipse is a memory
sensitive application and, in this case, the balanced configuration improved by almost 40% even with
25% less memory capacity and 20% slower DIMMs.
Figure 11 – Relative performance of 1066 balanced versus 1333 unbalanced, Single PowerEdge R610 with dual Intel Xeon X5550, 2GB UDIMMs in 6 1066MHz and 8 1333MHz DIMM configurations
Figure 12 plots the performance of the unbalanced configurations relative to the balanced configuration
across four cluster applications. Values higher than 1.0 indicate the unbalanced configuration
outperformed the balanced configuration by the corresponding amount. The circles above the bar graph
depict the unbalanced configurations’ energy efficiency relative to the balanced configuration. Energy
efficiency is calculated by dividing the application performance by average Watts consumed during the
application run. A value greater than 1.00 indicates that the unbalanced configuration was more energy
efficient than the balanced.
0.90
1.00
1.10
1.20
1.30
1.40
1.50
eddy_417k aircraft_2m sedan_4m ONEM1
Fluent Eclipse
Per
f. o
f 6
D 1
06
6 r
elat
ive
to 8
D 1
33
3
Balanced 1066 versus Unbalanced 1333

18
Figure 12 – Cluster level performance in balanced and unbalanced configurations, 16-node PowerEdge M610 cluster with dual Intel Xeon E5540 processors, 4GB 1333 MHz RDIMMs in 4, 6 and 8DIMM configurations
The memory bandwidth micro-benchmark results showed that balanced configurations outperform
unbalanced configurations by 22-29%. This result was confirmed by the application benchmark results.
Eclipse was the most memory bound application tested. Eclipse performance declined by 15 and 23%
when run on unbalanced nodes. The 8-DIMM configuration was almost 10% slower than the 4-DIMM
configuration. The three other cluster applications tested showed a 4-12% performance decline.
Therefore, from a performance standpoint, balanced configurations outperform unbalanced
configurations at the cluster level. The performance difference is not as great across clustered
applications as it is across the micro-benchmark results.
The energy efficiency of the unbalanced configurations also suffered. For 4-DIMM configurations the
energy efficiency declined despite the fact that 4 DIMMs consume less power than 6 DIMMs. The lower
power consumption of the 4 DIMM configurations did not offset the performance decline. Fluent was a
notable exception. Fluent performance decreased by less than 5% with the 4-DIMMs across unbalanced
configurations. The slight performance drop combined with lower power consumption to improve the
energy efficiency of the 4DIMM configuration by 5%. For Fluent, the 8-DIMM energy efficiency matched
the 6-DIMM energy efficiency because both the performance decline and power consumption increase
were small. The energy efficiency of the 8-DIMM configurations declined by 12-16% when running the
0.74
1.00
0.88 0.88
0.90
1.05
0.98
0.93
0.70
0.75
0.80
0.85
0.90
0.95
1.00
1.05
1.10
ECLIPSE - FOURMILL FLUENT - truck_poly_14m LU - class D WRF - Conus 12km
Per
f. a
nd
en
ergy
eff
. of
un
bal
ance
d (
rela
tive
to
bal
ance
d 6
dim
m c
on
fig)
Cluster-level DIMM population - balanced vs. unbalanced
8dimm - perf. 4dimm - perf. 8dimm - energy eff. 4dimm - energy eff

19
other three cluster applications due to the combined effects of the performance decrease and increased
power consumption.
Based on these results, a balanced configuration is recommended for general purpose HPC workloads.
Unbalanced configurations suffer in terms of performance and energy efficiency. The unbalanced 4-
DIMM configuration is a viable option for HPC workloads that are not memory sensitive because it can
reduce power consumption and lower acquisition cost. The 8-DIMM unbalanced configuration suffers in
terms of performance, energy efficiency, and acquisition cost.
Conclusion PowerEdge 11G servers feature a modular architecture that allows users to select components ideally
suited for their needs. However, users are often unsure of how these selections will impact their
application performance. The Dell HPC engineering team evaluated the performance and power
consumption of 11G servers running various HPC workloads across several memory configurations in
order to simplify the memory selection process. Based on the results of this study, the Dell HPC
engineering team recommends the following configurations for maximizing performance, maximizing
energy efficiency, and minimizing power consumption.
Cost and capacity are two additional considerations that have not been discussed in this paper. In
general, the minimum required capacity per core should be the starting point for memory selection. In
the past, the typical HPC customer required 2 GB of memory per core. For 11G servers, 3 GB per core
maximizes performance and energy efficiency because this requirement can be met by several balanced
configurations.
Cost is another primary concern for HPC customers. The cost of purchasing high speed, high capacity
DRAM in large quantities can offset a cluster’s favorable economy of scale. Furthermore, HPC customers
do not typically exploit the reliability features afforded by RDIMMs. In general, the decision to buy faster
DIMMs is justified if the percentage of performance improvement when executing the most frequently
used application exceeds the percentage of cost increase. In terms of capacity, buying the highest
capacity DIMMs within budget and using fewer DIMM slots is recommended. This allows the system to
run at the fastest memory speed while also allowing for future memory expansion.
Finally, it is also important to consider that the power consumption differences between DIMM types
and population schemes at equal capacity will be magnified by the cluster size. When selecting memory
Usage Model Processor Family DIMM Type DIMM Speed DIMM Count DIMM Population
Performance X-series UDIMM 1333 12 Balanced, 3 per socket
Energy Efficiency E-series UDIMM 1066 6 Balanced, 3 per socket
Power L-series UDIMM 1066 4 Unbalanced, 2 per socket

20
for hundreds or thousands of servers, the small power savings associated with purchasing 1 DPC rather
than 2 DPC may save thousands of dollars over the machine’s lifetime.
References
1. Data Center Workhorses: New Dell PowerEdge Rack and Blade Servers
http://www.dell.com/downloads/global/power/ps2q09-20090246-Nguyen.pdf
2. DDR3
http://en.wikipedia.org/wiki/DDR3_SDRAM
3. Intel Xeon 5500 series Memory controller bandwidth
http://www.intel.com/cd/channel/reseller/asmo-na/eng/products/server/410125.htm
4. Intel QuickPath Interconnect
http://www.intel.com/technology/quickpath/introduction.pdf
5. Optimal BIOS Settings for High Performance Computing with PowerEdge 11G Servers
http://www.dell.com/downloads/global/products/pedge/en/server-poweredge-11g-white-
paper.pdf
6. Dell PowerEdge M610 BIOS Version 1.2.7 RELEASE NOTES
http://ftp.us.dell.com/bios/R610-010206BIOS.txt

21
Appendix A – Summary of Key Findings
1. DIMM frequency is limited by the processor’s memory controller frequency. Do not buy faster
DIMMs than the memory controller can run. Refer to page 10.
2. RDIMMs and UDIMMs have equal performance but UDIMMs consume less power. Refer to Figure 3
and Table 2.
3. For clustered benchmarks, the 1333 MHz DIMMs outperformed 1066 MHz DIMMs by less than 5%
on average. Refer to Figure 5.
4. 1333 MHz DIMMs consumed 6-9% more power than 1066 DIMMs and were 5% less energy efficient.
Refer to Figure 5.
5. Most PowerEdge 11G servers support 2 DPC at 1333 MHz provided the CPU memory controller can
run at 1333 MHz. Refer to page 10.
6. At equal capacities and 1066 MHz, populating 2 DPC consumes 5% more power than 1 DPC but does
not improve application performance. Refer to Figure 8, Table 5 and Table 7.
7. At 1333 MHz, 2 DPC memory bandwidth is 4% higher than at 1 DPC. This is expected to result in ~1%
performance improvement at the cluster level for bandwidth sensitive applications. Refer to
8. Table 6.
9. Balanced configurations outperform unbalanced configurations by 4-23% when running clustered
applications. Refer to Figure 12.
10. A balanced 1066 MHz DIMM configuration will outperform an unbalanced 1333 MHz configuration.
Refer to Figure 11.
11. The 4-DIMM unbalanced configuration outperforms the 8-DIMM unbalanced configuration by up to
10% on memory intensive applications. Refer to Figure 12.
12. For some CPU-intensive applications, unbalanced 4-DIMM configurations can reduce power
consumption and cost without a significant performance decline. Refer to Figure 12.

22
Appendix B – Test Cluster
Component Description
SERVERS: Dell PowerEdge R610, Dell PowerEdge M610 (16) in a PowerEdge M1000e chassis
SERVER BIOS: 1.1.4, 1.2.6
PROCESSORS: Intel Xeon X5550, Intel Xeon X5570, Intel Xeon E5540
MEMORY: 6 x 4GB 1333 MHz RDIMM, 6 x 4GB 1066 MHz RDIMM, and as noted.
STORAGE: Dell SAS 6iR controller, 2 x 73GB 10k RPM SAS hard drives, RAID 1 on M610
Dell Perc6i controller, 2 X 73GB 15k RPM SAS hard drives, RAID 0 on R610
INTERCONNECT: InfiniBand - Mellanox MTH MT26428 [ConnectX IB QDR, Gen-2 PCIe]
IB SWITCH: Mellanox 3601Q QDR blade chassis I/O switch module
GbE NETWORK: Broadcom BCM5709
GbE switch: PowerConnect M6220 blade chassis I/O switch module, PowerConnect 6248 rack switch
SOFTWARE: ClusterCorp Rocks+ 5.1 for Dell*3
OS: Red Hat Enterprise Linux 5.3 x86_64 (2.6.18-128.el5 kernel)
IB STACK: Mellanox OFED 1.4
*This product includes software developed by the Rocks Cluster Group at the San Diego Supercomputer Center at the University of California, San Diego and its contributors.

23
Appendix C – Benchmark Descriptions
Benchmark Description Type
Stream1 Threaded memory bandwidth test Memory micro-benchmark
lat_mem_rd2 Memory latency test. Idle array chasing Memory micro-benchmark from LMBench
DGEMM3 Threaded matrix multiplication routine CPU micro-benchmark
HPL4 Distributed floating point benchmark CPU and communication benchmark
Fluent5 Computational fluid dynamics Commercial clustered application
Ansys6 Structural mechanics Commercial clustered application
ECLIPSE7 Reservoir simulation. Commercial clustered application
WRF8 Climate modeling Open source clustered application
LU9 Lower-upper decomposition physical systems Open source clustered synthetic kernel
1. Stream - v5.8 : http://www.cs.virginia.edu/stream/
2. lat_mem_rd v1.13 from LMBench3 : http://www.bitmover.com/lmbench/
3. DGEMM from Intel MKL 10.2 : http://software.intel.com/en-us/intel-mkl/
4. HPL v2.0 : http://www.netlib.org/benchmark/hpl/
5. Fluent: Ansys Fluent v12, Fluent benchmarks v6.3.26 : http://www.ansys.com/products/fluid-
dynamics/fluent/
6. Ansys: Distributed Ansys Workbench v12, Distributed Ansys benchmarks v12. :
http://www.ansys.com/products/workbench/default.asp
7. ECLIPSE: Reservoir Simulation Suite 2008.2 (November 2008) from Schlumberger. :
http://www.slb.com/content/services/software/reseng/index.asp
8. WRF v3.1. Data set Conus 12km. : http://www.mmm.ucar.edu/wrf/users/
9. LU: NAS Parallel Benchmarks. NPB-MPI v3.3, LU class D. : https://www.nas.nasa.gov/cgi-
bin/software/start