Embed Size (px)
Citation preview
Memory and Energy Profiling of Arduino Boards
Bhargavi Paranjape Raghavendra Udupa Microsoft Research Lab India Pvt Ltd
#9 Lavelle Road Bangalore, KA 15213
{t-bhpara,raghavu}@microsoft.com
Abstract
Low cost micro-controller boards such as Arduino, Beagle Bone, Particle Photon, etc. have unleashed a whole range of applications that interact with the environment through a variety of sensors and actuators. Whereas the early use of micro-controller boards seems to be for simple sensing and controlling of other devices, there is considerable interest in leveraging inexpensive boards for enabling more powerful applications, for example, those requiring Artificial Intelligence on devices in the Internet of Things (IoT). Developing such applications on Arduino and other boards is challenging because of the limitations of the microcontroller hardware and limited software support. In this study, we look at some of the challenges and explore potential solutions for them.
1 Introduction
Inexpensive micro-controllers like Arduino boards and single board computers like Raspberry Pi, BeagleBone Black together with their open-source hardware and software support have gained popularity as educational tools and in DIY and home electronics projects. They are also being used in personal health monitoring systems, industrial monitoring systems, weather stations, smart agriculture solutions etc. Such sophisticated IoT applications are challenging to these small computational units and need to be tackled to keep them operating correctly for years and decades.
One important consideration that affects performance and cost of aforementioned IoT systems is the energy consumption of such devices. We can quantify and measure the energy consumed in unit time, namely power. Previous studies have used USB Power Monitors1 and Multimeters2 to measure power consumption of different Arduino micro-controllers and custom micro-controllers. Such studies are motivated to evaluate and compare micro-controllers for optimal component combination selection by electronics hobbyists. What makes this study unique in that we focus on power monitoring to gain insight about the effect of running different kinds of applications and controlling various sensors on the power consumption of the micro-controller devices. We hope to discern variation in power consumption at different stages of running the application or taking a sensor reading.
____________________
1 Arduino Power Consumption study using USB Power Monitor, https://tlextrait.svbtle.com/arduino-power-consumption-compared
2 Arduino Power Consumption study using Multimeter, http://gadgetmakersblog.com/arduino-power-consumption/

Micro-controller devices are being considered as computational units on the edge that can lend intelligence to the collected raw sensor data. While these devices are capable of simple data manipulation, complex pattern recognition and learning algorithms have greater memory requirements. The ML for IoT project has developed machine learning models small enough to fit in the embedded memory of micro-controllers. However, low-power micro-controllers present several design and optimization challenges apart from small inbuilt memories. Such devices have low processor speeds, lack dedicated hardware to carry out floating-point operations, have lower memory access speeds, lack OS support for memory management and garbage collection and have limited software support . These differences can have an important impact on the applications using the ML models. For instance, an increased execution time due to slow processor speeds can contributes to more energy consumed. We implement compressed ML prediction models on these devices to gain insight about what engineering issues need be solved to bring ML to IoT devices in practice.
The report is organised as follows. In section 2, we present and describe in detail, an inexpensive and effective power-monitoring solution for micro-controllers, that can measure the power consumed by micro-controllers as they control sensors or run applications. In section 3, we explore the challenges associated with running applications/algorithms on micro-controllers with limited memory and software resources. We try to understand the ramifications on the memory, execution time and power consumption with the help of two machine learning algorithms. We accordingly recommend memory and power considerations to be made while implementing such applications.
2 Measuring Power Consumption of Micro -control lers
As micro-controllers are deployed in the field often in hazardous environments where it might be difficult and/or expensive to change batteries frequently, it is desirable that applications running on micro-controllers consume as little power as possible. Therefore, at the time of developing an application, algorithms need to be optimized appropriately to meet the power SLAs. This entails measuring the power consumed by a micro-controller when controlling sensors and running different variants of the controlling algorithm. Unfortunately, some of the inexpensive micro-controller boards such as Arduino UNO and Arduino MKR1000 do not provide software support for measuring power. An external power monitoring device also takes into consideration the power lost as heat by the power supply.
While it is possible to employ tools such as multimeters1 and power monitors2 for measuring power, the good ones are expensive and often involve a human-in-the-loop which might not be desirable in many scenarios. Portable USB power monitors do not have a sufficiently small response time to record the power consumption of many applications. Further, periodic measurement of power is necessary in many scenarios throughout the application development life cycle. We need an inexpensive solution that can measure the power consumed by micro-controllers when running applications. Furthermore, the solution needs to be simple enough to work with different boards and applications without requiring extensive instrumentation for each specific scenario.
In the remainder of this section we describe an inexpensive, simple, and programmatic solution for power measurement.
_________________________
1 Sophisticated power measurement multimeters, http://info.tek.com/rs/584-WPH-840/images/MDO4000C-Series-Oscilloscope-Datasheet-48W602770_11-11-15.pdf
2 USB Power Monitors, https://www.pretzellogix.net/2015/04/20/the-portable-led-usb-multimeter-that-you-didnt-know-you-needed/

2 .1 Po w er M ea sure ment C ircu i t
We employ INA219, an inexpensive high-side DC current sensor on a breakout board, to measure the power consumption of the micro-controller. INA219 breakout board can measure the high-side voltage as well as the DC current draw by the load attached to it. It is powered by 3V or 5V and handles high-side current up to 26V DC. What makes INA219 an attractive option for the task of micro-controller power measurement is its resolution of 0.1mA which allows practitioners to measure even small changes in power when algorithms are optimized. Furthermore, INA219 has an acceptably small response time (almost 10ms) which allows one to measure the power even when the algorithm takes very little time for execution.
Figure 1 shows the power measurement circuit. It consists of a) micro-controller M1 controlling the sensors and running an application (in this case Arduino UNO) b) INA219 breakout board c) micro-controller M2 powering INA219 (in this case another Arduino UNO) and measuring the power consumption of M1. Note that M1 is powered by power supply P1 through INA219 and M2 is powered by power supply P2. M1 could itself be connected to one or more sensors in practice. When M1 is running an algorithm, INA219 measures the current and voltage used by M1 by interrupting its power supply and M2 records these measurements. When M2 is connected to a computer through USB, the measurement data can be written to a file and stored or consumed by another application.
For more information on INA219 and Arduino UNO, please see Appendix 3 and 2 respectively.
Figure 1: Power Measurement Circuit

2 .2 Po w er M ea sure ment S ketch
The Arduino sketch for measuring the current and voltage and computing the power needs to be uploaded to M2. Here is the sketch we use in our setup:
#include <Wire.h>
#include <Adafruit_INA219.h>
Adafruit_INA219 ina219;
void setup()
{
Serial.begin(9600);
ina219.begin();
}
void loop()
{
float shuntVoltage = 0;
float busVoltage = 0;
float current_mA = 0;
float loadVoltage = 0;
float power = 0;
shuntVoltage = ina219.getShuntVoltage_mV();
busVoltage = ina219.getBusVoltage_V();
current_mA = ina219.getCurrent_mA();
loadVoltage = busVoltage + (shuntVoltage / 1000);
power = current * loadVoltage;
Serial.println(power);
delay(10);
}
Note that the above sketch measures power consumed by M1 approximately every 10 ms. If an algorithm takes less than 10 ms for execution, then it needs to be run in a loop for at least 10 ms.
2 .3 I l lus t ra t iv e Exa mp le 1 : E mpty Lo o p
As the first illustrative example of measuring power using INA219, we consider the following sketch that runs on M1. It is essentially an empty loop which does no application related computation.
void setup()
{
}
void loop()
{
}
We measured the power consumed by M1 when running the above sketch at an interval of 10ms for about 5 seconds. Figure 2 shows the cumulative density function of the power consumed by M1. X axis represents power (in mW) and Y axis gives the fraction of observations with power at most x for every x. We observe from Figure 2 that the power consumed varies between 227mW-234mW.
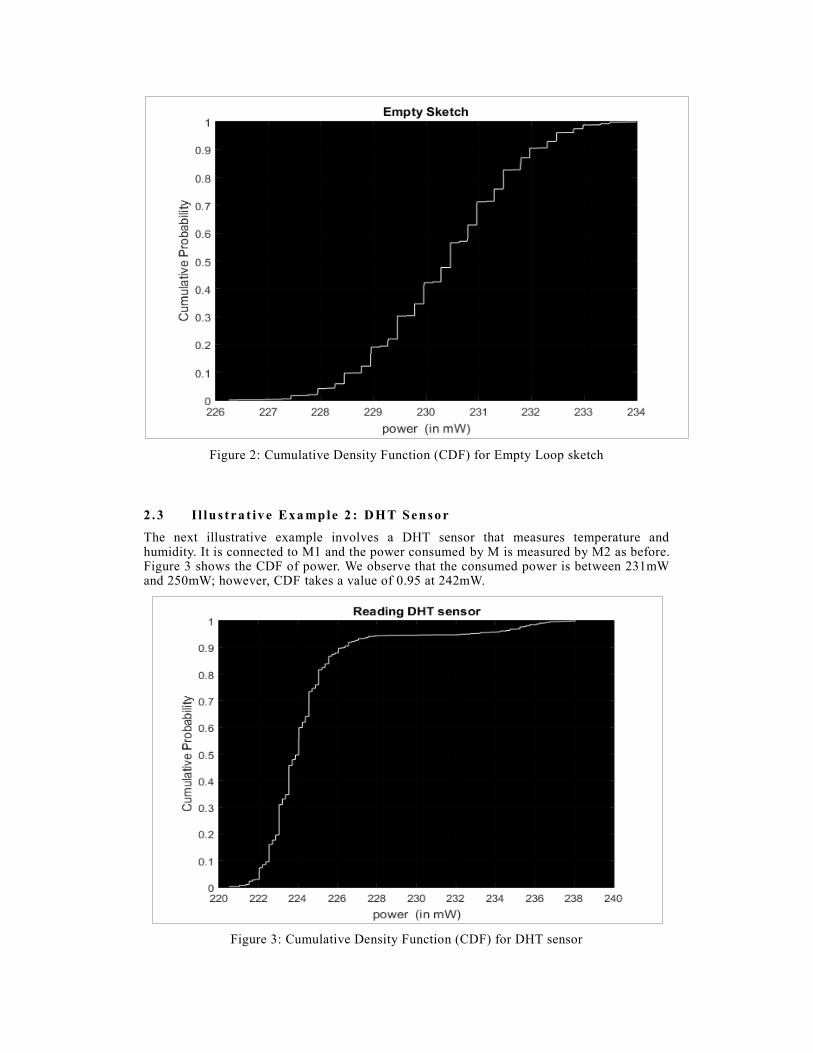
Figure 2: Cumulative Density Function (CDF) for Empty Loop sketch
2 .3 I l lu s t ra t iv e Exa mple 2 : DHT Senso r
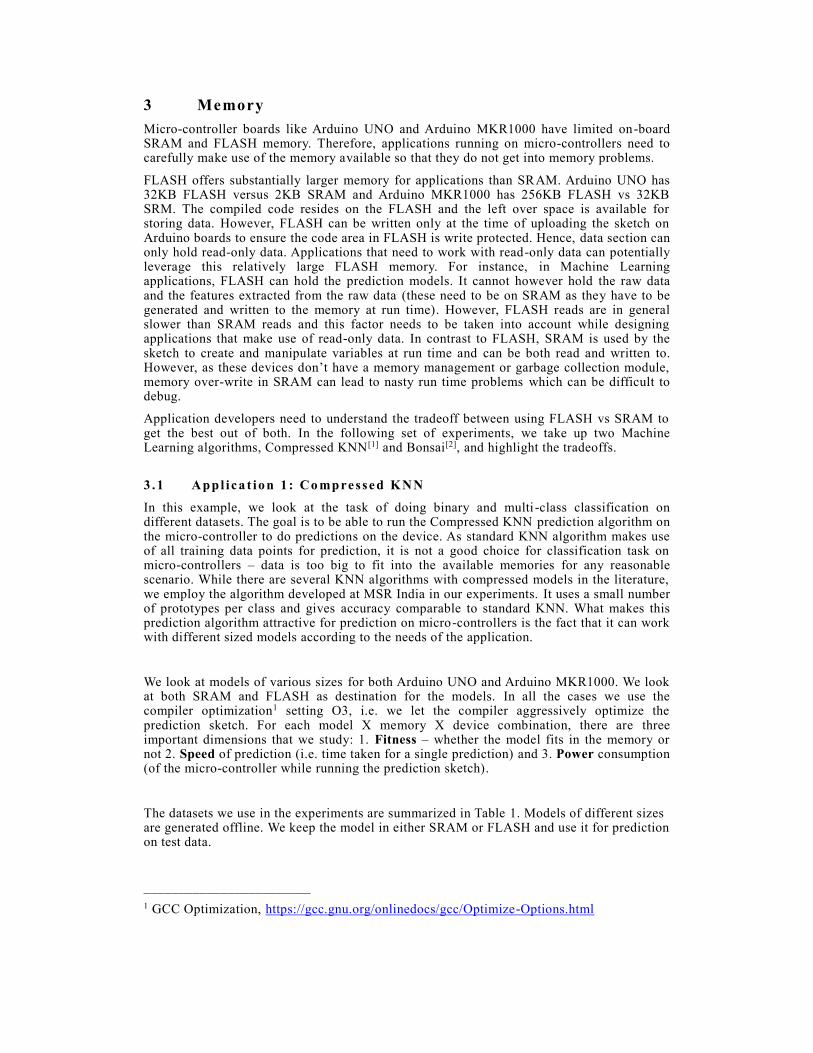
The next illustrative example involves a DHT sensor that measures temperature and humidity. It is connected to M1 and the power consumed by M is measured by M2 as before. Figure 3 shows the CDF of power. We observe that the consumed power is between 231mW and 250mW; however, CDF takes a value of 0.95 at 242mW.
Figure 3: Cumulative Density Function (CDF) for DHT sensor
3 Memory
Micro-controller boards like Arduino UNO and Arduino MKR1000 have limited on-board SRAM and FLASH memory. Therefore, applications running on micro-controllers need to carefully make use of the memory available so that they do not get into memory problems.
FLASH offers substantially larger memory for applications than SRAM. Arduino UNO has 32KB FLASH versus 2KB SRAM and Arduino MKR1000 has 256KB FLASH vs 32KB SRM. The compiled code resides on the FLASH and the left over space is available for storing data. However, FLASH can be written only at the time of uploading the sketch on Arduino boards to ensure the code area in FLASH is write protected. Hence, data section can only hold read-only data. Applications that need to work with read-only data can potentially leverage this relatively large FLASH memory. For instance, in Machine Learning applications, FLASH can hold the prediction models. It cannot however hold the raw data and the features extracted from the raw data (these need to be on SRAM as they have to be generated and written to the memory at run time). However, FLASH reads are in general slower than SRAM reads and this factor needs to be taken into account while designing applications that make use of read-only data. In contrast to FLASH, SRAM is used by the sketch to create and manipulate variables at run time and can be both read and written to. However, as these devices don’t have a memory management or garbage collection module, memory over-write in SRAM can lead to nasty run time problems which can be difficult to debug.
Application developers need to understand the tradeoff between using FLASH vs SRAM to get the best out of both. In the following set of experiments, we take up two Machine Learning algorithms, Compressed KNN[1] and Bonsai[2], and highlight the tradeoffs.
3 .1 Appl ica t io n 1 : Co mpressed KNN
In this example, we look at the task of doing binary and multi -class classification on different datasets. The goal is to be able to run the Compressed KNN prediction algorithm on the micro-controller to do predictions on the device. As standard KNN algorithm makes use of all training data points for prediction, it is not a good choice for classification task on micro-controllers – data is too big to fit into the available memories for any reasonable scenario. While there are several KNN algorithms with compressed models in the literature, we employ the algorithm developed at MSR India in our experiments. It uses a small number of prototypes per class and gives accuracy comparable to standard KNN. What makes this prediction algorithm attractive for prediction on micro-controllers is the fact that it can work with different sized models according to the needs of the application.
We look at models of various sizes for both Arduino UNO and Arduino MKR1000. We look at both SRAM and FLASH as destination for the models. In all the cases we use the compiler optimization1 setting O3, i.e. we let the compiler aggressively optimize the prediction sketch. For each model X memory X device combination, there are three important dimensions that we study: 1. Fitness – whether the model fits in the memory or not 2. Speed of prediction (i.e. time taken for a single prediction) and 3. Power consumption (of the micro-controller while running the prediction sketch).
The datasets we use in the experiments are summarized in Table 1. Models of different sizes are generated offline. We keep the model in either SRAM or FLASH and use it for prediction on test data.
________________________
1 GCC Optimization, https://gcc.gnu.org/onlinedocs/gcc/Optimize-Options.html
Dataset Task Dimension Devices Prediction Algorithms
USPS Binary Classification
256 UNO, MKR1000 Compressed KNN, Bonsai
Gas Sensor Multi-class Classification
128 UNO, MKR1000 Compressed KNN
Smart Phone Multi-class Classification
561 UNO, MKR1000 Compressed KNN
Table 1: Datasets
The first set of experiments run the Compressed KNN prediction sketch on Arduino UNO which has only 2KB SRAM and 32KB FLASH. Table 2 summarizes the results of the experiments on Arduino UNO. Without SRAM and FLASH extensions, Arduino UNO is a very challenging proposition for any prediction task. Only the two smallest sized models fit into SRAM whereas much larger sized models fit into FLASH. For the same sized model, prediction with model in FLASH is approximately 50% slower than prediction with model in SRAM. In all cases, we verified that the accuracy of prediction on the micro-controller matches that on desktop computer with substantially larger memory and faster CPU 1.
Table 2: Compressed KNN on Arduino UNO; USPS dataset
The next set of experiments run the Compressed KNN prediction sketch on Arduino MKR1000 which has ARM Cortex-M0+ MCU with 32KB SRAM and 256KB FLASH. Unlike Arduino UNO, models of substantially large size can fit into SRAM. And when the application demands even larger sized models can be fit into FLASH. Tables 3, 4 and 5 summarize the results. Key point to note is that for the same sized model, prediction with model in FLASH is nearly as fast as prediction with model in SRAM of MKR1000. Further, prediction is faster on MKR1000 and takes substantially less power than the UNO.
________________________
1We stored the test data points in an SD card and read one test point at a time for prediction on the MKR1000 micro-controller.
Model Size (KB)
Memory Fits in Memory
Power (mW) Time (ms)
0.74 SRAM Yes 234.8 ±1.4 3.4
FLASH Yes 232.0 ±1.9 6.0
1.07 SRAM Yes 233.9 ±1.3 6.4
FLASH Yes 232.1±1.9 9.0
2.61 SRAM No N/A N/A
FLASH Yes 234.6 ± 2.0 11.4
7.84 SRAM No N/A N/A
FLASH Yes 233.2 ±2.0 35.4
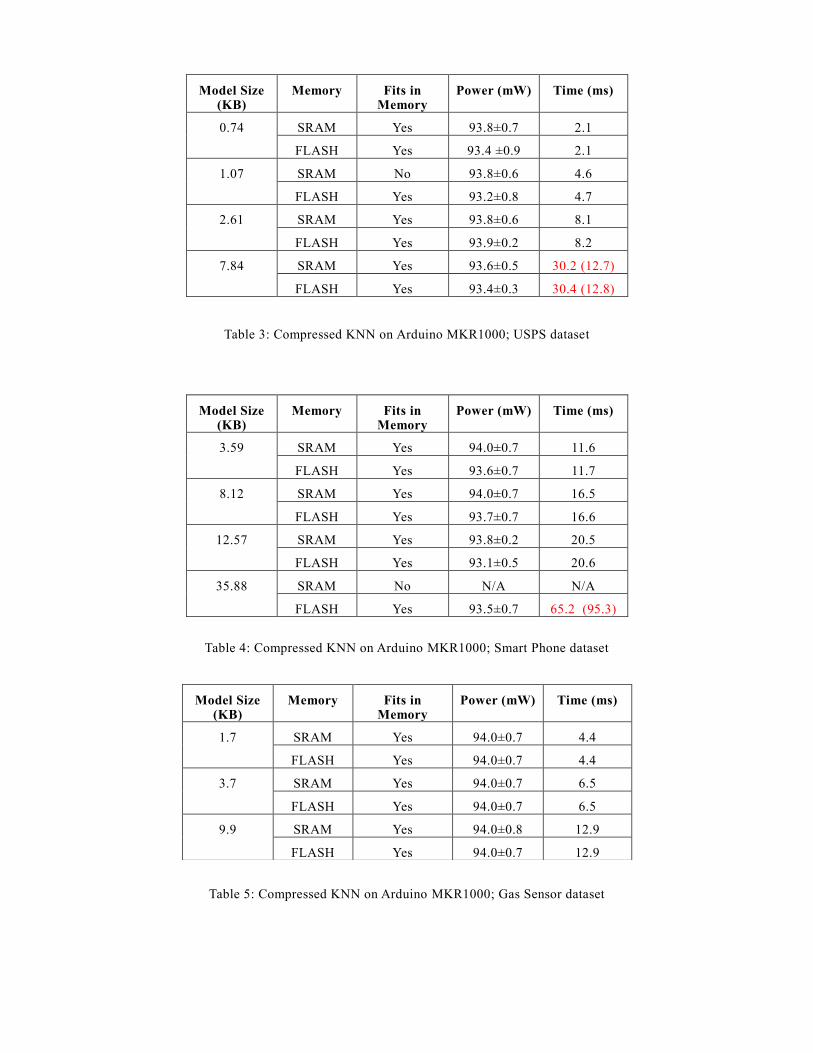
Table 3: Compressed KNN on Arduino MKR1000; USPS dataset
Table 4: Compressed KNN on Arduino MKR1000; Smart Phone dataset
Table 5: Compressed KNN on Arduino MKR1000; Gas Sensor dataset
Model Size (KB)
Memory Fits in Memory
Power (mW) Time (ms)
0.74 SRAM Yes 93.8±0.7 2.1
FLASH Yes 93.4 ±0.9 2.1
1.07 SRAM No 93.8±0.6 4.6
FLASH Yes 93.2±0.8 4.7
2.61 SRAM Yes 93.8±0.6 8.1
FLASH Yes 93.9±0.2 8.2
7.84 SRAM Yes 93.6±0.5 30.2 (12.7)
FLASH Yes 93.4±0.3 30.4 (12.8)
Model Size (KB)
Memory Fits in Memory
Power (mW) Time (ms)
3.59 SRAM Yes 94.0±0.7 11.6
FLASH Yes 93.6±0.7 11.7
8.12 SRAM Yes 94.0±0.7 16.5
FLASH Yes 93.7±0.7 16.6
12.57 SRAM Yes 93.8±0.2 20.5
FLASH Yes 93.1±0.5 20.6
35.88 SRAM No N/A N/A
FLASH Yes 93.5±0.7 65.2 (95.3)
Model Size (KB)
Memory Fits in Memory
Power (mW) Time (ms)
1.7 SRAM Yes 94.0±0.7 4.4
FLASH Yes 94.0±0.7 4.4
3.7 SRAM Yes 94.0±0.7 6.5
FLASH Yes 94.0±0.7 6.5
9.9 SRAM Yes 94.0±0.8 12.9
FLASH Yes 94.0±0.7 12.9

3 .2 Appl ica t io n 2 : B o nsa i
As the second illustrative application, we look at binary classification using Bonsai, which is a compressed decision tree algorithm. As with KNN, standard decision tree algorithm has a prohibitive model size to be used in micro-controller applications. Bonsai, like compressed KNN, can work with models of different size.
Tables 6 and 7 summarize the results of running Bonsai on Arduino UNO and Arduino MKR1000. We observe that these results are consistent with those of the experiments with Compressed KNN. On UNO, prediction is slightly faster when the model is in SRAM than in FLASH. However, bigger models can fit into FLASH. On MKR1000, no significant difference is seen in either speed or power between SRAM and FLASH. When the application demands models with size greater than 32KB, models can be fit into FLASH instead.
Table 6: Bonsai on Arduino UNO; USPS dataset
Model Size (KB)
Memory Fits in Memory
Power (mW) Time (ms)
0.3 SRAM Yes 228.0 ±2.4 2.4
FLASH Yes 228.4 ±2.4 2.8
1 SRAM Yes 227.6 ±2.1 2.6
FLASH Yes 228.9±1.9 3.1
2 SRAM No N/A N/A
FLASH Yes 228.6±2.3 4.1
4 SRAM No N/A N/A
FLASH Yes 228.7±1.2 6.6
8 SRAM No N/A N/A
FLASH Yes 228.76±2.1 13.18

Table 7: Bonsai on Arduino MKR1000; USPS dataset
3 .3 Discu ss io n
The results of Sections 3.1 and 3.2 might appear surprising initially as SRAM is in general substantially faster than FLASH. In the specific cases of Arduino UNO and Arduino MKR1000, it must be noted that the clock speed of the MCU is much lower than general purpose CPUs used in desktop machines and servers. UNO has a maximum clock speed of 16 MHz and MKR1000 clocks at 48 MHz Although we cannot confirm from the specifications of these boards, it is likely that on-chip SRAM and FLASH used in these boards have comparable if not the same data transfer speeds. The MCU clock speed throttles fast memory access.
Based on the results of our experiments, we can make the following recommendations:
It is not advisable to keep read-only data such as prediction models on SRAM of Arduino UNO. FLASH is a better alternative offering up to size 32K - 2K (bootloader) - size of the sketch.
While Arduino MKR1000 offers much larger SRAM for prediction models, it still makes sense to keep the models on FLASH as there is no observed difference in prediction speed. Further FLASH offers up to 256K - 16KB (bootloader) - size of the sketch for read-only data. This makes even more sense for image and video processing applications which need SRAM for raw data and features.
Refere nces
[1] Arun Sai Suggala et al, Compressed K-Nearest Neighbours, Personal Communication, Microsoft Research, India
[2] Asish Kumar et al, Bonsai Decision Trees, Personal Communication, Microsoft Research, India
Model Size (KB)
Memory Fits in Memory
Power (mW) Time (ms)
0.3 SRAM Yes 93.4±0.2 0.89
FLASH Yes 93.1±0.7 0.92
1 SRAM Yes 93.6 ±0.5 1.1
FLASH Yes 93.1±0.9 1.1
2 SRAM Yes 93.2±0.7 1.5
FLASH Yes 93.1±0.7 1.5
4 SRAM Yes 93.0±0.7 2.3
FLASH Yes 93.1±0.7 2.4
8 SRAM Yes 93.6±0.7 5.8
FLASH Yes 93.7±0.7 5.9

Appendix 1: Arduino UNO
Figure 4: Arduino UNO Board
General Specifications
Microcontroller: ATMEL Mega 328P-PU
SRAM: 2KB
Flash: 32KB (2 KB bootloader space), ROM
Maximum Clock Speed: 16MHz
Operating Voltage: 7-12V
Max DC Current: 50mA
EEPROM: 1KB (R/W)
Processor: 8 bits
Dimensions: 7*5.3 cm
Weight: 25g
Memory Details
Datatypes supported: 1-byte character, 2-byte integer and 4-byte fixed point decimal
(handled by integer operations on 2 B before and 2 B after decimal point). Arduino UNO
does not have a dedicated Floating point unit(FPU).
Register Memory: 32 General Purpose Registers which are not part of SRAM
Flash allows about 10,000 Flash Write/Erase cycles before wear begins to occur. Hence
the UNO can be programmed around 10,000 times.

Flash is organized as a 16K x 16 table. Hence, it supports a 16K addressing space. It is
divided into 2 sections: Boot loader and Application Program section each with lock bits
for memory protection.
Flash program space can store constant strings, arrays and matrices in the form of lookup
tables (http://www.nongnu.org/avr-libc/user-manual/pgmspace.html) and macros are
written to access them. At run time such data tables can only be read, not written to.
AVR library exposes only byte/word/double word access through MACROS
SRAM access: 2 CPU cycles, Flash read access: 5 CPU cycles
Execution highly optimized for SRAM memory compared to Flash at high optimization
levels of GNU GCC.
Compiler used by the Arduino development environment to compile on Arduino UNO is
avr-g++ version 4.9.1
Static data which is not marked to be stored and accessed from Flash is pushed from
Flash to SRAM in AVR MCU at the start of execution (https://cdn-
learn.adafruit.com/downloads/pdf/memories-of-an-arduino.pdf)
Appendix 2: Arduino MKR1000
.
Figure 5: Arduino MKR1000 Board
General Specifications
Microcontroller: ATSAMW25 with SAMD21 Cortex-M0+ 32bit low power ARM MCU
WINC1500 low power 2.4GHz IEEE® 802.11 b/g/n Wi-Fi module with certificate SHA-
256.
ECC508 CryptoAuthentication

SRAM: 32KB
Flash: 256 KB read-only (16KB bootloader)
Clock Speed: 48MHz
Operating Voltage: 3.3V
Li-Po charging circuit that can charge the battery used to power it.
Max DC Current: 7mA
EEPROM: No
Dimensions: 8*3.5 cm (compact design)
Weight: 32g
Memory Details
Datatypes Supported: 4-byte integer, 8-byte fixed point decimal and no dedicated floating
point unit
Since MKR1000 is an ARM architecture no PROGMEM and avr macros need to be used
to access flash, instead const keyword forces the data to flash and thereafter accesses it
using page wise read. Page size is 64B.
The SAM D21 MCU has single cycle I/O to both tightly coupled peripherals (SRAM and
Flash) and single cycle multiplication. It supports two stage pipelining of instructions and
memory protection.
Embedded gcc (version arm-none-eabi-gcc\4.8.3-2014q1) compiler is used by the
Arduino development environment to compile code.
Appendix 3: INA219
Figure 6: INA219 sensor
General Specifications
0.1 ohm 1% 2W current sense resistor
Up to +26V target voltage of the circuit to be measured
Powered by 3-5.5V at 1mA
Temperatures: -45 to 125 ºC
Up to ±3.2A current measurement, with ±0.8mA resolution
0.9" x 0.8" PCB

Based on precision and number of samples averaged, it measures at different rates,
default (11 bit, 128 samples) measures at 68.10ms per reading, minimum possible latency
is 10ms per reading
Communication interface used: I2C