Embed Size (px)
Citation preview

Memo
To:
From:
Date:
Subject:
David Anderson Charles Kennedy
Phil Richerson
2/6/2020
Northern Malheur County Groundwater Management Area Area-Wide Trend Analysis
At your request, I have performed a trend analysis of the groundwater nitrate concentrations in the Northern Malheur County Groundwater Management (GWMA). The results are described below and summarized in the attached table and figures. It is worth noting that this email describes results of the fifth trend analysis conducted since 2003. Because the sampling frequency and well network changed over time, results are not necessarily directly comparable between analyses. The analysis described in this memo used annual data (April • of each year).
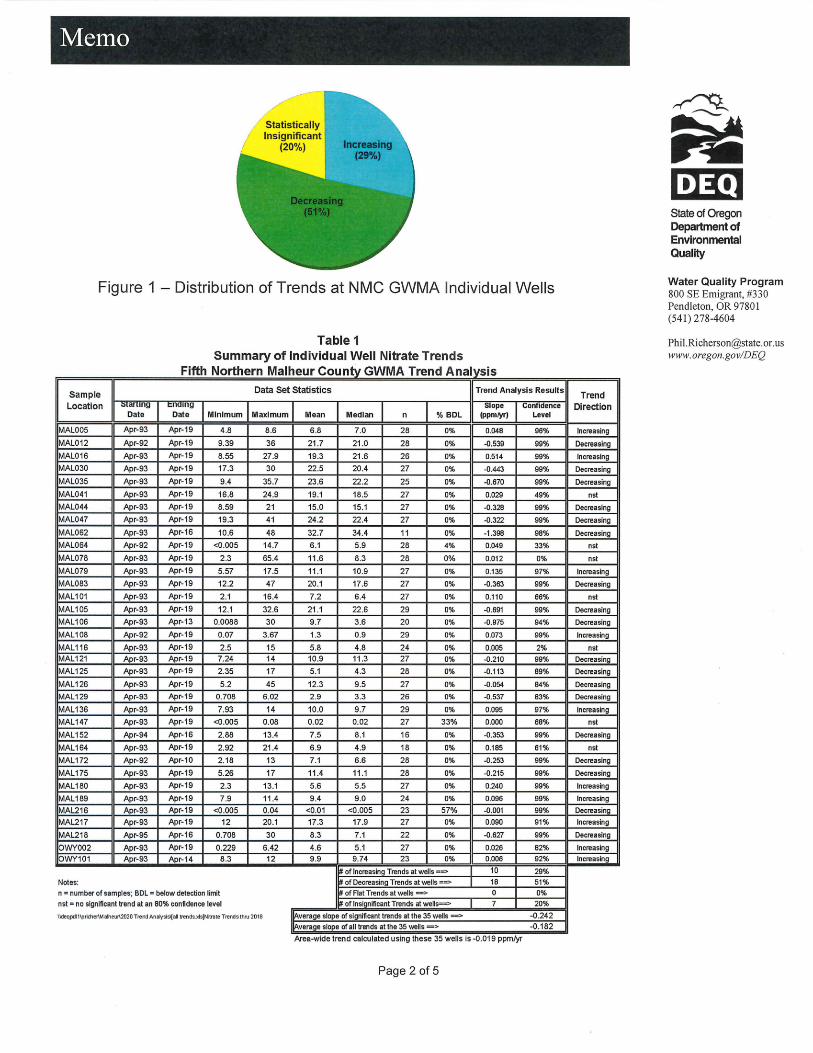
In summary, more wells are decreasing than increasing, and the area-wide trend of groundwater nitrate concentrations continues to decrease slightly. The decreasing area-wide trend meets the measure of Action Plan success that requires a statistically significant downward trend at the 80% confidence level.
Methods - As with previous analyses, the Seasonal Kendall procedure was used to evaluate trends at 35 individual wells. Data sets at most wells start in April 1993 and end in April 2019. Four data sets begin in April 1992, one begins in April 1994, and one in April 1995.
A variation of the Seasonal Kendall procedure known as the Regional Kendall test was used to evaluate the area-wide trend. The area-wide trend from April 1992 through April 2019 was calculated .
In order to evaluate changes in the area-wide trend over time, additional analyses were performed that consisted of deleting the most recent year of data then recalculating the area-wide trend. This process of deleting a year and recalculating trends was · repeated until statistically significant trends were no longer observed.
Trends at Individual Wells - Table 1 summarizes the data set statistics (e.g., timeframe of data, average concentration) as well as the trend slope (in parts per million per year) and confidence level1 (in percent). Figure 1 is a pie chart showing the breakdown of trends at individual wells. As shown in Table 1 and Figure 1, 10 wells (29%) showed increasing trends, 18 wells (51 %) showed decreasing trends, and 7 wells (20%) showed statistically insignificant trends.
1 The GWMA Action Plan calls for using a confidence level of 80% as the demarcation between statistically significant trends and statistically insignificant trends.
Page 1 of 5
~
rt: I •l !•J State of Oregon Department of Environmental Quality
Water Quality Program 800 SE Emigrant, #330 Pendleton, OR 97801 (541) 278-4604
[email protected] www.oregon.gov/DEQ
Memo
Figure 1 - Distribution of Trends at NMC GWMA Individual Wells
Table 1 Summary of Individual Well Nitrate Trends
Fifth Northern Malheur County GWMA Trend Analysis
Sample Data Set Statistics Trend Analysis Results
Location -:icarung cnamg Slope Confidence Date Date Minimum Maximum Mean Median n % BDL (ppm/yr) Level
MAL005 Apr-93 Apr-19 4.8 8 .6 6 .8 7 .0 28 0% 0.048 96%
MAL012 Apr-92 Apr-19 9.39 36 21.7 21.0 28 0% -0.539 99%
MAL016 Apr-93 Apr-19 8.55 27.9 19.3 21.6 26 0% 0.514 99%
MAL030 Apr-93 Apr-19 17.3 30 22 .5 20.4 27 0% -0.443 99%
MAL035 Apr-93 Apr-19 9 .4 35.7 23.6 22.2 25 0% -0.670 99%
MAL041 Apr-93 Apr-19 16.8 24 .9 19.1 18.5 27 0% 0.029 49%
MAL044 Apr-93 Apr-19 8.59 21 15.0 15.1 27 0% -0.328 99%
MAL047 Apr-93 Apr-19 19.3 41 24 .2 22.4 27 0% -0.322 99%
MAL062 Apr-93 Apr-16 10.6 48 32.7 34.4 11 0% -1.398 98%
MAL064 Apr-92 Apr-19 <0.005 14.7 6 .1 5 .9 28 4% 0.049 33%
MAL078 Apr-93 Apr-19 2.3 65 .4 11 .6 8 .3 28 0% 0.012 0%
MAL079 Apr-93 Apr-19 5.57 17.5 11 .1 10.9 27 0% 0.135 97%
MAL083 Apr-93 Apr-19 12.2 47 20.1 17.6 27 0% -0.363 99%
MAL101 Apr-93 Apr-19 2 .1 16.4 7 .2 6.4 27 0% 0.110 66%
MAL105 Apr-93 Apr-19 12.1 32.6 21 .1 22 .6 29 0% -0.691 99%
MAL106 Apr-93 Apr-13 0.0088 30 9 .7 3 .6 20 0% -0.975 94%
MAL108 Apr-92 Apr-19 0.07 3.67 1.3 0.9 29 0% 0.073 99%
MAL116 Apr-93 Apr-19 2 .5 15 5 .8 4.8 24 0% 0.005 2%
MAL121 Aor-93 Apr-19 7.24 14 10.9 11.3 27 0% -0.210 99%
MAL125 Apr-93 Apr-19 2.35 17 5 .1 4.3 28 0% -0.113 89%
MAL126 Apr-93 Apr-19 5 .2 45 12.3 9 .5 27 0% -0.054 84%
MAL129 Apr-93 Apr-19 0.708 6.02 2.9 3 .3 26 0% -0.537 83%
MAL136 Apr-93 Apr-19 7.93 14 10.0 9.7 29 0% 0.095 97%
MAL147 Apr-93 Apr-19 <0.005 0.08 0.02 0.02 27 33% 0.000 68%
MAL152 Apr-94 Apr-16 2.88 13.4 7 .5 8.1 16 0% -0.353 99%
MAL164 Apr-93 Apr-19 2.92 21 .4 6.9 4.9 18 0% 0.185 61%
MAL172 Apr-92 Apr-10 2.18 13 7 .1 6 .6 28 0% -0.253 9g%
MAL175 Apr-93 Apr-19 5.26 17 11.4 11.1 28 0% -0.215 99%
MAL180 Apr-93 Apr-19 2 .3 13.1 5 .6 5 .5 27 0% 0.240 99%
MAL189 Apr-93 Apr-19 7 .9 11.4 9 .4 9 .0 24 0% 0.096 99%
MAL216 Aor-93 Apr-19 <0.005 0.04 <0.01 <0 .005 23 57% -0.001 99%
MAL217 Apr-93 Apr-19 12 20 .1 17.3 17.9 27 0% 0.090 91%
MAL218 Apr-95 Apr-16 0.708 30 8 .3 7 .1 22 0% -0.627 99%
OWY002 Apr-93 Apr-19 0.229 6.42 4 .6 5 .1 27 0% 0.026 82%
OWY101 Apr-93 Apr-14 8.3 12 9 .9 9.74 23 0% 0.006 92%
fl. of Increasing Trends at wells==> 10 29%
Notes: fl. of Decreasing Trends at wells==> 18 51%
n = number of samples; BDL = below detection limit fl. of Flat Trends at wells ==> 0 0%
nst = no significant trend at an 80% confidence level II of Insignificant Trends at wells==> 7 20%
\\deqpdl1 \prlcher\Malheur\2020 Trend Analyslsl(all trends.lds]Nrrrate Trend s thru 2019 IIAverage slope of significant trends at the 35 wells => -0.242
IIAverage slope of all trends at the 35 wells=> -0.182
Area-wide trend calculated using these 35 wells 1s -0 .019 ppm/yr
Page 2 of 5
Trend Direction
Increasing
Decreasing
Increasing
Decreasing
Decreasing
nst
Decreasing
Decreasing
Decreasing
nst
nst
Increasing
Decreasing
nst
Decreasing
Decreasing
Increasing
nst
Decreasina
Decreasing
Decreasing
Decreasing
Increasing
nst
Decreasing
nst
Decreasing
Decreasing
Increasing
Increasing
Decreasina
Increasing
Decreasing
Increasing
Increasing
~
~ I •l :(•1 State of Oregon Department of Environmental Quality
Water Quality Program 800 SE Emigrant, #330 Pendleton, OR 97801 (541) 278-4604
[email protected] www.oregon.gov/DEQ

Memo
Area-Wide Trend - Figure 2 shows the 896 individual nitrate results from as many as 35 wells sampled during each event, the Regional Kendall trend line, and the LOWESS2 line through the data. As indicated in Figure 2, the area-wide trend is slightly declining at a rate of -0.019 ppm/yr at a 99% confidence level (pvalue of 0.0000005). The LOWESS line also shows the data slightly declines over time.
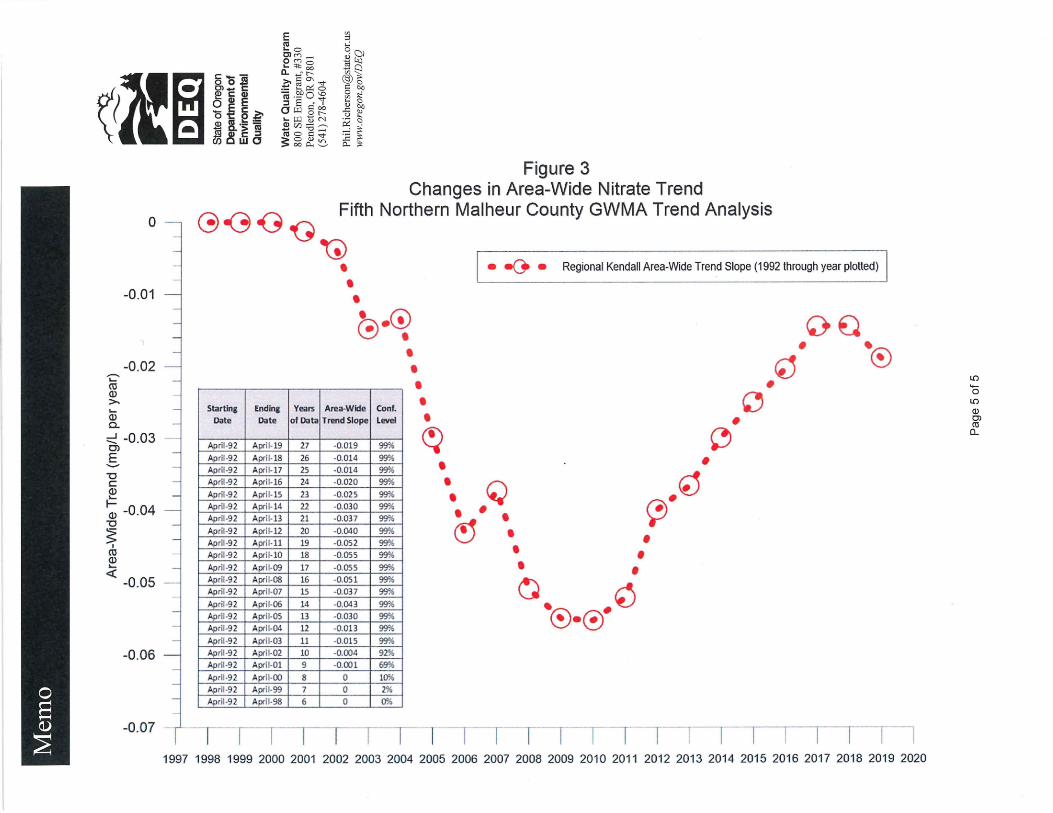
Figure 3 shows changes in the area-wide nitrate trend over time. As indicated in Figure 3, the area-wide trend was a statistically insignificant (i.e., low confidence level) flat trend (i.e., a slope of zero) from April 1992 through April 2000. The area-wide trend was then a statistically insignificant slightly decreasing (i.e., a negative slope) trend from April 1992 through April 2001. Then, the area-wide trend became a statistically significant (i.e., high confidence level) slightly decreasing trend from April 1992 through April 2002. The area-wide trend remained a statistically significant slightly decreasing trend from 2002 through 2019. The area-wide trend through 2010 was decreasing most steeply.
2 LOWESS stands for Locally Weighted Scatterplot Smoothing, is similar to a moving average, and is a way to gauge the general nature of change within a dataset.
Page 3 of 5
~
rt: I •l !•l State of Oregon Department of Environmental Quality
Water Quality Program 800 SE Emigrant, #330 Pendleton, OR 97801 (541) 278-4604
Phil .Richerson@state. or. us www.oregon.gov/DEQ

E ~o
C/l ::l
I~ c:--
- oo.S
(i~ HI~ - *C.>CU w~ifia
C>M -0 M 0 ... 'lt: 00 a. -,...' r:-->, s:: °' 'tj-
~ Ei~~ C'II · - 0 'tj;j a " I
orii §~ 1.. r.r.1 0 N 2u:i::a:::;C'II O s:: 'tj> 0 <l)lr) > 00 0.... ..__,,,
~ ()) ~~ @~ § ~ C/l.::: ~ C)
-5 ~ ·- ;.... ~ C)
~ ~ 0.... ;:!!:
-
70
65
55
50
45
40
0) 35 §, Q) m 30 -I-~
z 25
20
15
10
5
Figure 2 Area-Wide Nitrate Trend
Fifth Northern Malheur County GWMA Trend Analysis
8 0
0 0 0 0
0 0 0 8 0
§ 0 § 8 0 0 § § 0 0 0 8 ° 0 9
8 8 0
§ 8 0 8 8
~ 0 ~ 8 8 @ © §
8 r-- 0
0
0
0
•••• Individual Nitrate Results Areawide Trend using Regional Kendall Test (slope= -0.019 ppm/yr; 99% confidence level
---- LOWESS line through all data
0 0
0 0 @ i 8 0 0 0 § 8 0 0 § 0 0 0 8 0 © 0 8 ~ 8 ~ ~ 0 0 i 1 @ © 0 0 0 ~ © i ; ~ i © § 0 o ! 0
00© © ea§ Bj § 0 0 ® § 8 0 0 0 8 0 Q
0 - 0 Q 0 CJ
0 ,v ,() .{) ,U ,M .f~ .(J ,(:J ,Li ,f:1 ,() , (1 ,Fl ,M ,Fl .~J EJ , □ ,U ,R ,«» .(3 , f l ,fl ,<) .() ,C) ,CJ
1992 1994 1996 1998 2000 2002 2004 2006 2008 2010 2012 2014 2016 2018 2020
L() -0 -.::t" (I) 0) co
0...
E l!!o C>M -0Mo '-=!:l:oc,
C/)
::s
~ C))
\ti~ §'o]i en- c: ~ C: Q) o a, E - E c: ~ o t: e ==Q) ca ·- 1i:i lg C. e': :::J Cl)~WO
C. ..... r r-->-@ °' -.::t ~Sn~~ co ·- 0 -.::t ::I E " I
OP-1 §~ .._ p_i ~ N ,2l<Zl::a;::;-co O C -.::t > 0 <1.) <n >ooO...-._..,
~ ~ ~~ ~ ~ 5; s::: ti~ ..c:: (\} (.):...
~ ~ :-;::: ;s: li: ;s:
-.... ro Q.) >, .... Q.) c..
0
-0.01
-0.02
--' -0.03 -C)
E -"'C C
~ I- 0 04 (l) - .
"'C
~ I
ro Q) ....
<C -0.05
-0.06
-0.07
Figure 3 Changes in Area-Wide Nitrate Trend
G .C, (, G Fifth Northern Malheur County GWMA Trend Analysis
ti)
Starting Ending Years Date Date of Data
April--92 April--19 27
April-92 April--18 26
Aprit -92 April--17 25
April-92 April-- 16 24
April-92 April--15 23 April-92 April-14 22 April-92 April-13 21
April-92 April-12 20 April-92 April- 11 19 April-92 April--10 18
April-92 April--09 17
April-92 April-08 16
April-92 April-07 15
Aprit-92 April--06 14
April-92 April-OS 13 April-9 2 Aprll-04 12
April-92 April-03 11 April-92 April-02 10
April-9 2 Aprll--01 9
April-92 April-00 8 April -92 April-99 7
April-92 April-98 6
• • • G-@ •
Area-Wide Cont. Trend Slope Level
-0.019 99%
-0.014 99%
• • • • • ~
• -0 • Regional Kendall Area-Wide Trend Slope (1992 through year plotted)
"~ .® • ~ •
" • 0
• -0.014 ggo~ • -0.020 99%
-0.025 99% -0.030 99% -0.037 99% -0.040 99% -0.052 99% -0.055 99%
-0.055 99% -0.051 99% -0.037 99% -0.043 99% -0.030 99% -0.013 99%
-0.015 99% -0.004 92%
-0.001 69%
0 10% 0 2% 0 0%
• • •• Q ~· • • • <;>.<:> • • •
~ ~ • • ®•0
I I 1997 1998 1999 2000 2001 2002 2003 2004 2005 2006 2007 2008 2009 2010 2011 2012 2013 2014 2015 2016 2017 2018 2019 2020
LO '+-0
LO Q) 0) cu a..