Embed Size (px)
Citation preview

University of Arkansas, Fayetteville University of Arkansas, Fayetteville
ScholarWorks@UARK ScholarWorks@UARK
Graduate Theses and Dissertations
8-2017
Membrane Surface Engineering for Biochemical Applications Membrane Surface Engineering for Biochemical Applications
Anh T. Vu University of Arkansas, Fayetteville
Follow this and additional works at: https://scholarworks.uark.edu/etd
Part of the Biochemistry Commons, Membrane Science Commons, and the Petroleum Engineering
Commons
Citation Citation Vu, A. T. (2017). Membrane Surface Engineering for Biochemical Applications. Graduate Theses and Dissertations Retrieved from https://scholarworks.uark.edu/etd/2497
This Dissertation is brought to you for free and open access by ScholarWorks@UARK. It has been accepted for inclusion in Graduate Theses and Dissertations by an authorized administrator of ScholarWorks@UARK. For more information, please contact [email protected].

Membrane Surface Engineering for Biochemical Applications
A dissertation submitted in partial fulfillment of the requirements for the degree of Doctor of Philosophy in Engineering
by
Anh Vu
University of Arkansas Bachelor of Science in Chemical Engineering, 2009
University of Arkansas Master of Science in Chemical Engineering, 2011
August 2017 University of Arkansas
This thesis is approved for recommendation to the Graduate Council.
_____________________________________
Dr. Ranil Wickramasinghe Dissertation Director
_____________________________________ _____________________________________
Dr. Xianghong Qian Dr. Mathias Ulbricht Committee Member Committee Member
_____________________________________
Dr. Ravi Barabote Committee Member

Abstract
Synthetic membranes have been frequently used for many fields, such as, the food and
beverage, biopharmaceutical, and biofuel industries. In the beer industry, microfiltration
frequently suffers from fouling due to the interaction between different species. It is shown that
polyphenols can form cross-links with protein molecules, forming insoluble aggregates.
However, by adding an optimal amount of polysaccharides these aggregates can be disrupted
thus reducing fouling by the aggregates. Confocal laser scanning microscopy (CLSM) is a
powerful technique to locate the foulants inside the wet membrane in order to understand more
about the behavior of fouling in microfiltration.
Membrane surface modification is used to impart desirable membrane surface properties.
Here membrane surface modification is used to develop membrane adsorbers for protein
purification. Hydrophobic interaction membrane chromatography (HIMC) has gained interest
due to its excellent performance in purification humanized monoclonal antibodies. HIMC affords
all the advantages of membrane adsorbers, which is dynamic capacities that are independent of
flow rate, higher throughput and easy to scale up. Unique inverse colloidal crystal (ICC)
membranes were developed with highly periodic structures, high porosity, and fully
interconnected pores. ICC membranes offer a very high binding capacity for IgG4. On the other
hand, salt responsive membranes were developed by grafting responsive ligand, poly
vinylcaprolactam (PVCL), from the surface of the membrane by atom transfer radical
polymerization (ATRP). The nanostructure can vary its conformation and hydrophobicity when
the temperature changes. After modification, membrane is able to provide a very high recovery
and yield.

Membrane modification is also well applied for biofuel industry. Duel nanostructures,
poly styrene sulfonic acid (PSSA) and poly ionic liquid (PIL) were grafted separately and
neighborly from the surface of ceramic membrane substrate by control ATRP and UV initiated
radical polymerization. Modified membrane substrates were challenged with cellulose and corn-
stovers biomass hydrolysis in pure ionic liquid (IL) and mixture of IL and co-solvent. High yield
in total reducing sugar (TRS), 95% and 60% for cellulose and corn-stovers biomass respectively,
indicates strong activity of polymeric solid acid catalysts.

Acknowledgement
It is my pleasure to thank to my advisors who provide me a great environment for
studying and researching. Without their guidance, I will not have opportunity to be successful
like this today. I have been learning so much from my advisors. I could not thank enough for
their insightful comments and encouragements for making me grow to an independent
researcher. I would like to express my sincere gratitude to my supervisor, Dr. Ranil
Wickramasinghe, who brought me into this membrane life and give me a great opportunity to
work with many exciting projects. His hard work is always my motivation to move on when I
was about to give up. Thank to my co-advisor, Dr. Xianghong Qian, for her guidance during my
Ph.D. program. I will not be thankful enough for her patience and never give up on my research.
Her knowledge helps my research smoother and successful. Besides my advisors, I would like to
say many thanks to my dissertation committee, Prof. Mathias Ulbricht and Prof. Ravi Barabote,
for spending time to look and add inputs to broaden and deepen my research from many
perspectives.
It is my pleasure to work in the same lab with all of my great colleges. Thank to Mahdi,
Zizhao, and Alex for helping me all the time. I want to say thank to all postdocs, Yang Qian, Sia,
Blaine, and Arijit, that guided me through the experiments.
Last but not least, I want to say thank to my family that always support me all the time.
Without them, I won’t be able to make it by this time. I know both of you have sacrificed your
whole lives so I can have my success today.

Table of Contents Chapter 1 Introduction..................................................................................................................1 1.0 Introduction ................................................................................................................................1 1.1 Direct observation and suppression of membrane fouling ........................................................7 1.2 Membrane adsorbers for hydrophobic interaction chromatography ........................................10 1.3 Catalytic membrane for biomass hydrolysis ............................................................................16 References ......................................................................................................................................18 PART 1 Direct observation and suppression of membrane fouling........................................23 Chapter 2 Location and Quantification of Biological Foulants in a Wet Membrane Structure by Cross-sectional Confocal Laser Scanning Microscopy ......................................23 Summary ........................................................................................................................................23 2.1 Introduction ..............................................................................................................................24 2.2 Experimental materials and methods .......................................................................................29 2.2.1 Materials ...............................................................................................................................29 2.2.2 Filtration experiments ...........................................................................................................30 2.2.3 Calibration curve preparation ...............................................................................................31 2.2.4 Sectioning and mounting of samples for cross-sectional CLSM imaging ............................32 2.2.5 Optical system and imaging ..................................................................................................32 2.2.6 Image analysis .......................................................................................................................32 2.2.7 Dynamic light scattering (DLS) measurements ....................................................................32 2.3 Results and discussion .............................................................................................................33 2.3.1 Flux measurements ..............................................................................................................33 2.3.2 Sample preparation for CLSM imaging ................................................................................35 2.3.3 Determining the location of foulants by CLSM: single and binary component solutions ....37 2.3.4 Image analysis and quantification of foulants ......................................................................40 2.3.5 Fouling mechanisms .............................................................................................................47 2.4 Conclusion ..............................................................................................................................49 References ......................................................................................................................................50 Chapter 3 Evaluation of Fouling Mechanisms in Asymmetric Microfiltration Membranes Using Advanced Imaging ............................................................................................................54 Summary .......................................................................................................................................54 3.1 Introduction .............................................................................................................................55 3.2 Experimental materials and methods .......................................................................................58 3.2.1 Materials ...............................................................................................................................58 3.2.2 Filtration experiments ...........................................................................................................60 3.2.3 Calibration curve preparation ...............................................................................................61 3.2.4 Sectioning and mounting of samples for cross-sectional CLSM imaging ............................61 3.2.5 Optical system and imaging ..................................................................................................61 3.2.6 Image analysis .......................................................................................................................62 3.2.7 Dynamic light scattering (DLS) measurements ....................................................................62

3.3 Results and discussion ............................................................................................................62 3.3.1 Selection of study system .....................................................................................................62 3.3.2 Flux measurements ..............................................................................................................64 3.3.3 Cross-sectional CLSM imaging ...........................................................................................69 3.3.4 Fouling mechanisms ............................................................................................................81 3.4 Conclusions .............................................................................................................................83 References .....................................................................................................................................84 Chapter 4 Fouling OF Microfiltration Membranes by Biopolymers ......................................88 Summary .......................................................................................................................................88 4.1 Introduction .............................................................................................................................88 4.2 Experimental materials and methods .......................................................................................91 4.2.1 Chemicals ..............................................................................................................................91 4.2.2 Membrane filtration ..............................................................................................................92 4.2.3 Scanning electron microscopy ..............................................................................................93 4.2.4 Dynamic light scattering measurements ...............................................................................93 4.3 Theory .....................................................................................................................................94 4.4 Results and discussion ............................................................................................................95 4.5 Conclusion ............................................................................................................................106 References ...................................................................................................................................107 PART 2 Membrane adsorbers for hydrophobic interaction chromatography ....................110 Chapter 5 Inversed colloidal crystal membranes for hydrophobic interaction membrane chromatography .........................................................................................................................110 Summary .....................................................................................................................................110 5.1 Introduction ...........................................................................................................................110 5.2 Materials and methods ...........................................................................................................112 5.2.1 Chemicals and reagents.......................................................................................................112 5.2.2 Preparation of monodisperse silica particles.......................................................................113 5.2.3 Self-assembly of colloidal crystal template and fabrication of ICC membrane .................114 5.2.4 Antibody purification using HIMC .....................................................................................115 5.3 Results and discussion ..........................................................................................................115 5.4 Conclusion .............................................................................................................................122 References ...................................................................................................................................122 Chapter 6 Responsive Membrane for Hydrophobic Interaction Chromatography ............127 Summary .....................................................................................................................................127 6.1 Introduction ...........................................................................................................................127 6.2 Materials and methods ...........................................................................................................131 6.2.1 Chemicals ............................................................................................................................131

6.2.2 Membrane modification ......................................................................................................132 6.2.3 Membrane characterization .................................................................................................134 6.2.4 Chromatography testing ......................................................................................................136 6.3 Results and Discussion .........................................................................................................137 6.4 Conclusions ...........................................................................................................................151 References ...................................................................................................................................152 PART 3 Catalytic membranes for biomass hydrolysis ...........................................................156 Chapter 7 Novel Polymeric Solid Acid Catalyst for Cellulose and Biomass Hydrolysis.....156 7.1 Introduction ...........................................................................................................................156 7.2 Materials and reagents ...........................................................................................................160 7.3 Synthesis and modification ...................................................................................................162 7.3.1 UV initiator synthesis ........................................................................................................162 7.3.2 Grafting of SAM layer .......................................................................................................164 7.3.3 UV initiator immobilization ...............................................................................................164 7.3.4 ATRP initiator immobilization ...........................................................................................164 7.3.5 PSSA nanostructure synthesis via ATRP ..........................................................................165 7.3.6 PIL nanostructure synthesis via UV initiated polymerization ...........................................165 7.3.7 Real biomass pretreatment .................................................................................................166 7.3.8 Cellulose hydrolysis ...........................................................................................................167 7.3.9 Recycling membrane .........................................................................................................169 7.4 Membrane surface characterization .......................................................................................169 7.5 Results and discussion ..........................................................................................................170 7.5.1 Glass Substrate-Cellulose hydrolysis .................................................................................170 7.5.1.1 [EMIM]Cl vs [BMIM]Cl ................................................................................................170 7.5.1.2 Catalytic stability ............................................................................................................172 7.5.2 Silica membrane substrate-Cellulose hydrolysis ................................................................174 7.5.2.1 Cellulose hydrolysis in different solvent and solvent mixture ........................................174 7.5.2.2 Hydrolysis of cellulose at 5% cellulose loading ..............................................................178 7.5.3 Silica membrane substrate-Real biomass (prepared in lab) hydrolysis .............................181 7.5.4 Silica membrane substrate-Real biomass (NREL) hydrolysis ...........................................187 7.5.4.1 Temperature at 95°C .......................................................................................................187 7.5.4.2 Temperature at 100°C .....................................................................................................195 7.5.4.3 Temperature at 105°C .....................................................................................................202 7.5.5 Hydrolysis results comparison as changing in temperature ................................................207 7.6 Conclusion ............................................................................................................................208 References ...................................................................................................................................209 Chapter 8 Conclusions and Future work.................................................................................213
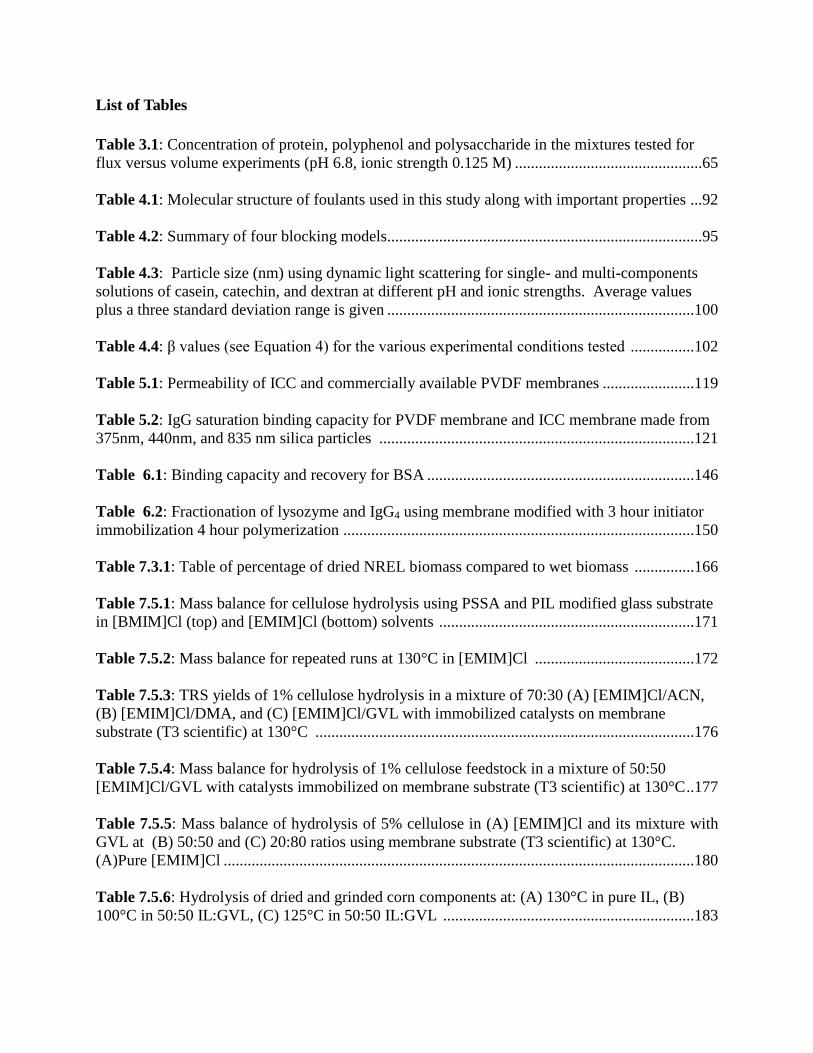
List of Tables Table 3.1: Concentration of protein, polyphenol and polysaccharide in the mixtures tested for flux versus volume experiments (pH 6.8, ionic strength 0.125 M) ...............................................65 Table 4.1: Molecular structure of foulants used in this study along with important properties ...92 Table 4.2: Summary of four blocking models...............................................................................95 Table 4.3: Particle size (nm) using dynamic light scattering for single- and multi-components solutions of casein, catechin, and dextran at different pH and ionic strengths. Average values plus a three standard deviation range is given .............................................................................100 Table 4.4: β values (see Equation 4) for the various experimental conditions tested ................102 Table 5.1: Permeability of ICC and commercially available PVDF membranes .......................119 Table 5.2: IgG saturation binding capacity for PVDF membrane and ICC membrane made from 375nm, 440nm, and 835 nm silica particles ...............................................................................121 Table 6.1: Binding capacity and recovery for BSA ...................................................................146 Table 6.2: Fractionation of lysozyme and IgG4 using membrane modified with 3 hour initiator immobilization 4 hour polymerization ........................................................................................150 Table 7.3.1: Table of percentage of dried NREL biomass compared to wet biomass ...............166 Table 7.5.1: Mass balance for cellulose hydrolysis using PSSA and PIL modified glass substrate in [BMIM]Cl (top) and [EMIM]Cl (bottom) solvents ................................................................171 Table 7.5.2: Mass balance for repeated runs at 130°C in [EMIM]Cl ........................................172 Table 7.5.3: TRS yields of 1% cellulose hydrolysis in a mixture of 70:30 (A) [EMIM]Cl/ACN, (B) [EMIM]Cl/DMA, and (C) [EMIM]Cl/GVL with immobilized catalysts on membrane substrate (T3 scientific) at 130°C ...............................................................................................176 Table 7.5.4: Mass balance for hydrolysis of 1% cellulose feedstock in a mixture of 50:50 [EMIM]Cl/GVL with catalysts immobilized on membrane substrate (T3 scientific) at 130°C ..177 Table 7.5.5: Mass balance of hydrolysis of 5% cellulose in (A) [EMIM]Cl and its mixture with GVL at (B) 50:50 and (C) 20:80 ratios using membrane substrate (T3 scientific) at 130°C. (A)Pure [EMIM]Cl ......................................................................................................................180 Table 7.5.6: Hydrolysis of dried and grinded corn components at: (A) 130°C in pure IL, (B) 100°C in 50:50 IL:GVL, (C) 125°C in 50:50 IL:GVL ...............................................................183

Table 7.5.7: Hydrolysis of dried and grinded kernel corn at: A) 95°C in 50:50 IL:GVL, B) 95°C in 80:20 IL:GVL, C) 95°C in 100% IL ........................................................................................186 Table 7.5.8: Hydrolysis of pretreated NREL biomass at 95oC in: a) 100% IL, b) 50:50 IL:GVL, c) 80:20 IL:GVL ..........................................................................................................................189 Table 7.5.9: Hydrolysis of pretreated NREL biomass at 95°C in: a) 80:20 IL:GVL b) 80:20 IL:water, c) 70:30 IL:water ..........................................................................................................193 Table 7.5.10: Hydrolysis of pretreated NREL biomass at 100°C in: a) 80:20 IL:GVL and b) IL:H2O, c) 70:30 IL:GVL d) 70:30 IL:H2O, e) 60:40 IL:GVL f) 50:50 IL:GVL ......................199 Table 7.5.11: Hydrolysis of pretreated NREL biomass at 105°C in: a) 80:20 IL:GVL and b) 80:20 IL:water, c) 70:30 IL:water ..............................................................................................204

List of Figures
Figure 1.1: Packed bed column ....................................................................................................11
Figure 1.2: Existing transport phenomena in conventional beads and Membrane Adsorbers .....12
Figure 1.3: Hydrophobic interaction chromatography outline .....................................................15
Figure 2.1: Schematic for sample sectioning and cross-sectional CLSM images ........................33
Figure 2.2: Permeate flux evolution for casein (25 mg/L) single component (●), dextran (25 mg/L) single component (○), casein-dextran binary component (12.5 mg/L each) (▼), dextran (12.5 mg/L) single component (Δ) .................................................................................................34 Figure 2.3: DLS data for 12.5 mg/L casein single component solution (TOP) and a 50:50 (w/w) mixture of casein and dextran at 25 mg/L (BOTTOM). ................................................................35 Figure 2.4: Cross-sectional CLSM images of dextran-Alexa Fluor® 594 binding within an asymmetric 0.65 μm PES membrane at a depth of 4 μm. Images are for samples taken after 15% flux decline. The dense surface of the membrane is on the left of all images. Images are for samples washed once (LEFT), twice (MIDDLE), and thrice (RIGHT). The scale indicator is 10 μm in diameter ...............................................................................................................................36 Figure 2.5: Intensity profile for CLSM images presented in figure 2.4. Profiles are for samples washed once (●), twice (○), and thrice (▼). ..................................................................................36 Figure 2.6: Cross-sectional CLSM images of casein and casein-FITC binding within an asymmetric 0.65 μm PES membrane at a depth of 4 μm. Feed was 25 mg/L casein (1: 20 fluorescent probe to non-tagged compound). The dense surface is on the LEFT of all images. Images are for samples taken after 5% flux decline (LEFT), 10% flux decline (MIDDLE), and 15% flux decline (RIGHT). The scale indicator is 10 μm in diameter. .........................................40 Figure 2.7: Cross-sectional CLSM images of dextran and dextran-Alexa Fluor® 594 binding within an asymmetric 0.65 μm PES membrane at a depth of 4 μm. Feed was 25 mg/L dextran (1:20 fluorescent probe to non-tagged compound). The dense surface is on the LEFT of all images. Images are for samples taken after 5% flux decline (LEFT), 10% flux decline (MIDDLE), and 15% flux decline (RIGHT). The scale indicator is 10 μm in diameter. ..............41 Figure 2.8: Cross-sectional CLSM images of a 50:50 (w/w) casein-dextran mixture binding within an asymmetric 0.65 μm PES membrane at a depth of 4 μm. Feed was 25 mg/L (1:20 fluorescent probe to non-tagged compound). The dense surface is on the LEFT of all images. TOP row images are for samples taken after 5% flux decline: casein (LEFT), dextran (MIDDLE), superimposed image of casein and dextran (RIGHT). SECOND row images are for samples taken after 10% flux decline. BOTTOM row images are for samples taken after 15% flux decline. The scale indicator is 10 μm in diameter. .................................................................42

Figure 2.9: Intensity profiles for the cross-sectional CLSM images of casein-FITC binding (Figure 2.6) within an asymmetric 0.65 μm PES membrane at a depth of 4 μm, after filtering a single-component solution. Profiles are for samples taken after 5% flux decline (●), 10% flux decline (○), and 15% flux decline (▼) ..........................................................................................43 Figure 2.10: Intensity profiles for the cross-sectional CLSM images of dextran-Alexa Fluor® 594 binding (Figure 2.7) within an asymmetric 0.65 μm PES membrane at a depth of 4 μm, after filtering a single-component solution. Profiles are for samples taken after 5% flux decline (●), 10% flux decline (○), and 15% flux decline (▼). .........................................................................44 Figure 2.11: Intensity profiles for the cross-sectional CLSM images of casein-FITC binding (Figure 2.8) within an asymmetric 0.65 μm PES membrane at a depth of 4 μm, after filtering a binary component (casein-dextran) solution. Profiles are for samples taken after 5% flux decline (●), 10% flux decline (○), and 15% flux decline (▼). ..................................................................45 Figure 2.12: Intensity profiles for the cross-sectional CLSM images of dextran-Alexa Fluor® 594 binding (Figure 2.9) within an asymmetric 0.65 μm PES membrane at a depth of 4 μm, after filtering a binary component (casein-dextran) solution. Profiles are for samples taken after 5% flux decline (●), 10% flux decline (○), and 15% flux decline (▼). ..............................................46 Figure 3.1: Permeate flux evolution for casein (25 mg/L) single component (□), tannic acid (150 mg/L) single component (●), β-cyclodextrin (200 mg/L) single component (◊), casein-tannic acid binary component (25 mg/L and 150 mg/L, respectively ) (▲), casein–tannic acid–β-cyclodextrin (25 mg/L, 150 mg/L, 200 mg/L, respectively) ternary component (♦), casein–tannic acid–β-cyclodextrin (25 mg/L, 150 mg/L, 50 mg/L, respectively) ternary component (○), casein–tannic acid–β-cyclodextrin (25 mg/L, 150 mg/L, 25 mg/L, respectively) ternary component (Δ).........................................................................................................................................................65 Figure 3.2: DLS data for (a) casein (25 mg/L) single component, (b) tannic acid (150 mg/L) single component, (c) casein–tannic acid binary component (25 mg/L and 150 mg/L, respectively) and (d) casein–tannic acid binary component (25 mg/L and 150 mg/L, respectively) size distribution by intensity. .........................................................................................................67 Figure 3.3: Cross-sectional CLSM images of casein/casein–FITC binding within an asymmetric 0.65 μm PES membrane measured 4 μm below the surface of the cross-section. Feed was 25 mg/L casein (1:20 fluorescently labeled to non-labeled protein). The dense surface is on the LEFT of all images. Images are for samples taken after processing 125 mL permeate volume (LEFT), 250 mL permeate volume (MIDDLE), and 500 mL permeate volume (RIGHT). The scale indicator is 10 μm in diameter. .............................................................................................70 Figure 3.4: Intensity profiles for the cross-sectional CLSM images of casein/casein–FITC binding (Figure 3.3) within an asymmetric 0.65 μm PES membrane measured 4 μm below the surface of the cross-section, after filtering a single-component solution. Profiles are for samples taken after processing 125 mL permeate volume (●), 250 mL permeate volume (○), and 500 mL permeate volume (▼). Please note that the y-axis range in this figure is different from that used

for mixed-component systems in Figure 3.8 and Figure 3.12. Error bars represent the standard deviation of the measurements.......................................................................................................71 Figure 3.5: Cross-sectional CLSM images of β-cyclodextrin/β-cyclodextrin–RITC binding within an asymmetric 0.65 μm PES membrane measured 4 μm below the surface of the cross-section. Feed was (a) 50 mg/L β-cyclodextrin (1:20 fluorescently labeled to non-labeled polysaccharide), and (b) 200 mg/L β-cyclodextrin (1:20). The dense surface is on the Left of all images. Images are for samples taken after processing 125 mL permeate volume (Left), 250 mL permeate volume (Middle), and 500 mL permeate volume (Right). The scale indicator is 10 μm in diameter. ....................................................................................................................................72 Figure 3.6: Intensity profiles for the cross-sectional CLSM images of β-cyclodextrin/β-cyclodextrin–RITC binding (Figure 3.5) within an asymmetric 0.65 μm PES membrane measured 4 μm below the surface of the cross-section, after filtering (a) 50 mg/L and (b) 200 mg/L single-component solutions. Profiles are for samples taken after processing 125 mL permeate volume (●), 250 mL permeate volume (○), and 500 mL permeate volume (▼). Error bars represent the standard deviation of the measurements. ..........................................................73 Figure 3.7: Cross-sectional CLSM images of casein/casein-FITC binding within an asymmetric 0.65 μm PES membrane measured 4 μm below the surface of the cross-section. Feed comprised 25 mg/L casein (1:20 fluorescently labeled to non-labeled protein) and 150 mg/L tannic acid. The dense surface is on the Left of all images. Images are for samples taken after processing 125 mL permeate volume (Left), 250 mL permeate volume (Middle), and 500 mL permeate volume (Right). The scale indicator is 10 μm in diameter. (For interpretation of the references to color in this figure, the reader is referred to the web version of this article.) ................................74 Figure 3.8: Intensity profiles for the cross-sectional CLSM images of casein/casein–FITC binding (Figure 3.7) within an asymmetric 0.65 μm PES membrane measured 4 μm below the surface of the cross-section, after filtering a solution comprising 25 mg/L casein and 150 mg/L tannic acid. Profiles are for samples taken after processing 125 mL permeate volume (●), 250 mL permeate volume (○), and 500 mL permeate volume (▼). Error bars represent the standard deviation of the measurements ........................................................................................75 Figure 3.9: Cross-sectional CLSM images of casein/casein–FITC and β-cyclodextrin/β-cyclodextrin–RITC binding within an asymmetric 0.65 μm PES membrane measured 4 μm below the surface of the cross-section. Feed comprised 25 mg/L casein (1:20 fluorescently labeled to non-labeled protein), 150 mg/L tannic acid, and 50 mg/L β-cyclodextrin (1:20 fluorescently labeled to non-labeled polysaccharide). The dense surface is on the Left of all images. TOP row images are for samples taken after processing 125 mL permeate volume: casein (Left), β-cyclodextrin (Middle), superimposed image of casein and β-cyclodextrin (Right). Second row images are for samples taken after processing 250 mL permeate volume. Bottom row images are for samples taken after processing 500 mL permeate volume. The scale indicator is 10 μm in diameter. .....................................................................................................................76 Figure 3.10: Cross-sectional CLSM images of casein/casein–FITC and β-cyclodextrin/β-cyclodextrin–RITC binding within an asymmetric 0.65 μm PES membrane measured 4 μm

below the surface of the cross-section. Feed comprised 25 mg/L casein (1:20 fluorescently labeled to non-labeled protein), 150 mg/L tannic acid, and 200 mg/L β-cyclodextrin (1:20 fluorescently labeled to non-labeled polysaccharide). The dense surface is on the Left of all images. Top row images are for samples taken after processing 125 mL permeate volume: casein (Left), β-cyclodextrin (Middle), superimposed image of casein and β-cyclodextrin (Right). Second row images are for samples taken after processing 250 mL permeate volume. Bottom row images are for samples taken after processing 500 mL permeate volume. The scale indicator is 10 μm in diameter. .....................................................................................................................78 Figure 3.11: Cross-sectional CLSM images of casein/casein–FITC and β-cyclodextrin/β-cyclodextrin–RITC binding within an asymmetric 0.65 μm PES membrane measured 4 μm below the surface of the cross-section. Feed comprised 25 mg/L casein (1:20 fluorescently labeled to non-labeled protein), 150 mg/L tannic acid, and 25 mg/L β-cyclodextrin (1:20 fluorescently labeled to non-labeled polysaccharide). The dense surface is on the Left of all images. TOP row images are for samples taken after processing 125 mL permeate volume: casein (Left), β-cyclodextrin (Middle), superimposed image of casein and β-cyclodextrin (Right). Second row images are for samples taken after processing 250 mL permeate volume. Bottom row images are for samples taken after processing 500 mL permeate volume. The scale indicator is 10 μm in diameter. .....................................................................................................................79 Figure 3.12: Intensity profiles for the cross-sectional CLSM images of casein/casein–FITC and β-cyclodextrin/β-cyclodextrin–RITC binding (Figure 3.9, Figure 3.10 and Figure 3.11) within asymmetric 0.65 μm PES membranes measured 4 μm below the surface of the cross-section, after filtering these solutions: (○) 25 mg/L casein (1:20 fluorescently labeled to non-labeled protein), 150 mg/L tannic acid, 50 mg/L β-cyclodextrin (1:20 fluorescently labeled to non-labeled polysaccharide); (●) 25 mg/L casein (1:20), 150 mg/L tannic acid, 25 mg/L β-cyclodextrin (1:20); and (▼) 25 mg/L casein (1:20), 150 mg/L tannic acid, 200 mg/L β-cyclodextrin (1:20). Top row images are fouling profiles corresponding to casein. Bottom row images are fouling profiles corresponding to β-cyclodextrin. Samples taken after processing 125 mL permeate volume (Left), 250 mL (Middle), 500 mL (Right). Error bars represent the standard deviation of the measurements. .......................................................................................81 Figure 4.1: Microfiltration set-up ..................................................................................................93
Figure 4.2: SEM image of PES membrane: a) support layer facing the feed in this study (magnification: 3500 X); b) membrane cross-section (magnification: 500 X); c) barrier layer facing away from the feed in this study (magnification: 3500 X) .................................................96 Figure 4.3: Variation of permeate flux with permeate volume for experimental conditions test
........................................................................................................................................................98
Figure 5.1: Schematic illustration of the fabrication process for the colloidal crystal template and SEM image of silica particles and template (using the 375 nm silica particles): (A) Vertical cell used to fabricate colloidal crystal template by self-assembly; (B) Colloidal crystal template after

solvent evaporation; (C) TEM image of 375 nm silica particles; (D) FESEM image of 375 nm colloidal crystal template. ............................................................................................................116 Figure 5.2: Schematic illustration of the fabrication process of ICC membranes (using the 375 nm colloidal crystal template): (A) Filling colloidal crystal template with monomer and photopolymerization; (B) Etching away the microspheres and formation of the membrane; (C) FESEM image of 375 nm colloidal crystal template filled with monomer after photopolymerization; (D) FESEM image of 375 nm ICC membrane obtained by the templating method..........................................................................................................................................117 Figure 5.3: FESEM images of ICC membranes made from 440 nm silica particles (A) top view (B) cross-section; 835 nm silica particles (C) top view (D) cross-section; commercially available PVDF membrane (E) top view (F) cross-section. ........................................................................118 Figure 5.4: Variation of UV absorption versus flow through volume for: ICC membranes made from (A) 440 nm silica particles and (B) 835 nm silica particles; (C) commercially available PVDF membrane. ........................................................................................................................120 Figure 6.1: Reaction scheme. ......................................................................................................133 Figure 6.2: Variation of grafting degree with polymerization time ............................................138 Figure 6.3: ATR-FTIR spectra for unmodified and modified membrane (2 hours initiator immobilization, 1 hour polymerization and 3 hours initiator immobilization, 4 hours polymerization). ...........................................................................................................................140 Figure 6.4: XPS spectra for the (A) carbon, (B) oxygen, and (C) nitrogen. Spectra are given for unmodified and modified membranes (2 hour immobilization, 1 and 4 hour polymerization times)............................................................................................................................................141 Figure 6.5: Average contact angle as a function of polymerization time for 20 mM sodium phosphate buffer containing 0 and 1.8 M ammonium sulfate. ....................................................143 Figure 6.6: FESEM images for (A) unmodified membrane, (B) membrane modified with 3 hour initiator immobilization, 4 hour polymerization ..........................................................................144 Figure 6.7: Typical chromatogram for BSA. The membrane was modified with a 2 hour initiator immobilization time and 4 hour polymerization time. Flow rate was constant at 1 mL/min, and the loading protein concentration was 0.1 mg BSA/mL ........................................146 Figure 6.8: Elution peaks for fractionation of lysozyme and IgG4 using gradient elution for membrane modified with 3 hour immobilization 4 hour polymerization. Flow rate was constant at 1 mL/min, and the loading protein concentration was 0.066 mg lysozyme/mL and 0.301 mg IgG4 /mL ......................................................................................................................................148

Figure 6.9: Elution peaks for fractionation of lysozyme and IgG4 using step-change elution for membrane modified with 3 hour immobilization 4 hour polymerization. Flow rate was constant at 1 mL/min, and the loading protein concentration was 0.066 mg lysozyme/mL and 0.301 mg IgG4 /mL ......................................................................................................................................149 Figure 7.1.1: Structure of cellulose, hemicellulose and lignin from lignocellulose biomass ....157 Figure 7.1.2: Schematic of cellulose with inter- and intra- hydrogen bonds .............................158 Figure 7.3.8: Calibration curve for TRS yield of cellulose hydrolysis in pure [EMIM]Cl .......168 Figure 7.4: XPS of unmodified glass substrate, SAM layer modified substrate and PIL and PSSA modified substrate synthesized with 1 h UV initiator immobilization, 8 hr ATRP initiator immobilization, 24 h ATRP, and 15 mins UV polymerization ...................................................170 Figure 7.5.1: TRS yields for cellulose hydrolysis using PSSA and PIL modified glass substrate in [BMIM]Cl and [EMIM]Cl solvents ........................................................................................171 Figure 7.5.2: Catalyst stability was tested on modified glass substrate at 130°C in [EMIM]Cl ......................................................................................................................................................172 Figure 7.5.3: TRS yields of 1% cellulose hydrolysis in a mixture of 70:30 a) [EMIM]Cl/acetonitrile (ACN), b) [EMIM]Cl/dimethylacetamide (DMAc), and c) [EMIM]Cl/γ-valerolactone (GVL) with membrane substrate (T3 scientific) at 130°C ....................................174 Figure 7.5.4: TRS yield from hydrolysis of 1% cellulose feedstock in a mixture of 50:50 [EMIM]Cl/GVL with catalysts immobilized on membrane substrate (T3 scientific) at 130°C ......................................................................................................................................................177 Figure 7.5.5: Hydrolysis of 5% cellulose in a) [EMIM]Cl and its mixture with GVL at b) 50:50 and c) 20:80 ratios using catalysts immobilized on membrane substrate (T3 scientific) at 130°C ......................................................................................................................................................179 Figure 7.5.6: Hydrolysis of dried and grinded corn components at: a) 130°C in pure IL, b) 100°C in 50:50 IL:GVL, c) 125°C in 50:50 IL:GVL ............................................................................182 Figure 7.5.7: Hydrolysis of dried and grinded kernel corn at: a) 95°C in 50:50 IL:GVL, b) 95°C in 80:20 IL:GVL, c) 95°C in 100% IL ........................................................................................185 Figure 7.5.8: Hydrolysis of pretreated NREL biomass at: a) 95°C in 100% IL, b) 95°C in 80:20 IL:GVL, c) 95°C in 50:50 IL:GVL ..............................................................................................188 Figure 7.5.9: Hydrolysis of pretreated NREL biomass at 95°C in: a) 80:20 IL:GVL b) 80:20 IL:water, c) 70:30 IL:water .........................................................................................................191

Figure 7.5.10: Hydrolysis of pretreated NREL biomass at 100°C in: a) 80:20 IL:GVL and b) IL:water, c) 70:30 IL:GVL d) 70:30 IL:water, e) 60:40 IL:GVL f) 50:50 IL:GVL ..................195 Figure 7.5.11: Hydrolysis of pretreated NREL biomass at 105°C in: a) 80:20 IL:GVL and b) 80:20 IL:water, c) 70:30 IL:water ..............................................................................................203 Figure 7.5.12: Temperature effect on hydrolysis of acid pretreated NREL biomass at 95°C, 100°C, and 105°C in: a) 80:20 IL:water, b) 70:30 IL:water .......................................................207

List of Published Papers
Chapter 2 Marroquin, M., Vu, A., Bruce, T., Powell, R., Wickramasinghe, Husson, S. Location and quantification of biological foulants in a wet membrane structure by cross-sectional confocal laser scanning microscopy. Journal of Membrane Science, 453, 282-291, 2014. Chapter 3 Marroquin, M., Vu, A., Bruce, T., Wickramasinghe, S. R., Zhao, LX., Husson, S. Local of Biological Foulant within a Wet Membrane Structure. Journal of Membrane Science, 465, 1-13, 2014. Chapter 4 Vu, A., Darvishmanesh, S., Marroquin, M., Husson, S. M., Wickramasinghe, S. R.. Fouling of Microfiltration membrane by biopolymers. Separation Science and Technology, 51(8), 2016. Chapter 5 Vu, A., Wang, X., Wickramasinghe, S. R., Yu, B., Yuan, H., Cong, H., Luo, Y., Tang, J. Inversed colloidal crystal membranes for hydrophobic interaction chromatography. Journal of Separation Science, 38(16), 2015. Chapter 6 Vu, A., Qian, X., Wickramasinghe, S. R.. Membrane-based hydrophobic interaction chromatography. Separation Science and Technology, 52(2):1-12, 2016

1
Chapter 1
Introduction
1.0 Introduction
Synthetic membranes, usually made of polymeric or ceramic materials, are routinely used
for separations. The phases to be separated are placed on either side of the membrane. The
membrane controls the rate of mass transfer between the phases. Typically, the two phases
consist of a liquid or gas. The membrane itself can be dense and homogeneous or heterogeneous
with fluid filled pores. Different technique or materials in synthesis will make the membrane
more homogenous or heterogeneous 1. Indeed, membrane can be made from various materials.
They are separated into two groups, organic and inorganic. Numerous polymers such as
polytetrafluoroethylene, polyester, polyether sulfone, poly (ethylene terephthalate), regenerated
cellulose etc. are used for commercial polymeric membranes. Inorganic membranes comprise in
materials that do not contain carbon atom in their main chains. It could be metallic (copper,
silver, gold, nickel, palladium), ceramic (aluminum, titanium or silica oxide), or zeolite
membranes (zeolite X & Y; zeolite ZSM-5 or silicalite-1; zeolite ZSM-12 and zeolite Theta-1 or
ZSM-22) 2–7 . Membranes are used in a wide variety of fields ranging from biomedical devices,
bioseparations, water treatment recovery and use, gas separations and the production of biofuels
and chemicals 8.
Membrane based separations are commercially attractive for a number of reasons. Often
they are cheaper to operate than competing technologies. Perhaps the best example is reverse
osmosis for desalination of sea water which is significantly cheaper than competing
technologies. Three of the basic categories of water purification technologies that are used for
desalination are membrane technologies, distillation process (thermal technologies), and

2
chemical approaches, where membrane process is the most common technique for desalination
application nowadays, especially reverse osmosis (RO). This physical process uses a hydrostatic
pressure to drive water through the membrane. It is an effective technique to remove total
dissolved solid (TDS) which concentrated up to 45000 mg/L. RO only needs the energy to
operate the pumps that realize the pressure applied to feedwater depending on its TDS
concentration 8,9.
In the biopharmaceutical industry, the easy scale up of membrane processes compared to
packed beds has led to the development of membrane absorbers. Column chromatography is an
exciting technology in biotechnology industry for the separation and purification of proteins and
pharmaceuticals. Packed bed is a traditional method for chromatography. A packed bed is
normally a hollow tube pipe, column, or other vessel that is filled with packing materials which
are small objects like raschig rings, beads, or even catalyst particles and zeolite pellets. However,
packed bed chromatography suffers from many limitations.
Membrane adsorber is a subset of much larger group of membrane based separation
devices known as membrane contactors. Common examples include non-dispersive gas-liquid
and liquid-liquid contactors. Membrane adsorber represent liquid-solid contactor 10-11. It is a
microporous membranes with functional ligand grafted from the surface and pore wall.
Membrane adsorber has been used commonly for removing contaminants 12–15. The study of
membrane adsorber with attached ligand from surface of the membrane pore was presented by
Brandt et al 16.
For applications such as treatment of wastewaters, membrane processes are more
environmentally benign, especially if addition of coagulants is minimized. Coagulation in water
treatment is the process that combines small particles into larger aggregates for better stability.

3
Adding coagulant prior the filtration helps not only reduce membrane fouling but also remove
the organic matters. However, the conditions need to be optimized in order to obtain the best
result 9,17.
Use of a catalytic membrane can lead to significant process intensification. Here the
membrane catalyzes a reaction and separates the reaction products in one step. A platinum-
impergnated Vycor glass membrane was designed and operated in such a way as to have
catalytic reaction of cyclohexene dehydrogenation in the membrane itself. The research
demonstrated the possibility of achieving conversion above the original equilibrium conversion
based on the feed conditions by combining the selective separation effect of membrane and
catalytic function of transition metals 7.
Finally membranes processes fill many niche applications where competing technologies
are unsuitable such as blood oxygenation and kidney dialysis. First attempts of oxygenating
blood outside the body were made in 19th century indicate a development of technology for
oxygenation of blood. Membrane oxygenators in current use utilize microporous, silicon or
polypropylene membranes. They can be grouped into 3 principle types, plate oxygenators, spiral
oxygenators and hollow fiber oxygenators. Recent biomaterials that was used as inert structural
materials sometime has an interaction with tissues and organs. Suitable bioactive materials
should be able to show the biocompatibility, blood compatibility, and biodegradability18,19. Many
materials had been investigated and used for kidney dialysis membranes, artificial organs, drug
delivery matrices, and tissue engineering scaffolds. Murugesan20 mentioned a special way to
improve the blood compatible and preventing the blood clots. Heparin is well-known as an
anticoagulant, blood thinner, that prevent the formation of blood clots in veins, arteries, or
lungs21.

4
Since it is the membrane surface that contacts the two fluid phases, membrane surface
properties are critical for optimizing performance of the membrane. Membrane surface
properties can be tuned to minimize fouling, maximize adsorption/desorption in chromatographic
applications and to impart catalytic activity. This thesis, which focuses on advanced membrane
for engineering applications discusses these aspects of solute membrane surface interactions.
The thesis is divided into three parts.
PART 1 Direct observation and suppression of membrane fouling
This section is based on the following published manuscripts.
Location and quantification of biological foulants in a wet membrane structure by cross-
sectional confocal laser scanning microscopy
Milagro Marroquina, Anh Vub, Terri Brucec, S. Ranil Wickramasingheb, Scott M. Hussona,*
aDepartment of Chemical and Biomolecular Engineering and Center for Advanced Engineering
Fibers and Films, Clemson University, Clemson, SC 29634, USA
bRalph E. Martin Department of Chemical Engineering, University of Arkansas, Fayetteville, AR
72701 USA
cDepartment of Biological Sciences, Clemson University, Clemson, SC 29634, USA
*In this paper, my work is analyzing the particles size, conducting all filtration experiments, and
then generating blocking models based on the results. And then finally, the membranes were sent
to Clemson University to analyze with Confocal Laser Scanning Microscopy.

5
Evaluation of fouling mechanisms in asymmetric microfiltration membranes using
advanced imaging
Milagro Marroquina, Anh Vub, Terri Brucec, S. Ranil Wickramasingheb, Lixin Zhaoa,‡, Scott
M. Hussona,*
aDepartment of Chemical and Biomolecular Engineering and Center for Advanced Engineering
Fibers and Films, Clemson University, Clemson, SC 29634, USA
bRalph E. Martin Department of Chemical Engineering, University of Arkansas, Fayetteville, AR
72701 USA
cDepartment of Biological Sciences, Clemson University, Clemson, SC 29634, USA
‡Current address: College of Mechanical Science and Engineering, Northeast Petroleum
University, Daqing, 163318, China
*In this paper, my work is analyzing the particles size, conducting all filtration experiments, and
then generating blocking models based on the results. And then finally, the membranes were sent
to Clemson University to analyze with Confocal Laser Scanning Microscopy.
Fouling of microfiltration membranes by biopolymers
Anh Vua, Siavash Darvishmanesha, Milagro Marroquinb, Scott M. Hussonb, S. Ranil
Wickramasinghea,*
aRalph E. Martin Department of Chemical Engineering, University of Arkansas, Fayetteville, AR
72701, USA

6
bDepartment of Chemical and Biomolecular Engineering, Clemson University, Clemson, SC
29634, USA
*In this paper, all experimental works were conducted by me.
PART 2 Membrane adsorbers for hydrophobic interaction chromatography
This section is based on the following published manuscripts
Inverse colloidal crystal membranes for hydrophobic interaction membrane
chromatography
Anh T. Vu.1, Xingying Wang2, S. Ranil Wickramasinghe1, Hua Yuan3, Hailin Cong3, Yongli
Luo3, and Jianguo Tang3.
1Ralph E Martin Department of Chemical Engineering, University of Arkansas, Fayetteville, AR
72703, USA
2Department of Chemical and Biological Engineering, Colorado State University, Fort Collins,
CO 80523, USA
3Laboratory for New Fiber Materials and Modern Textile, Growing Base for State Key
Laboratory, College of Chemical Engineering, Qingdao University, Qingdao, 266071, China
*In this paper, my work is making membranes and testing water flux filtration and protein
binding capacity.

7
Responsive membrane for hydrophobic interaction chromatography
Anh Vu1, Xianghong Qian2, S. Ranil Wickramasinghe1
1Ralph E Martin Department of Chemical Engineering, University of Arkansas, Fayetteville, AR
72701, USA;
2Department of Biomedical Engineering, University of Arkansas, Fayetteville, AR 72701, USA
*All experimental work was conducted by me.
PART 3 Catalytic membranes for biomass hydrolysis
This section focuses on the development of catalytic membranes for lignocellulosic
biomass hydrolysis. Lignocellulosic biomass represents an abundant source of renewable energy;
however, it is highly recalcitrant. This is a great need to develop efficient unit operations for
hydrolysis as well as recovery and purification of biofuels and chemicals. Here the potential of
significant process intensification by development of a catalytic membrane is explored.
1.1 Direct observation and suppression of membrane fouling
In pharmaceutical, food, and especially beverage industry, prior to the operation of
ultrafiltration, reverse osmosis or crystallization, microfiltration (MF) is a general and typical
filtration process which is used and applied for clarification, sterilization, stabilization and pre-
treatment 22. Interest in microfiltration is increase among multiple types of beverage processing,
milk, tea, soft drinks, alcohol, fruit juices. MF has been applied to sterilize and remove yeast
cells, chill and permanent haze flocs in beer industry. Additionally, MF is also an effective

8
technique in separating or removing fats, bacteria, proteins in dairy product industry. However,
filtration of these streams suffers from permeate flux decline caused by membrane fouling 23.
Membrane fouling is the a phenomenon where the solution or particle compounds deposit
on the membrane surface or in the pores which cause negative effects on the performance of the
membrane and increases the operating cost by requiring frequent membrane
cleaning/replacement. Additionally, membrane fouling can compromise the properties of the
final product, for example percentage of yield and selectivity. In general, fouling can be caused
by particulate matter with a size equal to or larger than the nominal pore size of the MF
membrane that completely or partially block the pores. However, many of the components which
have much smaller size compared to the pore size, like proteins, polysaccharides and
polyphenols that are presented in the feed solutions can foul MF membrane by absorbing to
membrane surfaces and pore walls 24. On the other hand, the interactions between proteins,
polysaccharides and polyphenols also cause the membrane fouling 25,26.
In previous work, it has been shown that polyphenols forms a crosslinks with protein
molecules, forming insoluble aggregates due to hydrophobic and/or hydrogen bonding
interactions. However, the appearance of polysaccharides are able to break and disrupt the
binding of polyphenols to proteins by molecular association between the polysaccharides and
polyphenols or by forming complexes among protein, polyphenol and polysaccharide molecules
26–28. In addition, protein and carbohydrates are able to interact to each other to form plugging
agents 29. Membrane-solute interactions may also affect the fouling of the membrane. For
example, Ulbricht at al30 reported that dextran and myoglobin significantly fouled
polyethyersulfone (PES) membrane compare to cellulose membrane.

9
Understanding how fouling occurs is the first step toward developing fouling mitigation
strategies for microfiltration of biological streams. Characterization of membrane fouling by
proteins, polysaccharides and/or polyphenols is necessary 26,30,31. Those studies were investigated
observing the reduction in relative flux profiles. Moreover, the fouled membranes were then
characterized with infrared (IR) spectroscopy, contact angle, and zeta potential to quantify the
degree of fouling at the surface of the membranes. In addition, atomic force microscopy (AFM)
and scanning electron microscopy (SEM) have been used to visualize the fouled membrane
surface 30,31. However, these techniques require precisely preparation protocols, and they are not
able to distinguish components that fouled the membranes.
In order to overcome the limitations of characterization techniques mentioned above,
confocal laser scanning microscopy (CLSM) is a recent technology that has become an important
new tool for studying membranes. Briefly, CLSM is able to characterize by focusing light into a
small spot on a single plane at a selected depth within the membrane structure. Images are
recorded at different depths by changing the position of the focal plane. With CLSM application,
foulants can be located individually within the membrane at specific depth of penetration. In
addition, cross-sectional CLSM imaging method provides images throughout the entire thickness
of the membrane, which can help to locate biological foulants in a wet membrane structure post-
filtration 32,33.
The objectives of this project were to determine interaction of protein, polyphenol, and
polysaccharide in single component feed mode or in mixture of two or three components.
Finally, investigate the type of fouling or location of foulants on wet microfiltration membrane
by using CLSM. Indeed, first important aim here is quantifying the amount of foulants at
different depths within the membrane as a function of volume processed by using CLSM.

10
Secondly, the combination results of flux decline and CLSM images of membranes at different
degrees of fouling can provide insights on the reasons for observed fouling of membrane
performance. Finally, interaction between fluorescently labeled protein-polysaccharide
investigations can also be studied for searching of evidence of fluorescence resonance energy
transfer (FRET). In this study, casein and dextran were used as the model protein and
polysaccharide respectively, where polyphenols are either tannic acid or catechin.
1.2 Membrane absorber for hydrophobic interaction chromatography
A traditional packed bed is normally a hollow tube pipe, column, or other vessel that is
filled with packing materials which are small objects like raschig rings, beads, or even catalyst
particles and zeolite pellets.

11
Figure 1.1: Packed bed column
However, packed bed chromatography suffers from many limitations. High pressure-drop
across the column due to media deformation is one of the examples of the limitations of packed
bed chromatography. The back pressure is normally much lower through a macroporous
membrane compared to a packed bed/bead column due to the larger pores and open structure.
Thus faster flow rates can be utilized without, due to convective impurity transport to all binding
sites, any loss in binding capacity which leads to decreased processing time during
manufacturing which results in substantial cost saving.

12
Another limitation that packed beds suffer from is slow pore diffusion through the
internal pores of porous particles, which leads to early breakthrough and incomplete usage of the
packed bed. Membrane absorbers overcome the disadvantages of packed bed and are alternative
to traditional packed columns. Membrane adsorber is a subset of much larger group of
membrane based separation devices known as membrane contactors. Common examples include
non-dispersive gas-liquid and liquid-liquid contactors 34. Membrane adsorber represents liquid-
solid contactor. It is a microporous membranes with functional ligand grafted from the surface
and pore wall. Membrane adsorber has been used commonly for removing contamination 13,34-35.
First study of membrane adsorber with attached ligand from surface of macro-porous membrane
was presented by Brandt et al 16.
Figure 1.2: Existing transport phenomena in conventional beads and Membrane Adsorbers 36
The large pore diameter allows convective transport of all impurity species to all binding
ligands on both the external and internal pore surfaces. Ideally binding is limited by binding
kinetics only. Therefore binding capacity is theoretically independent of flow rate in
convectively-driven binding processes like within membrane adsorber, at least at flow rates

13
useful to protein purification. Figure 1.3 provides a visual illustration of this point showing
electron micrographs of both a porous bead and membrane adsorber with icons show transport of
impurities to binding sites 36.
Hydrophobic interaction chromatography-Inversed colloidal crystal membrane (ICC)
An inverse colloidal crystal (ICC) substrate is a macro-porous material that has a three
dimensional ordered pore structure. After the first report in 1990’s, making ICC material using
colloidal crystal as template has been broadly investigated in many different fields. Because of
its special structures, including its highly periodical structure, high volume pores and uniform
pore size, ICC has been used for many applications, especially membrane.
Membrane adsorbers are investigated here based on advantages of ICC membranes as
they have high porosity and highly interconnected and uniform pore structure will lead to low
pressure drop and uniform flow through the membrane. Both of those two advantages are perfect
designs for membrane adsorbers. Moreover, the surface area of ICC membrane is very high and
controllable which helps for solute binding capacity. In this study, the membrane can be used as
microfiltration or ultrafiltration where the solute is monoclonal antibody, IgG4. Binding
mechanism is simply based on hydrophobic interaction membrane chromatography which is the
same as resin based hydrophobic interaction chromatography.
Hydrophobic interaction chromatography- Responsive membrane for hydrophobic interaction
chromatography (HIC-HIMC)
Based on bind and elute operation, membrane adsorber can be used for hydrophobic
interaction chromatography (HIC). This powerful technique was initially described by Shepard
and Tiselius (1949) using the term “salting-out chromatography 37,38.” Later 1973, Hjerten
successfully represented the HIC technique as “hydrophobic interaction chromatography” by

14
retaining proteins on weakly hydrophobic matrices in the presence of salt 39. Traditional HIC is
based on the reversible interactions between hydrophobic surface patches on proteins and
hydrophobic ligands attached to chromatographic resin particles 40. During the process, proteins
are normally bound at high salt concentration and eluted with decreasing salt concentration
buffers. Depending on the structure and hydrophobicity of the each protein, binding capacity and
recovery yield will be different 41.
Protein binding depends on the media. Hydrophobic media is mostly used in HIC where
the driving force is typically salt concentration 42,43. And many proteins “salt out” of solution
below the optimal binding salt concentration. As a result, the binding capacity is much lower
than in ion-exchange media, which is about 50 g/L. The other limitation lies in desorption of
bound protein from the hydrophobic media. Elution of proteins from HIC media is accomplished
either through decreased salt concentration and/or introduction of chemicals, such as organics or
chaotropes, which disrupt hydrophobic interactions 44. However, some proteins do not fully
desorb from salt media which lead to lower recovery. Therefore, using low or no salt media, or
hydrophobic ligands that become more hydrophilic in lower salt solution will increase the
recovery yield 45. The method is used commonly in downstream process as an industrial scale for
protein separation and purification.

15
Figure 1.3: Hydrophobic interaction chromatography outline 10.
Over the years, HIC has been developed and improved in order to fulfill the needs of
different purification applications. Membrane based HIC, hydrophobic interaction membrane
chromatography (HIMC), affords all the advantages of the membrane adsorber, which are
dynamic capacities that are independent of flow rate, higher throughput and easy to scale up. In
this study, we focus on the use of stimuli-responsive membranes for HIC. One of the most
interesting characteristics of the stimuli-responsive membranes is that they can change the
physiochemical properties due to change in environmental conditions, such as pH, temperature,
ionic strength, etc, then, they could promote separation during elution.

16
1.3 Catalytic membrane for biomass hydrolysis
Here we explore the use of surface modification to develop an advanced membrane
which is grafted with novel polymeric solid acid catalysts for lignocellulosic biomass hydrolysis
and dehyration. Lignocellulose or cellulosic biomass is an abundant leading biomass resource for
renewable energy and replacement for fossil-based transportation fuel. In general, Cellulose
contains 38-50%, and hemicellulose covers 23-32% where lignin holds 15-25% of biomass.
Cellulose is a polymer of β (1, 4)-linked cellubiose residues. It is a very complex
substrate with amorphous, semi-crystalline and crystalline structures which contains strong and
extensive hydrogen bonding networks. Qian et al 46,47 clearly stated that cooperativity of
hydrogen bonding interaction in crystalline structure amplified the hydrogen bonding interaction
energy to 50% compared to non-cooperative hydrogen bonding energy in other polysaccharide.
And that is the reason made cellulosic biomass become a recalcitrant substrate to depolymerize.
Many pretreatment methods have been studied. However, each method still suffers with
its own disadvantages. For example, method of pretreatment with dilute sulfuric acid,
hydrochloric acid, and nitric acid has been the leading and famous technology because this
technique has ability to improve the release of lignin from hemicellulose and decrystallization of
the cellulose. This technique is normally conducted at hash condition, for example 140-200°C, 4-
15psi, and the residue time is around 5-30mins. It could perform in batch with presoaking period,
or employ a continuous flow acid over the biomass (ionic liquid pretreatment...IL recycle). On
the other hand, the cost of this reagent is normally high and it is hard to recover and recycle.
Moreover, sulfuric acid is not an environmental favorite because of its highly hazardous.
Moreover, not only having ability to open up the biomass structure, thermos-chemical
pretreatment of biomass also has been recognized as a critical step to produce cellulose with
17
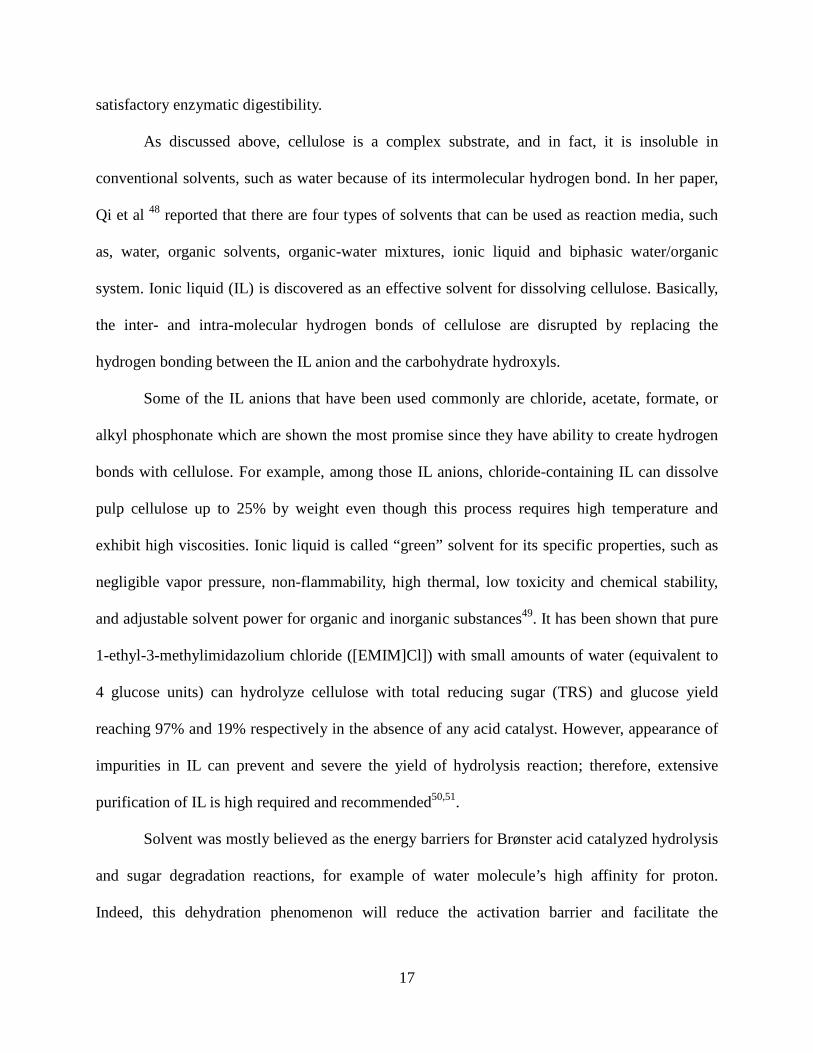
satisfactory enzymatic digestibility.
As discussed above, cellulose is a complex substrate, and in fact, it is insoluble in
conventional solvents, such as water because of its intermolecular hydrogen bond. In her paper,
Qi et al 48 reported that there are four types of solvents that can be used as reaction media, such
as, water, organic solvents, organic-water mixtures, ionic liquid and biphasic water/organic
system. Ionic liquid (IL) is discovered as an effective solvent for dissolving cellulose. Basically,
the inter- and intra-molecular hydrogen bonds of cellulose are disrupted by replacing the
hydrogen bonding between the IL anion and the carbohydrate hydroxyls.
Some of the IL anions that have been used commonly are chloride, acetate, formate, or
alkyl phosphonate which are shown the most promise since they have ability to create hydrogen
bonds with cellulose. For example, among those IL anions, chloride-containing IL can dissolve
pulp cellulose up to 25% by weight even though this process requires high temperature and
exhibit high viscosities. Ionic liquid is called “green” solvent for its specific properties, such as
negligible vapor pressure, non-flammability, high thermal, low toxicity and chemical stability,
and adjustable solvent power for organic and inorganic substances49. It has been shown that pure
1-ethyl-3-methylimidazolium chloride ([EMIM]Cl]) with small amounts of water (equivalent to
4 glucose units) can hydrolyze cellulose with total reducing sugar (TRS) and glucose yield
reaching 97% and 19% respectively in the absence of any acid catalyst. However, appearance of
impurities in IL can prevent and severe the yield of hydrolysis reaction; therefore, extensive
purification of IL is high required and recommended50,51.
Solvent was mostly believed as the energy barriers for Brønster acid catalyzed hydrolysis
and sugar degradation reactions, for example of water molecule’s high affinity for proton.
Indeed, this dehydration phenomenon will reduce the activation barrier and facilitate the

18
hydrolysis reaction, similar to the microenvironment in the catalytic tunnel of cellulose enzymes.
Based on this concept, polymeric solid acid catalysts immobilized on a supporting substrate
could potentially create a partially dehydrated microenvironment that is inductive for the
hydrolysis reaction. In this study, dual functional nanostructures are synthesized to help
solubilize cellulose and catalyze its hydrolysis reaction. Poly (styrene sulfonic acid) (PSSA)
chains are immobilized on surfaces of ceramic membrane substrates and used to catalyze
biomass hydrolysis. Its neighboring poly (vinyl Imidazolium chloride) ionic liquid (PIL) chains
are grafted from the surface to help solubilize lignocellulosic biomass and enhance the catalytic
activity.
Atom transfer radical polymerization (ATRP) was used to immobilize the acidic PSSA
polymer chains. On the other hand, its neighbor, PIL, was synthesized via UV-initiated radical
polymerization. Each method of polymerization will control the grafting of one specific polymer
only. The two chains were grafted randomly from the surface of ceramic membrane substrates.
Those two nanostructure polymer chains can be tuned independently the ratio as well as the
chain length and chain density in order to obtain the best hydrolysis reaction results with
optimize catalytic activity.
References:
1. Basile, A., Cassano, A., and Rastogi, N. K. Advances in Membrane Technologies for Water Treatment: Materials, Processes and Applications. Amsterdam: Elsevier/Woodhead, 2015. Print. 2. Mulder, M. Basic principles of membrane technology. Kluwer Academic Publishers, 1996. 3. Byeon, J. H., Hwang, J. Fabrication of a metal membrane on a perforated polymer substrate by palladium aerosol activation and subsequent electroless plating. ACS Appl. Mater, Interfaces, 1: 261–265, (2009).

19
4. Ciora, R. J., Liu, P. K. T. Ceramic Membranes for Environmental Related Applications. Fluid/Particle Sep. J., 15: 51–60, (2003). 5. Daramola, M. O., Aransiola, E. F., Ojumu, T. V. Potential applications of zeolite membranes in reaction coupling separation processes. Materials (Basel), 5: 2101–2136, (2012). 6. Feng, C., Khulbe, K. C., Matsuura, T., Farnood, R., Ismail, F. Recent Progress in Zeolite/Zeotype Membranes. J. Membr. Sci. Res., 1: 49–72, (2015). 7. Hao, Q., Zeng, Y., Juluri, B. K., Wang, X., Kilary, B., Chiang, I., Jensen, L., Werner, D. H., Crespi, V. H., Huang, T. J. Metallic membranes with subwavelength complementary patterns: Distinct substrates for surface-enhanced raman scattering. ACS Nano, 5: 5472–5477, (2011). 8. Younos, T., Tulou, K. E. Overview of Desalination Techniques. J. Contemp. Water Res. Educ., 132(1): 3–10, (2005). 9. Lee, J.-D., Lee, S.-H., Jo, M.-H., Park, P.-K., Lee, C.-H., Kwak, J.-W. Effect of Coagulation Conditions on Membrane Filtration Characteristics in Coagulation−Microfiltration Process for Water Treatment. Environ. Sci. Technol., 34(17): 3780–3788, (2000). 10. Kumar, M. A. "Bio-Resource." Hydrophobic Interaction Chromatography - Theory and Principle. N.p., 01 Jan. 1970. Web. 20 June 2017. 11. Kovvali, A.S., Sirkar, K. K. New Insights into Membrane Science and Technology: Polymeric and Biofunctional Membranes (ed. Bhattacharyya, D., Butterfield, D. A.) 147–164 (2003). 12. Ghosh, R. Review: protein sepration using membrane chromatography: opportunities and challenges. J. Chromatogr. Achromatography, 952: 13–27, (2002). 13. Specht, R., Han, B., Wickramasinghe, S. R., Carlson, J. O., Czemark, P., Wolf, A., Reif, O. W. Densonucleosis virus purification by ion exchange membranes. Biotechnol. Bioeng., 88: 465–473, (2004). 14. Wickramasinghe, S. R., Carlson, J. O., Teske, C., Hubbuch, J. & Ulbricht, M. Characterizing solute binding to macroporous ion exchange membrane adsorbers using confocal laser scanning microscopy. J. Memb. Sci., 281: 609–618, (2006). 15. Thoemmes, J., Kula, M.-R. Membrane chromatography - an integrative concept in the downstream processing of proteins. Biotechnol. Prog., 11: 357–367, (1995). 16. Brandt, S., Goffe, R. A., Kessler, S. B, O'Connor, J. L., Zale, S. E. Membrane based affinity technology for commercial scale purification. Nat. Biotechnol., 6: 779–782, (1988).

20
17. Wiesner, M. R., Clark, M. M., Mallevialle, J. Membrane Filtration of Coagulated Suspensions. J. Environ. Eng., 115: 20–40, (1989). 18. Cioci, F., Lavecchia, R., Mazzocchi, P. An enzymatic membrane reactor for extracorporeal blood oxygenation. Chemical Engineering Science, 54(15-16): 3217–3219, (1999). 19. Drummond, M., Braile, D. M., Lima-Oliveira, A. P. N., Camim, A. S., Oyama, R. S. K., Sandoval, G. H. Technological evolution of membrane oxygenators. Braz J. Cardiovasc Surg., 20 (4): 432–437, (2005). 20. Murugesan, S., Mousa, S., Vijayaraghavan, A., Ajayan, P. M., Linhardt, R. J. Ionic Liquid-Derived Blood-Compatible Composite Membranes for Kidney Dialysis. Journal Biomed Mater Res B Appl Biomater, 79 (2): 298–304, (2006). 21. Sun, Y. M. & Khang, S. J. Catalytic membrane for simultaneous chemical reaction and separation applied to a dehydrogenation reaction. Ind. Eng. Chem. Res., 27: 1136–1142, (1988). 22. Hubbard, A. T. Encyclopedia of surface and colloid science. Newyork: Marcel Dekker, (2002). Print. 23. Berk, Z. Food process engineering and technology. S.I.: Elservier Academic (2017). Print. 24. Czekaj, P., López, F., Güell, C. Membrane fouling during microfiltration of fermented beverages. Journal of Membrane Science, 166 (2): 199–212, (2000). 25. Loh, S., Beuscher, U., Poddar, T. K., Porter, A. G., Wingard, J. M., Husson, S. M., Wickramasinghe, S. R. Interplay among membrane properties , protein properties and operating conditions on protein fouling during normal-flow microfiltration. Journal of Membrane Science, 332 (1-2): 93–103, (2009). 26. Zator, M., Ferrando, M., López, F. & Güell, C. Microfiltration of protein / dextran / polyphenol solutions : Characterization of fouling and chemical cleaning efficiency using confocal microscopy. Journal of Membrane Science, 344 (1-2): 82–91, (2009). 27. Carvalho, E., Jo, M., Mateus, N., Freitas, V. D. Application of flow nephelometry to the analysis of the influence of carbohydrates on protein – tannin interactions. Journal of Science of Food and Agriculture, 86 (6): 891–896, (2006). 28. Soares, S. I., Rui M, G. A., Iva, F., Nuno, M., Victor, D. F. Mechanistic Approach by Which Polysaccharides Inhibit r -Amylase / Procyanidin Aggregation. 4352–4358, (2009). 29. Starbard, N. Beverage industry microfiltration. Ames, IA: Wiley Blackwell, 2009. Print.

21
30. Susanto, H., Franzka, S., Ulbricht, M. Dextran fouling of polyethersulfone ultrafiltration membranes — Causes , extent and consequences. J. Memb. Sci., 296: 147–155, (2007). 31. Vernhet, A., Moutounet, M. Fouling of organic microfiltration membranes by wine constituents : importance , relative impact of wine polysccharides and polyphenols and incidence of membrane properties. J. Memb. Sci., 201 (1-2): 103–122, (2002). 32. Marroquin, M., Bruce, T., Pellegrino, J., Wickramasinghe, S. R. & Husson, S. M. Characterization of asymmetry in microporous membranes by cross-sectional confocal laser scanning microscopy. J. Memb. Sci., 379: 504–515, (2011). 33. Zator, M., Ferrando, M. Membrane fouling characterization by confocal microscopy during filtration of BSA / dextran mixtures. J. Memb. Sci., 301 (1-2): 57–66, (2007). 34. Bhattacharyya, D., Butterfield, D. A. New Insights into Membrane Science and Technology: Polymeric and Biofunctional Membranes. Amsterdam: Elsevier, 2003. Print. 35. Ghosh, R. Review: protein separation using membrane chromatography: opportunities and challenges. J. Chromatogr. A, 952: 13–27, (2002). 36. Sofer, G. K., Nystrom, L. E. Process chromatography: Five decades of innovation. Process Chromatogr., 5–30, (1991). 37. Mahn, A. Hydrophobic Interaction Chromatography : Fundamentals and Applications in Biomedical Engineering. 2008. 38. Shepard, C. C., Tiselius, A. The chromatography of proteins. The effect of salt concentration and pH on the adsorption of proteins to silica gel. Discuss. Faraday Soc. 7, 275-285, (1949). 39. Shaltiel, S., Er-El, Z. Hydrophobic chromatography: use for purification of glycogen synthetase. Proc. Natl. Acad. Sci. U. S. A., 70: 778–781 (1973). 40. Lienqueo, M. E., A. Mahn, J. C. Salgado, and J. A. A. Current insights on protein behaviour in hydrophobic interaction chromatography. J. Chromatogr. B. Analyt. Technol. Biomed. Life Sci., 849: 53–68 (2007). 41. Chen, J., Luo, Q., Breneman, C. M., Cramer, S. M. Classification of protein adsorption and recovery at low salt conditions in hydrophobic interaction chromatographic systems. J. Chromatogr. A, 1139: 236–246 (2007). 42. Gagnon, P., Mayes, T. & Danielsson, Å. An adaptation of hydrophobic interaction chromatography for estimation of protein solubility optima. J. Pharm. Biomed. Anal., 16: 587–592 (1997).

22
43. N. Fraud, M. Kuczewski, G. Zarbis-Papastoitsis, M. H. Hydrophobic membrane adsorbers for large-scale downstream processing. Biopharm Int., 22: 24–27 (2009). 44. Tsumoto, K., Ejima, D., Nagase, K., Arakawa, T. Arginine improves protein elution in hydrophobic interaction chromatography. The cases of human interleukin-6 and activin-A. J. Chromatogr. A, 1154: 81–86 (2007). 45. Chen, J., Tetrault, J. & Ley, A. Comparison of standard and new generation hydrophobic interaction chromatography resins in the monoclonal antibody purification process. J. Chromatogr. A, 1177: 272–281 (2008). 46. Qian, X. The effect of cooperativity on hydrogen bonding interactions in native cellulose I from ab initio molecular dynamics simulations. Mol. Simul., 34, (2008). 47. Mosier, N., Wyman, C., Dale, B., Elander, R., Lee, Y. Y., Holtapple, M., Ladischm, M. Features of promising technologies for pretreatment of lignocellulosic biomass. Biosource Technology, 96 (6): 673–686 (2005). 48. Qi, X., Watanable, M., Aida, M. W., Smith, R. L. J. Catalytic dehydration of fructose into 5-hydroxymethylfurfural by ion-exchange resin in mixed-aqueous system by microwave heating. Green Chem., 10: 799–805 (2008). 49. Hu, S., Zhang, Z., Zhou, Y., Song, J., Fan, H., Han, B. Direct conversion of inulin to 5-hydroxymethylfurfural in biorenewable ionic liquids. Green Chemistry, 11(6): 873–877 (2009). 50. Zhang, Y., Du, H., Qian, X. & Chen, E. Y. Ionic Liquid - Water Mixtures : Enhanced K w for Efficient Cellulosic Biomass Conversion. Energy and Fuel, 2410–2417 (2010) 51. Qian, X. H., Lei, J., Wickramasinghe, S. R. Novel polymeric solid acid catalyst for cellulose hydrolysis. RSC Adv., 3: 24280–24287 (2013).

23
PART 1 Direct observation and suppression of membrane fouling
Chapter 2
Location and Quantification of Biological Foulants in a Wet Membrane Structure by
Cross-sectional Confocal Laser Scanning Microscopy1
Summary
Microfiltration of solutions containing proteins and polysaccharides suffers from permeate flux
decline caused by membrane fouling, despite the small size of these species relative to the
nominal membrane pore size. To develop fouling mitigation strategies for microfiltration of
biological streams, it is important to understand the mechanisms that lead to fouling. In this
contribution, we discuss the use of confocal laser scanning microscopy (CLSM) to determine
where proteins and polysaccharides deposit inside polymeric microfiltration membranes when a
fluid containing these materials is filtered. By using fluorescently labeled probes, CLSM
permitted evaluation of the location and extent of fouling by individual components (protein:
casein and polysaccharide: dextran) within wet, asymmetric polyethersulfone microfiltration
membranes. By labeling the protein and polysaccharide with different fluorophores, we were
able to locate each component separately and to visualize co-localization within the membrane.
In addition, flux profiles and cross-sectional CLSM images were obtained for membranes that
processed single-component solutions and mixtures to better understand the role of each on
membrane fouling and to see how component interactions impact the fouling profiles. Analysis
of the CLSM images at different levels of fouling for single-component solutions and mixtures
1 Marroquin, M., Vu, A., Bruce, T., Wickramasinghe, S. R., Husson, S. M. Location and Quantification of Biological Foulants in a Wet Membrane Structure by Cross-sectional Confocal Laser Scanning Microscopy. Journal of Membrane Science. 453, 282-291 (2014)

24
provided concentration profiles versus depth for each individual component present in the feed
solution. Using a new cross-sectional imaging protocol that we developed in a previous
investigation, we were able to visualize fouling profiles throughout the entire thickness of the
membrane, overcoming limitations of depth of penetration observed in previous CLSM work.
2.1 Introduction
Microfiltration (MF) is used in the food and beverage industry on a large scale for
clarification, sterilization (bacteria/microorganism removal), stabilization and pre-treatment prior
to unit operations such as ultrafiltration, reverse osmosis or crystallization (to ensure high quality
of crystals) 1. Processing of milk, beer, soft drinks, whisky, fruit juices, edible oils and vinegar
are a few examples where MF is applied. In beer production, MF is used for sterilization and for
removal of any remaining yeast cells, chill and permanent haze flocs (protein-polyphenol
aggregates), and other components that prevent its final crisp clarity. In the dairy product
industry, MF is used to separate fats, remove bacteria and maintain protein levels in the milk year
round for automated cheese making 2. However, filtration of these streams suffers from permeate
flux decline caused by membrane fouling.
Fouling negatively affects the performance of the membrane and increases the operating
by requiring frequent membrane cleaning/replacement and consequently higher energy
consumption. Further, membrane fouling can compromise the properties of the final product. For
example, in the dairy product industry, fouling can influence the rejection of caseins and whey
proteins, altering the quality of the final product. Fouling can be caused by particulate matter
with a size equal to or larger than the nominal pore size of the MF membrane (e.g., cellular
components, microorganisms, fat globules, etc.) that completely or partially block the pores. In
addition, components like proteins, polysaccharides and polyphenols that are present in the feed

25
solutions can foul microfiltration membranes despite having a much smaller size relative to the
nominal pore diameter of the membranes 3. These components tend to adsorb to the pore walls
constricting it over time. During MF, the extent of fouling depends on a number of factors that
include operating conditions, feed and membrane properties 4. In addition to these factors, solute-
solute interactions among components commonly found in the feed (e.g. proteins,
polysaccharides and polyphenols) have been shown to affect filtration performance significantly.
Polyphenols are thought to behave like physical crosslinkers among protein molecules, forming
insoluble aggregates due to hydrophobic and/or hydrogen bonding interactions 5. These
interactions are altered by the presence of polysaccharides, which can disrupt the binding of
polyphenols to proteins by molecular association between the polysaccharides and polyphenols
or by forming complexes among protein, polyphenol and polysaccharide molecules 6, 7, 8. Also,
protein and carbohydrates may interact to form plugging agents 9. Membrane-solute interactions
may also affect the fouling of the membrane. For example, Ulbricht and co-workers 10 reported
that dextran and myoglobin significantly fouled porous membranes and non-porous films of
polyethersulfone (PES) simply by contacting the PES with the polysaccharide or protein
solutions under static conditions. They found that the degree of fouling was less on cellulose
membranes by the same components using the same conditions.
Understanding how fouling occurs is the first step toward developing fouling mitigation
strategies for microfiltration of biological streams. Previous researchers have characterized
membrane fouling by proteins, polysaccharides and/or polyphenols 5, 10, 11. In these studies,
relative flux reductions and flux profiles of the fouled membranes were reported to characterize
how the fouling occurs and quantify its impact on performance. Infrared (IR) spectroscopy has
been used for indirect evaluation of the ‘degree’ of fouling by quantifying the increase in IR band

26
area of distinct peaks corresponding to the foulants deposited on the membrane surface 10 or the
decrease (or disappearance) in IR band area of the peaks that correspond to the clean base
membrane 12. Changes in contact angle and zeta potential have been quantified to characterize
how the foulants affect the surface properties of the polymeric membrane material. Atomic force
microscopy (AFM) and scanning electron microscopy (SEM) have been used to visualize the
fouled membrane surface 10, 11. Although AFM and SEM allow the observation of surface fouling
of membranes by proteins, polysaccharides and/or polyphenols, it is not possible to conclude
from the images how (i.e., by what mechanism) the fouling occurs when there is more than one
component involved, since it is not possible to distinguish individual components. An additional
disadvantage is that AFM and SEM only provide superficial information of the sample.
Although, it is possible to use SEM to visual the internal structure of the membrane post
filtration, doing so requires sectioning of the sample. This step introduces surface artifacts that
compromise the reliability of the information obtained from the imaging. Another requirement to
study samples with conventional SEM is that the sample must be dehydrated, preventing the
study of samples in the wet state, a disadvantage for samples prone to alteration of morphology
due to drying. Even though ESEM allows imaging of sample in a wet state and under a moderate
vacuum, obtaining clear images is difficult due the low electron density of the components in the
fouling layer (i.e. proteins, polysaccharide and polyphenols). Finally, while collecting images,
beam is damaged due to local heating and structural is collapsed due to vacuum can occur.
There is much interest to explore alternative characterization methods that may overcome
the limitations that have been mentioned above. Particularly, confocal laser scanning
microscopy (CLSM) is a recent technology that has become an important new tool for studying
membranes. Briefly, CLSM works by focusing light into a small spot on a single plane at a

27
selected depth within the membrane structure. Images are recorded at different depths by
changing the position of the focal plane 13. Thus, CLSM performs an ‘optical sectioning’ to
collect images from the membrane interior. Stacking the images from adjacent planes can create
three-dimensional volume elements. Recent studies by Zator and coworkers reported the use of
CLSM in the fluorescent mode for studying fouling of microfiltration of mixed protein-
polysaccharide 14 and protein-polysaccharide-polyphenol solutions 5. These studies were limited
to polycarbonate and polyester membranes using BSA as model protein. Confocal images were
collected after processing a fixed volume of solution, and depth of imaging was 3 micron. By
using CLSM, they were able to locate the foulants individually within the cake and within the
first 3 microns of the membrane by using foulants labeled with fluorescent dyes. Zator et al. 5
worked with foulants labeled with different dyes, and they collected images showing the location
of each foulant, represented by a different color, at different depths within the membrane. In their
conclusions, they suggest that, even though they did not find significant pore blockage by
protein, dextran and polyphenols within a depth of 3 micron from the surface of the membranes
after enzymatic cleaning, aggregates of these components may have been blocking the pores at
depths not reachable by their confocal analysis. They hypothesize that such aggregates were the
reason why the enzymatic cleaning process did not restore the water fluxes of the membranes
after cleaning. This hypothesis could not be tested due to the CLSM depth of penetration limit,
beyond which images become degraded as the emitted light (photons) originating at the focal
plane are lost due to scattering or absorption by the membrane material. In a previous publication
13, we explained the causes and consequences of the depth of penetration limit for membrane
imaging, and we developed a cross-sectional CLSM imaging method that overcomes this
limitation and provides images throughout the entire thickness of the membrane. This method

28
was used in this study to locate biological foulants in a wet membrane structure post-filtration.
The objectives of this research were to determine where proteins and polysaccharides
deposit inside a polymeric microfiltration membrane when a fluid containing these materials is
being filtered and to better understand the role of each component on membrane fouling. Using
mixed-component feeds, we sought to determine whether proteins and polysaccharides deposit
inside the membrane in the same manner or location within the wet membrane structure when
they are present together in a mixture as they do when present individually, and to investigate
how they affect one another in fouling a membrane. Our ultimate goals were (1) to use the
intensity information provided by the cross-sectional CLSM images of the fouled membranes to
quantify the amount of foulant at different depths within the membrane as a function of volume
processed; (2) to compare flux decline measurements of single-component and mixed solutions
against CLSM images of membranes at different degrees of fouling to gain insights on the
reasons for observed loss of performance; and (3) to search for evidence of fluorescence
resonance energy transfer (FRET) between fluorescently labeled protein and polysaccharide in
membranes that processed mixed solutions of these components, as a marker for protein-
polysaccharide interactions. In this contribution, we used casein and dextran as the model protein
and polysaccharide respectively. We used our newly developed CLSM protocol to conduct cross-
sectional imaging of membranes following filtration, overcoming limitations of depth of
penetration observed in previous CLSM work 15-18. The extension of our cross-sectional CLSM
imaging method offered in this work should be useful to researchers who wish to use CLSM to
study internal fouling within wet membrane structures. Also, the knowledge acquired in this
study will contribute to better understanding of the mechanisms that lead to fouling, as is needed
to develop more effective fouling mitigation strategies for microfiltration of biological streams.

29
2.2 Experimental materials and methods
2.2.1 Materials
Asymmetric polyethersulfone (PES) membranes (Pall Corporation) were used for
filtration experiments. The Supor® PES membranes that were used have effective pore diameter
of 0.65 µm and thickness of 114–175 µm.
Fluorescently labeled probes used in these experiments were fluorescein isothiocyanate
(FITC) labeled casein from bovine milk (Sigma-Aldrich, C-0403) and Alexa Fluor® 594 labeled
dextran, 10 kDa molecular weight, anionic-fixable (Life Technologies, D-22913);. Non-labeled
compounds used in the filtration experiments were casein from bovine milk (Sigma Aldrich,
C6554) and dextran from Leuconostoc mesenteroides, 9 -11 kDa molecular weight, (Sigma
Aldrich, D9260).
For filtration experiments, sodium phosphate buffered solutions were prepared using
sodium phosphate monobasic (anhydrous, ≥99%, Sigma Aldrich, S0751), sodium phosphate
dibasic (anhydrous, ≥99%, Sigma Aldrich, S9763), and deionized (DI) Milli-Q system (EMD
Millipore) water.
Dow Filmtec™ NF90 membranes were used to prepare the calibration plots of intensity
versus areal protein or polysaccharide mass. The NF90 membranes were pre-treated to enhance
the permeability of the membranes while maintaining their rejection properties [19]. Pre-
treatment was done by soaking the membranes for 2 days in a 1:10:9 (by volume) mixture of
absolute ethanol (≥99.5%, Sigma Aldrich, 459836), sulfuric acid (ACS reagent, 95-98%, Sigma
Aldrich, 258105), and DI water.
For membrane cryosectioning, the embedding medium was Tissue-Tek O.C.T.
Compound 4583 (VWR, 25608-930). Tissue-Tek 15×15×5 mm Intermediate Cryomolds 4566

30
were used (Fisher Scientific, NC9542860). The high-profile cutting blades were 76.2×1.4×0.03
mm (Fisher Scientific, 12-634-4). Superfrost® Plus Micro Slides (VWR, 48311-703) were used
to collect and mount cryosections. Samples for XY lateral CLSM scans were mounted on
microscope slides (Fisherbrand, 12-550-A3). All samples were mounted using
VECTASHIELD® aqueous mounting medium (glycerol-based aqueous sample mounting
medium and anti-fading agent for the fluorescent probe) and covered with micro cover glasses
(VWR, 48393 092) before imaging. The immersion oil Type A (Nikon) specified for the
objective lens was used with the optical system.
2.2.2 Filtration experiments
A direct-flow filtration cell, Amicon 8050 from EMD Millipore, was used at a constant
pressure of 14.5 kPa. The Amicon 8050 cell has an effective filtration area of 13.4 cm2.
Sodium phosphate buffer solutions were prepared with an ionic strength of 0.125 M and
pH of 6.8. A stock solution of casein (25 g/L) was prepared by mixing the casein powder from
bovine milk in a 0.04 M sodium hydroxide solution. Stirring at 250 rpm for 4 hours was applied
to facilitate the casein dissolution. A stock solution of dextran (9-11 kDa, 25 g/L) was prepared
by mixing the dextran powder in DI water.
Single component protein and polysaccharide solutions were prepared with a final
concentration of 25 mg/L or 12.5 mg/L in phosphate buffer solution. Binary component solutions
were prepared with a final mixture concentration of 25 mg/L comprising 50:50 (w/w) protein-
polysaccharide in phosphate buffer solution. These solutions were prepared by adding the
appropriate volume of stock solution(s) to a volumetric flask and adding phosphate buffer to
achieve the desired volume. To allow confocal visualization of the protein (casein) and
polysaccharide (dextran), fluorescently labeled casein and dextran were added to the solutions in

31
a ratio of 1:20 fluorescently labeled to non-labeled component.
PES membranes were pre-wetted before each filtration experiment by soaking them in a
25% (by volume) aqueous ethanol solution for 10 minutes. Then the membranes were soaked in
DI water for 10 minutes. Membranes were kept in DI water until use. Each filtration experiment
was done at constant pressure until 1 L of permeate was collected. The membrane was placed
with the more open surface facing the feed, and filtration was done in direct flow mode with
constant stirring speed of 250 rpm. Flux versus permeate volume data were recorded during
each experiment.
After filtration, 5 mL of a solution of non-labeled component(s) at the concentration(s)
used in the filtration run was filtered with the purpose of emptying out the pores of unbound
fluorescently labeled probes. This step was taken as a precaution to ensure that the confocal
microscope visualized only fluorescently labeled probes that were physisorbed to the membrane.
Membranes were used just once and sacrificed to collect samples for confocal visualization.
2.2.3 Calibration curve preparation
A pressure of 380 kPa was used to filter solutions containing different masses of
fluorescently labeled probes through pre-treated Dow Filmtec™ NF90 membranes. Post
filtration, the samples were collected for confocal microscopy visualization. Confocal lateral XY
scans were performed on the surface of NF90 membranes to determine the average intensity and
relate it to the mass per area of fluorescently labeled probe retained on the surface. This
information was used to generate calibration plots as average intensity versus mass per area of
fluorescently labeled probe retained on the surface. We followed a procedure described by
Marroquin et al. 13 to mount the NF90 calibration curve membranes for lateral XY CLSM
imaging.

32
2.2.4 Sectioning and mounting of samples for cross-sectional CLSM imaging
Cross-sections of the membranes used in the filtration experiments were obtained and
prepared for confocal imaging following the procedure described by Marroquin et al. 13. Figure
2.1 is a schematic for the sectioning process to access the sample cross-sections.
2.2.5 Optical system and imaging
A Nikon Eclipse Ti confocal laser scanning microscope system was used in fluorescence
mode with a Nikon 60X oil immersion objective with a numerical aperture of 1.49. This CLSM
system was used to visualize fluorescently labeled probes bound throughout the entire thickness
of the PES membranes or on the surface of the NF90 membranes. Images were stored as 12-bit
scan with a resolution of 512 × 512 pixels, which represented an area of 212 × 212 micron. The
excitation light source was a helium-neon laser (594 nm excitation wavelength for Alexa Fluor®
594 and 488 nm wavelength for FITC). Each image is the result of averaging the
signal/information collected from four scans, which reduces noise, producing better resolved
images.
2.2.6 Image analysis
Images collected by the confocal microscope were processed using NIS-Elements 3.2
Software Package.
2.2.7 Dynamic Light Scattering (DLS) measurements
DLS measurements were conducted using a Malvern Zetasizer Nano ZS instrument
(Malvern Instruments Ltd., Malvern, UK) at a wavelength of 633 nm from a 4.0 mW, solid-state
He-Ne laser at a scattering angle of 170°. Intensity average, volume average, and number
average diameters were calculated from the autocorrelation function using Malvern Zetasizer
Nano 5.1 software utilizing a version of the CONTIN algorithm.

33
Figure 2.1: Schematic for sample sectioning and cross-sectional CLSM images
2.3 Results and discussion
2.3.1 Flux measurements
Flux experiments were done with casein, dextran, and casein-dextran mixtures and the
asymmetric PES membrane. Figure 2.2 shows direct-flow flux data for solutions of the
individual components, as well as data for the casein-dextran mixture. It was observed that the
mixed feed (casein and dextran) showed a less severe flux decline than dextran alone. One
difference between these two solutions is that the concentration of dextran in the mixed solution
was lower than the concentration in the single component solution (12.5 mg/L versus 25 mg/L).
To determine if the difference in fouling behavior was due to a difference in dextran
concentration, we prepared a dextran solution at 12.5 mg/L and measured the flux versus
permeate volume for this single component solution. As shown in Figure 2.2, even at this lower
concentration, the dextran solution yielded a more severe flux decline than the mixture. To

34
understand what might be the cause of this difference, we carried out DLS measurements of the
solutions. Figure 2.3 shows the DLS data for casein and casein-dextran feed solutions. The
apparent size of 215 nm and broad peak size for the casein feed are consistent with the findings
of Gebhardt et al. 20 and indicate the presence of casein micelles. Figure 2.3 also shows the size
distribution of the micelles after addition of dextran to the solution. The apparent size of the
micelles increases to 290 nm after addition of dextran. We hypothesized that the increase in size
after dextran addition may be due to some form of association between the casein micelles and
dextran. Association of the dextran with casein may be the reason that the casein-dextran mixture
is less fouling than dextran alone.
Permeate volume (mL)
0 100 200 300 400 500
Flux
(L/m
2 h)
1000
2000
3000
4000
5000
CaseinDextranCasein-DextranDextran (12.5 mg/L)
Figure 2.2: Permeate flux evolution for casein (25 mg/L) single component (●), dextran (25 mg/L) single component (○), casein-dextran binary component (12.5 mg/L each) (▼), dextran (12.5 mg/L) single component (Δ).

35
Figure 2.3: DLS data for 12.5 mg/L casein single component solution (TOP) and a 50:50 (w/w) mixture of casein and dextran at 25 mg/L (BOTTOM).
2.3.2 Sample preparation for CLSM imaging
Samples were collected at 5, 10, and 15% flux decline and they were prepared for cross-
sectional CLSM imaging according to the protocol followed by Marroquin et al. 13. During
sample preparation, it was necessary to flush the pores to remove unbound fluorescent probe
molecules, and also it was necessary to remove the embedding medium used for cross-sectioning
by immersing the sample in phosphate buffered saline for 20 minutes at 35 °C. Control
experiments were done to verify that sample preparation removed unbound probe and did not
lead to foulant migration or leaching and a change of the bound probe intensity profile. In the
first experiment, a membrane was challenged with 500 mL of 25mg/L casein-FITC/casein (1:20)
in buffer solution and then rinsed twice to remove fluid in the pores. The second rinse solution
was analyzed, and there was no detected fluorescence. In a second experiment, membranes were
loaded with 12.5 mg/L of dextran (10kDa)- dextran (9-11 kDa)-Alexa Fluor® 594 (1:20) until
the flux declined by 15%. Three samples were prepared for cross-sectional CLSM using our
standard protocol. Sample 1 was washed once, sample 2 was washed twice, and sample 3 was

36
washed three times with PBS buffer for 20 minutes at 35 °C. Figure 2.4 gives the CLSM images
of the three samples. Intensity measurements showed that, within the standard error, the degree
of washing has no measureable effect on CLSM image intensity (Figure 2.5), consistent with the
first control experiment.
Figure 2.4: Cross-sectional CLSM images of dextran-Alexa Fluor® 594 binding within an asymmetric 0.65 μm PES membrane at a depth of 4 μm. Images are for samples taken after 15% flux decline. The dense surface of the membrane is on the left of all images. Images are for samples washed once (LEFT), twice (MIDDLE), and thrice (RIGHT). The scale indicator is 10 μm in diameter
Depth (microns)
020406080100120140
Inte
nsity
0
50
100
150
200
250
Figure 2.5: Intensity profile for CLSM images presented in figure 2.4. Profiles are for samples washed once (●), twice (○), and thrice (▼).

37
2.3.3 Determining the location of foulants by CLSM: single and binary component
solutions
Using cross-sectional CLSM imaging, we were able to image foulant at all depths within
the membrane structure, overcoming previous depth of penetration limitations for such studies 13.
Figures 2.6−8 show the cross-sectional CLSM images (at a depth of 4 μm) of the asymmetric
0.65 μm PES membranes that processed single and binary component solutions of casein and
dextran. We imaged just below the surface to avoid concerns about surface defects caused by
sample preparation.
Figure 2.6 shows the fouling profile within membranes after filtering a casein solution.
Protein accumulates throughout the membrane structure and is not concentrated at the feed
surface (right side of each image). The intensity of the green color (emission by FITC) increases
towards the dense surface, demonstrating that the membrane acts as a depth filter. Fouling of the
PES membranes by casein is due to hydrophobic interactions between the protein and the
membrane material as other authors have stated 10, 21, 22.
Figure 2.7 shows the fouling profile of dextran at different degrees of fouling. In this
case, we observed some accumulation of dextran at the feed surface, consistent with the more
severe flux decline in this system (see Figure 2.2). PES fouling by dextran at static and dynamic
conditions has been reported by Susanto et al. 10, 23. They propose that attractive forces between
dextran and PES are due to van der Waals interactions and hydrogen bonding between hydroxyl
groups of dextran (donor) and the oxygen atoms in the SO2 group of PES (acceptor). It also is
proposed that the displacement of water molecules from the hydrophobic surface by the
adsorbing polysaccharide results increases system entropy, favoring the adsorption process.
According to Mochizuki et al. 24, under some conditions dextran can deposit on the surface of the

38
membrane and form a ‘gel layer’. In this study, it is believed that interactions between dextran
and the PES membrane might be causing pore narrowing on the surface facing the feed. The
significant flux decline shown in Figure 2.2 is counter-intuitive since the hydrodynamic radius of
dextran (10 kDa) is approximately 2.2-3.6 nm 25. Another explanation for this unexpected flux
decline behavior may be related to the findings that neutral polysaccharides (like dextran) have a
low solubility due to the presence of a large number of hydrogen bonds that stabilize intra- and
inter-chain interactions 26, 27. Thus, the severe flux decline observed for the dextran solution
might be due to dextran aggregates that are not well solubilized in solution. Indeed, when high
intensity sonication was applied to the dextran stock solution, the solution was less fouling (data
shown in Supplementary Materials) compared to the results presented in Figure 2.2.
Figure 2.8 presents the CLSM cross-sectional images that show where casein and dextran
deposit within the PES membranes post-filtration of the casein-dextran mixture. Shown are the
fouling profiles for casein and dextran individually, as well as the overlaid profiles. Interestingly,
there appears to be no accumulation of dextran at the feed surface when casein also is present in
the feed. Also, the fouling profiles follow the same trend; the color intensity increases toward the
dense layer. The CLSM images agree with the flux decline data, which show that the mixed feed
has a less severe flux decline than dextran alone. It is apparent that the presence of casein in
solution is changing the fouling behavior of dextran. Interactions between dextran (molecular
weight 10 kDa) and a protein (myoglobin) were observed by Susanto et al. 28. They observed
higher degrees of fouling in dextran-myoglobin mixtures compared to the single solute feeds and
explained this behavior is a possible interpenetration of both biopolymers to form a network
structure stabilized by multiple hydrogen bonds. According to the work by Dickinson 29,
polysaccharides and proteins are capable of interacting favorably through hydrogen bonding or

39
electrostatic interactions. Also, weak complexation between proteins and neutral polysaccharides
can occur due to secondary, non-Coulombic interactions at low ionic strength conditions 30. To
gain a better understanding of the effect of pH and ionic strength on the interactions occurring
between casein and dextran, additional flux measurements were done for the binary mixture at
two ionic strength conditions (0.125 and 0.25) and three pH values (7, 6.25 and 5.5). The flux
profiles showed no change over the range of pH and ionic strength that was studied, suggesting
that electrostatic interactions between casein and dextran are not predominant at the conditions
tested (see Supplementary Materials for the full set of flux data for all conditions studied).
Motivated by the observations that dextran (used in some medical applications to lower
blood viscosity and to prevent platelet aggregation) is capable of coating platelets, red and white
cells, Ponder et al. 31 found, through electrophoretic methods, that a complex between the protein
albumin and dextran was formed and that this complex comprises one molecule of albumin for
every four dextran molecules. Based on the results of that study, together with the flux and DLS
data and CLSM imaging, we hypothesized that the co-localization of casein and dextran shown
in Figure 2.8 is due to association between casein and dextran, and that this association helps to
solubilize/disperse dextran and prevent its accumulation at the membrane feed surface. The
observed increase in the apparent casein micelle size given by the DLS measurements supports
our hypothesis about the association between casein micelles and dextran, likely due to van der
Waals and hydrogen bonding interactions.
Fluorescence resonance energy transfer (FRET) and immunoassay experiments were
done to further support our hypothesis that a complex forms between casein and dextran. Details
on these experiments are available in Supplementary Materials. Results for both experiments
were inconclusive. FRET was not observed, likely due to low extent of labeling by FITC and

40
TRITC on casein and dextran, respectively. To observe FRET, the distance between the donor
(FITC) and the acceptor (TRITC) should be 2-7 nm 32. Even if there is a complex formed
between casein and dextran, FRET will not be observed if the distance between their fluorescent
tags is too long. With a low extent of labeling on these macromolecules, the distance between
FITC and TRITC may be greater than 7 nm within the complex. The immunoassay experiments
showed that dextran tends to adsorb to immunoassay beads that have casein bound on their
surface. However, binding was not specific to casein. Dextran also bound to the base
immunoassay beads containing sheep anti-rabbit IgG. Since the manufacturer of the beads does
not supply plain beads (with no sheep anti-rabbit IgG covalently bound to the surface), we
cannot conclude that the adsorption of dextran to the beads depends on the presence of a protein
such as casein.
2.3.4 Image analysis and quantification of foulants
Cross-sectional CLSM images presented in Figures 2.6−8 give qualitative information
about the fouling occurring within PES membranes by casein and dextran.
Figure 2.6: Cross-sectional CLSM images of casein and casein-FITC binding within an asymmetric 0.65 μm PES membrane at a depth of 4 μm. Feed was 25 mg/L casein (1: 20 fluorescent probe to non-tagged compound). The dense surface is on the LEFT of all images. Images are for samples taken after 5% flux decline (LEFT), 10% flux decline (MIDDLE), and 15% flux decline (RIGHT). The scale indicator is 10 μm in diameter.

41
The quantitative intensity data for fluorescent probes covalently bound to casein and
dextran (FITC and Alexa Fluor® 594, respectively) within the PES membranes at different
degrees of fouling was obtained from Figures 2.6−8 by measuring the average color intensity at
locations throughout the entire thickness of the cross-sections. Figure 2.9−12 show average color
intensity versus depth plots for the cross-sectional CLSM images of the PES that processed
solutions of casein/casein-FITC (Figure 2.9), dextran/dextran-Alexa Fluor® 594 (Figure 2.10),
and casein/casein-FITC/dextran/dextran-Alexa Fluor® 594 (Figures 2.11 and 2.12) at three
levels of fouling (5, 10, and 15% flux decline).
Figure 2.7: Cross-sectional CLSM images of dextran and dextran-Alexa Fluor® 594 binding within an asymmetric 0.65 μm PES membrane at a depth of 4 μm. Feed was 25 mg/L dextran (1:20 fluorescent probe to non-tagged compound). The dense surface is on the LEFT of all images. Images are for samples taken after 5% flux decline (LEFT), 10% flux decline (MIDDLE), and 15% flux decline (RIGHT). The scale indicator is 10 μm in diameter.
Figure 2.9, for the fouling profile of casein single-component solution shows that the
average intensity increases with depth and also with degree of fouling. Since the FITC is bound
covalently to casein, the intensity of the green color is proportional to the mass of casein. The
intensity profile shows that the membrane behaves like a depth filter, where the maximum
adsorption occurs near the dense surface. Figure 2.10 for the fouling profile of dextran single-
component solution shows that, at 5% and 10% flux decline, the intensity is higher near the

42
surface facing the feed and then it plateaus. At 15% flux decline, the intensity profile presents a
“U” shape where the intensity near the surface facing the feed and the dense surface (permeate
side) have the highest values. It was explained in section 3.3 that dextran aggregates may have
accumulated on the membrane surface leading to high intensity values close to the surface facing
the feed.
Figure 2.8: Cross-sectional CLSM images of a 50:50 (w/w) casein-dextran mixture binding within an asymmetric 0.65 μm PES membrane at a depth of 4 μm. Feed was 25 mg/L (1:20 fluorescent probe to non-tagged compound). The dense surface is on the LEFT of all images. TOP row images are for samples taken after 5% flux decline: casein (LEFT), dextran (MIDDLE), superimposed image of casein and dextran (RIGHT). SECOND row images are for samples taken after 10% flux decline. BOTTOM row images are for samples taken after 15% flux decline. The scale indicator is 10 μm in diameter.

43
The intensity profiles for samples that filtered the casein-dextran mixture, Figures 2.11
and 12, show that mass of protein and polysaccharide both increase with depth and with degree
of fouling. The CLSM images and intensity profiles show that dextran no longer accumulates
near the top surface. It was explained in section 3.3 that the presence of casein and its
interactions with dextran are the reasons why dextran no longer accumulates at the feed surface.
Depth (microns)
020406080100120140
Inte
nsity
0
50
100
150
200
250
300
350
g C
asein
/cm
20.0
0.2
0.4
0.6
0.8
1.0
1.2
Figure 2.9: Intensity profiles for the cross-sectional CLSM images of casein-FITC binding (Figure 2.6) within an asymmetric 0.65 μm PES membrane at a depth of 4 μm, after filtering a single-component solution. Profiles are for samples taken after 5% flux decline (●), 10% flux decline (○), and 15% flux decline (▼).
The intensity values for casein within membranes that filtered casein-dextran mixtures
are roughly 2-3 times higher than the respective intensity profiles for membranes that filtered
single-component casein solutions. In contrast, the intensity values of dextran show about a 30%
decrease for membranes that processed the binary mixture compared to those that processed the
single-component dextran solution. This behavior can be explained by the association between

44
casein and dextran, which increases the casein micelle size (Figure 2.2) and improves the
solubility of dextran. The increase in micelle size leads to a higher sieving coefficient for casein
within the membrane structure. The improved solubility of dextran lessens the degree to which it
adsorbs to the membrane surface.
Depth (microns)
020406080100120140
Inte
nsity
0
50
100
150
200
250
g D
extra
n/cm
20.0
0.1
0.2
0.3
0.4
Figure 2.10: Intensity profiles for the cross-sectional CLSM images of dextran-Alexa Fluor® 594 binding (Figure 2.7) within an asymmetric 0.65 μm PES membrane at a depth of 4 μm, after filtering a single-component solution. Profiles are for samples taken after 5% flux decline (●), 10% flux decline (○), and 15% flux decline (▼).

45
Depth (microns)
020406080100120140
Inte
nsity
0
50
100
150
200
250
300
350
g C
asein
/cm
2
0.0
0.2
0.4
0.6
0.8
1.0
1.2
Figure 2.11: Intensity profiles for the cross-sectional CLSM images of casein-FITC binding (Figure 2.8) within an asymmetric 0.65 μm PES membrane at a depth of 4 μm, after filtering a binary component (casein-dextran) solution. Profiles are for samples taken after 5% flux decline (●), 10% flux decline (○), and 15% flux decline (▼).
Intensity is a measure of the mass of protein or polysaccharide deposited at different
depths within the membrane. It is directly proportional to the mass of labeled protein or
polysaccharide. We developed calibration curves that relate intensity to the mass of fluorescent
probe per membrane area for casein-FITC and dextran-Alexa Fluor® 594 by filtering known
masses of fluorescently labeled casein (and separately dextran) through Dow NF90 ultrafiltration
membranes that reject the protein and polysaccharide completely. The small pore size of the
membrane compared to the hydrodynamic size of the protein (or dextran) allowed us to retain it
all on the membrane surface. CLSM images of the NF90 membrane surfaces were obtained at
the same optical conditions used to obtain the CLSM images of the PES membranes at different

46
Depth (microns)
020406080100120140
Inte
nsity
0
50
100
150
200
250
g D
extra
n/cm
2
0.0
0.1
0.2
0.3
0.4
Figure 2.12: Intensity profiles for the cross-sectional CLSM images of dextran-Alexa Fluor® 594 binding (Figure 2.9) within an asymmetric 0.65 μm PES membrane at a depth of 4 μm, after filtering a binary component (casein-dextran) solution. Profiles are for samples taken after 5% flux decline (●), 10% flux decline (○), and 15% flux decline (▼).
degrees of fouling. The calibration curves (included in Supplementary Materials) for casein and
dextran were prepared by measuring the mean intensity of the fluorescently labeled protein or
polysaccharide deposited on the surface of the NF90 membrane and plotting it versus the
quotient of the known mass of fluorescent labeled protein or polysaccharide and the effective
filtration area of the membrane. By knowing the ratio of fluorescently labeled to non-labeled
protein or polysaccharide (1:20), we estimated the mass/area of casein and/or dextran at different
depths from the intensity profiles presented in Figures 2.9−12. Results are presented on
secondary y-axes of Figures 2.9−12 for the areal mass of casein and dextran found at different

47
depth for PES membranes that filtered single component casein and dextran solutions and binary
component casein-dextran solutions. Values also are tabulated in Supplementary Materials.
2.3.5 Fouling mechanisms
Filtration data were analyzed with the Hermia model for constant pressure filtrations
(Equation 1) to obtain more information about the fouling mechanisms. A more detailed
discussion of the underlying assumptions and mathematical development of equation 1 was
provided by Hermia 33.
∂2t∂V2
= k �∂t∂V�n (1)
In equation 1, t and V are the filtration time (s) and cumulative permeate volume (m3),
respectively. ∂t/∂V is the reciprocal of the permeate flow rate; ∂2t/∂V2 is defined as the resistance
coefficient or the rate of change of the instantaneous resistance to filtration with respect to
permeate volume; and k and n are two model parameters, where n depends on the fouling model
or mechanism (n = 0 for cake filtration, n = 1 for intermediate blocking, n = 2 for complete
blocking, and n = 1.5 for standard blocking). Plotting on a logarithmic scale ∂2t/∂V2 versus ∂t/∂V
should give a straight line with slope equal to the n parameter 34.
Filtration data presented in Figure 2.2 were analyzed with the Hermia model (equation 1)
and the n parameter from equation 1 was obtained for each case. For single-component solutions
of casein and dextran, steep slopes (n>2) were observed in early stages of filtration, and the slope
values decreased throughout the filtration. This phenomenon has been observed by other
researchers, and it has been attributed to the fact that particle deposition is unable to block or seal
pores since fluid can flow under and around any blocked surface when there is a highly
interconnected membrane pore structure 35, 36. Thus, the Hermia model, which does not account
for interconnected pores, fails to describe fouling behavior during the early stages of filtration of

48
casein and dextran single-component solutions. Half way through the filtration of single-
component solutions of dextran, the slope value converged to n=1, indicating an intermediate
pore blocking fouling mechanism, where dextran aggregates partially block the pores on the
surface of the PES membrane. Figure 2.7 supports this result, where we can visualize the
deposition of dextran on the surface of the membrane partially blocking the pores. According to
Starbard 9, soft (deformable) particles like carbohydrates typically plug a filter through a pore
blockage model. For single-component solutions of casein, the slope values were greater than 2
for the whole filtration data set, making it impossible to conclude by flux measurements alone
what fouling mechanism dominates throughout the filtration experiment. In this case, CLSM
images provide a visual description of how fouling occurs by depth filtration.
For the binary mixture of casein and dextran, we obtained a slope value of n = 0.4 for the
entire filtration data set. As mentioned earlier, a zero slope indicates that that the main fouling
mechanism is cake filtration. One might be tempted to argue that a slope value of n=0.4 is close
to zero and that cake filtration is the mechanism for fouling in this system. Cake filtration
generally is interpreted as an accumulation layer formed at the surface of the membrane facing
the feed. Yet, CLSM images in Figure 2.8 clearly show that the accumulation of foulants occurs
on the dense side of the membrane. Then, based on the CLSM images presented in Figure 2.8,
we can interpret the results from analysis of flux decline data using the Hermia model as ‘cake’
formation on the dense surface of the PES membrane opposite to the feed side of the membrane.
According to Bhattacharyya and Butterfield 35, governing filtration equations have been derived
for different values of the n parameter ranging between 0 and 2 (i.e. n=1/4, 1/3,1/2, 2/3, 5/4, 4/3);
however, no physical interpretation has been provided for these model equations, It is important
to note that fouling visualization by cross-sectional CLSM imaging can provide information that

49
can be used to give us this physical interpretation that is lacking in the model equation.
2.4 Conclusions
This research provides a methodology for direct visual observation of membrane fouling
within a wet, asymmetric membrane structure. The application of a protocol developed
previously by our research group for cross-sectional CLSM imaging allowed the location and
quantification of protein and polysaccharide foulants within the full thickness of a PES
asymmetric microfiltration membrane, something, to our knowledge, no one has reported
previously. Flux experiments provided information on the fouling behavior of casein and dextran
when they were alone in solution and when they were mixed. Cross-sectional CLSM images and
calibration images provided quantitative information about the location and mass/area of the
fluorescently labeled foulants throughout the wet membrane structure. Comparing quantitative
analysis of the CLSM images with flux decline data analysis using the Hermia model allowed a
better understanding about how fouling occurs. Also, information provided by CLSm inmaging
can be used to infer the fouling mechanism(s) when fouling models that are based on assumed
membrane structure, such as the Hermia model, do not apply, fail to provide physically
meaningful information or do not lead us the right conclusion.
Hydrophobic and hydrogen bonding interactions are believed to be responsible for casein
and dextran adsorption onto the PES membrane material. The presence of casein in solution
prevented surface fouling by dextran likely due to association between these components that
facilitates dissolution and prevents aggregation of dextran in solution. This association between
casein and dextran in the binary solution explains why the fouling profiles of both components
are similar. The knowledge generated in this study is relevant to industry and membrane

50
manufacturers since proteins and polysaccharides are present in beverages and play a role in the
fouling of membranes during microfiltration processes. The results from this investigation will
enable future investigations on membrane fouling by multicomponent solutions and the
elucidation of the roles that membrane structure and material of construction play on foulant
deposition/accumulation on and within the membrane. Such knowledge may aid in the design of
new membranes with tailored structure or surface chemistry that prevents the deposition of the
foulants in “prone to foul” regions.
References
1. Hubbard, T. Encyclopedia of surface and colloid science. Volume 1, Marcel Dekker, New York, 2002.
2. Berk, Z. Food process engineering and technology. Academic Press, Boston, 2009.
3. Czekaj, P., Lopez, F., Guell, C. Membrane fouling during microfiltration of fermented beverages. J. Membr. Sci., 166 (2): 199-212, (2000).
4. Loh, S., Beuscher, U., Poddar, T. K., Porter, A. G., Wingard, J. M., Husson, S. M.,
Wickramasinghe, S. R. Interplay among membrane properties, protein properties and operating conditions on protein fouling during normal-flow microfiltration. J. Membr. Sci., 332 (1-2): 93-103, (2009).
5. Zator, M., Ferrando, M., Lopez, F., Guell, C. Microfiltration of protein/dextran/polyphenol
solutions: Characterization of fouling and chemical cleaning efficiency using confocal microscopy. J. Membr. Sci., 344 (1-2): 82-91, (2009).
6. Mateus, E., Carvalho, C., Luis, C., de Freitas, V. Influence of the tannin structure on the
disruption effect of carbohydrates on protein-tannin aggregates. Anal. Chim. Acta., 513 (1): 135-140, (2004).
7. Carvalho, E., Povoas, M. J., Mateus, N., de Freitas, V. Application of flow nephelometry
to the analysis of the influence of carbohydrates on protein-tannin interactions. J. Sci. Food Agr., 86 (6): 891-896, (2006).
8. Soares, S. I., Goncalves, R. M., Fernandes, I., Mateus, N., de Freitas, V. Mechanistic
approach by which polysaccharides inhibit alpha-amylase/procyanidin aggregation. J. Agric. Food Chem., 57 (10): 4352-4358, (2009).

51
9. N. Starbard, Beverage industry microfiltration, Wiley-Blackwell, Iowa, 2008. 10. Susanto, H., Franzka, S., Ulbricht, M. Dextran fouling of polyethersulfone ultrafiltration
membranes - Causes, extent and consequences. J. Membr. Sci., 296 (1-2): 147-155, (2007).
11. Vernhet, A., Moutounet, M. Fouling of organic microfiltration membranes by wine constituents: importance, relative impact of wine polysccharides and polyphenols and incidence of membrane properties. J. Membr. Sci., 201 (1-2): 103-122, (2002).
12. Ismail, A. F., Matsuura, T. Sustainable membrane technology for energy, water, and
environment. Hoboken, John Wiley & Sons, 2012. 13. Marroquin, M., Bruce, T., Pellegrino, J., Wickramasinghe, S. R., Husson, S. M.
Characterization of asymmetry in microporous membranes by cross-sectional confocal laser scanning microscopy, J. Membr. Sci., 379 (1-2): 504-515, (2011).
14. Zator, M., Ferrando, M., Lopez, F., Guell, C. Membrane fouling characterization by
confocal microscopy during filtration of BSA/dextran mixtures. J. Membr. Sci., 301 (1-2): 57-66, (2007).
15. Charcosset, J., Bernengo, C. Comparison of microporous membrane morphologies using
confocal scanning laser microscopy. J. Membr. Sci., 168 (1-2): 53-62, (2000). 16. Reichert, U., Linden, T., Belfort, G., Kula, M. R., Thommes, J. Visualising protein
adsorption to ion-exchange membranes by confocal microscopy. J. Membr. Sci., 199 (1-2): 161-166, (2002).
17. Wickramasinghe, S. R., Carlson, J. O., Teske, C., Hubbuch, J., Ulbricht, M. Characterizing
solute binding to macroporous ion exchange membrane adsorbers using confocal laser scanning microscopy. J. Membr. Sci., 281 (1-2): 609-618, (2006).
18. Wang, J., Dismer, F., Hubbuch, J., Ulbricht, M. Detailed analysis of membrane adsorber
pore structure and protein binding by advanced microscopy. J. Membr. Sci., 320 (1-2): 456-467, (2008).
19. Kulkarni, A., Mukherjee, D., Gill, W. N. Flux enhancement by hydrophilization of thin film composite reverse osmosis membranes. J. Membr. Sci., 114 (1): 39-50, (1996).
20. Gebhardt, R., Doster, W., Friedrich, J., Kulozik, U. Size distribution of pressure-decomposed casein micelles studied by dynamic light scattering and AFM. Eur. Biophys. J., 35 (6): 503-509, (2006).
21. Koehler, J. A., Ulbricht, M., Belfort, G., Intermolecular forces between a protein and a
hydrophilic modified polysulfone film with relevance to filtration. Langmuir, 16 (26): 10419-10427, (2000).

52
23. Amanda, A., Mallapragada, S. K. Comparison of protein fouling on heat-treated poly(vinyl alcohol), poly(ether sulfone) and regenerated cellulose membranes using diffuse reflectance infrared Fourier transform spectroscopy. Biotechnol. Prog., 17 (5): 917-923, (2001).
24. Susanto, H., Ulbricht, M. Influence of ultrafiltration membrane characteristics on
adsorptive fouling with dextrans. J. Membr. Sci., 266 (1-2): 132-142, (2005).
25. Mochizuki, S., Zydney, A. L. Dextran transport through asymmetric ultrafiltration membranes - comparison with hydrodynamic models. J. Membr. Sci., 68 (1-2): 21-41, (1992).
26. Bohrer, M. P., Deen, W. M., Robertson, C. R., Troy, J. L., Brenner, B. M. Influence of molecular-configuration on the passage of macromolecules across the glomerular capillary wall. J. Gen. Physiol., 74 (5): 583-593, (1979).
27. Rinaudo, M. Relation between the molecular structure of some polysaccharides and original properties in sol and gel states. Food Hydrocolloids, 15 (4-6): 433-440, (2001).
28. De Freitas, V., Carvalho, E., Mateus, N. Study of carbohydrate influence on protein-tannin aggregation by nephelometry. Food Chem., 81 (4): 503-509, (2003).
29. Susanto, H., Arafat, H., Janssen, E. M. L., Ulbricht, M. Ultrafiltration of polysaccharide-protein mixtures: Elucidation of fouling mechanisms and fouling control by membrane surface modification. Sep. Sci. Technol., 63 (3): 558-565, (2008).
30. Dickinson, E. Food colloids: interactions, microstructure and processing. Royal Society of Chemistry, Cambridge, 2005.
31. Tolstoguzov, V. B., Grinberg, V. Y., Gurov, A. N. Some physicochemical approaches to the problem of protein texturization. J. Agric. Food Chem., 33 (2): 151-159, (1985).
32. Ponder, E., Ponder, R. V. The interaction of dextran with serum albumin, gamma globulin, and fibrinogen. J. Gen. Physiol., 43, 753-758, (1960).
33. Majoul, I., Jia, Y., Duden, R. Practical fluorescence resonance energy transfer or molecular nanobioscopy of living cells. In: J.B. Pawley (Ed), Handbook of Biological Confocal Microscopy, third ed., Plenum Press, New York, 2006.
34. Hermia, J. Constant pressure blocking filtration laws - application to power-law non-newtonian fluids. Trans. Inst. Chem. Eng., 60 (3): 183-187, (1982).
35. Wickramasinghe, S. R., Stump, E. D., Grzenia, D. L., Husson, S. M. Understanding virus filtration membrane performance. J. Membr. Sci., 365 (1-2): 160-169, (2010).

53
36. Bhattacharyya, D., Butterfield, D. A. New insights into membrane science and technology :
polymeric and biofunctional membranes. Elsevier, Boston, 2003.
37. Yazdanshenas, M., Soltanieh, M., Nejad, S. A. R. T., Fillaudeau, L. Cross-flow microfiltration of rough non-alcoholic beer and diluted malt extract with tubular ceramic membranes: Investigation of fouling mechanisms. J. Membr. Sci., 362 (1-2): 306-316, (2010).

54
Chapter 3
Evaluation of Fouling Mechanisms in Asymmetric Microfiltration Membranes Using
Advanced Imaging2
Summary
This contribution details the use of advanced microscopy to study the fouling of asymmetric
polyethersulfone membranes during the microfiltration of protein (casein), polyphenol (tannic
acid), and polysaccharide (β-cyclodextrin) mixtures to better understand the solute-solute and
solute-membrane interactions leading to fouling. Fluorescently labeled probes were used to
visualize the fouling profiles of individual components within the wet membrane structure with
confocal laser scanning microscopy (CLSM). Cross-sectional CLSM imaging provided
information on the location and extent of fouling throughout the entire thickness of the PES
membrane, overcoming the depth of penetration limit observed by researchers in previous
studies. Quantitative analysis of the cross-sectional CLSM images provided a measurement of
the masses of foulants deposited throughout the membrane. Moreover, flux decline data were
collected for different mixtures of casein, tannic acid and β-cyclodextrin and were analyzed with
standard fouling models to determine the fouling mechanisms at play when processing different
combinations of foulants. Results from model analysis of flux data were compared with the
quantitative visual analysis of the correspondent CLSM images. This approach, which couples
visual and performance measurements, is expected to provide a better understanding of the
causes of fouling that, in turn, is expected to aid in the design of new membranes with tailored
2 Marroquin, M., Vu, A., Bruce, T., Wickramasinghe, S. R., Zhao, L., Husson, S. M. Evaluation of fouling mechanisms in asymmetric microfiltration membranes using advanced imaging. Journal of Membrane Scicence, 465: 1-13 (2014)

55
structure or surface chemistries that prevent the deposition of the foulants in “prone to foul”
regions.
3.1 Introduction
Microfiltration (MF) is a key process in the beverage industry that is used to remove bacteria,
yeast, colloidal particles and even other filtration media such as diatomaceous earth, to ensure
final product quality and/or consumer safety. For instance, in beer production, microfiltration is
used to remove chill haze flocs and microorganisms that can spoil the final product 1. A major
problem for MF membranes is fouling, which decreases service life and increases change-out
costs compared to other filtration materials 2. In beverage processing, fouling of MF membranes
occurs not only due to the presence of microorganisms or suspended particles, but also by the
presence of low molecular weight components in solution. Furthermore, interactions among
these components can exacerbate fouling of the membrane.
Common constituents found in beer, wine, juices and tea are polyphenols, proteins and
polysaccharides. Polyphenols are responsible for the astringency sensation when drinking these
beverages, which is believed to be caused by the precipitation of salivary proteins by
polyphenols on oral surfaces, preventing palate lubrication and inducing the drying, puckering
and roughing sensation in the buccal cavity 3. To some degree, astringency is perceived as a
positive quality factor in certain beverages; for instance, it is one of the most important
organoleptic sensations perceived when drinking wine or tea 3. In addition, polyphenols have
antioxidant, antimutagenic and anticarcinogenic properties, among other health benefits 4,5.
Polyphenols behave like cross-linkers between protein molecules, and the complexation
between proteins and polyphenols in solution has been well documented 4, 6-9. It has been
reported that polyphenols bind to proteins (especially to proline-rich proteins) and form soluble

56
or insoluble complexes through hydrogen bonding and hydrophobic interactions 10, 11. The
protein-polyphenol interaction is affected by parameters that include ionic strength, pH,
concentration ratio of polyphenol to protein, solvent composition, and the presence of certain
components in solution like polysaccharides 12, 13.
Polysaccharides are capable of disrupting the protein-polyphenol interaction possibly due to
hydrophobic interactions and/or hydrogen bonding between oxygen atoms of the polysaccharide
and the phenolic hydroxyl group of the polyphenols 3, 6, 10. An everyday example of the
disruption of protein-polyphenol interactions by polysaccharides is the loss of astringency during
the ripening process of many edible fruits because of the increase of soluble pectins during
maturation 3, 14. There are two possible mechanisms by which polysaccharides disrupt
interactions between proteins and polyphenols: (1) Polysaccharides form a ternary complex with
proteins and polyphenols that enhances the solubility in solution. (2) There is a molecular
association between polysaccharides and polyphenols that disrupts protein-polyphenol
aggregation. It has been proposed that some polysaccharides, like xanthan gum and
cyclodextrins, develop structures in solution that provide hydrophobic pockets to encapsulate
polyphenols preventing further interaction with proteins 3, 6, 12, 14-16.
The understanding of solute-solute and solute-membrane interactions that lead to fouling
during the microfiltration of beverages is important to develop fouling mitigation strategies and
decrease costs of processing. To characterize membrane fouling, techniques like electron
microscopy (EM), atomic force microscopy (AFM) and confocal microscopy have been
implemented to visualize foulant accumulation 12, 17-21. Confocal Laser Scanning Microscopy
(CLSM) is a light microscopy technique that gradually has gained popularity in membrane
studies, and it has been used by our group and others to characterize fouling (internal and

57
external) 12, 22-24, morphology 25-27, performance 28, 29 and surface chemistry 30. Price et al. 31
provide a comprehensive overview of CLSM fundamentals. Briefly, CLSM in fluorescent mode
focuses a laser on a plane at a selected depth within the sample. The laser excites the fluorescent
molecules in the sample (present in the sample originally or added deliberately), and the emitted
light is collected by the microscope detector to produce an image. By changing the position of
the focal plane, it is possible to collect images of different depths within the sample (i.e., optical
sectioning).
Advantages that CLSM offers over EM and AFM are non-invasive depth imaging (optical
sectioning), wet state imaging capability, and, by using fluorescently labeled probes, ability to
locate and identify foulants within the sample. Several authors have identified a limit of depth of
penetration (LDP) for CLSM 12, 26, 28, 32. Beyond the LDP, excitation and emitted light is lost
significantly, which prevents the construction of images. The LDP is not the same for every
sample or microscope; rather, it depends on parameters that include sample material, light
wavelength, optical instrument, immersion-mounting media refractive index match, among
others 26. To overcome LDP, we have developed a cross-sectional CLSM imaging protocol that
produces defect-free images throughout the full thickness of membranes 26.
The main goal of this study was to gain a better understanding of the solute-solute and solute-
membrane interactions and their impact on fouling of asymmetric microfiltration membranes.
Flux data were collected for single-component and binary and ternary component mixtures of
protein, polyphenol, and polysaccharide. Cross-sectional CLSM imaging was used for direct
visual observation of the fouling profiles of fluorescently labeled protein (casein) and
polysaccharide (β-cyclodextrin) within the membranes, as well as visualization of how these
fouling profiles changed when a polyphenol (tannic acid) was present in solution. The mass of

58
foulants accumulated within the membrane was estimated based on the light emission intensity
captured in the CLSM images using calibration curves developed in this study. Finally, flux data
obtained in this study were analyzed using standard fouling models to determine the apparent
mechanisms of fouling occurring within the PES membrane when processing different
combinations of foulants. The consistency of these results was discussed based on the results of
the quantitative and visual analysis of their correspondent CLSM images.
The knowledge generated in this research is relevant to industry users of MF and membrane
manufacturers. Our hope is that it will aid in the design of new membranes with tailored
structure or surface chemistry that prevents the deposition of the foulants in “prone to foul”
regions, as well as the development of improved cleaning procedures.
3.2 Experimental materials and methods
3.2.1 Materials
Asymmetric polyethersulfone (PES) membranes (Pall Corporation) were used for filtration
experiments. The Supor® PES membranes that were used have manufacturer reported effective
pore diameter of 0.65 µm and thickness of 114–175 µm.
Non-labeled compounds used in the filtration experiments were casein from bovine milk
(Sigma Aldrich, C6554), β-cyclodextrin (Sigma Aldrich, C4767), tannic acid (Sigma Aldrich,
403040), (+)-catechin hydrate (Sigma Aldrich, C1251), xanthan gum (Sigma Aldrich, G1253)
and pectin (Sigma Aldrich, P9135).
Fluorescently labeled probes used in filtration experiments were fluorescein isothiocyanate
(FITC) labeled casein from bovine milk (Sigma-Aldrich, C-0403) and rhodamine B
isothiocyanate (RITC) labeled β-cyclodextrin. RITC (Sigma Aldrich, 283924) was bound
covalently to β-cyclodextrin by a slight modification of the method of Belder and Granath 33 in

59
which β-cyclodextrin was substituted for dextran and RITC for FITC. Briefly, pyridine (0.3 mL)
(Sigma Aldrich, 360570), dibutyltin dilaurate (20 µL) (Sigma Aldrich, 291234) and β-
cyclodextrin (1 g) were added to anhydrous dimethyl sulfoxide (10 mL) (Sigma Aldrich,
276855) in a screw-top scintillation vial, and the mixture was placed in a water bath at 95°C until
β-cyclodextrin was dissolved completely. Then, RITC (100 mg) was added to the mixture and
the vial was incubated at 95°C for 2 h with continuous magnetic stirring (250 rpm). At the end of
the reaction, the mixture was divided evenly into three screw-top tubes, and 25 mL of ethanol
(Sigma Aldrich, 459836) were added to each one. Precipitation of labeled β-cyclodextrin was
observed after vortexing for 2 min, and the tubes were centrifuged at 8000 g for 10 min to
separate precipitate from the supernatant containing free dye. The supernatant was collected and
divided evenly into three tubes. Ethanol (25 mL) was added to each tube to precipitate remaining
labeled β-cyclodextrin from solution, and then the tubes were centrifuged at the same conditions
specified earlier. After discarding supernatant, the precipitated β-cyclodextrin was washed by
resuspending in 10 mL of ethanol and centrifuging the tubes. Resuspension-centrifugation cycles
were repeated (5-6 times) until no dye was visible in the supernatant. Finally, RITC-labeled β-
cyclodextrin was dried overnight at 45 °C.
For filtration experiments, sodium phosphate buffered solutions were prepared using sodium
phosphate monobasic (anhydrous, ≥99%, Sigma Aldrich, S0751), sodium phosphate dibasic
(anhydrous, ≥99%, Sigma Aldrich, S9763), and deionized (DI) Milli-Q system (EMD Millipore)
water.
Dow Filmtec™ NF90 membranes were used to prepare the calibration plots of intensity
versus areal protein or polysaccharide mass. Before using the NF90 membranes, they were pre-
treated according to the procedure explained in Marroquin et al. 24 to enhance the permeability of

60
the membranes while maintaining their rejection properties.
3.2.2 Filtration experiments
A direct-flow filtration cell, Amicon 8050 from EMD Millipore, was used at a constant
pressure of 14.5 kPa. The Amicon 8050 cell has an effective filtration area of 13.4 cm2.
Sodium phosphate buffer solutions were prepared with an ionic strength of 0.125 M and pH
of 6.8. A stock solution of casein (25 g/L) was prepared by mixing the casein powder from
bovine milk in a 0.04 M sodium hydroxide solution. Stirring was applied at 250 rpm for 4 h to
facilitate the casein dissolution.
Single, binary and ternary solutions containing protein, polyphenol and/or polysaccharide
were prepared. The concentrations of the protein (casein) and polyphenol (tannic acid or
catechin) were 25 mg/L and 150 mg/L, respectively, in phosphate buffer solution. Solutions
containing polysaccharide were prepared with a final concentration of 200, 50 or 25 mg/L in
phosphate buffer solution. These solutions were prepared by adding the appropriate volume of
casein stock solution, mass of polysaccharide and/or mass of polyphenol to a volumetric flask
and adding phosphate buffer to achieve the desired volume. The polysaccharide and polyphenol
were sonicated in 20 mL of DI water before addition to the volumetric flask. To allow confocal
visualization of the protein (casein) and polysaccharide, fluorescently labeled casein and
polysaccharide were added to the solutions in a ratio of 1:20 fluorescently labeled to non-labeled
component.
PES membranes were pre-wetted before each filtration experiment by soaking them in a 25%
(v/v) aqueous ethanol solution for 10 min. Then the membranes were soaked in DI water for 10
min. Membranes were kept in DI water until use. Each filtration experiment was done at constant
pressure until 1 L of permeate was collected. The membrane was positioned with the more open

61
surface facing the feed, and filtration was done in direct-flow mode with a constant stirring speed
of 250 rpm. Flux versus permeate volume data were recorded during each experiment.
After filtration, 5 mL of a solution of non-labeled component(s) at the concentration(s) used
in the filtration experiment was filtered to displace solution containing unbound fluorescently
labeled compounds from the membrane pores. Using solutions of non-labeled component(s) at
the same concentration(s) was done to minimize desorption of physisorbed components from the
membrane. Membranes were used once and sacrificed to collect samples for confocal
visualization.
3.2.3 Calibration curve preparation
The procedure described by Marroquin et al. 24 was used to develop the calibration curve
relating fluorescence emission intensity to mass of fluorescently labeled polysaccharide per area.
The corresponding calibration plot for casein-FITC was developed previously 24.
3.2.4 Sectioning and mounting of samples for cross-sectional CLSM imaging
Cross-sections of the membranes used in the filtration experiments were obtained and
prepared for confocal imaging following the procedure described by Marroquin et al. 26.
3.2.5 Optical system and imaging
A Nikon Eclipse Ti confocal laser scanning microscope system was used in fluorescence
mode with a Nikon 60X oil immersion objective with a numerical aperture of 1.49. This CLSM
system was used to visualize fluorescently labeled probes bound throughout the entire thickness
of the PES membranes or on the surface of the NF90 membranes. Images were stored as 12-bit
scan with a resolution of 512 × 512 pixels, which represented an area of 212 × 212 micron. The
excitation light source was a helium-neon laser (561 nm excitation wavelength for RITC and 488
nm wavelength for FITC). Each image is the result of averaging the signal/information collected

62
from four scans, which reduces noise, producing better resolved images.
3.2.6 Image analysis
To compare information from CLSM images, special care was taken to keep the confocal
microscope settings the same for each sample (laser intensity, gain, pinhole size, pixel dwell
time, resolution, field zoom, averaging number) while imaging. Images collected by the confocal
microscope were processed using NIS-Elements 3.2 Software Package.
3.2.7 Dynamic Light Scattering (DLS) measurements
DLS measurements were conducted using a Malvern Zetasizer Nano ZS instrument (Malvern
Instruments Ltd., Malvern, UK) at a wavelength of 633 nm from a 4.0 mW, solid-state He-Ne
laser at a scattering angle of 173°. Number average diameters were calculated from the
autocorrelation function using Malvern Zetasizer Nano 7.01 software utilizing a version of the
CONTIN algorithm.
3.3 Results and discussion
3.3.1 Selection of study system
The first polyphenol tested in this study was (+)-catechin. We observed no significant fouling
when filtering casein-catechin mixtures (data presented in Supplementary Materials). This
observed result was counterintuitive based on the well-documented complexation (physical
crosslinking) that occurs between polyphenols and proline-rich proteins such as casein 7, 8, 11, 13.
Since complexation between proteins and polyphenols commonly results in larger aggregates in
solution, we expected to observe a decline in the flux due to fouling by the newly formed
aggregates. According to Mateus et al. 16, the size of the polyphenol plays an important role in
the crosslinking of proteins. Small polyphenols are not capable of crosslinking several proteins
since the number of sites able to associate or interact with the proteins is proportional to the

63
molecular weight of the polyphenol 34. Shukla et al. 8 described in their studies that small
polyphenols, like epigallocatechin gallate (main polyphenol in green tea), incorporate within
casein micelles, increasing the density of the micelle without modifying its apparent size. Since
casein and epigallocatechin gallate both have low molecular weights (290 g/mol and 458 g/mol,
respectively), we submit that catechin behaves similarly to epigallocatechin gallate and is
incorporated within the casein micelles. Due to its small size, it not capable of associating with
several proteins and forming aggregates large enough to significantly foul the MF membranes at
the conditions and permeate volume collected during this study. Therefore, we adopted a
polyphenol with higher molecular weight for our study system. We selected tannic acid (1,700
g/mol), which can cross-link casein proteins and form aggregates without significantly fouling
the membrane on its own.
Anionic polysaccharides, like xanthan gum and pectin, have been reported to be effective in
preventing the formation of insoluble aggregates between proteins and polyphenols 6. Initially,
we tested xanthan gum and pectin as model polysaccharides for this study; however, the fouling
was more severe when these polysaccharides were in solution with the protein and polyphenol
and even when they were alone in solution (see Supplementary Materials). Interestingly, the flux
declined faster when filtering the pectin ternary mixture (with casein and tannic acid) compared
to the pectin single-component solution. This phenomenon is attributed to the tendency of pectin
to form ternary complexes with proteins and polyphenols, as other researchers have reported 3.
Single-component xanthan gum solution and its ternary mixture showed similar flux profiles.
According to Freitas et al. 6, xanthan gum is believed to form gel-like networks in solution (by
lateral association of ordered chain sequences) that might be able to encapsulate the polyphenols.
While this gel-like network prevents polyphenols from interacting with proteins, it also increases

64
the fouling of the filtration membrane by plugging the pores at the membrane surface. Because
the xanthan gum gel-like network is being retained at the surface of the membrane, single-
component and ternary mixtures of xanthan gum present similar flux profiles 16. Thus, we
decided to test the lower molecular weight polysaccharide β-cyclodextrin, which, according to
the literature, associates strongly with polyphenols 14. β -cyclodextrin is a cyclic (doughnut-
shape) oligosaccharide with hydrophilic residues on the exterior and a structural interior that is
more hydrophobic than the exterior. Consequently, the mechanism that β-cyclodextrin follows to
prevent the association of proteins and polyphenols is believed to be the encapsulation of the
polyphenol in the hydrophobic pocket 3.
3.3.2 Flux measurements
Flux versus volume data were collected for casein, casein/tannic acid binary mixtures, and
casein/tannic acid/β-cyclodextrin ternary mixtures. Figure 3.1 presents the set of data collected at
constant pH (6.8) and ionic strength (0.125). It is observed that the mixture of casein (25 mg/L)
and tannic acid (150 mg/L) shows a severe flux decline compared to the single component
solutions of casein, tannic acid, and β-cyclodextrin, which do not foul the membrane
significantly. This result suggests that protein aggregation is caused by the presence of tannic
acid, and that these aggregates cause significant pore blockage.

65
Table 3.1: Concentration of protein, polyphenol and polysaccharide in the mixtures tested for flux versus volume experiments (pH 6.8, ionic strength 0.125 M)
Mixture Component concentration (mg/L)
Casein Tannic acid β-cyclodextrin
Protein 25 0 0 Polyphenol 0 150 0 Polysaccharide 0 0 200 Protein-polyphenol binary 25 150 0 Protein-polyphenol-polysaccharide 25 150 200 Protein-polyphenol-polysaccharide 25 150 50 Protein-polyphenol-polysaccharide 25 150 25
Permeate volume (mL)
0 100 200 300 400 500
Flux
(L/m
2 h)
0
1000
2000
3000
4000
5000
6000
Figure 3.1: Permeate flux evolution for casein (25 mg/L) single component (□), tannic acid (150 mg/L) single component (●), β-cyclodextrin (200 mg/L) single component (◊), casein-tannic acid binary component (25 mg/L and 150 mg/L, respectively ) (▲), casein–tannic acid–β-cyclodextrin (25 mg/L, 150 mg/L, 200 mg/L, respectively) ternary component (♦), casein–tannic acid–β-cyclodextrin (25 mg/L, 150 mg/L, 50 mg/L, respectively) ternary component (○), casein–tannic acid–β-cyclodextrin (25 mg/L, 150 mg/L, 25 mg/L, respectively) ternary component (Δ).

66
To test for protein-polyphenol association, DLS data were collected for single component
solutions of casein (25 mg/L) and tannic acid (150 mg/L) and for the casein-tannic acid binary
mixture (25 mg/L and 150 mg/L, respectively). DLS results presented in Figure 3.2a show that
the apparent diameter of the aggregates present in the casein solution are approximately 220 nm,
which is an indication of the presence of casein micelles 35. Figure 3.2b shows that the majority
of aggregates present in the tannic acid solution are approximately 5−6 nm in diameter.
Unexpectedly, Figure 3.2c shows that the majority of aggregates in the casein-tannic acid
mixture are 26 nm in diameter. Casein micelles are still present in solution, as seen in Figure 3.2d
(size distribution based on intensity) and their size has increased from 220 nm to 241 nm. Figure
3.2d also shows a small number of aggregates with a 5.4 µm size that probably are casein
micelles that have been aggregated by tannic acid. The 241 nm and 5.4 µm aggregates are
outnumbered by the new 26 nm aggregates and that is the reason why these peaks do not show
up in the DLS size distribution based on number. We submit that the abundant 26 nm aggregates
in solution are responsible for the fouling of the MF membrane observed when filtering the
casein-tannic acid mixture. Model-based analysis of the flux data (vide infra) suggest fouling by
pore blocking.
These nanosized clusters probably derive from the association of free casein in solution (in
equilibrium with the casein micelle) and tannic acid 4. From these results we conclude that tannic
acid is not large enough to effectively cause micelle-micelle aggregation (as there were very few
5.4 µm aggregates seen in Figures 3.2c and 3.2d), but it is capable of binding multiple free casein
proteins in solution and form the observed 26 nm aggregates. Also, the lack of a significant
number of micelles at 220 nm in Figure 3.2c suggests that the tannic acid breaks up many of the
casein micelles by forming more stable 26 nm clusters. As tannic acid scavenges free casein in

67
solution, a thermodynamic driving force exists for dissolution of the micelles into free protein.
Put another way, tannic acid acts like a chemical pump to pull casein from the micelles and form
a more thermodynamically stable, small association complex.
Figure 3.2: DLS data for (a) casein (25 mg/L) single component, (b) tannic acid (150 mg/L) single component, (c) casein–tannic acid binary component (25 mg/L and 150 mg/L, respectively) and (d) casein–tannic acid binary component (25 mg/L and 150 mg/L, respectively) size distribution by intensity.
Next, we tested the effect of the polysaccharide on the fouling behavior of a solution
containing the protein and the polyphenol. The concentration of protein and polyphenol were
kept constant, and the concentration of polysaccharide was varied. Three different molar ratios of
polyphenol to polysaccharide were tested (1:2, 2:1, 4:1). Adding 50 mg/L β-cyclodextrin (ratio
2:1 polyphenol to polysaccharide) to the mixture yielded some improvement to the flux
compared to the protein-polyphenol system (Figure 3.1). Unexpectedly, a higher concentration of
200 mg/L β-cyclodextrin (ratio 1:2 polyphenol to polysaccharide) yielded a more severe flux
decline than for the system protein-polyphenol (i.e., there was no benefit to adding more
polysaccharide). From these results, it is apparent that higher concentrations of β-cyclodextrin
(a) (b)
(c) (d)

68
(>50 mg/L) hinder the beneficial effect of the polysaccharide. Our explanation to this observed
phenomenon is that at 200 mg/L ternary complexes might be formed among casein/tannic acid/β-
cyclodextrin. As mentioned in Section 3.1, there are two possible mechanisms by which the
polysaccharide disrupts protein/polyphenol interactions: (1) by the association of polyphenols
and polysaccharides (i.e. physical encapsulation) and (2) by the formation of a ternary complex
(protein/polyphenol/polysaccharide). It appears that at 50 mg/L of β-cyclodextrin, mechanism (1)
is most important; whereas, at the higher concentration β-cyclodextrin, mechanism (2) becomes
important as more polyphenol is available to form these ternary complexes. A concentration of
25 mg/L of β-cyclodextrin (ratio 4:1 polyphenol to polysaccharide) showed a fouling behavior
that was similar to the initial mixture with no polysaccharide present in solution. This result may
be attributed to the low concentration of polysaccharide that is insufficient to effectively prevent
the protein-polyphenol association.
Based on the fouling behavior of the solutions tested in Figure 3.1, we found that the ‘sweet
spot’ ratio (2:1) proved to be an appropriate concentration of polysaccharide to limit the protein-
polyphenol association in our system. These findings suggest that, when feasible, addition of
aggregate disrupting sugars at low concentrations may be an effective approach to limit fouling
during the microfiltration of beverages. DLS data obtained from the ternary mixtures was
inconclusive regarding the mechanisms by which the polysaccharide at different concentrations
disrupts protein/polyphenol interactions. Resolution of our DLS instrument was high enough to
quantify the differences in aggregate size distributions corresponding to the aggregates formed at
the different polysaccharide concentrations.

69
3.3.3 Cross-sectional CLSM imaging
Flux measurements presented in section 3.2 provided indirect evidence for the cause of
fouling. Thus, CLSM was used to visualize protein and polysaccharide binding within the wet
membrane structures for the samples corresponding to the flux experiments presented in Figure
3.1. As mentioned earlier, to allow confocal visualization of the protein (casein) and
polysaccharide (β-cyclodextrin), fluorescently labeled casein-FITC and β-cyclodextrin-RITC
were added to the solutions in a ratio of 1:20 fluorescently labeled to non-labeled component. In
this section, the cross-sectional CLSM images are shown for three degrees of fouling
(corresponding to membranes collected after processing 125, 250 and 500 mL permeate volume).
All images correspond to the asymmetric 0.65 µm PES membranes used for the flux experiments
in Figure 3.1. Using cross-sectional imaging 26, we were able to image all depths and overcome
previous depth of penetration limitations for such studies. Images were taken at a depth of 4 μm
below the cross-section surface to avoid concerns about surface defects caused by sample
preparation.
For membranes that processed casein single component solution, Figure 3.3 shows that
protein accumulates throughout the membrane structure and is not concentrated at the feed
surface. It appears that the membrane functions as a depth filter. Fouling of the PES membranes
by casein is attributed to hydrophobic interactions between the protein and the membrane
material, as other authors have stated 17.

70
Figure 3.3: Cross-sectional CLSM images of casein/casein–FITC binding within an asymmetric 0.65 μm PES membrane measured 4 μm below the surface of the cross-section. Feed was 25 mg/L casein (1:20 fluorescently labeled to non-labeled protein). The dense surface is on the LEFT of all images. Images are for samples taken after processing 125 mL permeate volume (LEFT), 250 mL permeate volume (MIDDLE), and 500 mL permeate volume (RIGHT). The scale indicator is 10 μm in diameter.
The bright spots on Figure 3.3 are attributed to accumulation of protein aggregates in ‘blind
pores’. To quantify the mass of casein observed in the CLSM images, we used a calibration
curve developed in a previous publication that relates intensity to the mass of fluorescent dye per
membrane area for casein-FITC 24. The left-hand ordinate in Figure 3.4 presents the average
intensity versus depth corresponding to images in Figure 3.3, while the right-hand ordinate
presents the mass of casein foulant per area obtained based on the calibration curve. Casein tends
to accumulate more towards the dense side of the membrane, and the mass of casein within the
membrane increases with increasing volume of permeate that is collected. However, the
apparent increases are not statistically significant based on measurement uncertainties at these
low intensity values.
Figure 3.5 shows the CLSM images of membranes post filtration of single component β-
cyclodextrin solutions. The adsorption of β-cyclodextrin to the PES membrane occurs through
van der Waals interactions and hydrogen bonding between hydroxyl groups of dextran (donor)
and the oxygen atoms in the SO2 group of PES (acceptor) 17, 36. To quantify the mass of

71
Figure 3.4: Intensity profiles for the cross-sectional CLSM images of casein/casein–FITC binding (Figure 3.3) within an asymmetric 0.65 μm PES membrane measured 4 μm below the surface of the cross-section, after filtering a single-component solution. Profiles are for samples taken after processing 125 mL permeate volume (●), 250 mL permeate volume (○), and 500 mL permeate volume (▼). Please note that the y-axis range in this figure is different from that used for mixed-component systems in Figure 3.8 and Figure 3.12. Error bars represent the standard deviation of the measurements.
polysaccharide within the membrane, we developed a calibration curve for β-cyclodextrin-RITC
to relate intensity captured in CLSM images to the mass of β-cyclodextrin-RITC per area
(calibration curve is included in the Supplementary Materials). Consequently, by knowing the
ratio of fluorescently labeled to non-labeled component, we can determine the mass of foulant
within the membrane. The development of the β-cyclodextrin-RITC calibration curve was done
following the procedure explained by Marroquin et al. 24. Figure 3.6 presents the average
intensity versus depth and the mass of β-cyclodextrin per area at different depths within the
membranes corresponding to images in Figure 3.5. A slight accumulation of the polysaccharide
Depth (microns)
020406080100120140
Inte
nsity
0
20
40
60
80
100
g C
asein
/cm
2
0.0
0.1
0.2
0.3

72
is observed on the surface of the membrane facing the feed and also on the dense surface.
Accumulation of β-cyclodextrin on the surface facing the feed is attributed to the presence of
aggregates in solution. Interchain and intrachain interactions in neutral polysaccharides like β-
cyclodextrin are stabilized by a large number of hydrogen bonds, causing a relatively low
solubility for this kind of polysaccharide 37. Accumulation of a neutral polysaccharide also was
observed during the microfiltration of dextran solutions with PES asymmetric membranes (same
membrane orientation) in a previous study 24.
Figure 3.5: Cross-sectional CLSM images of β-cyclodextrin/β-cyclodextrin–RITC binding within an asymmetric 0.65 μm PES membrane measured 4 μm below the surface of the cross-section. Feed was (a) 50 mg/L β-cyclodextrin (1:20 fluorescently labeled to non-labeled polysaccharide), and (b) 200 mg/L β-cyclodextrin (1:20). The dense surface is on the Left of all images. Images are for samples taken after processing 125 mL permeate volume (Left), 250 mL permeate volume (Middle), and 500 mL permeate volume (Right). The scale indicator is 10 μm in diameter.

73
Figure 3.6: Intensity profiles for the cross-sectional CLSM images of β-cyclodextrin/β-cyclodextrin–RITC binding (Figure 3.5) within an asymmetric 0.65 μm PES membrane measured 4 μm below the surface of the cross-section, after filtering (a) 50 mg/L and (b) 200 mg/L single-component solutions. Profiles are for samples taken after processing 125 mL permeate volume (●), 250 mL permeate volume (○), and 500 mL permeate volume (▼). Error bars represent the standard deviation of the measurements.
Figure 3.7 shows the CLSM images of the PES membranes that processed the mixture of
casein and tannic acid (25 and 150 mg/L respectively). The casein and tannic acid mixture
significantly fouls the PES membrane compared to the minimal fouling observed during
filtration of the casein and tannic acid single component solutions. We can explain this result
based on the combination of solute-membrane interactions (i.e., hydrophobic adsorption of
casein to PES membrane) and perhaps more significantly solute-solute interactions (i.e., casein
and tannic acid association by hydrophobic interactions and hydrogen bonding) contributing to
severe flux decline. After collecting 125 mL of permeate, protein accumulated mostly on the
dense side of the membrane and the top surface facing the feed. After collecting 250 mL of
permeate, protein fouling on the dense side of the membrane and the surface facing the feed has
increased (perceived by a more intense green color in Figure 3.7). After collecting 500 mL of
Depth (microns)020406080100120140
Inte
nsity
0
20
40
60
80
100
120
g
-cyc
lode
xtrin
/cm
2
0.0
0.1
0.2
0.3
0.4
Depth (microns)020406080100120140
Inte
nsity
0
20
40
60
80
100
120
g
-cyc
lode
xtrin
/cm
2
0.0
0.1
0.2
0.3
0.4

74
permeate, protein fouling within the membrane has increased, and the highly fouled region close
to the dense side of the membrane is thicker. Additionally, in Figure 3.7, we did not observe the
bright spots seen in Figure 3.3. It appears that casein aggregates now are bound together by
tannic acid and are retained by size-based sieving on the membrane surface facing the feed.
Figure 3.8 shows the corresponding average intensity versus depth and the mass of casein per
area at different depths within the membranes corresponding to Figure 3.7. The intensity of the
green color is higher at the surface facing the feed compared to the bulk of the membrane and
increases again towards the dense surface. The high intensity on the feed side denotes
accumulation of protein aggregates caused by the presence of tannic acid.
Figure 3.7: Cross-sectional CLSM images of casein/casein-FITC binding within an asymmetric 0.65 μm PES membrane measured 4 μm below the surface of the cross-section. Feed comprised 25 mg/L casein (1:20 fluorescently labeled to non-labeled protein) and 150 mg/L tannic acid. The dense surface is on the Left of all images. Images are for samples taken after processing 125 mL permeate volume (Left), 250 mL permeate volume (Middle), and 500 mL permeate volume (Right). The scale indicator is 10 μm in diameter. (For interpretation of the references to color in this figure, the reader is referred to the web version of this article.)

75
Figure 3.8: Intensity profiles for the cross-sectional CLSM images of casein/casein–FITC binding (Figure 3.7) within an asymmetric 0.65 μm PES membrane measured 4 μm below the surface of the cross-section, after filtering a solution comprising 25 mg/L casein and 150 mg/L tannic acid. Profiles are for samples taken after processing 125 mL permeate volume (●), 250 mL permeate volume (○), and 500 mL permeate volume (▼). Error bars represent the standard deviation of the measurements
Figure 3.9 shows the CLSM images of the PES membranes that processed the mixture of
casein (25 mg/L), tannic acid (150 mg/L), and β-cyclodextrin (50 mg/L). After collecting 250 mL
of permeate, little protein has accumulated on the surface facing the feed compared to the case of
the casein-tannic acid binary mixture. Only after 500 mL of permeate has been collected do we
see significant accumulation of casein on the surface. It appears that 50 mg/L of β-cyclodextrin
in solution is an appropriate amount of polysaccharide to minimize the aggregation of protein by
polyphenol.
Depth (microns)
020406080100120140
Inte
nsity
0
200
400
600
800
1000
g C
asein
/cm
2
0
1
2
3

76
Figure 3.9: Cross-sectional CLSM images of casein/casein–FITC and β-cyclodextrin/β-cyclodextrin–RITC binding within an asymmetric 0.65 μm PES membrane measured 4 μm below the surface of the cross-section. Feed comprised 25 mg/L casein (1:20 fluorescently labeled to non-labeled protein), 150 mg/L tannic acid, and 50 mg/L β-cyclodextrin (1:20 fluorescently labeled to non-labeled polysaccharide). The dense surface is on the Left of all images. TOP row images are for samples taken after processing 125 mL permeate volume: casein (Left), β-cyclodextrin (Middle), superimposed image of casein and β-cyclodextrin (Right). Second row images are for samples taken after processing 250 mL permeate volume. Bottom row images are for samples taken after processing 500 mL permeate volume. The scale indicator is 10 μm in diameter.

77
Figure 3.10 shows the CLSM images of the PES membranes that processed the ternary
mixture of casein (25 mg/L), tannic acid (150 mg/L), and β-cyclodextrin (200 mg/L). Shown are
the individual and overlaid fouling profiles for casein and β-cyclodextrin at different levels of
fouling. Our expectation was that a higher concentration of the polysaccharide would disrupt the
interactions between casein and tannic acid more effectively than the 50 mg/L concentration of
polysaccharide. Rather, higher levels of casein and β-cyclodextrin accumulated within the
membrane when using the polysaccharide at a higher concentration. This result was consistent
with the observed acceleration in flux decline, and may be attributed to the excess of β-
cyclodextrin (relative to what is needed to bind tannic acid), along with formation of a larger
complex, that may be attributed to ternary casein-β-cyclodextrin-tannic acid aggregates. Thus,
adding more polysaccharide to a casein-tannic acid mixture to disrupt their interactions is
counterproductive.
Figure 3.11 shows the CLSM images of the PES membranes that processed the mixture of
casein (25 mg/L), tannic acid (150 mg/L), and β-cyclodextrin (25 mg/L). There is an increase in
the color intensity compared to the previous case using 50 mg/L β-cyclodextrin, indicating a
higher amount of casein-FITC and β-cyclodextrin-RITC within the membrane. Also,
accumulation of casein on the membrane surface facing the feed is observed even at early stages
of the filtration (125 mL permeate volume).

78
Figure 3.10: Cross-sectional CLSM images of casein/casein–FITC and β-cyclodextrin/β-cyclodextrin–RITC binding within an asymmetric 0.65 μm PES membrane measured 4 μm below the surface of the cross-section. Feed comprised 25 mg/L casein (1:20 fluorescently labeled to non-labeled protein), 150 mg/L tannic acid, and 200 mg/L β-cyclodextrin (1:20 fluorescently labeled to non-labeled polysaccharide). The dense surface is on the Left of all images. Top row images are for samples taken after processing 125 mL permeate volume: casein (Left), β-cyclodextrin (Middle), superimposed image of casein and β-cyclodextrin (Right). Second row images are for samples taken after processing 250 mL permeate volume. Bottom row images are for samples taken after processing 500 mL permeate volume. The scale indicator is 10 μm in diameter.

79
Figure 3.11: Cross-sectional CLSM images of casein/casein–FITC and β-cyclodextrin/β-cyclodextrin–RITC binding within an asymmetric 0.65 μm PES membrane measured 4 μm below the surface of the cross-section. Feed comprised 25 mg/L casein (1:20 fluorescently labeled to non-labeled protein), 150 mg/L tannic acid, and 25 mg/L β-cyclodextrin (1:20 fluorescently labeled to non-labeled polysaccharide). The dense surface is on the Left of all images. TOP row images are for samples taken after processing 125 mL permeate volume: casein (Left), β-cyclodextrin (Middle), superimposed image of casein and β-cyclodextrin (Right). Second row images are for samples taken after processing 250 mL permeate volume. Bottom row images are for samples taken after processing 500 mL permeate volume. The scale indicator is 10 μm in diameter.

80
From these observations, 25 mg/L of β-cyclodextrin (4:1 polyphenol/polysaccharide) in
solution appears to be insufficient to sequester all or the majority of tannic acid in solution, and
there is still significant protein-polyphenol aggregation. This conclusion is supported by DLS
measurements, which show a large number of aggregates in the mixture containing 25 mg/L of β-
cyclodextrin that are larger in size than those present in the ternary mixture containing 50 mg/L
polysaccharide. Also, there were more 26 nm aggregates present, which have been attributed to
protein-polyphenol aggregates (Figure 3.2).
Figure 3.12 shows the comparison of intensity and concentration profiles for Figure 3.9−11.
As expected, the intensity and the mass of foulants within the membranes increase with permeate
volume. Also, as expected from the flux data and visual inspection of the CLSM images, the
lowest intensity and therefore mass of foulants corresponds to the case for 50 mg/L β-
cyclodextrin. In most cases, the intensity and mass of foulants were similar for 200 mg/L or 25
mg/L of β-cyclodextrin in solution; although, in some cases, the intensity of the former was
higher.

81
Figure 3.12: Intensity profiles for the cross-sectional CLSM images of casein/casein–FITC and β-cyclodextrin/β-cyclodextrin–RITC binding (figure 3.9, figure 3.10, and figure 3.11) within asymmetric 0.65 μm PES membranes measured 4 μm below the surface of the cross-section, after filtering these solutions: (○) 25 mg/L casein (1:20 fluorescently labeled to non-labeled protein), 150 mg/L tannic acid, 50 mg/L β-cyclodextrin (1:20 fluorescently labeled to non-labeled polysaccharide); (●) 25 mg/L casein (1:20), 150 mg/L tannic acid, 25 mg/L β-cyclodextrin (1:20); and (▼) 25 mg/L casein (1:20), 150 mg/L tannic acid, 200 mg/L β-cyclodextrin (1:20). Top row images are fouling profiles corresponding to casein. Bottom row images are fouling profiles corresponding to β-cyclodextrin. Samples taken after processing 125 mL permeate volume (Left), 250 mL (Middle), 500 mL (Right). Error bars represent the standard deviation of the measurements.
3.3.4 Fouling mechanisms
CLSM images presented in section 3.3 show us where the foulants tend to accumulate within
the membrane and help us to better understand or justify the trends observed in the flux
measurement results. It is also our interest to understand the fouling mechanisms that lead to the
results observed in the CLSM images and flux plots. We begin by analyzing the flux data
presented in Figure 3.1 with the Hermia model for constant pressure filtration (Equation 1).
Depth (microns)020406080100120140
Inte
nsity
0
200
400
600
800
1000
g C
asei
n/cm
2
0
1
2
3
Depth (microns)020406080100120140
Inte
nsity
0
200
400
600
800
1000
g C
asei
n/cm
2
0
1
2
3
Depth (microns)020406080100120140
Inte
nsity
0
200
400
600
800
1000
g C
asei
n/cm
2
0
1
2
3
Depth (microns)020406080100120140
Inte
nsity
0
20
40
60
80
100
120
g
-cyc
lode
xtrin
/cm
2
0.0
0.1
0.2
0.3
0.4
Depth (microns)020406080100120140
Inte
nsity
0
20
40
60
80
100
120
g
-cyc
lode
xtrin
/cm
2
0.0
0.1
0.2
0.3
0.4
Depth (microns)020406080100120140
Inte
nsity
0
20
40
60
80
100
120
g
-cyc
lode
xtrin
/cm
2
0.0
0.1
0.2
0.3
0.4

82
∂2t∂V2
= k �∂t∂V�n (1)
In Equation 1, t and V are the filtration time and cumulative permeate volume (m3),
respectively. ∂t/∂V is the reciprocal of the permeate volumetric flow rate; ∂2t/∂V2 is defined as
the resistance coefficient, or the rate of change of the instantaneous resistance to filtration with
respect to permeate volume; and k and n are two model parameters, where n depends on the
fouling model or mechanism (n = 0 for cake filtration, n = 1 for intermediate blocking, n = 2 for
complete blocking, and n = 1.5 for standard blocking). For the detailed discussion of the
underlying assumptions and mathematical development of Equation 1, please refer to the
publication by Hermia 38. The fouling mechanism occurring during a filtration (n parameter) is
obtained from the Hermia model equation by plotting on a logarithmic scale ∂2t/∂V2 versus
∂t/∂V.
By analyzing the flux data from Figure 3.1 with the Hermia model, we observed values for
the n parameter greater than 2 (the maximum value for the Hermia model) during early stages of
filtration of the binary and ternary mixtures (permeate volume less than 125 mL). Other
researchers have observed n > 2 during studies on the fouling of microfiltration membranes with
interconnected pores 19, 39. Based on these earlier studies, we attribute the steep initial slope in
the log(∂2t/∂V2) versus log (∂t/∂V) plots to the fact that liquid can flow under and around any
blocked pore due to highly interconnected pore structure of the PES membranes used in this
study. Also, it was observed that the slope decreased throughout the course of the filtration, and,
at the end of the experiment, the n parameter was close to 1 for casein/tannic acid, casein/tannic
acid/β-cyclodextrin (200 mg/L) and casein/tannic acid/β-cyclodextrin (25 mg/L) mixtures,
indicating intermediate pore blocking as the fouling mechanism. Towards the end of the filtration
of the casein/tannic acid/β-cyclodextrin (50 mg/L) mixture, the n parameter was close to 1.5,

83
indicating that the mechanism of fouling is standard blocking. The results from the Hermia
model analysis are coherent with the observations in CLSM image analysis and flux
measurements. The 50 mg/L concentration of β-cyclodextrin (2:1 polyphenol to polysaccharide)
in the casein-tannic acid mixtures is capable of decreasing or preventing the protein-polyphenol
aggregation and thereby changing the fouling mechanism from intermediate pore blocking to
standard pore blocking, where the smaller aggregates present in this mixture adsorb on the
surface of the pore walls leading to pore constriction over time. While in the case of the binary
casein-tannic acid mixture, the larger aggregates are capable of blocking the pores, consistent
with the definition of intermediate blocking.
3.4 Conclusions
CLSM has proved to be a useful tool for visualizing the fouling within asymmetric
membranes when filtering casein, tannic acid and β-cyclodextrin mixtures. By using our cross-
sectional CLSM imaging protocol, we have overcome the limit of depth of penetration and
obtained quantitative information on the masses of protein and polysaccharide deposited
throughout the entire thickness of asymmetric microfiltration membranes at different degrees of
fouling.
Evidence of association between the protein casein and the polyphenol tannic acid was
obtained from flux and DLS data, as well as CLSM images. The effect of adding the
polysaccharide β-cyclodextrin to the casein-tannic acid mixture was studied. Polysaccharides are
known to disrupt protein-polyphenol interactions, and a 2:1 polyphenol to polysaccharide ratio
was most effective for limiting flux decline associated with casein-tannic acid aggregates. Ratios
below or above this ‘sweet spot’ were less effective at preventing severe, rapid flux decline.
Information on the fouling mechanisms occurring during microfiltration was obtained by

84
analyzing flux data with the Hermia model, and it was found that, at the end of the filtration
experiments, the dominant fouling mechanism was intermediate pore blocking for the cases
where significant fouling was observed (casein/tannic acid, casein/tannic acid/β-cyclodextrin 200
mg/L, and casein/tannic acid/β-cyclodextrin 25 mg/L); whereas, standard pore blocking was
observed for the mixture containing a 2:1 polyphenol to polysaccharide ratio (casein/tannic
acid/β-cyclodextrin 50 mg/L). The results from the Hermia model analysis are coherent with the
qualitative and quantitative CLSM image analysis of the CLSM images.
Lastly, CLSM allows the direct visualization, location and quantification of foulants
(individually) within microfiltration membranes. Additionally, CLSM imaging of the fouled
membranes, along with the flux decline plots and analysis of the flux data with fouling models,
helps in the description and understanding of the root cause(s) of fouling. Another advantage of
using CLSM imaging in the study of MF membrane fouling is that it provides direct visual
information on how individual foulants deposit within the membranes. This information can be
used to infer the fouling mechanism(s) when fouling models that are based on assumed
membrane structure, such as the Hermia model, do not apply or fail to provide physically
meaningful information (e.g., during the early stages of filtration in this study).
References
1. Hubbard, A.T. Encyclopedia of surface and colloid science. Marcel Dekker, New York, 2002. 2. Starbard, N. Beverage industry microfiltration. Wiley-Blackwell, Ames, Iowa, 2008. 3. Soares, S.I., Goncalves, R.M., Fernandes, I., Mateus, N., Freitas, V. D. Mechanistic approach by which polysaccharides inhibit alpha-amylase/procyanidin aggregation, J. Agric. Food Chem., 57: 4352-4358, (2009). 4. Ma, W., Baron, A., Guyot, S., Bouhallab, S., Zanchi, D. Kinetics of the formation of beta-casein/tannin mixed micelles, RSC Adv., 2: 3934-3941, (2012).

85
5. Kuroda, Y., Hara, Y. Health effects of tea and its catechins. Kluwer Academic/Plenum Publishers, New York, 2004. 6. Freitas, V. D., Carvalho, E., Mateus, N. Study of carbohydrate influence on protein-tannin aggregation by nephelometry, Food Chem., 81: 503-509, (2003). 7. Jobstl, E., O'Connell, J., Fairclough, J.P.A., Williamson, M.P. Molecular model for astringency produced by polyphenol/protein interactions, Biomacromolecules, 5: 942-949, (2004). 8. Shukla, A., Narayanan, T., Zanchi, D. Structure of casein micelles and their complexation with tannins. Soft Matter, 5: 2884-2888, (2009). 9. Brown, P.J., Wright, W.B. An investigation of the interactions between milk proteins and tea polyphenols. J. Chromatogr. A., 11: 504-514, (1963). 10. Yan, Y., Hu, J., Yao, P. Effects of casein, ovalbumin, and dextran on the astringency of tea polyphenols determined by quartz crystal microbalance with dissipation. Langmuir, 25: 397-402, (2009). 11. Zanchi, D., Narayanan, T., Hagenmuller, D., Baron, A., Guyot, S., Cabane, B., Bouhallab, S. Tannin-assisted aggregation of natively unfolded proteins. EPL, 82 (2008). 12. Zator, M., Ferrando, M., Lopez, F., Guell, C. Microfiltration of protein/dextran/polyphenol solutions: Characterization of fouling and chemical cleaning efficiency using confocal microscopy. J. Membr. Sci., 344: 82-91, (2009). 13. Freitas, V. de, Mateus, N. Nephelometric study of salivary protein-tannin aggregates. J. Sci. Food Agr., 82: 113-119, (2002). 14. Ozawa, T., Lilley, T. H., Haslam, E. Polyphenol interactions .3. polyphenol interactions - astringency and the loss of astringency in ripening fruit. Phytochemistry, 26: 2937-2942, (1987). 15. Carvalho, E., Povoas, M. J., Mateus, N., Freitas, V. D. Application of flow nephelometry to the analysis of the influence of carbohydrates on protein-tannin interactions. J. Sci. Food Agr., 86: 891-896, (2006). 16. Mateus, N., Carvalho, E., Luis, C., Freitas, V. D. Influence of the tannin structure on the disruption effect of carbohydrates on protein-tannin aggregates. Anal. Chim. Acta., 513: 135-140, (2004). 17. Susanto, H., Franzka, S., Ulbricht, M. Dextran fouling of polyethersulfone ultrafiltration membranes - Causes, extent and consequences. J. Membr. Sci., 296: 147-155, (2007). 18. Zator, M., Ferrando, M., Lopez, F., Guell, C. Membrane fouling characterization by confocal microscopy during filtration of BSA/dextran mixtures. J. Membr. Sci., 301: 57-66, (2007).

86
19. Yazdanshenas, M., Soltanieh, M., Nejad, S. A. R. T., Fillaudeau, L. Cross-flow microfiltration of rough non-alcoholic beer and diluted malt extract with tubular ceramic membranes: Investigation of fouling mechanisms. J. Membr. Sci., 362: 306-316, (2010). 20. Loh, S., Beuscher, U., Poddar, T. K., Porter, A. G., Wingard, J. M., Husson, S. M., Wickramasinghe, S. R. Interplay among membrane properties, protein properties and operating conditions on protein fouling during normal-flow microfiltration. J. Membr. Sci., 332: 93-103, (2009). 21. Vernhet, A., Moutounet, M. Fouling of organic microfiltration membranes by wine constituents: importance, relative impact of wine polysccharides and polyphenols and incidence of membrane properties. J. Membr. Sci., 201: 103-122, (2002). 22. Ferrando, M., Rozek, A., Zator, M., Lopez, F., Guell, C. An approach to membrane fouling characterization by confocal scanning laser microscopy. J. Membr. Sci., 250: 283-293, (2005). 23. Hwang, B.-K., Lee, C.-H., Chang, I.-S., Drews, A., Field, R. Membrane bioreactor: TMP rise and characterization of bio-cake structure using CLSM-image analysis. J. Membr. Sci., 419: 33-41, (2012). 24. Marroquin, M., Vu, A., Bruce, T., Wickramasinghe, S. R., Husson, S. M. Location and Quantification of Biological Foulants in a Wet Membrane Structure by Cross-sectional Confocal Laser Scanning Microscopy, J. Membr. Sci., 453: 282-291, (2014). 25. Snyder, M.A., Vlachos, D.G., Nikolakis, V. Quantitative analysis of membrane morphology, microstructure, and polycrystallinity via laser scanning confocal microscopy: Application to NaX zeolite membranes. J. Membr. Sci., 290: 1-18, (2007). 26. Marroquin, M., Bruce, T., Pellegrino, J., Wickramasinghe, S. R., Husson, S. M. Characterization of asymmetry in microporous membranes by cross-sectional confocal laser scanning microscopy. J. Membr. Sci., 379: 504-515, (2011). 27. Bonilla, G., Tsapatsis, M., Vlachos, D. G., Xomeritakis, G. Fluorescence confocal optical microscopy imaging of the grain boundary structure of zeolite MFI membranes made by secondary (seeded) growth. J. Membr. Sci., 182: 103-109, (2001). 28. Reichert, U., Linden, T., Belfort, G., Kula, M. R., Thommes, J. Visualising protein adsorption to ion-exchange membranes by confocal microscopy. J. Membr. Sci., 199: 161-166, (2002). 29. Wickramasinghe, S. R., Carlson, J. O., Teske, C., Hubbuch, J., Ulbricht, M. Characterizing solute binding to macroporous ion exchange membrane adsorbers using confocal laser scanning microscopy. J. Membr. Sci., 281: 609-618, (2006).

87
30. Schmidt, C., Toepfer, O., Langhoff, A., Oppermann, W., Schmidt-Naake, G. Depth profiling of graft polymer membranes via confocal laser scanning microscopy. Chem. Mater., 19: 4277-4282, (2007). 31. Basic Confocal Microscopy. Springer, New York, 2011. Print. 32. Wang, J., Dismer, F., Hubbuch, J., Ulbricht, M. Detailed analysis of membrane adsorber pore structure and protein binding by advanced microscopy. J. Membr. Sci., 320: 456-467, (2008). 33. Belder, A. N. D., Granath, K. Preparation and properties of fluorescein-labeled dextrans. Carbohydr. Res., 30: 375-378, (1973). 34. Haslam, E. Polyphenol-protein interactions. Biochem. J., 139: 285-288, (1974). 35. Gebhardt, R., Doster, W., Friedrich, J., Kulozik, U. Size distribution of pressure-decomposed casein micelles studied by dynamic light scattering and AFM. Eur Biophys J., 35: 503-509, (2006). 36. Susanto, H., Ulbricht, M. Influence of ultrafiltration membrane characteristics on adsorptive fouling with dextrans. J. Membr. Sci., 266: 132-142, (2005). 37. Rinaudo, M. Relation between the molecular structure of some polysaccharides and original properties in sol and gel states. Food Hydrocolloids, 15: 433-440, (2001). 38. Hermia, J. Constant pressure blocking filtration laws - application to power-law non-newtonian fluids. Trans. Inst. Chem. Eng., 60: 183-187, (1982). 39. Bhattacharyya, D., Butterfield, D. A. New insights into membrane science and technology: polymeric and biofunctional membranes. 1st ed., Elsevier, Amsterdam; Boston, 2003.

88
Chapter 4
Fouling of microfiltration membranes by biopolymers3
Summary
Suppression of fouling due to biopolymers of relevance to the brewing industry has been
investigated. The effects of three model biopolymers: casein (protein); catechin (polyphenol)
and dextran (polysaccharide) on fouling of asymmetric 0.65 µm polyethersulfone membranes
during direct-flow filtration have been studied. While dextran is successful in disrupting
interactions between casein and catechin, the associated reduction in aggregate size does not
always result in reduced fouling. Solution conditions such as pH and ionic strength modulate the
tendency of the aggregates to adsorb onto the membrane surface. Thus optimizing solution
conditions to suppress adsorption of aggregates is essential for increasing the membrane
filtration capacity.
4.1 Introduction
Microfiltration is frequently used commercially for removal of insoluble particulate matter in
the size range 0.02–10 μm 1-3. In these applications, fouling negatively affects membrane
performance, decreases filtration capacity, and shortens membrane life. Predicting the effect of
fouling on membrane performance is complicated. The degree of fouling and its effects on
performance depend on the interplay among three main groups of variables: membrane
properties, feed properties and operating conditions. In earlier work using model feed streams
consisting of single proteins (bovine serum albumin or hemoglobin), we showed the importance
of the interplay among these groups of variables on the degree of flux decline 4. Direct-flow
3 Vu, A., Darvishmanesh, S., Marroquin, M., Husson, S. M., Wickramasinghe, S. R. Fouling of microfiltration membranes by biopolymers. Separation Science and Technology. 51(8), 1370-1379, 2016.

89
filtration experiments were conducted using membranes with nominal pore diameters ranging
from 0.45 to 0.6 µm. Even though the proteins were over an order of magnitude smaller than the
nominal pore size of the membranes, significant flux decline was frequently observed.
In this contribution, we focus on feed streams of relevance to the food and beverage industry,
where microfiltration is used for water treatment and wine and beer clarification 5-7. Of particular
interest is beer filtration, in which the feed stream is a complex mixture consisting of
carbohydrates such as pentosans and β-glucans, proteins and polyphenols. Formation of protein-
polyphenol complexes (haze formation) is of particular importance as they are known to be
responsible for membrane fouling 8.
Tangential flow microfiltration has been investigated in the brewing industry since the
1980s6. However unlike the dairy, fruit juice and wine industries, severe flux decline as well as
protein and aroma retention have made commercial implementation much slower. Previous
investigators 9, 10 have observed that when using 0.5 µm and 0.22 µm pore size membranes for
solids removal, the permeate lacks dissolved species essential for bitterness, aroma and foam
retention. Since the membrane pores are much larger than the dissolved species, rejection is due
to membrane fouling. Blanpain-Avet et al. 11 investigated fouling of 0.22 µm polycarbonate
membranes. They concluded that permeate flux decline occurred in two stages. Initially there
was internal pore fouling followed by external surface fouling. Retention of soluble species
depended on the degree of fouling. Initially there was little retention. During internal pore
fouling they observed low but constant retention. Eventual formation of a gel layer on the
membrane surface led to significant retention of dissolved species.
Our earlier studies focused on location and quantification of biological foulants during
microfiltration 12, 13. Model single-component feed streams consisting of protein (casein),

90
polyphenol (tannic acid) and polysaccharide (β-cyclodextran) were investigated. To study the
effect of solute-solute interactions, feed streams consisting of a binary mixture of protein and
polyphenol were investigated. In addition, ternary-component feed streams consisting of protein,
polyphenol and polysaccharide were studied. The results indicated that for complex feed streams
of relevance to the brewing industry, interactions among these different solute types have a
significant effect on membrane fouling and consequently performance. In particular, association
between the protein and polyphenol leads to the formation of large aggregates that contribute to
significant flux decline and membrane fouling. Polysaccharides can disrupt the protein-
polyphenol interactions, limiting flux decline and increasing membrane filtration capacity.
Here we extend this previous work by evaluating the roles of solution pH and ionic strength
on flux decline in these systems. Our hypothesis was that changes in solute-solute interactions
due to different feed conditions will lead to the formation of different sized aggregates and,
hence, different rates and levels of flux decline. Single-component feed streams consisting of
casein (protein), catechin (polyphenol) and dextran (polysaccharide); binary-component feed
streams consisting of casein and catechin; as well as ternary-component feed streams consisting
of casein, catechin and dextran were tested using an asymmetric 0.65 µm polyethersulfone
membrane. Direct-flow filtration measurements were conducted over a range of pH values and
ionic strength. By investigating model feed streams we have been able to conduct experiments
under controlled conditions where we have eliminated the natural variability that arises from real
feed streams. Our results highlight the importance of feed conditions on microfiltration
performance for complex mixtures of biopolymers that are relevant to the beer industry.

91
4.2 Experimental materials and methods
4.2.1 Chemicals
Casein from bovine milk (Product code C6554), (+)-catechin hydrate (C1251) and dextran
from Leuconostoc mesenteroides (MW 9-11kDa, D9260), were purchased from Sigma Aldrich
(St. Louis, MO). Table 4.1 gives further details of the three feed components. Phosphate buffer
solutions were prepared using anhydrous dibasic sodium phosphate, >99% (71640) and
anhydrous monobasic sodium phosphate, >98% (S3139) from Sigma Aldrich and deionized (DI)
Milli-Q system (EMD Millipore, Billerica, MA) water. Buffer ionic strengths of 0.125 M and
0.250 M were prepared at pH values of 5.50, 6.25 and 7.00.
A stock solution of casein (2.5 mg/ml) was prepared by mixing the casein powder in a
0.04 M sodium hydroxide solution (0583) purchased from VWR and stirring at 250 rpm for 4 h
facilitated casein dissolution. A stock solution of (+)-catechin hydrate (25 mg/ml) was prepared
by mixing the (+)-catechin hydrate powder in DI water for 1 h. A stock solution of dextran (25
mg/ml) was prepared by mixing the dextran powder in DI water for 1 h. Single component
casein, (+)-catechin and dextran solutions were prepared with a final concentration of 25 mg/L in
phosphate buffer solution. Binary component solutions were prepared with a final concentration
of 25 mg/L comprising 50:50 (w/w) protein–polyphenol in phosphate buffer solution. Ternary
component solutions were prepared with a final concentration of 25 mg/L comprising 8.3 mg/mL
of each component.

92
Table 4.1: Molecular structure of foulants used in this study along with important properties.
Chemical name casein (+)-catechin dextran
structure
Molecular weight 22000-23000 g/mol 290.26 g/mol 9000-11000 g/mol
comments IEP=4.6 pKa=8.64 Branched dextran consisting of α-1,6 and α-1,3 linkages
4.2.2 Membrane filtration
Asymmetric polyethersulfone (PES) microfiltration membranes (Pall Corporation, NY) were
used for the filtration experiments. The Supor® PES membranes had a thickness of 114–175 μm
and nominal pore size of 0.65 μm. Membranes were pretreated before each measurement by
soaking them in a 25 vol% aqueous ethanol solution for 30 min and then DI water for 30 min.
An Amicon 8050 stirred cell from EMD Millipore was used for direct-flow filtration
experiments. The more open side of the asymmetric membranes was placed towards the feed
(opposite to conventional operation of these membranes). The effective membrane area was
13.4 cm2. Filtration experiments were carried out at constant pressure of 14 kPa and a constant
stirring speed of 250 rpm. The flux was recorded continuously as shown in Figure 4.1, and
filtration was stopped after 400 mL of permeate solution had been collected.

93
Figure 4.1: Microfiltration set-up
4.2.3 Scanning electron microscopy
SEM was used to characterize the surface morphology of the membrane. The images were
obtained using a FEI Nova Nanolab 200 Duo-Beam Workstation (Hillsboro, OR). Samples were
coated with 10 nm layer of gold and scanned using a 15 kV electron beam. In order to prevent
collapse of pores, critical point drying was conducted. The method involved soaking the samples
sequentially in ethanol/water solutions containing increasing amounts of ethanol. Finally the
samples were soaked in absolute ethanol. Next, the samples were placed inside a high pressure
stainless steel container. The container was flushed with supercritical CO2 at 37 °C and 8500 kPa
(85 bar), 3–5 times in order to replace all the ethanol in the membrane pores.
4.2.4 Dynamic light scattering measurements
Dynamic light scattering (DLS) was conducted to determine the level of aggregation of
dissolved component species in the feed streams using a DelsaNano HC particle analyzer
instrument (Beckman Coulter, Miami , FL) with a solid-state He–Ne laser at a scattering angle of
165°. Number average diameters were calculated from the autocorrelation function using Delsa
Nano HC particle size analyzer from Beckman Coulter with Delsa Nano program version 3.73 of
More open side up
Membrane cross section
Pressure supplied by nitrogen cylinder
Pressure vessel

94
the CONTIN algorithm.
4.3 Theory
Constant-pressure filtration may be described in terms of four models: standard blocking,
complete blocking, intermediate blocking and cake filtration 14, 15, 16. These blocking models are
based on Darcy’s law;
𝐽 = 𝑄𝐴
= 1𝐴𝑑𝑑𝑑𝑑
= 1𝐴
∆𝑃𝜇(𝑅𝑚+𝑅𝑐) (Eq. 1)
where J is the permeate flux, Q the permeate flow rate, A the membrane surface area, V the
filtrate volume, ∆P the pressure drop across the membrane, μ the viscosity of the feed stream,
and Rm and Rc the resistance of the membrane and cake layer. If one assumes the flow through
the membrane pores may be described by the Hagen Poiseuille law, then
𝐽 = 𝑄𝐴
= 𝑁𝑁𝑑4∆𝑃128𝜇𝜇
(Eq. 2)
where N is the number of pores, d is the diameter and l the length of the pores. The four blocking
models assume the membrane contains uniform straight pores that are perpendicular to the
membrane surface. Table 4.2 summarizes the blocking models. All four models assume that the
resistance to filtrate flow increases only with increasing filtrate volume. Hermia 15 defined a
resistance coefficient, R, for constant pressure filtration as the rate of change of the instantaneous
resistance to filtration with respect to the filtrate volume, which is given as the reciprocal of the
filtrate flow rate. Thus,
𝑅 = 𝑑𝑑𝑑�𝜇 𝑅𝑀+𝑅𝐶
∆𝑃� = 𝜅 𝑑
𝑑𝑑[𝑓(𝑄)] (Eq. 3)
where 𝜅 is a constant that includes µ and ∆P. The resistance depends on permeate volume and
hence permeate flowrate. Hermia 15 indicates that all four blocking models can be written as
𝑑2𝑑𝑑𝑑2
= 𝛼 �𝑑𝑑𝑑𝑑�𝛽
(Eq. 4)
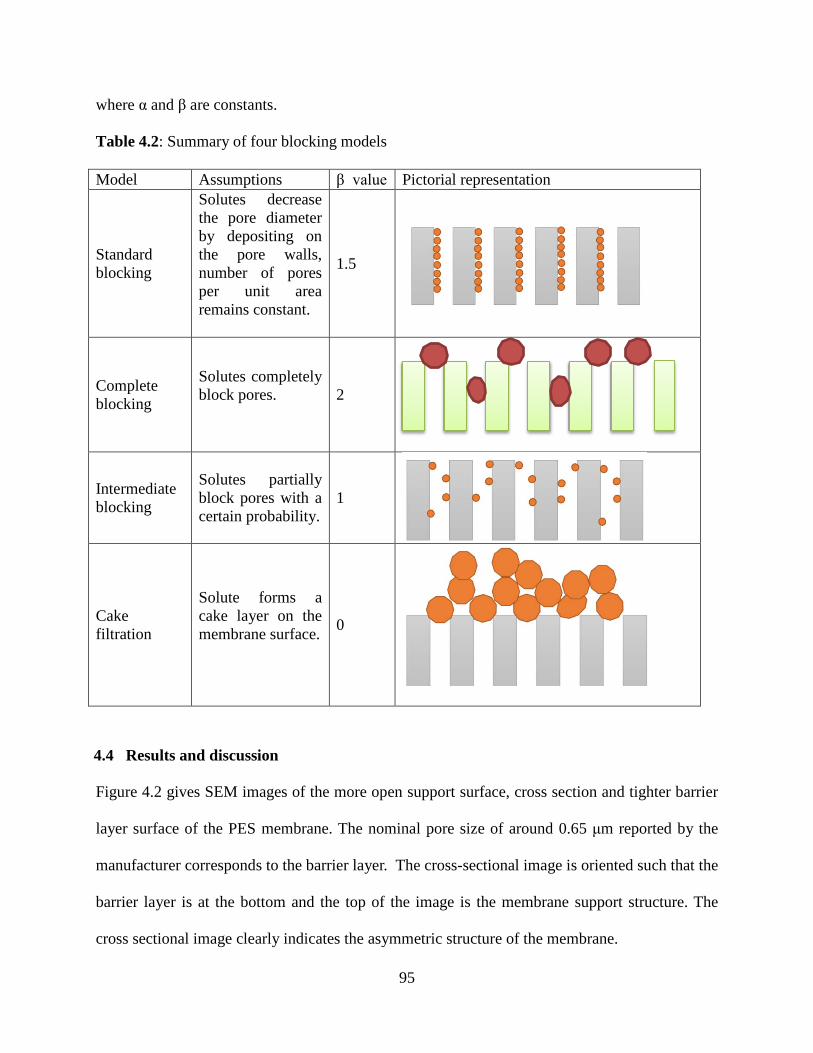
95
where α and β are constants.
Table 4.2: Summary of four blocking models
Model Assumptions β value Pictorial representation
Standard blocking
Solutes decrease the pore diameter by depositing on the pore walls, number of pores per unit area remains constant.
1.5
Complete blocking
Solutes completely block pores.
2
Intermediate blocking
Solutes partially block pores with a certain probability.
1
Cake filtration
Solute forms a cake layer on the membrane surface.
0
4.4 Results and discussion
Figure 4.2 gives SEM images of the more open support surface, cross section and tighter barrier
layer surface of the PES membrane. The nominal pore size of around 0.65 μm reported by the
manufacturer corresponds to the barrier layer. The cross-sectional image is oriented such that the
barrier layer is at the bottom and the top of the image is the membrane support structure. The
cross sectional image clearly indicates the asymmetric structure of the membrane.

96
a) support layer facing feed in this study magnification: 3500 X
b) membrane cross-section magnification: 500 X
c) barrier layer away from feed in this study magnification: 3500 X
Figure 4.2: SEM image of PES membrane: a) support layer facing the feed in this study (magnification: 3500 X); b) membrane cross-section (magnification: 500 X); c) barrier layer facing away from the feed in this study (magnification: 3500 X)
In our previous work 12, 13 we conducted constant-pressure, direct-flow filtration
experiments with the more open membrane surface facing the feed stream and used confocal
laser scanning microscopy to observe and quantify where biological foulants and their aggregates
accumulated within the membrane structure. This orientation of the membrane is used in depth
filtration applications to increase filtration capacity. Our aim here was to determine how different
100µm
10µm
10µm

97
feed conditions affect aggregate formation and hence fouling while membrane properties and
operating conditions are kept constant. Here we again use constant-pressure, direct-flow
filtration with the more open side of the membrane facing the feed stream. Changes in solute-
solute interactions due to different feed conditions will lead to the formation of different sized
aggregates. This in turn will lead to different rates and levels of flux decline.
Figure 4.3 gives the variations of permeate flux with permeate volume for the various
experimental conditions. Figures 4.3(a-c) give results at pH 5.50, 6.25 and 7.00 respectively for
an ionic strength of 0.125 M. Figures 4.3(d-e) are analogous for an ionic strength of 0.250 M.
Results are given for single-component casein, catechin and dextran feed streams, as well as
mixtures of casein and catechin and casein, catechin and dextran.
Figure 4.3 indicates that severe fouling occurs for casein feed streams. Change of pH or ionic
strength has no significant effect on the degree of fouling. Thus, hydrophobic interactions appear
to be more important than coulombic interactions under the study conditions. Casein contains a
high number of proline residues and no disulfide bridges. As a result, it has relatively little
tertiary structure and is relatively hydrophobic. Casein readily forms micelles in solution that are
known to be highly fouling 17,18. Jimenez-Lopez et.al 19 studied microfiltration of skimmed milk
at various ionic strengths to understand the formation of casein micelle deposits. They concluded
that with increasing ionic strength, the global charge of the casein micelles is reduced, which
lead to a decrease in repulsive interactions between micelles. Accordingly the hydrophobic
interactions between micelles increased. As a result, the micelles can associate and adsorb onto
hydrophobic membrane surfaces.

98
Figure 4.3: Variation of permeate flux with permeate volume for experimental conditions tested.
0
1000
2000
3000
4000
5000
0 100 200 300 400
Flux
(L/m
2 .h)
Volume (mL)
a) pH= 5.50, I= 0.125M
Casein
Catechin
Dextran
Mix-Cas-Cat
MixAll
0
1000
2000
3000
4000
5000
0 100 200 300 400
Flux
(L/m
2 .h)
Volume (mL)
d) pH= 5.50, I= 0.250M
Casein
Catechin
Dextran
Mix-Cas-Cat
MixAll
0
1000
2000
3000
4000
5000
0 100 200 300 400
Flux
(L/m
2 .h)
Volume (mL)
b) pH= 6.25, I=0.125M
Casein
Catechin
Dextran
Mix-Cas-Cat
MixAll
0
1000
2000
3000
4000
5000
0 100 200 300 400
Flux
(L/m
2 .h)
Volume (mL)
e) pH= 6.25, I= 0.250M
Casein
Catechin
Dextran
Mix-Cat-Cas
MixAll
0
1000
2000
3000
4000
5000
0 100 200 300 400
Flux
(L/m
2.h)
Volume (mL)
c) pH=7.00, I= 0.125M
Casein
Catechin
Dextran
Mix-Cas-Cat
MixAll0
1000
2000
3000
4000
5000
0 100 200 300 400
Flux
(L/m
2.h)
Volume (mL)
f) pH= 7.00, I= 0.250M
Casein
Catechin
Dextran
Mix-Cas-Cat
MixAll

99
Table 4.3 gives the number average size of particles in the casein feed streams at the two
different ionic strengths and three pH values. In all cases the measured diameter is around
210±20 nm indicating significant micelle formation in agreement with the 220 nm casein micelle
size reported by Marroquin et al. 12. These aggregates in solution are known to foul the
membrane due to hydrophobic interactions as we observed here12, 19.
The flux data presented in Figure 4.3 for casein were analyzed by the Hermia model 20
and the β values are given in Table 4.4. For all six feed conditions, the value of β is close to 2,
indicating complete pore blocking (see Table 4.2). Further evidence of this fouling mechanism is
provided by Marroquin et al. 12, 13. Using the same 0.65 µm PES membranes and fluorescently
labeled casein, they studied casein deposition with confocal laser scanning microscopy. The
more open side of the membrane was placed in contact with the feed stream as we do here.
Deposition of casein micelles was observed to develop from the inside surface of the barrier
layer of the membrane and then progress through the more open membrane support structure.
Taken together these results indicate that given the predominance of hydrophobic interactions,
suppression of these interactions and disrupting casein micelle formation will be essential to
minimize fouling by casein containing feed streams.
Figure 3 indicates that for catechin feed streams, pH and ionic strength affect the degree
of flux decline and hence fouling observed. For the lower pH values, there is much more severe
flux decline at higher ionic strength. However at pH 7, the degree of flux decline is independent
of ionic strength. Table 4.3 indicates that the average size of the polyphenol aggregates is slightly
smaller at higher ionic strength. This means that the differences in size-based sieving of catechin
aggregates at different conditions (pH and ionic strength) alone cannot explain the differences in
observed fouling. Thus fouling depends also on hydrophobic interactions and/or coulombic

100
interactions between the aggregates and the membrane.
Table 4.3: Particle size (nm) using dynamic light scattering for single- and multi-components solutions of casein, catechin, and dextran at different pH and ionic strengths. Average values plus a three standard deviation range is given. Ionic strength,
M pH=5.50 pH=6.25 pH=7.00
casein I=0.250 192 ±20 203 ±20 210 ±18 I=0.125 197 ±19 211 ±22 226 ±24
catechin I=0.250 160 ±20 129 ±18 118 ±16 I=0.125 206 ±19 171 ±20 169 ±25
dextran I=0.250 3 ±1 5 ±2 6 ±2 I=0.125 4 ±1.5 3 ±2 5 ±2
casein-catechin
I=0.250 126 ±17 151 ±17 140 ±17 I=0.125 166 ±16 235 ±27 265 ±27
casein-catechin-dextran
I=0.250 65 ±11 34 ±13.6 41 ±12 I=0.125 37 ±12 79 ±11 79 ±10
Catechin is an amphipathic molecule, with hydrophobic aromatic rings and hydrophilic
hydroxyl groups that can form hydrogen bonds. Increasing solution ionic strength will tend to
promote hydrophobic interactions between hydrophobic regions of the catechin molecule and the
membrane surface. Hu et al. 21 show the effect of hydrophobic and coulombic interactions on
adsorption of dyes on negatively and positively charged resin. They conclude that the
hydrophobic adsorption increases with increasing ionic strength while coulombic interaction
decreases. Figure 4.3 tends to support this observation; greater flux decline occurs for the higher
ionic strength feed streams. However for a high ionic strength feed stream at pH 7.00, a much
lower flux decline is observed even though the size of the aggregates is similar to those at pH
5.50 and 6.25 and high ionic strength (Table 4.3).
Catechin has a pKa1 of 8.64. Thus at the lower pH values tested, catechin will be neutral.
At pH 7, 2.2% of catechin molecules will be charged negatively. The PES membranes have been
reported to have a negative zeta potential 22-24. Thus at all pH values investigated here the
membrane will be negatively charged. Our results indicate that while hydrophobic interactions

101
are favored at higher ionic strength, the degree of fouling that occurs depends not just on
hydrophobic interactions but also coulombic interactions. It appears that at pH 7, adsorption of
catechin aggregates on the membrane surface is suppressed by the presence of a low percentage
of negatively charged catechin molecules within the aggregates25.
The results for catechin and casein indicate the importance of the interplay between
hydrophobic and coulombic interactions. Table 4.3 indicates that based on the number average
particle size, in the absence of attractive interactions (hydrophobic or coulombic) between the
aggregates and the membrane, aggregates can pass through the membrane without causing
severe fouling. Further, the degree of fouling depends greatly on the strength of these
interactions, as observed by the severe fouling by casein (strong hydrophobic interactions at all
conditions) and pH/ionic strength dependent fouling by catechin (less hydrophobic).
Figure 4.3 indicates that at low ionic strength dextran containing feed streams pass
through the membrane pores relatively unhindered and little flux decline is observed. At high
ionic strength, the same observation holds except at pH 5.50 where noticeable flux decline is
observed during filtration. Table 4.3 indicates that little aggregation of dextran is observed. The
branched dextran used here is not expected to aggregate.
Dextran adsorption on PES membranes has been observed by others. Susanto et al. 26
conducted experiments using porous and nonporous PES membranes and confirmed that dextran
adsorbed to the PES surface. A similar result was observed by Marroquin et al. 12. Susanto et al.
26 explained the PES-dextran interaction by considering multivalent hydrogen bonding between
dextran and the membranes and water structure and reactivity at solid surfaces. Water is bound
weakly to the hydrophobic PES surface and therefore can be replaced by dextran molecules in a
process known as surface dehydration. For higher ionic strength solutions, surface dehydration is

102
more likely. Figure 4.3 indicates that at low pH when the membrane surface charge is lowest and
at high ionic strength when surface dehydration is more likely, dextran adsorption onto the
surface of the membrane occurs more substantially, leading to a decrease in permeate flux.
However Table 4.4 indicates that even though greater flux decline was observed at low pH and
high charge density, β values could not be calculated due to the low fouling by dextran under all
conditions tested.
Table 4.4: β values (see Equation 4) for the various experimental conditions tested. Ionic strength,
M pH=5.50 pH=6.25 pH=7.00
casein I=0.250 2.04 1.94 2.05 I=0.125 2.07 1.99 2.22
catechin I=0.250 1.95 1.82 Not applicable* I=0.125 1.92 Not applicable Not applicable
dextran I=0.250 Not applicable Not applicable Not applicable I=0.125 Not applicable Not applicable Not applicable
casein-catechin
I=0.250 1.90 1.95 2.00 I=0.125 2.00 1.85 2.10
casein-catechin-dextran
I=0.250 1.97 Not applicable Not applicable I=0.125 Not applicable Not applicable Not applicable
*Not applicable due to minimal fouling
Membrane fouling depends on (i) feed properties such as composition, pH, ionic strength,
the concentration of the large and major components7, etc.; (ii) membrane properties like surface
structure, morphology, porosity, pore size distribution, hydrophobicity and surface charge2; and
(iii) system properties like temperature, operating mode (direct-flow; cross flow), module design
(frame and plate, hollow fiber, spiral wound), and hydrodynamic conditions (e.g., cross flow
velocity)2. Of course, membrane material properties, solute properties, and operating parameters
can interact with each other and give rise to quite different effects in combination than if these
factors were studied individually or with model systems.
Any parameter that may influence the chemistry of the feed solution might change the

103
overall membrane performance and fouling phenomena. Understanding how solutes interact in
solution or with the membrane can help to elucidate fouling mechanisms16. Introducing an
additional compound to the feed solution that interferes with the interaction between existing
species or with the membrane can affect the filtration performance by decreasing or increasing
the rate and degree of fouling. For example, polyphenols may act as a cross-linking agent to bind
protein molecules and form protein-polyphenol aggregates 27. The interaction between
polyphenols and proteins to form insoluble complexes is widely acknowledged in the brewing
industry 26.
Marroquin12 studied the microfiltration of protein (casein) and polyphenol (tannic acid)
individually as well as their combination. It was observed that by introducing polyphenol with
large molecular weight to the protein solution the membrane flux declined, which was correlated
with pore blocking due to aggregation. Dynamic light scattering measurements revealed that
aggregates were formed with a diameter of 26 nm, smaller than the protein micelles (220 nm)
and larger than the polyphenol (5-6 nm). They suggested that these nanosized clusters probably
derive from the association of free casein in solution (in equilibrium with the casein micelle) and
tannic acid. Tannic acid also appeared to break up many of the casein micelles by forming more
stable 26 nm clusters. They concluded that the large abundance of the 26 nm aggregates was
mainly responsible for fouling and flux decline in binary mixtures of casein-tannic acid.
In our work with the binary mixture of casein-catechin, fouling was observed for all
solution conditions. Table 4.4 reports the β values calculated for this set of measurements. Table
4.3 reports the average size of the casein-catechin aggregates. Unlike the results reported by
Marroquin et al. for the casein-tannic acid system, the average size of the aggregates in the
casein-catechin system is similar to that observed for single-component solutions of catechin and

104
casein. In contrast to tannic acid, catechin is a low molecular weight polyphenol that is not able
to be linked with several proteins 28. Thus addition of catechin to the casein solution changes the
average aggregate size only slightly. A similar conclusion was achieved by Eagles et al. 9. They
conducted experiments on a model feed solution of casein and catechin during microfiltration
with a 0.2 μm cellulose nitrate membrane. They concluded that protein-polyphenol interactions
are specific for each individual type of polyphenol and protein. Large polyphenols are able to
crosslink several proteins, because the number of potential sites capable of interacting with the
protein is higher. In general the number of sites is proportional to the molecular weight of
polyphenols 29. Proteins may encircle low molecular weight polyphenols and consequently
decrease the possibility of aggregate formation. These interactions might also be influenced by
presence of other solutes like polysaccharides in solution 28, 30-32.
Flux decline data for mixtures of casein and catechin display more complicated behavior.
At pH 5.50 and 6.25 and low ionic strength, the rate of flux decline is intermediate to the single-
component solutions. It appears that protein-membrane interactions cause fouling in this case,
and the lower concentration of protein (12.5 mg/L) relative to the single-component protein case
(25 mg/L) leads to a lower rate of flux decline compared solutions of protein alone. At pH 5.50
and 6.25 and high ionic strength, the rate of flux decline for the mixture is lower than either
single-component solution. It appears that protein-polyphenol interactions are important here and
that association through hydrophobic regions of the molecules leads to aggregates with surfaces
that are more hydrophilic on average than the single-component systems. Finally, at pH 7.00
protein-membrane interactions appear to be the primary cause of the flux decline. However, at
this pH, there is no effect of ionic strength. Protein-polyphenol association appears to be
suppressed by coulombic repulsion caused by the presence of a low percentage of negatively

105
charged catechin molecules within the aggregates, as discussed earlier.
Addition of polysaccharides such as dextran to the solution might influence the aggregate
formation through two mechanisms: (i) molecular association between polysaccharides and
polyphenols can disrupt the binding between proteins and polyphenols; (ii) polysaccharides can
form ternary complexes with proteins and polyphenols in solution. Addition of polysaccharides
with suitable physicochemical characteristics to the solution can eliminate or decrease the
amount of protein-polyphenols aggregation. Suitable polysaccharides must have right shape, size
and flexible structure with specific ionic character, to form complexes with polyphenols 28, 33, 34.
Polysaccharides may also form secondary structures in solution 35 that are able to encapsulate the
polyphenols in hydrophobic micro/nanocapsules.
Zator et al. 36 investigated the effect of polysaccharides addition on membrane fouling
while keeping the concentrations of protein and polyphenol unchanged. Their system consisted
of dextran (70 kDa) as the model polysaccharide, BSA as the model protein and tannic acid as
the model polyphenol. Dextran was added at three different concentrations to the
protein/polyphenol solution, corresponding to molar ratios of 1:2, 2:1, 4:1
polyphenol/polysaccharide. These investigators observed that addition of the polyphenol to
protein and protein polysaccharide feed streams significantly lowered the permeate flux
irrespective of the polyphenol concentration. Dextran is known to have the weakest ability to
disrupt BSA tannic acid interactions and can lead to increased aggregation due to adsorption of
dextran into the BSA tannic acid complex. 33, 34. In contrast, Marroquin et al. 12 observed a slight
improvement in flux when adding β-cyclodextrin to casein-tannic acid solutions. They also
found that a 2:1 polyphenol to polysaccharide ratio was most effective for limiting flux decline
associated with casein-tannic acid aggregates. These prior results indicate that the effect of a

106
polysaccharide on a binary protein-polyphenol system depends on the specific components
present. Furthermore, the mechanisms by which the polysaccharide disrupts protein-polyphenol
interactions may depend on the solution composition.
Figure 4.3 presents flux versus permeate volume data collected for ternary mixtures of
casein-catechin-dextran. Fouling was decreased significantly by adding dextran for all tested
conditions except for the experiment run at pH 5.50 and solution ionic strength of 0.250 M. For
this solution, severe fouling was observed. The β value calculated from the Hermia model for
this solution was 1.97, which indicates internal fouling of the pores. Table 4.3 indicates that
there is no significant difference in the size of aggregation under these conditions. The aggregate
sizes are much smaller than for binary protein polyphenol feed streams suggesting dextran is
successful in disrupting these complexes. We note that a single component dextran feed stream
exhibits the greatest degree of fouling under these conditions. Thus the much higher degree of
fouling for the three-component system could be due to the increased level of dextran fouling.
4.5 Conclusion
The results of this work add to the general body of knowledge on fouling of microfiltration
membranes by multicomponent protein, polyphenol, polysaccharide systems. The results
highlight the importance of solution conditions. While hydrophobic interactions tend to
dominate, solution pH and ionic strength can enhance the effect of coulombic interactions.
While polysaccharides often disrupt interactions between proteins and polyphenols leading to
smaller aggregate sizes, this does not always lead to a decrease in fouling. The tendency of the
aggregates to adsorb to the membrane surface irrespective of their size is modulated by solution
conditions. Thus it is essential to optimize solution conditions to minimize membrane fouling
during microfiltration of multicomponent protein, polyphenol, polysaccharide systems.

107
References 1. Ho, W. W., Sirkar, K. K. Membrane handbook. Springer, 1992.
2. Belfort, G., Davis, R. H., Zydney, A. L. The behavior of suspensions and macromolecular
solutions in crossflow microfiltration. Journal of Membrane Science, 96(1): 1-58, (1994).
3. Kubota, N., Hashimoto, T., Mori, Y. Microfiltration and ultrafiltration. Advanced Membrane Technology and Applications, 101-129, (2008).
4. Loh, S., Beuscher, U., Poddar, T. K., Porter, A. G., Wingard, J. M., Husson, S. M., Wickramasinghe, S. R. Interplay among membrane properties, protein properties and operating conditions on protein fouling during normal-flow microfiltration. Journal of Membrane Science, 332(1): 93-103, (2009).
5. Vernhet, A., Moutounet, M. Fouling of organic microfiltration membranes by wine constituents: importance, relative impact of wine polysccharides and polyphenols and incidence of membrane properties. Journal of Membrane Science, 201(1): 103-122, (2002).
6. Pabby, A. K., Rizvi, S. S. H., Requena, A. M. S. Handbook of membrane separations: chemical, pharmaceutical, food, and biotechnological applications. CRC press, 2008.
7. Bowen, W. R., Calvo, J. I., Hernandez, A. Steps of membrane blocking in flux decline during protein microfiltration. Journal of Membrane Science, 101(1): 153-165, (1995).
8. Jin, Y. L., Speers, R. A., Paulson, A. T., Stewart, R. J. Effect of β-glucans and process conditions on the membrane filtration performance of beer. Journal of the American Society of Brewing Chemists, 62(3): 117-124, (2004).
9. Eagles, W. P., Wakeman, R. J. Interactions between dissolved material and the fouling layer during microfiltration of a model beer solution. Journal of membrane science, 206(1): 253-264, (2002).
10. Ryder, D. S., Davis, C. R., Anderson, D., Glancy, F. M., Power, J. N. Brewing experience with cross-flow filtration. Technical quarterly-Master Brewers Association of the Americas (USA), 25(2): 67-79, (1988).
11. Blanpain-Avet, P., Fillaudeau, L., Lalande, M. Investigation of mechanisms governing membrane fouling and protein rejection in the sterile microfiltration of beer with an organic membrane. Food and bioproducts processing, 77(C2): 75-89, (1999).
12. Marroquin, M., Vu, A., Bruce, T., Wickramasinghe, S. R., Zhao, L. X., Husson, S. M. Evaluation of fouling mechanisms in asymmetric microfiltration membranes using advanced imaging. Journal of Membrane Science, 465: 1-13, (2014).

108
13. Marroquin, M., Vu, A., Bruce, T., Powell, R., Wickramasinghe, S. R., Husson, S. M. Location and quantification of biological foulants in a wet membrane structure by cross-sectional confocal laser scanning microscopy. Journal of Membrane Science, 453: 282-291, (2014).
14. Van Reis, R., Zydney, A. Bioprocess membrane technology. Journal of Membrane Science, 297(1): 16-50, (2007).
15. Hermia, J. Constant pressure blocking filtration law application to powder-law non-Newtonian fluid. Trans. Inst. Chem. Eng., 60(3): 183-187, (1982).
16. Velasco, C., Ouammou, M., Calvo, J. I., Hernández, A. Protein fouling in microfiltration: deposition mechanism as a function of pressure for different pH. Journal of colloid and interface science, 266(1): 148-152, (2003).
17. Tracey, E. M., Davis, R. H. Protein fouling of track-etched polycarbonate microfiltration membranes. Journal of Colloid and Interface Science, 167(1): 104-116, (1994).
18. Qu, P., Gésan-Guiziou, G., Bouchoux, A. Dead-end filtration of sponge-like colloids: The case of casein micelle. Journal of Membrane Science, 417: 10-19, (2012).
19. Jimenez-Lopez, A. J. E., Leconte, N., Garnier-Lambrouin, F., Bouchoux, A., Rousseau, F., Gésan-Guiziou, G. Ionic strength dependence of skimmed milk microfiltration: Relations between filtration performance, deposit layer characteristics and colloidal properties of casein micelles. Journal of Membrane Science, 369(1): 404-413, (2011).
20. Hermia, J. Blocking Filtration. Application to Non-Newtonian Fluids. Mathematical models and design methods in solid-liquid separation, NATO ASI series, 88: 83-84;Springer, (1985).
21. Hu, Y., Guo, T., Ye, X. S., Li, Q., Guo, M., Liu, H. N., Wu, Z. J. Dye Adsorption by resins: Effect of ionic strength on hydrophobic and electrostatic interactions. Chemical Engineering Journal, 228: 392-397, (2013).
22. Burns, D. B., Zydney, A. L. Buffer effects on the zeta potential of ultrafiltration membranes. Journal of membrane science, 172(1): 39-48, (2000).
23. Nyström, M., Lindström, M., Matthiasson, E. Streaming potential as a tool in the characterization of ultrafiltration membranes. Colloids and surfaces, 36(3): 297-312, (1989).
24. Causserand, C., Nyström, M., Aimar, P. Study of streaming potentials of clean and fouled ultrafiltration membranes. Journal of membrane science, 88(2): 211-222, (1994).
25. Bentz, E.N., Pomilio, A. B., Lobayan, R. M. Structure and electronic properties of (+)-catechin: aqueous solvent effects. Journal of molecular modeling, 20(2): 1-13, (2014).

109
26. Susanto, H., Feng, Y., Ulbricht, M. Fouling behavior of aqueous solutions of polyphenolic
compounds during ultrafiltration. Journal of food engineering, 91(2): 333-340, (2009).
27. Munin, A., Edwards-Lévy, F. Encapsulation of natural polyphenolic compounds; a review. Pharmaceutics, 3(4): 793-829, (2011).
28. Mateus, N., Carvalho, E., Luı́s, C., de Freitas, V. Influence of the tannin structure on the disruption effect of carbohydrates on protein–tannin aggregates. Analytica Chimica Acta, 513(1): 135-140, (2004).
29. Siebert, K. J., Troukhanova, N. V., Lynn, P. Y. Nature of polyphenol-protein interactions. Journal of Agricultural and Food Chemistry, 44(1): 80-85, (1996).
30. Freitas, V. D., Mateus, N. Nephelometric study of salivary protein–tannin aggregates. Journal of the Science of Food and Agriculture, 82(1): 113-119, (2002).
31. Yan, Y. F., Hu, J. H., Yao, P. Effects of casein, ovalbumin, and dextran on the astringency of tea polyphenols determined by quartz crystal microbalance with dissipation. Langmuir, 25(1): 397-402, (2008).
32. Zanchi, D., Narayanan, T., Hagenmuller, D., Baron, A., Guyot, S., Cabane, B., Bouhallab, S. Tannin-assisted aggregation of natively unfolded proteins. EPL (Europhysics Letters), 82(5): 58001, (2008).
33. de Freitas, V., Carvalho, E., Mateus, N. Study of carbohydrate influence on protein–tannin aggregation by nephelometry. Food Chemistry, 81(4): 503-509, (2003).
34. Carvalho, E., Mateus, N., de Freitas, V. Flow nephelometric analysis of protein–tannin interactions. Analytica chimica acta, 513(1): 97-101, (2004).
35. Carvalho, E., Póvoas, M. J., Mateus, N., de Freitas, V. Application of flow nephelometry to the analysis of the influence of carbohydrates on protein–tannin interactions. Journal of the Science of Food and Agriculture, 86(6): 891-896, (2006).
36. Zator, M., Ferrando, M., López, F., Güell, C. Microfiltration of protein/dextran/polyphenol solutions: characterization of fouling and chemical cleaning efficiency using confocal microscopy. Journal of Membrane Science, 344(1): 82-91, (2009).

110
PART 2 Membrane adsorbers for hydrophobic interaction chromatography
Chapter 5
Inverse colloidal crystal membranes for hydrophobic interaction membrane
chromatography4
Summary
Hydrophobic interaction membrane chromatography (HIMC) has gained interest due to
its excellent performance in the purification humanized monoclonal antibodies. The membrane
material used in HIMC has typically been commercially available PVDF. In this contribution,
newly developed inverse colloidal crystal (ICC) membranes which have uniform pores, high
porosity and therefore surface area for protein binding are used as HIMC membranes for
humanized monoclonal antibody IgG purification. The capacity of the ICC membranes
developed here is up to 10 times greater than commercially available PVDF membranes with a
similar pore size. This work highlights the importance of developing uniform pore size high
porosity membranes in order to maximize the capacity of HIMC.
5.1 Introduction
Chromatography has been widely used in the purification and analysis of proteins 1–4.
Conventional pack-bed chromatography columns suffer from several drawbacks, such as high
pressure drop across the bed which may increase due to media deformation or pore blockage,
low flow rates and slow transport of solute to the binding sites due to slow pore diffusion.
Microfiltration membranes used as chromatographic support materials, overcome the
4 Vu, T. A., Wang, X., Wickramasinghe, S. R., Yu, B., Yuan, H., Cong, H.,∗Luo, Y., and Tang, J. Inverse colloidal crystal membranes for hydrophobic interaction membrane chromatography. Journal Separation Science. 38 (16), 2819-2825, 2015.

111
disadvantages of traditional packed columns 5–7. Brandt et al. first described the use of
membranes adsorbers where microfiltration membranes are used as chromatographic support
materials 8.
Membrane absorbers are operated at much lower pressure drop and are easy to scale up
compared to packed beds. Further since the feed is pumped through the membrane pores,
transport of the target compound to the binding sites occurs by fast convective flow.
Consequently the dynamic capacity is shown to be independent of flow rate over a larger range
of flow rates 9, 10. Nevertheless, a major disadvantage of microfiltration membranes used as
chromatographic support materials is that the ligand density is generally lower than porous resin
particles. Consequently there is a need to develop uniform pore size, highly porous
microfiltration membrane support materials for use as membrane adsorbers that display higher
capacities than currently available membranes 11-13.
Inverse colloidal crystal (ICC) structures have received extensive attention due to their highly
periodic structures, high porosity and fully interconnected pores. Inverse colloidal crystals or
inverse opals are produced from colloidal crystals which are long range ordered lattices
assembled from polymeric or inorganic colloids. Generally, the ICC formation steps include
infiltration with a reactive monomer solution, polymerization, and removal of the colloidal
particles by thermal processing, solvent extraction or chemical etching. The resulting ICC
structure gives ordered, high volume and interconnected pores which are left behind after
removal of original particles. ICC materials have generated considerable interest due to their
potential applications in photonic crystals and optical devices 14–18, sensors 19–22, catalysts 23, 24,
magnetic materials 25, 26, electrodes and batteries 27, and bioactive materials 28. Recently the
benefits of the uniform pore size high porosity ICC structure as filtration membranes has been

112
described 29–32.
Here we have investigated the use of ICC membranes as membrane adsorbers. In particular
their high porosity as well as their highly interconnected and uniform pore structure will lead to
low pressure drop and uniform flow through the membrane, both of which are highly desirable
for membrane adsorbers. In addition, the presence of high membrane porosity results in a high
surface area for solute binding. We have developed a new ICC membrane formation method, the
vertical cell assembly method 33, for making ICC membranes. We have used this method to make
ICC microfiltration 31 and ultrafiltration 32 membranes in the past.
Here we investigate binding of a monoclonal antibody, IgG4. Hydrophobic interaction
membrane chromatography (HIMC) has gained interest for protein 34–36 and DNA purification 37
due to the relatively efficient and gentle nature of the process. The binding mechanism for HIMC
is the same as resin based hydrophobic interaction chromatography 38,39. Many recent studies
further highlight the benefits of HIMC over resin based hydrophobic interaction chromatography
40–42. However these studies typically use commercially available membranes such as PVDF
microfiltration membranes. Here we highlight the benefits of using a carefully structured high
porosity membrane.
5.2 Materials and methods
5.2.1 Chemicals and Reagents
The following chemicals were obtained from Sigma Aldrich (St Louis, MO): sodium phosphate
monobasic (99.5%) and dibasic (99.2%); ammonium sulfate, ethylene glycol dimethacrylate
(EGDMA, 98%); hydroxybutyl methacrylate, mixture of isomers (HBMA, 94%); 2-hydroxyethyl
methacrylate (HEMA, 97%); benzoin isobutyl ether (BIE, 90%); hydrofluoric acid (HF, 40%);
tetraethylorthosilicate (TEOS, 99%); hydrogen peroxide (30%); sulfuric acid (95–98%) and

113
ammonium hydroxide (28–30%). EGDMA, HBMA and HEMA were passed through a neutral
Al2O3 column to remove polymerization inhibitors prior to use. TEOS was vacuum distilled prior
to use. BIE and HF were used as received. Ethanol (200 proof) was obtained from Pharmaco
Products (Brookfield, CT) and used as received. Microscope cover glasses (24×50×0.1 mm)
were obtained from VWR International (West Chester, PA) and cleaned using a mixture of 1:3
hydrogen peroxide-sulfuric acid before use. Polyvinylidene fluoride (PVDF) microfiltration
membranes (0.45 μm, Millipore, MA), polyethersulfone microfiltration membranes (pore size
0.22 μm, thickness 100 μm, Pall Corp., NY). Humanized IgG monoclonal antibody with size of
155 kDa was used.
5.2.2 Preparation of monodisperse silica particles
Monodisperse silica particles were prepared based on the method by Stöber-Fink-Bohn 43.
Ethanol (210 mL) was added to a 500 mL flask. HPLC water (17 mL), ammonium hydroxide
solution (11 mL), and TEOS (11 mL) were added sequentially. The reaction was conducted at
room temperature for 4 hours with agitation. The contents of the flask were centrifuged at 5,000
rpm for 10 min. The solvent was then decanted, and a 50:50 (v/v) mixture of ethanol-water was
added to resuspend the particles. The suspension was centrifuged at 5,000 rpm for 10 min. The
solvent was decanted and the particles again resuspended in a 50:50 (v/v) mixture of ethanol-
water and centrifuged as before. This procedure was repeated three times to wash the particles.
Laser diffraction light scattering (Beckman Coulter LS 230, Fullerton, CA), was used to
determine the particle size distribution. The resulting mean particle diameters were found to be
300–500 nm. Though there is batch-to-batch variation in the mean particle diameter, for a given
batch, the standard deviation of the particle size distribution was less than 5% of the mean
diameter.

114
Larger particles were prepared by following the method described above, except that an
additional 11 ml TEOS and 10 ml water were added to the beaker after the initial 4 hr reaction
time. The contents of the flask were again agitated for 4 hours to allow further reaction. This
procedure was repeated until the desired particle size was obtained. After washing as described
above, the particle dispersions were diluted to 1–5 wt% with absolute ethanol.
5.2.3 Self-assembly of colloidal crystal template and fabrication of ICC membrane
Self-assembly of colloidal crystal templates was conducted in the ‘membrane casting’ cell. The
method developed here involved the use of two microscope cover glasses cut into 24×30 mm
rectangles separated by two strips of either Mylar film or microfiltration membrane at the top
and bottom. The casting cell was placed vertically in the beaker containing the colloidal
dispersion. This ‘vertical cell’ assembly of colloidal crystal films has been described in detail in
our earlier publication 33. Briefly, silica particles are transported to the lower surface of the upper
spacer by capillary forces. As the solvent (ethanol) evaporates, the particles self-assemble into a
close-packed structure. In this work, both Mylar and microfiltration membranes have been used
as spacers. The later yielded a more rapid self-assembly of the colloidal crystal template due to
faster ethanol evaporation through the microfiltration membrane.
The colloidal crystal template formed in 1 day, depending on the concentration of silica
particles in the dispersion. The thickness of the template and, therefore, the corresponding
membrane depends on the thickness of the spacer. After formation of the colloidal crystal
template, the template was dried at room temperature for 12 hours and infiltrated with the
monomer solution.
The following monomer solution was used to cast membranes: 0.5 g HEMA, 1.5 g HBMA,
0.2 g EGDMA and 0.03 g BIE. The monomer solution within the colloidal crystal template was

115
polymerized using a UV lamp (30 W with wavelength 254 nm) by irradiating for 15 min.
Following polymerization, the casting cell was immersed in 10 wt% HF solution to etch away
the template and the microscope cover glasses. Membranes were characterized by field emission
scanning electron microscopy (FESEM, Model JSM-6500F, JOEL, Japan) using a method
described previously 44.
5.2.4 Antibody purification using HIMC
The antibody used for purification tests was IgG4 with molecule weight of 155 kDa. ICC
membranes made from 375, 440 nm particles and 835 nm particles were used as chromatography
media. For comparison, commercially available PVDF microfiltration membrane with nominal
pore size of 0.45 �m (450 nm) was also tested. The experiments were conducted using an ÄKTA
FPLC system (GE Healthcare Bio-Sciences Corp, Piscataway, NJ). Two buffer solutions were
used. The low salt concentration buffer consisted of 20 mM sodium phosphate at pH 7.0. The
high salt concentration buffer was prepared by adding 2M ammonium sulfate to the low salt
concentration buffer. The feed solute consisted of 1g/L IgG in the high salt concentration buffer.
All the solutions were passed through a 0.22 um pore size microfiltration membrane to remove
any particulates. The membrane support was fixed in the support chamber and then equilibrated
with buffer with high concentration salt buffer for 30 minutes at a flow rate of 1mL/min. Next
further 2.5 mL of high salt concentration buffer was pumped at 1 mL/min followed by 10 mL of
the IgG feed solution at 1 mL/min. The flow rate during the washing (7.5 mL high salt
concentration buffer) and elution was maintained at 1 mL/min.
5.3 Results and discussion
In the first step, the ‘vertical cell’ method was used to fabricate the colloidal crystal
template as illustrated in Figure 5.1 (A) and (B). Two strips of thin polymer spacer were used to

116
form colloidal crystal template and the thickness of the colloidal crystal template depended on
the thicknesses of polymer spacers (shown in Figure 5.1 (A)). The lower edge of the glass sheet
is placed in the beaker, which contains a dispersion of SiO2 microspheres in ethanol. The
particles are transported from the bottom of the glass sheet to the top by capillary force and self-
assemble into the colloidal crystal
Figure 5.1: Schematic illustration of the fabrication process for the colloidal crystal template and SEM image of silica particles and template (using the 375 nm silica particles): (A) Vertical cell used to fabricate colloidal crystal template by self-assembly; (B) Colloidal crystal template after solvent evaporation; (C) TEM image of 375 nm silica particles; (D) FESEM image of 375 nm colloidal crystal template.
template after the solvent evaporates. Figure 5.1 (C) and (D) give a TEM image of 375 nm silica
particles synthesized by the Stöber method and FESEM image of 375 nm colloidal crystal
templates assembled in the vertical cell, respectively. Relatively monodispersed particles with a

117
spherical shape were observed from Figure 5.1 (C). This result confirms that these colloidal
particles can be used for self-assembly as template model for preparation of porous structures.
From Figure 5.1 (D), the template used for membrane fabrication shows domains of face
centered close packing.
A schematic representation of the fabrication process for ICC membranes is shown in Figure
5.2. Figure 2 (A) illustrates filling the colloidal crystal template with monomer (HBMA,
EGDMA and BIE) followed by polymerization using a UV lamp. A composite film is shown in
Figure 5.2 (C). The ICC membrane was obtained, once the silica was etched out with HF
solution (Figure 5.2 (B) and (D)). This shows the pore structure is interconnected throughout the
membrane in three dimensions. A uniform membrane structure forms with few blocked pores.
Figure 5.2: Schematic illustration of the fabrication process of ICC membranes (using the 375 nm colloidal crystal template): (A) Filling colloidal crystal template with monomer and photopolymerization; (B) Etching away the microspheres and formation of the membrane; (C) FESEM image of 375 nm colloidal crystal template filled with monomer after photopolymerization; (D) FESEM image of 375 nm ICC membrane obtained by the templating method.

118
Figure 5.3 gives FESEM images of several of the membranes tested here. Figure 5.3(A and
B) give the surface and cross section of an ICC membrane made with 440 nm silica particles.
Figure 5.3(C and D) give analogous images for an ICC membrane made with 835 nm silica
particles. Figures 5.3(A and C) indicate the existence of a very regular structure. Cross sectional
images, Figures 5.3(B and D), indicate a highly porous material with interconnected pores.
Figure 5.3(E and F) are surface and cross sectional images of commercially available 0.45 µm
PVDF membrane. This membrane is similar to ones used in the past for HIMC 36, 40–42. While the
membrane exhibits a high porosity, a large pore distribution is shown to exist. The images
Figure 5.3: FESEM images of ICC membranes made from 440 nm silica particles (A) top view (B) cross-section; 835 nm silica particles (C) top view (D) cross-section; commercially available PVDF membrane (E) top view (F) cross-section.

119
also indicate that the ICC membranes made with the smaller 440 nm particles has a greater
density of pores per volume as expected. The BET surface area for the ICC membrane made
from 440 nm particles was found to be 27.77 m2/g while that for the PVDF membrane with a
nominal pore size of 0.45 µm was only 2.21 m2/g 45. The highly regular structure of the ICC
membrane leads to very high surface area for solute binding. The permeability of three ICC
membranes and the commercially available PVDF membrane are given in Table 5.1. As expected
as the membrane pore size increases the permeability increases (but the internal pore surface are
decreases).
Table 5.1: Permeability of ICC and commercially available PVDF membranes
Membrane Permeability
(L·m-2·h-1·kPa-1) Made from 375 nm particles 5.0 Made from 440 nm particles 7.0 Made from 835 nm particles 13.0 Commercial PVDF 10.3
Figure 5.4 gives the variation of UV absorption versus flow through volume during loading,
washing and elution. Results are given for the same membranes shown in Figure 5.3 (membranes
made from 440, and 835 nm silica particles as well as 0.45 µm commercially available PVDF
membrane). Figure 5.4 may be divided into four steps. The first step consisted of pumping 2.5
mL of high salt concentration buffer for membrane equilibration. Next loading consisted of
pumping 10 mL of the IgG in high salt concentration buffer followed by 7.5 mL of high salt
concentration buffer without IgG to wash any unbound IgG. Finally low salt concentration buffer
was pumped for IgG elution.

120
Figure 5.4: Variation of UV absorption versus flow through volume for: ICC membranes made from (A) 440 nm silica particles and (B) 835 nm silica particles; (C) commercially available PVDF membrane.
As can be seen the breakthrough peak moves to higher flow through volumes in order:
commercially available PVDF membrane, membrane made with 835 nm silica particles and
membrane made with 440 nm silica particles. Thus as the internal pore surface area of the
membrane increases, the amount of IgG bound to the membrane also increases. Figure 5.4
indicates a sharp elution peak for all three membranes. This suggests the absence of slow pore
diffusion 46. It can also be seen that the elution peaks decrease in order: membrane made with
440 nm silica particles membrane made with 835 nm silica particles and the commercially
available PVDF membrane. Thus in agreement, with the breakthrough curves, the greater the
internal pore surface area of the membrane the greater the binding capacity of the membrane.
Table 5.2 gives the calculated binding capacity of the four membranes given in Table 5.1.

121
Table 5.2: IgG saturation binding capacity for PVDF membrane and ICC membrane made from 375nm, 440nm, and 835 nm silica particles Nominal pore size
(nm)
Binding capacity
(mg/mL)
375 25.5
440 19
835 9.5
PVDF (0.45 μm) 2.5
Our results indicate the importance of maximizing the internal pore surface area in order to
maximize membrane adsorber binding capacity. In general the smaller the pore size the greater
the internal membrane surface area for a fixed porosity. However, the smaller the pore size the
greater the pressure drop for a given throughput. Optimized adsorber designs will maximize the
membrane pore surface area but also minimize the pressure drop for flow through the membrane.
In the work conducted here the pressure drop was always less than 40 kPa as is the case for
microfiltration. Designing high porosity membranes with uniform, highly interconnected pores
achieves both of these aims.
The focus of this work was the development of uniform pore size, high porosity membranes
which have a high surface area for hydrophobic interaction chromatography. However by
modifying the surface of the membrane one can impart specific functionality such as ion
exchange groups for ion exchange chromatography. In earlier work 29, we have shown the
feasibility of grafting polymer chains from the surface of the membrane in order to tune the
membrane pore size. Thus the membranes developed here represent a platform from which many
different membranes can be developed for chromatographic applications.
Our results indicate the tremendous advantages the ICC membrane structure has over

122
commercially available membranes which exhibit a range of pore sizes. The ICC structure could
be ideally suited for development of high capacity membrane adsorbers. While the use of
membranes as chromatographic support structures overcomes the disadvantages of resin based
chromatography, a major limitation has been the fact that the capacity of membrane adsorbers is
less than packed beds. By designing uniform pore size, high porosity membranes we maximize
the surface area present thus leading to much higher capacity membrane adsorbers.
5.4 Conclusion
We have developed ICC membranes for HIMC. The ICC structure results in a high porosity
membrane with uniform and highly interconnected pores. This structure maximizes the internal
pore surface area available for protein binding thus maximizing capacity. The uniform pore size
and interconnected pore structure minimizes the pressure drop for flow through the membrane.
The results obtained here indicate that the ICC structure is superior to commercially available
membranes for HIMC.
References
1. Demmer, W., Nussbaumer, D. Large-scale membrane adsorbers. J. Chromatogr. A, 852(1): 73–81, (1999).
2. Dong, Y., Wang, H., Zhang, Y., An, N., Zhang, Y., Shou, D. Ultra high performance liquid chromatography with synapt high-definition mass spectrometry and a pattern recognition approach to characterize chemical constituents and rat metabolites after the oral administration of Phellinus igniarius. J. Sep. Sci., 38, 1137-1148, (2015).
3. Yu, B., Cong, H., Liu, H., Li, Y., Liu, F. Ionene-dynamically coated capillary for analysis
of urinary and recombinant human erythropoietin by capillary electrophoresis and online electrospray ionization mass spectrometry. J. Sep. Sci., 28(17): 2390–2400, (2005).
4. Yu, B., Jiao, M., Cong, H., Shu, X., Yang, S. A Novel Diazoresin/Poly(N-Vinyl
Aminobutyric Acid) Covalent Capillary Coating for the Analysis of Proteins by Capillary Electrophoresis. J. Sep. Sci., 37(6): 725–730, (2014).

123
5. Guo, W., Ruckenstein, E. A new matrix for membrane affinity chromatography and its application to the purification of concanavalin A. J. Membr. Sci., 182(1-2): 227–234, (2001).
6. Knudsen, H. L., Fahrner, P. L., Xu, Y., Norling, L. A., Blank, G. S. Membrane ion-exchange chromatography for process-scale antibody purification. J. Chromatogr. A, 907(1-2): 145–154, (2001).
7. Li, C., Lu, A., Wang, J., Li, J., Ping, H., Luan, Y., Chen, J., Ha, X. Determination of five sulfonylurea herbicides in environmental waters and soil by ultra high performance liquid chromatography with tandem mass spectrometry after extraction using graphene. J. Sep. Sci., 37(24): 3714-3721, (2014).
8. Brandt, S., Goffe, R. A., Kessler, S. B., O’Conner, J. L., Zale, S. E. Membrane-Based Affinity Technology for Commercial Scale Purifications. Biotechnology, 6: 779–782, (1988).
9. Curling, J., Gottschalk, U., Roeraade, J. Process Chromatography: Five decades of innovation. Biopharm. Int., 20: 70–94, (2007).
10. Specht, R., Han, B., Wickramasinghe, S. R., Carlson, J. O., Czernak, P., Wolf, A., Reif, O. W. Densonucleosis virus purification by ion exchange membranes. Biotechnol. Bioeng., 88(4): 465–473, (2004).
11. Pereira, L. R., Prazeres, D. M. F., Mateus, M. Hydrophobic interaction membrane chromatography for plasmid DNA purification: Design and optimization. J. Sep. Sci., 33(9): 1175-1184, (2010).
12. Cheong, W. J., Yang, S. H., Ali, F. Molecular imprinted polymers for separation science: a review of reviews. J Sep. Sci., 36: 609-628, (2013).
13. Sun, H., Ge, B., Liu, S., Chen, H. Preparation of nitrocellulose (NC) immuno-affinity membrane for purification of rAPC antibody. J. Sep. Sci., 31: 1201-1206, (2008).
14. Cong, H., Yu, B., Tang, J., Li, Z., Liu, X. Current status and future developments in preparation and application of colloidal crystals. Chem. Soc. Rev., 42: 7774–7800, (2013).
15. Weissman, J. M., Sunkara, H. B., Tse, A. S., Asher, S. A. Thermally Switchable Periodicities and Diffraction from Mesoscopically Ordered Materials. Science, 274(5289): 959–960, (1996).
16. Kanmenetzky, E. A., Magliocco, L. G., Panzer, H. P. Structure of solidified colloidal array laser filters studied by cryogenic transmission electron microscopy. Science, 263: 207–210, (1994).
17. Blanco, A., Chomski, E., Grabtchak, K., Ibisate, M., John, S., Leonard, S. W., Lopez, C.,

124
Meseguer, F., Miguez, H., Mondia, J. P., Ozin, G. A., Toader, O., Van Driel, H. M. Large-scale synthesis of a silicon photonic crystal with a complete three-dimensional bandgap near 1.5 micrometres. Nature, 405: 437–440, (2000).
18. Wang, D., Salgueirino-Maceira, V., Liz-Marzan, L. M., Caruso, F. Gold–Silica Inverse Opals by Colloidal Crystal Templating. Adv. Mater., 14(12): 908–912, (2002).
19. Holtz, J. H., Asher, S. A. Polymerized colloidal crystal hydrogel films as intelligent chemical sensing materials. Nature, 389: 829–832, (1997).
20. Asher, S. A., Alexeev, V. L., Goponenko, A. V., Sharma, A. C., Lednev, I. K., Wilcox, C. S., Finegold, D. N. Photonic Crystal Carbohydrate Sensors: Low Ionic Strength Sugar Sensing. J. Am. Chem. Soc., 125(11): 3322–3329, (2003).
21. Velev, O. D., Kaler, E. W. In Situ Assembly of Colloidal Particles into Miniaturized Biosensors. Langmuir, 15(11): 3963–3968, (1999).
22. Sharma, A. C., Jana, T., Kesavamoorthy, R., Shi, L. J., Virji, M. A., Finegold, D. N., Asher, S. A. A General Photonic Crystal Sensing Motif: Creatinine in Bodily Fluid. J. Am. Chem. Soc., 126(9): 2971–2977, (2004).
23. Schroden, R. C., Blanford, C. F., Melde, B. J., Johnson, B. J. S., Stein, A. Direct Synthesis of Ordered Macroporous Silica Materials Functionalized with Polyoxometalate Clusters. Chem. Mater., 13(3): 1074–1081, (2001).
24. Johnson, B. J. S., Stein, A. Surface Modification of Mesoporous, Macroporous, and Amorphous Silica with Catalytically Active Polyoxometalate Clusters. Inorg. Chem., 40(4): 801–808, (2001).
25. Bartlett, P. N., Ghanem, M. A., El Hallag, I. S., De Groot, P. A. J., Zhukov, J. Electrochemical deposition of macroporous magnetic networks using colloidal templates. J. Mater. Chem., 13: 2596–2602, (2003).
26. Zhukov, A. A., Goncharov, A. V., De Groot, P. A. J., Bartlett, P. N., Ghanem, M. A. Magnetic antidot arrays from self-assembly template methods. J. Appl. Phys. 2003, 93: 7322–7324.
27. Long, W. A., Dunn, B., Rolison, D. R., White, H. S., Chem. Rev., 104(10): 4463–4492, (2004).
28. Liu, Y., Wang, S., Lee, J. W., Kotov, N. A. Three-Dimensional Battery Architectures, Chem. Mater., 17: 4918–4924, (2005).
29. Espinha, A., Ibisate, M., Galisteo-López, J., Blanco, A., López, C. One-Step-Process Composite Colloidal Monolayers and Further Processing Aiming at Porous Membranes. Langmuir, 28(37): 13172–13180, (2012).
125
30. Rhee, D. K., Jung, B., Kim, Y. H., Yeo, S. J., Choi, S. J., Rauf, A., Han, S., Yi, G. R., Lee,
D., Yoo, P. J. Particle-Nested Inverse Opal Structures as Hierarchically Structured Large-Scale Membranes with Tunable Separation Properties. ACS Appl. Mater. Interfaces, 6(13): 9950–9954, (2014).
31. Wang, X., Husson, S. M., Qian, X., Wickramasinghe, S. R. Integration of conventional electrodialysis and electrodialysis with bipolar membranes for production of organic acids. J. Membr. Sci., 365(1-2): 302–310, (2010).
32. Wang, X., Husson, S. M., Qian, X., Wickramasinghe, S. R. Inverse colloidal crystal ultrafiltration membranes. Sep. Pur. Technol., 93(1): 33–41, (2012).
33. Wang, X., Husson, S. M., Qian, X., Wickramasinghe, S. R. Vertical cell assembly of colloidal crystal films with controllable thickness. Mater. Lett., 63(23): 1981–1983, (2009).
34. Ghosh, R. Separation of proteins using hydrophobic interaction membrane chromatography. J. Chromatogr. A, 923(1-2): 59–64, (2001).
35. Wang, L., Hale, G., Ghosh, R. Non-Size-Based Membrane Chromatographic Separation and Analysis of Monoclonal Antibody Aggregates. Anal. Chem., 78(19): 6863–6867, (2006).
36. Wang, L., Ghosh, R., J. Membr. Sci. Fractionation of monoclonal antibody aggregates using membrane chromatography. 318(1-2): 311–316, (2008).
37. Pereira, L. R., Prazeres, D. M. F., Mateus, M. Hydrophobic interaction membrane chromatography for plasmid DNA purification: Design and optimization. J. Sep. Sci., 33: 1175–1184, (2010).
38. Diogo, M. M., Queiroz, J. A., Prazeres, D. M. F. Hydrophobic interaction chromatography of homo-oligonucleotides on derivatized Sepharose CL-6B: Application of the solvophobic theory. J. Chromatogr. A, 944(1-2): 119–128, (2002).
39. Luliano, S., Fisher, J. R., Chen, M., Kelly, W. J. Rapid analysis of a plasmid by hydrophobic-interaction chromatography with a non-porous resin. J. Chromatogr. A, 972(1): 77–86, (2002).
40. Sadavarte, R., Spearman, M., Okum, N., Butler, M., Ghosh, R. Purification of chimeric heavy chain monoclonal antibody EG2-hFc using hydrophobic interaction membrane chromatography: An alternative to protein-A affinity chromatography. Biotechnol. Bioeng., 111(6): 1139–1149, (2014).
41. Shang, X., Wittbold, W., Ghosh, R. Purification and analysis of mono-PEGylated HSA by hydrophobic interaction membrane chromatography. J. Sep. Sci., 36(23): 3673–3681, (2013).

126
42. Yoo, S. M., Ghosh, R. Simultaneous removal of leached protein-A and aggregates from
monoclonal antibody using hydrophobic interaction membrane chromatography. J. Membr. Sci., 390: 263–269, (2012).
43. Stöber, W., Fink, A., Bohn, E. Controlled growth of monodisperse silica spheres in the micron size range. J. Colloid Interf. Sci., 26(1): 62–69, (1968).
44. Loh, S. T., Beuscher, U., Poddar, T. K., Porter, A. G., Wingard, J. M., Husson, S. M., Wickramasinghe, S. R. Interplay among membrane properties, protein properties and operating conditions on protein fouling during normal-flow microfiltration. J. Membr. Sci., 332(1-2): 93–103, (2009).
45. Singh, N., Husson, S. M., Zdyrko, B., Luzinov, I. Surface modification of microporous PVDF membranes by ATRP. J. Membr. Sci., 262: 81–90, (2005).
46. Han, B., Specht, R., Poddar, Carlson, J. O., Wickramasinghe, S. R. Binding Aedes aegypti densonucleosis virus to ion exchange membranes. J. Chromatogr. A, 1092(1): 114–124, (2005).

127
Chapter 6
Membrane Based Hydrophobic Interaction Chromatography5
Summary
Hydrophobic interaction membrane adsorbers have been prepared using poly N-
vinylcaprolactam as the binding ligand. The ligands were grafted using atom transfer radical
polymerization. Binding and elution of lysozyme, bovine serum albumin and IgG4 was
investigated. At high ionic strength during loading, the ligand is above its lower critical solution
temperature and adopts a dehydrated conformation. During elution in low ionic strength buffer,
the ligand is below its lower critical solution temperature and adopts a hydrated conformation.
Use of a responsive ligand could lead to improved performance. The importance of tailoring the
three dimensional structure of the ligands is shown.
6.1 Introduction
Significant increases in product titers during cell culture means that development of
purification processes that can efficiently recover and purify high titer feed streams is a major
challenge in the biopharmaceutical industry1. On the other hand, introduction of new unit
operations is complicated by the significant cost involved in meeting the regulatory requirements
for validation and approval of a new unit operation2. Recently the development of bio-similars
or clones of products for which patent protection has expired, has provided an added competitive
incentive for the development of low cost, high efficiency purification processes.
Traditional hydrophobic interaction chromatography (HIC) depends on reversible
interactions between the hydrophobic surface patches on proteins and hydrophobic ligands on
5 Vu, A., Qian, X., Wickramasinghe, S. R. Membrane based hydrophobic Interaction Chromatography. Separation Science and Technology. 52 (2), 287-298. 2016.

128
chromatographic resin particles3. Proteins are typically loaded at high salt concentration (ionic
strength) and eluted with decreasing salt concentration4. Due to differences in the interactions
between the hydrophobic ligand and proteins, the salt concentrations needed for adsorption can
vary leading to the possibility of protein fractionation5–7. HIC is an important method for large-
scale purification of therapeutic proteins8–12. Currently the most frequent application of HIC is
for removal of aggregates (dimers and higher MW aggregates of the product protein)13–16.
There are many major limitations with traditional resin-based HIC. The pressure drop
across the packed bed is usually high. Most of the binding sites are located on the inside surface
of the porous resin particles. Slow pore diffusion can lead to low dynamic binding capacities
especially for removal of larger aggregates. This limits process flow rates17. Longer processing
times increase the risk of protein denaturation due to prolonged contact with the hydrophobic
ligand and the presence of a high concentration of lyotropic salts18. The use of HIC in bind and
elute mode has been limited due to relatively low binding capacities and low process throughputs
which are particularly problematic for purification of monoclonal antibodies (mAbs) as titers
during cell culture have increased13. Further the strong hydrophobicity of some ligands can lead
to protein denaturation and consequently low product yields18–21.
Membrane adsorbers have been proposed as an alternative to packed columns that
contain resin particles22,23. Here a macroporous membrane is used as the chromatographic
support material and the ligands are attached to the surface of the membrane pores. Since feed is
pumped through the membrane pores, pore diffusional resistances are eliminated. The pressure
drop is much lower compared to a packed bed as the flow path is much shorter. In addition scale
up of membrane modules is much easier than packed beds24. Today anion exchange membrane
adsorbers are used routinely in the biopharmaceutical industry in flow through polishing steps.

129
The use of HIC membrane adsorbers, generally in flow through mode, however is less
widespread.
Antibody manufacturers typically use a three column platform for product purification.
Protein A affinity chromatography is used for product capture. Typically anion exchange
chromatography in flow through mode is used to remove negatively charged impurities followed
by cation exchange chromatography or hydrophobic interaction chromatography in bind and
elute mode to remove positively charged impurities and aggregates25. Given the advantages of
membrane adsorbers over resin based chromatography for large molecules (over 200 Da) as well
as removal of most contaminants, development of membrane based HIC for flow through as well
as bind and elute operations is of significant commercial interest.
Ghosh and Wang26 purified a humanized mAb from a CHO cell culture using a PVDF
based HIC membrane adsorber in bind and elute mode. Fraud et al.27 investigated the purification
of a human mAb using a phenyl based HIC membrane adsorber. The membrane adsorber
displayed product recoveries of over 94% with up to 50% reduction of aggregates in the elution
pool in flow through mode. In bind and elute mode, up to 99% reduction in aggregates was
observed. Kuczewski et al.28 showed that the same membrane adsorber displayed dynamic
binding capacities in the range of 20 mg-mAb/cm3 membrane. Fan et al.29 used the same phenyl
based HIC membrane adsorbers in flow through mode for purification of α1-antitrypsin from
human plasma fraction IV. They showed that using an HIC membrane adsorber permitted much
faster processing compared to resin based HIC. In a more recent publication Fan et al.30 used a
HIC membrane adsorber containing dodecyl mercaptan as the ligand to fractionate IgG from
human serum albumin (HSA) in bind and elute mode. The purity of IgG in the elution pool was
above 94%.

130
Recently a few studies have considered the use of stimuli-responsive ligands for
membrane based HIC24,31,32. These ligands change their conformation in response to changes in
environmental conditions33–35. Of interest here are thermo-responsive polymers that change their
conformation in response to changes in temperature; in particular, they exhibit a lower critical
temperature (LCST). The LCST is the temperature below which the polymer or constituent
monomers are miscible at all compositions. Above the LCST they phase separate. Here we have
used poly N-vinylcaprolactam (PVCL) as the binding ligand for HIC. PVCL exhibits a LCST
around 32°C in DI water 36. When grafted from a membrane surface, the nanostructure will
swell and collapse below and above the LCST37. The LCST decreases with increasing ionic
strength. Here we make use of this dependence of LCST on ionic strength. The actual decrease
depends on the ionic species present as well as the polymer in solution38,39. Maeda et al.36
indicate that the LCST of PVCL decreases below 20°C in the presence of 1.0 M KCl. In addition
the LCST depends on the degree of polymerization of N-vinylcaprolactam40. Consequently,
when conducting HIC at room temperature (approximately 25°C) at high salt concentration,
above its LCST PVCL will adopt a collapsed conformation that will promote protein adsorption.
At low salt concentration, the LCST remains above room temperature. This will lead to a more
swollen conformation which will promote desorption of the adsorbed protein at room
temperature.
Yu et al.31 considered the use of polyethylene glycol (PEG) as a responsive binding
ligand for HIC for purification of the monoclonal antibody hIgG1-CD4 from simulated cell
culture supernatant in bind and elute mode. In a subsequent study, Mah and Ghosh32 investigated
the use of PVCL to purify human immunoglobulin (hIgG) in bind and elute mode. In our earlier
work 24 we used atom transfer radical polymerization (ATRP) to graft PVCL from the surface of

131
regenerated cellulose (RC) membranes. We showed that the use of a controlled polymerization
method lead to lower polydispersity of the grafted chains compared to a less controlled
polymerization method. Since the LCST depends slightly on chain molecular weight40, obtaining
a more uniform molecular weight distribution will lead to a sharper transition between the
collapsed and swollen conformation at the LCST which should lead to better performance.
Here we extend our previous work. ATRP allows us to independently vary grafted chain
density and length. We show the importance of optimizing chain density and length in order to
maximize capacity and recovery. In addition, we show that protein fractionation is possible.
Finally, we highlight the importance of careful three dimensional design of the ligand in order to
maximize capacity.
6.2 Materials and Methods
6.2.1 Chemicals
DI water (0.06 μS/cm) was obtained Barnstead Smart2Pure 12 UV/UF Thermo Scientific
(Waltham, MA, USA). All chemicals were 97+% purity unless otherwise noted. Triethylamine
(TEA), and 4-N,N-dimethylaminopyridine (DMAP) were obtained from Fluka (Munich,
Germany); ethanol (pure), methanol, acetonitrile; α-bromoisobutyrlbromide (BiB), N-
vinylcaprolactam (VCL), CuCl, CuCl2, CuBr2, and N,N,N′,N′,N′′-pentamethyldiethylenetriamine
(PMDETA) were obtained from Sigma-Aldrich (St. Louis, MO, USA). Sodium phosphate
monobasic, sodium phosphate dibasic, ammonium sulfate and bovine serum albumin (BSA)
were obtained from J. T. Baker (Center Valley, PA). The following buffer solutions were
prepared (all at pH 7): Buffer A, 20 mM sodium phosphate; Buffer B, 20 mM sodium phosphate
containing 2 M ammonium phosphate, Buffer C, 20 mM sodium phosphate 1 M sodium sulfate
and 3 M ammonium sulfate. Regenerated cellulose (RC) membranes (RC 55, REF# 10410212,

132
LOT# D013110, 0.45 μm effective pore diameter) were purchased from Whatman (GE
Healthcare Life Sciences, Pittsburgh, MA, USA) as 47 mm diameter discs. Lysozyme was
purchased from EMD Millipore (Billerica, MA, USA), IgG4 was provided by Eli Lilly
(Indianapolis, IN, USA). A stainless steel flow cell (Mustang coin unit, MSTG18H16) was
purchased from Pall Corporation (Port Washington, NY, USA) and used in this work.
6.2.2 Membrane Modification
Initiator Immobilization
Figure 6.1 gives the overall reaction scheme. The as-received membranes were first rinsed with
methanol overnight then dried overnight in in a vacuum oven at 30°C. Initiator immobilization
was conducted by adding 61 mg DMAP and 1387 μL TEA into 100 mL distilled acetonitrile. A
small amount of this solution was added to a jar containing a membrane disc. 10 μL BiB/mL
solution was added to the jar and then quickly sealed. The reaction proceeded at room
temperature for 2 and 3 hours. The membrane discs were removed from the jar, rinsed twice with
acetonitrile next DI water and then placed overnight in excess DI water on a shaker table. The
membranes were then dried overnight at 40°C in a vacuum oven.

133
O
Br
Br
InitiatorImmobilization
TEA, DMAP,Acetonitrile
O
O
Br+OH
N O
Methanol/H2O
+O
O
BrO
OCl
N On
Cu+/PMDETA Br--Cu2+/PMDETA
Kact
Kdeact
KPropagation
Ktermination
O
OCl
N O
+Cl- Cl-
Polymerization
O
OCl
N On
Quenching
CuB2, PMDETAMethanol/H2O
O
OBr
N On
Figure 6.1: Reaction scheme
Surface Initiated Atom Transfer Radical Polymerization (SI-ATRP)
VCL monomer, CuCl, CuCl2, and PMDETA were dissolved in equal parts (v/v) water and
methanol. The molar ratios of the final solution were 100:1:0.5:0.1 VCL:PMDETA:CuCl:CuCl2.
First, VCL and PMDETA were added to the solvent with stirring and the solution was degassed
for 15 minutes. CuCl and CuCl2 were then added sequentially to the solution with further
stirring and degassing for 15 minutes. Membrane discs were placed in the flasks and evacuated
three times under vacuum and then filled with argon gas. Immediately after preparation, 20 mL
of the reaction solution was cannulated into each of the sealed flasks containing a membrane
disc. The reaction occurred at room temperature for 1, 2, 3, and 4 hours. Following the reaction,
the membranes were placed in a quenching solution consisting of 500 mg CuBr2 and 1250 μL

134
PMDETA in 100 ml of equal parts methanol/water (v/v) to stop the polymerization. After 10
minutes in the quenching solution the membranes were rinsed with 50:50 methanol/water (v/v)
twice, then with DI water for 2 minutes, washed with ethanol for 1 minute, and placed in excess
DI water on a shaker table overnight. The membranes were then dried overnight in a vacuum
oven at 40°C.
6.2.3 Membrane characterization
Grafting degree
Grafting degree is a basic and simple method to measure the amount of polymer which is grafted
from the surface of the membrane. The base membrane was rinsed and dried overnight in a
vacuum oven at 40°C. The dried weight of the unmodified membrane was recorded. After
modification, the membrane was washed in DI water and then dried overnight in a vacuum oven
at 40°C. The membrane was then weighted again. The grafting degree, GD is given by
𝐷𝐷 =𝑊𝑓 −𝑊𝑖
𝑆
where Wf, Wi and S are the membrane mass after and before modification and the membrane
surface area respectively.
Since regenerated cellulose membranes are hygroscopic, it is critical to standardize mass
measurements. After the membrane was removed from the oven, it was allowed to rest at
atmospheric conditions for 30 minutes before the mass was recorded.
Contact angle
The contact angle is the angle, conventionally measured through the liquid, where a
liquid interface meets a solid surface. It quantifies the wettability of a solid flat and homogenous
surface by a liquid via Young’s equation41
𝛾𝑠𝑠 = 𝛾𝑠𝜇 + 𝛾𝜇𝑠𝑐𝑐𝑐𝑐 ,
135
where θ is the contact angle and γsv γsl and γlv are the solid surface energy, the solid/liquid
interfacial free energy and the liquid surface energy respectively.
Static contact angles for all membranes were measured using the sessile drop method at
room temperature and pressure (OCA 20, Future Digital Scientific Corp., Garden City, NY,
USA). Membranes were cut into small pieces and pasted on a glass chip with double sided tape.
A liquid drop (2 μL) was placed on the membrane surface and the image was recorded by a
camera. The liquid drop consisted of buffer A and mixture of 1:9 buffer A : buffer B. Using the
circle fitting method, the angle made between the water drop and the membrane surface was
measured every 0.1 second. Data were collected for the first 3 seconds. Each condition was
tested at 5 different locations. Average contact angles of these 150 measurements yield the final
result.
Field Emission Scanning Electron Microscopy (FESEM)
FESEM was used to image the membrane surface before and after modification. Samples
were first dried in a vacuum oven at 40°C and then coated with 10 nm layer of gold prior to
FESEM imaging using Phillip/FEI XL30 ESEM instrument (Hillsboro, OR, USA).
Attenuated Total Reflectance Fourier-Transform Infrared Spectroscopy (ATR-FTIR)
ATR-FTIR spectroscopy provides qualitative information about functional groups at the
top, approximately 2000 nm of the membrane. Data were obtained using an IR Affinity
instrument (Shimadzu, Columbia, MD, USA) with a horizontal ZnSe accessary. ATR-FTIR
spectra were averaged over 100 scans covering a range of 1500-4000 cm-1. Prior to analysis,
membranes were dried overnight in vacuum oven at 40°C.
X-ray Photoelectron Spectroscopy (XPS)
Compared to ATR-FTIR, XPS is far more surface sensitive. It is possible for XPS to have

136
ppm level detection, and the spatial resolution can reach about 10 nm. XPS can provide
information on the elemental composition presented on membrane surfaces. A VersaProbe station
from Physical Electronics (PHI) (Chanhassen, MN, USA) was used in this study. For each
sample, at first, survey scans over the range of binding energy from 0 to 600 eV with a resolution
of 1 eV step-change were obtained. Additionally, 50 scans with 3 repetitions at high resolution
of 0.1 eV step-change, focusing on the C, O and N regions were averaged to characterize small
changes in the surface chemistry upon grafting.
6.2.4 Chromatographic testing
Chromatography runs were performed on an ÄKTA FPLC from GE Healthcare Bio-
Sciences Corp. (Piscataway, NJ, USA) with FRAC-950 fraction collector using the associated
Unicorn software version 5.31. A stack of four membranes were loaded into the stainless steel
flow cell. Flow distributers (disperser and diffuser) were placed at the inlet/outlet of the flow cell
to ensure the flow was uniform across the entire membrane cross-sectional area. All flow rates
were 1 mL/min unless otherwise indicated. All experiments were conducted in triplicate.
Protein recovery studies were conducted by preparing a BSA feed solution containing 1.8
M ammonium sulfate by dissolving 10 mg of BSA in 10 mL of buffer A and diluting with 90 mL
of buffer B. The membrane stack was loaded into the flow cell and wet with Buffer A in the
reverse flow configuration for 5 minutes. During this time, the flow rate was increased from 0.2
mL/min to 1.0 mL/min in 0.2 mL/min increments. The membranes were then equilibrated in the
forward flow configuration in the feed buffer 1.8 M ammonium sulfate in 20 mM sodium
phosphate obtained by combining on line 10% buffer A and 90% buffer B.
The feed solution was pumped for 10 minutes. The membrane stack was then washed
with the feed buffer for 10 minutes. Finally, the membranes were eluted with buffer A until the

137
UV absorbance was constant. The washing fraction and elution fraction were collected and the
volume determined. Protein concentrations in the sample solution, washing fraction, and elution
fraction were calculated via UV absorbance at a wavelength of 280 nm.
Fractionation of lysozyme and IgG4 was investigated by preparing a feed solution
consisting of 0.066 mg lysozyme and 0.301 mg of IgG4 in buffer C. In addition, single protein
solutions consisting of lysozyme and IgG4 at the same individual concentrations as in the mixed
feed solution were also prepared and tested. The membrane stack was loaded and wet as
described for the protein recovery studies. The membranes were then equilibrated in the forward
flow configuration as described for protein recovery studies using buffer C. The feed solution
was loaded onto the membrane stack for 10 minutes. The membrane stack was then washed with
the feed buffer for 10 minutes at 1 mL/min.
Initially gradient elution was used to obtain two distinct elution peaks corresponding to
lysozyme and IgG4. The elution commenced with the feed buffer (buffer C) and switched to
100 % buffer A over 30 minutes. The conductivity at which two distinct peaks (lysozyme and
IgG4) appeared was noted. In order to quantify the amount of protein that is eluted, a second
experiment was run using a step change elution method. Elution commenced using 65% buffer
C and 35% buffer A giving a conductivity of 162.6 mS/cm for 15 minutes after which 100%
buffer A was used for another 15 minutes. Protein concentrations were calculated via UV
absorbance at a wavelength of 280 nm. Recovery was calculated from the equation
% Recovery =Protein in elution peak
Bound protein∗ 100
6.3 Results and Discussion
Figure 2 gives the grafting degree as a function of polymerization time. Approximately
linear growth is observed over the period 1-4 hours suggesting a well-controlled process.

138
Results are given for 2 and 3 hour initiator immobilization times. Longer initiator
immobilization times will lead to a higher chain density. The higher grafting degrees observed
for the same polymerization time at higher initiator immobilization times suggests that we are
able to relatively independently control chain length and density. Interestingly much faster
growth is observed in the first hour of polymerization suggesting that reaction of VCL with BIB
is much faster than reaction of VCL monomer with the growing polymer chain.
In our earlier work24 we obtained similar grafting degrees but for 12 hour polymerization
times. Further we showed that for a 12 hour polymerization time, increasing the initiator
immobilization time up to about 5 hours yielded a higher grafting degree. Beyond 5 hours no
appreciable increase in grafting degree was observed suggesting that all accessible reactive sites
on the membrane surface had been used for polymerization.
Figure 6.2: Variation of grafting degree with polymerization time
0
5
10
15
20
25
30
35
40
0 1 2 3 4 5
Gra
ftin
g de
gree
(µg
cm-2
)
Polymerization time (h)
3h Immonilization
2h Immobilization3 h immobilization 2 h immobilization

139
The much shorter polymerization times used here indicate a much faster reaction yet
Figure 6.2 indicates that a significant level of control is maintained over the polymerization. The
initiator immobilization conditions are identical. The main difference is that here PMDETA
rather than 2,2'-Bipyridine (BPY) is used as the ligand. Tang et al.42 indicate that ATRP
equilibrium constants depend strongly on the initiator and ligand structures. PMDETA displays
around an order of magnitude higher ATRP equilibrium constant explaining the faster reaction
observed here. These results indicate the importance of optimizing polymerization conditions in
order to increase the rate of polymerization while maintaining controlled growth.
Figure 6.3 gives ATR-FTIR spectra for the base membrane as well as membranes
modified with lowest and highest grafting degrees. All spectra were averaged over 100 scans.
The largest peak at about 3335 cm-1 corresponds to stretching of C-OH bonds. Increasing the
grafting degree leads to a decrease in this peak as PVCL does not contain any C-OH bonds.
Though an amide I peak is expected at 1650-1670 cm-1 no clearly discernable peak is evident.
This suggests that the grafted nanostructure is relatively thin. Consequently, the amide I peak is
swamped by the signal from the base membrane.

140
Figure 6.3: ATR-FTIR spectra for unmodified and modified membranes (2 hour initiator immobilization, 1 hour polymerization and 3 hours initiator immobilization, 4 hours polymerization)
Figure 6.4 provides XPS spectra for the base membrane and membranes modified for 2
hour initiator immobilization and 1 and 4 hour polymerization. Figure 6.4(a) is a high resolution
spectrum of the carbon region. The largest peak at 286.3 eV corresponds to alcohol and ether
groups present in the regenerated cellulose membrane but not the PVCL. The peak decreases
with increasing grafting degree of the PVCL nanostructure. A shoulder at 288 eV representing
carbonyl groups in PVCL, appears in the modified membranes.
150020002500300035004000
Abs
orba
nce
(AU
)
Wavelength (1/cm)
unmodified2h Ini, 1h ATRP3h Ini, 4h ATRP
unmodified 2 h immobilization, 1 h polymerization 3 h immobilization, 4 h polymerization

141
Figure 6.4: XPS spectra for the (A) carbon, (B) oxygen, and (C) nitrogen. Spectra are given for unmodified and modified membranes (2 hours immobilization, 1 and 4 hours polymerization times)
275280285290295300
Inte
nsity
Binding Energy (eV)
Carbon Region blank1hr4hr
unmodified 1 h polymerization 4 h polymerization
520525530535540545
Inte
nsity
Binding Energy (eV)
Oxygen Region blank1hr4hr
unmodified 1 h polymerization 4 h polymerization

142
Figure 6.4 (Cont.)
Figure 6.4(b) is a high resolution spectrum of the oxygen region. For the modified
membranes the peak decreases due to less oxygen being present in the grafted PVCL
nanostructure. Further as the grafting degrees increases the peak height decreases indicating
growth of a thick PVCL layer. The oxygen peak for the modified membrane is shifted slightly
towards lower energy with increasing grafting degree due to the carbonyl oxygen present in the
PVCL layer representing a greater percent of the oxygen.
Finally Figure 6.4(c) is a high resolution spectrum of the nitrogen region. No nitrogen is
present in the base regenerated cellulose membrane. A peak appears as PVCL is grafted from the
membrane surface. Taken together, Figures 2-4 indicate that we successfully graft PVCL from
the surface of the regenerated cellulose membrane. Further as the grafting degrees increases, the
thickness of the grafted layer increases.
Figure 6.5 give the variation of contact angle with polymerization conditions. For the
unmodified membrane, the contact angle is the same for buffers A and B (0 and 1.8 M
390395400405410415
Inte
nsity
Binding Energy (eV)
Nitrogen Region blank1hr4hr
unmodified 1 h polymerization 4 h polymerization

143
ammonium sulfate in 20 mM sodium phosphate). However, for all modified membrane the
contact angle is significantly higher for buffer B compared to buffer A. Thus, the membrane is
much more hydrophobic in the presence of 1.8 M ammonium phosphate. At high ionic strength,
the PVCL chains collapse and dehydrate leading to a more hydrophobic surface. All testing was
conducted at 25 °C. Thus, the LCST in a 1.8 M ammonium sulfate solution is below 25 °C.
Maeda et al36 observed that the LCST of PVCL decreased to below 20 °C in the presence of 1.0
M KCl.
Figure 6.5: Average contact angle as a function of polymerization time for 20 mM sodium phosphate buffer containing 0 and 1.8 M ammonium sulfate.
0
20
40
60
80
100
120
140
0 1 2 3 4
Con
tac A
ngle
(o )
ATRP time (h)
1.8 M (NH4)2SO4, unmodified1.8 M (NH4)2SO4, 3h ini1.8 M (NH4)2SO4, 2h ini0 M (NH4)2SO4, unmodified0 M (NH4)2SO4, 2h ini0 M (NH4)2SO4, 3h ini
1.8 M (NH4)2SO4, unmodified 1.8 M (NH4)2SO4, 3 h immobilization 1.8 M (NH4)2SO4, 2 h immobilization 0 M (NH4)2SO4, unmodified 0 M (NH4)2SO4, 2 h immobilization 0 M (NH4)2SO4, 3 h immobilization

144
Figure 6.6 gives FESEM images of an unmodified membrane and a membrane modified
with the maximum grafting degrees (3 hour initiator immobilization and 4 hour polymerization).
Surface modification appears to have little effect on the membrane morphology. However, a
slight decrease in DI water permeability is observed. At a flow rate of 1 mL/min the permeability
for the base membrane was 0.79 L m-2 hr-1 Pa-1 while that for the membrane with the highest
grafting degree was 0.65 L m-2 hr-1 Pa-1. The decrease in permeability increased with grafting
degree.
(A) (B)
Figure 6.6: FESEM images for (A) unmodified membrane, (B) membrane modified with 3 hour initiator immobilization, 4 hour polymerization
Chromatographic testing
Figure 6.7 shows a chromatogram for a modified membrane where the initiator
immobilization time was 2 hours and the polymerization time 4 hours. The result is analogous to
our previous observations24. The figure clearly indicates that breakthrough occurs after 5 minutes
as the UV absorbance rises rapidly. After 10 minutes washing commenced and the absorbance
drops to zero. The elution buffer was introduced after 20 minutes of operation. During the

145
gradient elution step the conductivity decreases linearly. However, the UV absorbance drops
below zero at the end of the elution step. The UV absorbance was zeroed with the feed buffer
(buffer B) which contains 1.8 M ammonium sulfate. At the end the gradient elution step, pure
buffer A (10 mM sodium phosphate with no ammonium sulfate) is used. The difference in the
salts present in buffers B and A result in the observed negative absorbance at the end of the
elution step. A sharp elution peak indicates no pore diffusional resistance. In fact, additional
experiments at flow rates between 0.1 and 10 mL min-1 indicated no effect on the dynamic
capacity.
Based on analogous chromatograms, BSA dynamic binding capacity and recovery at
10 % and 90 % beak through were determined. The results are given in Table 1. As can be seen
within experimental error increasing the initiator immobilization time appears to lead to an
increase in capacity especially at 90 % breakthrough. However, increasing the polymerization
time seems to have little effect on capacity. Our earlier results24 indicated that for initiator
immobilization times up to 5 hours the dynamic binding capacity increased with increasing
initiator immobilization time. However, for initiator immobilization times of more than 5 hours
little increase in capacity was observed indicating that all the chain attachment site on the
membrane surface have been used.

146
0
50
100
150
200
250
300
-10
0
10
20
30
40
50
60
0 5 10 15 20 25 30
Conductivity (m
S/cm)
Time (min)
UV Conductivity
Abs
orba
nce
(mA
U)
Equilibrium
Binding
Breakthrough
Washing
Elute
Figure 6.7: Typical chromatogram for BSA. The membrane was modified with a 2 hours initiator immobilization time and 4 hours polymerization time. Flow rate was constant at 1 mL/min, and the loading protein concentration was 0.1 mg BSA/mL
Table 6.1: Binding capacity and recovery for BSA Immobilization time (h)
ATRP time (h)
Binding Capacity at 10% breakthrough (mg/mL)
Binding Capacity at 90% breakthrough (mg/mL)
Recovery at 90% breakthrough (%)
2 1 2.1±0.1 3.7 ±0.1 92.4 ±2.5 2 2 2.2±0.2 3.4 ±0.3 95.3 ±2.1 2 3 2.0±0.3 3.6 ±0.3 90.7 ±3.4 2 4 2.3±0.1 4.0 ±0.4 95.0 ±1.8 Immobilization time (h)
ATRP time (h)
Binding Capacity at 10% breakthrough (mg/mL)
Binding Capacity at 90% breakthrough (mg/mL)
Recovery (%) at 90% breakthrough (%)
3 1 2.2±0.1 4.3 ±0.2 94.2 ±1.4 3 2 2.2±0.1 4.3 ±0.4 98.1 ±1.5 3 3 2.4±0.2 4.6 ±0.3 99.4 ±1.1 3 4 2.5±0.3 5.1 ±0.3 99.9 ±1.2

147
Our results suggest that increasing the chain length does not lead to an increase in
capacity. Since protein binding occurs when the PVCL chains are in a collapsed conformation, it
is likely that only the ends of the chains are available for protein binding. Consequently, no
increase in capacity is seen with increasing polymerization time. The results suggest that
increased capacity could be obtained by designing comb like43 or short highly branched polymer
chains. Maximizing the number of short polymer chains per pore volume will ensure most
ligands remain accessible even in the collapsed conformation. Further it will minimize the
possibility of interaction between polymer chains in the collapsed conformation, thus
maximizing the capacity for protein binding.
Typical elution chromatograms of single component feeds consisting lysozyme, and IgG4
as well as a mixed feed consisting of lysozyme and IgG4 are given in Figures 6.8 and 6.9. Figure
6.8 shows results for gradient elution while Figure 6.9 gives results for a step elution process
based on the gradient elution results. As can be seen the elution times for the single components
feed streams correspond very well to the elution times for the feed stream containing both
lysozyme and IgG4. Thus there is little interaction between lysozyme and IgG4. Similar results
have been observed by previous researchers for model feed streams26,32. Lysozyme being less
hydrophobic elutes first. As noted for the BSA chromatogram, Figure 6.7, negative absorbance
values are due to the fact that the UV absorbance is zeroed based on the feed buffer. For
lysozyme and IgG4 binding, the feed buffer consisted of buffer C (20 mM sodium phosphate 1 M
sodium sulfate and 3 M ammonium sulfate). Figure 6.9 indicates the feasibility of developing a
step-change elution protocol for rapidly fractionating proteins with large differences in
hydrophobicity. Table 6.2 gives capacity and recovery data. As can be seen we obtain recoveries
in excess of 90% except for the mixed feed. Our data suggest the viability of very effective

148
protein fractionation using membrane based HIC. However, from a practical perspective it will
be essential to increase membrane capacity.
Figure 6.8: Elution peaks for fractionation of lysozyme and IgG4 using gradient elution for membrane modified with 3 hour immobilization 4 hour polymerization. Flow rate was constant at 1 mL/min, and the loading protein concentration was 0.066 mg lysozyme/mL and 0.301 mg IgG4 /mL.
0
50
100
150
200
250
-10
0
10
20
30
40
20 25 30 35 40 45 50 55Abs
orba
nce
(mA
U)
Time (min)
Lysozyme UVCond
Conductivity (m
S/cm)
0
50
100
150
200
250
-10
0
10
20
30
40
20 25 30 35 40 45 50 55Abs
orba
nce
(mA
U)
Time (min)
IgG4 UVCond
Conductivity (m
S/cm)
0
50
100
150
200
250
-10
0
10
20
30
40
20 25 30 35 40 45 50 55
Abs
orba
nce
(mA
U)
Time (min)
IgG4 and Lysozyme
UV
Cond
Conductivity (m
S/cm)

149
Figure 6.9: Elution peaks for fractionation of lysozyme and IgG4 using step-change elution for membrane modified with 3 hour immobilization 4 hour polymerization. Flow rate was constant at 1 mL/min, and the loading protein concentration was 0.066 mg lysozyme/mL and 0.301 mg IgG4 /mL.
0
50
100
150
200
250
-20
0
20
40
60
80
20 25 30 35 40 45 50Abs
orba
nce
(mA
U)
Time (min)
Lysozyme
UV
Cond
Conductivity (m
S/cm)
0
50
100
150
200
250
-20
0
20
40
60
80
20 25 30 35 40 45 50Abs
orba
nce
(mA
U)
Time (min)
IgG4 UVCond
Conductivity (m
S/cm)
0
50
100
150
200
250
-20
0
20
40
60
80
20 25 30 35 40 45 50
Abo
rben
ce (m
AU
)
Time (min)
IgG4 and Lysozyme
UVCond
Conductivity (m
S/cm)

150
Table 6.2: Fractionation of lysozyme and IgG4 using membrane modified with 3 hours initiator immobilization 4 hour polymerization Feed proteins in
10 mL of solution (mg)
Binding capacity (10% breakthrough) (mg/mL)
Recovery (10% breakthrough) (mg/mL)
IgG4 (single component) 0.602 4.68±0.05 94.5±1.8 Lysozyme (single component) 0.132 0.97±0.03 93.9±2.5 IgG4 (mixture) 0.301 2.89±0.12 85.1±1.1 Lysozyme (mixture) 0.066 0.63±0.06 81.2±2.3
Previous investigators have suggested that membrane based HIC could be used to
separate IgG from other proteins. Kuczewski et al.28 indicate binding capacities for a non-
responsive phenyl ligand based membrane adsorber of 20 mg Mab/cm3 membrane. Ghosh and
Wang26 indicate binding capacities of a humanized mAb ranging from 13 to 33 mg/cm3
membrane for base PVDF membranes while Yu et al.31 obtained capacities of 9 mg/cm3 using a
PEG ligands from a simulated mammalian cell culture supernatant. Finally Mah and Ghosh32
obtained capacities of close to 12 mg/cm3 for human IgG using a PVCL hydrogel coated on filter
paper. While the dynamic binding capacity for all of these studies is higher than the capacities
obtained here, the observed capacity depends on the operating conditions.
In general, previous studies have used higher feed protein concentrations which led to
higher capacities. Further optimizing the ionic strength of the feed solution is also important.
The feed ionic strength during loading will affect capacity and recovery. Our results indicate very
good recovery of the three proteins investigated here. A major impediment to the widespread use
of membrane based HIC has been poor protein recovery. Our future work will focus on
optimizing the three-dimensional structure of the binding ligand to increase membrane capacity.

151
6.4 Conclusions
Increasing titers during cell culture operations has resulted in a need to develop
downstream purification processes that can efficiently handle these high titer feed streams.
Since obtaining approval for new unit operations is time consuming and costly, there is
tremendous interest in improving the efficiency of existing unit operations. Here we show that
the use of responsive ligands for membrane based HIC could lead to much more efficient HIC
operations. In particular membrane based HIC could be used for bind and elute operations.
The results obtained here indicate the importance of carefully designing the three-
dimensional structure of the ligands to maximize capacity and recovery. Use of a controlled
polymerization process, such as atom transfer radical polymerization, will be essential.
Maximizing the capacity will require growing short highly branched polymer chains from the
membrane surface.
HIMC offers all the advantages of membrane adsorbers compared to traditional packed
bed chromatography. Both ICC and responsive membrane based HIMC are operated at lower
pressure drop and are easy to scale up. In the case of ICC membranes, the membrane surface
area is maximized by developing uniform three-dimensional microporous structures. In the case
of responsive ligands, the aim is to develop a ligand that responds to environmental changes.
The results obtained here indicate that both approaches could lead to commercially viable HIMC.
HIMC could be run in flow through mode for removal of contaminants. In this case, it is
essential to ensure efficient clearance of contaminants such as host cell proteins, DNA and
viruses while maximizing product recovery. ICC membranes may well be suited for such

152
applications. In the case of bind and elute chromatography, efficient recovery of the bound
protein is essential. Responsive membranes may be well suited for such applications.
The capacity and recovery of ICC membranes is highly protein specific. Results for BSA
and IgG4 cannot be compared directly due to the different molecular weight, structure,
hydrophobicity etc. of the molecules. The results obtained here indicate that HIMC could be an
enable process to overcome the purification bottleneck that exists today. However more detailed
studies that focus on specific classes or proteins will be necessary in order to optimize either ICC
or responsive membranes.
References
1. Gagnon, P. Technology trends in antibody purification. J. Chromatogr. A, 1221: 57–70, (2012).
2. Low, D., O’Leary, R., Pujar, N. S. Future of antibody purification. J. Chromatogr. B, 848
(1): 48–63, (2007). 3. Lienqueo, M. E., Mahn, A., Salgado, J. C., Asenjo, J. A. Current insights on protein
behaviour in hydrophobic interaction chromatography. J. Chromatogr. B, 849 (1-2): 53–68, (2007).
4. Chen, J., Luo, Q., Breneman, C. M., Cramer, S. M. Classification of adsorption and
recovery at low salt conditions in hydrophobic interaction chromatographic systems. J. Chromatogr. A, 1139 (2): 236–246, (2007).
5. Fausnaugh, J. L., Regnier, F. E. Solute and mobile phase contributions to retention in
hydrophobic interaction chromatography of proteins. J. Chromatogr. A, 359: 131–146, (1986).
6. Machold, C., Deinhofer, K., Hahn, R., Jungbauer, A. Hydrophobic interaction
chromatography of proteins. I. Comparison of selectivity. J. Chromatogr. A, 972 (1), 3–19, (2002).
7. Melander, W. R., Rassi, Z. E., Horváth, C. Interplay of hydrophobic and electrostatic
interactions in biopolymer chromatography. Effect of salts on the retention of proteins. J. Chromatogr. A, 469, 3–27, (1989).

153
8. Gagnon, P., Grund, E., Lindbäck, T. Large-scale process development for hydrophobic interaction chromatography. 2. Controlling process variation. Biopharm-The Technol. Bus. Biopharm., 8 (4), 36–41, (1995).
9. Gagnon, P., Grund, E., Lindbäck, T. Large-scale process development for hydrophobic
interaction chromatography. 4. Controlling selectivity. Biopharm-The Technol. Bus. Biopharm., 9, 54, (1996).
10. Gagnon, P., Grund, E., Lindbäck, T. Large-scale process development for hydrophobic
interaction chromatography. 3. Factors affecting capacity determination. Biopharm-The Technol. Bus. Biopharm., 9, 34–39, (1996).
11. Gagnon, P., Grund, E., Lindbäck, T. Large-Scale Process Development for Hydrophobic
Interaction Chromatography, Part I-Gel Selection and Development of Binding Conditions. LC GC Magazine-Magazine of Separation Science-Liquid. Chromatogr. Gas Chromatogr., 13, 318–327, (1995).
12. Evans, D. R. H., Macniven, R. P., Labanca, M., Walker, J., Notarnicola, S. M. Purification
of an Fc-fusion biologic: clearance of multiple product related impurities by hydrophobic interaction chromatography. J. Chromatogr. A, 1177 (2), 265–271, (2008).
13. Lu, Y., Williamson, B., Gillespie, R. Recent advancement in application of hydrophobic
interaction chromatography for aggregate removal in industrial purification process. Curr. Pharm. Biotechnol., 10, 427–433, (2009).
14. Li, F., Zhou, J. X., Yang, X., Tressel, T., Yang, X. Current therapeutic antibody production
and process optimization. Bioprocess. J., 5 (4), 16-25, (2006). 15. Bolton, G. R., Violand, B. N., Wright, R. S., Sun, S., Sunasara, K. M., Watson, K.,
Coffman, J. L., Gallo, C., Godavarti, R. Addressing the Challenges in Downstream Processing Today and Tomorrow. Advanstar Commun. Inc, (2011).
16. Shukla, A. A., Hubbard, B., Tressel, T., Guhan, S., Low, D. Downstream processing of
monoclonal antibodies-application of platform approaches. J. Chromatogr. B, 848 (1), 28–39, (2007).
17. Teeters, M. A., Conrardy, S. E., Thomas, B. L., Root, T. W., Lightfoot, E. N. Adsorptive
membrane chromatography for purification of plasmid DNA. J. Chromatogr. A, 989 (1), 165–173, (2003).
18. Jungbauer, A., Machold, C., Hahn, R. Hydrophobic interaction chromatography of
proteins. J. Chromatogr. A, 1079, 221–228, (2005). 19. Ueberbacher, R., E. Haimer, R. Hahn, Jungbauer, A. Hydrophobic interaction
chromatography of proteins V. Quantitative assessment of conformational changes. J. Chromatogr. A, 1198-1199, 154–163, (2008).

154
20. Queiroz, J. A., Tomaz, C. T., Cabral, J. M. S. Hydrophobic interaction chromatography of
proteins. J. Biotechnol., 87 (2), 143–159, (2001). 21. Arakawa, T., Narhi, L. O. Solvent modulation in hydrophobic interaction
chromatography. Biotechnol. Appl. Biochem., 13 (2), 151–172, (1991). 22. Klein, E. Affinity membranes: a 10-year review. J. Membr. Sci., 179 (1-2), 1–27, (2000). 23. Ghosh, R. Review: protein separation using membrane chromatography: opportunities and
challenges. J. Chromatogr. A, 952 (1-2), 13–27, (2002). 24. Himstedt, H. H., Qian, X., Weaver, J. R., Wickramasinghe, S. R. Responsive membranes
for hydrophobic interaction chromatography. J. Membr. Sci., 447: 335–344, (2013). 25. Giovannoi, L., Ventani, M., Gottschalk, Giovannoni, U. Antibody purification using
membrane adsorbers. BioPharm Int., 21 (12): 48–52, (2008). 26. Ghosh, R., Wang, L. Purification of humanized monoclonal antibody by hydrophobic
interaction membrane chromatography. J Chromatogr. A, 1107 (1-2): 104–109, (2006). 27. Fraud, N., Kuczewski, M., Zarbis-Papastoitsis, G., Hirai, M. Hydrophobic membrane
adsorbers for large-scale downstream processing. Biopharm Int., 22: 24–27, (2009). 28. Kuczewski, M., Fraud, N., Faber, R., Zarbis-Papastoitsis, G. Development of a polishing
step using a hydrophobic interaction membrane adsorber with a PER.C6 – derived recombinant antibody. Biotechnol. Bioeng., 105 (2): 296–305, (2010).
29. Fan, J., Luo, J., Song, W., Chen, X., Wan, Y. Directing membrane chromatography to
manufacture α1-antitrypsin from human plasma fraction IV. J. Chromatogr. A, 1423: 63–70, (2015).
30. Fan, J., Luo, J., Chen, X., Wan, Y. Polydopamine meets porous membrane: a versatile
platform for facile preparation of membrane adsorbers. J. Chromatogr. A, 1448: 121–126, (2016).
31. Yu, D., Chen, X., Pelton, R., Ghosh, R. Paper-PEG-Based Membranes for Hydrophobic
Interaction Chromatography: Purification of Monoclonal Antibody. Biotechnol. Biosep., 99 (6): 1434–1442, (2009).
32. Mah, K. Z., Ghosh, R. Paper-based composite lytropic salt-responsive membranes for
chromatographic separations of proteins. J. Membr. Sci., 360 (1-2): 149–154, (2010). 33. Wandera, D., Wickramasinghe, Husson, S. M. Review Stimuli-responsive Membranes. J.
Memb. Sci., 357: 6–35, (2010).

155
34. Bhattacharyya, D., Schäfer, T., Wickramasinghe, Daunert, S. Responsive Membranes and Materials, John Wiley & Sons. 2013.
35. Darvishmanesh, S., Qian, X., Wickramasinghe, S. R. Responsive membranes for advanced
separations. Curr. Opin. Chem. Eng., 8: 98–104, (2015). 36. Maeda, Y., Nakmura, T., Ikeda, I. Hydration and phase behavior of poly(N-
vinylcaprolactam) and poly(N-vinylpyrrolidone) in water. Macromolecules, 35 (1): 217–222, (2002).
37. Prabaharan, M., Grailer, J. J., Steeber, D. A., Gong, S. Stimuli-responsive chitosan-graft-
poly(N-vinylcaprolactam) as a promising material for controlled hydrophobic drug delivery. Macromol. Biosci., 8 (9): 843–851, (2005).
38. Du, H., Wickramasinghe, S.R., Qian, X. The effects of salt on the lower critical solution
temperature of poly (N-isopropylacrylamide). J. Phys. Chem. B, 114 (49): 16594–16604, (2010).
39. Du, H., Qian, X. Molecular Dynamics Simulations of PNIPAM-co-PEGMA Copolymer
Hydrophilic to Hydrophobic Transition in NaCl Solution. J. Polym. Sci. B Polym. Phys., 49 (15): 1112–1122, (2011).
40. Ieong, N. S., Hasan, M., Phillips, D. J., Saaka, Y., O’Reilly, R. K., Gibson, M. I. Polymers
with molecular weight dependent LCSTs are essential for cooperative behaviour. Polym. Chem., 3: 794–799, (2012).
41. Eral, H. B., Mannetje, D. J. C. M. ’T., Oh, J. M. Contact angle hysteresis: A review of
fundamentals and applications. Colloid Polym. Sci., 291 (2): 247–260, (2013). 42. Tang, W., Kwak, Y., Braunecker, W., Tsarvevsky, N. V., Coote, M. L., Matyjaszewski, K.
Understanding atom transfer radical polymerization: effect of ligand and initiator structures on the equilibrium constants. J. Am. Chem Soc., 130 (32): 10702–10713, (2008).
43. Farjadian, F., Schwark, S., Ulbricht, M. Novel functionalization of porous polypropylene
microfiltration membranes: via grafted poly-(aminoethyl methacrylate) anchored Schiff bases toward membrane adsorbers for meatal ions. Polym. Chem., 6, 1584–1593, (2015).
156
PART 3 Catalytic membranes for biomass hydrolysis
Chapter 7
Novel polymeric solid acid catalysts for cellulose and Biomass hydrolysis
7.1 Introduction
As a part of membrane technology, surface modification on commercially available
membranes has been widely adopted to render membranes with additional functionalities such as
antifouling, responsiveness and affinity. For example, undesirable molecules or particles easily
lead to fouling which degrades the performance of the membranes. Himstedt et al. proposed a
method of grafting poly(2-hydroxymethyl methacrylate) with superparamagnetic iron oxide
(Fe3O4) at the polymer chain ends grafted on the surface of polyamide composite nanofiltration
membrane in order to inducing mixing thereby reducing the concentration polarization and
colloidal fouling 1. Membrane surface modification has received much attention. By 1996,
Zeman and Zydney reported that 50 percent of microfiltration (MF) and ultrafiltration (UF)
membranes in the market were surface modified 2.
Membrane modification by grafting responsive polymeric ligands has played an
important role due to its switchable physicochemical properties. Indeed, it is an inspiration from
nature to develop stimuli-responsive membranes with environmental conditions, such as
temperature, pH, solution ionic strength, light, electric and magnetic fields, and chemical cues.
The functional group or responsive polymer in the membrane bulk or grafted on its surface will
change its conformation, polarity, or reactivity as the environment changes. Depending on the
characteristics of the membranes, for example porous or non-porous, responsiveness can be built
in by grafting specific responsive polymer layers from the membrane external surface or inside

157
pore walls 3.
Here we explore the use of surface modification to develop advanced membranes
immobilized with novel polymeric acid catalysts for lignocellulosic biomass hydrolysis.
Lignocelluloses or cellulosic biomass is an abundant leading biomass resource for
producing renewable energy to replace fossil-based transportation fuels 4,5. In general,
lignocellulosic biomass contains 38-50% cellulose, and 23-32% hemicelluloses and 15-25%
lignin. The structures of cellulose, hemicellulose and lignin are shown in Figure 7.1.1.
O O
O OO O O
OH
OH
OH
OH
OHOH
OHOH
OH
OH
OH
OH nCellobiose unit
Cellulose
Lignin (soft wood)
O
O OO O O
OH
OOH
O
OH
OH
O
n
O-OOC
OHO
OH
O
O
OH
OHO
O
O
HO
Hemicellulose (xylan type)
Figure 7.1.1: Structures of cellulose, hemicellulose and lignin from lignocellulosic biomass 6,7

158
Cellulose is β-(1, 4)-linked glucose polymer. It is a complex substrate consisting of
amorphous, semi-crystalline and crystalline regions which contain strong and extensive
hydrogen bonding networks. Qian clearly stated that cooperativity of hydrogen bonding
interaction, where the –OH group is both a donor and acceptor of a hydrogen bond, in crystalline
cellulose enhanced the hydrogen bonding energy by as much as 50% compared to non-
cooperative ones in other polysaccharides. And that is why cellulosic biomass is so recalcitrant to
depolymerization 8,9.
O
O
O
O
O
O
O
O
O
OH O
O
O
HO OH
O
O
HO
O
O
O
OOH
O
O
HO
OO
O
O
HO OH
HO
HO
OH
OH
OH
OH
OH
O
O
O
HO
HO
O
O
O
HO
H
H
H
H
H
H
H
H
H
Intra chain Inter chain
Figure 7.1.2: Schematic of cellulose with inter-and intra-hydrogen bonds 10.
Many pretreatment methods have been investigated. However, each method still suffers
from its own disadvantage. For example, dilute sulfuric acid pretreatment has been the leading

159
pretreatment technology to dislocate lignin and decrystallize cellulose. This technique is
normally conducted at hash condition, for example 140-200°C and 4-15psi with 5-30 min
residence time. It can be operated in the batch and continuous modes. On the other hand, the
cost of pretreatment is high particularly the equipment cost due to the corrosive nature of the
feed. Moreover, sulfuric acid is not environmentally friendly and difficult to recycle and recover.
As discussing above, cellulose is a complex substrate, and in fact, insoluble in most of the
conventional solvents, due to its extensive hydrogen bonding network. Ionic liquid (IL) is
discovered as an effective solvent for dissolving cellulose11–15. Basically, the inter- and intra-
molecular hydrogen bonds of cellulose are disrupted by replacing the hydrogen bonds between
the IL anions and the hydroxyl groups on the cellulose substrate. Some of the commonly used IL
anions are chloride, acetate, formate, and alkylphosphonate due to their ability to form hydrogen
bonds with cellulose. For example, chloride-containing IL can dissolve pulp cellulose up to 25%
by weight at high temperature. Moreover, Fukaya et al., Zhang et al., and Zhu et al. also listed
more than twenty ILs that have ability to dissolve cellulose (ref in ionic liquid pretreatment...IL
recycle)13,16–18. They are “green” solvents with negligible vapor pressure, non-flammability, high
thermal, low toxicity and chemical stability, and tunable 19. One recent study shows that pure 1-
ethyl-3-methylimidazolium chloride ([EMIM]Cl]) with small amounts of water (equivalent to 4
glucose units) can hydrolyze cellulose with total reducing sugar (TRS) and glucose yield
reaching 97% and 19% respectively in the absence of any acid catalyst. However, impurities in
IL can reduce the yield of hydrolysis reaction. As a result, extensive purification of IL is
required 20.
The reaction barrier for Brønste acid catalyzed cellulose hydrolysis and sugar
dehydration/degradation reactions is largely due to the solvent, for example, due to water

160
molecule’s high affinity for proton21–28. Indeed, limiting the degree of cellulose hydration will
reduce the activation barrier and facilitate the hydrolysis reaction, similar to the
microenvironment in a catalytic tunnel of cellulose enzymes. Based on this concept, polymeric
solid acid catalysts immobilized on a supporting substrate could potentially create a partially
dehydrated microenvironment that is inductive for the hydrolysis reaction. In this study, dual
functional nanostructures are synthesized to help solubilize cellulose and catalyze its hydrolysis
reaction. Poly (styrene sulfonic acid) (PSSA) chains are immobilized on surfaces of ceramic
membrane substrates and used to catalyze biomass hydrolysis. Its neighboring poly (vinyl
Imidazolium chloride) ionic liquid (PIL) chains are grafted from the surface to help solubilize
lignocellulosic biomass and enhance the catalytic activity.
Atom transfer radical polymerization (ATRP) was used to immobilize the acidic PSSA
polymer chains. The PIL chains were grafted via UV-initiated radical polymerization. Each
method of polymerization will control the grafting of one specific polymer only. The two chains
were grafted randomly from the surface of ceramic membrane substrates. These two
nanostructured polymer chains can be tuned independently including the chain length and chain
density as well as the ratio of the polymer chains. An optimal condition for biomass hydrolysis
can be achieved by tuning these parameters29,30.
7.2 Materials and reagents
All purified water (0.06 µS/cm) was obtained from a combination Water Pro/RO reverse
osmosis and Pro Plus deionization purification system from Labconco Corp. (Kansas City m
MO). Benzoin ethyl ether (BEE, 97%), 1-butyl-3-methyl-imidazolium chloride ([BMIM]Cl,
99%), 1-ethyl-3-methyl-imidazolium chloride ([EMIM]Cl, 95%), 3-aminopropyltriethoxysilane
(APTES, 99%), ethyl acetate (EtOAc, anhydrous, 99.8%), 2,2’-bipyridine (BPY, 99%), copper(I)

161
chloride (Cu(I)Cl, anhydrous, beads, ≥ 99.99% trace metal basis), copper(II) chloride, (Cu(II)Cl,
anhydrous, beads, ≥ 99.99% trace metal basis), 1-ethyl-3-(3-dimethylaminopropyl) carbodiimide
Hydrochloric acid (EDC.HCl, ≥ 98%), 2-bromo-2-methylpropionyl bromide (or α-
bromoisobutyrylbromide) (BiB, 98%), and sodium 4-styrenesulfonate (NaStS, technical, ≥90%),
boric anhydride (99.99% trace metal basis), bovine serum albumin (BSA) (>99%, product
#I4506), Dimethyl sulfoxide (DMSO), trimethylamine (TEA, ≥ 99%) were purchased from
Millipore Sigma (Saint Louis, MO). Acetonitrile (ACN, reagent, HPLC grade) and hydrochloric
acid (12N), Ethanol (EtOH, pure, 200 proof, from KOPTEC), and sodium hydroxide (ACS
grade) were purchased from VWR (West Chester, PA). Potassium hydroxide (KCl, 98% extra
pure), flakes), tetrahydrofuran (THF, 99.9%, stablized) and sodium hydroxide were purchased
from Acros Organics (Fisher Science Education, Hanover Park, IL). Acetic acid (glacial, ACS
grade) was purchased from EMD Millipore, Germany. N-Vinyl imidazole (VI, 99%) wase
purchased from Alfa Aesar (Tewsbury, MA). All chemicals were used without further
purification.
α-cellulose (white powder) and D-glucose (ACS reagent) were purchased from Sigma
Aldrich. Real corn biomass was obtained from Walmart food market, then dried and grinded in
the lab. Pretreated corn-stovers samples with acid (CH131104 PCS), base (PSI150310-17) or
steam were obtained from NREL.
Ceramic membranes were purchased or obtained Whatman (Maidstone, England),
(Anopore (Anodisc), 0.2 µm pore diameter, 47 mm diameter disc aluminum oxide), T3 scientific
company from Minnesota (small cylinder tube 0.15cm ID), and ATECH German company (silica
oxide with variation in shapes, small cylinder tube 0.15cm ID; larger cylinder tube 0.6cm ID,
1cm OD; 152 cm diameter, 7 nm pore side disc membrane).

162
7.3 Synthesis and modification
7.3.1 UV initiator Synthesis
UV initiator was synthesized before starting the modification. The basic reaction
mechanism is following scheme 7.3.1 as described in our earlier publication.
Scheme 7.3.1: Synthesis of UV initiator (BEE-COOH)
20 g of Benzoin ethyl ether (BEE) was dissolved in 40 mL dimethyl sulfoxide (DMSO)
solvent. The solution was degassed with argon during mixing. Then 1.6 mL of 4 M potassium
hydroxide (KOH) was added into the main solution and degassed with argon for 30 minutes. The
color of solution changed from light yellow to dark orange, and then to dark green. Thereafter,
10 mL of ethyl acrylate was also added. The color of the solution changed back to orange. BEE
reacted with ethyl acrylate for 4 hours under argon gas at room temperature. The color of each
solution in each step was indicated in appendix. When mixing BEE in DMSO, the color of
solution is light green. After adding KOH solution, the solution changed to dark orange at first,
then turning to dark green after ten minutes. Finally, adding ethyl acrylate into the solution will
make the solution turn back to orange.
Afterward, 95% of DMSO was removed under vacuum evaporation at 80°C. The brown
and gel-like residue product was then dissolved with 100 mL of 1 M sodium hydroxide (NaOH)
solution containing 6% methanol. Base catalyzed hydrolysis reaction was conducted for 24 hours

163
at room temperature in order to obtain the final product BEE-COOH in liquid form. However,
the pH of the solution is around 11. Because there was NaOH left over after the hydrolysis
reaction, and it can also easily react with BEE-COOH to form a salt-form BEE-COONa.
Therefore, the solution was then neutralized with 0.1 M hydrochloric acid till it can reach pH 6.
Vacuum evaporation was used to remove the solvent, and BEE-COOH would become a yellow
powder. The images of the products and H-NMR spectra for BEE-COOH during the synthesis
steps were listed in the Appendix.
OH OH OH
SAM
O O O
Si
NH2
O
OH
O
O
OO
HN
O
HN
Nm
Br
OBr
HN
Br
OO
HN HNO
SO-3Na+
n
S O- 3N
a+
NN
1. UV 15 min
2. HCl
ATRP
1. UV Immobilization
2. ATRP Immobilization
O O
O
NC
l
OSi
O ONH2
O
OO
HN HN
BrO
O
SO- 3N
a+
Br
HNO
n
SO3H
SO3H
Br
NH
NC
l
Scheme 7.3.2: Overall reactions for grafting PSSA and PIL chains from a glass substrate.

164
Main modification started with forming a SAM layer with an amino end group on the
surface of the glass substrate or ceramic membrane substrates. UV and ATRP initiators were
subsequently immobilized on the SAM layer by reacting with the amino groups. Sodium 4-
styrenesulfonate was grafted via ATRP. UV initiated polymerization of N-vinyl imidazole (VI)
to form PIL. Overall reactions are described in scheme 7.3.2.
7.3.2 Grafting of SAM layer
Glass or membrane substrates obtained commercially from VWR were rinsed with
ethanol then Milli-Q water. The substrate was then submerged into a plastic jar which had 10 mL
1:1 (v:v) mixture of ethanol and Milli-Q water containing 40 μL 3-aminopropyl-triethoxysilane
and 5 μL glacial acetic acid. The reaction took place at room temperature with slow agitation by
a shaker. After 1 hour, the silane layer on substrate surface was cured in an oven at 115°C for 30
minutes. Finally, the substrates were ultrasonicated in ethanol for 1 min, and further dried first
with nitrogen then in a vacuum oven at 40°C.
7.3.3 UV initiator immobilization
The substrate with amino functionalized SAM layer was placed in a container which had
10 mL water, 10 mg EDC-HCl and 150 mg BEE-COOH to immobilize the UV initiator. The
container was sealed and agitated on a shaker. The reaction was run for a specified amount of
time. The length of the time determines the chain density of the grafted PIL chains. After the
reaction, the substrate was taken out and washed with water then dried in vacuum oven
overnight.
7.3.4 ATRP initiator immobilization
In order to immobilize the ATRP initiator, the substrate with amino functionalized SAM
layer was placed in a flask containing 10 mL dry THF, 200μL TEA, and 200 μL 2-bromo-2-

165
methylpropionyl bromide. The reaction was conducted at 0°C by using ice bath in 8 hours. At
the end of the reaction, the membrane substrate was taken out and rinsed with THF 3 times and
then placed in DI water overnight. Finally, the substrate was dried in vacuum oven at 40°C
overnight.
7.3.5 PSSA nanostructure synthesis via ATRP
Following initiator immobilization, ATRP of sodium 4-styrenesulfonate was carried out.
The substrate was placed in the flask, and then evacuated and backfilled with argon at least three
times. The main solution was then prepared. 4.89 g of NaStS was dissolved in 40 mL
water/methanol mixture (1:1, v/v) and then purged with argon and agitated for at least 30
minutes until a white precipitate appeared. Subsequently, 148 mg of bpy ligand and 47 mg of
cooper(I) chloride (CuCl) were added into the solution under argon stream with continuous
stirring. After degasing with argon for another 30 minutes, the reaction solution was cannulated
into a sealed argon filled flask which contained the glass substrate. Reaction flask had to be
sealed carefully in order to prevent the occurring of oxidization during reaction. The reaction
was incubated at room temperature for 24 hours. Thereafter, the glass substrate was removed
from the flask, then thoroughly washed with water, methanol, ethanol, then dried in vacuum
oven at 40°C overnight. Sulfonic acid groups on PSSA chain were generated after grafting PIL
by immersing the substrate in a 12 N hydrochloric acid (HCl) solution for 24 hours.
7.3.6 PIL nanostructure synthesis via UV initiated polymerization
After synthesizing PSSA nanostructures via ATRP, poly vinyl imidazole was grafted
from the surface of the glass substrate by UV-initiated radical polymerization. The main solution
was first prepared by mixing 1 mL of N-vinyl imidazole in 10 mL of water and degasing for
more than 30 minutes before reaction of polymerization. Glass substrate was fixed between 2

166
filter papers (Whatman, No 1) then immersed into the main solution in petri disc. UV radiation
was carried out in a UV reactor box for 15 minutes. After reaction, the substrate was washed
with water then dried in vacuum oven. The PIL was formed by reacting poly vinyl imidazole
with 12 N HCl solution for 24 hours.
7.3.7 Lignocellulosic Biomass Preprocessing
Real corn purchased from the supermarket was separated into 3 specific components
including cob, husk and kernel. It was then dried in oven at 60°C for 1-2 days. Dried corn cob,
husk, and kernel were then grinded with a coffee-grinder and separated with 100 sieve mesh (150
µm)
The pretreated NREL corn-stovers was received in a wet-state. They were dried and the
weights of the dried samples were measured to get an estimate of the biomass content. Table
7.3.1 shows the biomass contents of acid, base and steam pretreated NREL biomass samples.
Pictures of these NREL pretreated corn-stovers during preprocessing steps are shown in the
Appendix.
Table 7.3.1: Table of percentage of dried NREL biomass compared to wet biomass
Biomass (NREL)
Dried/Wet (without grinding)
Dried/Wet (with grinding)
Acid pretreatment 39.25% 39.7%
Base pretreatment 34.48% 34.8%
Steam pretreatment 32.63% 38.7%
At some cases, NREL biomass samples were first pretreated with a mixture of
[EMIM]Cl/H2O before hydrolysis. For example, 0.1 g of biomass was added into the reactor

167
with 10 mL of mixed IL/water solvent at different ratios. The mixture was then stirred at 60°C
for specified amount of time before hydrolysis.
7.3.8 Cellulose hydrolysis
0.1g of cellulose was dissolved with 10 mL [EMIM]Cl or a mixture of [EMIM]Cl and co-
solvent in a batch reactor. Glass/membrane substrate was then also submerged into the solution.
The batch reactor was tightly sealed and placed into a sand bath.Reaction was conducted at
specified temperature and for specified amount of time. After that, the reactor was cooled down
to room temperature and diluted with 10 times amount of water. The precipitated cellulose was
filtered, dried under vacuum oven. The total reducing sugar (TRS) was determined by DNS
reagent.
Calculation for TRS yield of cellulose hydrolysis in pure ILand IL/GVL mixture
After hydrolysis, 10 mL of hydrolysate solution will be diluted into 100 mL with DI
water. The solution will be filtered with PES membrane, 0.22 μm pore size, to remove unreacted
cellulose and undissolved solid in hydrolysate solution. Filter and remained solids were dried in
vacuum oven at 40°C for overnight. The weight of remained solids was measured. Total reducing
sugar (TRS) yield in hydrolysate was measured with 3,5-Dinitrosalicylic acid (DNS) solution.
DNS assay was conducted to quantitatively analyze TRS yield in hydrolysate. DNS
solution, which was prepared following the procedure of Miller, 0.63% dinitrosalicylic acid,
18.2% Rochelle salts, 0.5% phenol, 0.5% sodium bisulfite, and 2.14% sodium hydroxide. A
mixture with 0.5 mL of DNS reagent and 1 mL of a reaction sample was heated in a boiling
water bath for 5 min, cooled to room temperature. The color intensity of the resulting mixture
was measured using a UV-visible spectrometer at 540 nm. The concentration of TRS was
calculated based on a standard curve obtained with glucose in figure 7.3.8.

168
Mass balance was calculated based one below formula:
Mass balance= 𝑀𝑀𝑠𝑠 𝑇𝑅𝑇 + 𝑀𝑀𝑠𝑠 𝑠𝑠𝜇𝑖𝑑𝑠𝑀𝑀𝑠𝑠 𝐶𝐶𝜇𝜇𝐶𝜇𝑠𝑠𝐶
*100
Figure 7.3.8: Calibration curve for TRS yield of cellulose hydrolysis in pure [EMIM]Cl
Since the appearance of GVL will affect the activity of DNS solution. Mass balance was
used to estimate the amount of TRS in hydrolysate. In general, after the reaction, the products
were diluted 10 times then filtered with 0.2μm filter membrane. The solids remain were then
dried and weighed.
TRS for cellulose hydrolysis in mixture of GVL and IL:
After the hydrolysis reaction, , after the reaction, there are appearances of HMF/furfural,
where they are measured by using UV spectrometer at 280nm wavelength. The solids after
y = 5.541x - 0.1816 R² = 0.9996
0
0.2
0.4
0.6
0.8
1
0 0.05 0.1 0.15 0.2 0.25
Abso
rban
ce
Glucose concentration (mg/mL)
Calibration curve for TRS yield of cellulose hydrolysis in pure [EMIM]Cl

169
reaction are just unreacted cellulose. Therefore, the amount of TRS yield is estimated by this
formula
MassTRS = Masscellulose – Massunreacted solid- MassHMF/Furfural
3.3.9 Membrane regeneration
After repeated usage, membranes became degraded and were covered with dark brown
humins. These membranes were then regenerated by soaking in different types of solvents to
remove the humins. These solvents include 2 M NaOH, Gamma-Valerolactone (GVL), and
Dimethylacetamide (DMA). Thereafter, the membranes were again soaked in 12 N HCl to
regenerate the PSSA group.
7.4 Membrane surface characterization
The synthesized catalysts were characterized by x-ray photoelectron spectroscopy (XPS).
Figure 7.4showed the XPS of the unmodified glass substrate, and the substrate modified with a
SAM layer, PSSA and PIL modified substrate with 1 hr UV initiator immobilization, 8 hr ATRP
initiator immobilization followed by a total of 24 hr ATRP and 15 mins UV polymerization. The
XPS spectra were recorded before immersing the modified substrates in 12 N HCl to generate
the acid groups and generating PIL chains with Cl- anion. For the unmodified glass substrate, the
Si 2s and 2p peaks are clear and distinctive. However, after grafting SAM layer on the surface of
glass substrate, a strong peak of N 1s appears. Moreover, after modification with PSSA and PIL,
the N 1s peak becomes even stronger. The ratio between C 1s and O 1s peak heights increases
for the modified substrate compared to unmodified and SAM layer modified substrates
indicating successful modification of the polymer chains. Appearance of S 2s and 2p confirms
the success of ATRP modification.

170
Figure 7.4: XPS of unmodified glass substrate, SAM layer modified substrate and PIL and PSSA modified substrate synthesized with 1 hr UV initiator immobilization, 8 hr ATRP initiator immobilization, 24 hr ATRP, and 15 mins UV polymerization
7.5 Results and discussion
7.5.1 Glass substrate – Cellulose hydrolysis
7.5.1.1 [EMIM]Cl vs [BMIM]Cl
As shown in Figure 7.5.1, cellulose hydrolysis was conducted in ionic liquid [BMIM]Cl
at 130°C. The glass substrate was modified at the following condition: 1 hour UV
immobilization, 8 hours ATRP immobilization, 24 hours ATRP, and 15 minutes UV
polymerization. At this condition, the highest TRS yield obtained was 89.7% for 7 hr hydrolysis
reaction. With the catalyst modified at the same condition, a 96.4% TRS yield was obtained
when the reaction was conducted in [EMIM]Cl. However, on the other hand, if glass substrate
0100200300400500600
c/s
Binding Energy (eV)
XPS results for Glass substrate
O1s
N1s
C1s
S2s S2p
Si2s Si2p
SAM layer
Unmodified
PSSA +PIL

171
was only grafted with PSSA chains without PIL, a maximum TRS yield of about 69.4% was
obtained in [EMIM]Cl. It demonstrates that PIL chains are necessary to help dissolve the
cellulose and enhance the catalytic activity. Even though hydrolysis with [EMIM]Cl took longer
time to reach the maximum TRS yield, it achieved higher TRS yield than in the corresponding
[BMIM]Cl.
Figure 7.5.1: TRS yields for cellulose hydrolysis using PSSA and PIL modified glass substrate in [BMIM]Cl and [EMIM]Cl solvents. Table 7.5.1: Mass blance for cellulose hydrolysis using PSSA and PIL modified glass substrate in [BMIM]Cl (top) and [EMIM]Cl (bottom) solvents
Time (h) 6 7 7.5 8 8.5 9 Measured TRS
(%) 71.1 85.5 90.1 96.4 92.9 84.3
Solids (%) 24.5 8.9 7.1 1.1 0.8 2.2 Mass balance (%) 95.6 94.4 97.2 98.1 93.7 86.5
Time (h) 6 7 7.5 8 Measured TRS (%) 41.9 74.2 89.7 87.9
Solids (%) 47.0 17.0 5.9 9.2 Mass balance (%) 88.9 91.2 95.6 97.1
0
20
40
60
80
100
6 7 7.5 8 8.5 9
TR
S yi
eld
(%)
Reaction time (h)
Cellulose hydrolysis in pure IL at 130°C glass substrate
[EMIM]Cl
[BMIM]Cl

172
Table 7.5.1 shows the mass balances for hydrolysis experiments that were conducted in
[BMIM]Cl and [EMIM]Cl solvents with the immobilized catalysts. Mass balance was calculated
by adding the mass of the TRS and solids after reaction as no or very little HMF was detected.
In both ILs and up to 8.5 h of reaction time, mass balances of over 90% were achieved. At the
beginning, the amount of solid is high because cellulose was not hydrolyzed yet. When the TRS
yield reached to the maximum value, the amount of solid was also close to zero. For example,
after 8.5 hours of hydrolysis in [BMIM]Cl, TRS reached to 92.9% and solid amount is only
0.9%. However, after obtaining a maximum amount TRS yield, the amount of solids increased
when the reaction continued. At this time, humins from glucose degradation start to form and the
amount of solids start to increase. Mass balance reduces to less than 90% due to the formation of
degradation productions such as HMF and furfural.
7.5.1.2 Catalytic stability
Cellulose hydrolysis was conducted using the PSSA and PIL modified glass substrate at
the same condition with 8 hours of hydrolysis at 130°C in [EMIM]Cl for a total of 12 repeated
runs, figure 7.5.2. At the end of each run, the glass substrate was quickly rinsed with DI water
and stored in a petridish in a dry condition for the next run. The TRS yields for these repeated
runs were all above 90% except the last run. The glucose yields are around 20% with glucose
assay.

173
Figure 7.5.2: Catalyst stability was tested on modified glass substrate at 130°C in [EMIM]Cl Table 7.5.2 Mass balance for repeated runs at 130°C in [EMIM]Cl
Repeated time
1 2 3 4 5 6 7 8 9 10 11 12
Measured TRS (%)
92.2 96.4 95.6 96.4 97.9 95.2 94.1 93.7 93.2 93.9 90.6 90
Measured glucose (%)
16.7 22.3 18.9 25.8 21.2 22.24
Solids (%) 2.0 0.7 0.3 0.9 1.7 0.2 2.1 4.0 3.7 4.3 0.6 3.2 Mass
balance (%) 94.2 97.1 95.9 97.3 99.6 95.4 96.2 97.7 96.9 98.2 91.2 93.2
The catalytic activity of the immobilized catalysts were tested by performing hydrolysis
reaction repeatedly for a total of 12 times. The TRS, some of the glucose yields as well as the
mass balance achieved were shown in Table 7.5.2. After 8 hours of hydrolysis, not only the TRS
yields maintained at over 90%, but also the amount of solids remain at 0.6-4.3% during the 12
repeated runs. A mass balance of above 91 were achieved for all the runs. Our results indicate
that the catalyst is stable and could be reused. Moreover, it is possible to use mass balance as a
simple estimate for the TRS yield during hydrolysis reactions when DNS measurement is not
0
20
40
60
80
100
1st 2nd 3rd 4th 5th 6th 7th 8th 9th 10th 11th 12th
TR
S Y
ield
(%)
Repeat times
Repetition of Cellulose hydrolysis with same glass substrate in [EMIM]Cl at 130°C for 8h
Glass substrate %TRS
%Glucose

174
possible in IL/GVL solvent mixtures.
7.5.2 Silica membrane substrate - Cellulose hydrolysis
7.5.2.1 Cellulose hydrolysis in different solvent and solvent mixtures
As shown above, ionic liquids are effective for cellulose hydrolysis with high TRS yield
achieved. The catalysts are stable and can be used multiple times without losing its catalytic
effectiveness. Though green and environmentally friendly, ILs are generally expensive and the
process is not economically viable. In order to reduce the cost, other organic solvents are
explored to replace partially the amount of IL used. Moreover, earlier experimental results show
that GVL can reduce the production of humin and speed up the reaction process31. Figure 7.5.3
below is the TRS yields of cellulose hydrolysis in the mixture of IL with other cosolvents.
Figure 7.5.3: TRS yields of 1% cellulose hydrolysis in a mixture of 70:30 a) [EMIM]Cl/acetonitrile (ACN), b) [EMIM]Cl/dimethylacetamide (DMAc), and c) [EMIM]Cl/γ-valerolactone (GVL) with membrane substrate (T3 scientific) at 130°C.
0
20
40
60
80
100
2 4 6 7 8 10
Yie
ld (%
)
Reaction time (h)
Cellulose hydrolysis in 70:30 IL/ACN at 130°C silica membrane substrate
%TRS
%Glucose

175
Figure 7.5.3 (Cont.)
0
20
40
60
80
100
2 3 5 7 9 11
Yie
ld (%
)
Reaction time (h)
Cellulose hydrolysis in 70:30 IL/DMAc at 130°C silica membrane substrate
%TRS
%Glucose
0
20
40
60
80
100
2 3 4 5
Yie
ld (%
)
Reaction time (h)
Cellulose hydrolysis in 70:30 IL/GVL at 130°C silica membrane substrate
%TRS
%Glucose

176
Table 7.5.3: TRS yields of 1% cellulose hydrolysis in a mixture of 70:30 (A) [EMIM]Cl/ACN, (B) [EMIM]Cl/DMA, and (C) [EMIM]Cl/GVL with immobilized catalysts on membrane substrate (T3 scientific) at 130°C. (A)Mixture of 70:30 [EMIM]Cl/ACN
Time (h) 2 4 6 7 8 10 Measured TRS (%) 35.9 50.7 95.7 83.2 70.1 58.9
Measured glucose (%) 20.9 28.1 30.7 29.5 25.8 10.9 Measure HMF/Furfural (%) 0 0 0 3.9 10.2 15.6
Solids (%) 55.9 46.6 1.4 6.7 14.6 19.5 Mass balance (%) 91.8 97.3 97.1 93.8 94.9 94.0
(B)Mixture of 70:30 [EMIM]Cl/ Dimethylacetamide
Time (h) 2 3 5 7 9 11 Measured TRS (%) 55.5 77.6 63.1 45.8 40.0 37.7
Measured glucose (%) 15.1 21.3 20.2 16.7 15.4 Measured HMF/Furfural (%) 0 1.5 4.4 8.9 16.2 19.1
Solids (%) 42.7 19.3 25.3 35.1 35.3 36.7 Mass balance (%) 98.2 98.4 92.8 89.8 91.5 93.5
(C)Mixture of 70:30 [EMIM]Cl/ γ-Valerolactone
Time (h) 2 3 4 5 Calculated TRS (%) 35.2 68.5 96.7 81.4
Measured glucose (%) 3.4 15.7 29.1 27.9 Measured HMF/Furfural (%) 0 0 0 3.8
Solids (%) 64.8 31.5 3.3 14.8
After replacing 30% of IL by acetonitrile (ACN), dimethylacetamide (DMAc), and γ-
valerolactone (GVL), cellulose was hydrolyzed at 130°C with the same reaction condition. The
optimal TRS and glucose yields in 70:30 IL/ACN solvent mixture can reach 95.7% and 30.7%
respectively after 6 hr of hydrolysis reaction. However, in 70:30 IL/DMAc, the best yields
obtained were 77.6% and 21.3% of TRS and glucose respectively after 3 hr of reaction. In 70:30
IL:GVL solvent, the TRS and glucose yields of 96.7% and 29.1% respectively were achieved
after 4 hr of reaction. Once the maximum yields are reached, longer reaction time leads to the
degradation of the sugar and formation of humin as seen from Table 7.5.3.

177
In these cases, since the amount of HMF/furfural produced were included in the
calculated mass balance, over 90% mass balance was achieved for both IL mixed with ACN and
DMAc solvents similar to the mass balance in pure IL as shown in Table 7.5.1 above. The
consistent high mass balance obtained indicate that it is possible to determine the TRS yield in
IL/GVL solvent mixtures using mass balance as a simple estimate.
Figure 7.5.4: TRS yield from hydrolysis of 1% cellulose feedstock in a mixture of 50:50 [EMIM]Cl/GVL with catalysts immobilized on membrane substrate (T3 scientific) at 130°C.
Table 7.5.4: Mass balance for hydrolysis of 1% cellulose feedstock in a mixture of 50:50 [EMIM]Cl/GVL with catalysts immobilized on membrane substrate (T3 scientific) at 130°C.
Time (h) 1 2 2.5 3 Calculated TRS (%) 59.6 84.8 95.6 85.1
Measured glucose (%) 15.2 28.9 32.3 24.6 Measured HMF/Furfural (%) 0 0 0 2.1
Solids (%) 40.4 15.2 4.4 12.8
Along with acetonitrile and dimethylacetamide, γ-Valerolactone (GVL) can provide not
only a higher TRS yields but also a faster conversion rate. It is also a better choice for several
reasons. First of all, it is an organic compound generated during biomass processing. GVL is also
0
20
40
60
80
100
1 2 2.5 3
Yie
ld (%
)
Reaction time (h)
Cellulose hydrolysis at 130°C in 50:50 IL/GVL silica membrane substrate
%TRS
%Glucose

178
a green solvent and a potential fuel. GVL is relatively inexpensive to produce, and each year, this
biofuel was produced at a price between 2-3 US$/gallon. GVL has gained popularity as a legal
substitute for γ-hydroxybutyric acid, which is controlled in many parts of the world as a drug
product as γ-hydroxyvaleric acid.
Due to the many advantages of GVL, cellulose hydrolysis in different ratios of IL/GVL
ranging from 90:10 to 10:90 IL/GVL was conducted. The best condition is the solvent mixture
with 50:50 IL/GVL where 95.6% and 32.3% of TRS and glucose yields were obtained after only
2.5 h of reaction at 130°C. The results were listed in figure and table 7.5.4.
7.5.2.2 Hydrolysis of cellulose at 5% cellulose loading
In order to evaluate the catalytic activity of polymeric acid catalysts synthesized,
hydrolysis of cellulose at higher cellulose loading of 5% in IL and its mixtures with GVL was
conducted. Results of TRS yield of cellulose hydrolysis with 5% feedstock load were mentioned
in Figure 7.5.5 below.

179
Figure 7.5.5: Hydrolysis of 5% cellulose in a) [EMIM]Cl and its mixture with GVL at b) 50:50 and c) 20:80 ratios using catalysts immobilized on membrane substrate (T3 scientific) at 130°C.
0102030405060708090
1 2 3 4 5 6
Yie
ld (%
)
Reaction time (h)
5% Cellulose hydrolysis in pure IL at 130°C silica membrane substrate
%TRS
%Glucose
0102030405060708090
100
1 2 3 4 5 6
Yie
ld (%
)
Reaction time (h)
5% Cellulose hydrolysis in 50:50 IL/GVL at 130°C silica membrane substrate
%TRS
%Glucose

180
Figure 7.5.5 (Cont.)
Table 7.5.5: Mass balance of hydrolysis of 5% cellulose in (A) [EMIM]Cl and its mixture with GVL at (B) 50:50 and (C) 20:80 ratios using membrane substrate (T3 scientific) at 130°C. (A)Pure [EMIM]Cl
Time (h) 1 2 3 4 5 6 Measured TRS (%) 20.1 34.6 50.4 69.8 84.7 78.3
Measured glucose (%) 4.6 7.8 18.7 25.4 29.9 25.2 Measured
HMF/Furfural (%) 0 0 0 1.2 2.5 5.9
Solids (%) 78.1 62.3 48 26.1 10.6 14.5 Mass balance (%) 98.2 96.9 98.4 97.1 97.8 98.7
(B) 50:50 [EMIM]Cl/GVL
Time (h) 1 2 3 4 5 6 Calculated TRS (%) 35.6 50.7 68.9 85.6 92.7 78.3
Measured glucose (%) 8.1 17.2 23.3 27.5 32.2 24.9 Measured HMF/Furfural
(%) 0 0 0 0 0.9 4.5
Solids (%) 64.4 49.3 31.1 14.4 6.4 17.2 (B) 20:80 [EMIM]Cl/GVL
Time (h) 1 2 3 4 5 6 7 Calculated TRS (%) 19.8 35.9 59.1 72.9 80.3 94.5 85.1
Measured glucose (%) 3.3 8.3 19.2 23.5 25.1 30.2 27.7 Measured
HMF/Furfural (%) 0 0 0 0 0 0 3.2
Solids (%) 80.2 64.1 41.9 27.1 19.7 5.5 11.7
0102030405060708090
100
1 2 3 4 5 6 7
Yie
ld (%
)
Reaction time (h)
5% Cellulose hydrolysis in 20:80 IL/GVL at 130°C silica membrane substrate
%TRS
%Glucose

181
The hydrolysis of cellulose at 5% loading was conducted at the same reaction condition
as before. The highest TRS and glucose yields are only 84.7% and 29.9% respectively in pure
[EMIM]Cl after 5 h of reaction. Further increase in the reaction time leads to the formation of
HMF and humin. Both the TRS and glucose yields start to decrease after 5 h of reaction.
However, in the IL/GVL mixture, the formation of HMF and humin was suppressed. For
example, in the case of 50:50 IL/GVL, the highest TRS yield reached 92.7% with 32.2% glucose
after 5 h of reaction. In the 20:80 IL/GVL, the TRS yield reached 94.5% with 30.2% glucose
after 6 h of reaction. In both cases, the appearance of HMF was delayed leading to an enhanced
TRS yield. Indeed, this phenomenon shows that γ-valerolactone is a green and inexpensive
solvent which can be used to replace majority of the IL during biomass processing. Moreover,
GVL appears to speed up the hydrolysis reaction and reduce the degradation of glucose. For
example, based on Table 7.5.5, after reaching the maxima TRS yields, HMF yields were only
5.9% and 4.5% for reactions in the pure IL and 50:50 IL/GVL solvents. HMF yield was only
3.2% in 20:80 IL/GVL after 7 h of reaction which is 1 h after reaching the maxima TRS yield.
Moreover, the amount of solids including unreacted cellulose and humins also decreased. The
solid contents are 14.5%, 17.2% and 11.7% in pure IL, 50:50 IL/GVL, and 20:80 IL/GVL
mixtures respectively.
7.5.3 Silica membrane substrate - Real biomass (prepared in lab) hydrolysis
Taking advantage of the high TRS yield during cellulose hydrolysis, dual polymeric acid
catalysts immobilized on ceramic membrane substrate were used to evaluate its catalytic activity
with actual biomass feedstock using corn purchased from the supermarket. Corn cob, kernel and
husk were dried and grinded and were subsequently used for hydrolysis at different conditions.
Figure 7.5.6 and Table 7.5.6 below are results of hydrolysis and their mass balance of dried and

182
grinded corn components at different temperature in various solvents.
Figure 7.5.6: Hydrolysis of dried and grinded corn components at: a) 130°C in pure IL, b) 100°C in 50:50 IL:GVL, c) 125°C in 50:50 IL:GVL
0
10
20
30
40
50
60
70
1.5 3
TR
S yi
eld
(%)
Hydrolysis time (h)
TRS yield at 130°C in pure IL silica membrane substrate
Cob
Kernel
Husk
0
10
20
30
40
50
60
70
1 2 3
TR
S yi
eld
(%)
Reaction time (h)
TRS yield in 50:50 IL:GVL at 100°C silica membrane substrate
CobKernelHusk
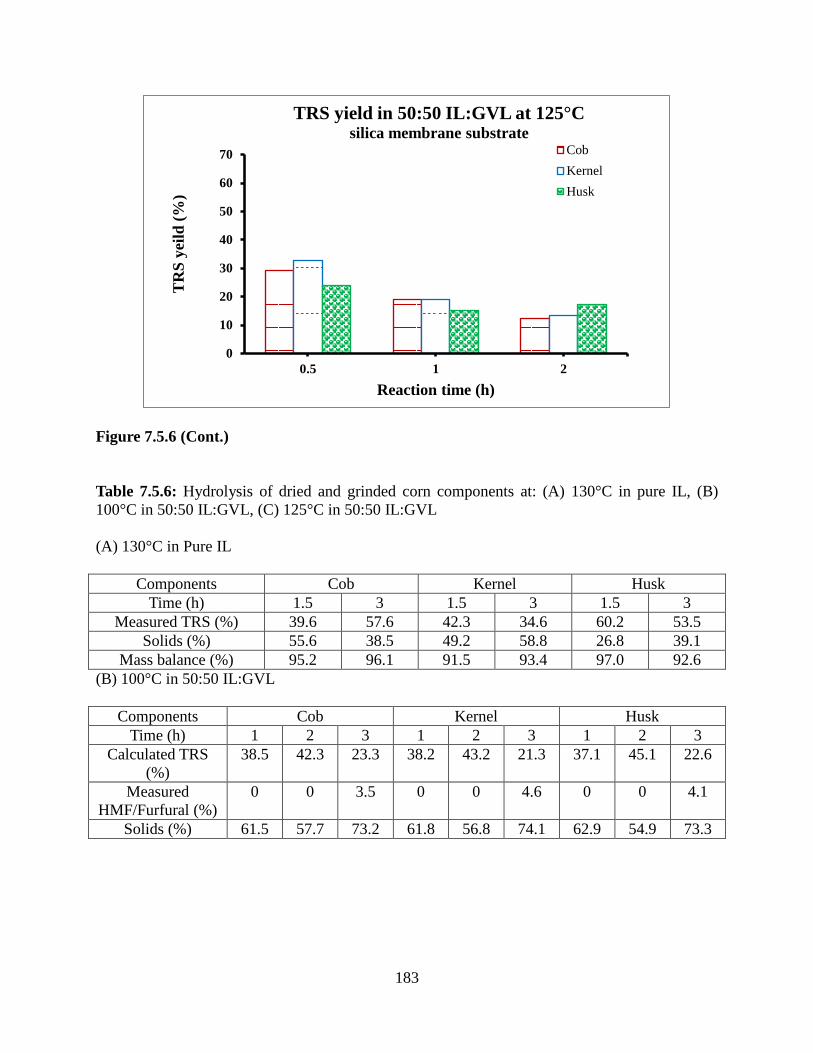
183
Figure 7.5.6 (Cont.)
Table 7.5.6: Hydrolysis of dried and grinded corn components at: (A) 130°C in pure IL, (B) 100°C in 50:50 IL:GVL, (C) 125°C in 50:50 IL:GVL (A) 130°C in Pure IL
Components Cob Kernel Husk Time (h) 1.5 3 1.5 3 1.5 3
Measured TRS (%) 39.6 57.6 42.3 34.6 60.2 53.5 Solids (%) 55.6 38.5 49.2 58.8 26.8 39.1
Mass balance (%) 95.2 96.1 91.5 93.4 97.0 92.6 (B) 100°C in 50:50 IL:GVL
Components Cob Kernel Husk Time (h) 1 2 3 1 2 3 1 2 3
Calculated TRS (%)
38.5 42.3 23.3 38.2 43.2 21.3 37.1 45.1 22.6
Measured HMF/Furfural (%)
0 0 3.5 0 0 4.6 0 0 4.1
Solids (%) 61.5 57.7 73.2 61.8 56.8 74.1 62.9 54.9 73.3
0
10
20
30
40
50
60
70
0.5 1 2
TR
S ye
ild (%
)
Reaction time (h)
TRS yield in 50:50 IL:GVL at 125°C silica membrane substrate
CobKernelHusk

184
Table 7.5.6 (Cont.)
(C) 125°C in 50:50 IL:GVL
Components Cob Kernel Husk Time (h) 0.5 1 2 0.5 1 2 0.5 1 2
Calculated TRS (%) 29.3 18.9 12.3 32.8 19.0 13.5 23.8 15.2 17.3 Measured
HMF/Furfural (%) 0 0.7 2.3 0 1.2 4.5 0 1.0 4.4
Solids (%) 70.7 80.4 85.4 67.2 79.8 82.0 76.2 84.8 78.3
In pure [EMIM]Cl, cob, kernel and husk were separately hydrolyzed at 130°C. At 1.5 h
of reaction for cob and 3 h of reaction for husk, the measured TRS yield reached around 57.6%
and 60.2% for cob and husk respectively. The TRS yield for kernel reduced from 42.3% at 1.5 h
of reaction to 34.6% at 3 h of reaction. It is likely that higher TRS yield could be obtained for
even shorter a reaction time. When hydrolysis was conducted at 125°C in 50:50 IL:GVL, TRS
yields obtained were lower than those obtained in pure IL and 130oC. GVL as a co-solvent could
mitigate the degradation reaction, it also reduces the solubility of corn biomass leading to a
reduced TRS yield. As was observed before, the presence of GVL increases the reaction rate as
the TRS yields started to decrease only after 30 minutes of hydrolysis reaction at 125oC as seen
from 7.5.6 (b). The subsequent experiments were performed in 50:50 IL:GVL at 100°C. At this
condition, the reduced temperature slows down the reaction, but the TRS yields for all three
biomass components reached over 40% after 2 h of reaction.
All of these cases, the amount of solids are dominated, table 7.5.6. One of the reason is
the corn-stovers prepared in lab did not passing through pretreatment to remove lignin. And
lignin is a complex organic polymer which causes a major problem of preventing biomass
hydrolysis. Another important reason that cause the amount of solids increased is appearance of
humins when increase temperature, or reaction rate. For example, in the case of 2 h of kenel

185
hydrolysis, TRS yield reached 43.2 compared to 19.0, while solid increase from 56.8 to 79.8
while temperature increased from 100°C to 125°C.
Kenel with different ratio of mixture IL:GVL
Figure 7.5.7: Hydrolysis of dried and grinded kernel corn at: a) 95°C in 50:50 IL:GVL, b) 95°C in 80:20 IL:GVL, c) 95°C in 100% IL
0
10
20
30
40
50
60
70
2 3
Yie
ld (%
)
Reaction time (h)
Kernel hydrolysis yield in 50:50 IL:GVL at 95°C silica membrane substrate
TRS
HMF
Furfural
0
10
20
30
40
50
60
70
2 3
Yie
ld (%
)
Reaction time (h)
Kernel hydrolysis yield in 80:20 IL:GVL at 95°C silica membrane substrate
TRS
HMF
Furfural

186
Figure 7.5.7 (Cont.)
Table 7.5.7: Hydrolysis of dried and grinded kernel corn at: A) 95°C in 50:50 IL:GVL, B) 95°C in 80:20 IL:GVL, C) 95°C in 100% IL (A)50:50 IL/GVL
Time (h) Calculated TRS (%) HMF (%) Furfural (%) Solid (%) 2 40.6 6.5 1.1 51.8 3 31.5 13.2 3.9 51.4
(B)80:20 IL/GVL
Time (h) Calculated TRS (%) HMF (%) Furfural (%) Solid (%) 2 39.5 3.5 0.8 56.2 3 46.9 6.4 1.7 45.0
(C)Pure IL/GVL
Time (h) Measured TRS (%)
HMF (%)
Furfural (%)
Solid (%)
Mass balance (%)
2 45.2 4.9 0.6 44.4 95.1 3 65.3 6.4 1.7 21.5 94.9
0
10
20
30
40
50
60
70
2 3
Yie
ld (%
)
Reaction time (h)
Kernel hydrolysis yield in pure IL at 95°C silica membrane substrate
TRS
HMF
Furfural

187
Of the three corn components, kernel gave the lowest TRS yields at the same
experimental conditions. As a result, additional conditions were explored for kernel hydrolysis
with reduced temperature and different solvent compositions. Temperature was further decreased
to 95°C for kernel hydrolysis in 50:50 IL:GVL mixed solvent. The TRS yield of over 40% was
obtained after 2 h of reaction similar to the reaction conducted at 100oC as shown in Figure 7.5.6.
Kernel hydrolysis was also conducted in 80:20 IL/GVL and in pure IL at 95oC. The increase in
IL ratio improves the TRS yield. The optimal TRS yields are 46% and 65.3% respectively in
80:20 IL/GVL and pure IL solvents. The reason is likely due to the increased solubility of corn
biomass in IL leading to a higher TRS yield. Indeed for raw corn-stovers, the maximum amount
of carbohydrate is 60.8% 32 which similar to average of maximum of three components of raw
corn-stovers that prepare in lab.
7.5.4 Silica membrane substrate - Real biomass (NREL) hydrolysis
7.5.4.1 Temperature at 95°C
Mixture of IL:GVL

188
Figure 7.5.8: Hydrolysis of pretreated NREL biomass at: a) 95°C in 100% IL, b) 95°C in 80:20 IL:GVL, c) 95°C in 50:50 IL:GVL
0
10
20
30
40
50
60
70
80
2 3
Yie
ld (%
)
Reaction time (h)
TRS yield in pure IL at 95°C silica membrane substrate acid pretreated
base pretreated
steam pretreated
0
10
20
30
40
50
60
70
80
2 3
Yie
ld (%
)
Reaction time (h)
TRS yield in 80:20 IL:GVL at 95°C silica membrane substrate
acid pretreated
base pretreated
steam pretreated

189
Figure 7.5.8 (Cont.) Table 7.5.8: Hydrolysis of pretreated NREL biomass at 95oC in: a) 100% IL, b) 50:50 IL:GVL, c) 80:20 IL:GVL (a)100% IL
Components Acid pretreated Base pretreated Steam pretreated Time (h) 2 3 2 3 2 3
Measured TRS (%) 55.3 77.8 42.8 55.9 56.6 76 Measured HMF/Furfural (%) 0 0.8 0 1.5 0 1.2
Solids (%) 38.5 18.3 54.7 35.9 41.7 18.7 Mass balance (%) 93.8 95.3 97.5 90.3 98.3 93.5
(b)80:20 IL/GVL
Components Acid pretreated Base pretreated Steam pretreated Time (h) 2 3 2 3 2 3
Calculated TRS (%) 52.1 72.6 48.9 52.8 38.2 67.9 Measured HMF/Furfural (%) 0 0.7 0 1.3 0 1.7
Solids (%) 47.9 26.7 51.1 45.9 61.8 30.4
0
10
20
30
40
50
60
70
80
2 3
Yie
ld (%
)
Reaction time (h)
TRS yield in 50:50 IL:GVL at 95°C silica membrane substrate
acid pretreated
base pretreated
steam pretreated
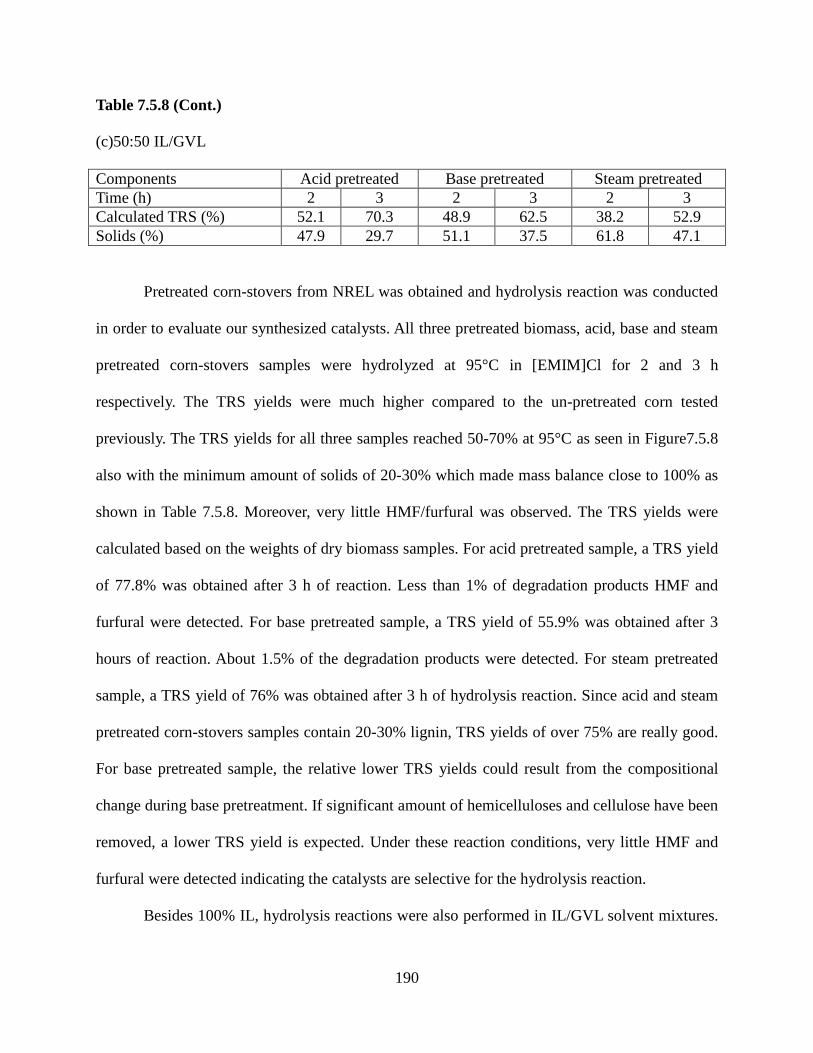
190
Table 7.5.8 (Cont.)
(c)50:50 IL/GVL
Components Acid pretreated Base pretreated Steam pretreated Time (h) 2 3 2 3 2 3 Calculated TRS (%) 52.1 70.3 48.9 62.5 38.2 52.9 Solids (%) 47.9 29.7 51.1 37.5 61.8 47.1
Pretreated corn-stovers from NREL was obtained and hydrolysis reaction was conducted
in order to evaluate our synthesized catalysts. All three pretreated biomass, acid, base and steam
pretreated corn-stovers samples were hydrolyzed at 95°C in [EMIM]Cl for 2 and 3 h
respectively. The TRS yields were much higher compared to the un-pretreated corn tested
previously. The TRS yields for all three samples reached 50-70% at 95°C as seen in Figure7.5.8
also with the minimum amount of solids of 20-30% which made mass balance close to 100% as
shown in Table 7.5.8. Moreover, very little HMF/furfural was observed. The TRS yields were
calculated based on the weights of dry biomass samples. For acid pretreated sample, a TRS yield
of 77.8% was obtained after 3 h of reaction. Less than 1% of degradation products HMF and
furfural were detected. For base pretreated sample, a TRS yield of 55.9% was obtained after 3
hours of reaction. About 1.5% of the degradation products were detected. For steam pretreated
sample, a TRS yield of 76% was obtained after 3 h of hydrolysis reaction. Since acid and steam
pretreated corn-stovers samples contain 20-30% lignin, TRS yields of over 75% are really good.
For base pretreated sample, the relative lower TRS yields could result from the compositional
change during base pretreatment. If significant amount of hemicelluloses and cellulose have been
removed, a lower TRS yield is expected. Under these reaction conditions, very little HMF and
furfural were detected indicating the catalysts are selective for the hydrolysis reaction.
Besides 100% IL, hydrolysis reactions were also performed in IL/GVL solvent mixtures.

191
The TRS yields are in the range of 50-70% when the IL:GVL ratio varies from 80:20 to 50:50.
Different cosolvent
Figure 7.5.9: Hydrolysis of pretreated NREL biomass at 95°C in: a) 80:20 IL:GVL b) 80:20
IL:water, c) 70:30 IL:water
0
10
20
30
40
50
60
70
80
2 3 4 5 6 7 8 9 10
Yie
ld (%
)
Reaction time (h)
TRS yield for dissolved NREL biomass in 80:20 IL:GVL at 95°C
Atech silica disc membrane acid pretreated steam pretreated base pretreated

192
Figure 7.5.9 (Cont.)
0
10
20
30
40
50
60
70
80
7 8 9 10 15 17 19
Yie
ld (%
)
Reaction time (h)
TRS yield for dissolved NREL biomass in 70:30 IL:Water at 95°C
Atech silica disc membrane acid pretreated steam pretreated base pretreated
0
10
20
30
40
50
60
70
80
2 3 4 5 6 7 7.5 8
Yie
ld (%
)
Reaction time (h)
TRS yield for dissolved NREL biomass in 80:20 IL:Water at 95°C
Atech silica disc membrane acid pretreated steam pretreated base pretreated

193
Table 7.5.9: Hydrolysis of pretreated NREL biomass at 95°C in: a) 80:20 IL:GVL b) 80:20 IL:water, c) 70:30 IL:water (a) 80:20 IL:GVL
Components Time (h) 2 3 4 5 6 7 8 9 10 Acid pretreated Calculated TRS
(%) 26.7 42.1 63.5 55.1 43.2 31.6 18.3 11.3 6.9
Measured HMF (%)
0 0 2.1 6.2 15.5 20.7 28.2 25.9 20.1
Measured Furfural (%)
0 0 0.6 3.9 10.1 13.5 21.1 18.1 16.3
Solids (%) 73.3 57.9 33.8 34.8 31.2 34.2 32.4 44.7 56.7 Base pretreated
Calculated TRS
(%) 19.8 28.7 50.2 70.6 55.3 43.9 33.4 21.7 14.5
Measured HMF (%)
0 0 0 1.1 8.7 15.9 20.9 29.3 23.7
Measured Furfural (%)
0 0 0 0.6 3.9 11.0 18.8 24.3 19.8
Solids (%) 80.2 71.3 49.8 27.7 32.1 29.2 26.9 24.7 42.0 Steam pretreated Calculated TRS
(%) 23.7 35.1 55.9 47.2 34.1 28.9 21.3 14.4 11.3
Measured HMF (%)
0 0 0.8 6.8 11.3 18.7 22.2 27.6 25.1
Measured Furfural (%)
0 0 0.3 3.2 5.9 8.5 12.3 16.5 14.2
Solids (%) 76.3 64.9 43.0 42.8 48.7 43.9 44.2 41.5 49.4
(b)80:20 IL/Water
Components Time (h) 2 3 4 5 6 7 7.5 8 Acid
pretreated Measured TRS (%) 28.9 36.8 43.9 55.6 59.3 65.2 62.5 61.2 Measured HMF (%) 0 0 0 0.5 0.9 2.1 2.1 3.2
Measured Furfural (%) 0 0 0 0.2 0.5 1.1 1.2 1.8 Solids (%) 65.9 60.1 57.2 40.1 36.9 35.2 31.1 29.2
Base pretreated
Measured TRS (%) 33.5 40.4 49.2 57.8 65.9 72.6 70.2 69.1 Measured HMF (%) 0 0 0 0 0.8 1.5 1.7 2.6
Measured Furfural (%) 0 0 0 0 0.2 0.6 0.8 1.2 Solids (%) 62.5 55.7 49.2 38.2 30.2 21.4 24.9 22.8
Steam pretreated
Measured TRS (%) 29.2 35.1 40.5 49.2 52.3 56.1 53.9 52.3 Measured HMF (%) 0 0 0 0 0 0.7 0.9 1.7
Measured Furfural (%) 0 0 0 0 0 0.3 0.6 0.9 Solids (%) 65.9 62.3 55.7 47.9 42.9 38.8 39.6 41.5

194
Table 7.5.9 (Cont.)
(C)70:30 IL/Water
Components Time (h) 7 8 9 10 15 17 19 Acid pretreated
Measured TRS (%) 21.1 27.9 31.2 35.7 58.2 60.1 57.2 Measured HMF (%) 0 0 0 0 0.8 1.2 2.3 Measured Furfural (%) 0 0 0 0 0.2 0.6 1.2 Solids (%) 72.9 73.6 63.5 60.1 35.8 34.5 33.9
Base pretreated
Measured TRS (%) 19.9 26.1 32.5 37.5 62.6 69.1 65.8 Measured HMF (%) 0 0 0 0 0.3 1.8 2.9 Measured Furfural (%) 0 0 0 0 0 0.4 0.9 Solids (%) 76.9 69.2 65.2 60.0 34.4 25.7 28.8
Steam pretreated
Measured TRS (%) 20.6 24.4 28.3 33.1 46.2 54.4 50.9 Measured HMF (%) 0 0 0 0 0 0.8 1.9 Measured Furfural (%) 0 0 0 0 0 0.2 1.1 Solids (%) 68.9 72.5 68.2 63.5 50.0 42.1 43.2
When hydrolysis reaction was taken place in the mixture of IL:GVL, the TRS yield
decreases slightly where the time takes to reach the maximum TRS yield becomes slightly
longer. In Figure 7.5.8, the TRS yield for acid treated biomass in pure IL was 77.8% after 3 h of
reaction. While the TRS yield decrease to 63.5% when 20% of IL was replaced by GVL after 4 h
of reaction. Even though GVL can help reduce the humins and the production of HMF/Furfural,
replacing IL with GVL also decreases the solubility of biomass in the solvent. This leads to a
somewhat lower TRS yield than in 100% IL and longer reaction time. When water was used as a
co-solvent, the reaction time becomes much longer. A reasonable TRS yield (50-70%) can still be
obtained even when 30% of IL was replaced by water even though the reaction time increases to
17 h to reach the maximum yield. For example, in Figure and Table 7.5.9, the maximum TRS
yields of base pretreatment biomass were 70.6%, 72.6%, 69.1% in 80:20 IL:GVL, 80:20 IL:H2O,
70:30 IL:H2O after 5, 7 and 17 h of reaction respectively.
Indeed, replace part of IL with co-solvents may reduce the hydrolysis reaction rate.
However, since the reaction rate is also controlled by temperature, NREL biomass in different

195
mixture of co-solvents at 100°C and 105°C have been investigated
7.5.4.2 Temperature at 100°C
Cosolvent comparison: GVL vs. Water and increase in concentration of cosovlent
Figure 7.5.10: Hydrolysis of pretreated NREL biomass at 100°C in: a) 80:20 IL:GVL and b) IL:water, c) 70:30 IL:GVL d) 70:30 IL:water, e) 60:40 IL:GVL f) 50:50 IL:GVL
0
10
20
30
40
50
60
70
80
2 3 4 5 6
Yie
ld (%
)
Reaction time (h)
TRS yield for dissolved NREL biomass in 80:20 IL:GVL at 100°C
Atech silica disc membrane acid treated steam treated base treated

196
Figure 7.5.10 (Cont.)
0
10
20
30
40
50
60
70
2 3 4 5 6 7
Yie
ld (%
)
Reaction time (h)
TRS yield for dissolved NREL biomass in 80:20 IL:Water at 100°C
Atech silica disc membrane acid pretreated steam pretreated base pretreated
0
10
20
30
40
50
60
70
2 3 4 5 6 7
Yie
ld (%
)
Reaction time (h)
TRS yield for dissolved NREL biomass in 70:30 IL:GVL at 100°C
Atech silica disc membrane acid pretreated steam pretreated base pretreated

197
Figure 7.5.10 (Cont.)
0
10
20
30
40
50
60
70
6 8 10 12 13 14 15 16
Yie
ld (%
)
Reaction time (h)
TRS yield for dissolved NREL biomass in 70:30 IL:Water at 100°C
Atech silica disc membrane acid pretreated Steam pretreated base pretreated
0
10
20
30
40
50
60
70
2 3 4 5 6 7
Yie
ld (%
)
Reaction time (h)
TRS yield for dissolved NREL biomass in 60:40 IL:GVL at 100°C Atech silica disc membrane
acid pretreated steam pretreated base pretreated

198
Figure 7.5.10 (Cont.)
0
10
20
30
40
50
60
70
80
7 8 9 10 15 17 19
Yie
ld (%
)
Reaction time (h)
TRS yield for dissolved NREL biomass in 70:30 IL:Water at 95°C
Atech silica disc membrane acid pretreated steam pretreated base pretreated
0
10
20
30
40
50
60
70
2 3 4 5 6 7 8
Yie
ld (%
)
Reaction time (h)
TRS yield for dissolved NREL biomass in 50:50 IL:GVL at 100°C
acid pretreated steam pretreated base pretreated

199
Table 7.5.10: Hydrolysis of pretreated NREL biomass at 100°C in: a) 80:20 IL:GVL and b) IL:H2O, c) 70:30 IL:GVL d) 70:30 IL:H2O, e) 60:40 IL:GVL f) 50:50 IL:GVL (a) 80:20 IL:GVL
Components Time (h) 2 3 4 5 6 Acid pretreated Calculated TRS (%) 30.7 55.6 74.9 62.1 55.4
Measured HMF (%) 0 0 1.2 7.6 13.2 Measured Furfural (%) 0 0 0.9 3.9 6.5 Solids (%) 69.3 44.4 23.0 26.4 24.9
Base pretreated
Calculated TRS (%) 20.9 45.7 62.5 71.1 62.3 Measured HMF (%) 0 0 0.7 1.1 4.2 Measured Furfural (%) 0 0 0.3 0.6 1.6 Solids (%) 79.1 54.3 36.5 27.2 31.9
Steam pretreated Calculated TRS (%) 15.7 30.5 43.1 56.7 44.2 Measured HMF (%) 0 0 0 0.9 2.1 Measured Furfural (%) 0 0 0 0.3 1.0 Solids (%) 84.3 69.5 56.9 42.1 52.7
(b)80:20 IL:H2O
Components Time (h) 2 3 4 5 6 7 Acid pretreated
Measured TRS (%) 20.1 32.4 40.1 51.5 63.2 56.7 Measured HMF (%) 0 0 0 0 1.3 4.7 Measured Furfural (%) 0 0 0 0 0.6 2.1 Solids (%) 76.8 65.2 59.9 44.5 30.2 34.5
Base pretreated
Measured TRS (%) 15.6 28.2 39.0 50.1 64.9 57.2 Measured HMF (%) 0 0 0 0 2.1 6.7 Measured Furfural (%) 0 0 0 0 0.9 3.2 Solids (%) 80.9 70.0 60.2 47.3 30.1 29.9
Steam pretreated
Measured TRS (%) 11.2 21.7 29.4 39.5 53.1 46.7 Measured HMF (%) 0 0 0 0 0.7 2.6 Measured Furfural (%) 0 0 0 0 0.3 1.0 Solids (%) 85.5 76.1 68.2 59.9 43.1 47.4

200
Table 7.5.10 (Cont.)
(c) 70:30 IL:GVL
Components Time (h) 2 3 4 5 6 7 Acid treated Calculated TRS (%) 26.1 33.9 41.5 52.7 65.0 59.6
Measured HMF (%) 0 0 0 0 0.9 3.6 Measured Furfural (%) 0 0 0 0 0.2 1.5 Solids (%) 73.9 66.1 58.5 47.3 33.9 35.3
Base treated
Calculated TRS (%) 22.2 29.7 36.8 49.5 62.4 58.1 Measured HMF (%) 0 0 0 0 1.8 3.0 Measured Furfural (%) 0 0 0 0 0.5 1.8 Solids (%) 77.8 70.3 63.2 50.5 35.3 37.1
Steam treated Calculated TRS (%) 15.1 23.6 31.2 39.5 50.7 47.2 Measured HMF (%) 0 0 0 0 0.8 2.1 Measured Furfural (%) 0 0 0 0 0.4 0.9 Solids (%) 84.9 76.4 68.8 60.5 48.1 49.8
(D) 70:30 IL:H2O
Components Time (h) 6 8 10 12 13 14 15 16 Acid treated Measured TRS (%) 28.2 33.3 40.9 48.2 55.1 63.6 60.0 56.4
Measured HMF (%) 0 0 0 0 0 0.2 1.2 3.5 Measured Furfural (%) 0 0 0 0 0 0.6 2.4 4.8 Solids (%) 68.8 62.3 57.1 45.0 40.2 31.5 32.3 31.1
Base treated
Measured TRS (%) 27.1 34.2 41.4 46.1 53.7 60.2 58.3 55.6 Measured HMF (%) 0 0 0 0 0 0.6 2.1 3.6 Measured Furfural (%) 0 0 0 0 0 0.5 1.8 3.1 Solids (%) 70.1 62.3 55.1 50.2 44.1 32.8 31.0 32.5
Steam treated
Measured TRS (%) 11.5 17.1 24.6 31.2 37.9 45.5 41.7 38.1 Measured HMF (%) 0 0 0 0 0 0.3 1.6 2.9 Measured Furfural (%) 0 0 0 0 0 0.6 1.5 2.3 Solids (%) 81.5 79.2 71.5 65.8 58.9 49.0 50.1 51.3
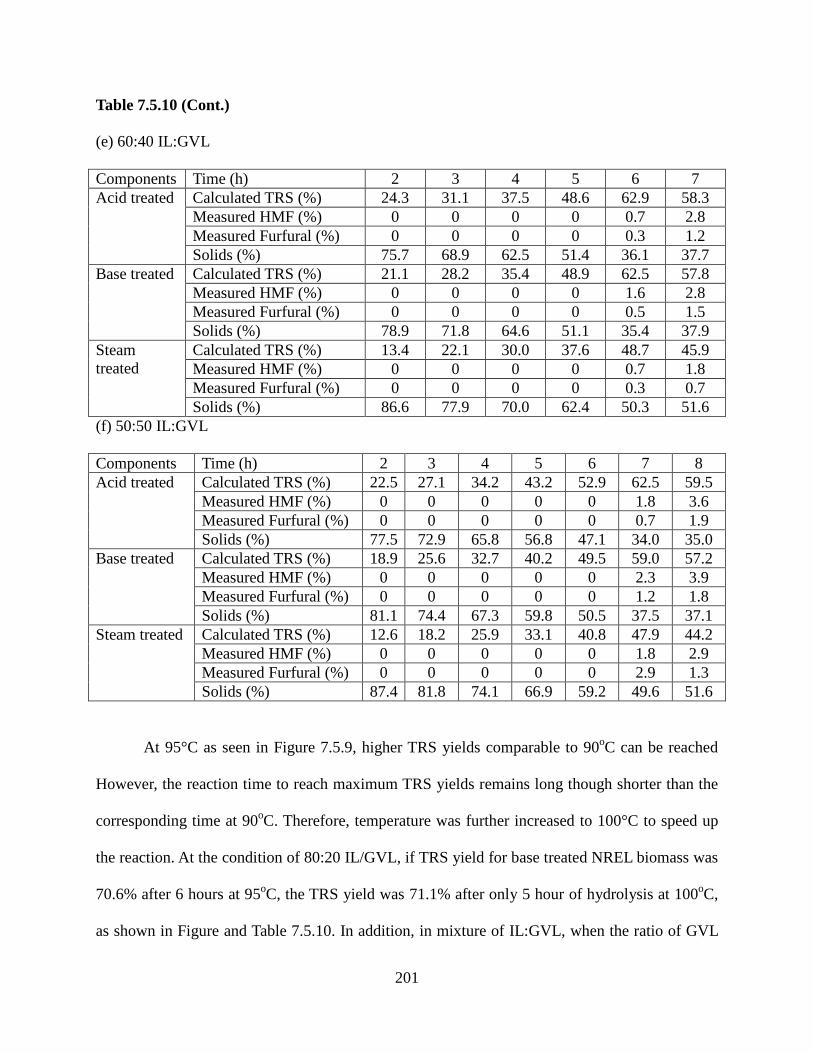
201
Table 7.5.10 (Cont.)
(e) 60:40 IL:GVL
Components Time (h) 2 3 4 5 6 7 Acid treated Calculated TRS (%) 24.3 31.1 37.5 48.6 62.9 58.3
Measured HMF (%) 0 0 0 0 0.7 2.8 Measured Furfural (%) 0 0 0 0 0.3 1.2 Solids (%) 75.7 68.9 62.5 51.4 36.1 37.7
Base treated
Calculated TRS (%) 21.1 28.2 35.4 48.9 62.5 57.8 Measured HMF (%) 0 0 0 0 1.6 2.8 Measured Furfural (%) 0 0 0 0 0.5 1.5 Solids (%) 78.9 71.8 64.6 51.1 35.4 37.9
Steam treated
Calculated TRS (%) 13.4 22.1 30.0 37.6 48.7 45.9 Measured HMF (%) 0 0 0 0 0.7 1.8 Measured Furfural (%) 0 0 0 0 0.3 0.7 Solids (%) 86.6 77.9 70.0 62.4 50.3 51.6
(f) 50:50 IL:GVL
Components Time (h) 2 3 4 5 6 7 8 Acid treated Calculated TRS (%) 22.5 27.1 34.2 43.2 52.9 62.5 59.5
Measured HMF (%) 0 0 0 0 0 1.8 3.6 Measured Furfural (%) 0 0 0 0 0 0.7 1.9 Solids (%) 77.5 72.9 65.8 56.8 47.1 34.0 35.0
Base treated
Calculated TRS (%) 18.9 25.6 32.7 40.2 49.5 59.0 57.2 Measured HMF (%) 0 0 0 0 0 2.3 3.9 Measured Furfural (%) 0 0 0 0 0 1.2 1.8 Solids (%) 81.1 74.4 67.3 59.8 50.5 37.5 37.1
Steam treated Calculated TRS (%) 12.6 18.2 25.9 33.1 40.8 47.9 44.2 Measured HMF (%) 0 0 0 0 0 1.8 2.9 Measured Furfural (%) 0 0 0 0 0 2.9 1.3 Solids (%) 87.4 81.8 74.1 66.9 59.2 49.6 51.6
At 95°C as seen in Figure 7.5.9, higher TRS yields comparable to 90oC can be reached
However, the reaction time to reach maximum TRS yields remains long though shorter than the
corresponding time at 90oC. Therefore, temperature was further increased to 100°C to speed up
the reaction. At the condition of 80:20 IL/GVL, if TRS yield for base treated NREL biomass was
70.6% after 6 hours at 95oC, the TRS yield was 71.1% after only 5 hour of hydrolysis at 100oC,
as shown in Figure and Table 7.5.10. In addition, in mixture of IL:GVL, when the ratio of GVL

202
to IL increases, for example, 80:20, 70:30, 60:40, and 50:50, the TRS yields becomes lower with
longer reaction time to reach maximum yield. For example, in the case of acid treated biomass,
the TRS yield is 74.9% in 80:20 IL:GVL after 4 h of reaction, 65.0% in 70:30 IL:GVL after 6 h
of hydrolysis, 62.9% in 60:40 IL:GVL after 6 h of reaction, and 62.5% in 50:50 IL:GVL after 7 h
of hydrolysis. Increasing the amount of GVL slows down the reaction and reduces the TRS yield.
Moreover, even though GVL is a green and bio-compatible solvent, it is not the most
favorable compare to water. Since the reaction time is long, the temperature was raised to 100°C
in order to obtain good TRS yield with shorter time. Similar to the case of 80:20 IL/Water. if
TRS yield for base treated NREL biomass was 72.6% after 7 hours, the TRS yield was 64.9%
after only 6 hour of hydrolysis And with those conditions, mixture of 70:30 IL:Water, the
maximum TRS yield for those NREL pretreated biomass could be reached at 14 h compared to
17 h when temperature was 95°C. Again, the base and acid pretreated biomass can give higher
TRS yield compare to steam pretreated sample since the lignin contained was lower in acid and
base pretreated samples. Moreover, as mentioned above, hydrolysis yield and reaction time in
mixture of IL:GVL is higher and shorter than in IL:H2O.
7.5.4.3 Temperature at 105°C
Cosolvent comparison: GVL vs. Water and increase in concentration of water
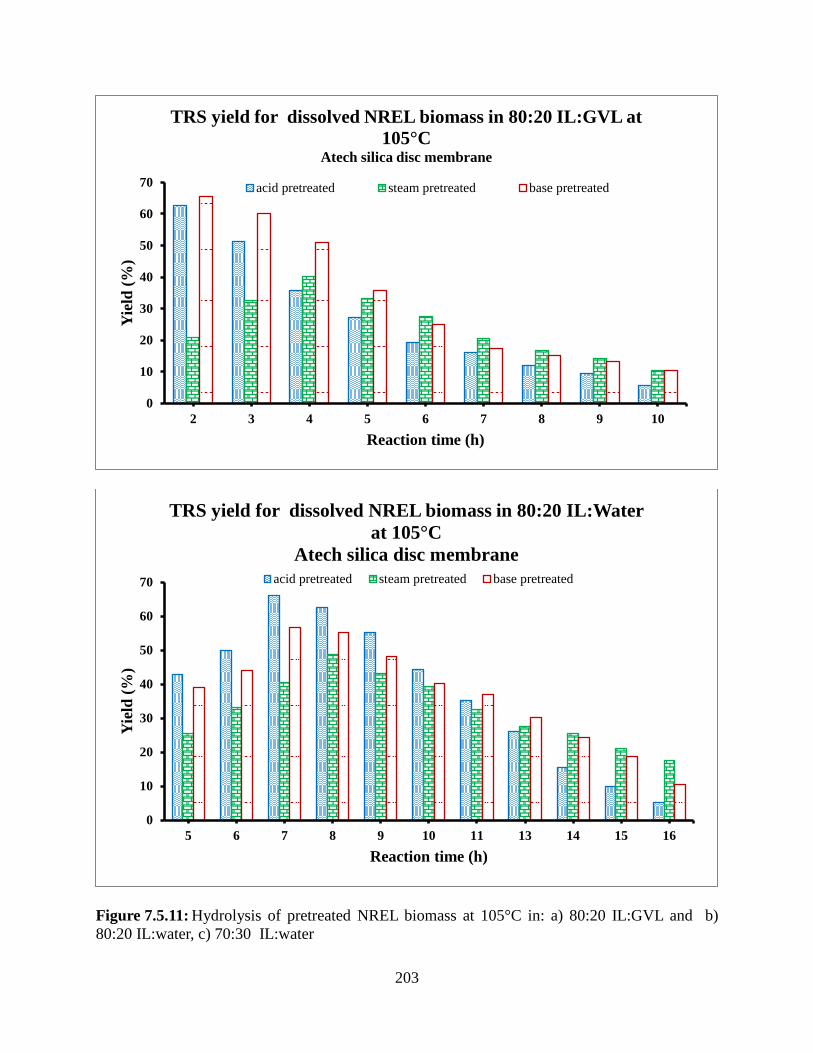
203
Figure 7.5.11: Hydrolysis of pretreated NREL biomass at 105°C in: a) 80:20 IL:GVL and b) 80:20 IL:water, c) 70:30 IL:water
0
10
20
30
40
50
60
70
2 3 4 5 6 7 8 9 10
Yie
ld (%
)
Reaction time (h)
TRS yield for dissolved NREL biomass in 80:20 IL:GVL at 105°C
Atech silica disc membrane
acid pretreated steam pretreated base pretreated
0
10
20
30
40
50
60
70
5 6 7 8 9 10 11 13 14 15 16
Yie
ld (%
)
Reaction time (h)
TRS yield for dissolved NREL biomass in 80:20 IL:Water at 105°C
Atech silica disc membrane acid pretreated steam pretreated base pretreated

204
Figure 7.5.11 (Cont.)
Table 7.5.11: Hydrolysis of pretreated NREL biomass at 105°C in: a) 80:20 IL:GVL and b) 80:20 IL:water, c) 70:30 IL:water (a) 80:20 IL:GVL
Components Time (h) 2 3 4 5 6 7 8 9 10 Acid treated Calculated TRS (%) 62.6 51.2 35.9 27.2 19.3 16.3 12.1 9.6 5.8
Measured HMF (%) 1.2 7.9 17.2 22.9 25.1 26.7 20.1 17.3 14.8 Measured Furfural (%)
0.7 6.0 12.1 17.3 20.5 19.2 15.6 13.3 10.2
Solids (%) 35.5 34.9 34.8 32.6 33.5 39.4 52.2 59.8 69.2 Base treated
Calculated TRS (%) 65.7 60.3 51.1 35.7 24.9 17.3 15.1 13.2 10.4 Measured HMF (%) 0.8 5.9 11.9 19.2 23.9 27.8 29.3 24.9 20.1 Measured Furfural (%)
0.4 4.1 7.3 15.2 19.7 24.3 24.3 21.1 17.2
Solids (%) 33.1 29.7 29.7 29.9 31.5 30.6 31.3 40.8 52.3 Steam treated
Calculated TRS (%) 20.9 32.7 40.1 33.2 27.5 20.7 16.8 14.1 10.5 Measured HMF (%) 0 0 2.1 5.4 8.1 10.5 13.5 15.9 14.2 Measured Furfural (%)
0 0 0.9 3.2 4.9 7.7 9.3 11.8 8.9
Solids (%) 79.1 67.3 56.9 58.2 59.5 61.1 60.4 58.2 66.4
0
10
20
30
40
50
60
70
80
7 8 9 10 11 13 14 15 16 17
Yie
ld (%
)
Reaction time (h)
TRS yield for dissolved NREL biomass in 70:30 IL:Water at 105°C,
Atech silica disc membrane
acid pretreated steam pretreated base pretreated

205
Table 7.5.11 (Cont.)
(b) 80:20 IL:H2O
Components Time (h) 5 6 7 8 9 10 11 13 14 15 16 Acid treated Measured TRS
(%) 42.8 50.1 66.2 62.6 55.3 44.5 35.1 26.1 15.6 9.9 5.2
Measured HMF (%)
0 0 0.3 2.1 4.3 7.9 15.1 21.2 23.6 26.7 28.1
Measured Furfural (%)
0 0 2.4 7.2 8.9 11.7 16.5 20.3 25.6 19.1 32.5
Solids (%) 53.8 47.2 29.1 26.2 29.5 31.4 30.3 29.2 31.9 32.1 33.3 Base treated
Measured TRS (%)
39.2 44.1 56.7 55.2 48.2 40.1 37.1 30.2 24.4 18.7 10.5
Measured HMF (%)
0 0 0 1.6 2.5 4.3 8.1 12.5 16.7 19.2 22.8
Measured Furfural (%)
0 0 1.2 5.9 8.9 12.0 14.6 18.1 22.2 25.7 28.5
Solids (%) 57.1 51.2 39.3 34.7 37.4 40.4 36.5 35.9 32.1 31.0 34.6 Steam treated
Measured TRS (%)
25.5 33.1 40.6 48.7 43.2 39.4 32.5 27.5 25.4 21.1 17.5
Measured HMF (%)
0 0 0 0.4 1.2 2.3 5.2 7.0 8.9 10.5 13.1
Measured Furfural (%)
0 0 0 2.2 3.8 5.1 7.9 10.8 12.7 15.6 18.9
Solids (%) 70.5 61.0 52.4 40.1 45.9 49.2 50.8 51.7 49.1 48.5 45.6

206
Table 7.5.11 (Cont.)
(c) 70:30 ILH2O
Components Time (h) 7 8 9 10 11 13 14 15 16 17 Acid treated Measured
TRS (%) 42.1 53.4 65.2 51.2 45.5 18.2 18.5 17.1 15.6 9.3
Measured HMF (%)
0 0 2.3 7.9 12.2 18.8 19.2 20.2 10.9 22.2
Measured Furfural (%)
0 0 1.4 4.1 6.7 31.1 29.5 34.5 36.6 39.3
Solids (%) 55.9 44.2 29.1 31.5 30.6 27.3 28.9 25.4 22.3 25.6 Base treated
Measured TRS (%)
43.4 55.2 66.9 53.3 46.1 22.6 19.5 18.5 14.2 9.7
Measured HMF (%)
0 0 3.1 8.2 13.9 19.9 22.2 24.1 26.1 27.2
Measured Furfural (%)
0 0 1.1 5.3 7.8 27.3 29.5 29.9 33.8 35.7
Solids (%) 53.3 41.4 27.6 30.2 29.3 27.1 24.5 22.9 21.0 23.7 Steam treated
Measured TRS (%)
32.1 37.6 46.2 41.9 34.1 25.1 22.6 19.9 14.9 11.2
Measured HMF (%)
0 0 1.7 4.4 9.2 11.2 10.9 15.1 15.2 17.9
Measured Furfural (%)
0 0 0.6 2.3 4.9 12.7 13.1 16.9 17.7 19.5
Solids (%) 65.9 59.1 47.2 46.3 42.1 45.6 48.9 45.5 47.1 48.2
In Figure and Table 7.5.11, temperature was then again increased to 105°C in order to
shorten the reaction time. In the case of 80:20 IL:GVL, the hydrolysis time was only 2 h to reach
the maximum TRS yield for base pretreated NREL biomass. For example, TRS reached 71.1%
after 5 h of hydrolysis in base treated biomass at 100oC, whereas at 105°C, the maximum TRS
yield reach was 65.7% only after 2 h of hydrolysis. However, since the reaction was too fast, the
TRS yield quickly reached maximum and then started to reduce due to the formation of HFM,
levulinic acid or other degradation products. In the condition of 80:20 and 70:30 IL:H2O as
shown in Figures 7.5.9, and 7.5.11, for 95°C, after 7h (80:20 IL:Water) and 17h (70:30
IL:Water), the TRS yields range are about 69-72%. However, where the temperature is 10°C

207
higher, the TRS yields range are about 65-66% after 7h (80:20 IL:Water) and 9h (70:30
IL:Water).
7.5.5 Hydrolysis result comparison as changing in temperature
Figure 7.5.12: Temperature effect on hydrolysis of acid pretreated NREL biomass at 95°C, 100°C, and 105°C in: a) 80:20 IL:water, b) 70:30 IL:water
0
10
20
30
40
50
60
70
0 2 4 6 8 10 12 14 16 18
TR
S yi
eld
(%)
Reaction time (h)
TRS yield for NREL acid treated biomass in 80:20 IL:Water Atech silica disc membrane 95°C
100°C
105°C
0
10
20
30
40
50
60
70
0 5 10 15 20
TR
S yi
eld
(%)
Reaction time (h)
TRS yield for NREL acid treated biomass in 70:30 IL:Water Atech silica disc membrane 95°C
100°C
105°C

208
Temperature effect was then proven with hydrolysis of NREL acid treated biomass in
mixture of 80:20 and 70:30 IL:Water. If in 80:20 IL:Water, the effect of temperature between
95°C to 105°C is not a great deal. Then in 70:30 IL:Water, the effect is more visible. For
example, when the temperature increased from 95°C to 105°C, the yield was increased from 60
to 65%. Reaction time in order to reach maximum TRS yield was decreased from 17 h to 9 h.
When water was used as co-solvent with IL as a ratio 70:30 IL:Water, the NREL
pretreated biomass was then hydrolyzed at 95°C in order to obtain the best TRS yield. After 17h
of hydrolysis, the base pretreated sample could give almost 70%, where acid pretreated and
steam pretreated samples gave lower yield in TRS, 60% and 54%. Since the reaction time is
long, the temperature was raised to 105°C to the hope of obtain good TRS yield with shorter
time. And with those conditions, the maximum TRS yield for those NREL pretreated biomass
could be reached at 9h compared to 17h when temperature was 95°C. Again, the base and acid
pretreated biomass can give higher TRS yield compare to steam pretreated sample since the
lignin contained was lower in acid and base pretreated samples.
7.6 Conclusion
Dual polymeric solid acid catalysts for cellulose or biomass hydrolysis were successfully
synthesized. Catalysts are consisted with PSSA and PIL which grafted randomly from the surface
of membrane substrates. PSSA chains are immobilized on surfaces of membrane substrates in
order to catalyze biomass hydrolysis. PIL chains are neighborly grafted from the surface to help
solubilize lignocellulosic biomass and enhance the catalytic activity. Those two nanostructure
polymer chains can be tuned independently the ratio as well as the chain length and chain density
in order to obtain the best hydrolysis reaction results with optimize catalytic activity. It has been
proven that the hydrolysis of cellulose can be reached to 96.4% TRS yield. Moreover, the

209
activity of the catalyst was stable during twelve times of repetition where the TRS yield was still
able to reach more equal or more than 90%. In additional, co-solvents are used to replace part of
expensive IL for economic purpose. Among Acetonitrile, Dimethylacetamide, and Gamma-
valerolactone, GVL not only is a green solvent, but also is able to give a high TRS yield, 96.7%.
Amount of GVL can be increased till 50% of total volume of the solution and still be able to
obtain high TRS yield, over 95%. Higher concentration of cellulose feedstock loaded was
applied and also give a high yield TRS, 90%. Corn-stovers, which prepared in lab and obtained
from NREL, were used as feedstock. The highest TRS yield can be reached from 60-70% even
though water was used as cosolvent. Temperature effect was proven with hydrolysis of NREL
acid treated biomass in mixture of IL:Water. The higher temperature will shorter the time of
hydrolysis also higher in max TRS yield since the activity of the catalyst will decrease in water
when time increases.
References
1. Himstedt, H. H. et al. Magnetically activated micromixers for separation membranes. Langmuir 27, 5574–5581 (2011).
2. Zeman, L. J.; Zydney, A. L. Microfiltration and Ultrafiltrion: Principles and Applications.
(Marcel Dekker: New York, 1996). 3. Wandera, D., Wickramasinghe, S. R. & Husson, S. M. Stimuli-responsive membranes. J.
Memb. Sci. 357, 6–35 (2010). 4. Farrell, A. E. et al. Supporting Online Material for: Ethanol Can Contribute To Energy and
Environmental Goals. Science (80-. ). 301, 506–508 (2006). 5. Himmel, M. E., Ding, S., Johnson, D. K. & Adney, W. S. Biomass Recalcitrance :
Engineering Plants and Enzymes for Biofuels Production. Science (80-. ). 315, 804–808 (2007).
6. Alonso, D. M., Wettstein, S. G. & Dumesic, J. a. Bimetallic catalysts for upgrading of
biomass to fuels and chemicals. Chem. Soc. Rev. 41, 8075 (2012). 7. Kärkäs, M. D., Matsuura, B. S., Monos, T. M., Magallanes, G. & Stephenson, C. R. J.

210
Biomolecular Chemistry the key to a sustainable carbon-neutral future. 1853–1914 (2016). doi:10.1039/c5ob02212f
8. Qian, X. The effect of cooperativity on hydrogen bonding interactions in native cellulose I
from ab initio molecular dynamics simulations. Mol. Simul. 34, (2008). 9. Mosier, N. et al. Features of promising technologies for pretreatment of lignocellulosic
biomass. 96, 673–686 (2005). 10. Xianghong Qian, Shi-You Ding, Mark R Nimlos, David K Johnson, M. E. H. Atomic and
electronic structures of molecular crystalline cellulose Iβ: A first-principles investigation. Macromolecules 38, 10580–10589 (2005).
11. Francisco, M., Mlinar, A. N., Yoo, B., Bell, A. T. & Prausnitz, J. M. Recovery of glucose
from an aqueous ionic liquid by adsorption onto a zeolite-based solid. 172, 184–190 (2011).
12. Gericke, M., Fardim, P. & Heinze, T. Ionic Liquids — Promising but Challenging
Solvents for Homogeneous Derivatization of Cellulose. 7458–7502 (2012). doi:10.3390/molecules17067458
13. Shill, K. et al. Ionic Liquid Pretreatment of Cellulosic Biomass : Enzymatic Hydrolysis
and Ionic Liquid Recycle. 108, 511–520 (2011). 14. Jiang, L., Fang, Z., Li, X. & Luo, J. Production of 2 , 3-butanediol from cellulose and
Jatropha hulls after ionic liquid pretreatment and dilute-acid hydrolysis. AMB Express 3, 1 (2013).
15. Wang, P., Yu, H., Zhan, S. & Wang, S. Catalytic hydrolysis of lignocellulosic biomass into
5-hydroxymethylfurfural in ionic liquid. Bioresour. Technol. 102, 4179–4183 (2011). 16. Zhang, H., Wu, J., Zhang, J. & He, J. 1-Allyl-3-methylimidazolium Chloride Room
Temperature Ionic Liquid : A New and Powerful Nonderivatizing Solvent for Cellulose. 8272–8277 (2005).
17. Zhu, S. et al. Dissolution of cellulose with ionic liquids and its application : a mini-review.
325–327 (2006). doi:10.1039/b601395c 18. Fukaya, Y., Hayashi, K. & Ohno, H. Cellulose dissolution with polar ionic liquids under
mild conditions : required factors for anions {. 44–46 (2008). doi:10.1039/b713289a 19. Hu, S. et al. Direct conversion of inulin to 5-hydroxymethylfurfural in biorenewable ionic
liquids. 873–877 (2009). doi:10.1039/b822328a 20. Zhang, Y., Du, H., Qian, X. & Chen, E. Y. Ionic Liquid - Water Mixtures : Enhanced K w
for Efficient Cellulosic Biomass Conversion. 2410–2417 (2010). doi:10.1021/ef1000198

211
21. Qian, X., Nimlos, M. R., Davis, M., Johnson, D. K. & Himmel, M. E. Ab initio molecular
dynamics simulations of b - D -glucose and b - D -xylose degradation mechanisms in acidic aqueous solution. 340, 2319–2327 (2005).
22. Liu, D., Nimlos, M. R., Johnson, D. K., Himmel, M. E. & Qian, X. Free Energy
Landscape for Glucose Condensation Reactions. 12936–12944 (2010). 23. Qian, X. & Wei, X. Glucose Isomerization to Fructose from ab Initio Molecular Dynamics
Simulations. (2012). 24. Qian, X. Mechanisms and Energetics for Acid Catalyzed β - D -Glucose Conversion to 5-
Hydroxymethylfurfurl. 11740–11748 (2011). 25. Dong, H., Nimlos, M. R., Himmel, M. E., Johnson, D. K. & Qian, X. The Effects of Water
on - D -Xylose Condensation Reactions. 8577–8585 (2009). 26. Qian, X., Johnson, D. K., Himmel, M. E. & Nimlos, M. R. The role of hydrogen-bonding
interactions in acidic sugar reaction pathways. Carbohydr. Res. 345, 1945–1951 (2010). 27. Xianghong Qian, Mark R. NimlosDavid K. Johnson, M. E. H. Acidic sugar degradation
pathways. Appl. Biochem. Biotechnol. 124, 989–997 (2005). 28. Qian, X. Mechanisms and Energetics for Brønsted Acid-Catalyzed Glucose Condensation,
Dehydration and Isomerization Reactions. Top. Catal. 55, 218–226 (2012). 29. Cheol-Kyu Choi, Y.-B. K. Atom Transfer Radical Polymerization of Styrenesulfonic Acid
Sodium Salts (SSNa) in Aqueous Phase. Polymer (Guildf). 49, 433–439 (2003). 30. Matyjaszewski, K. Atom Transfer Radical Polymerization (ATRP): Current status and
future perspectives. Macromolecules 45, 4015–4039 (2012). 31. Alonso, D. M., Wettstein, S. G. & Dumesic, J. A. gamma valerolactone sustainable
flatform molecule derived from lignocellulosic biomass. Green Chem. 15, 584–595 (2013).
32. Links, D. A. et al. Green Chemistry ionic liquid solution for microbial lipid production.
Green Chem. 14, 1202–1210 (2012).

212

213
Chapter 8
Conclusions and future work
Indeed, improvements and advances in membrane technology over the past few decades
have been proven by the expanding of their application in various industrial fields, for example,
water treatment and recovery, production of chemicals and biofuels, food and beverage industry,
biopharmaceutical. Membrane with specific properties, such as materials, morphology, porosity,
will be synthesized depending on of demand or application. For example, inversed colloidal
crystal membrane has been casted in order to apply for biopharmaceutical use base on its special
properties. Overcome the limitation of packed bed, adsorptive membrane can be used for
removing contaminants. Membrane based HIC afford all the advantages of membrane
adsorption, for example, dynamic capacity is independent of flow rate, higher throughput and
easy to scale up. ICC membrane substrate adopts a macro porous material with high porosity and
highly interconnected, periodical and uniform pore structure, which improve a pressure drop and
constant flow through the membrane. Moreover, the surface area of ICC membrane is very high
and controllable which is helpful for solute binding capacity. Base on binding and elute
mechanism, same as resin based hydrophobic interaction chromatography, ICC membrane is
able to reach high protein binding capacity and recovery compared to other commercial
membrane, PVDF, with the same pore size.
Moreover, membrane properties and its applications are able to improved and expanded
by surface modification. Microporous regenerated cellulose membrane has been grafted with
vinylcaprolactam from the surface of the membrane to become a responsive membrane, which is
able to change its physiochemical properties due to the environmental conditions. Poly
vinylcaprolactam is an environmental temperature responsive polymer. It is a bio-compatible and
214
has lower critical solution temperature in DI water around 32°C. Above the LCST, the poly-VCL
will dehydrate, contract and collapse promoting proteins adsorption. On the other hand, it will
hydrate, expand and swell promotes proteins desorption when the temperature is below the
LCST. Controllable of polymer chain length and density polymerization technique, ATRP, is
used to graft poly-VLC from the surface of the membrane. Also base on bind and elute mode,
this membrane adsorption is able to obtain good binding capacity and very high yield of
recovery, which is every useful for proteins purification and separation in biopharmaceutical.
Additionally, taking advantages from the limitation of common catalyst, expensive and
slow activity of enzyme and corrosion of mineral acid, duel polymeric solid acid catalyst are
grafted from the surface of ceramic membrane substrate for biofuels and chemicals production.
Poly sulfonic acid is grafted from the surface of the membrane by using ATRP polymerization in
order to hydrolyze the biomass where poly ionic liquid is grafted neighborly with PSSA group
by UV initiated polymerization to help to solubilize the catalyst and enhance the catalyst activity.
Those two catalysts are grafted independently to help to control polymer chain density and chain
length of each polymer. Ionic liquid is called a green solvent and effective solvent for dissolving
biomass since it has ability to break the hydrogen bonds of biomass. However it is expensive;
therefore, gamma-valerolactone is used as co-solvent in order to replace part of ionic liquid.
Modified catalyst membrane is stalely obtain more than 90% of total reducing sugar yield for
cellulose after twelve time of repetition. Not just stop at hydrolyzing cellulose, catalyst is also
active for real biomass, corn-stovers. For example, for without pretreatment corn-storvers, TRS
yield can be reach to 60% where it will be 70% for pretreatment corn-stovers biomass.
Even though, membrane is very useful for separation and filtration, it still suffers from
permeate flux decline caused by membrane fouling. Membrane fouling causes negative effects

215
on the performance of the membrane when the solution or particle compounds deposit on the
membrane surface or in the pores. Indeed, in beverage industry, beer industry, microfiltration
membrane has been used commonly for filtration. Appearance of polyphenol which creates a
crosslink with protein molecules, insoluble aggregates due to hydrophobic and hydrogen boning
interaction, can bind and foul the membrane. However, polysaccharides are able to break and
disrupt the binding of polyphenols to proteins by molecular association between the
polysaccharides and polyphenols. Amount of polysaccharides is very important because it can
help the flux less severe or bring back fouling situation. Confocal laser scanning microscopy is a
recent technology that has become an important new tool for localize the fouling in the
membrane.
Future work
After successfully modified a responsive membrane or grafted and ICC membrane for
hydrophobic interaction for protein separation and purification with bovine serum albumin
(BSA), lysozyme, and immunoglobulin G (IgG4), different proteins or additional number of
proteins for separation and purification can be worth to investigate. Sodium dodecyl sulfate-
polyacrylamide gel electrophoresis (SDS page) can be used to qualify the purity of the protein
and make sure there are no other proteins eluting at the same time. Binding capacity and
recovery can be calculated after that. Hydrophobic interaction not only depends on type of ligand
but also on type of binding salts solution. Since the LCST of the ligand is influenced by salt type
and concentration, ligand could play an important role on salt effect studies. Thus exploring
ligand effects which strongly depends on salt type and concentration is also very important.
LCST change of responsive polymer on surface as the polymer brush is very interesting to
explore.

216
ICC membrane originally has a very high binding capacity; however, the recovery is not
high compare to responsive membrane. Casting the membrane with responsive ligand, PVCL,
with ICC technique will be very interesting to explore for HIC. Responsive membrane has a
good start-up when its binding and recovery yield is high. Even though the binding capacity is
not much higher than other commercial membrane but the results could be modified. One of the
reasons that it does not have a high binding capacity is its low porosity. If the membrane base
can be changed to different materials, for example nano fiber membrane, the yield will be
greater. The design of membrane holder is also important. It needs to be well designed so the
solution is able to pass through the total membrane surface but not part of the membrane.
For catalytic membrane, the modification conditions can be more optimized in the future.
Since the previous method was developed for cellulose hydrolysis with glass substrate and
Titanium oxide disc membranes. Depending on our purpose, cellulose hydrolysis or dehydration,
or different type of membrane surface, we can have a different optimization condition for
modification. Modification condition here can be varied since we have two nanostructures of
grafted polymer, PSSA and PIL. The ratio between chain density and chain length for each
component or both components can give different results for cellulose hydrolysis and
dehydration. Therefore, optimization of conditions for specific membrane substrate and purpose
of use is very important and necessary. Generally, one of the traditional technique for changing
polymer chain density and chain length is varying time and monomer solution concentration.
However, chemistry can also be changed if it’s necessary in order to obtain better results.
After grafting the catalyst from the surface of the membrane, it can be used for membrane
reactor application. Basically, when a mixture of cellulose in IL/Water is added into the reactor,
cellulose will be hydrolyzed and dehydrated by the catalyst. Then sugars, water and other

217
products will permeate through the membrane where IL and solvents will be rejected inside the
reactor to continue the reaction. On the other hand, IL can be purified and recycled for the next
runs of hydrolysis and dehydration.
5-HMF is an intermediate product for biofuel. HMF was mostly made from fructose or
glucose, and the feedstock is costly if processing this way. Multiple studies have been reported
for making HMF with different types of catalysts, liquid acids, solid acids, or metals. However,
liquid acids give low yield. In the other hand, metal catalyst could be able to give very high yield
but it costly and not environmental friendly. Indeed, the solid catalyst has a potential for HMF
production study because it is active and environmental friendly compared to those previous
catalysts. And the aim for this study is to reach the HMF production yield close to the yield from
metals catalysts. Moreover, IL is very expensive. Market price is approximately $1/1gr. Recycled
IL after hydrolysis is also economically helpful.
In the HMF production process, higher temperature compared to hydrolysis condition is
recommended in order to speed up the reaction rate. On the other hand, applying high
temperature also increases the appearance of humins during the process. Therefore, beside IL,
co-solvents will be used not only suppressed the appearance of humins but also economic
purpose. Acetonitrile, Dimethylacetamide (DMA), and Gamma-Valerolactone (GVL) were
investigated as an effective solvent to decrease the appearance of humins. Mixtures of three
different solvents are also worth to investigate. Temperature will be kept the same at 135°C
where the concentration of co-solvent in IL will be varied. HMF yield will be measured by UV
spectrometer, high performance liquid chromatography (HPLC), and Mass Spectrometry (MS).