Embed Size (px)
Citation preview
Sains Malaysiana 48(4)(2019): 877–885 http://dx.doi.org/10.17576/jsm-2019-4804-20
Membrane Electrode Assembly with High Efficiency and Stability: Effect of Solvent Type and Membrane Composition
(Pemasangan Elektrod Membran dengan Kecekapan dan Kestabilan yang Tinggi: Kesan Jenis Pelarut dan Komposisi Membran)
N. SABLI*, N.A. ABU BAKAR, S. IZHAR & H.S. HILAL
ABSTRACT
Membrane electrode assembly (MEA) method is being widely considered in proton exchange membrane fuel cell (PEMFC) preparation. This work describes for the first time how PEMFC performance can be enhanced, while using relatively low temperature processing for the MEA, by choosing the suitable solvent and suitable ionomer (nafion) content. Three dispersion solvents (water, ethylene glycol and ethanol) have been examined here, and ethanol (with lowest boiling point) showed best PEMFC performance. In addition to its non-hazardous nature, the low boiling point ethanol allowed manufacturing the working membrane at 130°C or lower besides using a safe solvent to use. In each solvent system, different nafion concentrations were used (10%, 20% and 30%). The 30% nafion concentration in ethanol showed highest performance (Open circuit potential of 0.88 V and output working potential of 0.67 V at 20 mA/cm2 current density) among the series. The anode and cathode, of the MEA, were both fabricated using same catalyst material (Platinum) and same nafion sheet thickness (50 µm). The spray method was employed. The electrochemical performance for the prepared MEA fuel cells was assessed by linear sweep voltammetry to evaluate the open circuit voltage.
Keywords: Dispersion solvent; hydrogen fuel cell; MEA; nafion ionomer
ABSTRAK
Kaedah pemasangan elektrod membran (MEA) dipertimbangkan secara meluas dalam penyediaan sel bahan bakar membran sel proton (PEMFC). Kajian ini menerangkan buat kali pertama bagaimana prestasi PEMFC dapat dipertingkatkan semasa memproses MEA pada suhu yang rendah dengan memilih pelarut dan kandungan ionomer (nafion) yang sesuai. Tiga pelarut penyebaran (air, etilena glikol dan etanol) telah diperiksa. Etanol (takat didih terendah) didapati menunjukkan prestasi PEMFC yang terbaik. Tambahan pula sifat etanol yang tidak berbahaya, takat didih yang rendah membolehkan pembuatan membran pada suhu 130°C atau lebih rendah dapat dilaksanakan di samping ia juga pelarut yang selamat untuk digunakan. Dalam setiap sistem pelarut, kepekatan nafion berbeza digunakan (10%, 20% dan 30%). Kepekatan 30% nafion dalam etanol menunjukkan prestasi tertinggi (potensi litar terbuka 0.88 V dan potensi kerja output 0.67 V pada kepadatan arus 20 mA /cm2) antara siri ini. Anod dan katod pada MEA, kedua-duanya difabrikasi menggunakan bahan pemangkin yang sama (Platinum) dan ketebalan lembaran nafion yang sama (50 μm). Kaedah semburan telah digunakan. Prestasi elektrokimia untuk sel bahan bakar MEA diukur menggunakan voltammetri menyapu linear untuk menilai voltan litar terbuka.
Kata kunci: MEA; nafion ionomer; pelarut penyebaran; sel bahan api hidrogen
INTRODUCTION
Proton exchange membrane fuel cells (PEMFC) received a great attention because of their low pollution level, soundly high power density, short induction time, response to varying loads and low operating temperature (Cho et al. 2011; Mehta et al. 2003; Thanasilp & Hunsom 2010). PEMFCs have gained interest in both automotive and stationary applications. Despite that, too much is still needed in the PEMFC technology to produce setups with higher performance, lower manufacturing cost and safer production materials. The membrane electrode assembly (MEA), which is being considered for PEMFC manufacturing, involves different materials that may affect the cell performance (Frey et al. 2004; He et al. 2005;
Kilner et al. 2012; Kohler & Banisch 2005; Kulkarni 2011; Mehmood & Ha 2013; Mench 2008; Park & Li 2010; Yang et al. 2004). The MEA involves a catalyst layer, the properties of which affect the MEA performance (Jao et al. 2013; Saha et al. 2010; Song et al. 2010; Taylor et al. 2007; Yang et al. 2004). For example, the resistance at the catalyst/membrane interface affects the fuel cell efficiency. The speed of the chemical reaction that occurs between the catalyst layers is affected by the catalyst layer structure and the porous nature of the carbon in the MEA. Adding nafion in different proportions to the catalyst was also found to affect the cell efficiency (Antoloni et al. 1999; Passalacqua et al. 2001).
878
Effect of the type of dispersion solvent on cell performance was also studied. Eguchi et al. (2012) studied the influence of ionomer/carbon (I/C) ratio on the performance of a polymer electrolyte fuel cell. The ionomer used in their study was nafion solution. Different ratios of ionomer were used to improve the fuel cell performance. The I/C ratio of 0.14 gave soundly good results. The performance was enhanced by lowering the I/C ratio (Eguchi et al. 2012). In another report by Ticianelli et al. (1988), the effect of nafion on current density was studied. The results showed that in the low current density range (0-300 mA/cm2) an increase of nafion loading increased the performance of the fuel cell. At higher current densities, increasing nafion loading up to 33% showed positive impact on the performance, whereas loading above 33% lowered the cell performance. This is because the excessive nafion may flood the active sites and retard the gas away from them (Passalacua et al. 2001). Too low nafion loading leads to poor internal electrolytic conductivity causing poor cell performance (Ticianelli et al. 1988). The effect of using nafion on active surface area of the electrocatalyst was reported by Yidianti et al. (2014). In the presence of nafion ionomer, the electrochemical surface area for the electrocatalyst was 75.5 m2/g, while electrocatalyst systems without the ionomer showed 120.5 m2/g. The nature of the organic solvent also affected the molecular conformation of the nafion ionomer, and the Pt distribution, in the resulting electrocatalyst surface. Best results were observed in case of isopropyl alcohol solvent which caused a wrapping fiber in the inner network. The screen printing technique makes it possible to control thickness of electrocatalyst layer depending on the ink characteristics (Yudianti et al. 2014). Normally, in preparing the catalyst layer, the catalyst ink is mixed with the solvent and ionomers. The solvent is used to make better dispersion on the catalyst layer and membrane while ionomers are used as the binder and proton conductor to increase the reaction area and to maximize the catalyst utilization. Nafion instability is a technical difficulty that may occur. The nafion may absorb remaining solvent and may swell up, which lowers the cell performance (Holton et al. 2013). The solvent type, the ionomer loading and the ink composition should be carefully selected as they affect aggregate properties in the catalyst layer (Huang et al. 2011). Controlling the catalyst layer properties readily affects the fuel cell performance. In some reports, ethylene glycol was used as a dispersion solvent for nafion, and showed best performance. However, elevated temperatures (200 or 250°C) were needed to completely evaporate the solvent (Kwak et al. 2001). The major objective of this work was to find techniques to enhance the fuel cell performance and membrane stability to swelling, without compromising materials safety. It is also intended to prepare the MEA without using high evaporation temperatures. Moreover,
finding a safe solvent (like water or ethanol) and avoiding hazardous ones (like ethylene glycol) was another objective for this study. Direct spray method is employed to fabricate MEA here. Varying the ionomer to dispersion solvent ratio is investigated to find the optimal conditions for the fuel cell.
MATERIALS AND METHODS
STARTING MATERIAL
Perfluorinated Nafion 112 (EC-NM-112) ion exchange solid membrane, with thickness of 0.002 inch (50.8 µm) and nafion perfluorinated resin (NPR) solution with 5 wt. % in lower aliphatic alcohols and water were purchased from Sigma-Aldrich. Organic solvent: Ethylene glycol and ethanol were purchased from Merck KGaA. Commercial carbon black-carbon supported Pt catalyst with 20 wt. % Pt on VULCAN XC-72 Carbon was purchased from ElectroChem, Inc.
NAFION CLEANING
Prior to fabrication of the MEA, Nafion 112 sheets (5 cm2) were treated according to the standard procedures to eliminate inorganic and organic contaminants (Ranney 2008). The membrane sheets were heated in deionized water followed by 3% (wt.) sodium peroxide solution. The membrane sheets were then heated in both deionized water and in 0.5 M sulphuric acid (H2SO4) and finally in deionized water. Each heating was carried out for 1 h at 80°C. The membrane sheets were then dried overnight in an oven at 70-80°C. The pre-cleaned membrane was further heated at 70 ~ 80°C under vacuum for 1 h prior used.
CATALYST INK PREPARATION
The amount ratio of nafion solution to catalyst used were 10%, 20% and 30%. Higher nafion loading were intentionally avoided, because the excessive nafion may flood the active sites and retard the gas away from them (Passalacua et al. 2001). The weight percentage of nafion perfluorinated resin in the final solution can be calculated by (1).
NFP = (1)
where NFP is the nafion percentage (NPR %); LNaf is the NPR solution loading (mg); Lpt is the platinum/carbon powder catalyst (mg); and Lda is the loading of dispersion agent (mg). The catalyst ink was prepared using the 20:1 ratio of catalyst 20% Pt/C to dispersion solvent. Three different types of dispersion solvents were used (water, ethylene glycol and ethanol). The nafion solution, that was prepared with desired ratio, was then added to the mixture. In each step the mixture was magnetically stirred for 1 h.
879
ELECTROCHEMICAL CATALYST PREPARATION
The prepared catalyst inks with different percentages and different dispersion agents were directly sprayed onto both sides of the 5 cm2 pre-cleaned membrane sheets and weighed until the desirable membrane total weight (5.0 mg) was achieved. The coated membrane was then dried at 100°C for 10 min. The dried coated membrane was sandwiched between the carbon cloths sheets before being hot pressed under 11 MPa at 130°C for 5 min using a hot press. The carbon cloth works as a support for the catalyst layer and improves electrical conductivity. The prepared membrane was then installed in the fuel cell stack for evaluation. The fuel cell performance was tested using standard fuel cell testing methods. The oxygen and hydrogen gases were bubbled through the system at 80°C with constant flow rate of 60 mLmin-1. The fuel cell anode and cathode were kept at 65°C without any back pressure. Under this condition, the resulting water flow could be observed at cathode exit hose indicating that hydrogen gases and oxygen gases reacted together. A computerized fuel cell station, with automatic polarization system (HZ-500) was used to measure the performance of the PEMFC. The linear sweep voltammetry (LSV) was used to determine the current-voltage (I-V) characteristics of the fuel cell, by sweeping the potential at the working electrode and measuring the current response. The performance results of the PEM fuel cell are summarized in the polarization curves in Figure 2(a)-2(c). The polarization curve shows the measurement of the output voltage for the tested membrane which gives a specific output current.
CHARACTERIZATION AND FUEL CELL OUTPUT
Commercial Perfluorinated Nafion 112 (EC-NM-112) ion exchange solid membrane and NPR were purchased from ElectroChem, Inc. and were used as starting materials in this work. The Pt catalyst particles on carbon black VULCAN
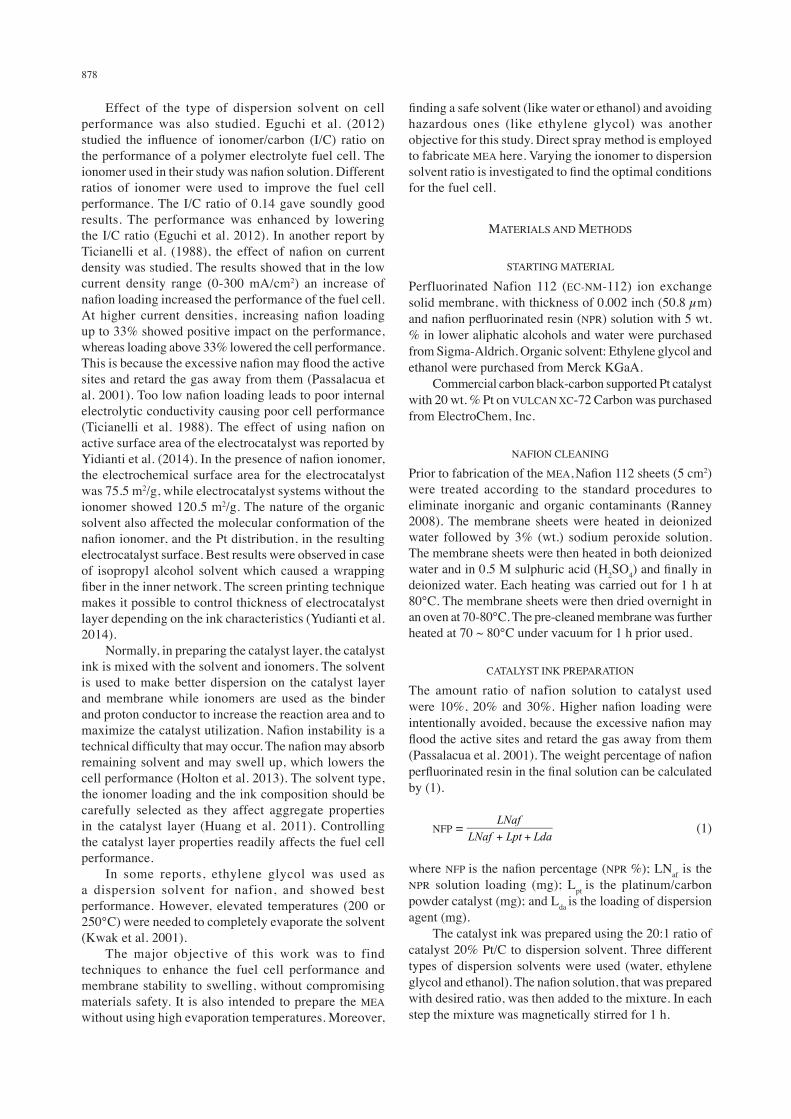
XC-72 particles (Pt/C) were further characterized by XRD in powder form. The XRD patterns were measured on an XPERT-PRO X-Ray diffractometer with Cuα (1.54956 Å). The XRD pattern for Pt/C is shown in Figure 1. The strong diffraction peaks at the Bragg angles of 40.08°, 46.67° and 68.02° correspond to the (111), (200) and (220) facets of Pt/C in congruence with earlier reports (Saha et al. 2010; Song et al. 2010). After confirming its XRD pattern, the Pt/C catalyst was then used in MEA preparation. To measure the output power of the PEMFC, with different fabrication compositions, the HZ-500 system was equipped with an HZ-500 ANA software. The polarization curve was plotted from the data using OriginPro. The graphs were analyzed and used to determine the performance of fuel cell for different catalyst systems with different membrane compositions and solvents. The atomic compositions of the films were investigated by EDS (Thermo Scientific NORAN System 7) attached to a Hitachi S-3400N scanning electron microscope (SEM) was also study to study surface morphology.
RESULTS AND DISCUSSION
FUEL CELL PERFORMANCE STUDY
The effects of varying NPR content, in different solvents, on cell performance, have been investigated. All otherwise working conditions were kept the same. Same type of platinum catalyst was used in the MEA, as described previously. As the fuel cell circuit is connected to the electrode (closed circuit), the fuel cell stack will be polarized causing the anode to move to a more positive value and the cathode to a more negative value. The cell voltage is thus lowered with current, as reported earlier (Taylor et al. 2007). The voltage loss is classified into three regions, namely: the activation loss, Ohmic loss and mass transport
FIGURE 1. X-Ray diffraction pattern for Pt catalyst on VULCAN XC-72
880
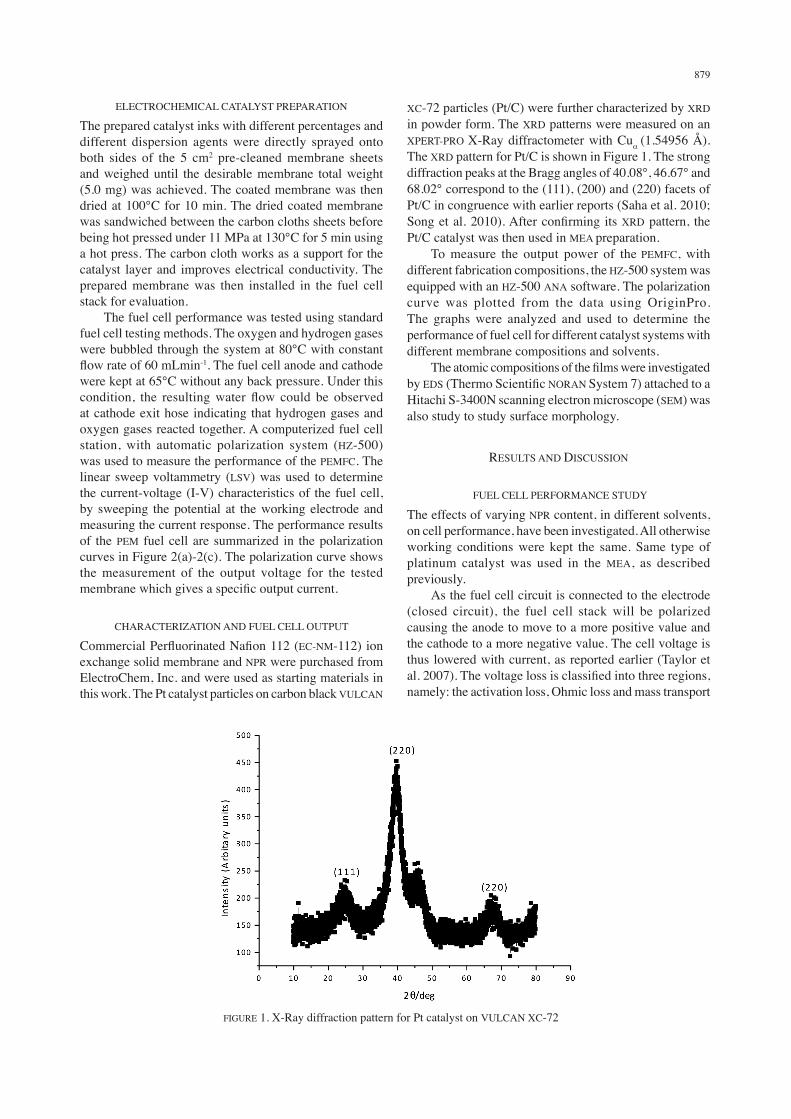
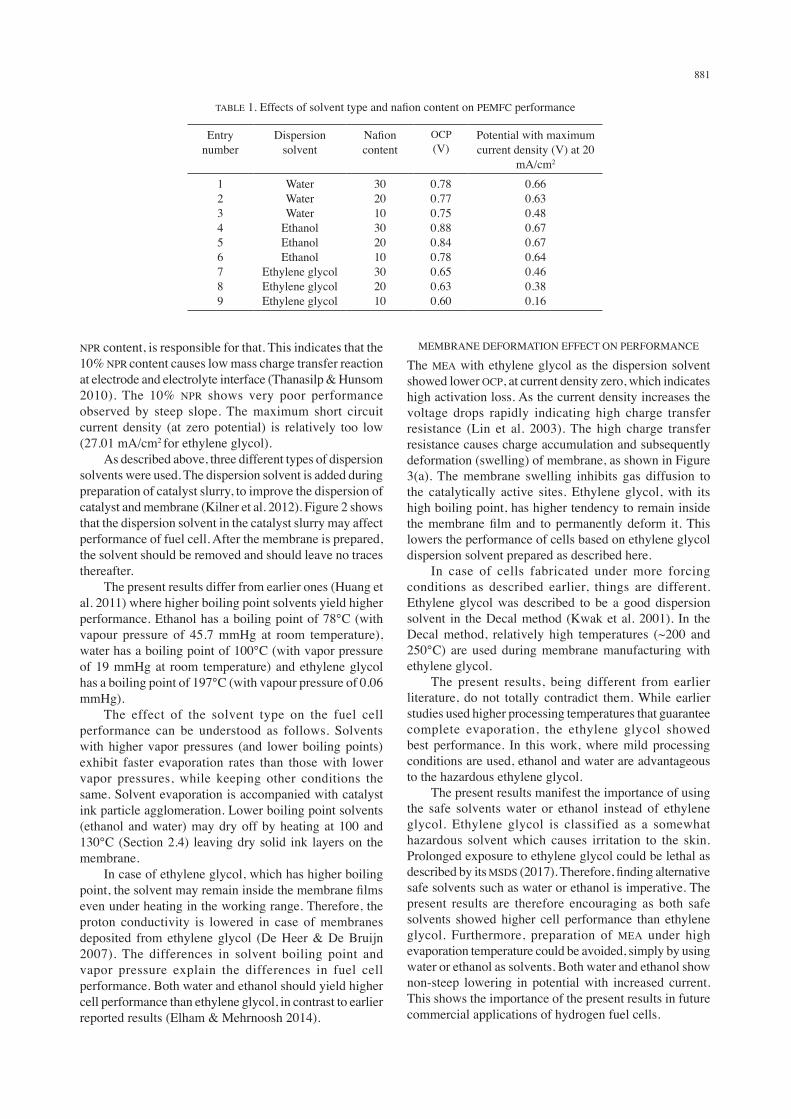
(or gas transport) loss. The results observed here indicate that adding nafion ionomers inside the catalyst ink affects the activation loss region. This in turn affects the charge transfer resistance and open circuit potential (OCP) value. Theoretically, the OCP value is 1.23 V but in practice it could be in the range of 0.6- 0.9 V when considering voltage loss. The OCP values occur in the activation region only. In this first part of the experiment, the effect of NPR is studied. The amount of NPR was calculated using (1). In theory, the nafion acts as bridge for ionic conduction between the catalyst layer and membrane. Sufficient amount of nafion is needed to transfer the ions produced at the catalyst surface, to achieve high cell performance. For this purpose, the effect of the amount of NPR on cell performance is investigated here, as shown in Figure 2. The Figure 2 results are summarized in Table 1. Table 1 shows that, in all three different solvents, the 30% nafion content exhibits 0.65 ~ 0.88 mA/cm2 current density while having highest potential. Moreover, a closer look at Figure 2 shows that in each solvent, the value of the OCP is higher for the 30% NPR content. The highest OCP value in this study, which is 0.88 V, resembles that for Pt/C reference reported by Izhar and Nagai (2008). This means that the MEA preparation and single unit fuel cell measurement system, described here, were conducted according to standard measurement. Higher NPR content is expected to increase the transport of reactant to the electrochemical side and to maintain higher cell voltage. In case of the 30% NPR content, the cell can yield higher current density due to the lower catalyst layer, as sufficient amount of nafion furnishes more charge transfer sites across the membrane. Moreover, the high abundance of the charge transfer sites keeps the cell potential high enough across the cell electrodes, to furnish the relatively high current density. The fact that the higher nafion content showed higher current density is consistent with earlier literature (Passalacqua et al. 2001). For the 20% nafion system, the OCP values are also relatively high, in the range range 0.84 V ~ 0.63 V, as shown in Table 1. The values are still relatively lower than those for the 30% NPR systems discussed above. It can be seen from all three solvent used with 20% NPR content the activation losses are low. The high OCP values for the 20% NPR indicate low activation losses. Another feature for the 20% NPR systems (Figure 2(a), 2(b) and 2(c)) is that they have Current Density-Voltage plots parallel to the 30% systems (Figure 2(a), 2(b) and 2(c)), as the value of voltage undergoes steady but not steep lowering with current density increase. From Table 1, the OCP values for the 10% NPR content are lower than other counterparts. Figure 2(c) shows a steep slope for voltage lowering with current density increase. The lowest recorded OCP was 0.60V in ethylene glycol. Even at low current density the voltage drops sharply, which indicates high activation losses (Zhang 2008). With higher current density the voltage value continued to drop steeply. The proton flow across the membrane is lowered by the insufficient NPR content that helps the catalyst to
bind resulted in high charge mass resistance. As the current density is further increased, the voltage further dropped. The OCP in 10% NPR content was rather smaller compared to the other MEA systems constructed as the curve drops steeply. The high charge transport resistance, due to low
FIGURE 2. Effect of NPR loading on PEMFC performance. Membranes were processed using different dispersion solvents:
a) water, b) ethanol and c) ethylene glycol
881
NPR content, is responsible for that. This indicates that the 10% NPR content causes low mass charge transfer reaction at electrode and electrolyte interface (Thanasilp & Hunsom 2010). The 10% NPR shows very poor performance observed by steep slope. The maximum short circuit current density (at zero potential) is relatively too low (27.01 mA/cm2 for ethylene glycol). As described above, three different types of dispersion solvents were used. The dispersion solvent is added during preparation of catalyst slurry, to improve the dispersion of catalyst and membrane (Kilner et al. 2012). Figure 2 shows that the dispersion solvent in the catalyst slurry may affect performance of fuel cell. After the membrane is prepared, the solvent should be removed and should leave no traces thereafter. The present results differ from earlier ones (Huang et al. 2011) where higher boiling point solvents yield higher performance. Ethanol has a boiling point of 78°C (with vapour pressure of 45.7 mmHg at room temperature), water has a boiling point of 100°C (with vapor pressure of 19 mmHg at room temperature) and ethylene glycol has a boiling point of 197°C (with vapour pressure of 0.06 mmHg). The effect of the solvent type on the fuel cell performance can be understood as follows. Solvents with higher vapor pressures (and lower boiling points) exhibit faster evaporation rates than those with lower vapor pressures, while keeping other conditions the same. Solvent evaporation is accompanied with catalyst ink particle agglomeration. Lower boiling point solvents (ethanol and water) may dry off by heating at 100 and 130°C (Section 2.4) leaving dry solid ink layers on the membrane. In case of ethylene glycol, which has higher boiling point, the solvent may remain inside the membrane films even under heating in the working range. Therefore, the proton conductivity is lowered in case of membranes deposited from ethylene glycol (De Heer & De Bruijn 2007). The differences in solvent boiling point and vapor pressure explain the differences in fuel cell performance. Both water and ethanol should yield higher cell performance than ethylene glycol, in contrast to earlier reported results (Elham & Mehrnoosh 2014).
MEMBRANE DEFORMATION EFFECT ON PERFORMANCE
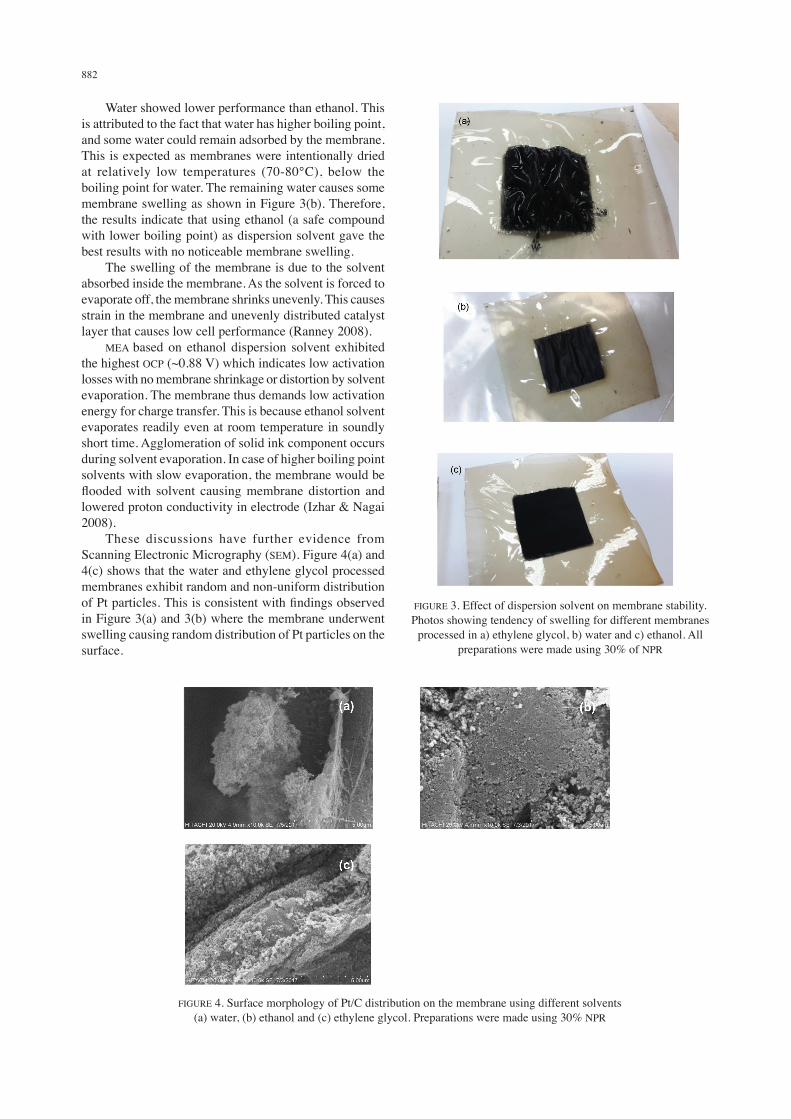
The MEA with ethylene glycol as the dispersion solvent showed lower OCP, at current density zero, which indicates high activation loss. As the current density increases the voltage drops rapidly indicating high charge transfer resistance (Lin et al. 2003). The high charge transfer resistance causes charge accumulation and subsequently deformation (swelling) of membrane, as shown in Figure 3(a). The membrane swelling inhibits gas diffusion to the catalytically active sites. Ethylene glycol, with its high boiling point, has higher tendency to remain inside the membrane film and to permanently deform it. This lowers the performance of cells based on ethylene glycol dispersion solvent prepared as described here. In case of cells fabricated under more forcing conditions as described earlier, things are different. Ethylene glycol was described to be a good dispersion solvent in the Decal method (Kwak et al. 2001). In the Decal method, relatively high temperatures (~200 and 250°C) are used during membrane manufacturing with ethylene glycol. The present results, being different from earlier literature, do not totally contradict them. While earlier studies used higher processing temperatures that guarantee complete evaporation, the ethylene glycol showed best performance. In this work, where mild processing conditions are used, ethanol and water are advantageous to the hazardous ethylene glycol. The present results manifest the importance of using the safe solvents water or ethanol instead of ethylene glycol. Ethylene glycol is classified as a somewhat hazardous solvent which causes irritation to the skin. Prolonged exposure to ethylene glycol could be lethal as described by its MSDS (2017). Therefore, finding alternative safe solvents such as water or ethanol is imperative. The present results are therefore encouraging as both safe solvents showed higher cell performance than ethylene glycol. Furthermore, preparation of MEA under high evaporation temperature could be avoided, simply by using water or ethanol as solvents. Both water and ethanol show non-steep lowering in potential with increased current. This shows the importance of the present results in future commercial applications of hydrogen fuel cells.
TABLE 1. Effects of solvent type and nafion content on PEMFC performance
Entry number
Dispersion solvent
Nafion content
OCP (V)
Potential with maximum current density (V) at 20
mA/cm2
123456789
WaterWaterWater
EthanolEthanolEthanol
Ethylene glycolEthylene glycolEthylene glycol
302010302010302010
0.780.770.750.880.840.780.650.630.60
0.660.630.480.670.670.640.460.380.16
882
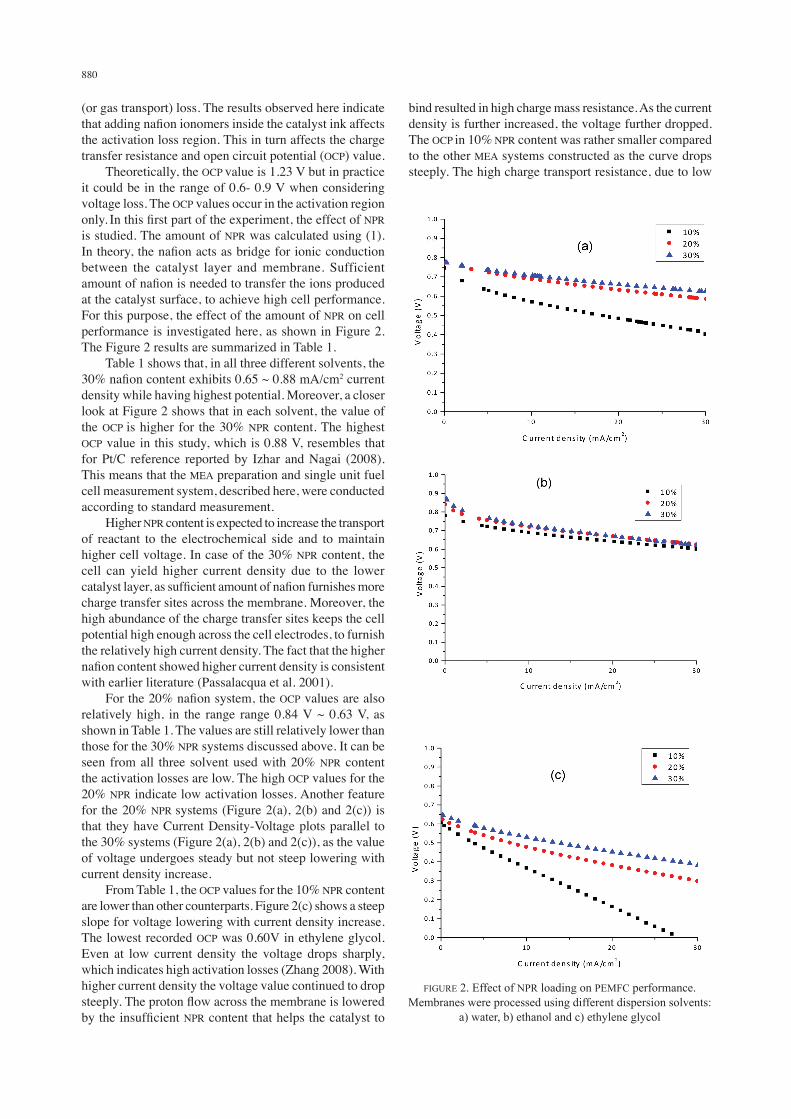
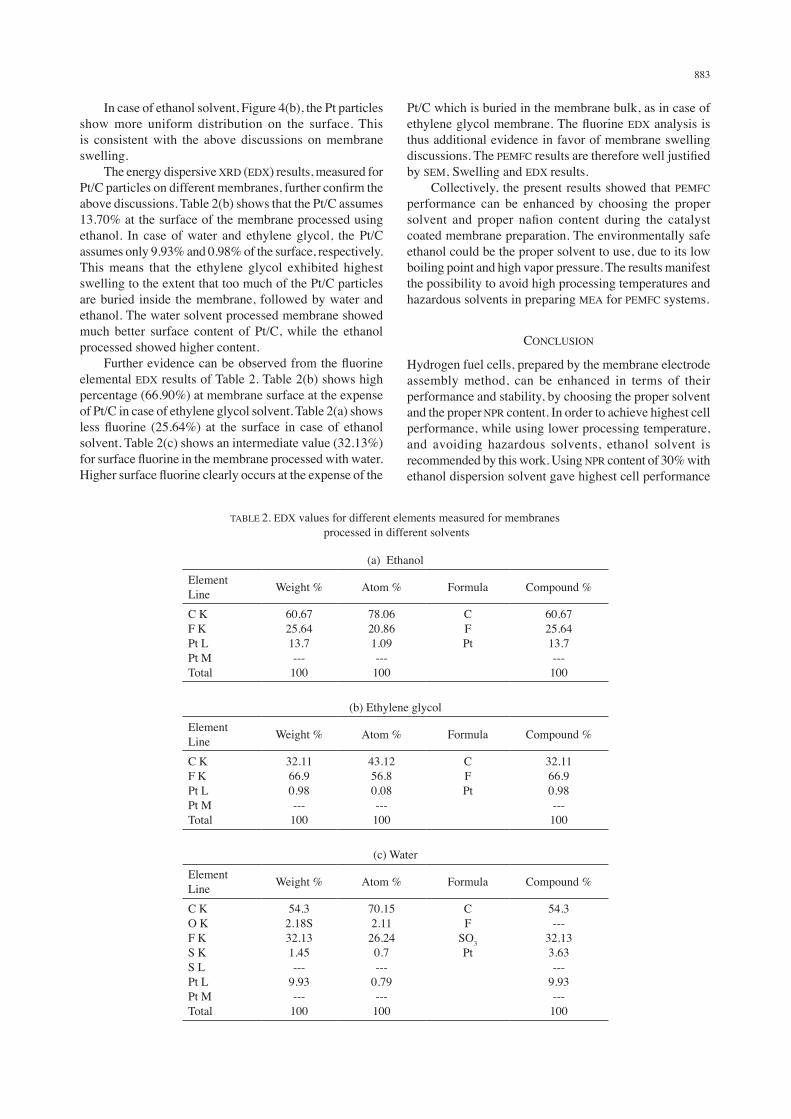
Water showed lower performance than ethanol. This is attributed to the fact that water has higher boiling point, and some water could remain adsorbed by the membrane. This is expected as membranes were intentionally dried at relatively low temperatures (70-80°C), below the boiling point for water. The remaining water causes some membrane swelling as shown in Figure 3(b). Therefore, the results indicate that using ethanol (a safe compound with lower boiling point) as dispersion solvent gave the best results with no noticeable membrane swelling. The swelling of the membrane is due to the solvent absorbed inside the membrane. As the solvent is forced to evaporate off, the membrane shrinks unevenly. This causes strain in the membrane and unevenly distributed catalyst layer that causes low cell performance (Ranney 2008). MEA based on ethanol dispersion solvent exhibited the highest OCP (~0.88 V) which indicates low activation losses with no membrane shrinkage or distortion by solvent evaporation. The membrane thus demands low activation energy for charge transfer. This is because ethanol solvent evaporates readily even at room temperature in soundly short time. Agglomeration of solid ink component occurs during solvent evaporation. In case of higher boiling point solvents with slow evaporation, the membrane would be flooded with solvent causing membrane distortion and lowered proton conductivity in electrode (Izhar & Nagai 2008). These discussions have further evidence from Scanning Electronic Micrography (SEM). Figure 4(a) and 4(c) shows that the water and ethylene glycol processed membranes exhibit random and non-uniform distribution of Pt particles. This is consistent with findings observed in Figure 3(a) and 3(b) where the membrane underwent swelling causing random distribution of Pt particles on the surface.
FIGURE 3. Effect of dispersion solvent on membrane stability. Photos showing tendency of swelling for different membranes
processed in a) ethylene glycol, b) water and c) ethanol. All preparations were made using 30% of NPR
FIGURE 4. Surface morphology of Pt/C distribution on the membrane using different solvents (a) water, (b) ethanol and (c) ethylene glycol. Preparations were made using 30% NPR
883
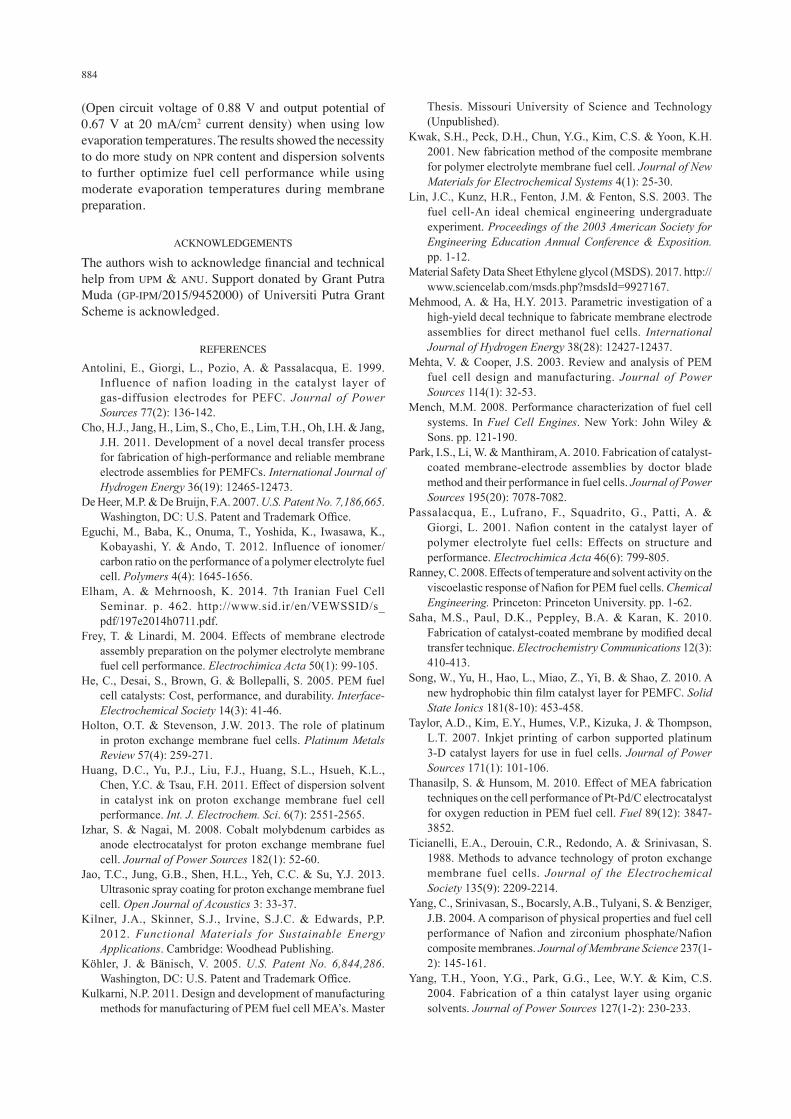
In case of ethanol solvent, Figure 4(b), the Pt particles show more uniform distribution on the surface. This is consistent with the above discussions on membrane swelling. The energy dispersive XRD (EDX) results, measured for Pt/C particles on different membranes, further confirm the above discussions. Table 2(b) shows that the Pt/C assumes 13.70% at the surface of the membrane processed using ethanol. In case of water and ethylene glycol, the Pt/C assumes only 9.93% and 0.98% of the surface, respectively. This means that the ethylene glycol exhibited highest swelling to the extent that too much of the Pt/C particles are buried inside the membrane, followed by water and ethanol. The water solvent processed membrane showed much better surface content of Pt/C, while the ethanol processed showed higher content. Further evidence can be observed from the fluorine elemental EDX results of Table 2. Table 2(b) shows high percentage (66.90%) at membrane surface at the expense of Pt/C in case of ethylene glycol solvent. Table 2(a) shows less fluorine (25.64%) at the surface in case of ethanol solvent. Table 2(c) shows an intermediate value (32.13%) for surface fluorine in the membrane processed with water. Higher surface fluorine clearly occurs at the expense of the
Pt/C which is buried in the membrane bulk, as in case of ethylene glycol membrane. The fluorine EDX analysis is thus additional evidence in favor of membrane swelling discussions. The PEMFC results are therefore well justified by SEM, Swelling and EDX results. Collectively, the present results showed that PEMFC performance can be enhanced by choosing the proper solvent and proper nafion content during the catalyst coated membrane preparation. The environmentally safe ethanol could be the proper solvent to use, due to its low boiling point and high vapor pressure. The results manifest the possibility to avoid high processing temperatures and hazardous solvents in preparing MEA for PEMFC systems.
CONCLUSION
Hydrogen fuel cells, prepared by the membrane electrode assembly method, can be enhanced in terms of their performance and stability, by choosing the proper solvent and the proper NPR content. In order to achieve highest cell performance, while using lower processing temperature, and avoiding hazardous solvents, ethanol solvent is recommended by this work. Using NPR content of 30% with ethanol dispersion solvent gave highest cell performance
TABLE 2. EDX values for different elements measured for membranes processed in different solvents
(a) EthanolElementLine Weight % Atom % Formula Compound %
C KF KPt LPt MTotal
60.6725.6413.7---
100
78.0620.861.09---
100
CFPt
60.6725.6413.7---
100
(b) Ethylene glycolElementLine Weight % Atom % Formula Compound %
C KF KPt LPt MTotal
32.1166.90.98---
100
43.1256.80.08---
100
CFPt
32.1166.90.98---
100
(c) WaterElementLine Weight % Atom % Formula Compound %
C KO KF KS KS LPt LPt MTotal
54.32.18S32.131.45---
9.93---
100
70.152.11
26.240.7---
0.79---
100
CF
SO3Pt
54.3---
32.133.63---
9.93---
100
884
(Open circuit voltage of 0.88 V and output potential of 0.67 V at 20 mA/cm2 current density) when using low evaporation temperatures. The results showed the necessity to do more study on NPR content and dispersion solvents to further optimize fuel cell performance while using moderate evaporation temperatures during membrane preparation.
ACKNOWLEDGEMENTS
The authors wish to acknowledge financial and technical help from UPM & ANU. Support donated by Grant Putra Muda (GP-IPM/2015/9452000) of Universiti Putra Grant Scheme is acknowledged.
REFERENCES
Antolini, E., Giorgi, L., Pozio, A. & Passalacqua, E. 1999. Influence of nafion loading in the catalyst layer of gas-diffusion electrodes for PEFC. Journal of Power Sources 77(2): 136-142.
Cho, H.J., Jang, H., Lim, S., Cho, E., Lim, T.H., Oh, I.H. & Jang, J.H. 2011. Development of a novel decal transfer process for fabrication of high-performance and reliable membrane electrode assemblies for PEMFCs. International Journal of Hydrogen Energy 36(19): 12465-12473.
De Heer, M.P. & De Bruijn, F.A. 2007. U.S. Patent No. 7,186,665. Washington, DC: U.S. Patent and Trademark Office.
Eguchi, M., Baba, K., Onuma, T., Yoshida, K., Iwasawa, K., Kobayashi, Y. & Ando, T. 2012. Influence of ionomer/carbon ratio on the performance of a polymer electrolyte fuel cell. Polymers 4(4): 1645-1656.
Elham, A. & Mehrnoosh, K. 2014. 7th Iranian Fuel Cell Seminar. p. 462. http://www.sid.ir/en/VEWSSID/s_pdf/197e2014h0711.pdf.
Frey, T. & Linardi, M. 2004. Effects of membrane electrode assembly preparation on the polymer electrolyte membrane fuel cell performance. Electrochimica Acta 50(1): 99-105.
He, C., Desai, S., Brown, G. & Bollepalli, S. 2005. PEM fuel cell catalysts: Cost, performance, and durability. Interface-Electrochemical Society 14(3): 41-46.
Holton, O.T. & Stevenson, J.W. 2013. The role of platinum in proton exchange membrane fuel cells. Platinum Metals Review 57(4): 259-271.
Huang, D.C., Yu, P.J., Liu, F.J., Huang, S.L., Hsueh, K.L., Chen, Y.C. & Tsau, F.H. 2011. Effect of dispersion solvent in catalyst ink on proton exchange membrane fuel cell performance. Int. J. Electrochem. Sci. 6(7): 2551-2565.
Izhar, S. & Nagai, M. 2008. Cobalt molybdenum carbides as anode electrocatalyst for proton exchange membrane fuel cell. Journal of Power Sources 182(1): 52-60.
Jao, T.C., Jung, G.B., Shen, H.L., Yeh, C.C. & Su, Y.J. 2013. Ultrasonic spray coating for proton exchange membrane fuel cell. Open Journal of Acoustics 3: 33-37.
Kilner, J.A., Skinner, S.J., Irvine, S.J.C. & Edwards, P.P. 2012. Functional Materials for Sustainable Energy Applications. Cambridge: Woodhead Publishing.
Köhler, J. & Bänisch, V. 2005. U.S. Patent No. 6,844,286. Washington, DC: U.S. Patent and Trademark Office.
Kulkarni, N.P. 2011. Design and development of manufacturing methods for manufacturing of PEM fuel cell MEA’s. Master
Thesis. Missouri University of Science and Technology (Unpublished).
Kwak, S.H., Peck, D.H., Chun, Y.G., Kim, C.S. & Yoon, K.H. 2001. New fabrication method of the composite membrane for polymer electrolyte membrane fuel cell. Journal of New Materials for Electrochemical Systems 4(1): 25-30.
Lin, J.C., Kunz, H.R., Fenton, J.M. & Fenton, S.S. 2003. The fuel cell-An ideal chemical engineering undergraduate experiment. Proceedings of the 2003 American Society for Engineering Education Annual Conference & Exposition. pp. 1-12.
Material Safety Data Sheet Ethylene glycol (MSDS). 2017. http://www.sciencelab.com/msds.php?msdsId=9927167.
Mehmood, A. & Ha, H.Y. 2013. Parametric investigation of a high-yield decal technique to fabricate membrane electrode assemblies for direct methanol fuel cells. International Journal of Hydrogen Energy 38(28): 12427-12437.
Mehta, V. & Cooper, J.S. 2003. Review and analysis of PEM fuel cell design and manufacturing. Journal of Power Sources 114(1): 32-53.
Mench, M.M. 2008. Performance characterization of fuel cell systems. In Fuel Cell Engines. New York: John Wiley & Sons. pp. 121-190.
Park, I.S., Li, W. & Manthiram, A. 2010. Fabrication of catalyst-coated membrane-electrode assemblies by doctor blade method and their performance in fuel cells. Journal of Power Sources 195(20): 7078-7082.
Passalacqua, E., Lufrano, F., Squadrito, G., Patti, A. & Giorgi, L. 2001. Nafion content in the catalyst layer of polymer electrolyte fuel cells: Effects on structure and performance. Electrochimica Acta 46(6): 799-805.
Ranney, C. 2008. Effects of temperature and solvent activity on the viscoelastic response of Nafion for PEM fuel cells. Chemical Engineering. Princeton: Princeton University. pp. 1-62.
Saha, M.S., Paul, D.K., Peppley, B.A. & Karan, K. 2010. Fabrication of catalyst-coated membrane by modified decal transfer technique. Electrochemistry Communications 12(3): 410-413.
Song, W., Yu, H., Hao, L., Miao, Z., Yi, B. & Shao, Z. 2010. A new hydrophobic thin film catalyst layer for PEMFC. Solid State Ionics 181(8-10): 453-458.
Taylor, A.D., Kim, E.Y., Humes, V.P., Kizuka, J. & Thompson, L.T. 2007. Inkjet printing of carbon supported platinum 3-D catalyst layers for use in fuel cells. Journal of Power Sources 171(1): 101-106.
Thanasilp, S. & Hunsom, M. 2010. Effect of MEA fabrication techniques on the cell performance of Pt-Pd/C electrocatalyst for oxygen reduction in PEM fuel cell. Fuel 89(12): 3847-3852.
Ticianelli, E.A., Derouin, C.R., Redondo, A. & Srinivasan, S. 1988. Methods to advance technology of proton exchange membrane fuel cells. Journal of the Electrochemical Society 135(9): 2209-2214.
Yang, C., Srinivasan, S., Bocarsly, A.B., Tulyani, S. & Benziger, J.B. 2004. A comparison of physical properties and fuel cell performance of Nafion and zirconium phosphate/Nafion composite membranes. Journal of Membrane Science 237(1-2): 145-161.
Yang, T.H., Yoon, Y.G., Park, G.G., Lee, W.Y. & Kim, C.S. 2004. Fabrication of a thin catalyst layer using organic solvents. Journal of Power Sources 127(1-2): 230-233.

885
Yudianti, R., Onggo, H. & Syampurwadi, A. 2014. Molecular conformation of Nafion ionomer on electrocatalyst layer prepared by screen printing technique. Int. J. Electrochem. Sci. 9: 3047-3059.
Zhang, J. 2008. Springer Science Business Media, 1.
N. Sabli*, N.A. Abu Bakar & S. Izhar
Department of Chemical and Environmental EngineeringFaculty of EngineeringUniversiti Putra Malaysia43400 UPM Serdang, Selangor Darul EhsanMalaysia
N. Sabli*Institute of Advance Technology (ITMA)Universiti Putra Malaysia43400 UPM Serdang, Selangor Darul EhsanMalaysia
H.S. HilalSSERL, Department of ChemistryAn-Najah N. UniversityNablus, West Bank Palestine
*Corresponding author; email: [email protected]
Received: 22 June 2018Accepted: 16 February 2019