Embed Size (px)
Citation preview

Transport Membrane Condenser for Water and Energy Recovery from Power Plant Flue Gas
FINAL TECHNICAL REPORT
October 1, 2007 to March 31, 2012
by
Dexin Wang
Report Issued June 2012
DOE Award Number DE‐NT0005350
Gas Technology Institute 1700 S Mount Prospect Rd
Des Plaines, IL 60016
ii
Disclaimer
"This report was prepared as an account of work sponsored by an agency of the
United States Government. Neither the United States Government nor any agency
thereof, nor any of their employees, makes any warranty, express or implied, or
assumes any legal liability or responsibility for the accuracy, completeness, or
usefulness of any information, apparatus, product, or process disclosed, or represents
that its use would not infringe privately owned rights, Reference herein to any specific
commercial product, process, or service by trade name, trademark, manufacturer, or
otherwise does not necessarily constitute or imply its endorsement, recommendation, or
favoring by the United States Government or any agency thereof, The views and
opinions of authors expressed herein do not necessarily state or reflect those of United
States Government or any agency thereof."
iii
ACKNOWLEDGEMENTS
In addition to the U.S. Department of Energy, the authors of this report are
extremely grateful to Illinois Clean Coal Institute for supporting this project.
The authors are grateful to Dr. Paul Liu, and Dr. Richard Ciora, Jr. from Media
and Process Technology Inc.; and Dr. Zhanhua Ma and Dr. Heyang Wang from
SmartBurn LLC for supporting this project.
The authors are also grateful to the members of Gas Technology Institute project
team, which includes Mr. Walter Kunc, Dr. John Wagner and Dr. Ainan Bao.
iv
ABSTRACT
The new waste heat and water recovery technology based on a nanoporous ceramic
membrane vapor separation mechanism has been developed for power plant flue gas
application. The recovered water vapor and its latent heat from the flue gas can increase the
power plant boiler efficiency and reduce water consumption. This report describes the
development of the Transport Membrane Condenser (TMC) technology in details for power
plant flue gas application. The two‐stage TMC design can achieve maximum heat and water
recovery based on practical power plant flue gas and cooling water stream conditions. And the
report includes:
• Two‐stage TMC water and heat recovery system design based on potential host
power plant coal fired flue gas conditions.
• Membrane performance optimization process based on the flue gas conditions, heat
sink conditions, and water and heat transport rate requirement.
• Pilot‐Scale Unit design, fabrication and performance validation test results.
Laboratory test results showed the TMC system can exact significant amount of
vapor and heat from the flue gases. The recovered water has been tested and
proved of good quality, and the impact of SO2 in the flue gas on the membrane has
been evaluated.
• The TMC pilot‐scale system has been field tested with a slip stream of flue gas in a
power plant to prove its long term real world operation performance.
• A TMC scale‐up design approach has been investigated and an economic analysis of
applying the technology has been performed.

v
Table of Content
CHAPTER 1 Introduction ....................................................................................................................... 1‐1
Background ........................................................................................................................................ 1‐1
TMC Technology Concept and Development History ........................................................................ 1‐3
Project Description............................................................................................................................. 1‐7
CHAPTER 2 Coal Power Plant Flue Gas Evaluation and TMC Concept Design ...................................... 2‐1
Introduction ....................................................................................................................................... 2‐1
Power Plant Flue Gas Condition Analysis ........................................................................................... 2‐1
A Two‐stage TMC Concept Design for Power Plant Water/Steam Cycle ........................................... 2‐6
Summary ............................................................................................................................................ 2‐8
CHAPTER 3 TMC Membrane Performance Evaluation and Selection ................................................... 3‐1
Introduction ....................................................................................................................................... 3‐1
Experimental Apparatus .................................................................................................................... 3‐1
Result Discussions .............................................................................................................................. 3‐3
CHAPTER 4 Pilot‐Scale TMC Design, Fabrication and Performance Test .............................................. 4‐1
Introduction ....................................................................................................................................... 4‐1
System Design and Fabrication .......................................................................................................... 4‐1
Pilot‐Scale Unit Performance Test ..................................................................................................... 4‐4
CHAPTER 5 Pilot‐Scale TMC Field Testing at a Power Plant .................................................................. 5‐1
Introduction ....................................................................................................................................... 5‐1
TMC Field Test System Setup ............................................................................................................. 5‐1
Field Test Results ............................................................................................................................... 5‐4
Summary ............................................................................................................................................ 5‐8
CHAPTER 6 TMC Waste heat and Water Recovery System Scale‐Up Design Investigation ................. 6‐1
Scale up investigation for a 550MW power plant ............................................................................. 6‐1
CHAPTER 7 Technology Application and Commercialization................................................................ 7‐1
TMC technology application and economic analysis ......................................................................... 7‐2
TMC technology commercialization path .......................................................................................... 7‐6
vi
LIST OF FIGURES
Figure 1‐1: TMC concept schematic ........................................................................................................... 1‐5 Figure 1‐ 2: Water Vapor Transport Mode Effect ...................................................................................... 1‐6 Figure 1‐ 3: Photomicrograph of TMC Membrane Cross‐Section .............................................................. 1‐6 Figure 1‐4: New Membrane Module (left),Version 1.0 and 2.0 TMC Design (middle), and an installed unit for a 200HP boiler (right) ........................................................................................................................... 1‐7 Figure 2‐1: Typical fly ash particle size distribution from a plant using western Elk Coal ......................... 2‐6 Figure 2‐2: Power Plant Flue Gas Heat and Water Recovery with a Two‐Stage TMC ............................... 2‐8 Figure 3‐1: Lab TMC module performance test setup ............................................................................... 3‐2 Figure 3‐2: Lab size TMC module with Garolite material and new adhesive ............................................ 3‐2 Figures 3‐3 Water transport rate vs. inlet flue gas temperature ............................................................... 3‐4 Figures 3‐4 Water transport rate vs. water inlet temperature and water flow rate. ............................... 3‐4 Figures 3‐5 Water transport rate under different vacuums ...................................................................... 3‐5 Figure 3‐6: TMC/Stage 1 different membrane pore size effect on water transfer .................................... 3‐6 Figure 3‐7: TMC/Stage 1 different membrane pore size effect on heat transfer ...................................... 3‐6 Figure 3‐8: High moisture flue gas effect on water transport ................................................................... 3‐7 Figure 3‐9: High moisture flue gas effect on heat transfer ........................................................................ 3‐7 Figure 3‐10: Different membrane pore size effect on water transport ..................................................... 3‐8 Figure 3‐11: Different membrane pore size effect on heat recovery ........................................................ 3‐9 Figure 3‐12: Photograph of the membranes following fouling test. ...................................................... 3‐11 Figure 3‐13: Photograph of black debris on the membranes following fouling test. ............................. 3‐12 Figure 4‐1: TMC test setup layout drawing (boiler and economizer are not shown) ................................ 4‐2 Figure 4‐2: Long TMC module designed and made for utility boiler application ...................................... 4‐2 Figure 4‐3: pilot‐scale TMC unit test system with the boiler on the right side ......................................... 4‐3 Figure 4‐4: a close‐up view of the TMC pilot unit ...................................................................................... 4‐3 Figure 4‐5: Different pore size membrane modules used for different TMC test settings ....................... 4‐6 Figure 4‐6: Stage 1 water average temperature effect for different TMC settings ................................... 4‐7 Figure 4‐7: Stage 2 water average temperature effect for different TMC settings ................................... 4‐7 Figure 4‐8: Stage 1 water inlet temperature effect for different TMC settings ........................................ 4‐8 Figure 4‐9: Stage 1 water average temperature effect for different TMC settings ................................... 4‐9 Figure 4‐10: Stage 2 water average temperature effect for different TMC settings ................................. 4‐9 Figure 4‐11: Stage 1 water flow rate effect ............................................................................................. 4‐11 Figure 4‐12: Stage 1 water inlet temperature effect ............................................................................... 4‐11 Figure 4‐13: Stage 2 water flow rate effect ............................................................................................. 4‐12 Figure 4‐14: Stage 2 water inlet temperature effect ............................................................................... 4‐12 Figure 4‐15: Flue gas inlet temperature effect. ...................................................................................... 4‐13 Figure 4‐16: Flue gas inlet moisture content effect ................................................................................. 4‐13 Figure 4‐17: Stage 1 average temperature effect .................................................................................... 4‐14 Figure 4‐18: Stage 2 average temperature effect .................................................................................... 4‐14 Figure 4‐19: Stage 1 heat transfer coefficient vs. flow rate ..................................................................... 4‐15 Figure 4‐20: Stage 2 heat transfer coefficient vs. flow rate ..................................................................... 4‐15
vii
Figure 4‐21: Stage 1 water flow rate effect on heat recovery ................................................................. 4‐16 Figure 4‐22: Stage 1 water inlet temperature effect on heat recovery ................................................... 4‐16 Figure 4‐23: Stage 2 water flow rate effect on heat recovery ................................................................... 17 Figure 4‐24: Stage 2 water inlet temperature effect on heat recovery ...................................................... 17 Figure 4‐25: Flue gas inlet temperature effect on heat recovery ............................................................... 18 Figure 4‐26: Flue gas inlet moisture content effect on heat recovery ....................................................... 18 Figure 4‐27: Stage 1 water average temperature effect for heat recovery ............................................ 4‐19 Figure 4‐28: Stage 2 water average temperature effect for heat recovery ............................................ 4‐19 Figure 4‐29: Stage 1 water average temperature effect before and after SO2 injection ........................ 4‐22 Figure 4‐30: Stage 2 water average temperature effect before and after SO2 injection ........................ 4‐22 Figure 4‐31: Stage 1 water average temperature effect before and after SO2 injection at high moisture content ..................................................................................................................................................... 4‐23 Figure 4‐32: Stage 2 water average temperature effect before and after SO2 injection at high moisture content ..................................................................................................................................................... 4‐23 Figure 5‐2: picture of the test system installation location before installation ........................................ 5‐3 Figure 5‐3: Pilot unit in the field: left shows in installation, right shows in testing with a tent ................ 5‐4 Figure 5‐4: Flue gas pressure drop through the pilot unit for the whole long term test period ............... 5‐5 Figure 5‐5: The pilot unit overall water recovery rate for the long term test period ................................ 5‐6 Figure 5‐6: the pilot unit overall heat recovery rate for the long term test period .................................. 5‐6 Figure 5‐7: Water transport rates at the beginning and at the end of the long term field test ................ 5‐7 Figure 5‐7: Laboratory test and field test TMC performance comparison ................................................ 5‐8 Figure 6‐1: TMC module arrangement in one of the 550 MW unit flue gas ductwork ............................. 6‐2 Figure 6‐2: Power Plant Flue Gas Water Recovery with a Two‐Stage TMC ............................................... 6‐3 Figure 7‐1: Water usage in a coal fired power plant (source: NETL) ......................................................... 7‐3
viii
LIST OF TABLES
Table 2‐1: Typical flue gas composition for a FGD unit ............................................................................. 2‐3 Table 2‐2:Typical coal power plant operation information ....................................................................... 2‐4 Table 2‐3: Condensate and cooling water streams for several coal power plants .................................... 2‐5 Table 3‐1: membrane transport rate changes after 100 hour fouling test with natural gas flue ........... 3‐10 Table 3‐2: membrane transport rate changes after 100 hour test with 200ppm SO2 flue gas .............. 3‐12 Table 4‐1: Two stage TMC lab test results ................................................................................................. 4‐5 Table 4‐1: Water Quality Testing without SO2 ........................................................................................ 4‐21 Table 4‐2: Water Quality Testing with 250ppm SO2 ............................................................................... 4‐21 Table 5‐1: Host site flue gas components by measurement ..................................................................... 5‐4 Table 5‐2 Water Chemical Analysis ............................................................................................................ 5‐7 Table 6‐1: A 550 MW boiler operating condition ...................................................................................... 6‐1 Table 7‐1: FGD make up water calculation ................................................................................................ 7‐3 Table 7‐2: Dilution water calculation ......................................................................................................... 7‐4 Table 7‐3: TMC system cost benefit analysis ............................................................................................. 7‐5
ix
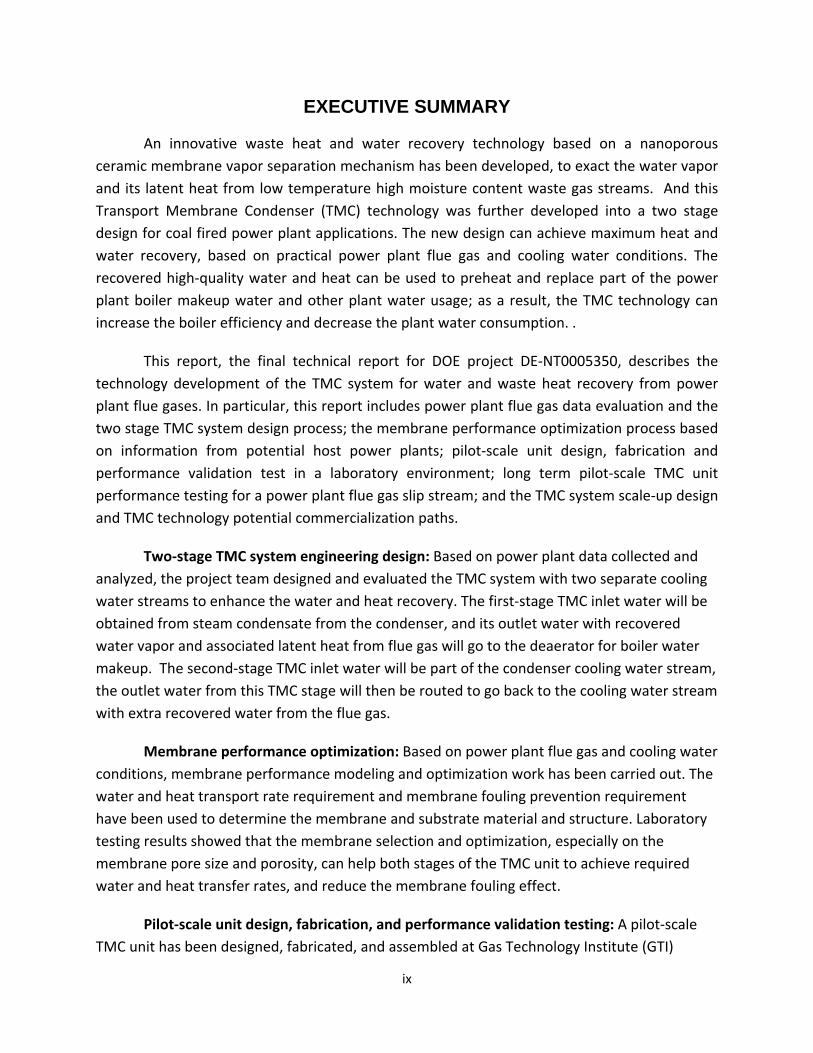
EXECUTIVE SUMMARY
An innovative waste heat and water recovery technology based on a nanoporous ceramic membrane vapor separation mechanism has been developed, to exact the water vapor and its latent heat from low temperature high moisture content waste gas streams. And this Transport Membrane Condenser (TMC) technology was further developed into a two stage design for coal fired power plant applications. The new design can achieve maximum heat and water recovery, based on practical power plant flue gas and cooling water conditions. The recovered high‐quality water and heat can be used to preheat and replace part of the power plant boiler makeup water and other plant water usage; as a result, the TMC technology can increase the boiler efficiency and decrease the plant water consumption. .
This report, the final technical report for DOE project DE‐NT0005350, describes the technology development of the TMC system for water and waste heat recovery from power plant flue gases. In particular, this report includes power plant flue gas data evaluation and the two stage TMC system design process; the membrane performance optimization process based on information from potential host power plants; pilot‐scale unit design, fabrication and performance validation test in a laboratory environment; long term pilot‐scale TMC unit performance testing for a power plant flue gas slip stream; and the TMC system scale‐up design and TMC technology potential commercialization paths.
Two‐stage TMC system engineering design: Based on power plant data collected and analyzed, the project team designed and evaluated the TMC system with two separate cooling water streams to enhance the water and heat recovery. The first‐stage TMC inlet water will be obtained from steam condensate from the condenser, and its outlet water with recovered water vapor and associated latent heat from flue gas will go to the deaerator for boiler water makeup. The second‐stage TMC inlet water will be part of the condenser cooling water stream, the outlet water from this TMC stage will then be routed to go back to the cooling water stream with extra recovered water from the flue gas.
Membrane performance optimization: Based on power plant flue gas and cooling water conditions, membrane performance modeling and optimization work has been carried out. The water and heat transport rate requirement and membrane fouling prevention requirement have been used to determine the membrane and substrate material and structure. Laboratory testing results showed that the membrane selection and optimization, especially on the membrane pore size and porosity, can help both stages of the TMC unit to achieve required water and heat transfer rates, and reduce the membrane fouling effect.
Pilot‐scale unit design, fabrication, and performance validation testing: A pilot‐scale TMC unit has been designed, fabricated, and assembled at Gas Technology Institute (GTI)
x
Combustion Laboratory. A test setup was also configured at GTI for the TMC laboratory testing, which includes a 3‐million‐But/hr natural gas‐fired boiler and gas component simulation system to match coal‐fired flue gas components. The performance validation testing results showed the TMC system, at the specific parametric ranges based on potential host power plant conditions, can recover a significant amount of water and heat. The water quality testing, high vapor concentration flue gas testing and flue gas spiked with SO2 testing also validated the TMC system performance at various conditions.
Pilot‐scale unit field long term testing: The pilot‐scale unit with full instrumentation and control was installed at a host power plant at Baltimore, MD. A slip stream of the coal‐fired flue gas was used for the continuous five‐week testing. The results demonstrated the TMC water and heat recovery system can achieve stable and reliable performance under a real world operating conditions.
Scale‐up Design and TMC Technology Commercialization Path: A system scale‐up evaluation has been carried out for a typical 550 MW power plant, with potential integration strategy into the plant water loop. The TMC technology application in a power plant and its potential economic impact has been analyzed, and the technology preliminary commercialization path has been outlined.
1‐1
CHAPTER 1 Introduction
Background
As fresh water is becoming a less abundant natural resource, retrieving water from
different waste water sources, such as industrial waste water, brackish water, produced water,
as well as sea water, becomes a promising choice to produce fresh water. But these processes
are typically energy intensive, no matter it is a thermal process or a membrane separation
process, therefore they are still not cost competitive for wide commercial use. On the other
hand, there is another waste water source that was not given enough attention, the water
vapor contained in many waste gas streams, which is present in many industrial and power
generation processes. Minimum external energy source will be needed to recover these water
because they themselves are already at high energy status. Also, the water vapor latent heat of
these waste gas streams, is substantial compared with the sensible heat associated with the
temperatures of these streams; these vapor can release significant amount of heat when
turned to liquid phase. As a result, recovery of these waste water vapors can also greatly
improve the overall industrial process thermal efficiency.
For instance, a large portion of energy consumed today comes from hydrocarbon fuel
combustion, and one of the major combustion products of this combustion is water vapor [1].
For a coal‐fired power plant boiler equipped with a wet Flue Gas Desulfurization (FGD) unit, flue
gas exits at 160 to 180°F with nearly 100% relative humidity, contains about 40% in volume of
water vapor. For a coal‐fired power plant boiler with a dry FGD, the flue gas moisture content is
still comparable with the industrial gas‐fired flue gas, with a dew point at 130 to 140°F, or about
20% in volume of water vapor in the flue gas stream. If 40 to 60% of this water vapor and its
latent heat could be recovered and reused, the plant thermal efficiency can be significantly
improved besides the water recovery benefit.
Until now, there has been no practical commercial technology available for recovering
waste heat and water vapor from the power plant flue gases. Condensing flue gas moisture by
simply removing heat in a heat exchanger presents the problem of a large surface area

1‐2
requirement for the low‐temperature flue gas, and also raises the issue of equipment corrosion
by the acidic condensate. The recovered water needs further treatment before it can be used
for any other processes, due to the high acidity and other contaminates that may present in the
water.
Gas Technology Institute (GTI) has developed a new technology based on a nanoporous
ceramic separation membrane to extract a portion of the water vapor and its latent heat from
flue gases and return the recovered water and heat to the steam cycle. This is achieved
through the use of its patented Transport Membrane Condenser (TMC). Water vapor
condenses and passes through the membrane, which has the permeate side in direct contact
with a low‐temperature water stream. Contaminants such as CO2, O2, NOx, and SO2 are
inhibited from passing through the membrane by its high selectivity. The recovered water is of
high quality and mineral free, therefore can be used as supplemental makeup water for other
processes. The TMC has been developed and proven at industrial demonstration scale for gas‐
fired package boilers and commercial laundry application, and already commercialized. The
TMC technology was developed by GTI as a key component for high‐efficiency Super Boiler
program, which was sponsored by the United States Department of Energy (DOE) and other
industrial sponsors started in 2000.
This project aimed at developing a new two‐stage TMC design for recovering water
vapor and its latent heat from power plant flue gases. The new two‐stage TMC seeks to achieve
maximum heat and water recovery. The recovered high‐purity water and heat can be used
directly to replace power plant boiler makeup water to improve its efficiency, and any
remaining recovered water can be used for FGD water makeup or other plant uses. The TMC
technology will be particularly beneficial to coal‐fired power plants that use high‐moisture coals
and/or FGD for flue gas cleanup. The TMC can be used to process high‐moisture flue gas from
the FGD to recover its water vapor and latent heat to increase boiler efficiency and decrease its
water consumption.
The economic benefits of water vapor removal from flue gas are substantial. GTI
calculates a reduction in the flue gas dew point from 140°F down to 100°F, which corresponds
to recovering 84 lb/h water per 1 million Btu/h firing rate. For the year 2000, the net U.S.

1‐3
electric power generation was 3,802 billion kWh, of which coal‐fired generation was 1,966
billion kWh, and natural gas‐fired generation was another 613 billion kWh. [2] Because this
water recovery technology could be used for both coal‐ and gas‐fired power plants, up to 2,579
billion kWh of capacity could be impacted by this technology. Assuming 35% baseline fuel‐to‐
electricity efficiency, the total firing rate is estimated at 25 trillion Btu/h. The corresponding
total water saving, if this technology were applied to all U.S. power generation, would be 8.3
billion tons per year. At a typical treated water price of $0.52/ton [3], the total annual U.S. cost
saving in water alone would be $4.3 billion/year. Additionally, the use of TMC can increase
boiler thermal efficiency by 0.1‐0.2% as described above by recovering the water vapor latent
heat. This efficiency increase would increase power output by 3.0 billion kWh nationwide.
TMC Technology Concept and Development History
Membrane separation technology has been used commercially for many years for gas
separation and liquid filtration, and features low energy cost and high separation ratio
compared with competing separation methods. There are two kinds of membranes, porous and
non‐porous. For porous membranes, the pore size is normally in the sub‐micron (nanoporous)
range, and varies for different applications. To achieve a good separation ratio with a porous
membrane for gaseous species, including the separation of water vapor from flue gas, the
typical pore size must be less than 50 nm. Water vapor transport through a porous ceramic
membrane must follow some combination of the following four modes: Knudsen diffusion,
surface diffusion, capillary condensation, and molecular sieving.
For water vapor, molecular sieving mode can only occur when the pore size of
membrane is smaller than 1 nm. The pore size used in the TMC is 4 nm and larger, so this mode
does not apply. This operating mode can achieve high separation ratio, but the permeate flux is
too low for bulk separation applications. For the Knudsen and surface diffusion modes, water
vapor passes through the membrane pores essentially in the gas phase, as can many other gas
components, but the water vapor molecules transport faster because of their lower molecular
weight. Water vapor separation ratio in these modes is not high. The permeate flux is also too
low at the water vapor partial pressure difference presented in the flue gas.

1‐4
But when one of the gas components is a condensable vapor and the pores are small,
capillary condensation can occur. In this case, the condensate can block gas phase diffusion
through the pores, allowing only the condensed phase to pass through. The Kelvin equation
predicts that condensation can occur in small pores even though the partial pressure of that
component is below its vapor pressure. In most cases, capillary condensation begins to occur at
50‐80% of the saturation vapor pressure—which in the case of water is equal to relative
humidity—because of the surface tension in the pores. As a result, the pores can be completely
filled with condensed water. The flux of other components in the flue gas through the
membrane will be very small, limited by their solubility in water and by the limited mobility of
solvated molecules. Thus, a very high separation ratio can be achieved for water vapor. Also,
under the same pressure difference across the membrane, H2O mass transport rate in liquid
phase can be as high as 40 times the rate in the gas phase. This is mainly due to the more than a
thousand‐fold difference of their densities, although viscosity change adversely affects liquid
transport, but much less than the favorable effect of density. The above evidence proves that
membrane water vapor separation in a capillary condensation mode can promote both a high
transport rate and a high separation ratio.
GTI has investigated water vapor transport from flue gas using both non‐porous and
porous membranes. The conclusion was that a nanoporous ceramic membrane can achieve
both high water vapor transport rate and high separation ratio when it works at favorable
capillary condensation conditions. For flue gas from natural gas firing, the flue gas moisture
content is typically at 18% in volume for the high hydrogen element content in the fuel. With
coal firing, the moisture produced from combustion itself is usually lower for the lower
hydrogen content of coal. But for high moisture content coals and plants equipped with FGDs,
the flue gas humidity is comparable or much higher than the natural gas firing flue gas. This
provides a favorable condition for extracting water vapor from their flue gases. In the TMC,
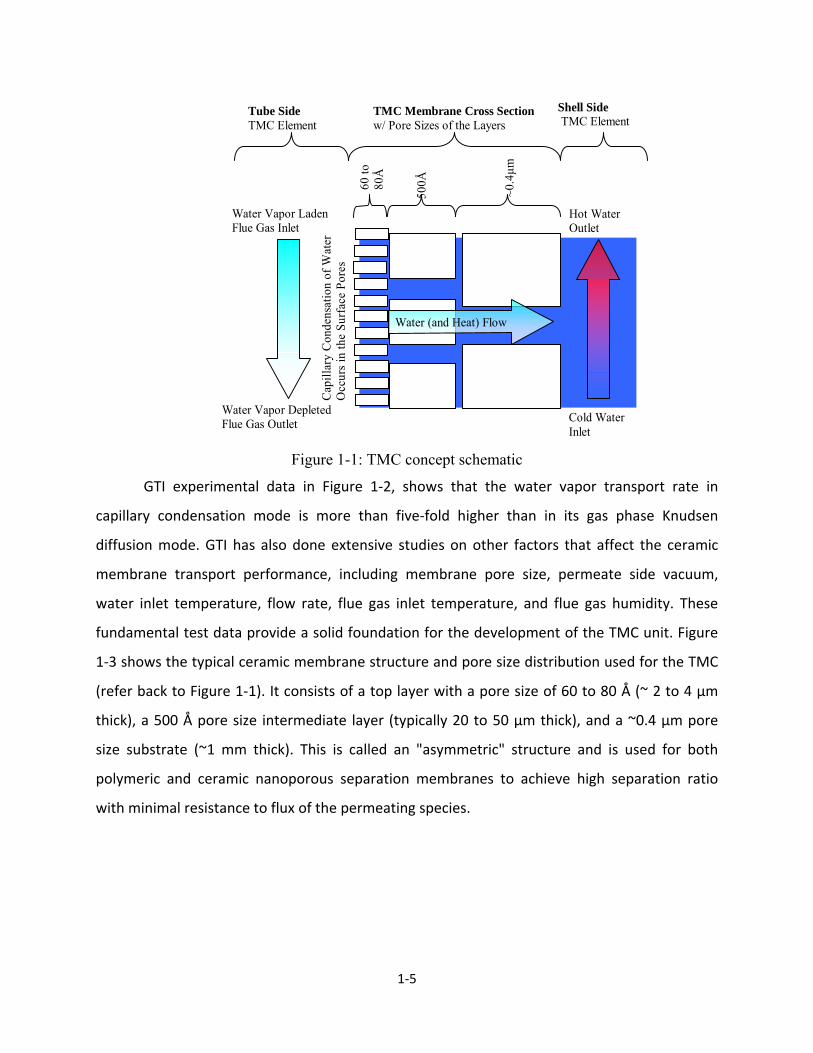
water vapor from flue gas passes through a permselective membrane (Figure 1‐1), and is
condensed by direct contact with low‐temperature water. In this way, the transported water is
recovered along with virtually all of its latent heat. The conditioned flue gas leaves the TMC at a
reduced temperature and relative humidity below saturation.
1‐5
Figure 1-1: TMC concept schematic
GTI experimental data in Figure 1‐2, shows that the water vapor transport rate in
capillary condensation mode is more than five‐fold higher than in its gas phase Knudsen
diffusion mode. GTI has also done extensive studies on other factors that affect the ceramic
membrane transport performance, including membrane pore size, permeate side vacuum,
water inlet temperature, flow rate, flue gas inlet temperature, and flue gas humidity. These
fundamental test data provide a solid foundation for the development of the TMC unit. Figure
1‐3 shows the typical ceramic membrane structure and pore size distribution used for the TMC
(refer back to Figure 1‐1). It consists of a top layer with a pore size of 60 to 80 Å (~ 2 to 4 µm
thick), a 500 Å pore size intermediate layer (typically 20 to 50 µm thick), and a ~0.4 µm pore
size substrate (~1 mm thick). This is called an "asymmetric" structure and is used for both
polymeric and ceramic nanoporous separation membranes to achieve high separation ratio
with minimal resistance to flux of the permeating species.
Water Vapor Laden Flue Gas Inlet
Water Vapor Depleted Flue Gas Outlet
60 to
80
Å
500Å
~0.4μm
Tube Side TMC Element
Shell Side TMC Element
Cold Water Inlet
Hot Water Outlet
TMC Membrane Cross Sectionw/ Pore Sizes of the Layers
Cap
illar
y C
onde
nsat
ion
of W
ater
O
ccur
s in
the
Surf
ace
Pore
s Water (and Heat) Flow

1‐6
Figure 1- 2: Water Vapor Transport Mode Effect
Figure 1- 3: Photomicrograph of TMC Membrane Cross-Section
GTI has already demonstrated the use of the TMC in four industrial gas‐fired boilers for
long‐term operations, with the first unit being in continuous operation for nearly three years
with no detectable performance degradation. The customer has confirmed 12% fuel saving and
20% makeup water saving. However, economic analysis showed that the earlier version of the
TMC (version 1.0) was too expensive to manufacture, assemble, and maintain. As a result, GTI
has developed a version 2.0 design of the TMC for industrial and commercial boilers with more
cost‐effective characteristics. With water flowing inside the tubes, the water side management
allows a more flexible design, with the TMC to be designed with several passes (Figure 1‐4
shows a three‐pass design). Hot water can be pumped out from the lower section of the TMC
instead of the upper section, which results in simplified water level controls. Another
important advantage of the new design is that flue gas now flows upwards instead of
Flue Gas Temperature (oF)
Per
mea
teFl
ux(lb
/ft2 -h
)
130 140 150 160 170 180 190 2000
0.1
0.2
0.3
0.4
0.5
0.6
0.7
0.8
0.9
1
Capillary condensationDiffusion transport
p y
1‐7
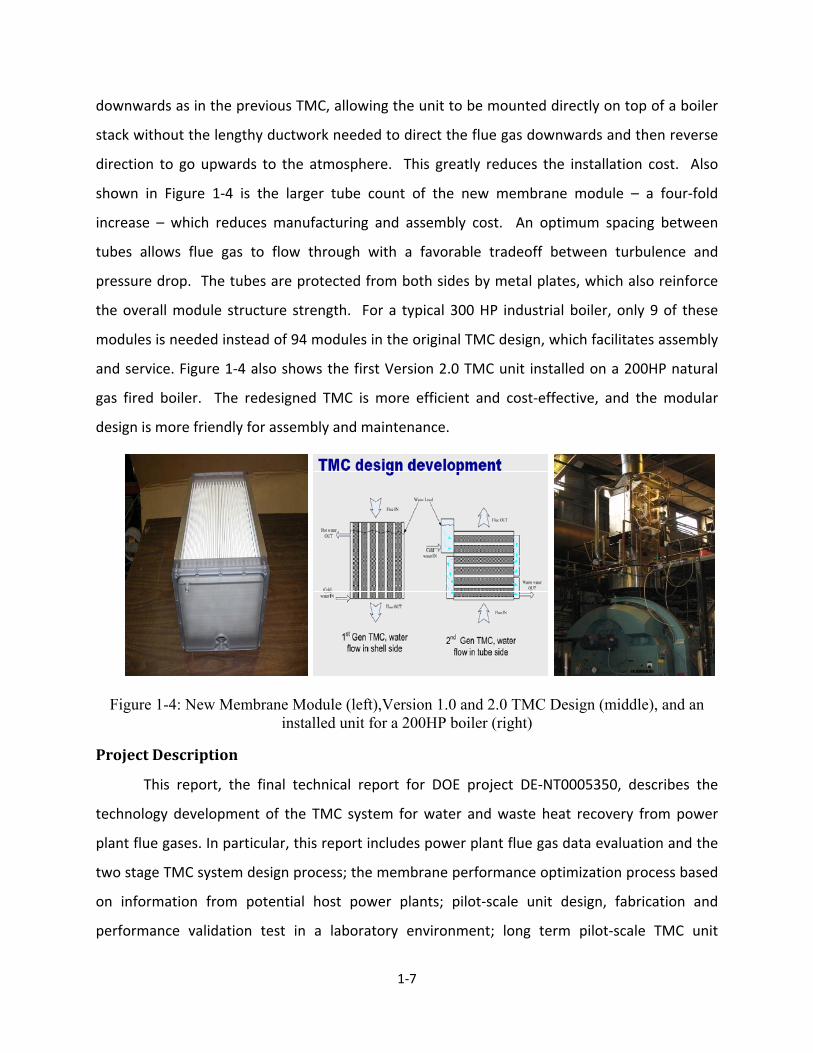
downwards as in the previous TMC, allowing the unit to be mounted directly on top of a boiler
stack without the lengthy ductwork needed to direct the flue gas downwards and then reverse
direction to go upwards to the atmosphere. This greatly reduces the installation cost. Also
shown in Figure 1‐4 is the larger tube count of the new membrane module – a four‐fold
increase – which reduces manufacturing and assembly cost. An optimum spacing between
tubes allows flue gas to flow through with a favorable tradeoff between turbulence and
pressure drop. The tubes are protected from both sides by metal plates, which also reinforce
the overall module structure strength. For a typical 300 HP industrial boiler, only 9 of these
modules is needed instead of 94 modules in the original TMC design, which facilitates assembly
and service. Figure 1‐4 also shows the first Version 2.0 TMC unit installed on a 200HP natural
gas fired boiler. The redesigned TMC is more efficient and cost‐effective, and the modular
design is more friendly for assembly and maintenance.
Figure 1-4: New Membrane Module (left),Version 1.0 and 2.0 TMC Design (middle), and an installed unit for a 200HP boiler (right)
Project Description
This report, the final technical report for DOE project DE‐NT0005350, describes the
technology development of the TMC system for water and waste heat recovery from power
plant flue gases. In particular, this report includes power plant flue gas data evaluation and the
two stage TMC system design process; the membrane performance optimization process based
on information from potential host power plants; pilot‐scale unit design, fabrication and
performance validation test in a laboratory environment; long term pilot‐scale TMC unit
1‐8
performance testing for a power plant flue gas slip stream; and the TMC system scale‐up design
and TMC technology potential commercialization paths.
Two‐stage TMC system engineering design: Based on power plant data collected and
analyzed, the project team designed and evaluated the TMC system with two separate cooling
water streams to enhance the water and heat recovery. The first‐stage TMC inlet water will be
obtained from steam condensate from the condenser, and its outlet water with recovered
water vapor and associated latent heat from flue gas will go to the deaerator for boiler water
makeup. The second‐stage TMC inlet water will be part of the condenser cooling water stream,
the outlet water from this TMC stage will then be routed to go back to the cooling water stream
with extra recovered water from the flue gas.
Membrane performance optimization: Based on power plant flue gas and cooling water
conditions, membrane performance modeling and optimization work has been carried out. The
water and heat transport rate requirement and membrane fouling prevention requirement
have been used to determine the membrane and subtract material and structure. Laboratory
testing results showed that membrane modification and optimization, especially the membrane
pore size and porosity, can provide both stages with required water and heat transfer rates,
and reduce the membrane fouling effect.
Pilot‐scale unit design, fabrication, and performance validation testing: A pilot‐scale
TMC unit has been designed, fabricated, and assembled at Gas Technology Institute (GTI)
Combustion Laboratory. A test setup was also configured at GTI for the TMC laboratory testing,
which includes a 3‐million‐But/h natural gas‐fired boiler and gas component simulation system
to match coal‐fired flue gas components. The performance validation testing results showed
the TMC system, at the specific parametric ranges based on potential host power plant
conditions, can recover significant water and heat. The water quality testing, high vapor
concentration flue gas testing and flue gas spiked with SO2 testing also validated the TMC
system performance at various conditions.
Pilot‐scale unit field long term testing: The pilot‐scale unit with full instrumentation and
control was installed at a host power plant at Baltimore, MD. A slip stream of the coal‐fired flue
1‐9
gas was used for the continuous five‐week testing. The results demonstrated the TMC water
and heat recovery system can achieve stable and reliable performance under a real world
operating conditions.
Scale‐up Design and TMC Technology Commercialization Path: A system scale‐up
evaluation has been carried out for a typical 550 MW power plant, with potential integration
strategy into the plant water loop. The TMC technology application in a power plant and its
potential economic impact has been analyzed, and the technology preliminary
commercialization path has been outlined.
References:
1. J. Boyen, Thermal Energy recovery, JOHN WILEY&SONS, (1980)
2. Bend Research, Research on an Energy‐Efficient Drying Process, DOE Final Report, DOE/ID/12293‐1 (DE 86013369, Feb.25, (1986).
3. I. Rabovister, R. Knight, R. Remick, "Method and Apparatus for Selective Removal of a Condensable Component from a Process Stream with Latent Heat Recovery", U.S. Patent No. 6,517, 607 B2, Feb.11, 2003.
4. A. Bao, D. Wang, and C.X. Lin, "Nanoporous Membrane Tube Condensing Heat Transfer Enhancement Study", IMECE 2011‐63530, Denver, CO, Nov. 11‐17, 2011
5. K. Keizer, R. Uhlhorn, V. Zaspalis and A. Burggraaf, "Transport and Related (Gas and Vapor) Separation in Ceramic Membranes", Key Engineering materials, v.61&62, p. 143‐154, 1991
6. R. Knight, "Compact Package Boiler Combining Ultra‐High‐Efficient and Ultra‐Low Emissions: Development and Demonstration", Natural Gas Technology Conference II, Buena Vista, FL, 2005
7. D. Wang, W. Liss, and A. Bao, "Water Reclamation from High Moisture Content Waste Heat Streams", IMECE 2011‐63513, Denver, CO, Nov. 11‐17, 2011
8. R. Knight, I. Rabovister, D. Wang, "Method and Apparatus for Enhanced Heat Recovery from Stream Generators and Water Heaters", U.S. Patent No. 7,066.396 B2, Jun.27,2006
9. D. Wang, R. Knight, D. Chojnacki, P. Molvie, B. Tynkov, and D. Willems, "Reduce Energy Cost with the Super Boiler", WEEC 2007, Atlanta, GA, August 15‐16, 2007
10. D. Wang, R. Knight, D. Chojnacki, P. Molvie, B. Tynkov, and D. Willems, "Saving Energy with the High Efficiency Super Boiler", Journal of Energy Engineering, Vol. 105, No.3, pp.38‐48, 2008.

2‐1
CHAPTER 2 Coal Power Plant Flue Gas Evaluation and TMC Concept Design
Introduction
In this chapter, the two‐stage TMC heat and water recovery concept has been
developed, modeled, and evaluated by using analytical and numerical methods for coal‐fired
power plant application. Our power industry partner, SmartBurn LLC has provided detailed
coal‐fired power plant data on operations and flue gases, as well as cooling water conditions.
Analysis based on these information was performed for a specific existing plant, and for a
conceptual plant of typical capacity and flow characteristics. The two stage TMC design has
been optimized so that the TMC/stage 1 can recover maximum heat and just enough water for
the boiler makeup, and the TMC/stage2 can recover maximum amount of water.
Power Plant Flue Gas Condition Analysis
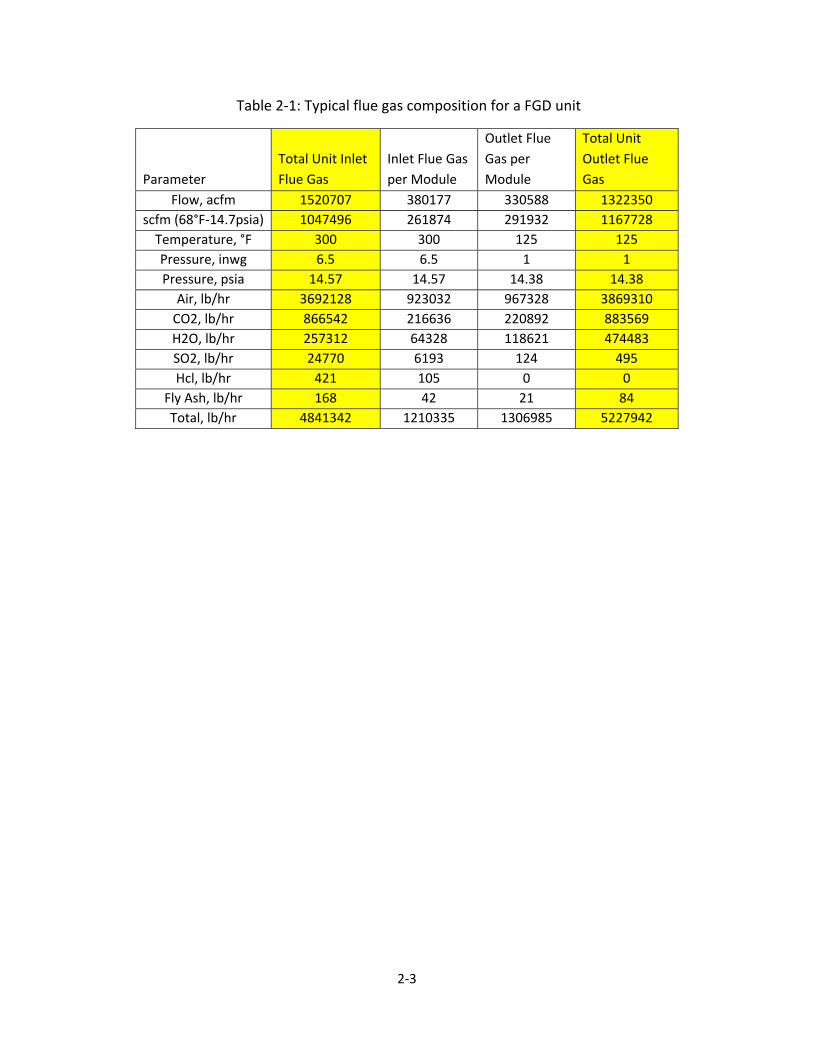
Detailed power plant related data was collected by SmartBurn. Data obtained includes
flue gas parameters (flow rate, temperature, composition, pressure, etc. see Table 2‐1 and 2‐2)
before and after a FGD unit, steam condensate and cooling water parameters (temperature and
flow rate, Table 2‐3), condensate and cooling water parameters (Table 2‐4), potential
demineralized water usage (boiler makeup, heating system losses, bearing cooling, FGD, etc) in
a power plant, and fly ash data (particulate concentration and size, before and after an ESP, see
Figure 2‐1). The purpose of this exercise was to determine the amount of water vapor typically
available from a flue gas stream and estimate a recoverable amount with the available cooling
sources. Additionally, application of this recovered water in the power plant water circuits
besides boiler makeup and cooling water makeup was also identified. This is because the
recovered water is basically mineral free and of high quality, and we should find a better using
place than cooling water makeup. Fly ash data is for identifying if there is any concern of these
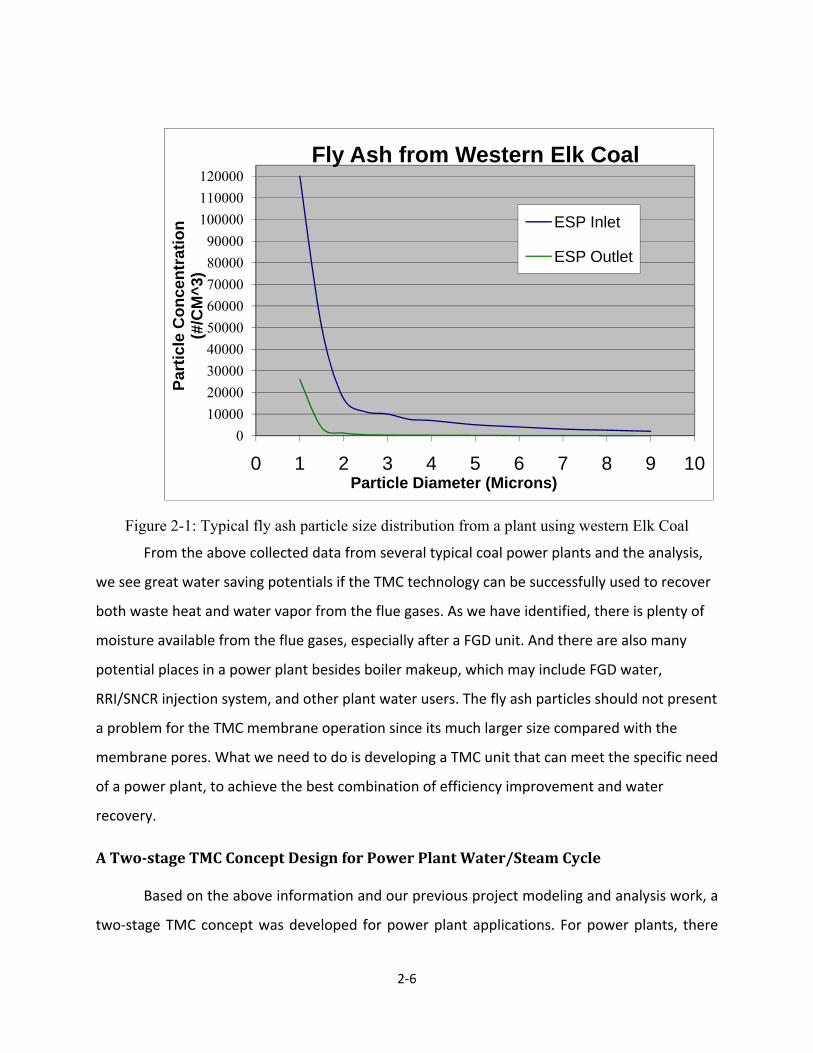
small particulates for membrane fouling. From Figure 2‐1, you can see a fly ash particle size
distribution, they are in the range of 1 to 10 microns after coming out of an ESP. For the TMC
2‐2
membrane pore size is 8 to 25 nanometer, the fly ash will not present any problem to block the
membrane pores, they are simple too large for the pores.
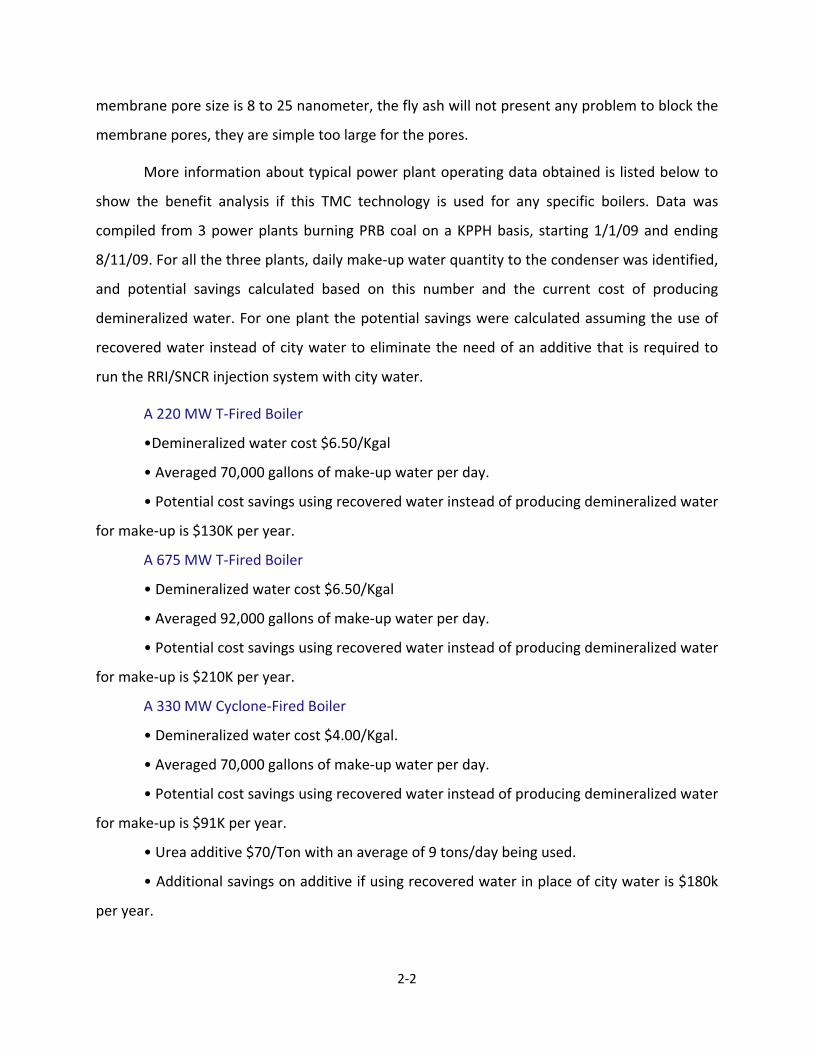
More information about typical power plant operating data obtained is listed below to
show the benefit analysis if this TMC technology is used for any specific boilers. Data was
compiled from 3 power plants burning PRB coal on a KPPH basis, starting 1/1/09 and ending
8/11/09. For all the three plants, daily make‐up water quantity to the condenser was identified,
and potential savings calculated based on this number and the current cost of producing
demineralized water. For one plant the potential savings were calculated assuming the use of
recovered water instead of city water to eliminate the need of an additive that is required to
run the RRI/SNCR injection system with city water.
A 220 MW T‐Fired Boiler
•Demineralized water cost $6.50/Kgal
• Averaged 70,000 gallons of make‐up water per day.
• Potential cost savings using recovered water instead of producing demineralized water
for make‐up is $130K per year.
A 675 MW T‐Fired Boiler
• Demineralized water cost $6.50/Kgal
• Averaged 92,000 gallons of make‐up water per day.
• Potential cost savings using recovered water instead of producing demineralized water
for make‐up is $210K per year.
A 330 MW Cyclone‐Fired Boiler
• Demineralized water cost $4.00/Kgal.
• Averaged 70,000 gallons of make‐up water per day.
• Potential cost savings using recovered water instead of producing demineralized water
for make‐up is $91K per year.
• Urea additive $70/Ton with an average of 9 tons/day being used.
• Additional savings on additive if using recovered water in place of city water is $180k
per year.
2‐3
Table 2‐1: Typical flue gas composition for a FGD unit
Parameter Total Unit Inlet Flue Gas
Inlet Flue Gas per Module
Outlet Flue Gas per Module
Total Unit Outlet Flue Gas
Flow, acfm 1520707 380177 330588 1322350 scfm (68°F‐14.7psia) 1047496 261874 291932 1167728 Temperature, °F 300 300 125 125 Pressure, inwg 6.5 6.5 1 1 Pressure, psia 14.57 14.57 14.38 14.38 Air, lb/hr 3692128 923032 967328 3869310 CO2, lb/hr 866542 216636 220892 883569 H2O, lb/hr 257312 64328 118621 474483 SO2, lb/hr 24770 6193 124 495 Hcl, lb/hr 421 105 0 0
Fly Ash, lb/hr 168 42 21 84 Total, lb/hr 4841342 1210335 1306985 5227942
2‐4
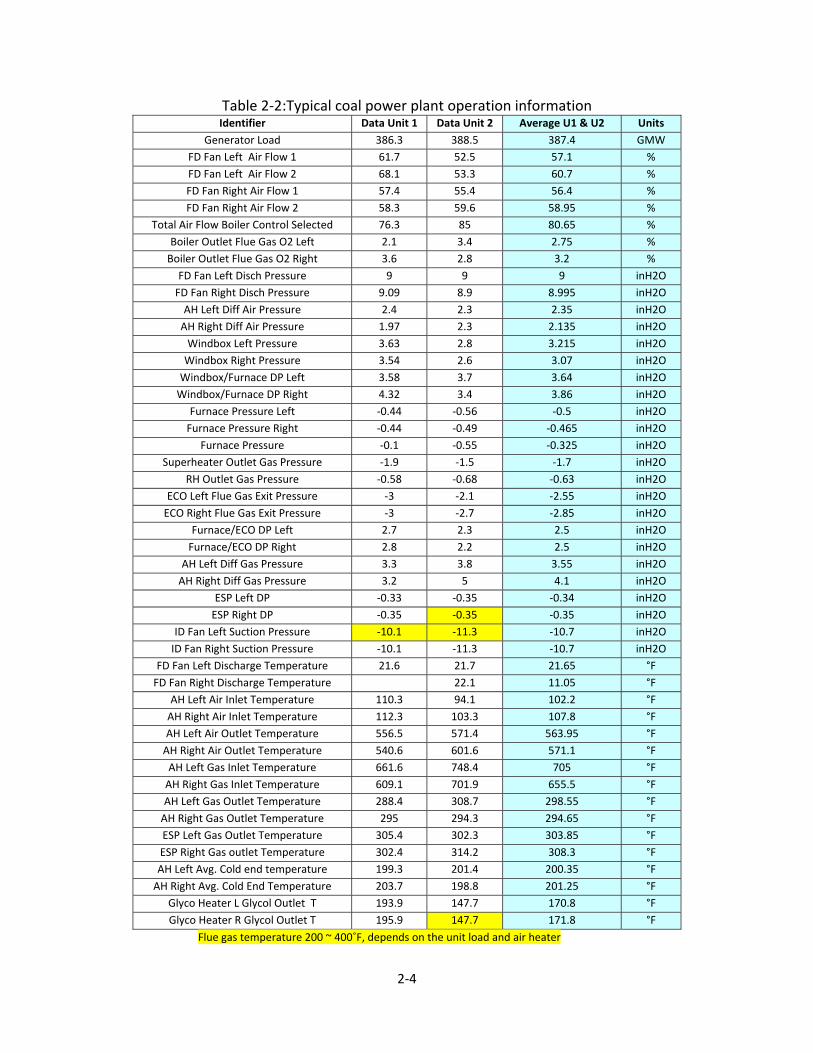
Table 2‐2:Typical coal power plant operation information Identifier Data Unit 1 Data Unit 2 Average U1 & U2 Units
Generator Load 386.3 388.5 387.4 GMWFD Fan Left Air Flow 1 61.7 52.5 57.1 %FD Fan Left Air Flow 2 68.1 53.3 60.7 %FD Fan Right Air Flow 1 57.4 55.4 56.4 %FD Fan Right Air Flow 2 58.3 59.6 58.95 %
Total Air Flow Boiler Control Selected 76.3 85 80.65 %Boiler Outlet Flue Gas O2 Left 2.1 3.4 2.75 %Boiler Outlet Flue Gas O2 Right 3.6 2.8 3.2 %FD Fan Left Disch Pressure 9 9 9 inH2OFD Fan Right Disch Pressure 9.09 8.9 8.995 inH2OAH Left Diff Air Pressure 2.4 2.3 2.35 inH2OAH Right Diff Air Pressure 1.97 2.3 2.135 inH2OWindbox Left Pressure 3.63 2.8 3.215 inH2OWindbox Right Pressure 3.54 2.6 3.07 inH2OWindbox/Furnace DP Left 3.58 3.7 3.64 inH2OWindbox/Furnace DP Right 4.32 3.4 3.86 inH2O
Furnace Pressure Left ‐0.44 ‐0.56 ‐0.5 inH2OFurnace Pressure Right ‐0.44 ‐0.49 ‐0.465 inH2O
Furnace Pressure ‐0.1 ‐0.55 ‐0.325 inH2OSuperheater Outlet Gas Pressure ‐1.9 ‐1.5 ‐1.7 inH2O
RH Outlet Gas Pressure ‐0.58 ‐0.68 ‐0.63 inH2OECO Left Flue Gas Exit Pressure ‐3 ‐2.1 ‐2.55 inH2OECO Right Flue Gas Exit Pressure ‐3 ‐2.7 ‐2.85 inH2O
Furnace/ECO DP Left 2.7 2.3 2.5 inH2OFurnace/ECO DP Right 2.8 2.2 2.5 inH2O
AH Left Diff Gas Pressure 3.3 3.8 3.55 inH2OAH Right Diff Gas Pressure 3.2 5 4.1 inH2O
ESP Left DP ‐0.33 ‐0.35 ‐0.34 inH2OESP Right DP ‐0.35 ‐0.35 ‐0.35 inH2O
ID Fan Left Suction Pressure ‐10.1 ‐11.3 ‐10.7 inH2OID Fan Right Suction Pressure ‐10.1 ‐11.3 ‐10.7 inH2O
FD Fan Left Discharge Temperature 21.6 21.7 21.65 °FFD Fan Right Discharge Temperature 22.1 11.05 °F
AH Left Air Inlet Temperature 110.3 94.1 102.2 °FAH Right Air Inlet Temperature 112.3 103.3 107.8 °FAH Left Air Outlet Temperature 556.5 571.4 563.95 °FAH Right Air Outlet Temperature 540.6 601.6 571.1 °FAH Left Gas Inlet Temperature 661.6 748.4 705 °FAH Right Gas Inlet Temperature 609.1 701.9 655.5 °FAH Left Gas Outlet Temperature 288.4 308.7 298.55 °FAH Right Gas Outlet Temperature 295 294.3 294.65 °FESP Left Gas Outlet Temperature 305.4 302.3 303.85 °FESP Right Gas outlet Temperature 302.4 314.2 308.3 °FAH Left Avg. Cold end temperature 199.3 201.4 200.35 °FAH Right Avg. Cold End Temperature 203.7 198.8 201.25 °F
Glyco Heater L Glycol Outlet T 193.9 147.7 170.8 °FGlyco Heater R Glycol Outlet T 195.9 147.7 171.8 °F
Flue gas temperature 200 ~ 400˚F, depends on the unit load and air heater

2‐5
Table 2‐3: Condensate and cooling water streams for several coal power plants
Condenser parameters: Plant 1 Plant 2 Plant 3 Plant 4
Gross Generation (MW) 198.4 547 540 384
Back pressure (inHga) 2.11 2.88 2.52 1.43
Circulating water flow (GPM) 117,175 190,250 185,000 175,000
Cooling water in temp (F) 61 75.2 75 54
Cooling water out temp (F) 77 106 104 81.7
Steam Condensate temp (F), calculated from back pressure 102.2 115 109.4 87.8
Condenser inlet steam temp (F) 106.1 114.6 105 90.2
Condenser outlet water temp (F) 91.1 113.2 109 96.6
Sub Cooling (F) 11.8 1.1 0 ‐6.4
Table 2‐4: Typical Power Plant Water Consumptions
Water Usage in Power Plants Unit # 1 Unit # 2 Unit # 3 Unit #4
T‐Fired 530 MW
Cyclone 330 MW
Wall Fired 400 MW
T‐Fired 390 MW
Make‐Up Water 44 kpph 21.5 kpph 29.9 kpph 90 kpph Water Cannon NA NA NA Water Lance RO or Serv.
Water NA NA NA
Sootblowing Steam Make‐Up 22 kpph NA 11.9 kpph incl. in make‐up
RRI/SNCR NA 7.6 kpph NA NA Water Storage boiler fill &
emergency ‐ 4x boiler fill
boiler fill & emergency ‐ 4 x boiler fill
boiler fill & emergency ‐ 4 x boiler fill
boiler fill & emergency ‐ 4 x boiler fill
Feed Water closed loop closed loop closed loop
closed loop
Bearing Cooling Water closed loop closed loop closed loop
closed loop
FGD water NA NA NA 257 kpph Condenser Circulating Water Flow
NA NA 185 kpph 175 kpph
Service Water Flow NA NA NA NA Notes: 1. If Sootblowing Steam is listed it is already accounted for in the Make‐up water. It is just showing how much of the make‐up is due to sootblower consumption. 2. Water Storage ‐ is part of emergency and reserve for start‐up activities. Drum blow downs are open for boiler water chemistry control. 3. Make‐up water includes normal blow downs, leaks through safety or other valves, plant heating systems and other open‐loop steam usages. 4. Service Water flows and usage is depending on plant specific layout and location. It's sources are river, lake, city, deep well water sources.
2‐6
Figure 2-1: Typical fly ash particle size distribution from a plant using western Elk Coal
From the above collected data from several typical coal power plants and the analysis,
we see great water saving potentials if the TMC technology can be successfully used to recover
both waste heat and water vapor from the flue gases. As we have identified, there is plenty of
moisture available from the flue gases, especially after a FGD unit. And there are also many
potential places in a power plant besides boiler makeup, which may include FGD water,
RRI/SNCR injection system, and other plant water users. The fly ash particles should not present
a problem for the TMC membrane operation since its much larger size compared with the
membrane pores. What we need to do is developing a TMC unit that can meet the specific need
of a power plant, to achieve the best combination of efficiency improvement and water
recovery.
A Twostage TMC Concept Design for Power Plant Water/Steam Cycle
Based on the above information and our previous project modeling and analysis work, a
two‐stage TMC concept was developed for power plant applications. For power plants, there
0100002000030000400005000060000700008000090000
100000110000120000
0 1 2 3 4 5 6 7 8 9 10
Part
icle
Con
cent
ratio
n (#
/CM
^3)
Particle Diameter (Microns)
Fly Ash from Western Elk Coal
ESP Inlet
ESP Outlet

2‐7
are two water streams can be used as TMC cooling sources: the turbine steam condensate and
the condenser cooling water. Besides the lower temperature turbine steam condensate, the
cooling water is typically 25 times of the boiler feed water flow rate, and can provide a much
larger driving force for the TMC. With the two streams of cooling water, up to 90% moisture
removal from the coal‐fired power plant flue gas is possible.
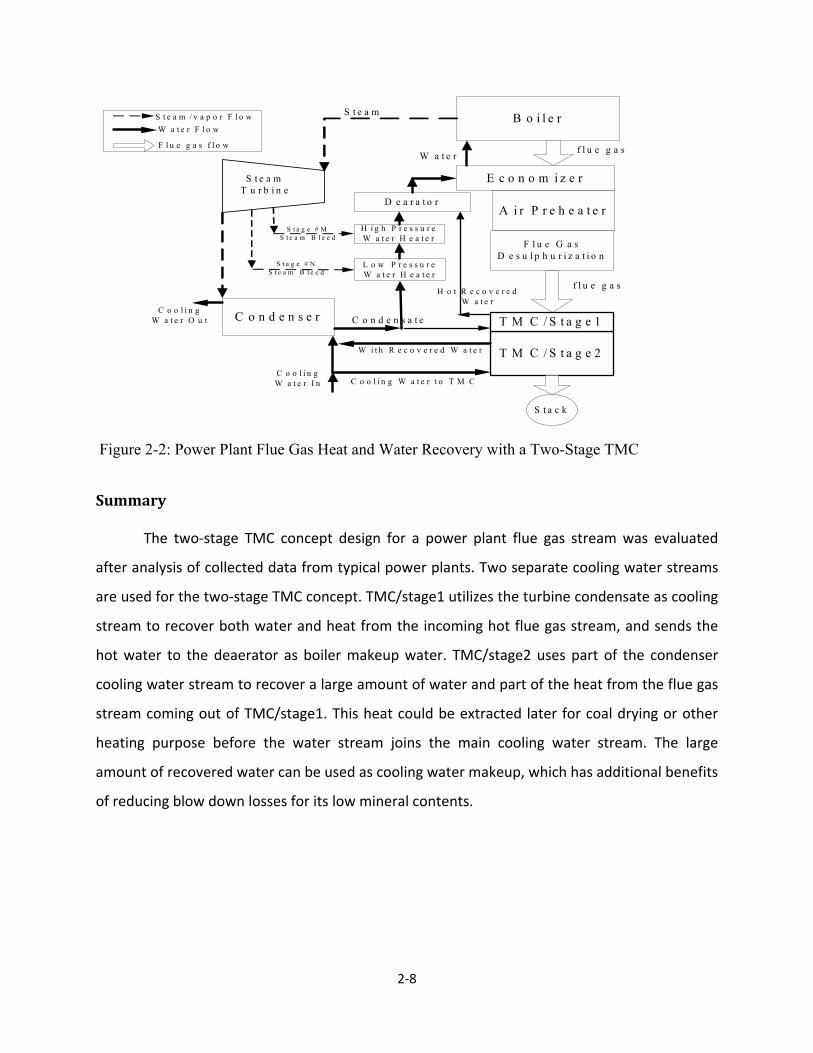
Figure 2‐2 shows a schematic for the two‐stage TMC concept and how to integrate the
TMC water recovery unit in a typical power generation boiler steam turbine loop. For the two‐
stage TMC unit to maximize its function for recovering both water and heat, two separate
cooling water streams are used. On the water side, the first‐stage TMC inlet water will be
obtained from steam condensate from the condenser, and its outlet water with recovered
water vapor and associated latent heat from flue gas will go to the deaerator for boiler water
makeup. This water is at a higher temperature (130˚F to 160˚F depending on incoming flue
condition) than a regular makeup water, thus the overall boiler efficiency can be expected to
increase about 0.5%. Recovered water quantity was more than sufficient for boiler makeup
(typically less than 1% steaming rate) and the excess mineral free water can be used to makeup
heating system losses, bearing cooling losses, in addition to being a part of FGD water supply.
The second‐stage TMC inlet water will be part of the condenser cooling water stream. The
outlet water from this TMC stage will then be routed to go back to the cooling water stream
with extra recovered water from the flue gas. On the flue gas side, the TMC is situated
between the FGD unit and the stack.
2‐8
Summary
The two‐stage TMC concept design for a power plant flue gas stream was evaluated
after analysis of collected data from typical power plants. Two separate cooling water streams
are used for the two‐stage TMC concept. TMC/stage1 utilizes the turbine condensate as cooling
stream to recover both water and heat from the incoming hot flue gas stream, and sends the
hot water to the deaerator as boiler makeup water. TMC/stage2 uses part of the condenser
cooling water stream to recover a large amount of water and part of the heat from the flue gas
stream coming out of TMC/stage1. This heat could be extracted later for coal drying or other
heating purpose before the water stream joins the main cooling water stream. The large
amount of recovered water can be used as cooling water makeup, which has additional benefits
of reducing blow down losses for its low mineral contents.
B o i l e r
E c o n o m i z e r
A i r P r e h e a t e r
T M C / S t a g e 2
f l u e g a s
S t e a m
L o w P r e s s u r eW a t e r H e a t e r
F l u e G a s D e s u l p h u r i z a t i o n
S t a c k
f l u e g a s
S t e a m T u r b i n e
C o n d e n s e r
C o o l i n g W a t e r I n
C o o l i n g W a t e r O u t C o n d e n s a t e
H i g h P r e s s u r eW a t e r H e a t e r
S t a g e # M S t e a m B l e e d
S t a g e # N S t e a m B l e e d
W a t e r
H o t R e c o v e r e d W a t e r
S t e a m / v a p o r F l o wW a t e r F l o w
F l u e g a s f l o w
T M C / S t a g e 1
D e a r a t o r
W i t h R e c o v e r e d W a t e r
C o o l i n g W a t e r t o T M C
Figure 2-2: Power Plant Flue Gas Heat and Water Recovery with a Two-Stage TMC
3‐1
CHAPTER 3 TMC Membrane Performance Evaluation and Selection
Introduction
For this two stage TMC design for coal power plant flue gas application, the project
team investigated different membrane pore sizes to achieve optimized membrane heat
transfer/water transport performance for TMC/stage 1 and TMC/stage 2. Also membrane
fouling potentials for coal‐fired flue gas has been studied. In addition to the current 8‐nm
membrane pore size that is used for both heat and water recovery application for most
industrial boiler applications, two additional pore sizes were studied, namely 15 nm and 25 nm
pore sizes, for maximizing water and heat transportation. Membrane coating method and
membrane module construction method have also been investigated to lower the TMC cost.
Experimental Apparatus
The GTI laboratory TMC test setup was modified for current project membrane module
performance test, which was aimed to select the appropriate membranes for the two‐stage
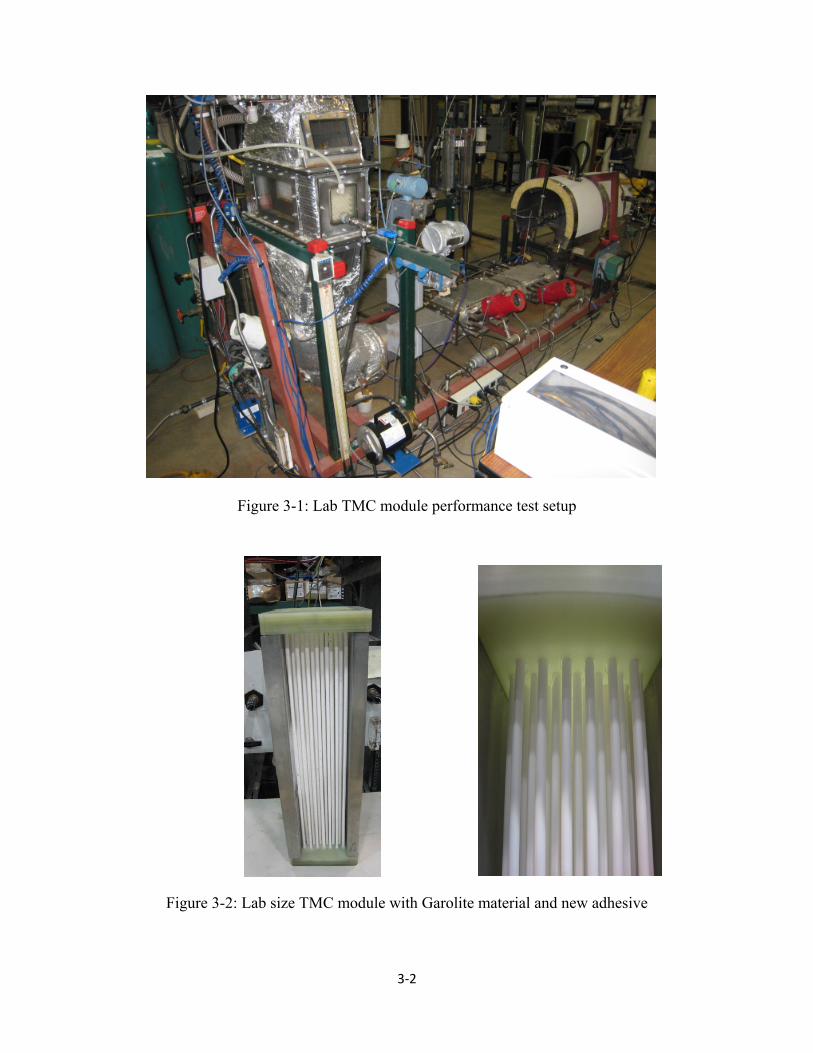
TMC unit. As shown in Figure 3‐1, the test setup consists of a gas burner with a 200,000 Btu/hr
firing capacity, two heat exchangers to cool the flue gas down for TMC test section inlet, and
the TMC test section itself. A new water pump and a new water flow meter have been acquired
and installed to accommodate the large water flow rate requirement special for this project. A
portable automatic data acquisition box was built for this testing, and also for future field
testing at host power plant.
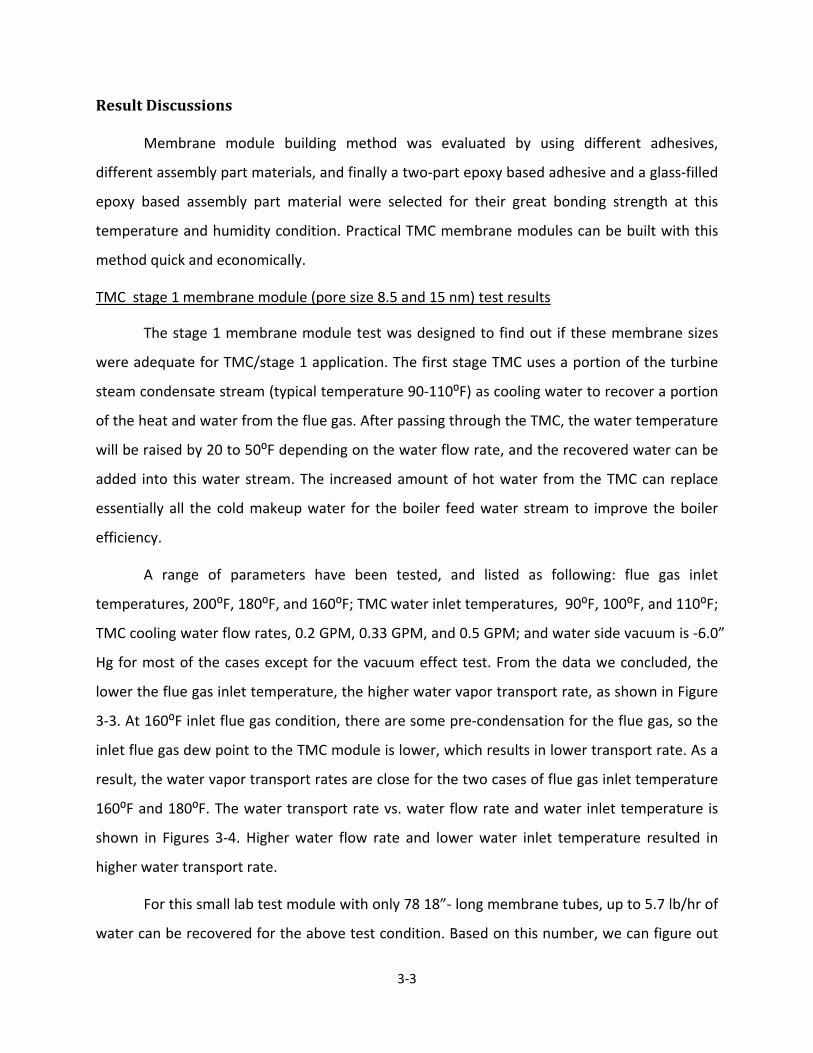
TMC membrane modules were built with seventy eight 18”‐ long membrane tubes for
TMC performance evaluation. The first module was built with our TMC typical membrane pore
size (8nm) tubes, which were used for most industrial TMC unit and can get the best water
recovery quality and adequate water and heat recovery to the make‐up water loop. One
laboratory module built for this project is shown in Figure 3‐2.
3‐2
Figure 3-1: Lab TMC module performance test setup
Figure 3-2: Lab size TMC module with Garolite material and new adhesive
3‐3
Result Discussions
Membrane module building method was evaluated by using different adhesives,
different assembly part materials, and finally a two‐part epoxy based adhesive and a glass‐filled
epoxy based assembly part material were selected for their great bonding strength at this
temperature and humidity condition. Practical TMC membrane modules can be built with this
method quick and economically.
TMC stage 1 membrane module (pore size 8.5 and 15 nm) test results
The stage 1 membrane module test was designed to find out if these membrane sizes
were adequate for TMC/stage 1 application. The first stage TMC uses a portion of the turbine
steam condensate stream (typical temperature 90‐110⁰F) as cooling water to recover a portion
of the heat and water from the flue gas. After passing through the TMC, the water temperature
will be raised by 20 to 50⁰F depending on the water flow rate, and the recovered water can be
added into this water stream. The increased amount of hot water from the TMC can replace
essentially all the cold makeup water for the boiler feed water stream to improve the boiler
efficiency.
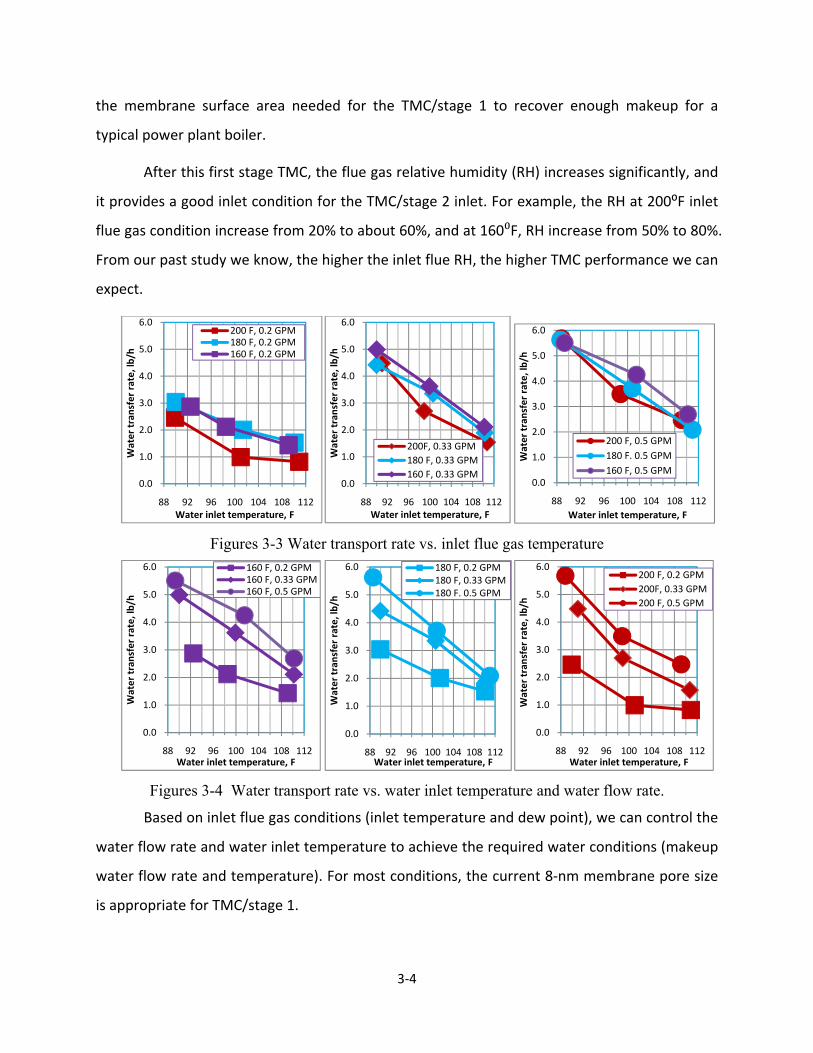
A range of parameters have been tested, and listed as following: flue gas inlet
temperatures, 200⁰F, 180⁰F, and 160⁰F; TMC water inlet temperatures, 90⁰F, 100⁰F, and 110⁰F;
TMC cooling water flow rates, 0.2 GPM, 0.33 GPM, and 0.5 GPM; and water side vacuum is ‐6.0”
Hg for most of the cases except for the vacuum effect test. From the data we concluded, the
lower the flue gas inlet temperature, the higher water vapor transport rate, as shown in Figure
3‐3. At 160⁰F inlet flue gas condition, there are some pre‐condensation for the flue gas, so the
inlet flue gas dew point to the TMC module is lower, which results in lower transport rate. As a
result, the water vapor transport rates are close for the two cases of flue gas inlet temperature
160⁰F and 180⁰F. The water transport rate vs. water flow rate and water inlet temperature is
shown in Figures 3‐4. Higher water flow rate and lower water inlet temperature resulted in
higher water transport rate.
For this small lab test module with only 78 18”‐ long membrane tubes, up to 5.7 lb/hr of
water can be recovered for the above test condition. Based on this number, we can figure out
3‐4
the membrane surface area needed for the TMC/stage 1 to recover enough makeup for a
typical power plant boiler.
After this first stage TMC, the flue gas relative humidity (RH) increases significantly, and
it provides a good inlet condition for the TMC/stage 2 inlet. For example, the RH at 200⁰F inlet
flue gas condition increase from 20% to about 60%, and at 160⁰F, RH increase from 50% to 80%.
From our past study we know, the higher the inlet flue RH, the higher TMC performance we can
expect.
Figures 3-3 Water transport rate vs. inlet flue gas temperature
Figures 3-4 Water transport rate vs. water inlet temperature and water flow rate.
Based on inlet flue gas conditions (inlet temperature and dew point), we can control the
water flow rate and water inlet temperature to achieve the required water conditions (makeup
water flow rate and temperature). For most conditions, the current 8‐nm membrane pore size
is appropriate for TMC/stage 1.
0.0
1.0
2.0
3.0
4.0
5.0
6.0
88 92 96 100 104 108 112
Water tran
sfer rate, lb
/h
Water inlet temperature, F
200 F, 0.2 GPM180 F, 0.2 GPM160 F, 0.2 GPM
0.0
1.0
2.0
3.0
4.0
5.0
6.0
88 92 96 100 104 108 112
Water tran
sfer rate, lb
/h
Water inlet temperature, F
200F, 0.33 GPM180 F, 0.33 GPM160 F, 0.33 GPM
0.0
1.0
2.0
3.0
4.0
5.0
6.0
88 92 96 100 104 108 112
Water tran
sfer rate, lb
/hWater inlet temperature, F
200 F, 0.5 GPM180 F. 0.5 GPM160 F, 0.5 GPM
0.0
1.0
2.0
3.0
4.0
5.0
6.0
88 92 96 100 104 108 112
Water tran
sfer rate, lb
/h
Water inlet temperature, F
160 F, 0.2 GPM160 F, 0.33 GPM160 F, 0.5 GPM
0.0
1.0
2.0
3.0
4.0
5.0
6.0
88 92 96 100 104 108 112
Water tran
sfer rate, lb
/h
Water inlet temperature, F
180 F, 0.2 GPM180 F, 0.33 GPM180 F. 0.5 GPM
0.0
1.0
2.0
3.0
4.0
5.0
6.0
88 92 96 100 104 108 112
Water tran
sfer rate, lb
/h
Water inlet temperature, F
200 F, 0.2 GPM200F, 0.33 GPM200 F, 0.5 GPM
3‐5
For some high water transport rate cases (low water inlet temperature and high water
rate), there are water droplets occurs on the membrane surface at the tube water inlet side,
which means the membrane can not transport all the water condensed. Larger membrane pore
size module performance should be also investigated.
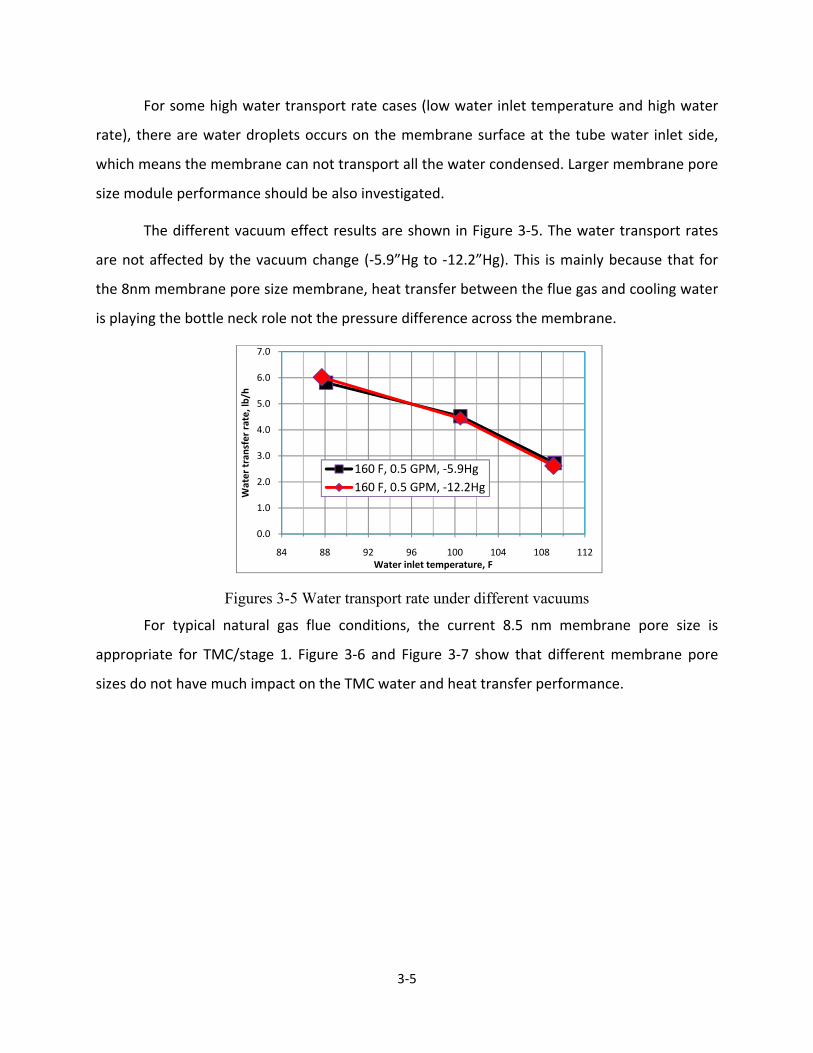
The different vacuum effect results are shown in Figure 3‐5. The water transport rates
are not affected by the vacuum change (‐5.9”Hg to ‐12.2”Hg). This is mainly because that for
the 8nm membrane pore size membrane, heat transfer between the flue gas and cooling water
is playing the bottle neck role not the pressure difference across the membrane.
Figures 3-5 Water transport rate under different vacuums
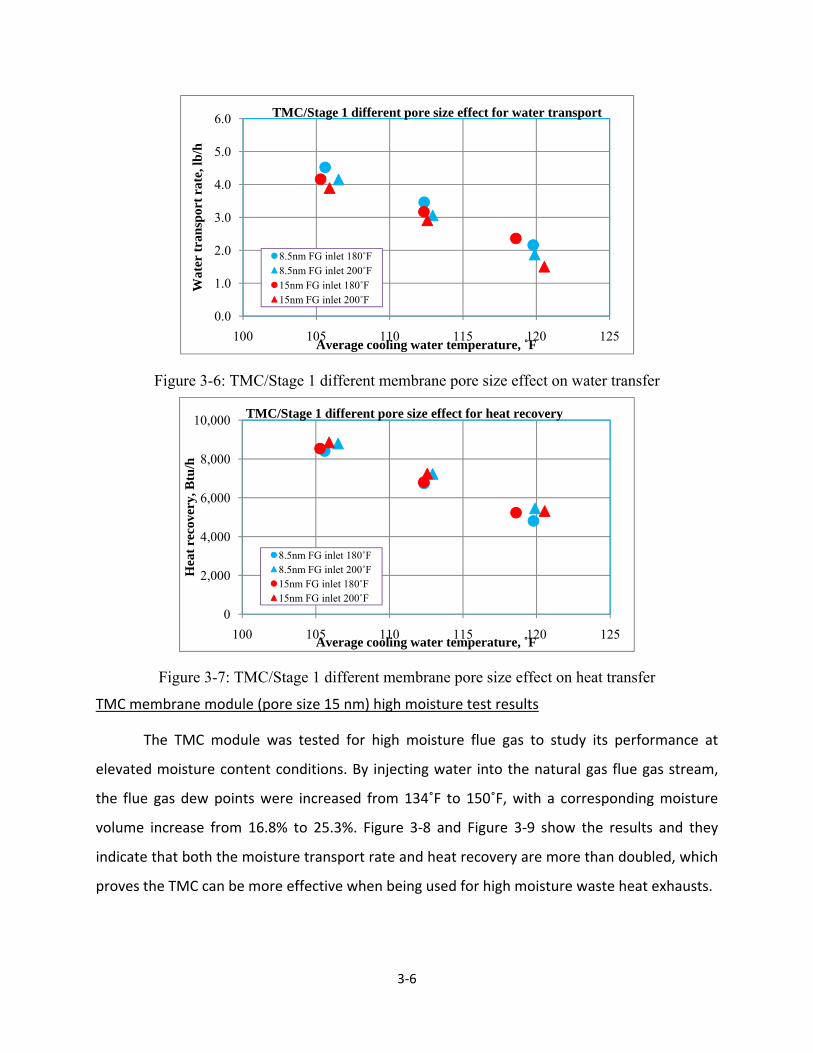
For typical natural gas flue conditions, the current 8.5 nm membrane pore size is
appropriate for TMC/stage 1. Figure 3‐6 and Figure 3‐7 show that different membrane pore
sizes do not have much impact on the TMC water and heat transfer performance.
0.0
1.0
2.0
3.0
4.0
5.0
6.0
7.0
84 88 92 96 100 104 108 112
Water tran
sfer rate, lb
/h
Water inlet temperature, F
160 F, 0.5 GPM, ‐5.9Hg160 F, 0.5 GPM, ‐12.2Hg
3‐6
Figure 3-6: TMC/Stage 1 different membrane pore size effect on water transfer
Figure 3-7: TMC/Stage 1 different membrane pore size effect on heat transfer
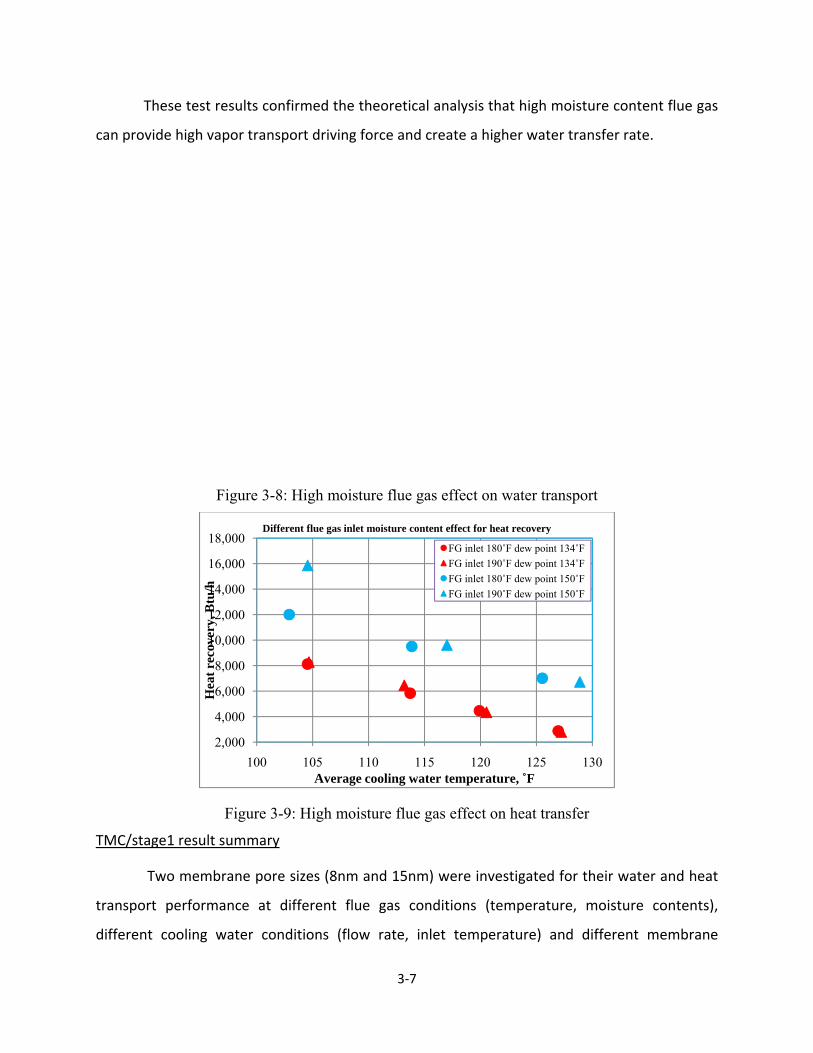
TMC membrane module (pore size 15 nm) high moisture test results
The TMC module was tested for high moisture flue gas to study its performance at
elevated moisture content conditions. By injecting water into the natural gas flue gas stream,
the flue gas dew points were increased from 134˚F to 150˚F, with a corresponding moisture
volume increase from 16.8% to 25.3%. Figure 3‐8 and Figure 3‐9 show the results and they
indicate that both the moisture transport rate and heat recovery are more than doubled, which
proves the TMC can be more effective when being used for high moisture waste heat exhausts.
0.0
1.0
2.0
3.0
4.0
5.0
6.0
100 105 110 115 120 125
Wat
er tr
ansp
ort r
ate,
lb/h
Average cooling water temperature, ˚F
TMC/Stage 1 different pore size effect for water transport
8.5nm FG inlet 180˚F8.5nm FG inlet 200˚F15nm FG inlet 180˚F15nm FG inlet 200˚F
0
2,000
4,000
6,000
8,000
10,000
100 105 110 115 120 125
Hea
t rec
over
y, B
tu/h
Average cooling water temperature, ˚F
TMC/Stage 1 different pore size effect for heat recovery
8.5nm FG inlet 180˚F8.5nm FG inlet 200˚F15nm FG inlet 180˚F15nm FG inlet 200˚F
3‐7
These test results confirmed the theoretical analysis that high moisture content flue gas
can provide high vapor transport driving force and create a higher water transfer rate.
Figure 3-8: High moisture flue gas effect on water transport
Figure 3-9: High moisture flue gas effect on heat transfer
TMC/stage1 result summary
Two membrane pore sizes (8nm and 15nm) were investigated for their water and heat
transport performance at different flue gas conditions (temperature, moisture contents),
different cooling water conditions (flow rate, inlet temperature) and different membrane
2,000
4,000
6,000
8,000
10,000
12,000
14,000
16,000
18,000
100 105 110 115 120 125 130
Hea
t rec
over
y, B
tu/h
Average cooling water temperature, ˚F
Different flue gas inlet moisture content effect for heat recovery
FG inlet 180˚F dew point 134˚FFG inlet 190˚F dew point 134˚FFG inlet 180˚F dew point 150˚FFG inlet 190˚F dew point 150˚F

3‐8
permeate side vacuums. A larger pore size is favored for high moisture content conditions
where high water transport rate is needed, but a smaller pore size is favored for most of the
cases of TMC/stage1 flue gas condition so as to create a better capillary condensation effect.
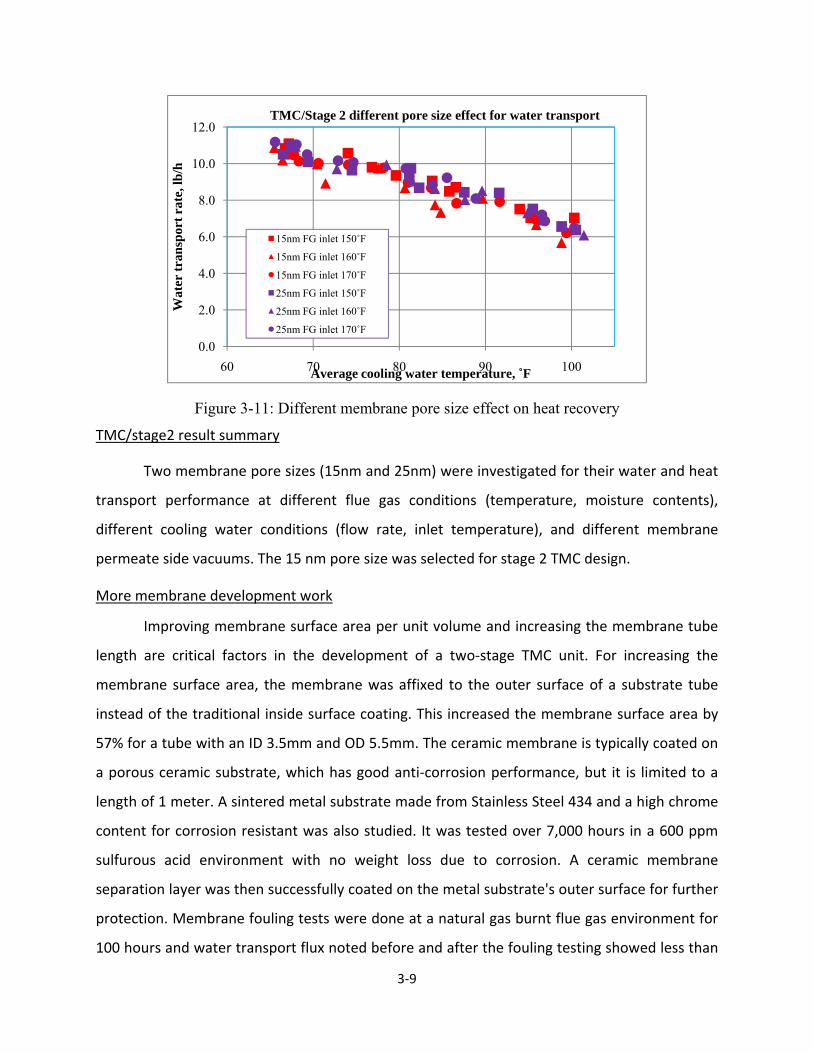
TMC stage 2 membrane module (pore size 15 and 25 nm) test results
This test was designed to investigate the adequacy of membrane sizes for a TMC/stage 2
application. The TMC/stage 2 receives low temperature flue gas from TMC/stage 1 with a low
moisture content. However since the flue gas is at a high relative humidity condition it is
favorable to recover a large portion of the water. Figure 3‐10 and Figure 3‐11 show data plots
for different flue gas inlet temperatures and different averaged cooling water temperatures
(water flow rate is already considered in this parameter). Under these testing conditions, no
performance difference on water and heat transfer for the two membrane pore sizes were
noted. Therefore a 15nm pore size membrane is suggested for a TMC/stage 2 application since
the smaller pore size is more favorable for contaminant rejection and encourages earlier
capillary condensation.
Figure 3-10: Different membrane pore size effect on water transport
0
3,000
6,000
9,000
12,000
15,000
18,000
60 70 80 90 100
Hea
t rec
over
y, lb
/h
Average cooling water temperature, ˚F
TMC/Stage 2 different pore size effect for heat recovery
15nm FG inlet 150˚F
15nm FG inlet 160˚F
15nm FG inlet 170˚F
25nm FG inlet 150˚F
25nm FG inlet 160˚F
25nm FG inlet 170˚F
3‐9
Figure 3-11: Different membrane pore size effect on heat recovery
TMC/stage2 result summary
Two membrane pore sizes (15nm and 25nm) were investigated for their water and heat
transport performance at different flue gas conditions (temperature, moisture contents),
different cooling water conditions (flow rate, inlet temperature), and different membrane
permeate side vacuums. The 15 nm pore size was selected for stage 2 TMC design.
More membrane development work
Improving membrane surface area per unit volume and increasing the membrane tube
length are critical factors in the development of a two‐stage TMC unit. For increasing the
membrane surface area, the membrane was affixed to the outer surface of a substrate tube
instead of the traditional inside surface coating. This increased the membrane surface area by
57% for a tube with an ID 3.5mm and OD 5.5mm. The ceramic membrane is typically coated on
a porous ceramic substrate, which has good anti‐corrosion performance, but it is limited to a
length of 1 meter. A sintered metal substrate made from Stainless Steel 434 and a high chrome
content for corrosion resistant was also studied. It was tested over 7,000 hours in a 600 ppm
sulfurous acid environment with no weight loss due to corrosion. A ceramic membrane
separation layer was then successfully coated on the metal substrate's outer surface for further
protection. Membrane fouling tests were done at a natural gas burnt flue gas environment for
100 hours and water transport flux noted before and after the fouling testing showed less than
0.0
2.0
4.0
6.0
8.0
10.0
12.0
60 70 80 90 100
Wat
er tr
ansp
ort r
ate,
lb/h
Average cooling water temperature, ˚F
TMC/Stage 2 different pore size effect for water transport
15nm FG inlet 150˚F
15nm FG inlet 160˚F
15nm FG inlet 170˚F
25nm FG inlet 150˚F
25nm FG inlet 160˚F
25nm FG inlet 170˚F
3‐10
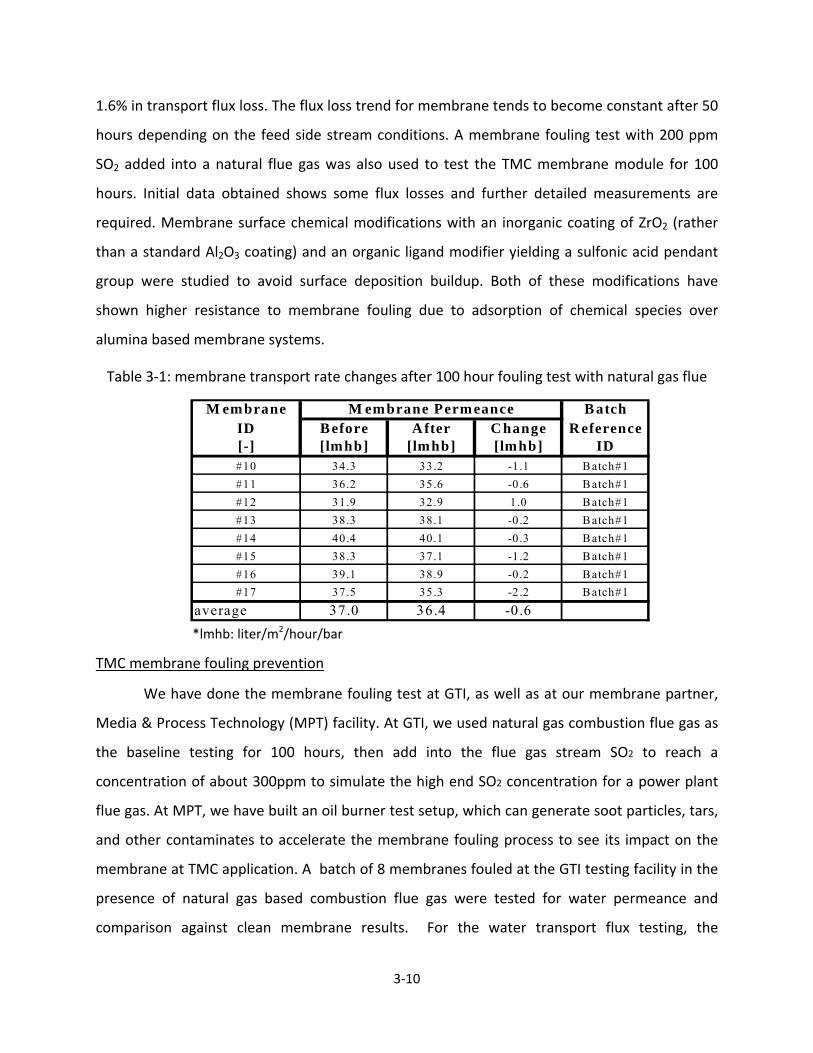
1.6% in transport flux loss. The flux loss trend for membrane tends to become constant after 50
hours depending on the feed side stream conditions. A membrane fouling test with 200 ppm
SO2 added into a natural flue gas was also used to test the TMC membrane module for 100
hours. Initial data obtained shows some flux losses and further detailed measurements are
required. Membrane surface chemical modifications with an inorganic coating of ZrO2 (rather
than a standard Al2O3 coating) and an organic ligand modifier yielding a sulfonic acid pendant
group were studied to avoid surface deposition buildup. Both of these modifications have
shown higher resistance to membrane fouling due to adsorption of chemical species over
alumina based membrane systems.
Table 3‐1: membrane transport rate changes after 100 hour fouling test with natural gas flue
*lmhb: liter/m2/hour/bar
TMC membrane fouling prevention
We have done the membrane fouling test at GTI, as well as at our membrane partner,
Media & Process Technology (MPT) facility. At GTI, we used natural gas combustion flue gas as
the baseline testing for 100 hours, then add into the flue gas stream SO2 to reach a
concentration of about 300ppm to simulate the high end SO2 concentration for a power plant
flue gas. At MPT, we have built an oil burner test setup, which can generate soot particles, tars,
and other contaminates to accelerate the membrane fouling process to see its impact on the
membrane at TMC application. A batch of 8 membranes fouled at the GTI testing facility in the
presence of natural gas based combustion flue gas were tested for water permeance and
comparison against clean membrane results. For the water transport flux testing, the
M embrane B atchID B efore A fter C hange R eference[-] [lmhb] [lmhb] [lmhb] ID#10 34.3 33.2 -1.1 B atch#1#11 36.2 35.6 -0.6 B atch#1#12 31.9 32.9 1.0 B atch#1#13 38.3 38.1 -0.2 B atch#1#14 40.4 40.1 -0.3 B atch#1#15 38.3 37.1 -1.2 B atch#1#16 39.1 38.9 -0.2 B atch#1#17 37.5 35.3 -2.2 B atch#1
average 37.0 36.4 -0.6
M embrane Permeance
3‐11
permeance results were obtained using distilled water pretreated with a 100Å pore size
membrane. The tests were conducted at room temperature (~ 22˚C) at 10psig. The data in
Table 3‐1 shows the permeance and the change in permeance following the TMC testing. A
negative value for the change in permeance indicates a decrease in permeance following
exposure to the flue gas. In all but one of the cases, the membrane permeance decreased
slightly, indicating a general but relatively small amount of membrane fouling. A slight decay in
membrane permeance is to be expected under general use conditions. It should be noted that
the error in the measurement in the water testing unit is on the order of 0.2 to 0.4
liter/m2/hr/bar, so that many of the observed changes in membrane permeance are within the
error limit. Hence, overall, under the gas conditions studied, very little impact on membrane
permeance is noted.
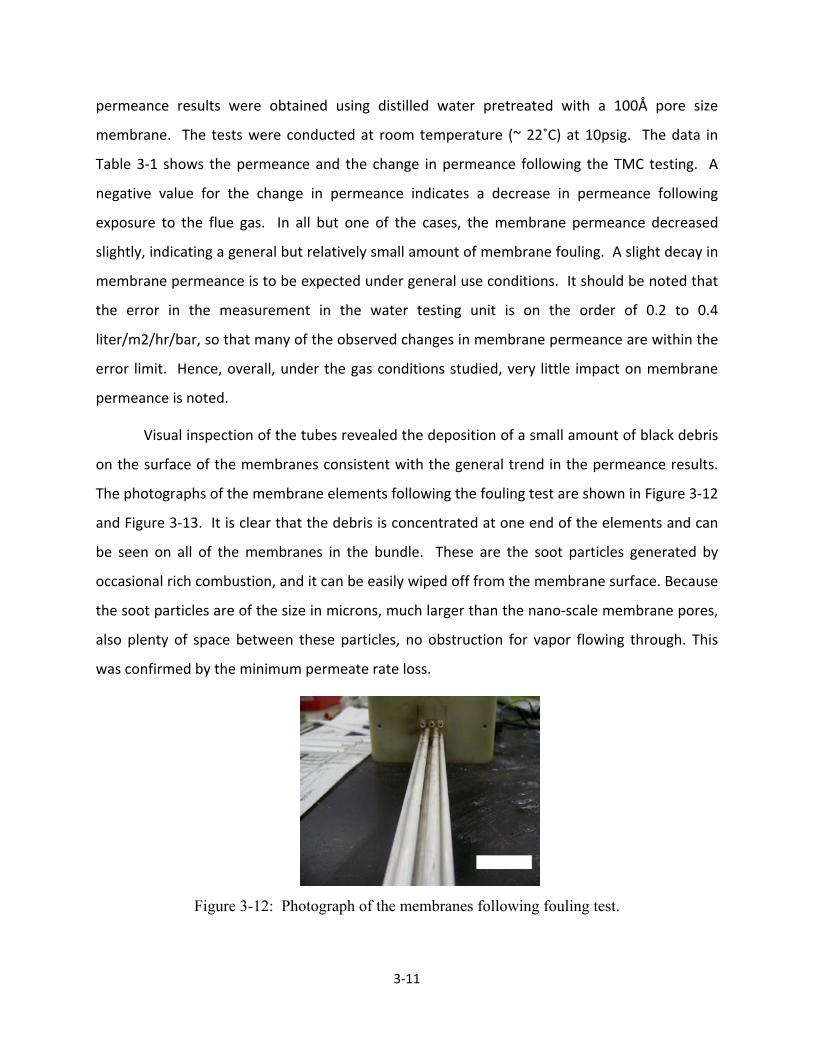
Visual inspection of the tubes revealed the deposition of a small amount of black debris
on the surface of the membranes consistent with the general trend in the permeance results.
The photographs of the membrane elements following the fouling test are shown in Figure 3‐12
and Figure 3‐13. It is clear that the debris is concentrated at one end of the elements and can
be seen on all of the membranes in the bundle. These are the soot particles generated by
occasional rich combustion, and it can be easily wiped off from the membrane surface. Because
the soot particles are of the size in microns, much larger than the nano‐scale membrane pores,
also plenty of space between these particles, no obstruction for vapor flowing through. This
was confirmed by the minimum permeate rate loss.
Figure 3-12: Photograph of the membranes following fouling test.

3‐12
Figure 3-13: Photograph of black debris on the membranes following fouling test.
The results in Table 3‐2 with 200ppm SO2 show permeance increasing by up to 50%.
SEM photomicrographs of the Batch #2 membrane surfaces showed no evidence of
“catastrophic” membrane damage, specifically, cracking, pinholing, delamination, etc. Further,
cross sections of the surface layer did not appear to show any irregular features and were
generally consistent with the virgin membranes. Hence, the increase in Batch #2 membrane
permeance in Table 3‐2 is likely due to membrane pore growth as a result of exposure of the
membrane surface to low pH due to the SO2 presence at high temperature moisture condition.
At the moment it is not known if the current pore growth represents a new equilibrium or if
pore size enlargement will continue with additional exposure to SO2 laden combustion gas.
Table 3‐2: membrane transport rate changes after 100 hour test with 200ppm SO2 flue gas
Membrane BatchID Before After Change Reference[-] [lmhb] [lmhb] [lmhb] ID#18 40.7 50.1 9.4 Batch#2#19 35.4 54.3 18.9 Batch#2#20 40.2 57.6 17.4 Batch#2#21 39.6 62.6 23.0 Batch#2#22 36.4 62.8 26.4 Batch#2#23 35.4 51.8 16.4 Batch#2#24 40.7 57.7 17.0 Batch#2#25 32.1 51.8 19.7 Batch#2
average 37.6 56.1 18.5
Membrane Permeance
4‐1
CHAPTER 4 Pilot-Scale TMC Design, Fabrication and Performance Test
Introduction
A pilot‐scale test system for the TMC technology to be applied for coal‐fired power plant
flue gases was designed, fabricated, and assembled. The team then performed comprehensive
testing for the 3‐million‐Btu/h capacity pilot‐scale TMC unit with flue gas from a boiler in GTI's
combustion laboratory. Steam was also added to the flue gas as required to simulate the
moisture level corresponding to wet or dry FGD exhaust streams. The two separate TMC
cooling water stream flow rates were adjusted to match in proportion with real power plant
operating conditions, and optimized within a certain range to achieve different objectives of the
TMC two stage designs. Recovered water quality was analyzed from the two outlet water
streams. Both water and energy recovery from the TMC unit have been quantified and analyzed
for the laboratory performance testing.
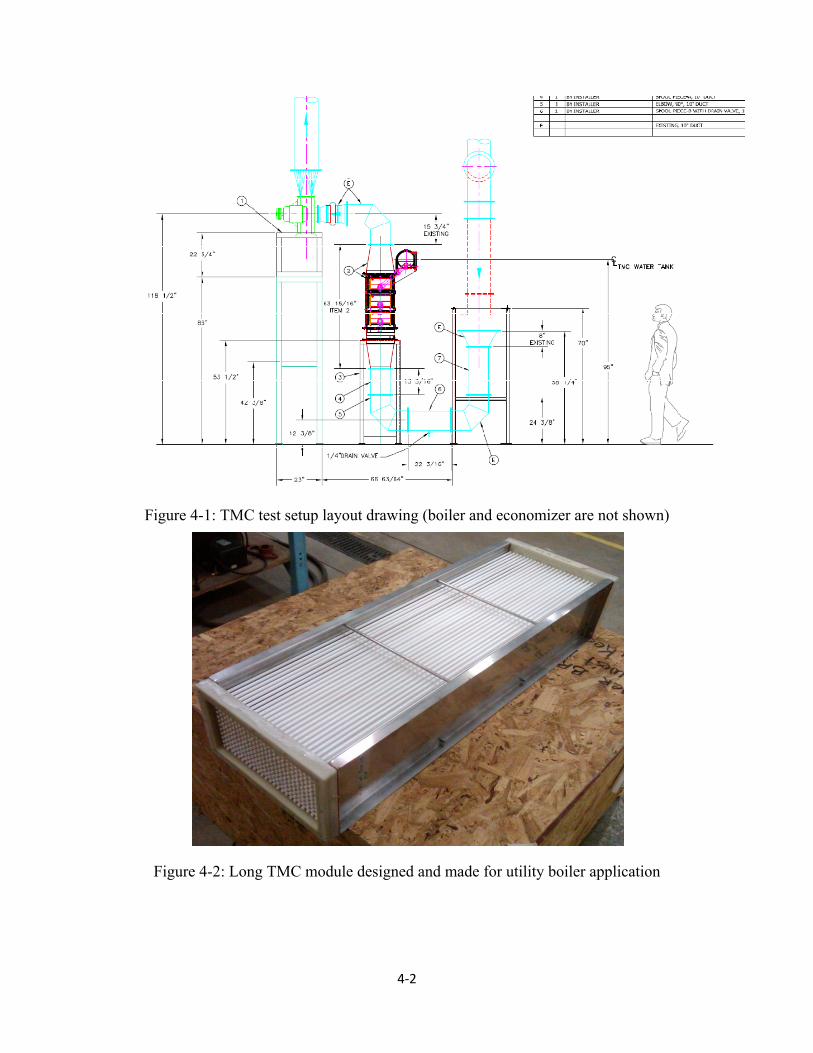
System Design and Fabrication
The TMC module design, TMC chamber design, and the overall test system design were
carried out for a 3‐million‐Btu/h capacity pilot‐scale TMC unit at GTI. The test system layout
arrangement is as shown in Figure 4‐1. Figure 4‐2 shows one of the long membrane modules
we specifically designed and made for the power plant application, which is 34” long compared
with 18” long module that was typically used for industrial boilers. Figure 4‐3 shows the test
system installed in GTI boiler room, and Figure 4‐4 is a close up view of the TMC unit. The whole
system is configured with necessary pumps, valves, controls, flue gas ductwork, water piping,
instrumentation, and data acquisition system. In addition, a boiler and related supporting
equipment are an integrate part of the test system, to provide flue gases with different
constituents for the TMC testing.
4‐2
Figure 4-1: TMC test setup layout drawing (boiler and economizer are not shown)
Figure 4-2: Long TMC module designed and made for utility boiler application

4‐3
Figure 4-3: pilot-scale TMC unit test system with the boiler on the right side
Figure 4-4: a close-up view of the TMC pilot unit
As shown in Figure 4‐3 and Figure 4‐4, the pilot TMC system was installed with control
and instrumentations. A data acquisition system is also designed and implemented for this test
setup to collect all important data into a computer. The whole test system also includes a boiler
4‐4
to supply flue gas to the TMC system, and a water softener to supply high quality water to TMC
to simulate steam condensate.
PilotScale Unit Performance Test
After installation and shakedown, we were able to perform several test runs to prove
the TMC preliminary performance. Table 4‐1 lists the 6 cases we have tested with detailed
parameters. Good performance has been achieved. Both stage 1 and stage 2 of the TMC unit
can realize high water vapor transfer rates, and the total vapor transport is 65% of the total
moisture in the flue gas. Along with the water vapor transportation, significant waste heat was
also transferred to the water side. The TMC/stage 1 water was heated up to 116˚F, which can
contribute to higher boiler efficiency if it is used for boiler makeup water as designed. Then we
proceed to more specific testing as will be discussed next.
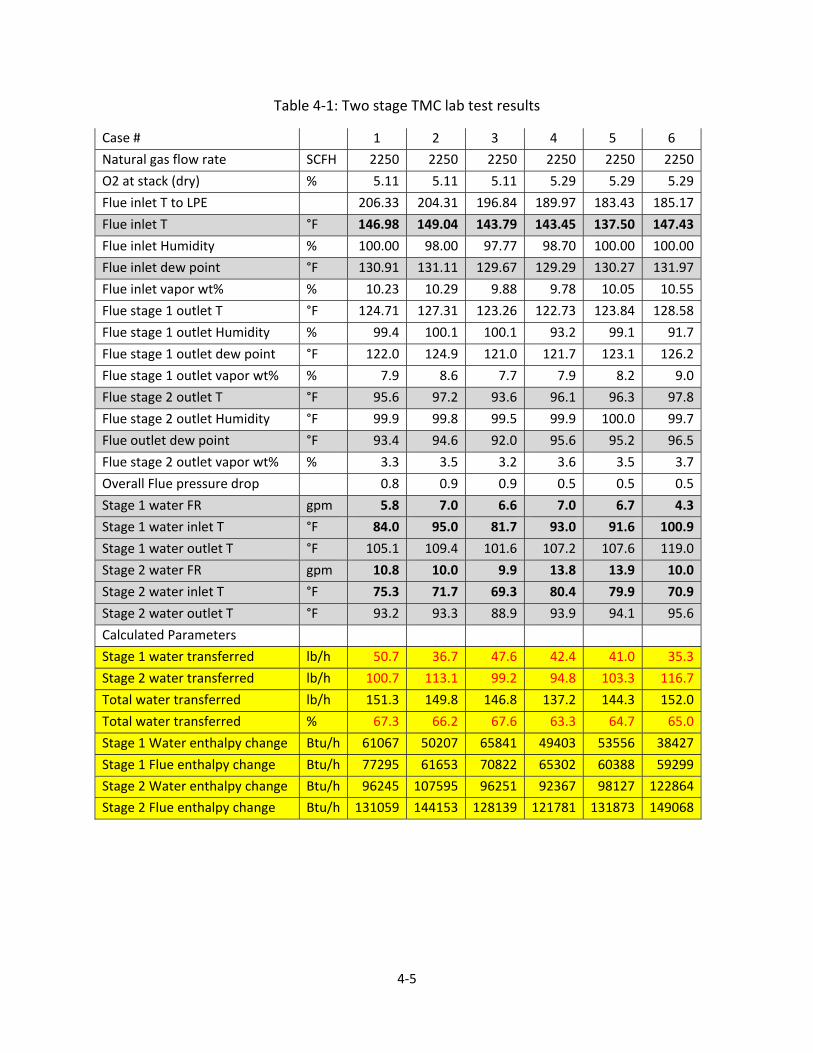
4‐5
Table 4‐1: Two stage TMC lab test results
Case # 1 2 3 4 5 6
Natural gas flow rate SCFH 2250 2250 2250 2250 2250 2250
O2 at stack (dry) % 5.11 5.11 5.11 5.29 5.29 5.29
Flue inlet T to LPE 206.33 204.31 196.84 189.97 183.43 185.17
Flue inlet T °F 146.98 149.04 143.79 143.45 137.50 147.43
Flue inlet Humidity % 100.00 98.00 97.77 98.70 100.00 100.00
Flue inlet dew point °F 130.91 131.11 129.67 129.29 130.27 131.97
Flue inlet vapor wt% % 10.23 10.29 9.88 9.78 10.05 10.55
Flue stage 1 outlet T °F 124.71 127.31 123.26 122.73 123.84 128.58
Flue stage 1 outlet Humidity % 99.4 100.1 100.1 93.2 99.1 91.7
Flue stage 1 outlet dew point °F 122.0 124.9 121.0 121.7 123.1 126.2
Flue stage 1 outlet vapor wt% % 7.9 8.6 7.7 7.9 8.2 9.0
Flue stage 2 outlet T °F 95.6 97.2 93.6 96.1 96.3 97.8
Flue stage 2 outlet Humidity °F 99.9 99.8 99.5 99.9 100.0 99.7
Flue outlet dew point °F 93.4 94.6 92.0 95.6 95.2 96.5
Flue stage 2 outlet vapor wt% % 3.3 3.5 3.2 3.6 3.5 3.7
Overall Flue pressure drop 0.8 0.9 0.9 0.5 0.5 0.5
Stage 1 water FR gpm 5.8 7.0 6.6 7.0 6.7 4.3
Stage 1 water inlet T °F 84.0 95.0 81.7 93.0 91.6 100.9
Stage 1 water outlet T °F 105.1 109.4 101.6 107.2 107.6 119.0
Stage 2 water FR gpm 10.8 10.0 9.9 13.8 13.9 10.0
Stage 2 water inlet T °F 75.3 71.7 69.3 80.4 79.9 70.9
Stage 2 water outlet T °F 93.2 93.3 88.9 93.9 94.1 95.6
Calculated Parameters
Stage 1 water transferred lb/h 50.7 36.7 47.6 42.4 41.0 35.3
Stage 2 water transferred lb/h 100.7 113.1 99.2 94.8 103.3 116.7
Total water transferred lb/h 151.3 149.8 146.8 137.2 144.3 152.0
Total water transferred % 67.3 66.2 67.6 63.3 64.7 65.0
Stage 1 Water enthalpy change Btu/h 61067 50207 65841 49403 53556 38427
Stage 1 Flue enthalpy change Btu/h 77295 61653 70822 65302 60388 59299
Stage 2 Water enthalpy change Btu/h 96245 107595 96251 92367 98127 122864
Stage 2 Flue enthalpy change Btu/h 131059 144153 128139 121781 131873 149068
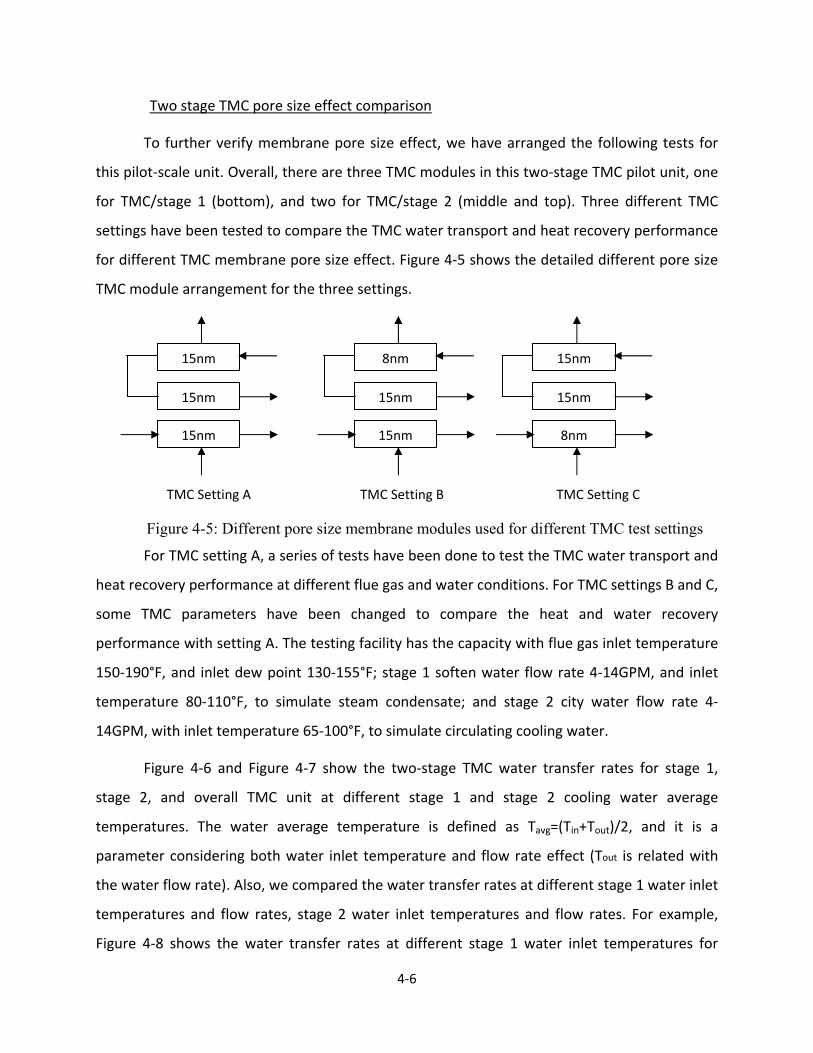
4‐6
Two stage TMC pore size effect comparison
To further verify membrane pore size effect, we have arranged the following tests for
this pilot‐scale unit. Overall, there are three TMC modules in this two‐stage TMC pilot unit, one
for TMC/stage 1 (bottom), and two for TMC/stage 2 (middle and top). Three different TMC
settings have been tested to compare the TMC water transport and heat recovery performance
for different TMC membrane pore size effect. Figure 4‐5 shows the detailed different pore size
TMC module arrangement for the three settings.
TMC Setting A TMC Setting B TMC Setting C
Figure 4-5: Different pore size membrane modules used for different TMC test settings
For TMC setting A, a series of tests have been done to test the TMC water transport and
heat recovery performance at different flue gas and water conditions. For TMC settings B and C,
some TMC parameters have been changed to compare the heat and water recovery
performance with setting A. The testing facility has the capacity with flue gas inlet temperature
150‐190°F, and inlet dew point 130‐155°F; stage 1 soften water flow rate 4‐14GPM, and inlet
temperature 80‐110°F, to simulate steam condensate; and stage 2 city water flow rate 4‐
14GPM, with inlet temperature 65‐100°F, to simulate circulating cooling water.
Figure 4‐6 and Figure 4‐7 show the two‐stage TMC water transfer rates for stage 1,
stage 2, and overall TMC unit at different stage 1 and stage 2 cooling water average
temperatures. The water average temperature is defined as Tavg=(Tin+Tout)/2, and it is a
parameter considering both water inlet temperature and flow rate effect (Tout is related with
the water flow rate). Also, we compared the water transfer rates at different stage 1 water inlet
temperatures and flow rates, stage 2 water inlet temperatures and flow rates. For example,
Figure 4‐8 shows the water transfer rates at different stage 1 water inlet temperatures for
15nm
15nm
15nm
15nm
8nm
15nm
8nm
15nm
15nm
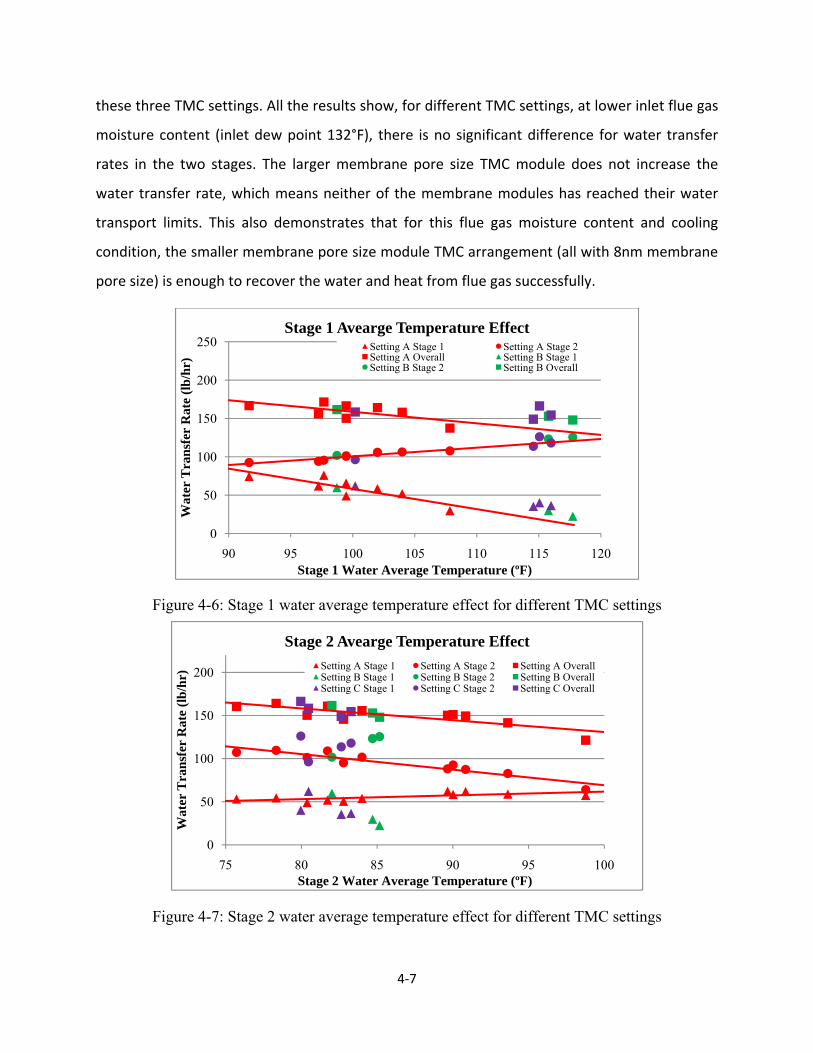
4‐7
these three TMC settings. All the results show, for different TMC settings, at lower inlet flue gas
moisture content (inlet dew point 132°F), there is no significant difference for water transfer
rates in the two stages. The larger membrane pore size TMC module does not increase the
water transfer rate, which means neither of the membrane modules has reached their water
transport limits. This also demonstrates that for this flue gas moisture content and cooling
condition, the smaller membrane pore size module TMC arrangement (all with 8nm membrane
pore size) is enough to recover the water and heat from flue gas successfully.
Figure 4-6: Stage 1 water average temperature effect for different TMC settings
Figure 4-7: Stage 2 water average temperature effect for different TMC settings
0
50
100
150
200
250
90 95 100 105 110 115 120
Wat
er T
rans
fer
Rat
e (lb
/hr)
Stage 1 Water Average Temperature (ºF)
Stage 1 Avearge Temperature Effect Setting A Stage 1 Setting A Stage 2Setting A Overall Setting B Stage 1Setting B Stage 2 Setting B Overall
0
50
100
150
200
75 80 85 90 95 100
Wat
er T
rans
fer
Rat
e (lb
/hr)
Stage 2 Water Average Temperature (ºF)
Stage 2 Avearge Temperature Effect Setting A Stage 1 Setting A Stage 2 Setting A OverallSetting B Stage 1 Setting B Stage 2 Setting B OverallSetting C Stage 1 Setting C Stage 2 Setting C Overall
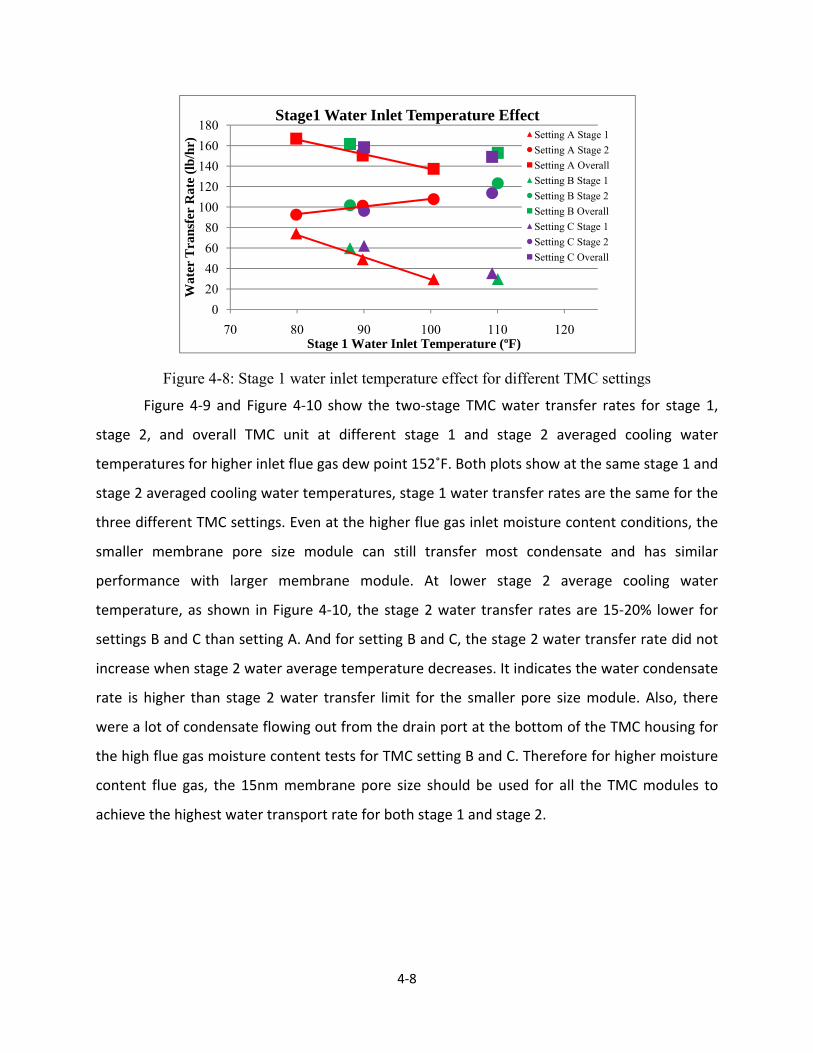
4‐8
Figure 4-8: Stage 1 water inlet temperature effect for different TMC settings
Figure 4‐9 and Figure 4‐10 show the two‐stage TMC water transfer rates for stage 1,
stage 2, and overall TMC unit at different stage 1 and stage 2 averaged cooling water
temperatures for higher inlet flue gas dew point 152˚F. Both plots show at the same stage 1 and
stage 2 averaged cooling water temperatures, stage 1 water transfer rates are the same for the
three different TMC settings. Even at the higher flue gas inlet moisture content conditions, the
smaller membrane pore size module can still transfer most condensate and has similar
performance with larger membrane module. At lower stage 2 average cooling water
temperature, as shown in Figure 4‐10, the stage 2 water transfer rates are 15‐20% lower for
settings B and C than setting A. And for setting B and C, the stage 2 water transfer rate did not
increase when stage 2 water average temperature decreases. It indicates the water condensate
rate is higher than stage 2 water transfer limit for the smaller pore size module. Also, there
were a lot of condensate flowing out from the drain port at the bottom of the TMC housing for
the high flue gas moisture content tests for TMC setting B and C. Therefore for higher moisture
content flue gas, the 15nm membrane pore size should be used for all the TMC modules to
achieve the highest water transport rate for both stage 1 and stage 2.
020406080
100120140160180
70 80 90 100 110 120
Wat
er T
rans
fer
Rat
e (lb
/hr)
Stage 1 Water Inlet Temperature (ºF)
Stage1 Water Inlet Temperature EffectSetting A Stage 1Setting A Stage 2Setting A OverallSetting B Stage 1Setting B Stage 2Setting B OverallSetting C Stage 1Setting C Stage 2Setting C Overall
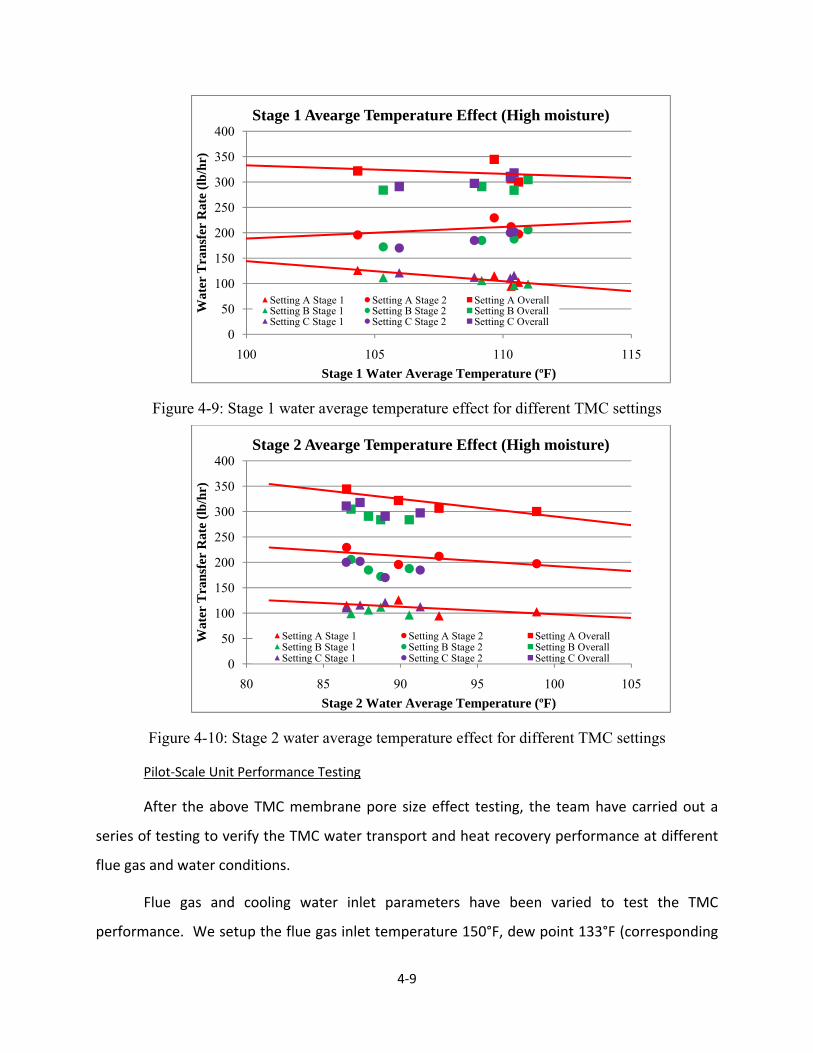
4‐9
Figure 4-9: Stage 1 water average temperature effect for different TMC settings
Figure 4-10: Stage 2 water average temperature effect for different TMC settings
Pilot‐Scale Unit Performance Testing
After the above TMC membrane pore size effect testing, the team have carried out a
series of testing to verify the TMC water transport and heat recovery performance at different
flue gas and water conditions.
Flue gas and cooling water inlet parameters have been varied to test the TMC
performance. We setup the flue gas inlet temperature 150°F, dew point 133°F (corresponding
0
50
100
150
200
250
300
350
400
100 105 110 115
Wat
er T
rans
fer
Rat
e (lb
/hr)
Stage 1 Water Average Temperature (ºF)
Stage 1 Avearge Temperature Effect (High moisture)
Setting A Stage 1 Setting A Stage 2 Setting A OverallSetting B Stage 1 Setting B Stage 2 Setting B OverallSetting C Stage 1 Setting C Stage 2 Setting C Overall
0
50
100
150
200
250
300
350
400
80 85 90 95 100 105
Wat
er T
rans
fer
Rat
e (lb
/hr)
Stage 2 Water Average Temperature (ºF)
Stage 2 Avearge Temperature Effect (High moisture)
Setting A Stage 1 Setting A Stage 2 Setting A OverallSetting B Stage 1 Setting B Stage 2 Setting B OverallSetting C Stage 1 Setting C Stage 2 Setting C Overall

4‐10
to stack O2 around 5%), stage 1 flow rate 7GPM and inlet temperature 80°F, stage 2 flow rate
10GPM and inlet temperature 70°F, as the baseline condition, and the flue gas volume flow rate
to TMC is 30,000 SCFH.
Figures 4‐11 and 4‐12 show the water transfer rates (stage 1, stage 2, and overall) at
different stage 1 water flow rates and water inlet temperatures. Higher flow rate or lower inlet
temperature increased the stage 1 water transfer rate; at the same time, the flue gas carries
less moisture to TMC stage 2, and stage 2 water transfer rate therefore decreased. The overall
water transfer rate change with Stage 1 water flow rate is not that significant due to the
balance effect of stage 2. On the other hand, the Stage 1 water temperature effect is stronger
than the water flow rate effect. Therefore, the overall TMC water transport rate will be affected
more by the steam condensate temperature instead of its flow rate to the TMC as the cooling
source for Stage 1.
Figures 4‐13 and 4‐14 show the water transfer rates (stage 1, stage 2, and overall) at
different stage 2 water flow rates and water inlet temperatures. The different inlet parameters
do not affect the TMC stage 1 performance, and the overall water transfer rate change is
exactly the same as stage 2 transfer rate change. Figures 4‐14 shows when the circulating
cooling water temperature changes from 65°F to 90°F, the TMC stage 2 and overall transfer
rate will decrease 50% and 30%, respectively. The stage 2 inlet temperature will be a key
parameter for the TMC water recovery performance.
Figure 4‐15 shows the TMC water transfer rates at different flue gas inlet temperatures.
The results proved that the flue gas inlet temperature has minimum effect on the TMC
performance at current range 150°F to 190°F, because sensible heat transfer rate is much less
than latent heat for the overall process. Figure 4‐16 shows the water transfer rates for different
flue gas inlet dew points, from 129°F to 155°F. The higher moisture concentration in flue gas
increased the TMC performance significantly, overall water transfer rate 150lb/hr for flue gas
dew point at 130°F, and 300 lb/hr for flue gas dew point at 155°F. The tests also indicate that
for higher moisture content cases, some of the condensed water vapor was not able to be
transferred into TMC water side, for the membrane already reached its transport limit at this
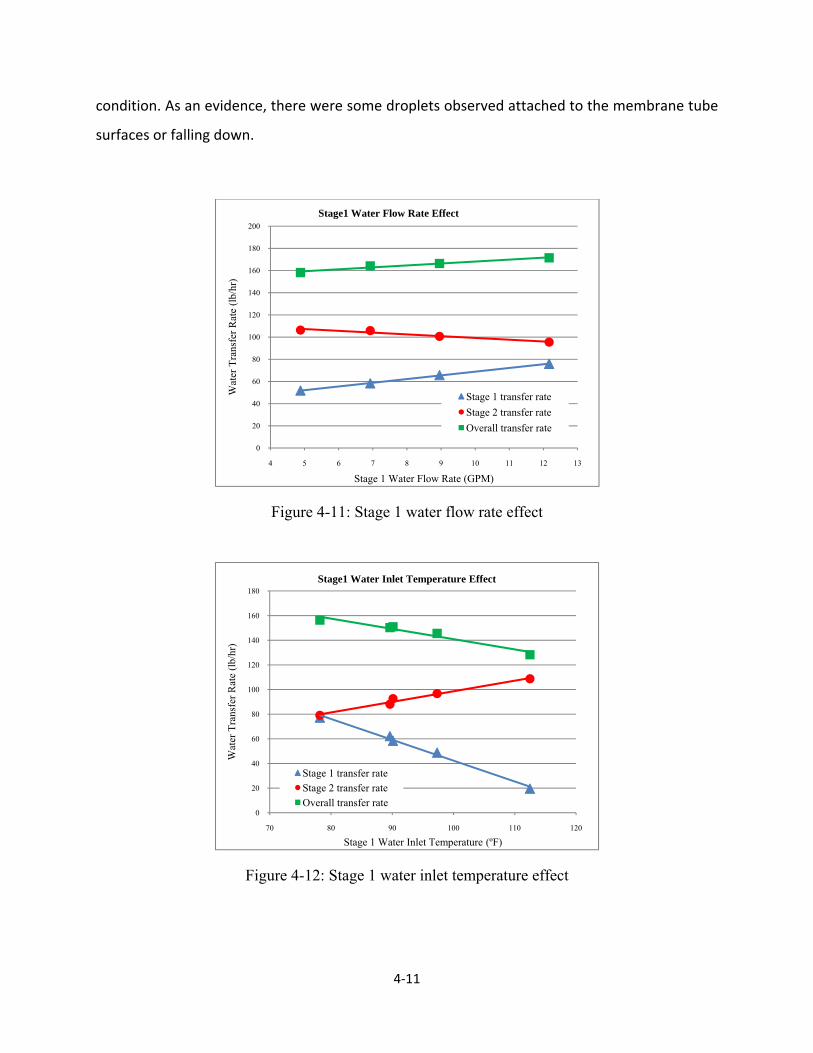
4‐11
condition. As an evidence, there were some droplets observed attached to the membrane tube
surfaces or falling down.
Figure 4-11: Stage 1 water flow rate effect
Figure 4-12: Stage 1 water inlet temperature effect
0
20
40
60
80
100
120
140
160
180
200
4 5 6 7 8 9 10 11 12 13
Wat
er T
rans
fer R
ate
(lb/h
r)
Stage 1 Water Flow Rate (GPM)
Stage1 Water Flow Rate Effect
Stage 1 transfer rateStage 2 transfer rateOverall transfer rate
0
20
40
60
80
100
120
140
160
180
70 80 90 100 110 120
Wat
er T
rans
fer R
ate
(lb/h
r)
Stage 1 Water Inlet Temperature (ºF)
Stage1 Water Inlet Temperature Effect
Stage 1 transfer rateStage 2 transfer rateOverall transfer rate
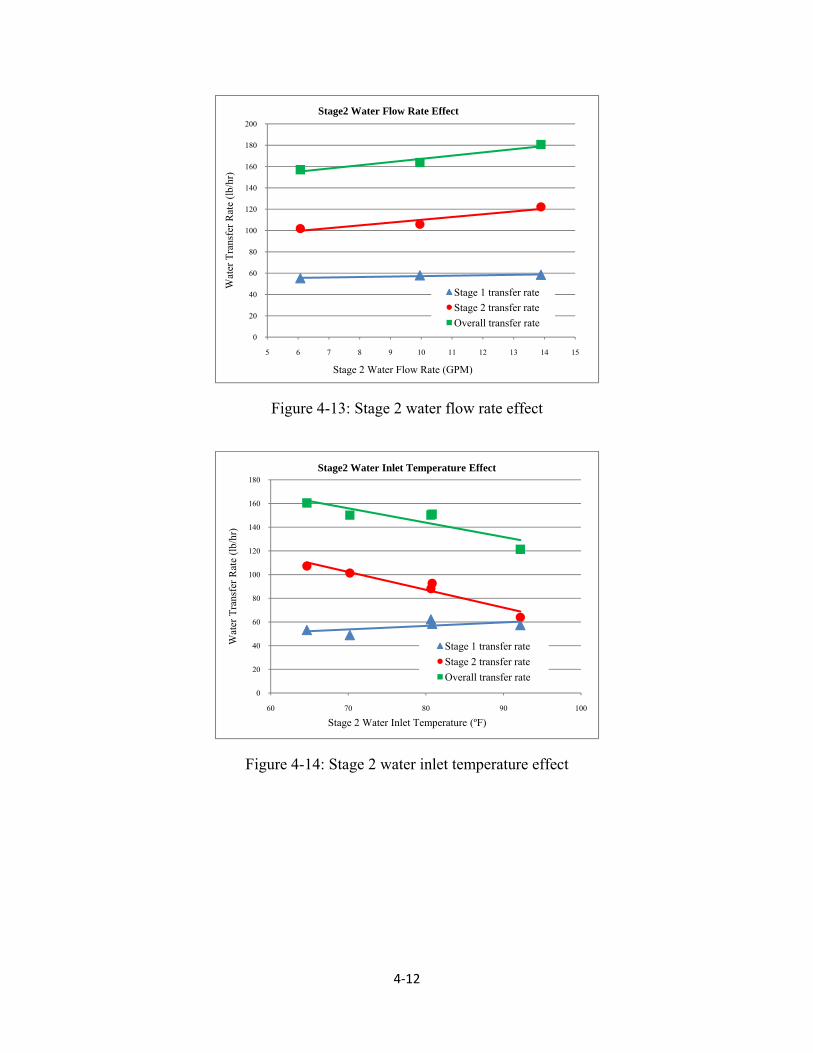
4‐12
Figure 4-13: Stage 2 water flow rate effect
Figure 4-14: Stage 2 water inlet temperature effect
0
20
40
60
80
100
120
140
160
180
200
5 6 7 8 9 10 11 12 13 14 15
Wat
er T
rans
fer R
ate
(lb/h
r)
Stage 2 Water Flow Rate (GPM)
Stage2 Water Flow Rate Effect
Stage 1 transfer rateStage 2 transfer rateOverall transfer rate
0
20
40
60
80
100
120
140
160
180
60 70 80 90 100
Wat
er T
rans
fer R
ate
(lb/h
r)
Stage 2 Water Inlet Temperature (ºF)
Stage2 Water Inlet Temperature Effect
Stage 1 transfer rateStage 2 transfer rateOverall transfer rate
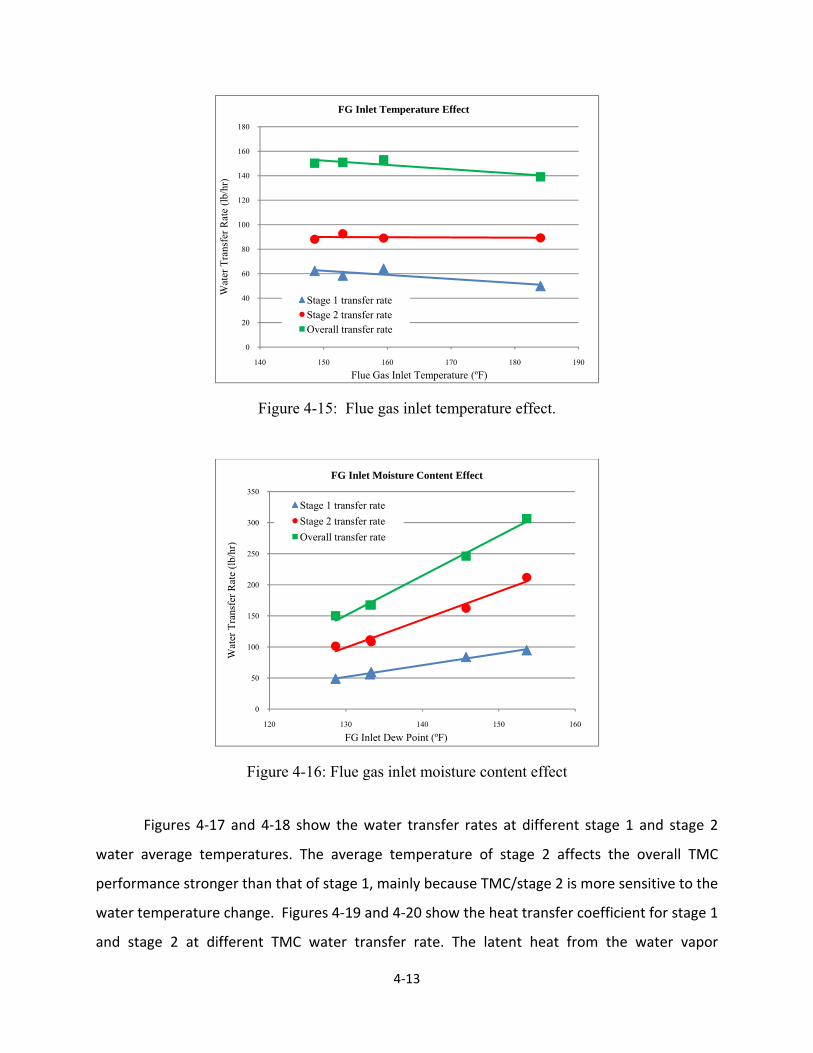
4‐13
Figure 4-15: Flue gas inlet temperature effect.
Figure 4-16: Flue gas inlet moisture content effect
Figures 4‐17 and 4‐18 show the water transfer rates at different stage 1 and stage 2
water average temperatures. The average temperature of stage 2 affects the overall TMC
performance stronger than that of stage 1, mainly because TMC/stage 2 is more sensitive to the
water temperature change. Figures 4‐19 and 4‐20 show the heat transfer coefficient for stage 1
and stage 2 at different TMC water transfer rate. The latent heat from the water vapor
0
20
40
60
80
100
120
140
160
180
140 150 160 170 180 190
Wat
er T
rans
fer R
ate
(lb/h
r)
Flue Gas Inlet Temperature (ºF)
FG Inlet Temperature Effect
Stage 1 transfer rateStage 2 transfer rateOverall transfer rate
0
50
100
150
200
250
300
350
120 130 140 150 160
Wat
er T
rans
fer R
ate
(lb/h
r)
FG Inlet Dew Point (ºF)
FG Inlet Moisture Content Effect
Stage 1 transfer rateStage 2 transfer rateOverall transfer rate
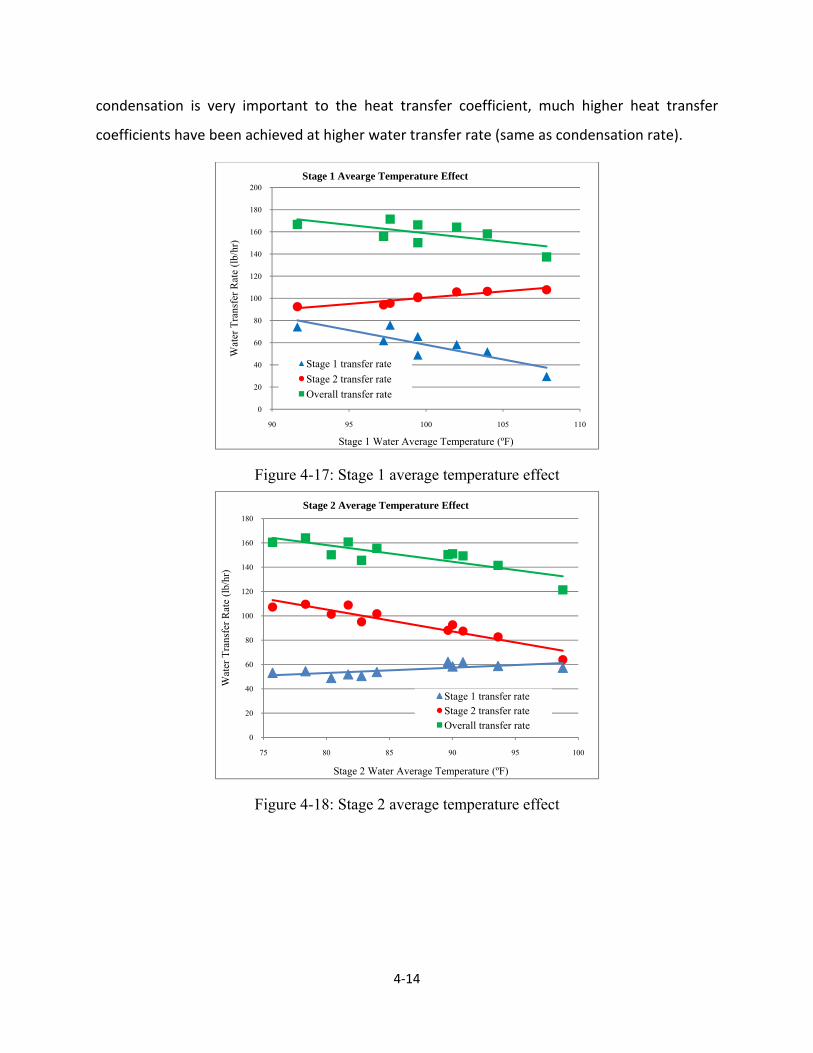
4‐14
condensation is very important to the heat transfer coefficient, much higher heat transfer
coefficients have been achieved at higher water transfer rate (same as condensation rate).
Figure 4-17: Stage 1 average temperature effect
Figure 4-18: Stage 2 average temperature effect
0
20
40
60
80
100
120
140
160
180
200
90 95 100 105 110
Wat
er T
rans
fer R
ate
(lb/h
r)
Stage 1 Water Average Temperature (ºF)
Stage 1 Avearge Temperature Effect
Stage 1 transfer rateStage 2 transfer rateOverall transfer rate
0
20
40
60
80
100
120
140
160
180
75 80 85 90 95 100
Wat
er T
rans
fer R
ate
(lb/h
r)
Stage 2 Water Average Temperature (ºF)
Stage 2 Average Temperature Effect
Stage 1 transfer rateStage 2 transfer rateOverall transfer rate
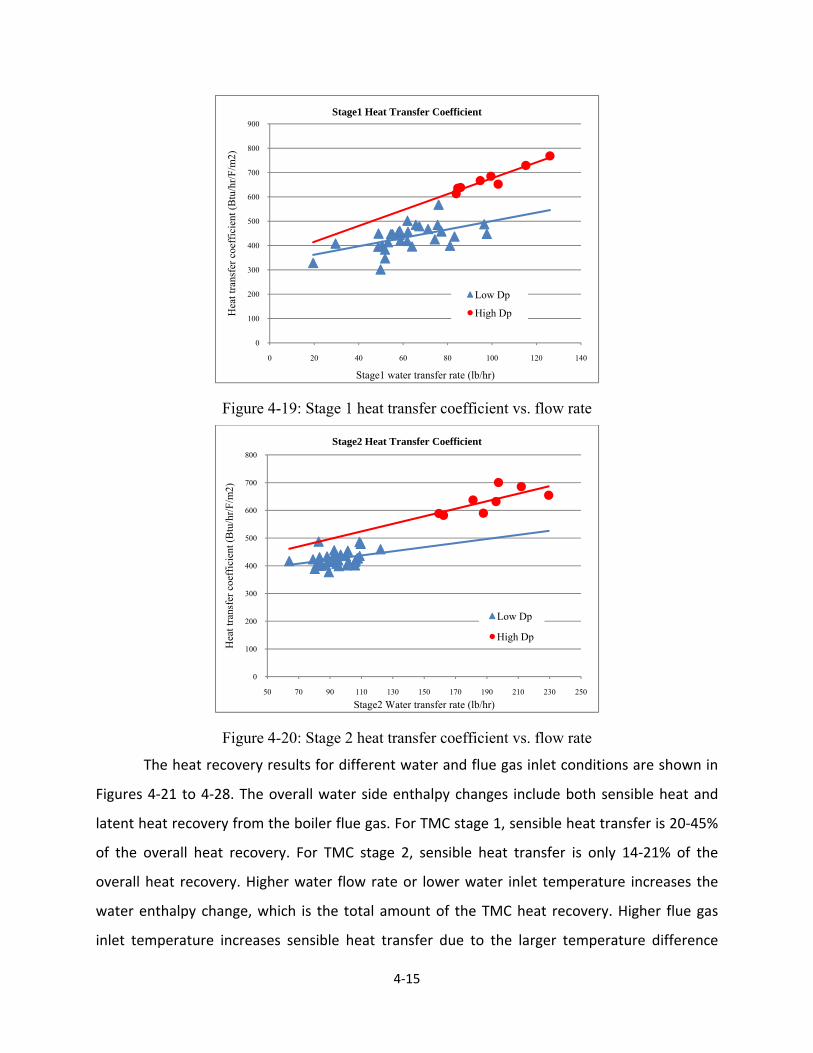
4‐15
Figure 4-19: Stage 1 heat transfer coefficient vs. flow rate
Figure 4-20: Stage 2 heat transfer coefficient vs. flow rate
The heat recovery results for different water and flue gas inlet conditions are shown in
Figures 4‐21 to 4‐28. The overall water side enthalpy changes include both sensible heat and
latent heat recovery from the boiler flue gas. For TMC stage 1, sensible heat transfer is 20‐45%
of the overall heat recovery. For TMC stage 2, sensible heat transfer is only 14‐21% of the
overall heat recovery. Higher water flow rate or lower water inlet temperature increases the
water enthalpy change, which is the total amount of the TMC heat recovery. Higher flue gas
inlet temperature increases sensible heat transfer due to the larger temperature difference
0
100
200
300
400
500
600
700
800
900
0 20 40 60 80 100 120 140
Hea
t tra
nsfe
r coe
ffic
ient
(Btu
/hr/F
/m2)
Stage1 water transfer rate (lb/hr)
Stage1 Heat Transfer Coefficient
Low Dp
High Dp
0
100
200
300
400
500
600
700
800
50 70 90 110 130 150 170 190 210 230 250
Hea
t tra
nsfe
r coe
ffic
ient
(Btu
/hr/F
/m2)
Stage2 Water transfer rate (lb/hr)
Stage2 Heat Transfer Coefficient
Low Dp
High Dp
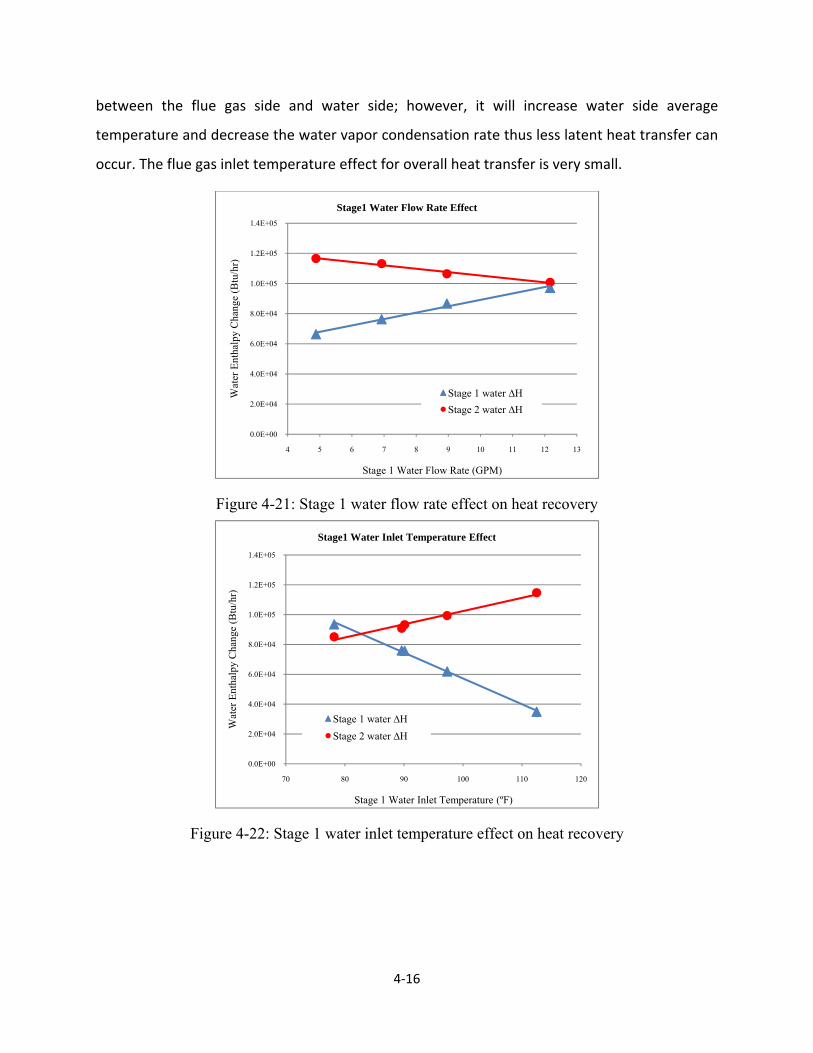
4‐16
between the flue gas side and water side; however, it will increase water side average
temperature and decrease the water vapor condensation rate thus less latent heat transfer can
occur. The flue gas inlet temperature effect for overall heat transfer is very small.
Figure 4-21: Stage 1 water flow rate effect on heat recovery
Figure 4-22: Stage 1 water inlet temperature effect on heat recovery
0.0E+00
2.0E+04
4.0E+04
6.0E+04
8.0E+04
1.0E+05
1.2E+05
1.4E+05
4 5 6 7 8 9 10 11 12 13
Wat
er E
ntha
lpy
Cha
nge
(Btu
/hr)
Stage 1 Water Flow Rate (GPM)
Stage1 Water Flow Rate Effect
Stage 1 water ∆HStage 2 water ∆H
0.0E+00
2.0E+04
4.0E+04
6.0E+04
8.0E+04
1.0E+05
1.2E+05
1.4E+05
70 80 90 100 110 120
Wat
er E
ntha
lpy
Cha
nge
(Btu
/hr)
Stage 1 Water Inlet Temperature (ºF)
Stage1 Water Inlet Temperature Effect
Stage 1 water ∆HStage 2 water ∆H
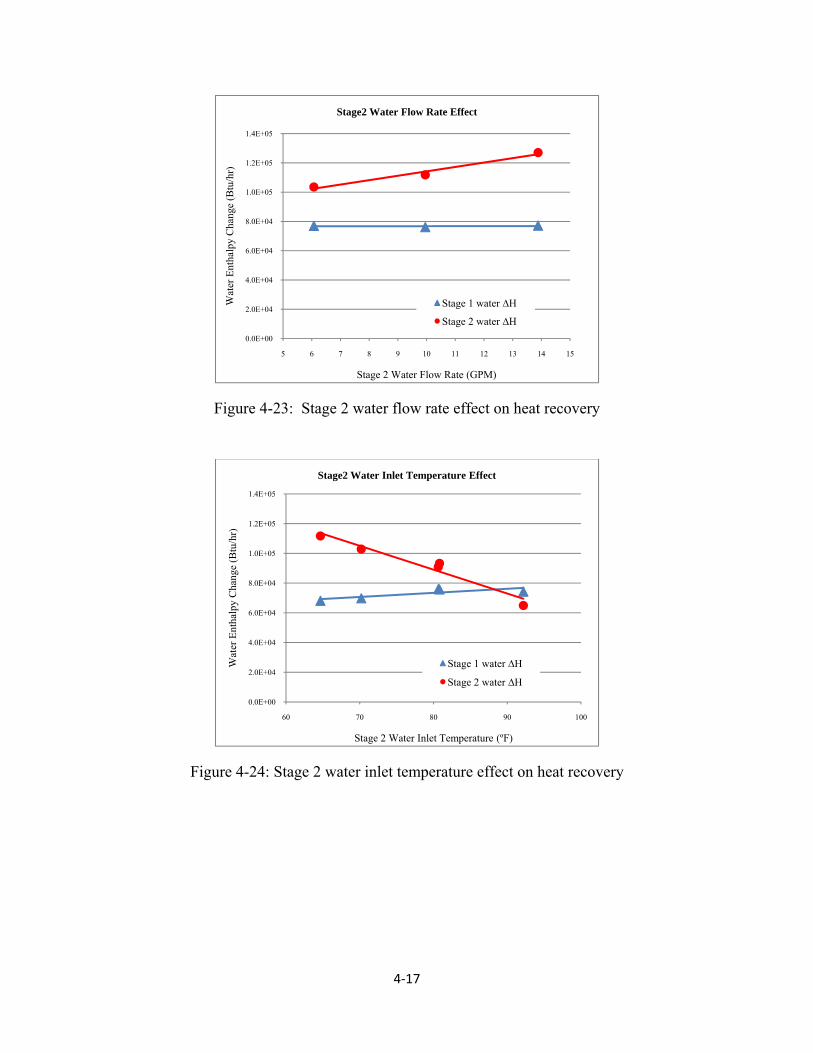
4‐17
Figure 4-23: Stage 2 water flow rate effect on heat recovery
Figure 4-24: Stage 2 water inlet temperature effect on heat recovery
0.0E+00
2.0E+04
4.0E+04
6.0E+04
8.0E+04
1.0E+05
1.2E+05
1.4E+05
5 6 7 8 9 10 11 12 13 14 15
Wat
er E
ntha
lpy
Cha
nge
(Btu
/hr)
Stage 2 Water Flow Rate (GPM)
Stage2 Water Flow Rate Effect
Stage 1 water ∆H
Stage 2 water ∆H
0.0E+00
2.0E+04
4.0E+04
6.0E+04
8.0E+04
1.0E+05
1.2E+05
1.4E+05
60 70 80 90 100
Wat
er E
ntha
lpy
Cha
nge
(Btu
/hr)
Stage 2 Water Inlet Temperature (ºF)
Stage2 Water Inlet Temperature Effect
Stage 1 water ∆H
Stage 2 water ∆H
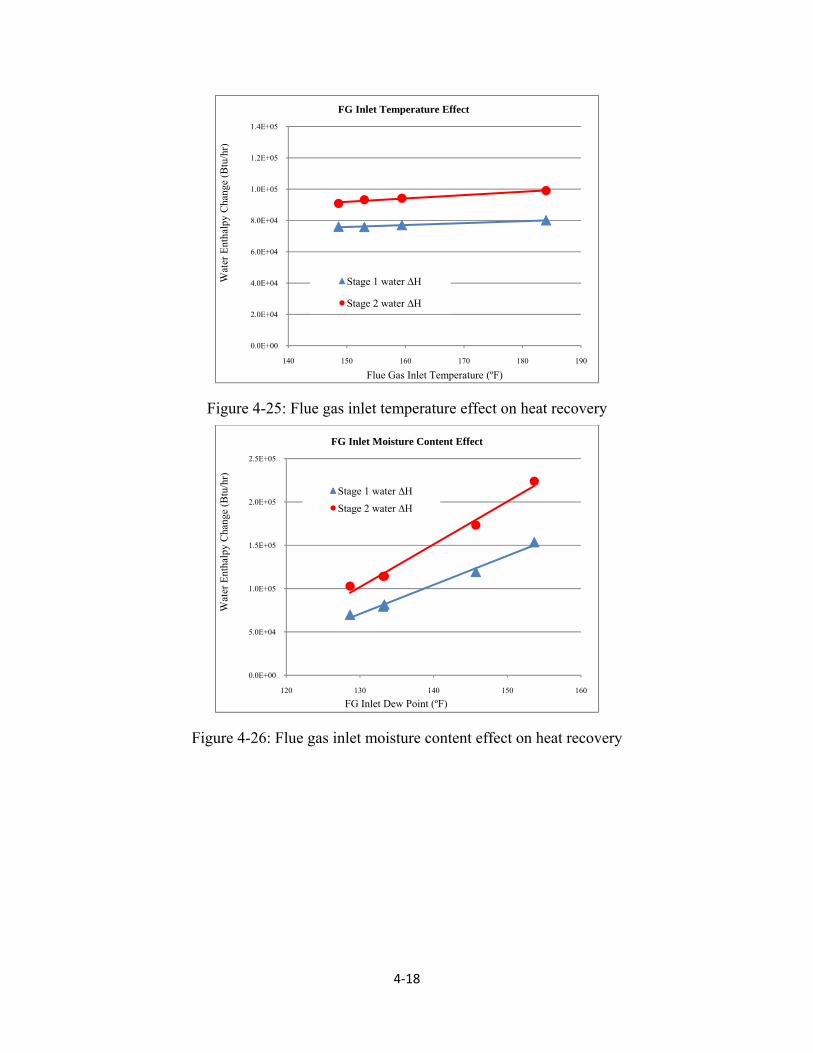
4‐18
Figure 4-25: Flue gas inlet temperature effect on heat recovery
Figure 4-26: Flue gas inlet moisture content effect on heat recovery
0.0E+00
2.0E+04
4.0E+04
6.0E+04
8.0E+04
1.0E+05
1.2E+05
1.4E+05
140 150 160 170 180 190
Wat
er E
ntha
lpy
Cha
nge
(Btu
/hr)
Flue Gas Inlet Temperature (ºF)
FG Inlet Temperature Effect
Stage 1 water ∆H
Stage 2 water ∆H
0.0E+00
5.0E+04
1.0E+05
1.5E+05
2.0E+05
2.5E+05
120 130 140 150 160
Wat
er E
ntha
lpy
Cha
nge
(Btu
/hr)
FG Inlet Dew Point (ºF)
FG Inlet Moisture Content Effect
Stage 1 water ∆HStage 2 water ∆H
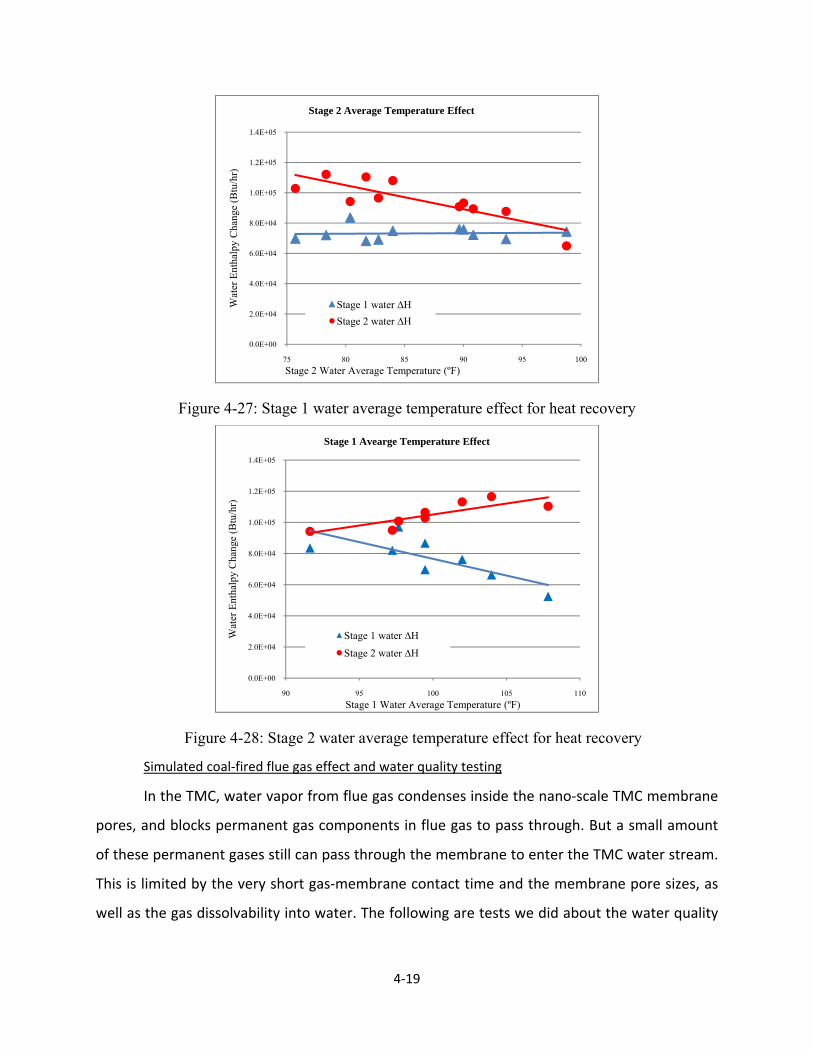
4‐19
Figure 4-27: Stage 1 water average temperature effect for heat recovery
Figure 4-28: Stage 2 water average temperature effect for heat recovery
Simulated coal‐fired flue gas effect and water quality testing
In the TMC, water vapor from flue gas condenses inside the nano‐scale TMC membrane
pores, and blocks permanent gas components in flue gas to pass through. But a small amount
of these permanent gases still can pass through the membrane to enter the TMC water stream.
This is limited by the very short gas‐membrane contact time and the membrane pore sizes, as
well as the gas dissolvability into water. The following are tests we did about the water quality
0.0E+00
2.0E+04
4.0E+04
6.0E+04
8.0E+04
1.0E+05
1.2E+05
1.4E+05
75 80 85 90 95 100
Wat
er E
ntha
lpy
Cha
nge
(Btu
/hr)
Stage 2 Water Average Temperature (ºF)
Stage 2 Average Temperature Effect
Stage 1 water ∆HStage 2 water ∆H
0.0E+00
2.0E+04
4.0E+04
6.0E+04
8.0E+04
1.0E+05
1.2E+05
1.4E+05
90 95 100 105 110
Wat
er E
ntha
lpy
Cha
nge
(Btu
/hr)
Stage 1 Water Average Temperature (ºF)
Stage 1 Avearge Temperature Effect
Stage 1 water ∆H
Stage 2 water ∆H
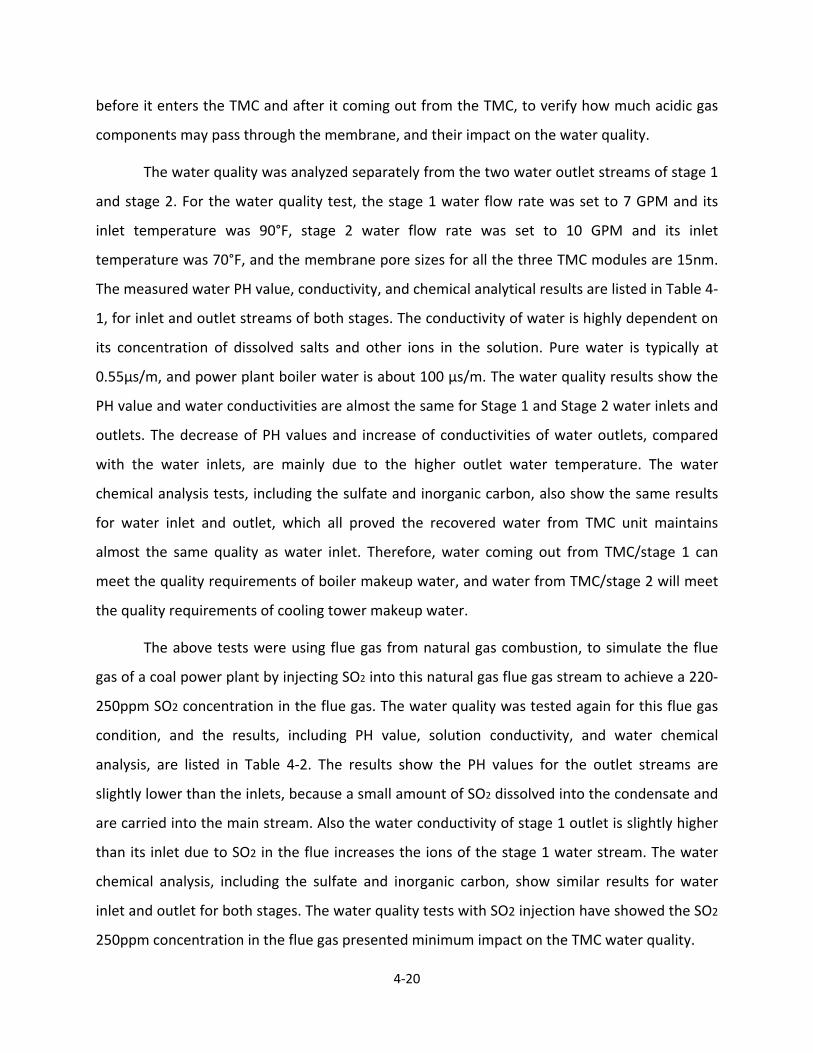
4‐20
before it enters the TMC and after it coming out from the TMC, to verify how much acidic gas
components may pass through the membrane, and their impact on the water quality.
The water quality was analyzed separately from the two water outlet streams of stage 1
and stage 2. For the water quality test, the stage 1 water flow rate was set to 7 GPM and its
inlet temperature was 90°F, stage 2 water flow rate was set to 10 GPM and its inlet
temperature was 70°F, and the membrane pore sizes for all the three TMC modules are 15nm.
The measured water PH value, conductivity, and chemical analytical results are listed in Table 4‐
1, for inlet and outlet streams of both stages. The conductivity of water is highly dependent on
its concentration of dissolved salts and other ions in the solution. Pure water is typically at
0.55μs/m, and power plant boiler water is about 100 μs/m. The water quality results show the
PH value and water conductivities are almost the same for Stage 1 and Stage 2 water inlets and
outlets. The decrease of PH values and increase of conductivities of water outlets, compared
with the water inlets, are mainly due to the higher outlet water temperature. The water
chemical analysis tests, including the sulfate and inorganic carbon, also show the same results
for water inlet and outlet, which all proved the recovered water from TMC unit maintains
almost the same quality as water inlet. Therefore, water coming out from TMC/stage 1 can
meet the quality requirements of boiler makeup water, and water from TMC/stage 2 will meet
the quality requirements of cooling tower makeup water.
The above tests were using flue gas from natural gas combustion, to simulate the flue
gas of a coal power plant by injecting SO2 into this natural gas flue gas stream to achieve a 220‐
250ppm SO2 concentration in the flue gas. The water quality was tested again for this flue gas
condition, and the results, including PH value, solution conductivity, and water chemical
analysis, are listed in Table 4‐2. The results show the PH values for the outlet streams are
slightly lower than the inlets, because a small amount of SO2 dissolved into the condensate and
are carried into the main stream. Also the water conductivity of stage 1 outlet is slightly higher
than its inlet due to SO2 in the flue increases the ions of the stage 1 water stream. The water
chemical analysis, including the sulfate and inorganic carbon, show similar results for water
inlet and outlet for both stages. The water quality tests with SO2 injection have showed the SO2
250ppm concentration in the flue gas presented minimum impact on the TMC water quality.
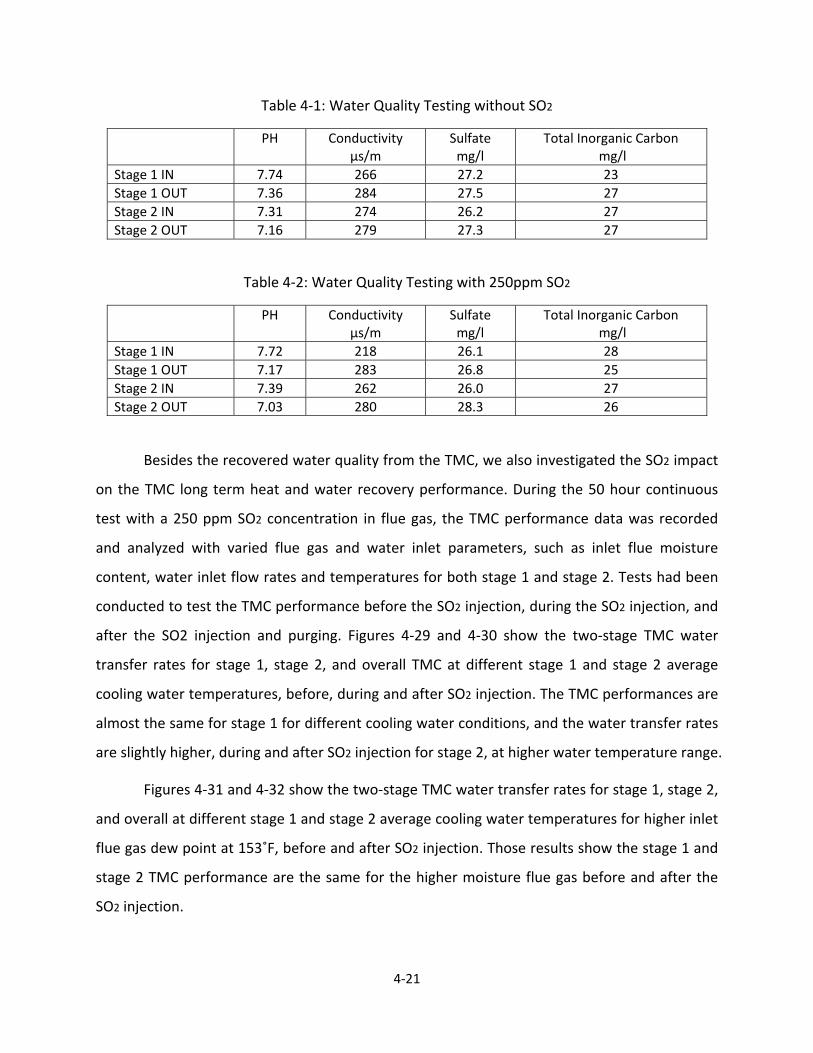
4‐21
Table 4‐1: Water Quality Testing without SO2
PH Conductivity μs/m
Sulfate mg/l
Total Inorganic Carbon mg/l
Stage 1 IN 7.74 266 27.2 23 Stage 1 OUT 7.36 284 27.5 27 Stage 2 IN 7.31 274 26.2 27 Stage 2 OUT 7.16 279 27.3 27
Table 4‐2: Water Quality Testing with 250ppm SO2
PH Conductivity μs/m
Sulfate mg/l
Total Inorganic Carbon mg/l
Stage 1 IN 7.72 218 26.1 28 Stage 1 OUT 7.17 283 26.8 25 Stage 2 IN 7.39 262 26.0 27 Stage 2 OUT 7.03 280 28.3 26
Besides the recovered water quality from the TMC, we also investigated the SO2 impact
on the TMC long term heat and water recovery performance. During the 50 hour continuous
test with a 250 ppm SO2 concentration in flue gas, the TMC performance data was recorded
and analyzed with varied flue gas and water inlet parameters, such as inlet flue moisture
content, water inlet flow rates and temperatures for both stage 1 and stage 2. Tests had been
conducted to test the TMC performance before the SO2 injection, during the SO2 injection, and
after the SO2 injection and purging. Figures 4‐29 and 4‐30 show the two‐stage TMC water
transfer rates for stage 1, stage 2, and overall TMC at different stage 1 and stage 2 average
cooling water temperatures, before, during and after SO2 injection. The TMC performances are
almost the same for stage 1 for different cooling water conditions, and the water transfer rates
are slightly higher, during and after SO2 injection for stage 2, at higher water temperature range.
Figures 4‐31 and 4‐32 show the two‐stage TMC water transfer rates for stage 1, stage 2,
and overall at different stage 1 and stage 2 average cooling water temperatures for higher inlet
flue gas dew point at 153˚F, before and after SO2 injection. Those results show the stage 1 and
stage 2 TMC performance are the same for the higher moisture flue gas before and after the
SO2 injection.
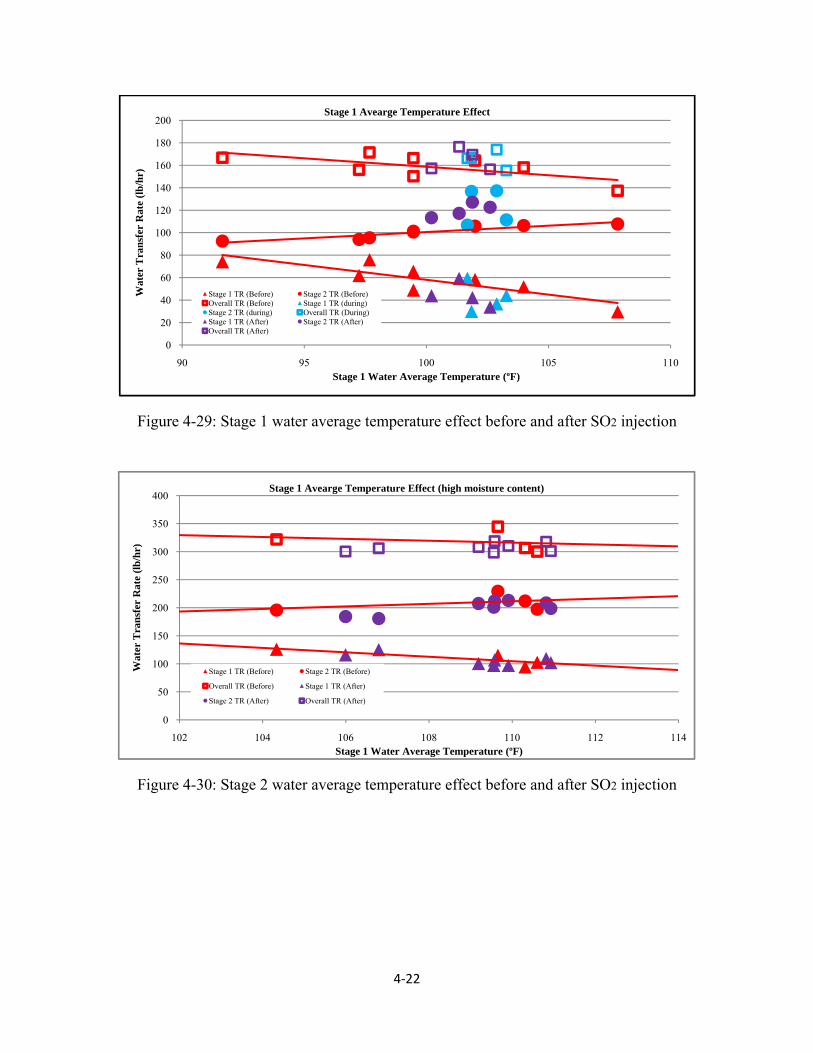
4‐22
Figure 4-29: Stage 1 water average temperature effect before and after SO2 injection
Figure 4-30: Stage 2 water average temperature effect before and after SO2 injection
0
20
40
60
80
100
120
140
160
180
200
90 95 100 105 110
Wat
er T
rans
fer
Rat
e (lb
/hr)
Stage 1 Water Average Temperature (ºF)
Stage 1 Avearge Temperature Effect
Stage 1 TR (Before) Stage 2 TR (Before)Overall TR (Before) Stage 1 TR (during)Stage 2 TR (during) Overall TR (During)Stage 1 TR (After) Stage 2 TR (After)Overall TR (After)
0
50
100
150
200
250
300
350
400
102 104 106 108 110 112 114
Wat
er T
rans
fer
Rat
e (lb
/hr)
Stage 1 Water Average Temperature (ºF)
Stage 1 Avearge Temperature Effect (high moisture content)
Stage 1 TR (Before) Stage 2 TR (Before)
Overall TR (Before) Stage 1 TR (After)
Stage 2 TR (After) Overall TR (After)

4‐23
Figure 4-31: Stage 1 water average temperature effect before and after SO2 injection at high moisture content
Figure 4-32: Stage 2 water average temperature effect before and after SO2 injection at high moisture content
0
20
40
60
80
100
120
140
160
180
200
70 75 80 85 90 95 100
Wat
er T
rans
fer
Rat
e (lb
/hr)
Stage 2 Water Average Temperature (ºF)
Stage 2 Avearge Temperature Effect
Stage 1 TR (Before) Stage 2 TR (Before)Overall TR (Before) Stage 1 TR (during)Stage 2 TR (during) Overall TR (During)Stage 1 TR (After) Stage 2 TR (After)Overall TR (After)
0
50
100
150
200
250
300
350
400
82 84 86 88 90 92 94 96 98 100 102
Wat
er T
rans
fer
Rat
e (lb
/hr)
Stage 2 Water Average Temperature (ºF)
Stage 2 Avearge Temperature Effect (high moisture content)Stage 1 TR (Before) Stage 2 TR (Before)
Overall TR (Before) Stage 1 TR (After)
Stage 2 TR (After) Overall TR (After)
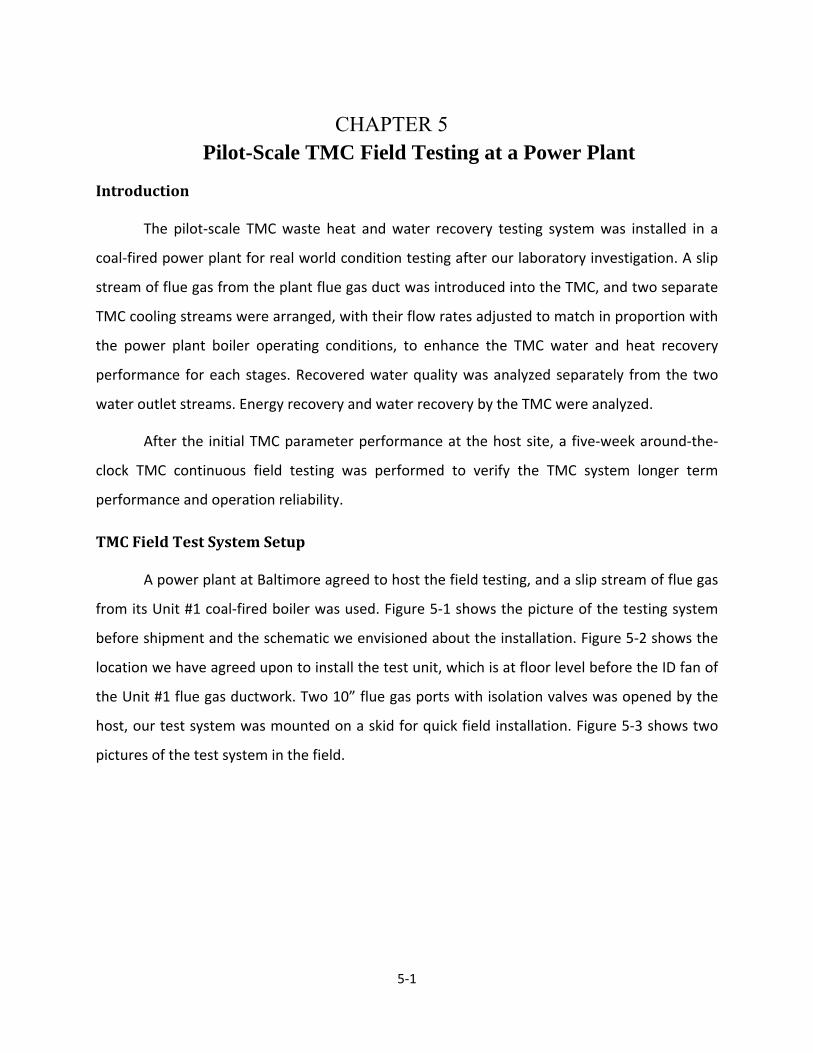
5‐1
CHAPTER 5 Pilot-Scale TMC Field Testing at a Power Plant
Introduction
The pilot‐scale TMC waste heat and water recovery testing system was installed in a
coal‐fired power plant for real world condition testing after our laboratory investigation. A slip
stream of flue gas from the plant flue gas duct was introduced into the TMC, and two separate
TMC cooling streams were arranged, with their flow rates adjusted to match in proportion with
the power plant boiler operating conditions, to enhance the TMC water and heat recovery
performance for each stages. Recovered water quality was analyzed separately from the two
water outlet streams. Energy recovery and water recovery by the TMC were analyzed.
After the initial TMC parameter performance at the host site, a five‐week around‐the‐
clock TMC continuous field testing was performed to verify the TMC system longer term
performance and operation reliability.
TMC Field Test System Setup
A power plant at Baltimore agreed to host the field testing, and a slip stream of flue gas
from its Unit #1 coal‐fired boiler was used. Figure 5‐1 shows the picture of the testing system
before shipment and the schematic we envisioned about the installation. Figure 5‐2 shows the
location we have agreed upon to install the test unit, which is at floor level before the ID fan of
the Unit #1 flue gas ductwork. Two 10” flue gas ports with isolation valves was opened by the
host, our test system was mounted on a skid for quick field installation. Figure 5‐3 shows two
pictures of the test system in the field.
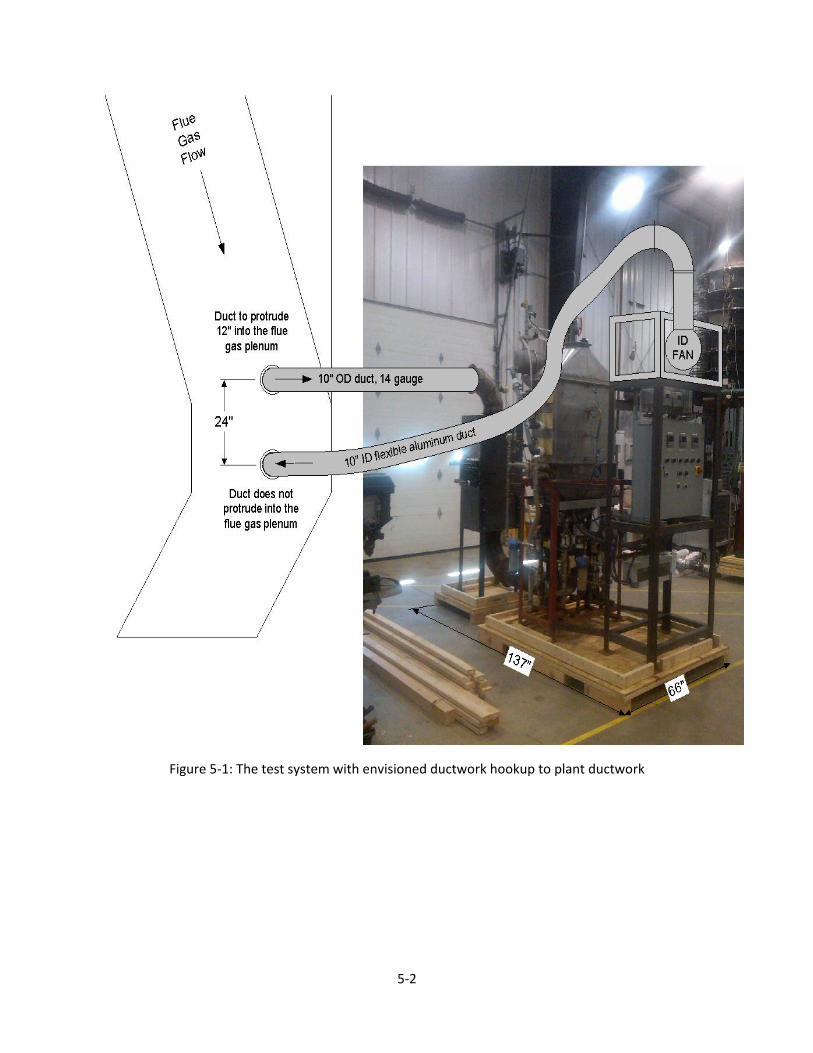
5‐2
Figure 5‐1: The test system with envisioned ductwork hookup to plant ductwork
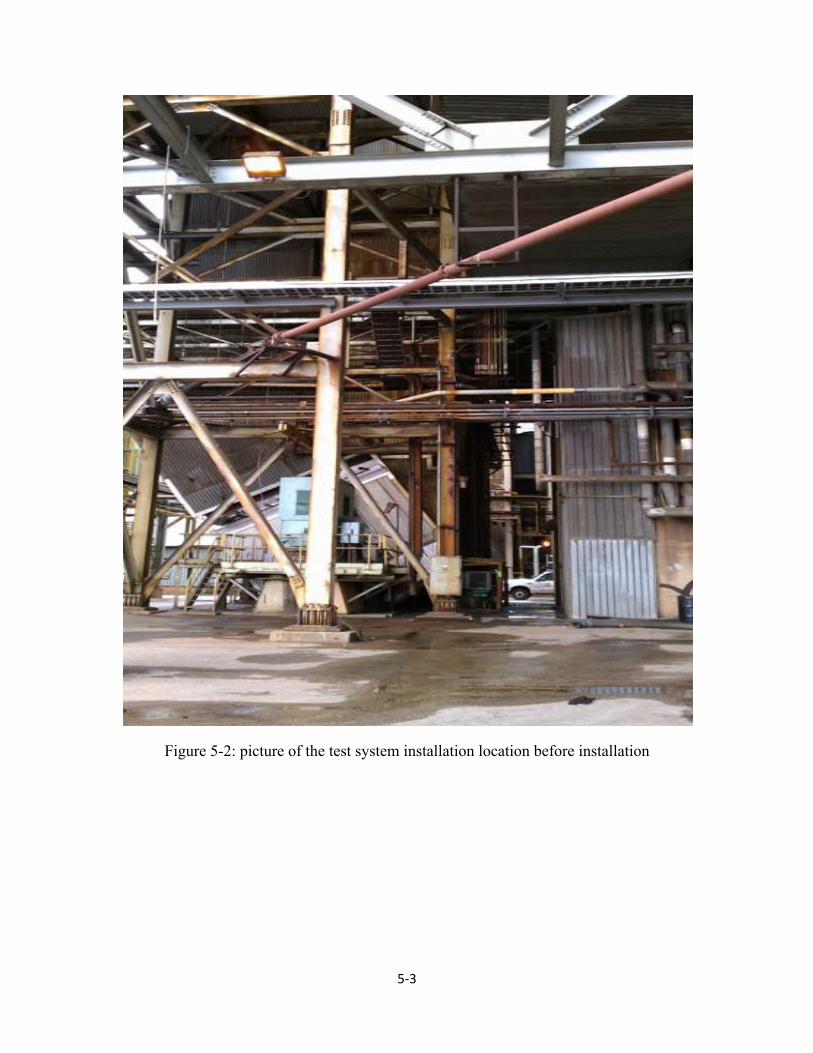
5‐3
Figure 5-2: picture of the test system installation location before installation

5‐4
Figure 5-3: Pilot unit in the field: left shows in installation, right shows in testing with a tent
Field Test Results
1. TMC real world performance and long term operation
The long term TMC power plant flue gas slip stream test has been carried out at a host
power plant in Baltimore area for 31 days around‐the‐clock, from Aug 17 2011 to Sep 16, 2011.
The whole pilot test system was able to run automatically with only adjustment needs for
different parameter testing.
Flue gas flow rates flowing through the pilot TMC unit was from 24,000 SCFH to 40,000
SCFH, by adjusting the TMC system ID fan speed and with varied plant boiler operation
conditions. Typical flue gas component concentrations in volume are listed at Table 5‐1
Table 5‐1: Host site flue gas components by measurement
Component Concentration (in volume)
CO2 12.4%
H2O 10.7%
N2 71.9%
SO2 0.043%
CO2 5.0%

5‐5
The flue gas inlet dew point was 118°F based on the water vapor volume concentration,
and measured flue gas inlet dew points were in the range from 118°F to 122°F. The flue gas
inlet temperatures were from 150°F to 190°F after passing through a flue gas heat exchanger.
For the long term field test, TMC cooling water flow rates were set at 7 GPM for TMC
stage 1 and 10 GPM for stage 2. The stage 1 inlet water temperatures were from 80°F to 100°F,
and stage 2 inlet water temperatures were from 78°F to 85°F.
Figures 5‐4 to 5‐6 show the TMC performance over the whole long term field test period.
Results show the TMC pilot unit can achieve relatively stable performance for the five weeks
real world field test, considering the plant boiler had to follow the load demand that caused
flue gas parameter changes beyond our control.
Figure 5-4: Flue gas pressure drop through the pilot unit for the whole long term test period
0
0.2
0.4
0.6
0.8
1
1.2
1.4
1.6
1.8
0 1 2 3 4 5 6 7 8 9 10 11 12 13 14 15 16 17 18 19 20 21 22 23 24 25 26 27 28 29 30
FG pressure drop
(inch‐water)
Time (Day)
Plant boiler shut down
High flue gas flow rate
Low flue gas flow rate
Design flue gas flow rate
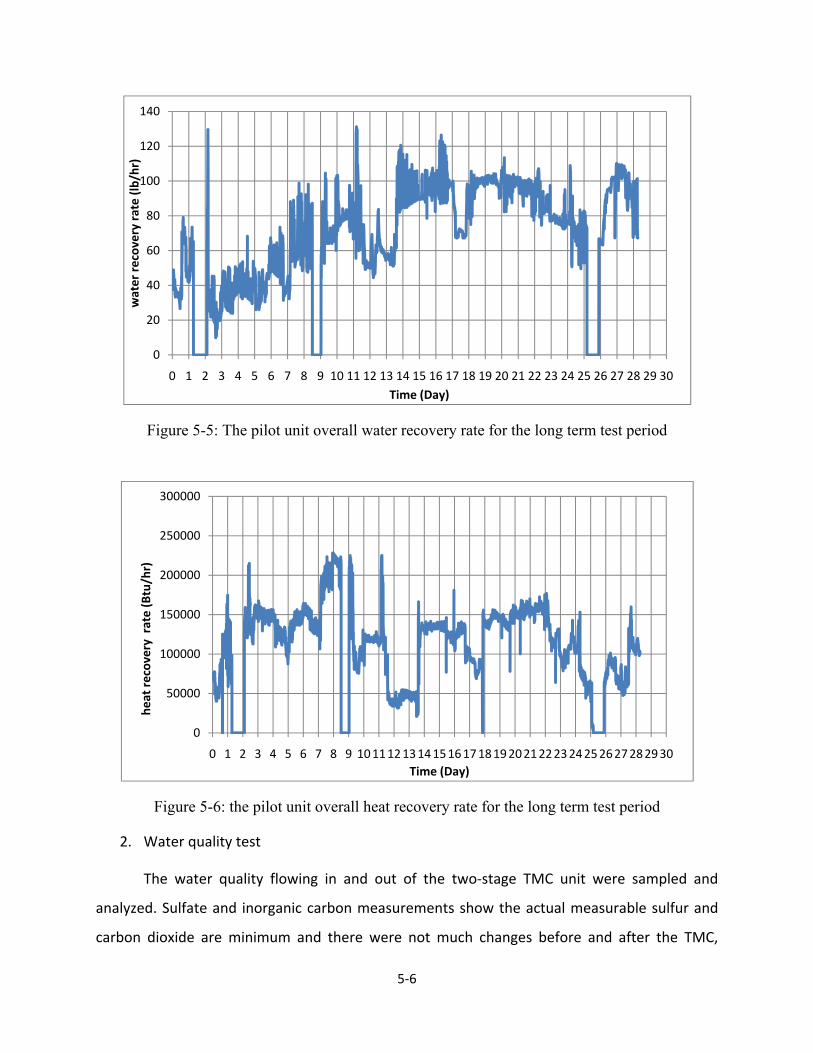
5‐6
Figure 5-5: The pilot unit overall water recovery rate for the long term test period
Figure 5-6: the pilot unit overall heat recovery rate for the long term test period
2. Water quality test
The water quality flowing in and out of the two‐stage TMC unit were sampled and
analyzed. Sulfate and inorganic carbon measurements show the actual measurable sulfur and
carbon dioxide are minimum and there were not much changes before and after the TMC,
0
20
40
60
80
100
120
140
0 1 2 3 4 5 6 7 8 9 10 11 12 13 14 15 16 17 18 19 20 21 22 23 24 25 26 27 28 29 30
water recovery rate (lb/hr)
Time (Day)
0
50000
100000
150000
200000
250000
300000
0 1 2 3 4 5 6 7 8 9 101112131415161718192021222324252627282930
heat re
covery rate (Btu/hr)
Time (Day)

5‐7
which means minimum contamination passing through the TMC membrane. PH value stays the
same for the water inlet and outlet, the water sample chemical analysis also confirmed
minimum dissolved acid gases passing through, which should have affected the PH values if
there were a relatively large amount passed through the membrane.
Table 5‐2 Water Chemical Analysis
Sample Number
Sample Description Sulfate, mg/l Total Inorganic Carbon, mg/l
pH
111607‐001 Fresh water supply 17.8 24 6
111607‐002 Stage 1 outlet 15.4 23 6
111607‐003 Stage 2 outlet 50.3 16 6
3. TMC membrane fouling test
During the long term field test period, the membrane transport rates at the beginning
and at the end were compared to check any membrane fouling effect which can significantly
reduce the membrane transport performance. Figure 5‐7 shows minimum performance
difference between the two results, which verified there was minimum membrane fouling
during this testing period.
Figure 5-7: Water transport rates at the beginning and at the end of the long term field test
0
10
20
30
40
50
60
70
80
90
22000 24000 26000 28000 30000 32000
Wat
er tr
ansp
ort r
ate,
lb/h
Flue gas flow rate (SCFH)
Startup Stage 1
Startup Stage 2
Startup Overall
End Stage 1
End Stage 2
End overall
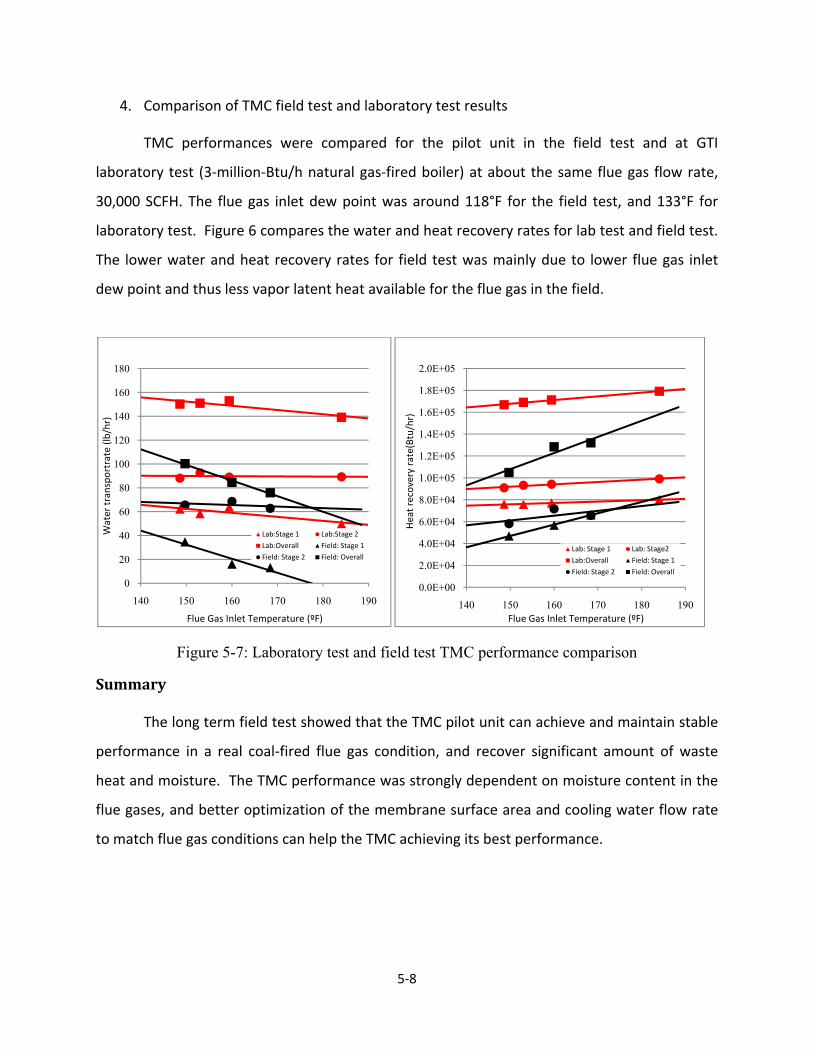
5‐8
4. Comparison of TMC field test and laboratory test results
TMC performances were compared for the pilot unit in the field test and at GTI
laboratory test (3‐million‐Btu/h natural gas‐fired boiler) at about the same flue gas flow rate,
30,000 SCFH. The flue gas inlet dew point was around 118°F for the field test, and 133°F for
laboratory test. Figure 6 compares the water and heat recovery rates for lab test and field test.
The lower water and heat recovery rates for field test was mainly due to lower flue gas inlet
dew point and thus less vapor latent heat available for the flue gas in the field.
Figure 5-7: Laboratory test and field test TMC performance comparison
Summary
The long term field test showed that the TMC pilot unit can achieve and maintain stable
performance in a real coal‐fired flue gas condition, and recover significant amount of waste
heat and moisture. The TMC performance was strongly dependent on moisture content in the
flue gases, and better optimization of the membrane surface area and cooling water flow rate
to match flue gas conditions can help the TMC achieving its best performance.
0
20
40
60
80
100
120
140
160
180
140 150 160 170 180 190
Water transportrate (lb
/hr)
Flue Gas Inlet Temperature (ºF)
Lab:Stage 1 Lab:Stage 2
Lab:Overall Field: Stage 1
Field: Stage 2 Field: Overall
0.0E+00
2.0E+04
4.0E+04
6.0E+04
8.0E+04
1.0E+05
1.2E+05
1.4E+05
1.6E+05
1.8E+05
2.0E+05
140 150 160 170 180 190
Heat recovery rate(Btu/hr)
Flue Gas Inlet Temperature (ºF)
Lab: Stage 1 Lab: Stage2
Lab:Overall Field: Stage 1
Field: Stage 2 Field: Overall
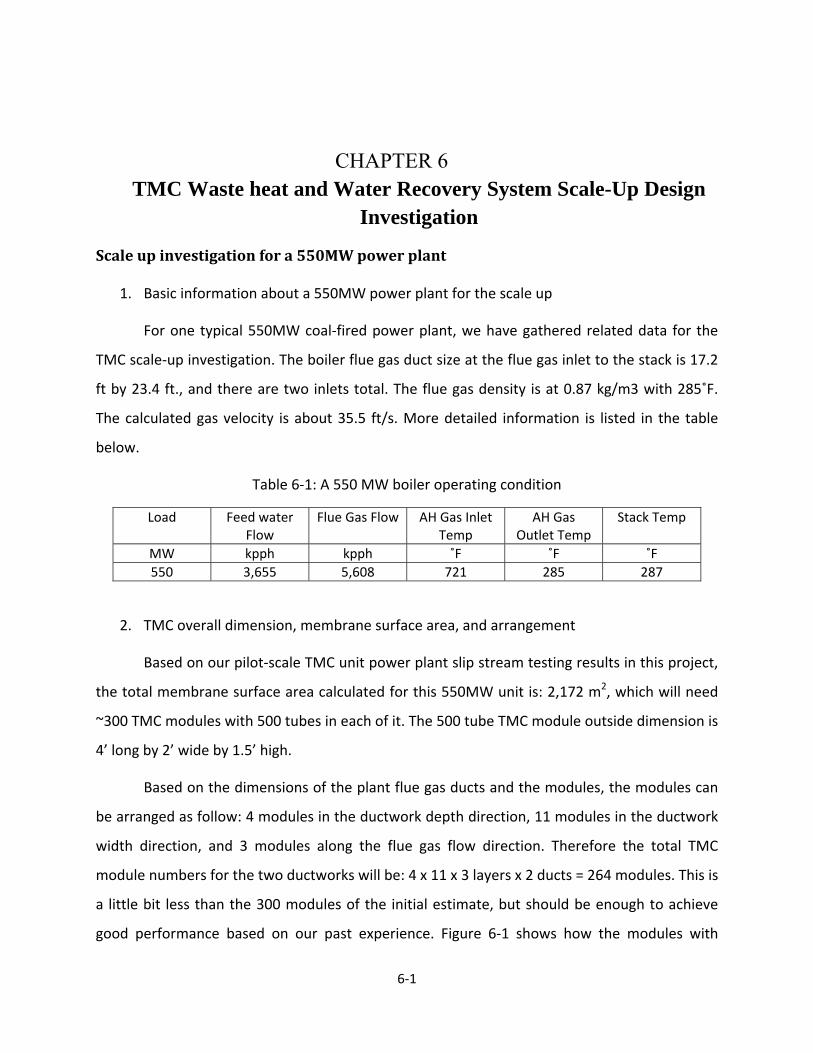
6‐1
CHAPTER 6 TMC Waste heat and Water Recovery System Scale-Up Design
Investigation
Scale up investigation for a 550MW power plant
1. Basic information about a 550MW power plant for the scale up
For one typical 550MW coal‐fired power plant, we have gathered related data for the
TMC scale‐up investigation. The boiler flue gas duct size at the flue gas inlet to the stack is 17.2
ft by 23.4 ft., and there are two inlets total. The flue gas density is at 0.87 kg/m3 with 285˚F.
The calculated gas velocity is about 35.5 ft/s. More detailed information is listed in the table
below.
Table 6‐1: A 550 MW boiler operating condition
Load Feed water Flow
Flue Gas Flow AH Gas Inlet Temp
AH Gas Outlet Temp
Stack Temp
MW kpph kpph ˚F ˚F ˚F 550 3,655 5,608 721 285 287
2. TMC overall dimension, membrane surface area, and arrangement
Based on our pilot‐scale TMC unit power plant slip stream testing results in this project,
the total membrane surface area calculated for this 550MW unit is: 2,172 m2, which will need
~300 TMC modules with 500 tubes in each of it. The 500 tube TMC module outside dimension is
4’ long by 2’ wide by 1.5’ high.
Based on the dimensions of the plant flue gas ducts and the modules, the modules can
be arranged as follow: 4 modules in the ductwork depth direction, 11 modules in the ductwork
width direction, and 3 modules along the flue gas flow direction. Therefore the total TMC
module numbers for the two ductworks will be: 4 x 11 x 3 layers x 2 ducts = 264 modules. This is
a little bit less than the 300 modules of the initial estimate, but should be enough to achieve
good performance based on our past experience. Figure 6‐1 shows how the modules with
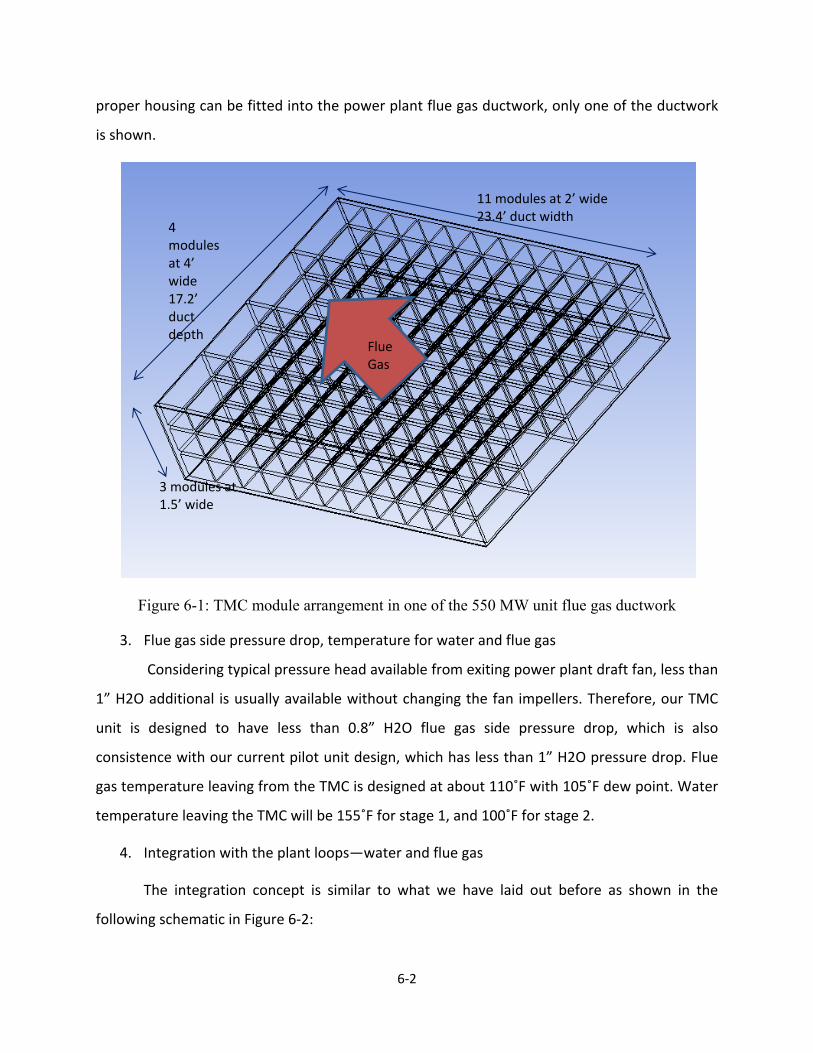
6‐2
proper housing can be fitted into the power plant flue gas ductwork, only one of the ductwork
is shown.
Figure 6-1: TMC module arrangement in one of the 550 MW unit flue gas ductwork
3. Flue gas side pressure drop, temperature for water and flue gas
Considering typical pressure head available from exiting power plant draft fan, less than
1” H2O additional is usually available without changing the fan impellers. Therefore, our TMC
unit is designed to have less than 0.8” H2O flue gas side pressure drop, which is also
consistence with our current pilot unit design, which has less than 1” H2O pressure drop. Flue
gas temperature leaving from the TMC is designed at about 110˚F with 105˚F dew point. Water
temperature leaving the TMC will be 155˚F for stage 1, and 100˚F for stage 2.
4. Integration with the plant loops—water and flue gas
The integration concept is similar to what we have laid out before as shown in the
following schematic in Figure 6‐2:
11 modules at 2’ wide 23.4’ duct width
4 modules at 4’ wide 17.2’ duct depth
3 modules at 1.5’ wide
Flue Gas
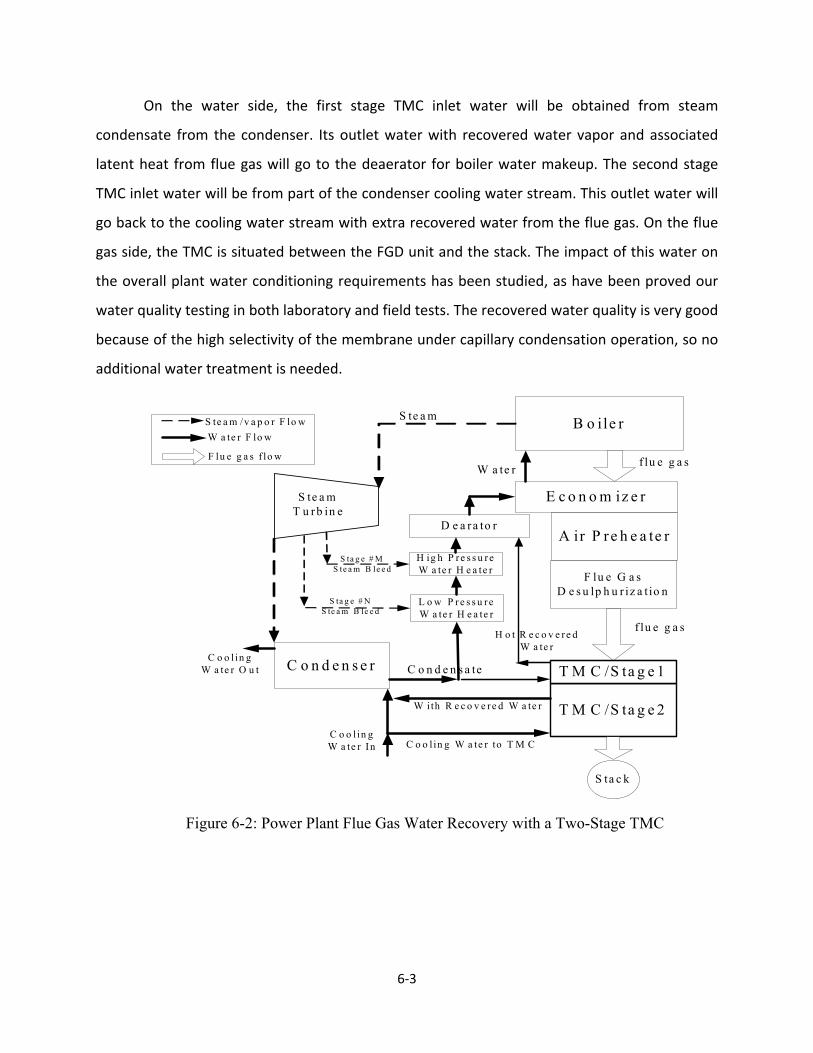
6‐3
On the water side, the first stage TMC inlet water will be obtained from steam
condensate from the condenser. Its outlet water with recovered water vapor and associated
latent heat from flue gas will go to the deaerator for boiler water makeup. The second stage
TMC inlet water will be from part of the condenser cooling water stream. This outlet water will
go back to the cooling water stream with extra recovered water from the flue gas. On the flue
gas side, the TMC is situated between the FGD unit and the stack. The impact of this water on
the overall plant water conditioning requirements has been studied, as have been proved our
water quality testing in both laboratory and field tests. The recovered water quality is very good
because of the high selectivity of the membrane under capillary condensation operation, so no
additional water treatment is needed.
B o ile r
E c o n o m iz e r
A ir P re h e a te r
T M C /S ta g e 2
f lu e g a s
S te a m
L o w P r e s s u r eW a te r H e a te r
F lu e G a s D e s u lp h u r iz a t io n
S ta c k
f lu e g a s
S te a m T u r b in e
C o n d e n s e r
C o o l in g W a te r In
C o o l in g W a te r O u t C o n d e n s a te
H ig h P r e s s u r eW a te r H e a te r
S ta g e # M S te a m B le e d
S ta g e # N S te a m B le e d
W a te r
H o t R e c o v e r e d W a te r
S te a m /v a p o r F lo wW a te r F lo w
F lu e g a s f lo w
T M C /S ta g e 1
D e a ra to r
W ith R e c o v e r e d W a te r
C o o l in g W a te r to T M C
Figure 6-2: Power Plant Flue Gas Water Recovery with a Two-Stage TMC
7‐1
CHAPTER 7 Technology Application and Commercialization
The TMC technology was developed initially for natural gas boiler flue gas heat and
water recovery. The present project has developed a new design to expand its use for power
plant flue gas applications. This technology can recover high‐purity water from flue gas and
reuse it as boiler feed water. It is expected that the recovered water will exceed the boiler fresh
makeup water requirement, and so it can be used for other purposes such as cooling tower
water makeup, FGD water makeup, and/or other plant uses. When this high‐purity mineral‐free
water is used for cooling tower water makeup, it also reduces the water blowdown amount
from the cooling water stream, which may account for up to 10% of its total makeup water. Not
only does this technology save water and water treatment cost, it can also improve the energy
efficiency of the power plant by replacing the cold makeup water with this preheated water. It
also minimizes or even eliminates reheating the flue gas after the FGD process. The improved
boiler efficiency sends less emission into the atmosphere and reduces solid waste.
The economic benefits of water vapor removal from flue gas are substantial. Typically it
reduces the flue gas dew point from 140°F to 100°F, which corresponds to recovering of 84 lb/h
water per 1 million Btu/h firing rate. For the year 2000, the net U.S. electric power generation
was 3,802 billion kWh, of which coal‐fired generation was 1,966 billion kWh, and natural gas‐
fired generation was another 613 billion kWh1. Because this water recovery technology could
be used for both coal‐ and gas‐fired power plants, up to 2,579 billion kWh of capacity could be
impacted by this technology. Assuming 35% baseline fuel‐to‐electricity efficiency, the total
firing rate is estimated at 25 trillion Btu/h. The corresponding total water saving, if this
technology were applied to all U.S. power generation, would be 8.3 billion tons per year. At a
typical water price of $0.52/ton2, the total annual U.S. cost saving in water alone would be $4.3
1 Electric Power Annual 2000, Volume II. 2 http://www.watertechonline.com
7‐2
billion/year. In addition to the cost savings from reduced water requirement, the use of TMC
can increase boiler thermal efficiency as described above by recovering the vapor latent heat.
TMC technology application and economic analysis
The following are some case analyses on how to use the recovered water from the flue
gas system, and potential benefit analysis, which mainly covers three areas:
• Boiler feedwater (BFW) make up water • FGD make up water • Water usage for RRI/SNCR system to dilute urea solution prior to injection
Calculation for boiler feedwater (BFW) and FGD makeup water saving
Assumption:
Demineralized water price = $5.25/1000-gal
Boiler feedwater (BFW) make up water usually requires ~10 gals/MWh, data from
Reference3, as shown in Figure 7-1.
3 DOE/NETL‐402/080108. “Water Requirements for Existing and Emerging Thermoelectric Plant Technologies.” August 2008 (April2009 Revision)
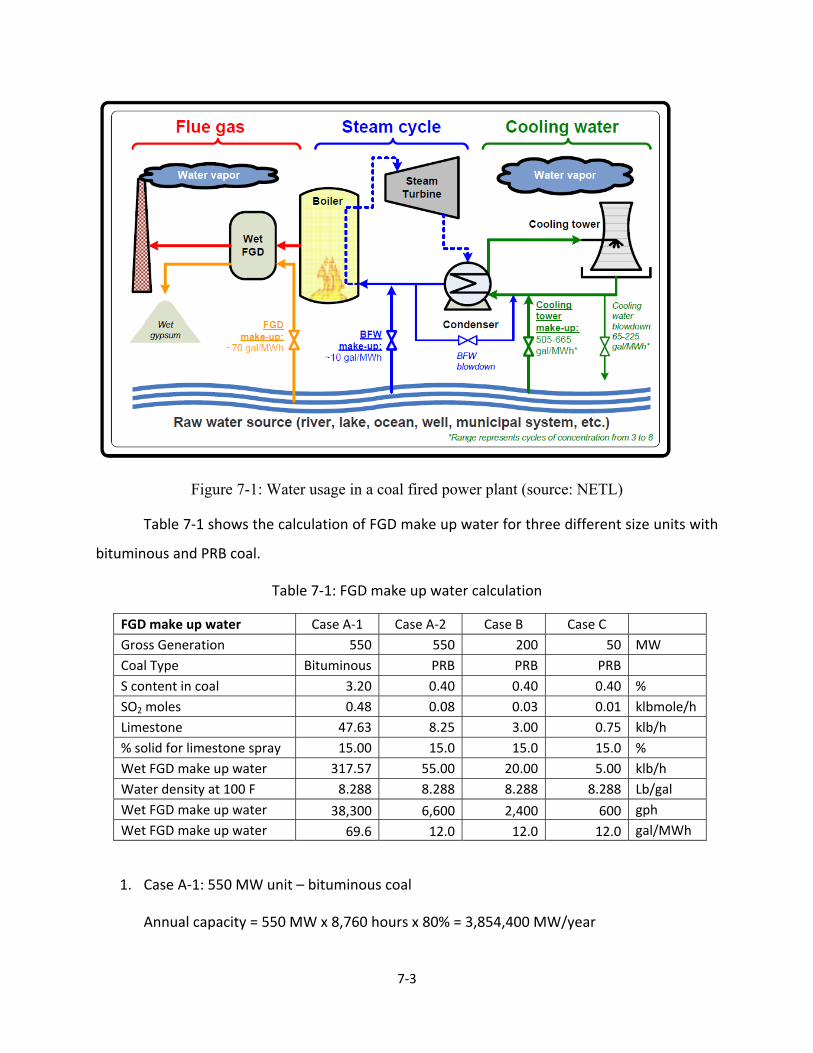
7‐3
Figure 7-1: Water usage in a coal fired power plant (source: NETL)
Table 7‐1 shows the calculation of FGD make up water for three different size units with
bituminous and PRB coal.
Table 7‐1: FGD make up water calculation
FGD make up water Case A‐1 Case A‐2 Case B Case C Gross Generation 550 550 200 50 MW Coal Type Bituminous PRB PRB PRB S content in coal 3.20 0.40 0.40 0.40 % SO2 moles 0.48 0.08 0.03 0.01 klbmole/h Limestone 47.63 8.25 3.00 0.75 klb/h % solid for limestone spray 15.00 15.0 15.0 15.0 % Wet FGD make up water 317.57 55.00 20.00 5.00 klb/h Water density at 100 F 8.288 8.288 8.288 8.288 Lb/gal Wet FGD make up water 38,300 6,600 2,400 600 gph Wet FGD make up water 69.6 12.0 12.0 12.0 gal/MWh
1. Case A‐1: 550 MW unit – bituminous coal
Annual capacity = 550 MW x 8,760 hours x 80% = 3,854,400 MW/year
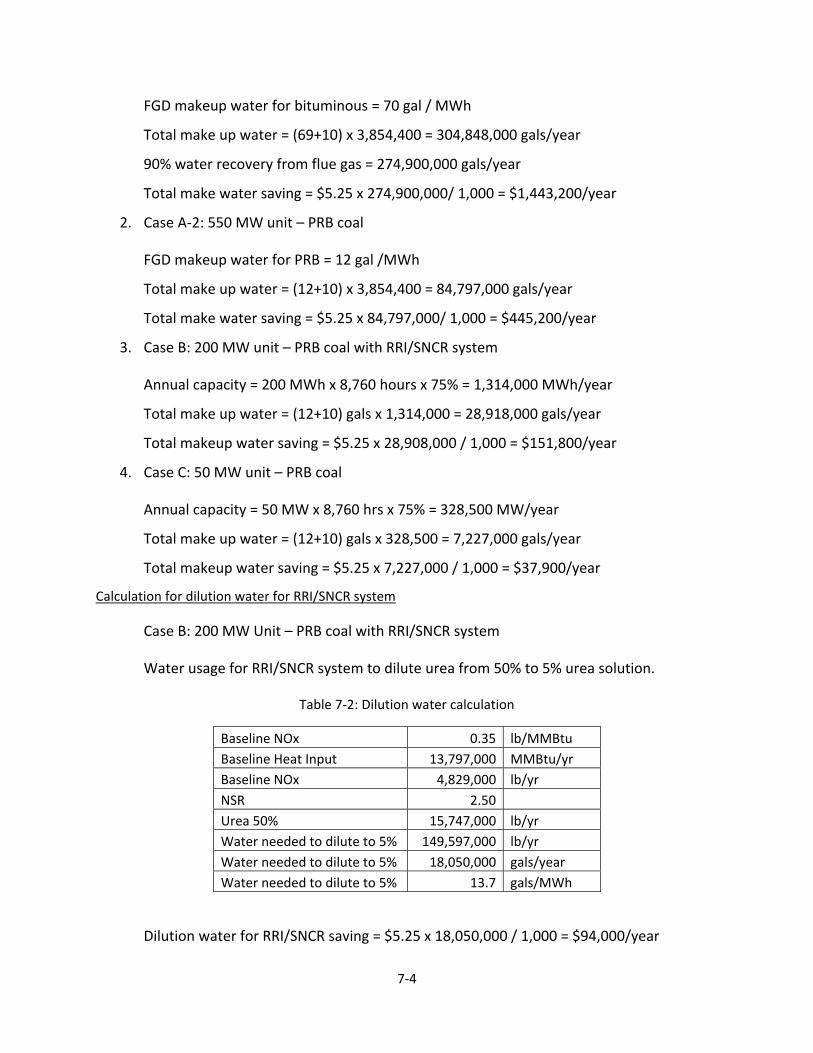
7‐4
FGD makeup water for bituminous = 70 gal / MWh
Total make up water = (69+10) x 3,854,400 = 304,848,000 gals/year
90% water recovery from flue gas = 274,900,000 gals/year
Total make water saving = $5.25 x 274,900,000/ 1,000 = $1,443,200/year
2. Case A‐2: 550 MW unit – PRB coal
FGD makeup water for PRB = 12 gal /MWh
Total make up water = (12+10) x 3,854,400 = 84,797,000 gals/year
Total make water saving = $5.25 x 84,797,000/ 1,000 = $445,200/year
3. Case B: 200 MW unit – PRB coal with RRI/SNCR system
Annual capacity = 200 MWh x 8,760 hours x 75% = 1,314,000 MWh/year
Total make up water = (12+10) gals x 1,314,000 = 28,918,000 gals/year
Total makeup water saving = $5.25 x 28,908,000 / 1,000 = $151,800/year
4. Case C: 50 MW unit – PRB coal
Annual capacity = 50 MW x 8,760 hrs x 75% = 328,500 MW/year
Total make up water = (12+10) gals x 328,500 = 7,227,000 gals/year
Total makeup water saving = $5.25 x 7,227,000 / 1,000 = $37,900/year
Calculation for dilution water for RRI/SNCR system
Case B: 200 MW Unit – PRB coal with RRI/SNCR system
Water usage for RRI/SNCR system to dilute urea from 50% to 5% urea solution.
Table 7‐2: Dilution water calculation
Baseline NOx 0.35 lb/MMBtu Baseline Heat Input 13,797,000 MMBtu/yr Baseline NOx 4,829,000 lb/yr NSR 2.50 Urea 50% 15,747,000 lb/yr Water needed to dilute to 5% 149,597,000 lb/yr Water needed to dilute to 5% 18,050,000 gals/year Water needed to dilute to 5% 13.7 gals/MWh
Dilution water for RRI/SNCR saving = $5.25 x 18,050,000 / 1,000 = $94,000/year
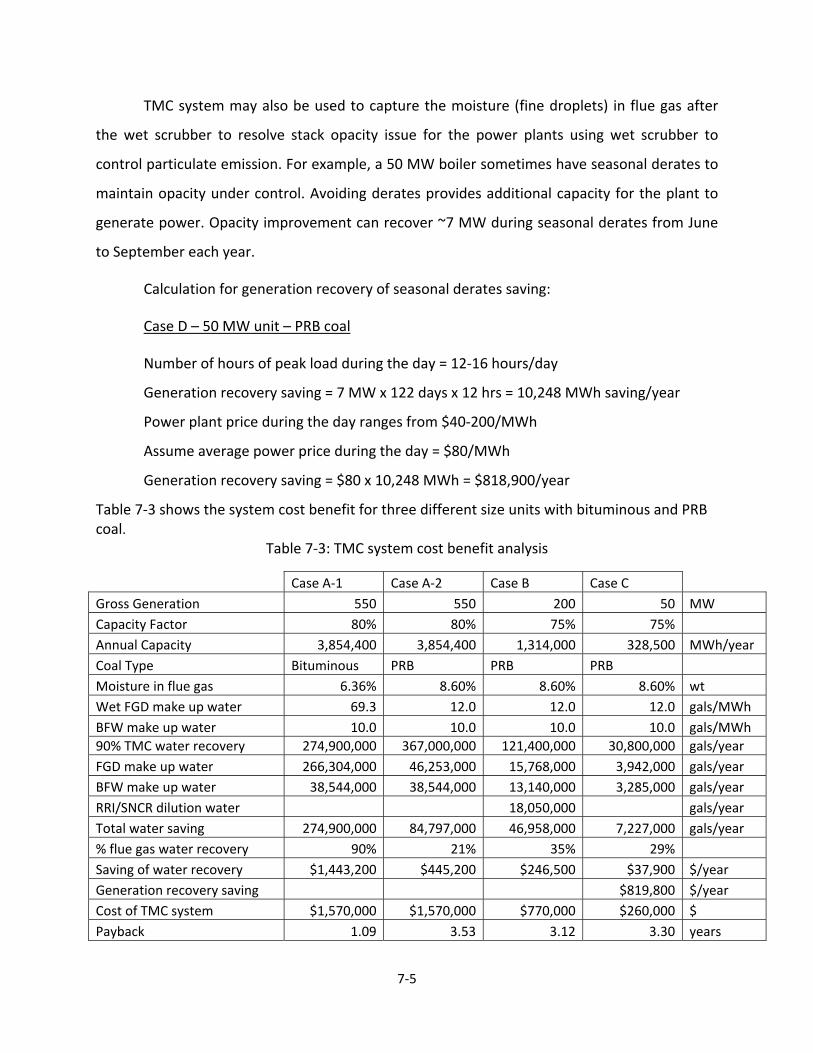
7‐5
TMC system may also be used to capture the moisture (fine droplets) in flue gas after
the wet scrubber to resolve stack opacity issue for the power plants using wet scrubber to
control particulate emission. For example, a 50 MW boiler sometimes have seasonal derates to
maintain opacity under control. Avoiding derates provides additional capacity for the plant to
generate power. Opacity improvement can recover ~7 MW during seasonal derates from June
to September each year.
Calculation for generation recovery of seasonal derates saving:
Case D – 50 MW unit – PRB coal
Number of hours of peak load during the day = 12‐16 hours/day
Generation recovery saving = 7 MW x 122 days x 12 hrs = 10,248 MWh saving/year
Power plant price during the day ranges from $40‐200/MWh
Assume average power price during the day = $80/MWh
Generation recovery saving = $80 x 10,248 MWh = $818,900/year
Table 7‐3 shows the system cost benefit for three different size units with bituminous and PRB coal.
Table 7‐3: TMC system cost benefit analysis
Case A‐1 Case A‐2 Case B Case C Gross Generation 550 550 200 50 MW Capacity Factor 80% 80% 75% 75% Annual Capacity 3,854,400 3,854,400 1,314,000 328,500 MWh/year Coal Type Bituminous PRB PRB PRB Moisture in flue gas 6.36% 8.60% 8.60% 8.60% wt Wet FGD make up water 69.3 12.0 12.0 12.0 gals/MWh BFW make up water 10.0 10.0 10.0 10.0 gals/MWh 90% TMC water recovery 274,900,000 367,000,000 121,400,000 30,800,000 gals/year FGD make up water 266,304,000 46,253,000 15,768,000 3,942,000 gals/year BFW make up water 38,544,000 38,544,000 13,140,000 3,285,000 gals/year RRI/SNCR dilution water 18,050,000 gals/year Total water saving 274,900,000 84,797,000 46,958,000 7,227,000 gals/year % flue gas water recovery 90% 21% 35% 29% Saving of water recovery $1,443,200 $445,200 $246,500 $37,900 $/year Generation recovery saving $819,800 $/year Cost of TMC system $1,570,000 $1,570,000 $770,000 $260,000 $ Payback 1.09 3.53 3.12 3.30 years
7‐6
Payback = Total System Cost / Annual benefit saving cost
Installing wet FGD system for bituminous coal provides the fastest payback for ~1 year
for the TMC system. For PRB coal applications, the payback duration increases to ~3.5 year.
TMC technology commercialization path
The TMC technology has been licensed to Cannon Boiler Works, Inc. (CBW) for industrial
boiler application, with the trade name Ultramizer. Media & Process Technology Inc. (MPT) has
provided the key material—ceramic membrane tubes. CBW has established the capability to
assemble TMC modules, fabricate the TMC housing, and configure the control system
independently. CBW is a well known, trusted supplier of boiler heat recovery devices including
economizers, vent condensers, air coolers, after coolers, and other energy efficiency devices.
They also have a non‐exclusive license from GTI to apply to the market sector beyond boiler
applications. For the TMC technology commercial application in power generation market, the
following is a path we plan to go:
First, a larger size field demonstration is needed to demonstrate the technology with
water integration to the plant. We are in negotiation with South California Gas Company for
potential field demonstration for larger size full integration with the plant flue gas and water
loops. They have a 50MW power generation unit for testing purpose in California and have
shown interest to host the TMC technology demonstration. Second, an equipment supplier,
preferably a FGD equipment manufacturer can build the TMC as an add‐on for its FGD unit to
remove moisture from its flue gas outlet, which is currently the pathway that we think can
quickly commercialize the TMC technology for power generation industry. We are actively
working with our power generation partners to discuss with potential FGD equipment suppliers.
MPT at this stage is still our membrane supplier, and CBW can fabricate the TMC modules for
the FGD supplier. Next step will be negotiating a license agreement with the FGD supplier to
supply the TMC system to power generation industry.

![Trane · ARI 550/5905 and ARI 5609 are : Evaporator leaving water temperature: 440 F [6.70C] .Water-cooled condenser, entering water temperature . 850F [29.400 .Air-cooled condenser,](https://img.pdfslide.us/doc/110x75/60e918d659b6ff48e55ecd8e/trane-ari-5505905-and-ari-5609-are-evaporator-leaving-water-temperature-440.jpg)