Embed Size (px)
Citation preview

Eur. J . Biochem. 199, 317-323 (1991) 0 FEBS 1991
0014295691004461
Membrane-bound cytochromes in Chloroflexus aurantiacus studied by EPR Pieter van VLIET', Davide ZANNONI', Wolfgang NITSCHKE' and A. William RUTHERFORD'
Section de Bioenergetique, Department de Biologie Cellulaire et Moleculaire, CE Saclay, Gif sur Yvette, France Department of Biology, Institute of Botany, University of Bologna, Italy
(Received January 16/March 27, 1991) - EJB 91 0093
The heme components of chlorosome-depleted membranes of the green-gliding bacterium Chlorojlexus auran- tiacus were studied by EPR spectroscopy. The four major species, which are present in approximately equimolar quantities, are characterized by the following g, values, redox midpoint potentials and orientations of heme planes with respect to the plane of the membrane: g , = 3.40, Em = + 280 mV, 30"; g, = 3.33, Em = 0 mV, 45"; g, = 3.03, Em = + 95 mV, 40-50" and g, = 2.95, Em = + 150 mV, 90". These four hemes were attributed to cytochrome cSs4, the membrane-bound immediate electron donor to the photosynthetic reaction centre in Chlorojlexus. All hemes except that with the highest potential were able to undergo photooxidation at 4 K. The photooxidation of the lowest potential heme was stable, whereas that of the + 95 mV and the + 150 mV hemes reversed on increasing the temperature to 100 K in darkness, due to charge recombination. The ability to photooxidize these hemes at 4 K was lost upon aging of samples. The results demonstrate that a reaction-centre-associated tetraheme cytochrome subunit, analogous to that of purple bacteria, is also present in C. aurantiacus.
A phylogenetic tree based on 16-S rRNA sequence com- parisons shows that the Chloroflexaceae branch off very early and are only distantly related to all other photosynthetic bac- teria (Woese, 1987). Nevertheless, spectroscopic evidence suggested some clear similarities of the photosynthetic reac- tion centre from Chlorojlexus aurantiacus with the purple bac- terial reaction centres (Bruce et al., 1982; Pierson and Thornber, 1983; Pierson et al., 1983; Blankenship et al., 1983; Vasinel et al., 1986; Kirmaier and Holten, 1987; Venturoli and Zannoni, 1988). The isolated reaction centre consists of two proteins with molecular masses similar to those of the L and M subunits from purple bacteria (Shiozawa et al., 1987). The full extent of this homology was subsequently confirmed by the primary sequences of these two subunits (Ovchinnikov et al., 1988a, b), in that the amino acid sequences of the two subunits present in the Chloroflexus reaction centre showed considerable similarity to the purple bacterial L and M sub- units (Shiozawa et al., 1989).
The purified Chlorojlexus reaction centre consists of the two 'core' subunits L and M (Shiozawa et al., 1989). In purple bacterial reaction centres additionally the H subunit and, in most cases, a cytochrome subunit are found. The H subunit is attached to the cytoplasmic side of the membrane, does not carry pigments and its function is still a matter of debate. The cytochrome subunit is attached to the periplasmic side of the reaction centre. It has been shown to contain four hemes in the well-studied purple bacteria Rhodopseudoomonas viridis (Deisenhofer and Michel, 1989), Chromatium vinosum (Kennel and Kamen, 1971) and Rhodobacter gelatinosus (Fukushima et al., 1988). From the crystal structure of Rps. viridis, it is known that the four hemes are arranged in a linear row pointing away from the special pair. In the species investi- gated, it was found that these four hemes cover a range of
Correspondence to W. Nitschke, Section de Bioenergetique, DBCM, CE Saclay, 91 191 Gif sur Yvette Cedex, France
redox potentials and that the lowest potential heme, when it is reduced, can donate electrons to the photooxidized special pair even at the temperature of liquid helium. Already in 1969, Kihara and Chance tested a large collection of different purple bacteria for this criterion of photooxidation of low-potential hemes at low temperature. Most species examined fulfilled this criterion and therefore must contain a reaction-centre- associated cytochrome. From comparisons to the well-studied examples of Chr. vinosum, Rps. viridis and Rb. gelatinosus, i t is most likely that all these cytochromes are tetraheme subunits.
In purified reaction centres of C. aurantiacus no bound cytochrome was found, however, in more intact systems (whole cells and pure plasma membranes), a membrane-bound heme, cytochrome c5 54, could be photooxidized by the reac- tion centre at room temperatures (Bruce et al., 1982). In mem- branes, the presence of four hemes with distinct redox midpoint potentials and which are capable of transferring electrons to the reaction centre at room temperature was suggested by Zannoni and Venturoli (1988). Cytochrome c554 has recently been purified from Chloroflexus membranes (Freeman and Blankenship, 1990); interestingly, it contains four hemes with distinct midpoint potentials, comparable to those determined by Zannoni and Venturoli (1988) in whole membrane fragments. Whereas Zannoni and Venturoli pro- posed a diheme and two monoheme cytochromes to account for the four distinct hemes, Freeman and Blankenship con- cluded from their data that a tetraheme subunit, i.e. cytochrome cs 54, acted as a reaction-centre-associated donor to the reaction centre.
The hemes in C. aurantiacus have until now hardly received any attention in EPR studies (however, see Wynn et al., 1987). In this study, the EPR spectral properties, redox potentials and orientations of the hemes with respect to the membrane are determined.
318
EXPERIMENTAL PROCEDURES
Cultures of Chloroflexus aurantiacus strain H-10-fl were grown phototrophically under low-light conditions as de- scribed by Zannoni and Venturoli (1988). Cell paste was resus- pended in 50 mM Mops pH 7.0 and cells were subsequently disrupted by three passages through a French pressure cell.
To be able to obtain sufficiently concentrated membrane samples, it was necessary to partially remove the so-called chlorosomes (large membrane-attached antenna systems) from the native membrane. This was achieved according to a protocol developed by Schmidt (1980).
Redox poising and redox titrations of these chlorosome- depleted membranes (in 50 mM Mops pH 7.0 at an ab- sorbance of approximately 25 at 866 nm in a I-cm light-path cuvette) were performed in near darkness under an appropri- ate safe lighr, essentially as described by Dutton (1971). The following redox mediators were used : 1,4-benzoquinone, N,N,N',N'-tetramethyl-p-phenylenediamine, diaminodiurol, variamine blue, toluylene blue, 1 ,4-naphthoquinone, 5- hydroxy-1,4-naphthoquinone, duroquinone, indigo-tetrasul- phonate, 1,4-hydroxy-naphthoquinone, 2,Sdihydroxy-p- benzoquinone, indigo carmine, 2-hydroxy-1,4-naphthoqui- none and safranine T, all at 100 pM, ferricyanide at 10 pM; phenazine methosulphate and phenazine ethosulphate at 50 pM. Reductive titrations were carried out using sodium dithionite and oxidative titrations were done using por- phyrexide.
Oriented membrane multilayers were obtained by using the technique of Blasie et al. (1978): membranes suspended in H 2 0 were painted on mylar sheets and were dried in 90% humidity atmosphere for approximately 24 h in darkness at 4°C. The redox state in these membranes was adjusted by applying solutions of sodium ascorbate and sodium dithionite (in 50 mM Mops pH 7.0) to the dried membranes followed by drying under a stream of argon gas in darkness. All angles are defined with respect to the membrane plane. EPR spectra were recorded at liquid helium temperatures with a Bruker ER 300 X-band spectrometer, fitted with an Oxford Instruments cryostat and temperature control system.
Illumination in the EPR cavity was carried out by using a 800-W tungsten projector providing 16 mmol photon m-' s-' of white light at the EPR cavity window after being filtered through 2 cm ofwater and two calflex filters to remove infrared radiation.
RESULTS
Spectral properties
The EPR spectrum of a sample containing fully oxidized membranes from Chloroflexus aurantiacus (Fig. 1 a) shows four peaks deriving from oxidized low-spin hemes. A very broad signal was seen at about g = 3.35, two relatively narrow but fairly overlapping peaks were distinguishable at g = 3.03 and g = 2.95 and a smaller signal was present at g = 2.8. It is well known that the signal intensity of the g, peaks of low- spin hemes decreases markedly with increasing g value within this spectral region. Using the semiempirical formula deduced by de Vries and Albracht (1979) to compensate for this effect, the following stoichiometry was calculated: 1.8 (g = 3.35): 1.0 ( g = 3.03):l.l (g=2.95):0.3 (g=2.8).
These values suggested that four hemes were present in roughly equimolar quantities, i. e. two of them giving rise to the signals at g = 3.03 and g = 2.95 and the remaining two
3.03 295
3 LO 3.33
/ I I '
+353mV
+238mV
+73mV
-53mV
L-U 170 220 270
Field ( m i l
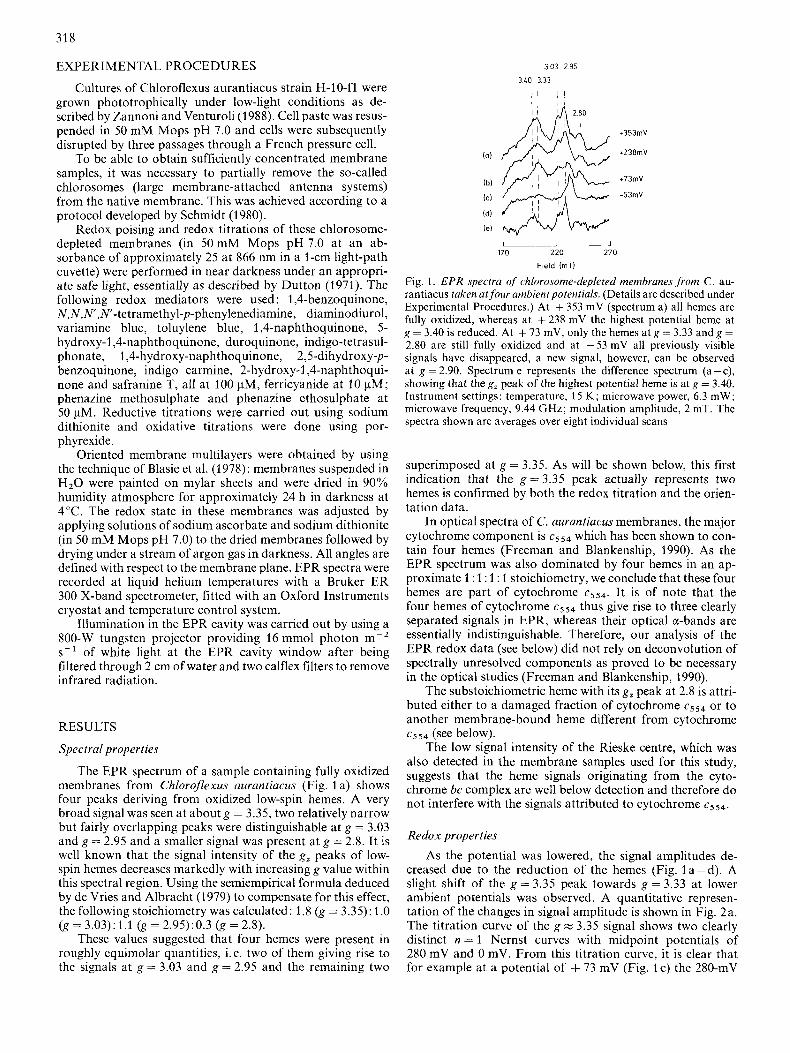
Fig. 1. EPR spectra of chlorosome-depleted membranes from C. au- rantiacus taken atfour ambientpotentials. (Details are described under Experimental Procedures.) At + 353 mV (spectrum a) all hemes are fully oxidized, whereas at + 238 mV the highest potential heme at g = 3.40 is reduced. At + 73 mV, only the hemes at g = 3.33 and g = 2.80 are still fully oxidized and at -53 mV all previously visible signals have disappeared, a new signal, however, can be observed at g = 2.90. Spectrum e represents the difference spectrum (a-c), showing that the g, peak of the highest potential heme is at g = 3.40. Instrument settings: temperature, 15 K; microwave power, 6.3 mW; microwave frequency, 9.44 GHz; modulation amplitude, 2 mT. The spectra shown are averages over eight individual scans
superimposed at g = 3.35. As will be shown below, this first indication that the g = 3.35 peak actually represents two hemes is confirmed by both the redox titration and the orien- tation data.
In optical spectra of C. aurantiucus membranes, the major cytochrome component is cSs4 which has been shown to con- tain four hemes (Freeman and Blankenship, 1990). As the EPR spectrum was also dominated by four hemes in an ap- proximate 1 : 1 : 1 : 1 stoichiometry, we conclude that these four hemes are part of cytochrome cS5+ It is of note that the four hemes of cytochrome cs54 thus give rise to three clearly separated signals in EPR, whereas their optical a-bands are essentially indistinguishable. Therefore, our analysis of the EPR redox data (see below) did not rely on deconvolution of spectrally unresolved components as proved to be necessary in the optical studies (Freeman and Blankenship, 1990).
The substoichiometric heme with its g , peak at 2.8 is attri- buted either to a damaged fraction of cytochrome css4 or to another membrane-bound heme different from cytochrome cSs4 (see below).
The low signal intensity of the Rieske centre, which was also detected in the membrane samples used for this study, suggests that the heme signals originating from the cyto- chrome bc complex are well below detection and therefore do not interfere with the signals attributed to cytochrome c554.
Redox properties As the potential was lowered, the signal amplitudes de-
creased due to the reduction of the hemes (Fig. 1 a - d). A slight shift of the g = 3.35 peak towards g = 3.33 at lower ambient potentials was observed. A quantitative represen- tation of the changes in signal amplitude is shown in Fig. 2a. The titration curve of the g E 3.35 signal shows two clearly distinct n = 1 Nernst curves with midpoint potentials of 280 mV and 0 mV. From this titration curve, it is clear tha t for example at a potential of + 73 mV (Fig. Ic) the 280-mV

319
3.03 2.95 3.10 3.33
5
-200 -100 0 100 200 300 100 500 Potential ImV)
Fig. 2. Redox titration of chlorosome-depleted membranes from C. aurantiacus. The curves represent plots of signal amplitudes at g = 3.35 (a), g = 3.03 (b) and g = 2.95 (c) versus ambient potential. The broken lines are n = 1 Nernst curves fitted to the data points. The dotted line in (c) shows then = 1 Nernst curve for an Em of + 220 mV (see Discussion). (0) Data points obtained while titrating towards lower ambient potentials; (A) data points obtained from oxidative titrations. Signal amplitudes are measured with respect to a straight baseline drawn between 180 and 250 mT (see Fig. 1). No correction for the overlap of the g = 2.90 signal on the peak a t g = 2.95 was performed in (c), hence the systematic deviation of the data points in the range between + 80 mV and 0 mV from the theoretical Nernst curve
component was already fully reduced, whereas the 0-mV heme was largely oxidized. Thus, the difference spectrum of a fully oxidized sample and the sample at 73 mV yielded the g, peak of the 280-mV heme (Fig. 1 e) with a peak position at g = 3.40.
In short, the broad band at g = 3.35 consisted of two distinct components, one of them peaking at g = 3.40 (Em = + 280 mV) and another one at g = 3.33 (Em = 0 mV). Accord- ing to the equal amplitudes of the two waves in Fig. 2a, the respective components were present in a 1 : 1 stoichiometry. This justified the conclusions drawn above, that the g = 3.35 peak represents two hemes, each of which is equimolar to the hemes showing up at g = 3.03 and g = 2.95.
The signals at g = 3.03 titrated with a midpoint potential of + 95 mV (Fig. 2 b) while the signal at g = 2.95 titrated with Em = + 150 mV (Fig. 2c). Both titration curves followed n = 1 Nernst behaviour.
A redox midpoint potential of z 0 mV was determined for the minor component at g = 2.80 (not shown).
Unexpectedly, an additional signal at g = 2.90 appeared on decreasing the ambient potential below 0 mV (Fig. 1 d). This signal titrated with an apparent midpoint potential of well below 0 mV. Whereas the shape of the signal was remi- niscent of a low-spin g, peak, its redox behaviour rules out the possibility that it comes from an unperturbed heme system. It is therefore highly unlikely that it is part of cytochrome cSs4; its actual origin, however, is not known.
It cannot be excluded that this signal is somehow related to cytochrome css4. However, as our spectra were taken on
900 I J
170 220 270
Field h T I
Fig. 3. Orientation dependence of EPR signals in the g, region of the spectrum. Spectra were recorded on untreated (i.e. largely oxidized) membranes (a) and on the same sample after reduction by ascorbate (see Experimental Procedures). EPR conditions are as in Fig. 1. The depicted spectra are averages over eight individual scans
membrane samples, many other enzymes containing paramag- netic centres could in principle contribute to the observed spectrum. The similarity of cytochrome c554 to reaction- centre-associated tetraheme subunits of purple bacteria (as evidenced by this work) and the absence of comparable effects in these latter systems argues against a close relationship of the signal at g = 2.90 with cytochrome cs54. Furthermore, no component with a midpoint potential below 0 mV had been seen in the optical studies (Zannoni and Venturoli, 1988; Freeman and Blankenship, 1990) of cytochrome c554. How- ever, only an EPR study performed on the purified cytochrome c5 54 can unambiguously settle this question.
Orientations of the hemes
The orientation dependence of the observed signal ampli- tudes was studied in untreated (i. e. largely oxidized, Fig. 3 a) and ascorbate-reduced (Fig. 3 b) oriented membrane samples. In both cases, the broad signal at about g = 3.35 could be observed at angles between 20" and 90". At an angle of 30" in the untreated sample the signal peaks at g = 3.35 (i.e. at the g value found for the superposition of the 280-mV heme and the 0-mV heme). This peak position shifted to g = 3.40 (i.e. the position of the 280-mV heme) at higher angles (Fig. 3a). A polar plot evaluation of the signal amplitude at about g = 3.35-3.40 is shown in Fig. 4 (squares) with the filled symbols denoting the higher g-value signals and the open symbols indicating that the peak was at lower g value for these data. The polar plot shows a maximum at 60". The shape of the polar plot curve, however, is unusual in that at angles below 40" (i.e. where the signal peaks at lower g values) apparently too much signal amplitude is found, rendering the curve asymmetric with respect to a line drawn from the origin to the maximum of the polar plot curve. This asymmetry is due to the contribution of the g = 3.33 (Em = 0 mV) heme, as evidenced by the spectra and the polar plot of the respective

320
(a1
3.03 2.95 3.40 3.33
I 1 I 1
Fig. 4. Polar plots of thesignalamplitudesat about g = 3.35 in untreated (0-4) andascorbate-treated (A----A) membranes. ( W ) EPR lines which peak i l l slightly higher g-values; (0) signals at slightly lower g-values; ( 0 ) line peaks a t an intermediate field position
900
I
+95mV
-32mV
I I I 170 220 270
Field (mT]
Fig. 6 . EPR spectra of chlorosome-depleted membranes.from C . auran- tiacus, redox poised at + Y5 m V ( a ) and -32 m V ( b ) before (. . . .) and after (-) illumination at 4 K. (Details as in Experimental Procedures.) EPR conditions are as in Fig. 1 . The depicted spectra are averages over 16 individual scans
9.3.03 I
Fig. 5. Polar plots of the signal amplitudes at g = 2.95 (0-0) and g = 3.03 (0-O), us determined from spectru recorded on untreated oriented memhrane samples from C . aurantiacus
peak in the ascorbate-reduced sample (Fig. 4, broken line). In this sample, the field position of the EPR signal is always lower than g = 3.40, due to the loss of the g = 3.40 (Em = 280 mV) heme signal upon reduction (Fig. 3 b). The polar plot is more symmetrical with a maximum at about 45" (Fig. 4, triangles).
Thus, the two hemes having g, signals around g = 3.35 not only showed rather different redox midpoint potentials, but were also distinguishable with respect to the orientations of their g, peaks. The g, direction of the g = 3.40 (Em = 280 mV) heme makes an angle of 60" with the membrane, whereas that of the g = 3.33 (Em = 0 mV) heme lies at about 45" with respect to the membrane plane.
The two hemes having peaks at g = 2.95 (Em = 150 mV) and g = 3.03 (Em = 95 mV) were too close with respect to their midpoint potentials to be selectively reduceable in ordered membranes. Thus, the evaluation of their orientations was done exclusively on the untreated sample, profiting from the higher signal amplitude and lower signal/noise ratio. The polar plot of the g = 2.95 (Em = 150 mV) heme is shown in Fig. 5 (continuous line, squares). The signal amplitude is maxi- mal at angles between 0" and lo", with a slight side maximum at higher angles, which is most probably due to an overlap from the g = 3.03 (Em = 95 mV) heme signal. The polar plot of the signal amplitude measured at g = 3.03 (Em = 95 mV) showed a broad maximum between 20" and 50". Due to the strong spectral overlap, the g = 2.95 (Em = 150 mV) heme, which has its maximal signal amplitude at O", contributes considerably at angles below 50". Therefore we conclude, that the g, direction of the g = 3.03 (Em = 95 mV) heme lies between 40 - 50" with respect to the membrane. The spectral
and redox proximity of the g = 2.95 (Em = 150 mV) heme, however, preclude a more precise determination of the orien- tation of the g = 3.03 (Em = 95 mV) heme.
The substoichiometric signal (Fig. 3 a, b) at g = 2.80 ( z 0 mV) showed a maximum at 40 - 50' (not shown). If this signal corresponds to a damaged form of one of the hemes from cytochrome c554, this orientation indicated that it could either be a denaturation product of the g = 3.40 (Em = 0 mV) heme (without concomitant shift in potential) or a denatured fraction of the heme peaking at g = 3.03 (combined with a shift in midpoint potential by about 100 mV towards more negative values).
In both the untreated and the ascorbate-reduced ordered membrane samples, another signal could be observed at g = 3.1 around 0". This signal was not observed in a non-ordered sample. It is of note, however, that the maximal signal ampli- tudes in ordered membranes do not have a straightforward relationship to total spin density. Rather, the g-value-depen- dent amplitudes, as discussed above, are further modulated by orientation-dependent parameters. In particular, if g, direc- tions are oriented at 0" and 90" to the membrane, dispro- portionally strong signals can be expected. Thus, the signal at g = 3.1 actually represents a very low number of spins as compared to the cytochrome c554 hemes and was merely amplified by its specific orientation. However, in view of its different orientation, it seems not to be due to a damaged cytochrome c554 heme, but instead to another heme-carrying enzyme.
Photooxidation at low temperature Fig. 6 shows EPR spectra recorded on redox-poised, dark-
adapted, non-oriented samples before and after continuous illumination at 4 K. The illumination at low temperature was performed in one continuous period of 10 min and with inter- mittant light (10 1-min illuminations interrupted by 10 I-min periods of darkness). No difference between the two illumi- nation protocols was seen, precluding the idea that heating the sample facilitated photooxidation.
32 1
The sample at an ambient potential of + 95 mV had the heme at g = 3.40 (Em = + 280 mV) completely reduced, the g = 2.95 heme (Em = + 150 mV) largely reduced, the g = 3.03 heme (Em = + 95 mV) half-reduced and the lowest potential heme (Em = 3.33, Em = 0 mV) completely oxidized. Illumi- nation of this sample at 4 K resulted in no photooxidation of the highest potential heme (Em = 3.40, Em = + 280 mV) and partial photooxidation of both intermediate potential hemes (g = 3.03, Em = + 95 mV and g = 2.95, Em = + 150 mV) but to differing extents: 25% of the heme with the lower potential (g = 3.03, Em = +95 mV), which was 50% reduced prior to illumination, was oxidized compared to only 7% of the heme with the higher potential (g = 2.95, Em = + 150 mV), which was almost completely reduced prior to illumination.
Warming the sample to 100 K in darkness completely re- versed the changes induced by the 4-K illumination.
When almost all cytochrome c554 hemes were reduced prior to illumination at an ambient potential of -32 mV, photooxidation of the two hemes at g = 3.03 (Em = + 95 mV) and g = 2.95 (Em = + 150 mV) was no longer observed. In- stead, the 0-mV heme at g = 3.33 was oxidized. The oxidation of the g = 3.33 heme at 4 K amounts to somewhat less that 50% of the total content of this heme. More accurate values are precluded due to the small signal amplitude of the peaks at such high g values. In contrast to results for the + 95-mV and the + 150-mV hemes, the g = 3.33 (Em = 0 mV) heme remained stably photooxidized after warming the sample to 100 K in darkness.
In purple bacteria, the photooxidation at low temperature of a heme from the tetraheme subunit is paralleled by the appearance of a signal attributed to the semiquinone-iron complex (QA- Fe2+). No such photo-induced signal could be detected in samples prepared from the C. aurantiacus cells used for this study. However, such a signal could not even be observed in samples were QA should be chemically (half-) reduced. This might be due to a large fraction of centres having a manganese ion instead of iron associated with the quinone- acceptor complex, as suggested by Blankenship et al. (1988). Interaction of the semiquinone with an Mn2+ ion in Rps. sphaeroides reaction centres results in a weaker signal with broad features spread over several tesla (Rutherford et al., 1985; Debus et al., 1986), which is difficult to detect in mem- branes.
DISCUSSION
Assignrnrnt of signals to cyt c5 54 As detailed above, the dominant peaks in the g, region of
the EPR spectrum occurring at g values of 3.40, 3.33,3.03 and 2.95, are present in an approximate 1 : 1 : 1 : 1 stoichiometry. Three of these four hemes can be photooxidized at 4 K, but with variable yields. This ability to undergo photooxidation at low temperature demonstrates that these three hemes are closely associated with the reaction centre in a fixed geometry. The fourth heme, which is present in an equimolar concen- tration and which could not be photooxidized at low tempera- ture, was the highest potential heme (Em = + 280 mV).
These results are reminiscent of the tetraheme cytochrome of Rps. viridis, the most thoroughly studied purple bacterial tetraheme subunit. In this system, the possibility to stably photooxidize the two low-potential hemes at temperatures below 50 K is well established (Nitschke and Rutherford, 1989; Hubbard and Evans, 1989; Vermtglio et al., 1989; Kaminskaya et al., 1990; see also the equivalent results for C.
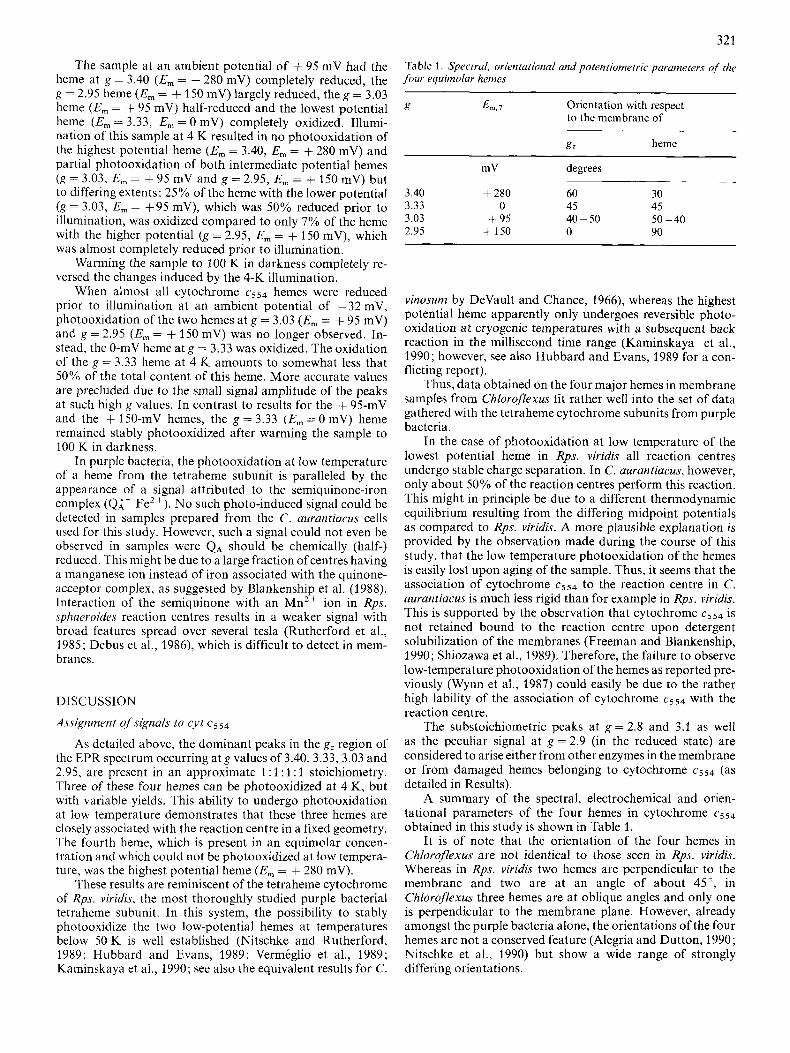
Table 1. Spectral, or'ientatioiral and poteiitiornetric parameters uf the four equimalar hemes
g Em., Orientation with respect to the membrane of
gz heme
mV degrees
3.40 + 280 60 30 3.33 0 45 45 3.03 + 95 40 - 50 50 - 40 2.95 + 150 0 90
vinosum by DeVault and Chance, 1966), whereas the highest potential heme apparently only undergoes reversible photo- oxidation at cryogenic temperatures with a subsequent back reaction in the millisecond time range (Kaminskaya et al., 1990; however, see also Hubbard and Evans, 1989 for a con- flicting report).
Thus, data obtained on the four major hemes in membrane samples from Chloroflexus fit rather well into the set of data gathered with the tetraheme cytochrome subunits from purple bacteria.
In the case of photooxidation at low temperature of the lowest potential heme in Rps. viridis all reaction centres undergo stable charge separation. In C. aurantiacus, however, only about 50% of the reaction centres perform this reaction. This might in principle be due to a different thermodynamic equilibrium resulting from the differing midpoint potentials as compared to Rps. viridis. A more plausible explanation is provided by the observation made during the course of this study, that the low temperature photooxidation of the hemes is easily lost upon aging of the sample. Thus, it seems that the association of cytochrome c554 to the reaction centre in C. aurantiacus is much less rigid than for example in Rps. viridis. This is supported by the observation that cytochrome c554 is not retained bound to the reaction centre upon detergent solubilization of the membranes (Freeman and Blankenship, 1990; Shiozawa et al., 1989). Therefore, the failure to observe low-temperature photooxidation of the hemes as reported pre- viously (Wynn et al., 1987) could easily be due to the rather high lability of the association of cytochrome c5s4 with the reaction centre.
The substoichiometric peaks at g = 2.8 and 3.1 as well as the peculiar signal at g = 2.9 (in the reduced state) are considered to arise either from other enzymes in the membrane or from damaged hemes belonging to cytochrome cs54 (as detailed in Results).
A summary of the spectral, electrochemical and orien- tational parameters of the four hemes in cytochrome c554 obtained in this study is shown in Table 1.
It is of note that the orientation of the four hemes in Chloroflexus are not identical to those seen in Rps. viridis. Whereas in Rps. viridis two hemes are perpendicular to the membrane and two are at an angle of about 45", in Chloroflexus three hemes are at oblique angles and only one is perpendicular to the membrane plane. However, already amongst the purple bacteria alone, the orientations of the four hemes are not a conserved feature (Alegria and Dutton, 1990; Nitschke et al., 1990) but show a wide range of strongly differing orientations.

322
Arrangement of the four hemes in cytochrome c554
All four hemes in cytochrome c554 are distinguishable according to their redox midpoint potentials and orientations with respect to the membrane plane. A similar situation is observed in the tetraheme subunits from Rps. viridis both in the crystal structure (Deisenhofer and Michel, 1989) and in studies which determined the electrochemical (Dracheva et al., 1988; Nitschke and Rutherford, 1989; Hubbard and Evans, 1989) and electron transfer characteristics (Dracheva et al., 1988; Kaminskaya et al., 1990) of the four hemes. The molec- ular mass of 43 kDa determined for cytochrome c554 from Chlorojlexus (Freeman and Blankenship, 1990), lies in the range found for the tetraheme subunits from a variety of purple bacteria (Kennel and Kamen, 1971; Weyer et al., 1987; Fukushima et al., 1988). Furthermore, sequence similarities have been pointed out between cytochrome cSs4 from Chloroflexus (Freeman, 1989) and the cytochrome subunit from Rps. viridis (Weyer et a1.,1987).
By analogy to the Rps. viridis cytochrome subunit, we consider it likely that, in cytochrome c554 from Chloroflexus, the four hemes are also arranged in a linear row pointing away from the special pair, as seen in the crystal structure of the Rps. viridis reaction centre (Deisenhofer and Michel, 1989). In the absence of a crystal structure for cytochrome cSs4 from Chloroflexus, a detailed assignment of the four hemes is not possible.
Comparison to other studies on cytochrome c554
In two previous optical studies (Zannoni and Venturoli, 1988 ; Freeman and Blankenship, 1990) the electrochemical parameters of hemes seen in Chloroflexus were determined. Zannoni and Venturoli monitored flash-induced cytochrome oxidation following a train of flashes in a range of ambient redox potentials. Three of the four midpoint potentials found by Zannoni and Venturoli are in good agreement with the results presented here, i.e. the 280 mV, the 150 mV and 0 mV are within
The heme having the second highest potential (Zannoni and Venturoli, 1988) titrated at 220 mV. In our EPR study we were unable to see such a component. The broken line in Fig. 2b represents the theoretical Nernst curve for a + 220 mV component. Despite the high scatter of the EPR titration data, the data points are certainly incompatible with such a high potential.
It is of note that in the experiments performed by Zannoni and Venturoli, the extent of photooxidation after the first flash increased following two separate Nernst curves at 295 mV and at 140 mV. The duration of the xenon flash (at half height) in the optical study was 15 ps. Since, for example in Rps. viridis, intramolecular electron transfer from the second highest po- tential heme to the highest potential heme proceeds with half- times of several microseconds, it is highly likely that multiple turnovers of the reaction centre are possible within the time of duration of the flash. Thus, chemical reduction of the second cytochrome (at Em = 150 mV) would result in a further increase in cytochrorne oxidation due to double turnover of the reaction centre. This is completely in line with our data showing that the highest potential heme is at an Em of 280 mV and the second highest shows an Em of 150 mV. The 220-mV component in the optical study is only seen in the subsequent flashes, i.e. at t > 30 ms after the first flash. This shows that for the interpretation of this titration wave, effects induced by secondary electron transfer from the cytochrome bcl complex
20 mV of the values described previously.
cannot be ruled out (as already discussed by Zannoni and Venturoli, 1988). The sensitivity of this wave to the cyto- chrome bcl inhibitor 2-n-heptyl-4-hydroxyquinoline N-oxide argues in favour of this possibility. Furthermore, the midpoint potential of 220 mV for the wave observed during subsequent flashes is suspiciously close to that of auracyanin (Em = 250 mV; Trost et al., 1988), which is proposed to function as an electron carrier between the cytochrome bc, complex and the photosynthetic reaction centre in Chlorojlexus.
Freeman and Blankenship (1990) performed equilibrium redox titrations on the purified cytochrome c554. Since at room temperature all four hemes have their a-peaks at the same wavelength (554 nm), the determination of the individ- ual midpoint potentials had to rely on the deconvolution of an unresolved single titration curve into four separate redox components. Again, one heme was proposed to have an Em of 2 + 220 mV. We tried to fit the data points from the optical titration (Freeman and Blankenship, 1990) by using the redox potentials determined with EPR. The general shape of the experimental curve could be satisfactorily reproduced. In the regions around 100 mV and 200 mV, however, the experimen- tal points deviated from the calculated curve by more than the apparent scatter of the data. Thus, we are led to assume that the midpoint potentials of the hemes in the purified protein are altered compared to those determined in the intact membrane. That such changes occur upon solubilization is well estab- lished for the tetraheme subunit of Rps. viridis (Alegria and Dutton, 1991).
Comparisons to purple bacteria
Our results presented above demonstrate, that the simi- larities between purple bacteria and Chlorojlexus extend from the L and M subunits of the reaction centre core towards the secondary electron donor, i. e. the tetraheme cytochrome subunit. These striking similarities between purple bacteria and Chlorojlexus are remarkable in view of the fact that Chlorojlexus is only very distantly related to purple bacteria at the evolutionary level. They might be due either to lateral gene transfer or to the presence of a precursor reaction centre which was the common ancestor of both phyla of photo- synthetic bacteria and which must already have contained a cytochrome subunit.
Furthermore, a close examination of the characteristics of the Chlorojlexus cytochrome c554 which deviate from the well studied cytochrome subunits form Rps. viridis (e. g. the differ- ent redox potentials and especially the lack of a clear sepa- ration into a ‘high-potential’ and a ‘low-potential pair’ of hemes) could well provide a better understanding of the still rather enigmatic function of the reaction-centre-associated tetraheme cytochrome subunits in general.
We would like to thank J. C. Freeman (Tempe AZ) and A. Vermkglio (Cadarache) for stimulating discussions and for communi- cating results prior to publication. Porphyrexide was kindly provided by M. Denis (Marseille) and H. Beinert (Milwaukee). A. W. R. is supported by the Centre National de la Recherche Scientifiyue (URA 1290), D. Z. benefitted from a grant from the Consiglio Nazionale delle Ricerche (Progretto Finalizzato Biotecnologie Biostrumentuzione) and P. v. V. was on leave from the Department of Molecular Physics, Agricultural University of Wageningen, The Netherlands, and was supported by the Commission of the European Communities under the COMETT Program.

323
REFERENCES Alegria, G. & Dutton, P. L. (1990) Biophys. J . 57, 571 a. Alegria, G. & Dutton, P. L. (1991) Biochim. Biophys. Actu 1057,258 -
272. Blankenship, R. E., Feick, R. G., Bruce, B. D., Kirmaier, C., Holten,
D. & Fuller, R. C. (1983) J . Cell. Biochem. 22, 251 -261. Blankenship, R. E., Trost, J . T. & Mancino, L. J. (1988) in The
photosynthetic bacterial reaction center (Breton, J. & Vermeglio, A., eds) pp. 119- 127, Plenum Press, New York.
Blasie, J. K., Erecinska, M., Samuels, S. & Leigh, J. S. (1978) Biochim. Biophys. Acta 501, 33 - 52.
Bruce, B. D., Fuller, R. C. & Blankenship, R. E. (1982) Proc. Nut1 Acad. Sci. U S A 79,6532-6536.
Debus, R. J., Feher, G. & Okamura, M. Y. (1986) Biochemistry 25,
Deisenhofer, J . & Michel, H. (1989) EMBO J . 8, 2149-2169. DeVault, D. & Chance, B. (1966) Biophys. J . 6,825-847. De Vries, S. & Albracht, S. P. J. (1979) Biochim. Biophys. Acta 546,
Dracheva, S. M., Drachev, L. A,, Konstantinov, A. A,, Semenov, A. Y., Skulachev, V. P., Arutjunjan, A. M., Shuvalov, V. A. & Zaberezhnaya, S. M. (1988) Eur. J . Biochem. 171,253-264.
2276 - 2287.
335 - 340.
Dutton, P. L. (1971) Biochim. Biophys. Acta 226, 63-80. Freeman, J. C. (1989) PhD thesis, Arizona State University, Tempe
Freeman, J . C. & Blankenship, R. E. (1990) Photosynth. Res. 23,29-
Fukushima, A., Matsuura, K., Shimada, K. & Satoh, T. (1988) Bio-
Hubbard, J. A. M. & Evans, M. C. W. (1989) FEBS Lett. 244, 71-
Kaminskaya, O., Konstantinov, A. A. & Shuvalov, V. A. (1990)
Kennel, S. J . & Kamen, M. D. (1971) Biochim. Biophys. Acta 253,
Kihara, T. & Chance, B. (1969) Biochim. Biophys. Acta 189, 116-
Kirmaier, C. & Holten, D. (1987) Photosynth. Res. 13, 225-260. Nitschke, W., Agalidis, I., Jubault-Bregler, M., Feiler, U., Liebl, U. &
Rutherford, A. W. (1990) Symposium on control of charge transfer in cytochrome and chlorophyll complexes, Abstr. 11.
AZ.
38.
chim. Biophys. Acta 933, 399-405.
75.
Biochim. Biophys. Acta 1016, 153 - 164.
153 - 166.
124.
Nitschke, W. & Rutherford, A. W. (1989) Biochemistry 28, 3161 - 3168.
Ovchinnikov, Yu. A,, Abdulaev, N. G., Zolotarev, A. S., Shmukler, B. E., Zargarov, A. A., Kutuzov, M. A,, Telezhinskaya, I. N. & Levina, N. B. (1988a) FEBS Lett. 231, 237-242.
Ovchinnikov, Yu. A., Abdulaev, N. G., Shmukler, B. E., Zargarov, A. A., Kutuzov, M. A,, Telezhinskaya, I. N., Levina, N. B. & Zolotarev, A. S. (1988b) FEES Lett. 232, 364-368.
Pierson, B. K. & Thornber, J. P. (1983) Proc. Nut1 Acad. Sci. USA
Pierson, B. K., Thornber, J. P. & Seftor, R. E. B. (1983) Biochim.
Rutherford, A. W., Agalidis, I. & Reiss-Husson, F. (1985) FEBS Lett.
Schmidt, K. (1980) Arch. Microhiol. 124, 21-31. Shiozawa, J. A,, Lottspeich, F. & Feick, R. (1987) Eur. J . Biochem.
Shiozawa, J. A., Lottspeich, F.,Oesterhelt, D. & Feick, R. (1989) Eur.
Trost, J. T., McManus, J. D., Freeman, J. C., Ramakrishna, B. L. &
Vasmel, H., Hoff, A. J. & Amesz, J. (1986) Eiochim. Biophys. Acta
Venturoli, G. & Zannoni, D. (1988) Eur. J . Biochem. 178, 503-509. Vermeglio, A., Richaud, P. &Breton, J. (1989) FEBS Lett. 243,259-
Weyer, W. R., Lottspeich, F., Gruenberg, H., Lang, F., Oesterhelt,
Woese, C. R. (1987) Microbiol. Rev. 51, 221 -271. Wynn, R. M., Redlinger, T. E., Foster, J . M., Blankenship, R. E.,
Fuller, R. C., Shaw, R. W. & Knaff, D. B. (1987) Biochim. Biophys.
Zannoni, D. & Venturoli, G. (1988) in Green photosynthetic bacteria (Olson, J. M., Ormerod, J. G., Amesz, J., Stackebrandt, E. & Truper, H. G., eds) pp. 135- 143, Plenum Press, New York.
80,80 - 84.
Biophys. Acta 723, 322 - 326.
182, 151-157.
167, 595-600.
J . Biochem. 180, 75 - 84.
Blankenship, R. E. (1988) Biochemistry 27, 7858-7863.
852, 159-168.
263.
D. & Michel, H. (1987) EMBO J . 6,2197-2202.
Acta 891, 216-222.