Embed Size (px)
Citation preview

Member stateview: Ctgb, NL
Jessica Broeders, PhD, ERTScientific Risk Assessor Mammalian Toxicology
Board for the Authorisation of Plant ProtectionProducts and Biocides28-09-2017
2
• Focus on sections 5 and 6
• Each subsection discussed; differencescompared to 2012GD; small examples
• Case study
– Applying new version guidance
– Comparison to previous version
• Pros and cons
• Considerations for the future
Introduction
3
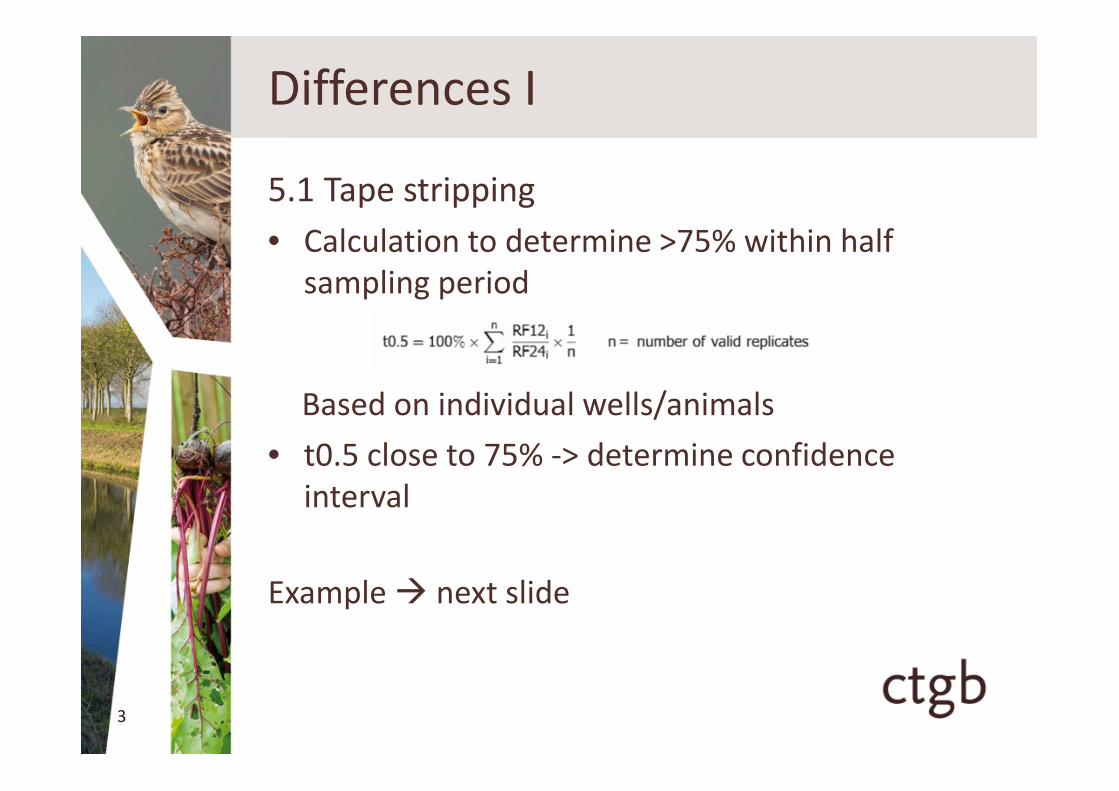
5.1 Tape stripping
• Calculation to determine >75% within halfsampling period
Based on individual wells/animals
• t0.5 close to 75% -> determine confidenceinterval
Example next slide
Differences I
4
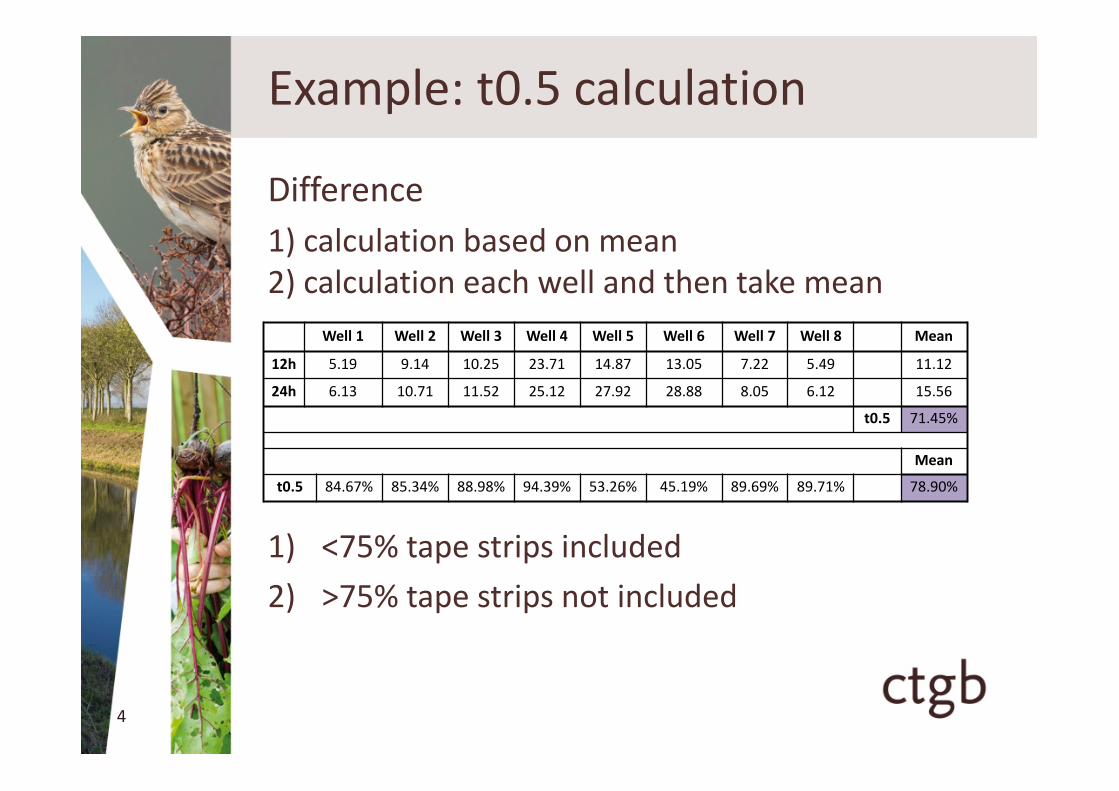
Difference
1) calculation based on mean2) calculation each well and then take mean
1) <75% tape strips included
2) >75% tape strips not included
Example: t0.5 calculation
Well 1 Well 2 Well 3 Well 4 Well 5 Well 6 Well 7 Well 8 Mean
12h 5.19 9.14 10.25 23.71 14.87 13.05 7.22 5.49 11.12
24h 6.13 10.71 11.52 25.12 27.92 28.88 8.05 6.12 15.56
t0.5 71.45%
Mean
t0.5 84.67% 85.34% 88.98% 94.39% 53.26% 45.19% 89.69% 89.71% 78.90%

5
5.2 Recovery• To be calculated for each individual well/animal
(also SD calculation possible)
• Options:– Overall recovery consistently low worst case:
missing material considered absorbed• This should certainly apply when DA <5% and recovery
<95%
– Normalisation = preferred option• Except for DA <5% and recovery <95 addition rule
• Critical evaluation of data to determine ifsignificant amounts of missing material couldhave been absorbed.
Differences II
6
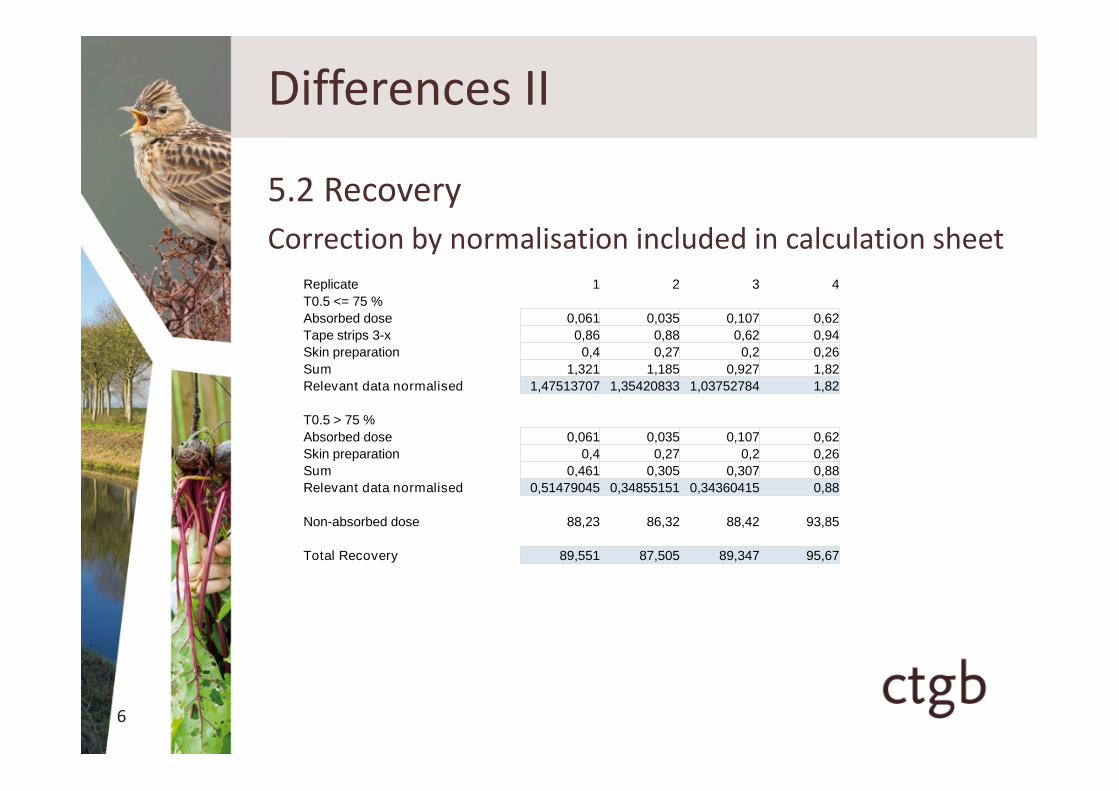
5.2 Recovery
Correction by normalisation included in calculation sheet
Differences II
Replicate 1 2 3 4
T0.5 <= 75 %
Absorbed dose 0,061 0,035 0,107 0,62
Tape strips 3-x 0,86 0,88 0,62 0,94
Skin preparation 0,4 0,27 0,2 0,26
Sum 1,321 1,185 0,927 1,82
Relevant data normalised 1,47513707 1,35420833 1,03752784 1,82
T0.5 > 75 %
Absorbed dose 0,061 0,035 0,107 0,62
Skin preparation 0,4 0,27 0,2 0,26
Sum 0,461 0,305 0,307 0,88
Relevant data normalised 0,51479045 0,34855151 0,34360415 0,88
Non-absorbed dose 88,23 86,32 88,42 93,85
Total Recovery 89,551 87,505 89,347 95,67
7
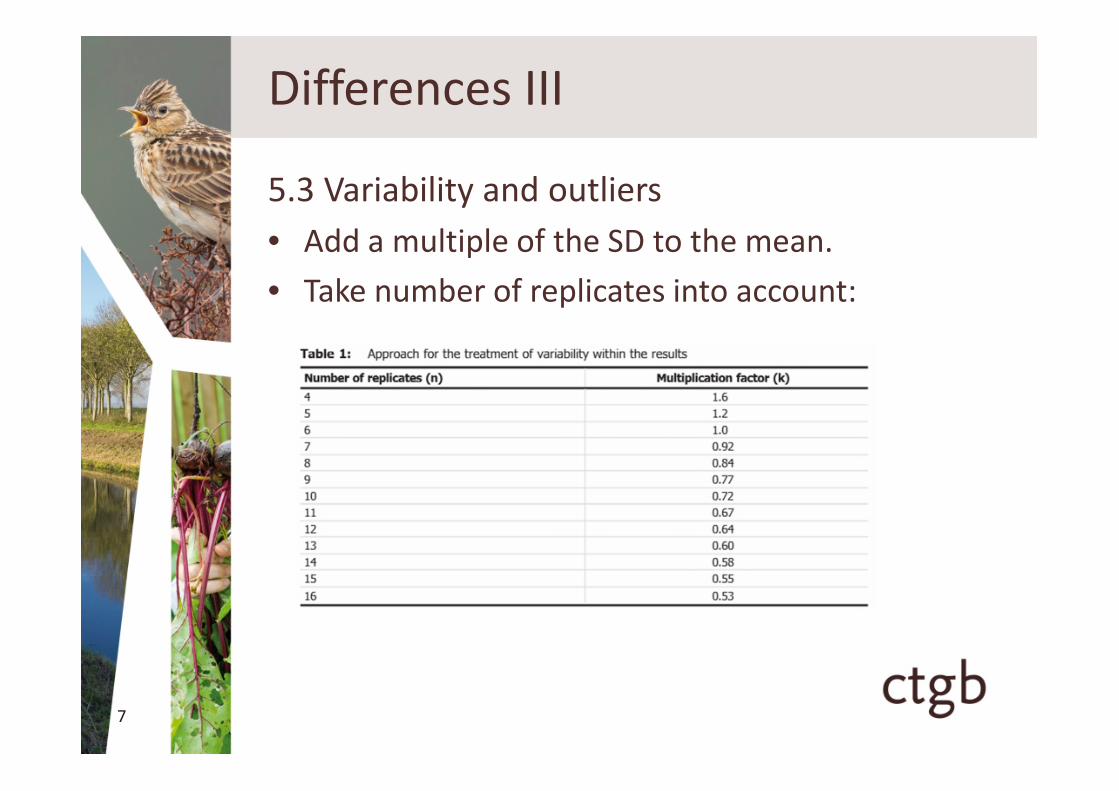
5.3 Variability and outliers
• Add a multiple of the SD to the mean.
• Take number of replicates into account:
Differences III
8
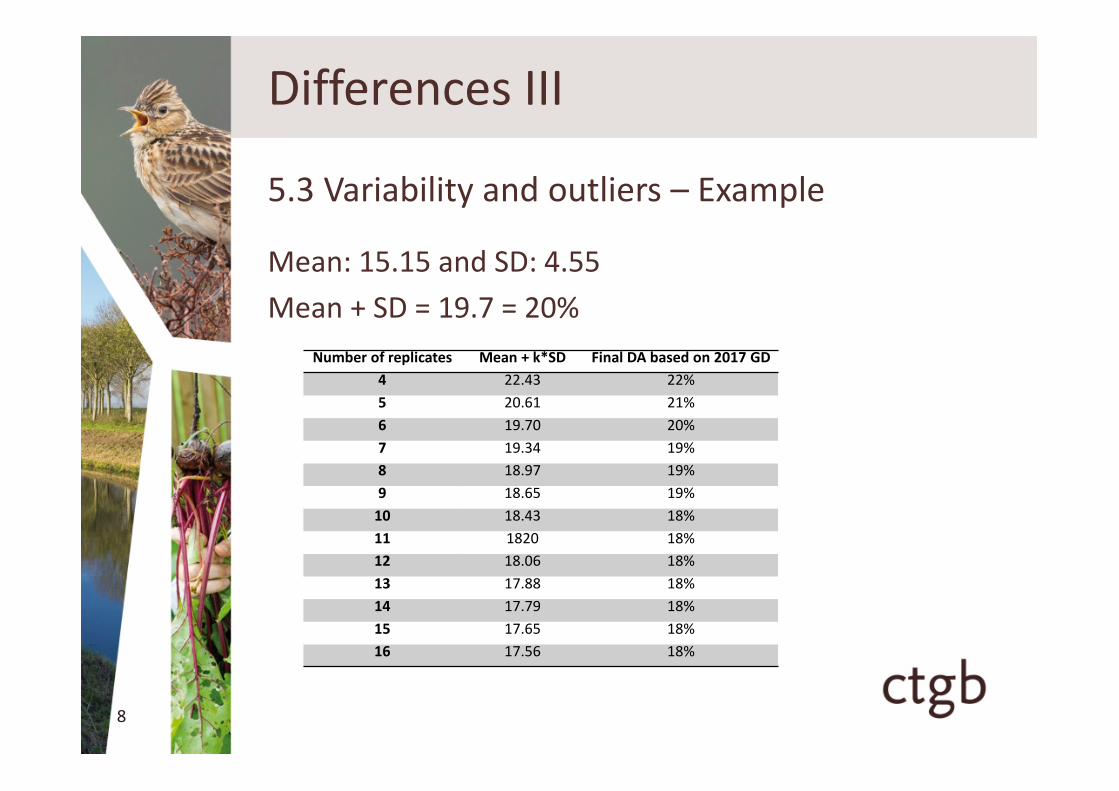
5.3 Variability and outliers – Example
Mean: 15.15 and SD: 4.55
Mean + SD = 19.7 = 20%
Differences III
Number of replicates Mean + k*SD Final DA based on 2017 GD
4 22.43 22%
5 20.61 21%
6 19.70 20%
7 19.34 19%
8 18.97 19%
9 18.65 19%
10 18.43 18%
11 1820 18%
12 18.06 18%
13 17.88 18%
14 17.79 18%
15 17.65 18%
16 17.56 18%
9
5.4 Rounding of values
• Max. 2 significant figures
5.5 Dilution rates
• Still pro rata correction
Differences IV
10
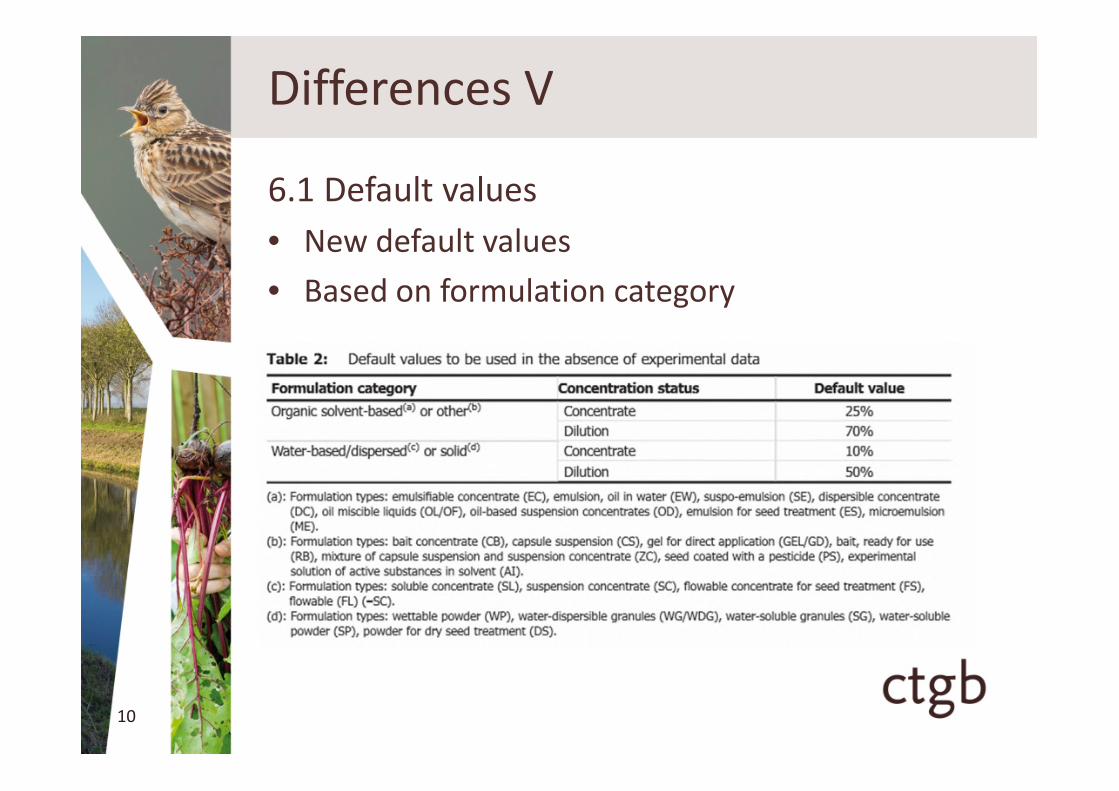
6.1 Default values
• New default values
• Based on formulation category
Differences V
11
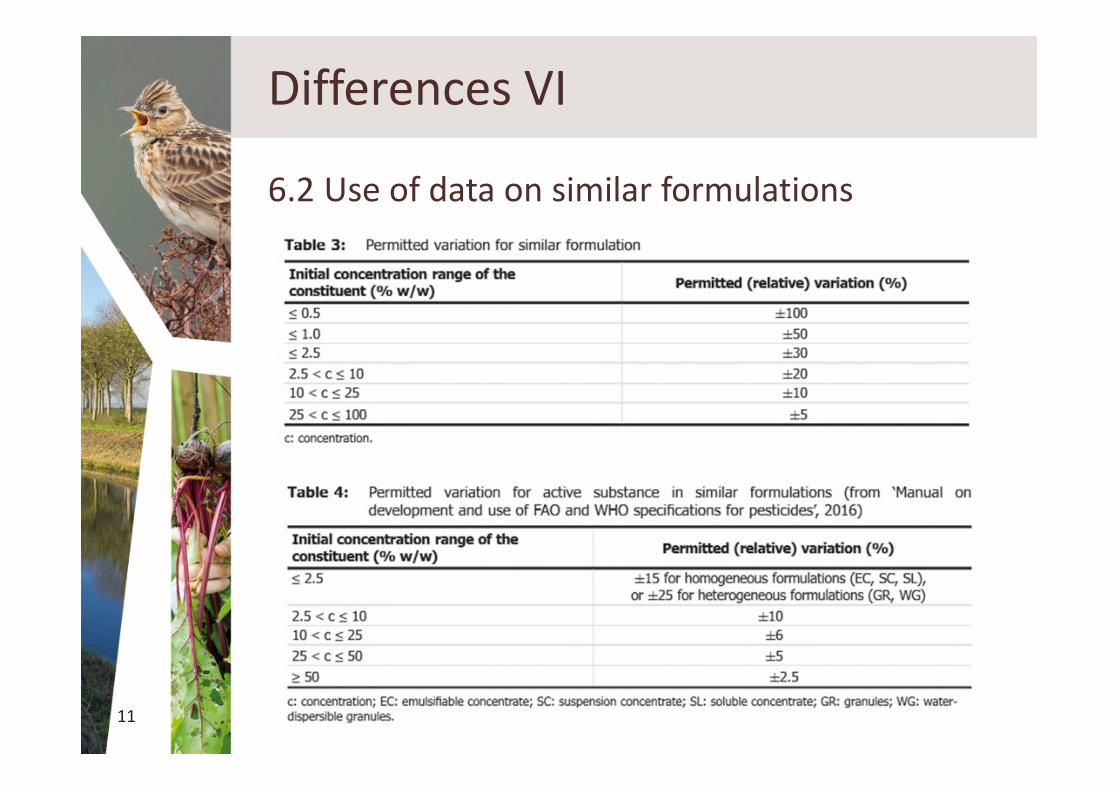
6.2 Use of data on similar formulations
Differences VI

12
• In vitro human skin
• Concentrate and 2 dilutions
– Filling in sheet
– Implications
– questions
Case study
13
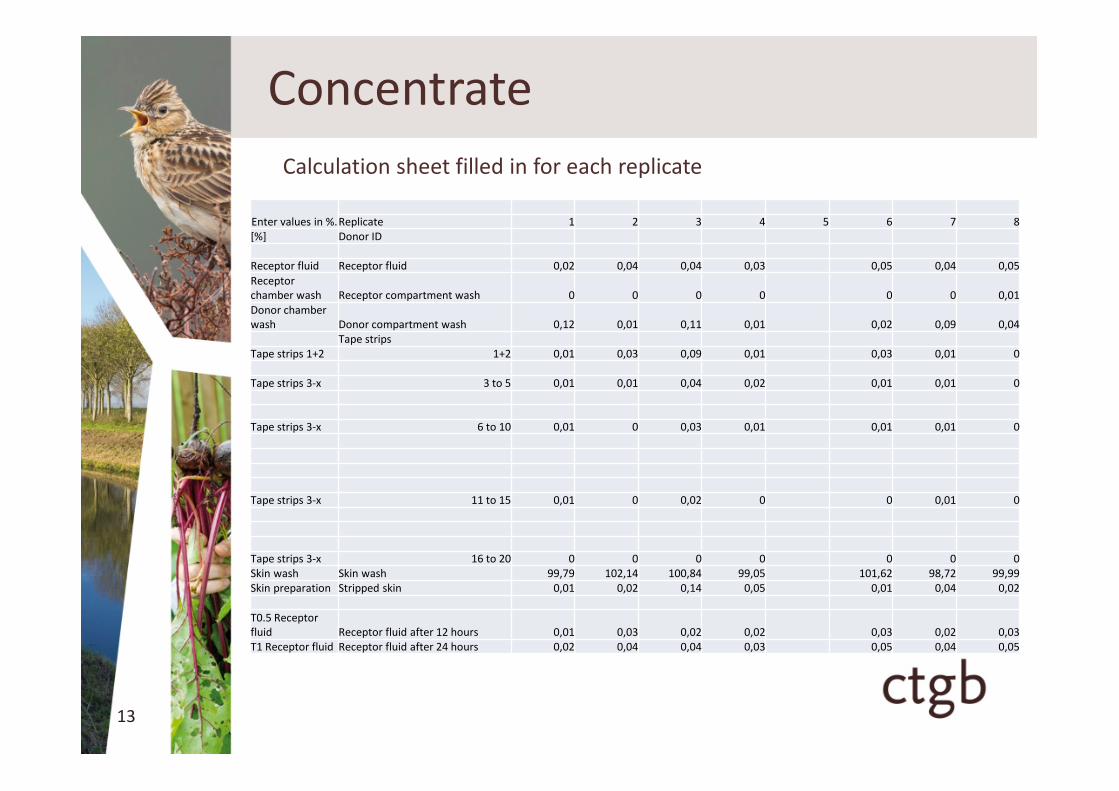
Concentrate
Calculation sheet filled in for each replicate
Enter values in %.Replicate 1 2 3 4 5 6 7 8[%] Donor ID
Receptor fluid Receptor fluid 0,02 0,04 0,04 0,03 0,05 0,04 0,05
Receptorchamber wash Receptor compartment wash 0 0 0 0 0 0 0,01Donor chamberwash Donor compartment wash 0,12 0,01 0,11 0,01 0,02 0,09 0,04
Tape stripsTape strips 1+2 1+2 0,01 0,03 0,09 0,01 0,03 0,01 0
Tape strips 3-x 3 to 5 0,01 0,01 0,04 0,02 0,01 0,01 0
Tape strips 3-x 6 to 10 0,01 0 0,03 0,01 0,01 0,01 0
Tape strips 3-x 11 to 15 0,01 0 0,02 0 0 0,01 0
Tape strips 3-x 16 to 20 0 0 0 0 0 0 0Skin wash Skin wash 99,79 102,14 100,84 99,05 101,62 98,72 99,99Skin preparation Stripped skin 0,01 0,02 0,14 0,05 0,01 0,04 0,02
T0.5 Receptorfluid Receptor fluid after 12 hours 0,01 0,03 0,02 0,02 0,03 0,02 0,03T1 Receptor fluid Receptor fluid after 24 hours 0,02 0,04 0,04 0,03 0,05 0,04 0,05
14
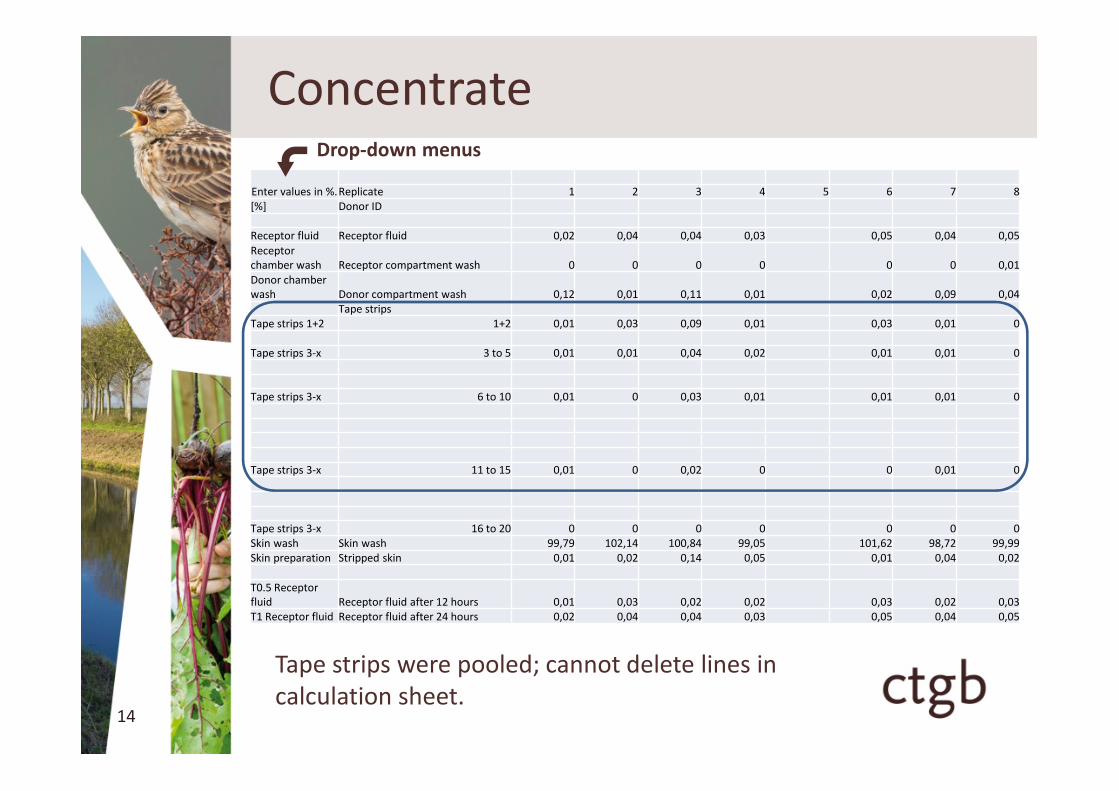
Concentrate
Tape strips were pooled; cannot delete lines incalculation sheet.
Drop-down menus
Enter values in %.Replicate 1 2 3 4 5 6 7 8[%] Donor ID
Receptor fluid Receptor fluid 0,02 0,04 0,04 0,03 0,05 0,04 0,05
Receptorchamber wash Receptor compartment wash 0 0 0 0 0 0 0,01Donor chamberwash Donor compartment wash 0,12 0,01 0,11 0,01 0,02 0,09 0,04
Tape stripsTape strips 1+2 1+2 0,01 0,03 0,09 0,01 0,03 0,01 0
Tape strips 3-x 3 to 5 0,01 0,01 0,04 0,02 0,01 0,01 0
Tape strips 3-x 6 to 10 0,01 0 0,03 0,01 0,01 0,01 0
Tape strips 3-x 11 to 15 0,01 0 0,02 0 0 0,01 0
Tape strips 3-x 16 to 20 0 0 0 0 0 0 0Skin wash Skin wash 99,79 102,14 100,84 99,05 101,62 98,72 99,99Skin preparation Stripped skin 0,01 0,02 0,14 0,05 0,01 0,04 0,02
T0.5 Receptorfluid Receptor fluid after 12 hours 0,01 0,03 0,02 0,02 0,03 0,02 0,03T1 Receptor fluid Receptor fluid after 24 hours 0,02 0,04 0,04 0,03 0,05 0,04 0,05
15
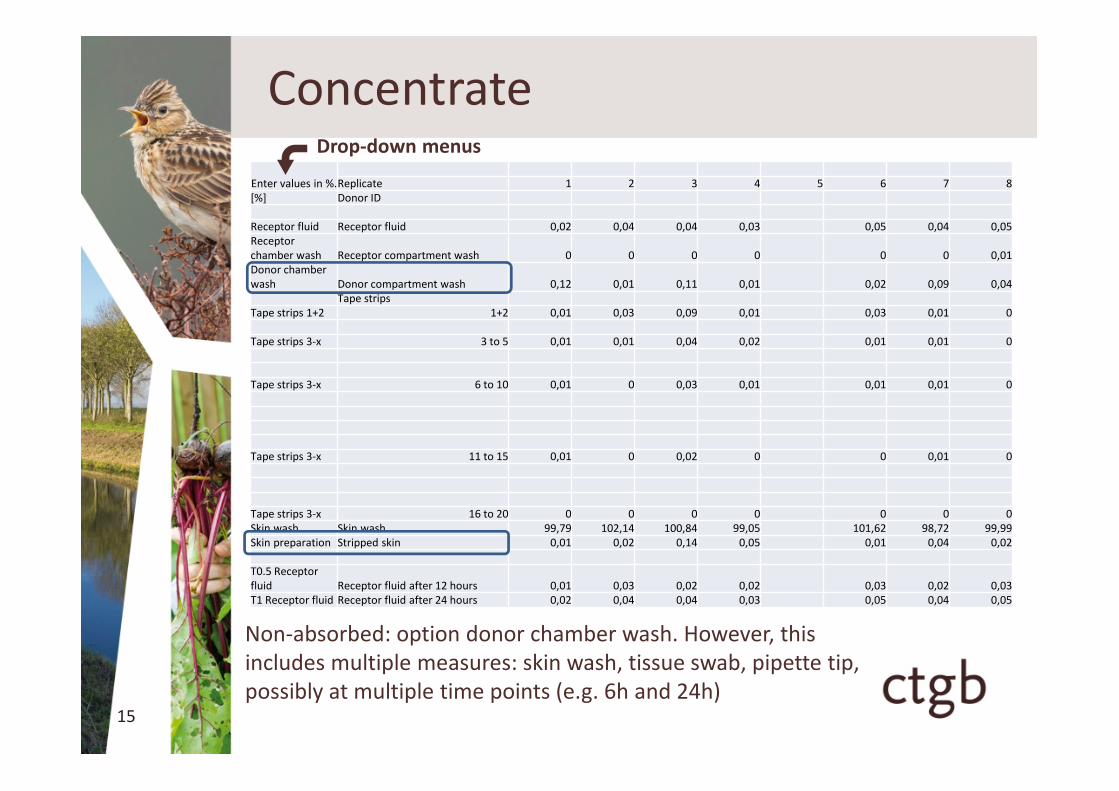
ConcentrateDrop-down menus
Non-absorbed: option donor chamber wash. However, thisincludes multiple measures: skin wash, tissue swab, pipette tip,possibly at multiple time points (e.g. 6h and 24h)
Enter values in %.Replicate 1 2 3 4 5 6 7 8[%] Donor ID
Receptor fluid Receptor fluid 0,02 0,04 0,04 0,03 0,05 0,04 0,05Receptorchamber wash Receptor compartment wash 0 0 0 0 0 0 0,01Donor chamberwash Donor compartment wash 0,12 0,01 0,11 0,01 0,02 0,09 0,04
Tape stripsTape strips 1+2 1+2 0,01 0,03 0,09 0,01 0,03 0,01 0
Tape strips 3-x 3 to 5 0,01 0,01 0,04 0,02 0,01 0,01 0
Tape strips 3-x 6 to 10 0,01 0 0,03 0,01 0,01 0,01 0
Tape strips 3-x 11 to 15 0,01 0 0,02 0 0 0,01 0
Tape strips 3-x 16 to 20 0 0 0 0 0 0 0Skin wash Skin wash 99,79 102,14 100,84 99,05 101,62 98,72 99,99Skin preparation Stripped skin 0,01 0,02 0,14 0,05 0,01 0,04 0,02
T0.5 Receptorfluid Receptor fluid after 12 hours 0,01 0,03 0,02 0,02 0,03 0,02 0,03T1 Receptor fluid Receptor fluid after 24 hours 0,02 0,04 0,04 0,03 0,05 0,04 0,05
16
Concentrate
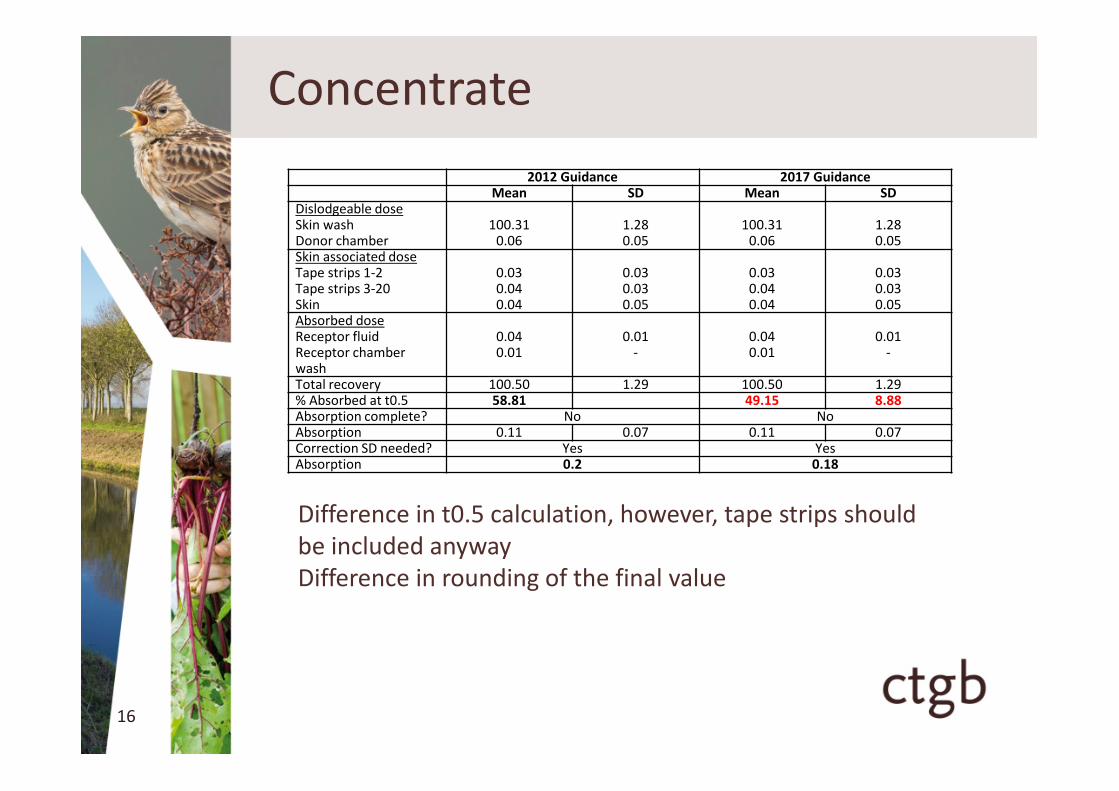
2012 Guidance 2017 GuidanceMean SD Mean SD
Dislodgeable doseSkin wash 100.31 1.28 100.31 1.28Donor chamber 0.06 0.05 0.06 0.05Skin associated doseTape strips 1-2 0.03 0.03 0.03 0.03Tape strips 3-20 0.04 0.03 0.04 0.03Skin 0.04 0.05 0.04 0.05Absorbed doseReceptor fluid 0.04 0.01 0.04 0.01Receptor chamberwash
0.01 - 0.01 -
Total recovery 100.50 1.29 100.50 1.29% Absorbed at t0.5 58.81 49.15 8.88Absorption complete? No NoAbsorption 0.11 0.07 0.11 0.07Correction SD needed? Yes YesAbsorption 0.2 0.18
Difference in t0.5 calculation, however, tape strips shouldbe included anywayDifference in rounding of the final value

17
• Guidance 2017: if t0.5 close to 75%estimate confidence interval
– Mean – k*s, where s is standard deviation and k isthe k-value for correction based on nr of replicatesin study.
• This is included in the calculation sheet, but:
– What is defined as ‘close to 75%’?
– Calculation sheets seems to take CI anyway,independent of initial t0.5-value
– Bugs in calculation sheet….
t0.5 calculation
18
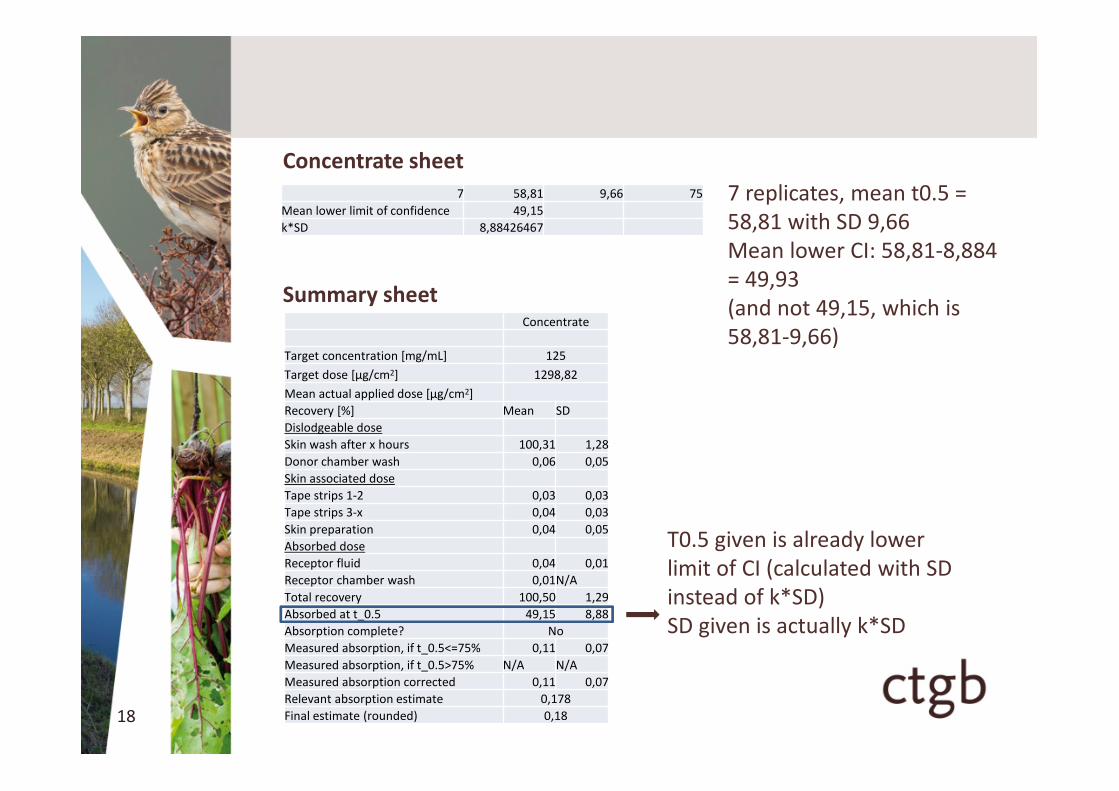
7 58,81 9,66 75
Mean lower limit of confidence 49,15
k*SD 8,88426467
Concentrate sheet
7 replicates, mean t0.5 =58,81 with SD 9,66Mean lower CI: 58,81-8,884= 49,93(and not 49,15, which is58,81-9,66)
Summary sheetConcentrate
Target concentration [mg/mL] 125
Target dose [µg/cm2] 1298,82
Mean actual applied dose [µg/cm2]
Recovery [%] Mean SD
Dislodgeable dose
Skin wash after x hours 100,31 1,28
Donor chamber wash 0,06 0,05
Skin associated dose
Tape strips 1-2 0,03 0,03
Tape strips 3-x 0,04 0,03
Skin preparation 0,04 0,05
Absorbed dose
Receptor fluid 0,04 0,01
Receptor chamber wash 0,01N/A
Total recovery 100,50 1,29
Absorbed at t_0.5 49,15 8,88
Absorption complete? No
Measured absorption, if t_0.5<=75% 0,11 0,07
Measured absorption, if t_0.5>75% N/A N/A
Measured absorption corrected 0,11 0,07
Relevant absorption estimate 0,178
Final estimate (rounded) 0,18
T0.5 given is already lowerlimit of CI (calculated with SDinstead of k*SD)SD given is actually k*SD
19
Dilution 1
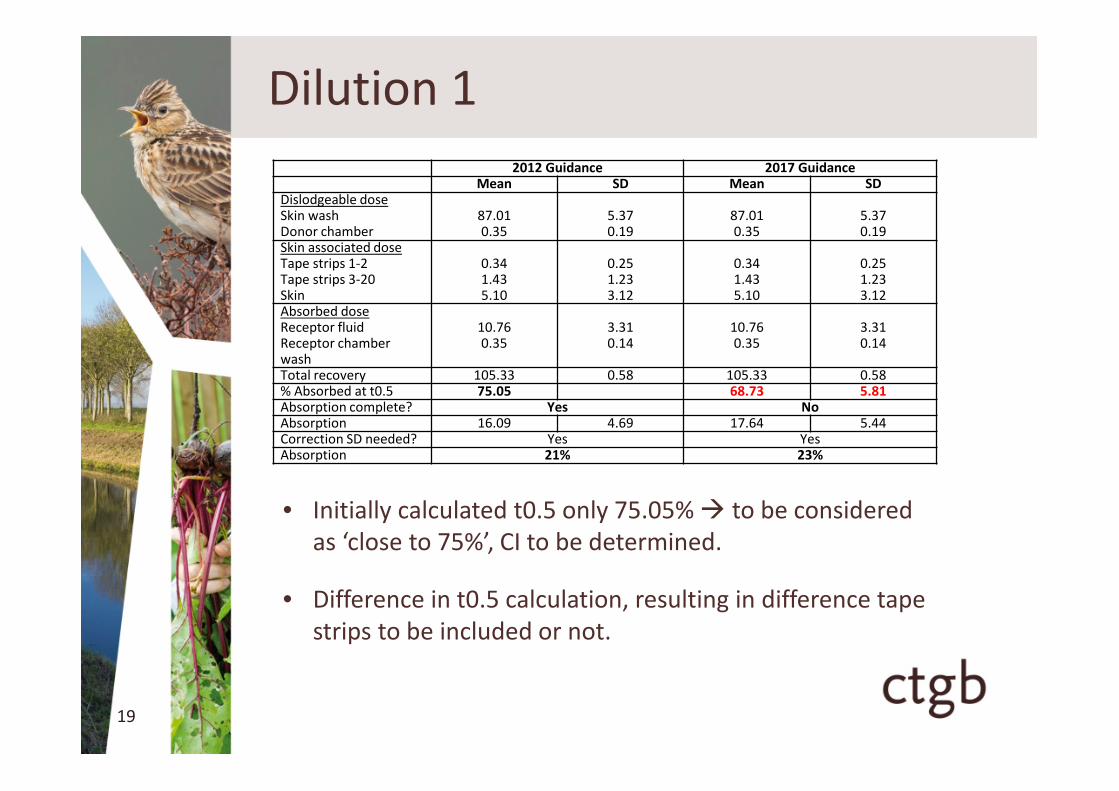
• Initially calculated t0.5 only 75.05% to be consideredas ‘close to 75%’, CI to be determined.
• Difference in t0.5 calculation, resulting in difference tapestrips to be included or not.
2012 Guidance 2017 GuidanceMean SD Mean SD
Dislodgeable doseSkin wash 87.01 5.37 87.01 5.37Donor chamber 0.35 0.19 0.35 0.19Skin associated doseTape strips 1-2 0.34 0.25 0.34 0.25Tape strips 3-20 1.43 1.23 1.43 1.23Skin 5.10 3.12 5.10 3.12Absorbed doseReceptor fluid 10.76 3.31 10.76 3.31Receptor chamberwash
0.35 0.14 0.35 0.14
Total recovery 105.33 0.58 105.33 0.58% Absorbed at t0.5 75.05 68.73 5.81Absorption complete? Yes NoAbsorption 16.09 4.69 17.64 5.44Correction SD needed? Yes YesAbsorption 21% 23%
20
Dilution 2
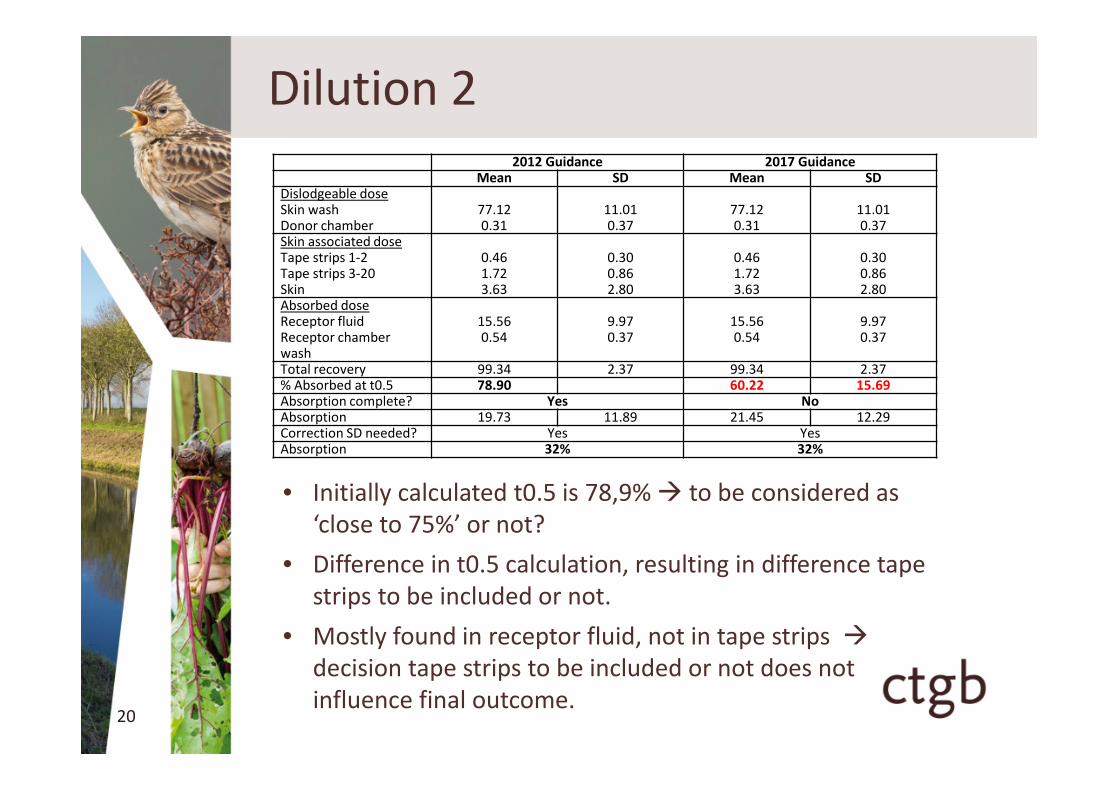
• Initially calculated t0.5 is 78,9% to be considered as‘close to 75%’ or not?
• Difference in t0.5 calculation, resulting in difference tapestrips to be included or not.
• Mostly found in receptor fluid, not in tape strips decision tape strips to be included or not does notinfluence final outcome.
2012 Guidance 2017 GuidanceMean SD Mean SD
Dislodgeable doseSkin wash 77.12 11.01 77.12 11.01Donor chamber 0.31 0.37 0.31 0.37Skin associated doseTape strips 1-2 0.46 0.30 0.46 0.30Tape strips 3-20 1.72 0.86 1.72 0.86Skin 3.63 2.80 3.63 2.80Absorbed doseReceptor fluid 15.56 9.97 15.56 9.97Receptor chamberwash
0.54 0.37 0.54 0.37
Total recovery 99.34 2.37 99.34 2.37% Absorbed at t0.5 78.90 60.22 15.69Absorption complete? Yes NoAbsorption 19.73 11.89 21.45 12.29Correction SD needed? Yes YesAbsorption 32% 32%

21
Pros and cons of the updated version
22
• Update based on actual data
• Reflects actual situation better
• More specific guidance given(e.g. t0.5 calculation)
• Standard calculation sheet
• More possibilities for ‘similarformulations’
Pros
23
• Time to get used to calculationsheet
• Bugs in calculation sheet
• …….
Cons

24
• More guidance needed
– What is ‘close to 75%’ for the t0.5?
– Pro rata correction, no guidance on when notneeded (there is no change of DA within therelevant dilution/concentration ranges)
– Worker dermal absorption
• Applicant fills in calculation sheets, (z)RMS topeer review?
• When guidance into force?
Considerations for the future