Embed Size (px)
Citation preview
The Weekly Dig – August 31, 2018 Mick Carew, PhD [email protected]
Pierre [email protected] Douglas Ibbitson, CFA| 416-507-2790 | [email protected]
Emma Boggio, MSA, CPA, CA604-697-6166 [email protected]
and the Haywood Mining Team Member of the Canadian Investor Protection Fund
Please see page 34 for Analyst Certification, and pages 34 to 43 for Important Information and Legal Disclaimers, Rating Structure, and notes.
Gold Rangebound Around US$1,200 Support Level • Precious Metals: The US$1,200 per ounce support level for gold continued to be the focus this week, as the price of gold
crossed the threshold a number of times before settling at US$1,200 (down 0.4%) per ounce on Friday at the time of publication. The yellow metal remained rangebound for the entire week, varying between a high of US$1,214 per ounce on Tuesday and falling to US$1,196 on Thursday. Gold’s holding pattern around US$1,200 per ounce follows a poor mid-month period, culminating into a 2% fall since the end of July. Silver (down 2%) and platinum (down 0.5%) were also down, while palladium had a relatively strong week, posting a 4.8% gain from last week to finish at US$982 per ounce. It was a mixed week for gold mining/exploration equities; the S&P/TSX Global Gold Index fell 3%, while the VanEck Vectors Junior Gold Mining Index fell 2%. In contrast, the S&P/TSX Ventures Composite Index rose 7 point to finish at 724. The rise in the TSX-V was reflected in the performance of some of the junior gold explorers this week, with Harte Gold Corp. (HRT-T, BUY rating, $0.60 target up over 40% this week, while Troilus Gold Corp. (TLG-V, BUY rating, $1.20 target, up 15%), Lumina Gold Corp. (LUM-V, BUY rating, $1.50 target, up 11%) and Marathon Gold Corp. (MOZ-T, BUY rating, $1.80 target, up 6%) also performed well. In contrast, gold producers were generally down, with SEMAFO Inc. (SMF-T, BUY rating, $5.50 target, up 3%) one of only a few positive performers this week.
• Base Metals: Base metals were all down this week, as the trade war continues to negatively impact the metals. LME nickel was the most negatively impacted metal, down -4.7% WoW, followed by LME zinc and LME copper, down -3.1% and -2.0% WoW, respectively. The LMEX Index finished the week down -1.42% WoW at 2,928.3. The S&P Composite Diversified Metals & Mining Industry Index finished the week at 5,347, which was down -0.8% WoW. YoY, metals have had a mixed performance: copper and zinc are down -11.7% and -21.6%, respectively while LME nickel is up 8.2% YoY. LME inventories were all down WoW, with copper, zinc and nickel inventories down -0.8%, -2.4% and -1.6%, respectively. The US Dollar Index was down 6 bps this week finishing at 96.4, having a minimal impact on base metals prices. According to a Bloomberg article, open interest on copper contracts is nearing 19 month lows as the trade dispute between the US and China heats up. President Trump intends to move ahead with a plan to impose tariffs on $200B in Chinese imports as soon as a public-comment period concludes next week. Overall, the stocks in our coverage universe were mixed this week. The most positively and negatively impacted weekly performers in our coverage universe were Copper Mountain (CMMC:TSX, BUY, $2.00/sh target) and Nevada Copper (CS:TSX, BUY, C$0.90/sh target), which were up 6.7% and down -5.0%, respectively. Earlier this week, Nevada Copper announced a positive construction decision for its Pumpkin Hollow underground mine project. The decision was expected; pre-construction activities have been ongoing since May 2018, however Capex increases to $197M from $183M (full report). The Dig is intended to provide general information only and it is written for an institutional audience. It is not a solicitation for the purchase of securities, an offer of securities, or intended as investment research or advice. The information presented, while obtained from sources we believe reliable is not guaranteed against errors or omissions. For Canadian residents: Haywood Securities Inc. is a Canadian registered broker-dealer and a member of the Investment Industry Regulatory Organization of Canada, the Toronto Stock Exchange, the Toronto Venture Exchange and the Canadian Investor Protection Fund. Any Canadian client that wishes further information about anything contained herein should contact a qualified salesperson of Haywood Securities Inc. For U.S. residents: The Dig is distributed in the United States by Haywood Securities (USA) Inc
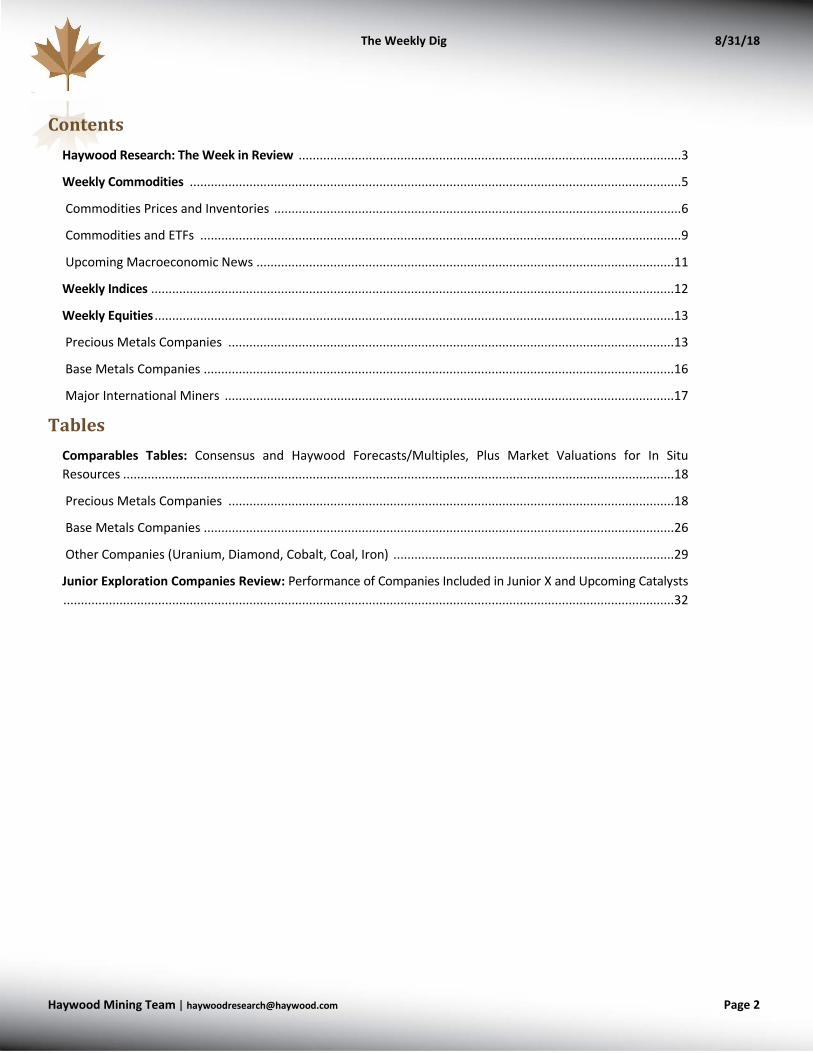
Weekly Performance
1
Source: Bloomberg and Haywood Securities
$1,050
$1,100
$1,150
$1,200
$1,250
$1,300
$1,350
$1,400
$1,450
$-
$2.00
$4.00
$6.00
$8.00
$10.00
$12.00
$14.00
$16.00
$18.00
$20.00
31-Aug-17 31-Jan-18 30-Jun-18
Gold
US$
/oz
Silv
er U
S$/o
z
Silver -2.3% WoW $14.56/oz Gold -0.6% WoW $1,205/oz
0.00
1.00
2.00
3.00
4.00
5.00
6.00
7.00
8.00
31-Aug-17 31-Dec-17 30-Apr-18 31-Aug-180.00
0.50
1.00
1.50
2.00
2.50
3.00
3.50
Copp
er &
Zin
c US$
/lb
Nick
el U
S$/l
b
Zinc -3.1% WoW $1.12/lb
Copper -2.0% WoW $2.71/lb
Nickel -4.7% WoW $5.76/lb
0
1,000
2,000
3,000
4,000
5,000
6,000
7,000
8,000
31-Aug-17 31-Dec-17 30-Apr-18 31-Aug-180
50
100
150
200
250
S&P/
TSX
Glob
al G
old
S&P/
TSX
Dive
rsifi
ed M
etal
s & M
inin
g
S&P/TSX Global Gold Index -2.4% WoW
S&P/TSX Diversified Metals & Mining Index -2.3% WoW
The Weekly Dig 8/31/18
Haywood Mining [email protected] Page 2
Contents Haywood Research: The Week in Review ............................................................................................................. 3
Weekly Commodities ............................................................................................................................................ 5
Commodities Prices and Inventories .................................................................................................................... 6
Commodities and ETFs ......................................................................................................................................... 9
Upcoming Macroeconomic News .......................................................................................................................11
Weekly Indices .....................................................................................................................................................12
Weekly Equities ....................................................................................................................................................13
Precious Metals Companies ...............................................................................................................................13
Base Metals Companies ......................................................................................................................................16
Major International Miners ................................................................................................................................17
Tables Comparables Tables: Consensus and Haywood Forecasts/Multiples, Plus Market Valuations for In Situ Resources .............................................................................................................................................................18
Precious Metals Companies ...............................................................................................................................18
Base Metals Companies ......................................................................................................................................26
Other Companies (Uranium, Diamond, Cobalt, Coal, Iron) ................................................................................29
Junior Exploration Companies Review: Performance of Companies Included in Junior X and Upcoming Catalysts ..............................................................................................................................................................................32
The Weekly Dig 8/31/18
Haywood Mining [email protected] Page 3
Haywood Research: The Week in Review – Covered Companies Publications from the Haywood Research team for the week included the following for covered companies:
• Marathon Gold Corp. (MOZ-T, $0.91): Announcement of new discovery • Nevada Copper Corp. (NCU-T, C$0.46): Construction decision
Covered Name Reports:
Marathon Gold Corp. (MOZ-T, $0.91 [Buy Rating, $1.80 Target Price]) – Discovery of New 1,500 metre Southwest Extension Zone Mick Carew, PhD, [email protected]; Emma Boggio, MSA, CPA, CA, [email protected]
Marathon Gold announced that, through recent prospecting and trenching, it has discovered a 1,500 metre southwest extension of its Victory Gold Trend at its 100% owned Valentine Lake Gold Camp in central Newfoundland. The Company plans to commence drilling on the prospect with one of its rigs while the other two continue infill and expansion drilling at the Marathon Deposit.
See Haywood Securities for the full report
Nevada Copper Corp. (NCU-T, C$0.46 [Buy Rating, C$0.90 Target Price]) – Moving Forward with Construction; Reducing our Target Price Pierre Vaillancourt, [email protected]; Douglas Ibbitson, CFA, [email protected]
Nevada Copper announced a positive construction decision for its Pumpkin Hollow underground mine project. The decision was expected; pre-construction activities have been ongoing since May 2018. Capex increases to $197M from $183M. Nevada Copper announced the start of full-scale construction for the underground mine plan at Pumpkin Hollow. The Company has also awarded key project contracts for EPC as well as underground mine development and shaft sinking. A number of operational de-risking measures have been incorporated, including a centralized mine design and construction of a ventilation shaft via blind sink. As a result, the capex estimate has increased to $197M from the January 2018 PFS estimate of $183M. Further project enhancements continue to be reviewed by Nevada Copper.
See Haywood Securities for the full report
The Weekly Dig 8/31/18
Haywood Mining [email protected] Page 4
Haywood Research: The Week in Review – Uncovered Companies News from the Junior sector this week included the following for uncovered companies:
• Chakana Copper Corp. (PERU-V, $0.47): Site Visit
Mining Flashes:
Chakana Copper Corp. (PERU-V, $0.47 [Not Rated]) – Site Visit: Building a “Critical Mass” of Breccia Pipes at Soledad Mick Carew, PhD, [email protected]; Emma Boggio, MSA, CPA, CA, [email protected]
We recently visited Chakana Copper’s Soledad project near Aija, in the Ancash region of Peru. Soledad, which hosts a number of copper-gold and tourmaline-bearing breccia pipes of variable width, is located approximately 450 kilometres north of Lima within Peru’s prolific Cordillera Negra copper-gold belt and is situated at an elevation between 3,800 and 4,600 metres. Nearby mining operations include Barrick Gold’s (ABX-T; Hold; $19.50 Target Price) Pierina gold mine (35 kilometres to the north) and the Antamina mine joint venture (JV) (60 kilometres to the northeast). The project is also located < 1 kilometre west of the Hercules silver-lead-zinc mine owned by Lincuna (Private). Unpaved roads cleared for the mine and previous exploration programs in the area provide access to many of Chakana’s high-priority targets. Chakana acquired the Soledad project through a reverse takeover of Remo Resources late last year, and the Company has entered into three earn-in/purchase agreements with Condor Resources (CN-V; Not Rated), Barrick Gold, and a Peruvian family.
See Haywood Securities for the full report
The Weekly Dig 8/31/18
Haywood Mining [email protected] Page 5
Weekly Commodities
Source: Haywood Securities and Bloomberg
.
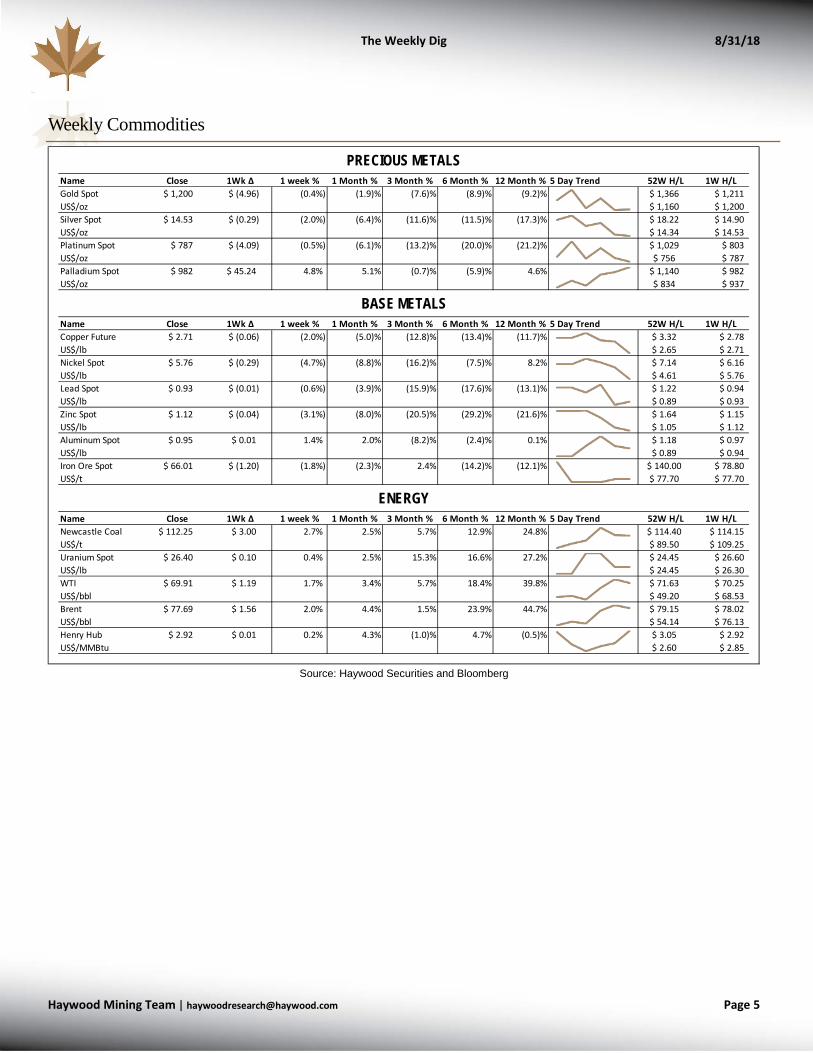
Name Close 1Wk Δ 1 week % 1 Month % 3 Month % 6 Month % 12 Month % 5 Day Trend 52W H/L 1W H/LGold Spot $ 1,200 $ (4.96) (0.4%) (1.9)% (7.6)% (8.9)% (9.2)% $ 1,366 $ 1,211US$/oz $ 1,160 $ 1,200Silver Spot $ 14.53 $ (0.29) (2.0%) (6.4)% (11.6)% (11.5)% (17.3)% $ 18.22 $ 14.90US$/oz $ 14.34 $ 14.53Platinum Spot $ 787 $ (4.09) (0.5%) (6.1)% (13.2)% (20.0)% (21.2)% $ 1,029 $ 803US$/oz $ 756 $ 787Palladium Spot $ 982 $ 45.24 4.8% 5.1% (0.7)% (5.9)% 4.6% $ 1,140 $ 982US$/oz $ 834 $ 937
Name Close 1Wk Δ 1 week % 1 Month % 3 Month % 6 Month % 12 Month % 5 Day Trend 52W H/L 1W H/LCopper Future $ 2.71 $ (0.06) (2.0%) (5.0)% (12.8)% (13.4)% (11.7)% $ 3.32 $ 2.78US$/lb $ 2.65 $ 2.71Nickel Spot $ 5.76 $ (0.29) (4.7%) (8.8)% (16.2)% (7.5)% 8.2% $ 7.14 $ 6.16US$/lb $ 4.61 $ 5.76Lead Spot $ 0.93 $ (0.01) (0.6%) (3.9)% (15.9)% (17.6)% (13.1)% $ 1.22 $ 0.94US$/lb $ 0.89 $ 0.93Zinc Spot $ 1.12 $ (0.04) (3.1%) (8.0)% (20.5)% (29.2)% (21.6)% $ 1.64 $ 1.15US$/lb $ 1.05 $ 1.12Aluminum Spot $ 0.95 $ 0.01 1.4% 2.0% (8.2)% (2.4)% 0.1% $ 1.18 $ 0.97US$/lb $ 0.89 $ 0.94Iron Ore Spot $ 66.01 $ (1.20) (1.8%) (2.3)% 2.4% (14.2)% (12.1)% $ 140.00 $ 78.80US$/t $ 77.70 $ 77.70
Name Close 1Wk Δ 1 week % 1 Month % 3 Month % 6 Month % 12 Month % 5 Day Trend 52W H/L 1W H/LNewcastle Coal $ 112.25 $ 3.00 2.7% 2.5% 5.7% 12.9% 24.8% $ 114.40 $ 114.15US$/t $ 89.50 $ 109.25Uranium Spot $ 26.40 $ 0.10 0.4% 2.5% 15.3% 16.6% 27.2% $ 24.45 $ 26.60US$/lb $ 24.45 $ 26.30WTI $ 69.91 $ 1.19 1.7% 3.4% 5.7% 18.4% 39.8% $ 71.63 $ 70.25US$/bbl $ 49.20 $ 68.53Brent $ 77.69 $ 1.56 2.0% 4.4% 1.5% 23.9% 44.7% $ 79.15 $ 78.02US$/bbl $ 54.14 $ 76.13Henry Hub $ 2.92 $ 0.01 0.2% 4.3% (1.0)% 4.7% (0.5)% $ 3.05 $ 2.92US$/MMBtu $ 2.60 $ 2.85
.
PRECIOUS METALS
BASE METALS
ENERGY
The Weekly Dig 8/31/18
Haywood Mining [email protected] Page 6
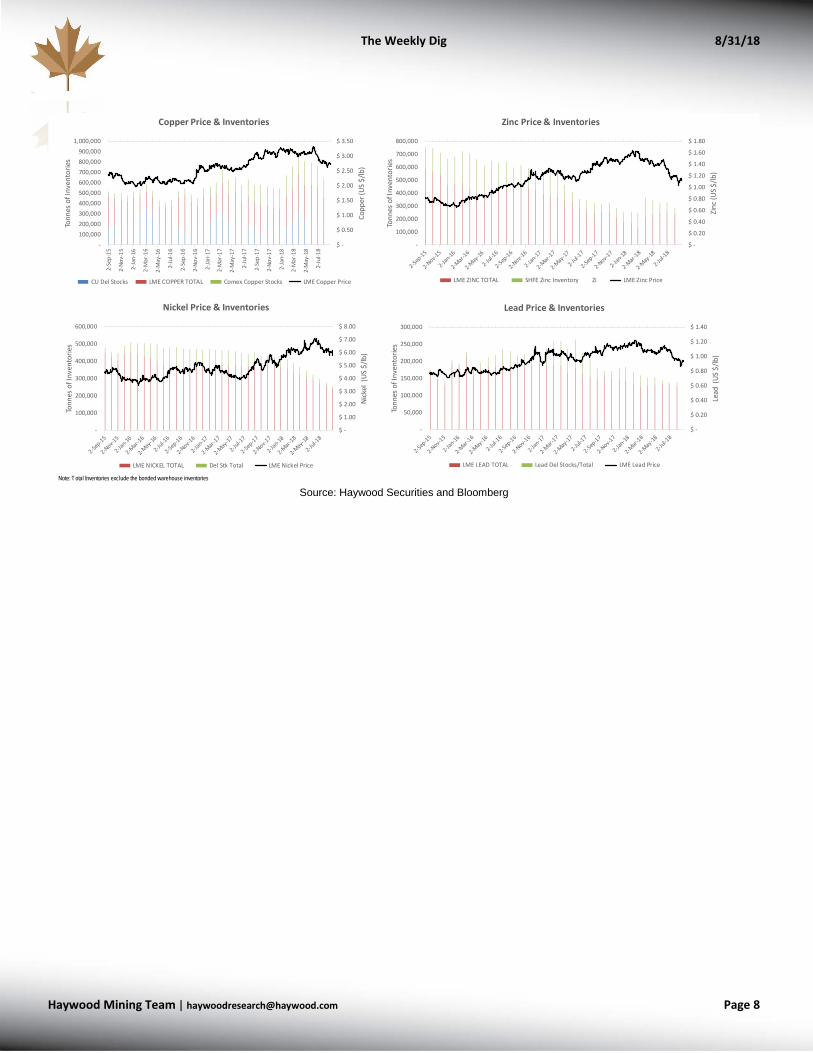
Commodities Prices and Inventories
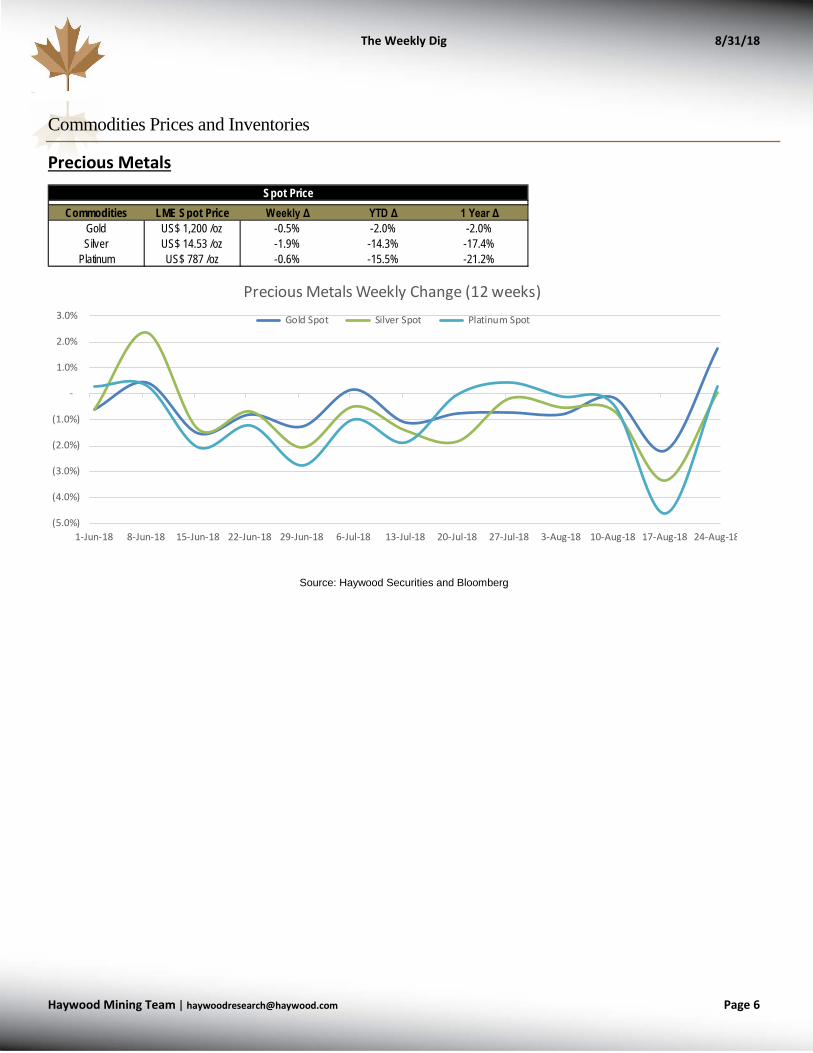
Precious Metals
Source: Haywood Securities and Bloomberg
Commodities LME Spot Price Weekly Δ YTD Δ 1 Year ΔGold US$ 1,200 /oz -0.5% -2.0% -2.0%Silver US$ 14.53 /oz -1.9% -14.3% -17.4%
Platinum US$ 787 /oz -0.6% -15.5% -21.2%
Spot Price
(5.0%)
(4.0%)
(3.0%)
(2.0%)
(1.0%)
-
1.0%
2.0%
3.0%
1-Jun-18 8-Jun-18 15-Jun-18 22-Jun-18 29-Jun-18 6-Jul-18 13-Jul-18 20-Jul-18 27-Jul-18 3-Aug-18 10-Aug-18 17-Aug-18 24-Aug-18
Precious Metals Weekly Change (12 weeks) Gold Spot Silver Spot Platinum Spot
The Weekly Dig 8/31/18
Haywood Mining [email protected] Page 7
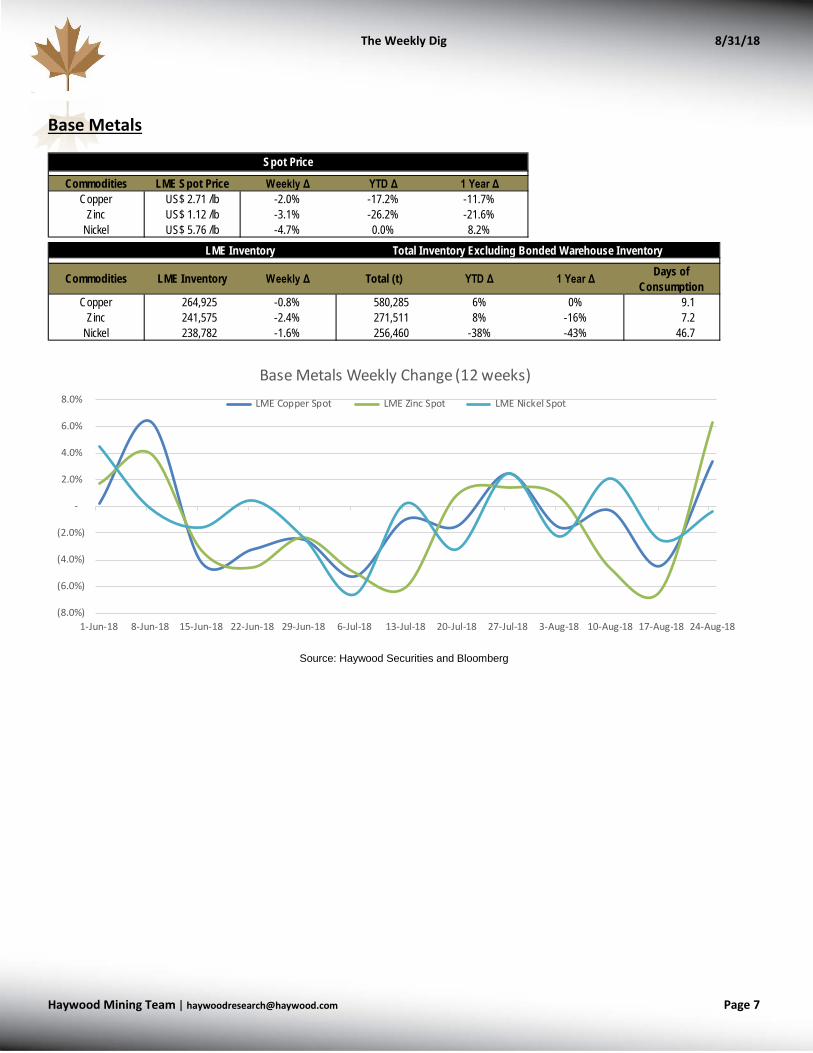
Base Metals
Source: Haywood Securities and Bloomberg
Commodities LME Spot Price Weekly Δ YTD Δ 1 Year ΔCopper US$ 2.71 /lb -2.0% -17.2% -11.7%
Zinc US$ 1.12 /lb -3.1% -26.2% -21.6%Nickel US$ 5.76 /lb -4.7% 0.0% 8.2%
Commodities LME Inventory Weekly Δ Total (t) YTD Δ 1 Year Δ Days of Consumption
Copper 264,925 -0.8% 580,285 6% 0% 9.1 Zinc 241,575 -2.4% 271,511 8% -16% 7.2
Nickel 238,782 -1.6% 256,460 -38% -43% 46.7
LME Inventory Total Inventory Excluding Bonded Warehouse Inventory
Spot Price
(8.0%)
(6.0%)
(4.0%)
(2.0%)
-
2.0%
4.0%
6.0%
8.0%
1-Jun-18 8-Jun-18 15-Jun-18 22-Jun-18 29-Jun-18 6-Jul-18 13-Jul-18 20-Jul-18 27-Jul-18 3-Aug-18 10-Aug-18 17-Aug-18 24-Aug-18
Base Metals Weekly Change (12 weeks) LME Copper Spot LME Zinc Spot LME Nickel Spot
The Weekly Dig 8/31/18
Haywood Mining [email protected] Page 8
Source: Haywood Securities and Bloomberg
1
Note: Total Inventories exclude the bonded warehouse inventories
30-Sep-1531-Oct-1530-Nov-1531-Dec-1531-Jan-1629-Feb-1631-Mar-1630-Apr-1631-May-1630-Jun-1631-Jul-1631-Aug-1630-Sep-1631-Oct-1630-Nov-1631-Dec-1631-Jan-1728-Feb-1731-Mar-1730-Apr-1731-May-1730-Jun-1731-Jul-1731-Aug-1730-Sep-1731-Oct-1730-Nov-1731-Dec-1731-Jan-1828-Feb-1831-Mar-1830-Apr-1831-May-1830-Jun-1831-Jul-1831-Aug-18
-100,000200,000300,000400,000500,000600,000700,000800,000900,000
1,000,000
2-Se
p-15
2-No
v-15
2-Ja
n-16
2-M
ar-1
6
2-M
ay-1
6
2-Ju
l-16
2-Se
p-16
2-No
v-16
2-Ja
n-17
2-M
ar-1
7
2-M
ay-1
7
2-Ju
l-17
2-Se
p-17
2-No
v-17
2-Ja
n-18
2-M
ar-1
8
2-M
ay-1
8
2-Ju
l-18
$ -
$ 0.50
$ 1.00
$ 1.50
$ 2.00
$ 2.50
$ 3.00
$ 3.50
Tonn
es o
f Inv
ento
ries
Copp
er (U
S $/
lb)
Copper Price & Inventories
CU Del Stocks LME COPPER TOTAL Comex Copper Stocks LME Copper Price
30-Sep-1531-Oct-1530-Nov-1531-Dec-1531-Jan-1629-Feb-1631-Mar-1630-Apr-1631-May-1630-Jun-1631-Jul-1631-Aug-1630-Sep-1631-Oct-1630-Nov-1631-Dec-1631-Jan-1728-Feb-1731-Mar-1730-Apr-1731-May-1730-Jun-1731-Jul-1731-Aug-1730-Sep-1731-Oct-1730-Nov-1731-Dec-1731-Jan-1828-Feb-1831-Mar-1830-Apr-1831-May-1830-Jun-1831-Jul-1831-Aug-18
-
100,000
200,000
300,000
400,000
500,000
600,000
700,000
800,000
$ -
$ 0.20
$ 0.40
$ 0.60
$ 0.80
$ 1.00
$ 1.20
$ 1.40
$ 1.60
$ 1.80
Tonn
es o
f Inv
ento
ries
Zinc
(US $
/lb)
Zinc Price & Inventories
LME ZINC TOTAL SHFE Zinc Inventory Zi LME Zinc Price
30-Sep-1531-Oct-1530-Nov-1531-Dec-1531-Jan-1629-Feb-1631-Mar-1630-Apr-1631-May-1630-Jun-1631-Jul-1631-Aug-1630-Sep-1631-Oct-1630-Nov-1631-Dec-1631-Jan-1728-Feb-1731-Mar-1730-Apr-1731-May-1730-Jun-1731-Jul-1731-Aug-1730-Sep-1731-Oct-1730-Nov-1731-Dec-1731-Jan-1828-Feb-1831-Mar-1830-Apr-1831-May-1830-Jun-1831-Jul-1831-Aug-18
-
100,000
200,000
300,000
400,000
500,000
600,000
$ -
$ 1.00
$ 2.00
$ 3.00
$ 4.00
$ 5.00
$ 6.00
$ 7.00
$ 8.00
Tonn
es o
f Inv
ento
ries
Nick
el (
US $
/lb)
Nickel Price & Inventories
LME NICKEL TOTAL Del Stk Total LME Nickel Price
30-Sep-1531-Oct-1530-Nov-1531-Dec-1531-Jan-1629-Feb-1631-Mar-1630-Apr-1631-May-1630-Jun-1631-Jul-1631-Aug-1630-Sep-1631-Oct-1630-Nov-1631-Dec-1631-Jan-1728-Feb-1731-Mar-1730-Apr-1731-May-1730-Jun-1731-Jul-1731-Aug-1730-Sep-1731-Oct-1730-Nov-1731-Dec-1731-Jan-1828-Feb-1831-Mar-1830-Apr-1831-May-1830-Jun-1831-Jul-1831-Aug-18
-
50,000
100,000
150,000
200,000
250,000
300,000
$ -
$ 0.20
$ 0.40
$ 0.60
$ 0.80
$ 1.00
$ 1.20
$ 1.40
Tonn
es o
f Inv
ento
ries
Lead
(US
$/lb
)
Lead Price & Inventories
LME LEAD TOTAL Lead Del Stocks/Total LME Lead Price
The Weekly Dig 8/31/18
Haywood Mining [email protected] Page 9
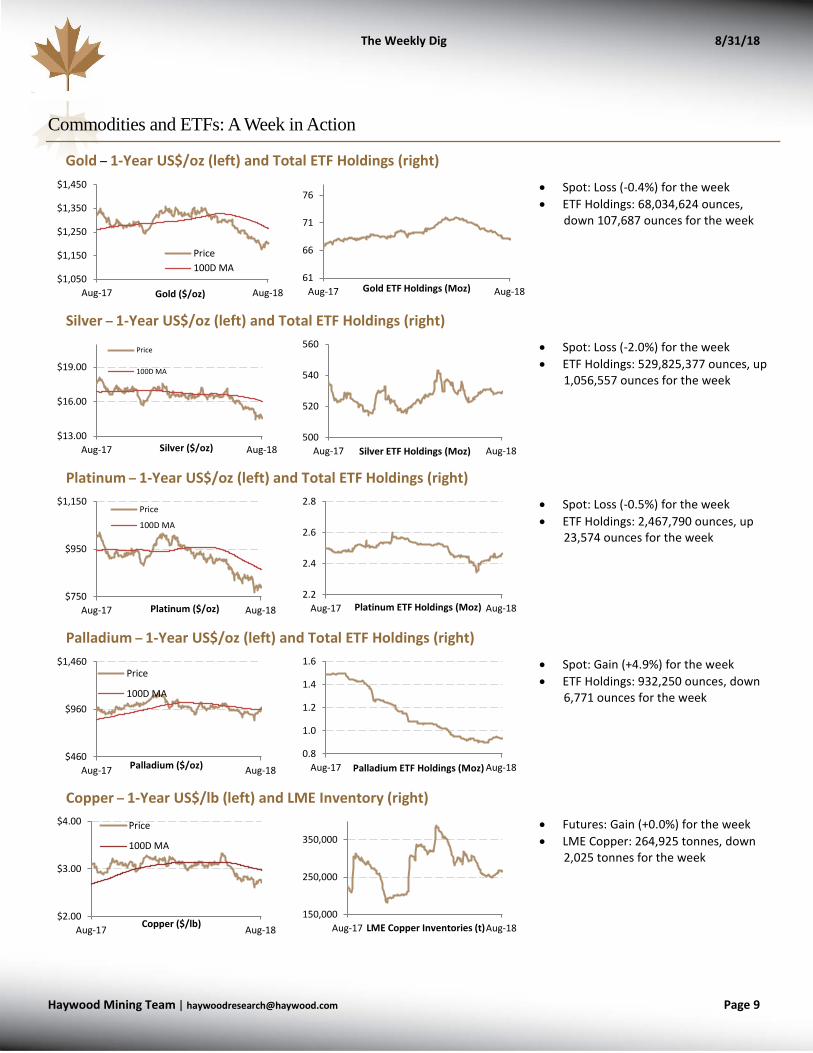
Commodities and ETFs: A Week in Action
Gold – 1-Year US$/oz (left) and Total ETF Holdings (right)
• Spot: Loss (-0.4%) for the week • ETF Holdings: 68,034,624 ounces,
down 107,687 ounces for the week
Silver – 1-Year US$/oz (left) and Total ETF Holdings (right)
• Spot: Loss (-2.0%) for the week • ETF Holdings: 529,825,377 ounces, up
1,056,557 ounces for the week
Platinum – 1-Year US$/oz (left) and Total ETF Holdings (right)
• Spot: Loss (-0.5%) for the week • ETF Holdings: 2,467,790 ounces, up
23,574 ounces for the week
Palladium – 1-Year US$/oz (left) and Total ETF Holdings (right)
• Spot: Gain (+4.9%) for the week • ETF Holdings: 932,250 ounces, down
6,771 ounces for the week
Copper – 1-Year US$/lb (left) and LME Inventory (right)
• Futures: Gain (+0.0%) for the week • LME Copper: 264,925 tonnes, down
2,025 tonnes for the week
$1,050
$1,150
$1,250
$1,350
$1,450
Aug-17 Aug-18Gold ($/oz)
Price100D MA
61
66
71
76
Aug-17 Aug-18Gold ETF Holdings (Moz)
$13.00
$16.00
$19.00
Aug-17 Aug-18Silver ($/oz)
Price
100D MA
500
520
540
560
Aug-17 Aug-18Silver ETF Holdings (Moz)
$750
$950
$1,150
Aug-17 Aug-18Platinum ($/oz)
Price
100D MA
2.2
2.4
2.6
2.8
Aug-17 Aug-18Platinum ETF Holdings (Moz)
$460
$960
$1,460
Aug-17 Aug-18Palladium ($/oz)
Price
100D MA
0.8
1.0
1.2
1.4
1.6
Aug-17 Aug-18Palladium ETF Holdings (Moz)
$2.00
$3.00
$4.00
Aug-17 Aug-18Copper ($/lb)
Price
100D MA
150,000
250,000
350,000
Aug-17 Aug-18LME Copper Inventories (t)
The Weekly Dig 8/31/18
Haywood Mining [email protected] Page 10
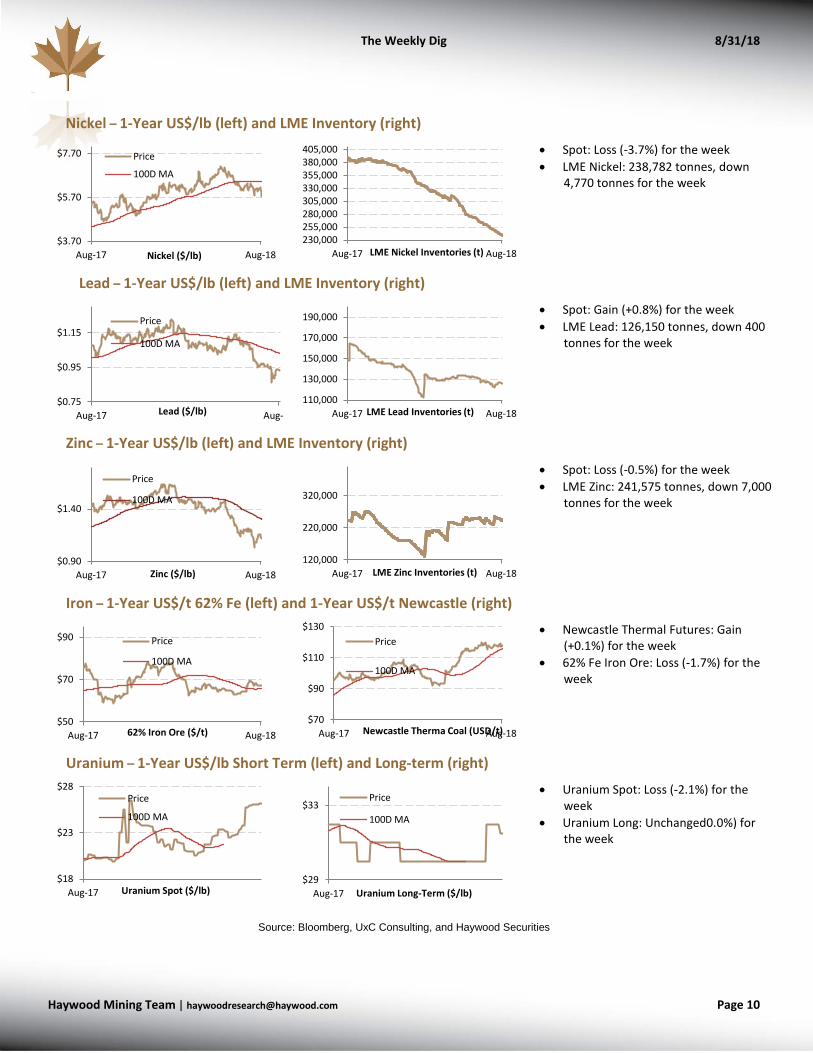
Nickel – 1-Year US$/lb (left) and LME Inventory (right)
• Spot: Loss (-3.7%) for the week • LME Nickel: 238,782 tonnes, down
4,770 tonnes for the week
Lead – 1-Year US$/lb (left) and LME Inventory (right)
• Spot: Gain (+0.8%) for the week • LME Lead: 126,150 tonnes, down 400
tonnes for the week
Zinc – 1-Year US$/lb (left) and LME Inventory (right)
• Spot: Loss (-0.5%) for the week • LME Zinc: 241,575 tonnes, down 7,000
tonnes for the week
Iron – 1-Year US$/t 62% Fe (left) and 1-Year US$/t Newcastle (right)
• Newcastle Thermal Futures: Gain (+0.1%) for the week
• 62% Fe Iron Ore: Loss (-1.7%) for the week
Uranium – 1-Year US$/lb Short Term (left) and Long-term (right)
• Uranium Spot: Loss (-2.1%) for the week
• Uranium Long: Unchanged0.0%) for the week
Source: Bloomberg, UxC Consulting, and Haywood Securities
$3.70
$5.70
$7.70
Aug-17 Aug-18Nickel ($/lb)
Price
100D MA
230,000255,000280,000305,000330,000355,000380,000405,000
Aug-17 Aug-18LME Nickel Inventories (t)
$0.75
$0.95
$1.15
Aug-17 Aug-1Lead ($/lb)
Price
100D MA
110,000
130,000
150,000
170,000
190,000
Aug-17 Aug-18LME Lead Inventories (t)
$0.90
$1.40
Aug-17 Aug-18Zinc ($/lb)
Price
100D MA
120,000
220,000
320,000
Aug-17 Aug-18LME Zinc Inventories (t)
$50
$70
$90
Aug-17 Aug-1862% Iron Ore ($/t)
Price
100D MA
$70
$90
$110
$130
Aug-17 Aug-18Newcastle Therma Coal (USD/t)
Price
100D MA
$18
$23
$28
Aug-17 Uranium Spot ($/lb)
Price
100D MA
$29
$33
Aug-17 Uranium Long-Term ($/lb)
Price
100D MA
The Weekly Dig 8/31/18
Haywood Mining [email protected] Page 11
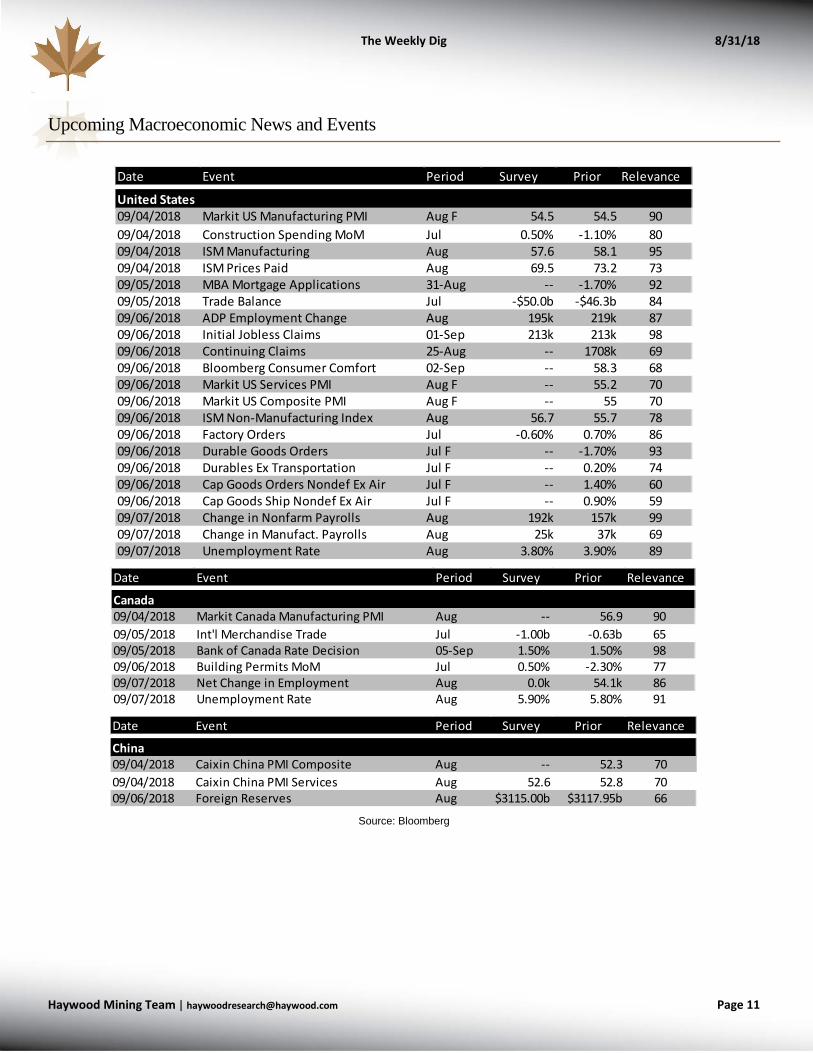
Upcoming Macroeconomic News and Events
Source: Bloomberg
Date Event Period Survey Prior Relevance
United States09/04/2018 Markit US Manufacturing PMI Aug F 54.5 54.5 9009/04/2018 Construction Spending MoM Jul 0.50% -1.10% 8009/04/2018 ISM Manufacturing Aug 57.6 58.1 9509/04/2018 ISM Prices Paid Aug 69.5 73.2 7309/05/2018 MBA Mortgage Applications 31-Aug -- -1.70% 9209/05/2018 Trade Balance Jul -$50.0b -$46.3b 8409/06/2018 ADP Employment Change Aug 195k 219k 8709/06/2018 Initial Jobless Claims 01-Sep 213k 213k 9809/06/2018 Continuing Claims 25-Aug -- 1708k 6909/06/2018 Bloomberg Consumer Comfort 02-Sep -- 58.3 6809/06/2018 Markit US Services PMI Aug F -- 55.2 7009/06/2018 Markit US Composite PMI Aug F -- 55 7009/06/2018 ISM Non-Manufacturing Index Aug 56.7 55.7 7809/06/2018 Factory Orders Jul -0.60% 0.70% 8609/06/2018 Durable Goods Orders Jul F -- -1.70% 9309/06/2018 Durables Ex Transportation Jul F -- 0.20% 7409/06/2018 Cap Goods Orders Nondef Ex Air Jul F -- 1.40% 6009/06/2018 Cap Goods Ship Nondef Ex Air Jul F -- 0.90% 5909/07/2018 Change in Nonfarm Payrolls Aug 192k 157k 9909/07/2018 Change in Manufact. Payrolls Aug 25k 37k 6909/07/2018 Unemployment Rate Aug 3.80% 3.90% 89
Date Event Period Survey Prior Relevance
Canada09/04/2018 Markit Canada Manufacturing PMI Aug -- 56.9 9009/05/2018 Int'l Merchandise Trade Jul -1.00b -0.63b 6509/05/2018 Bank of Canada Rate Decision 05-Sep 1.50% 1.50% 9809/06/2018 Building Permits MoM Jul 0.50% -2.30% 7709/07/2018 Net Change in Employment Aug 0.0k 54.1k 8609/07/2018 Unemployment Rate Aug 5.90% 5.80% 91
Date Event Period Survey Prior Relevance
China09/04/2018 Caixin China PMI Composite Aug -- 52.3 7009/04/2018 Caixin China PMI Services Aug 52.6 52.8 7009/06/2018 Foreign Reserves Aug $3115.00b $3117.95b 66
The Weekly Dig 8/31/18
Haywood Mining [email protected] Page 12
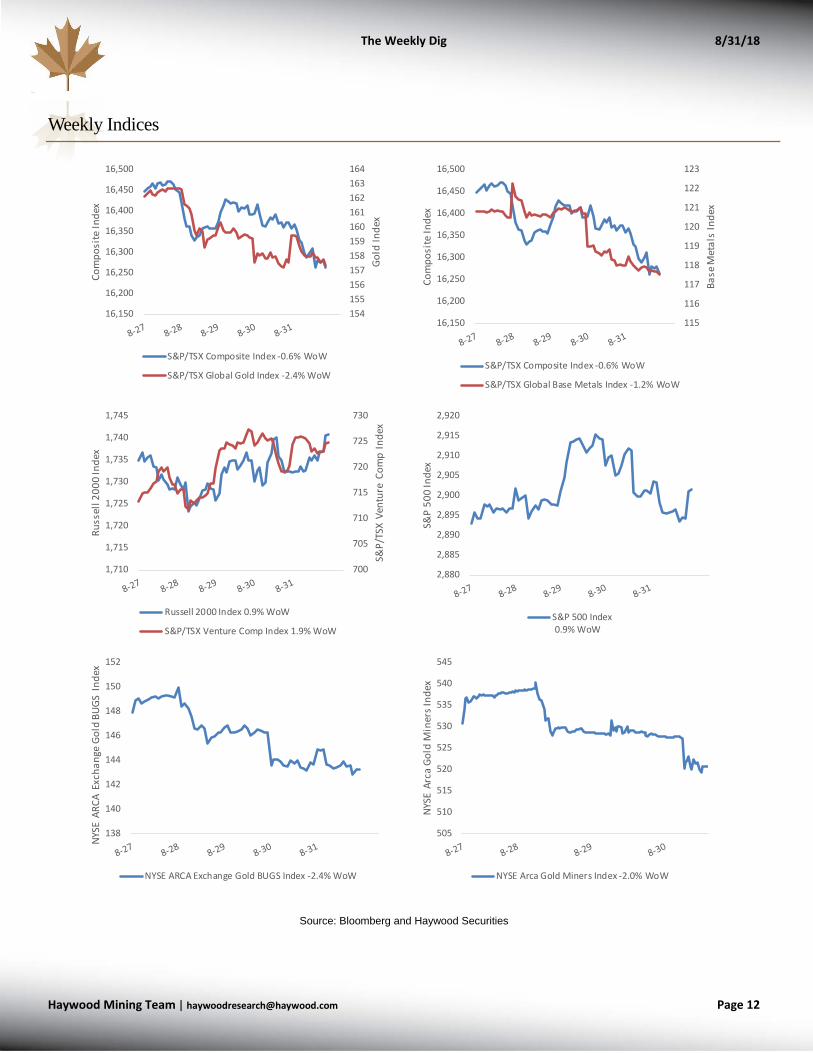
Weekly Indices
Source: Bloomberg and Haywood Securities
.
.
154155156157158159160161162163164
16,150
16,200
16,250
16,300
16,350
16,400
16,450
16,500
Gold
Inde
x
Com
posi
te In
dex
S&P/TSX Composite Index -0.6% WoW
S&P/TSX Global Gold Index -2.4% WoW
115
116
117
118
119
120
121
122
123
16,150
16,200
16,250
16,300
16,350
16,400
16,450
16,500
Base
Met
als
Inde
x
Com
posi
te In
dex
S&P/TSX Composite Index -0.6% WoW
S&P/TSX Global Base Metals Index -1.2% WoW
700
705
710
715
720
725
730
1,710
1,715
1,720
1,725
1,730
1,735
1,740
1,745
S&P/
TSX
Vent
ure
Com
p In
dex
Russ
ell 2
000
Inde
x
Russell 2000 Index 0.9% WoW
S&P/TSX Venture Comp Index 1.9% WoW
2,880
2,885
2,890
2,895
2,900
2,905
2,910
2,915
2,920S&
P 50
0 In
dex
S&P 500 Index 0.9% WoW
138
140
142
144
146
148
150
152
NYSE
ARC
A Ex
chan
ge G
old
BUGS
Ind
ex
NYSE ARCA Exchange Gold BUGS Index -2.4% WoW
505
510
515
520
525
530
535
540
545
NYSE
Arc
a Go
ld M
iner
s Ind
ex
NYSE Arca Gold Miners Index -2.0% WoW
The Weekly Dig 8/31/18
Haywood Mining [email protected] Page 13
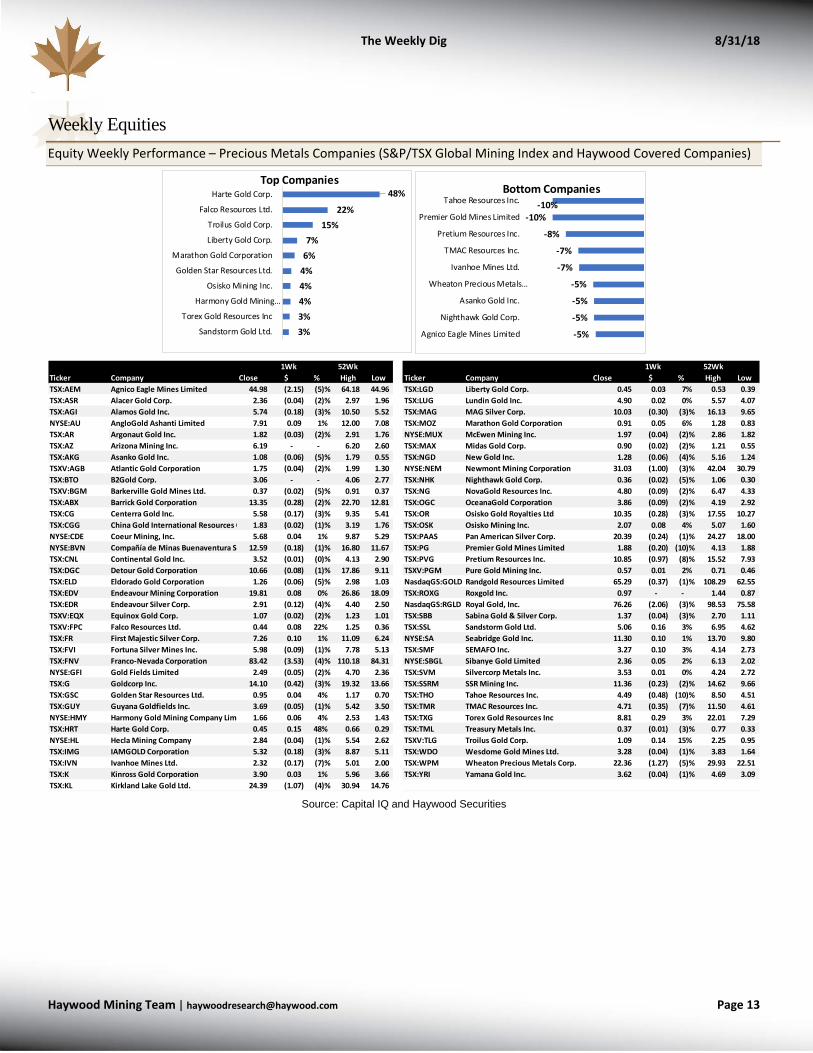
Weekly Equities Equity Weekly Performance – Precious Metals Companies (S&P/TSX Global Mining Index and Haywood Covered Companies)
Source: Capital IQ and Haywood Securities
48%
22% 15%
7% 6%
4% 4% 4% 3% 3%
Harte Gold Corp.
Falco Resources Ltd.
Troilus Gold Corp.
Liberty Gold Corp.
Marathon Gold Corporation
Golden Star Resources Ltd.
Osisko Mining Inc.
Harmony Gold Mining…
Torex Gold Resources Inc
Sandstorm Gold Ltd.
Top Companies
-10%-10%
-8%
-7%
-7%
-5%
-5%
-5%
-5%
Tahoe Resources Inc.
Premier Gold Mines Limited
Pretium Resources Inc.
TMAC Resources Inc.
Ivanhoe Mines Ltd.
Wheaton Precious Metals…
Asanko Gold Inc.
Nighthawk Gold Corp.
Agnico Eagle Mines Limited
Bottom Companies
1Wk 52Wk 1Wk 52WkTicker Company Close $∆ %∆ High Low Ticker Company Close $∆ %∆ High LowTSX:AEM Agnico Eagle Mines Limited 44.98 (2.15) (5)% 64.18 44.96 TSX:LGD Liberty Gold Corp. 0.45 0.03 7% 0.53 0.39 TSX:ASR Alacer Gold Corp. 2.36 (0.04) (2)% 2.97 1.96 TSX:LUG Lundin Gold Inc. 4.90 0.02 0% 5.57 4.07 TSX:AGI Alamos Gold Inc. 5.74 (0.18) (3)% 10.50 5.52 TSX:MAG MAG Silver Corp. 10.03 (0.30) (3)% 16.13 9.65 NYSE:AU AngloGold Ashanti Limited 7.91 0.09 1% 12.00 7.08 TSX:MOZ Marathon Gold Corporation 0.91 0.05 6% 1.28 0.83 TSX:AR Argonaut Gold Inc. 1.82 (0.03) (2)% 2.91 1.76 NYSE:MUX McEwen Mining Inc. 1.97 (0.04) (2)% 2.86 1.82 TSX:AZ Arizona Mining Inc. 6.19 - - 6.20 2.60 TSX:MAX Midas Gold Corp. 0.90 (0.02) (2)% 1.21 0.55 TSX:AKG Asanko Gold Inc. 1.08 (0.06) (5)% 1.79 0.55 TSX:NGD New Gold Inc. 1.28 (0.06) (4)% 5.16 1.24 TSXV:AGB Atlantic Gold Corporation 1.75 (0.04) (2)% 1.99 1.30 NYSE:NEM Newmont Mining Corporation 31.03 (1.00) (3)% 42.04 30.79 TSX:BTO B2Gold Corp. 3.06 - - 4.06 2.77 TSX:NHK Nighthawk Gold Corp. 0.36 (0.02) (5)% 1.06 0.30 TSXV:BGM Barkerville Gold Mines Ltd. 0.37 (0.02) (5)% 0.91 0.37 TSX:NG NovaGold Resources Inc. 4.80 (0.09) (2)% 6.47 4.33 TSX:ABX Barrick Gold Corporation 13.35 (0.28) (2)% 22.70 12.81 TSX:OGC OceanaGold Corporation 3.86 (0.09) (2)% 4.19 2.92 TSX:CG Centerra Gold Inc. 5.58 (0.17) (3)% 9.35 5.41 TSX:OR Osisko Gold Royalties Ltd 10.35 (0.28) (3)% 17.55 10.27 TSX:CGG China Gold International Resources C 1.83 (0.02) (1)% 3.19 1.76 TSX:OSK Osisko Mining Inc. 2.07 0.08 4% 5.07 1.60 NYSE:CDE Coeur Mining, Inc. 5.68 0.04 1% 9.87 5.29 TSX:PAAS Pan American Silver Corp. 20.39 (0.24) (1)% 24.27 18.00 NYSE:BVN Compañía de Minas Buenaventura S. 12.59 (0.18) (1)% 16.80 11.67 TSX:PG Premier Gold Mines Limited 1.88 (0.20) (10)% 4.13 1.88 TSX:CNL Continental Gold Inc. 3.52 (0.01) (0)% 4.13 2.90 TSX:PVG Pretium Resources Inc. 10.85 (0.97) (8)% 15.52 7.93 TSX:DGC Detour Gold Corporation 10.66 (0.08) (1)% 17.86 9.11 TSXV:PGM Pure Gold Mining Inc. 0.57 0.01 2% 0.71 0.46 TSX:ELD Eldorado Gold Corporation 1.26 (0.06) (5)% 2.98 1.03 NasdaqGS:GOLD Randgold Resources Limited 65.29 (0.37) (1)% 108.29 62.55 TSX:EDV Endeavour Mining Corporation 19.81 0.08 0% 26.86 18.09 TSX:ROXG Roxgold Inc. 0.97 - - 1.44 0.87 TSX:EDR Endeavour Silver Corp. 2.91 (0.12) (4)% 4.40 2.50 NasdaqGS:RGLD Royal Gold, Inc. 76.26 (2.06) (3)% 98.53 75.58 TSXV:EQX Equinox Gold Corp. 1.07 (0.02) (2)% 1.23 1.01 TSX:SBB Sabina Gold & Silver Corp. 1.37 (0.04) (3)% 2.70 1.11 TSXV:FPC Falco Resources Ltd. 0.44 0.08 22% 1.25 0.36 TSX:SSL Sandstorm Gold Ltd. 5.06 0.16 3% 6.95 4.62 TSX:FR First Majestic Silver Corp. 7.26 0.10 1% 11.09 6.24 NYSE:SA Seabridge Gold Inc. 11.30 0.10 1% 13.70 9.80 TSX:FVI Fortuna Silver Mines Inc. 5.98 (0.09) (1)% 7.78 5.13 TSX:SMF SEMAFO Inc. 3.27 0.10 3% 4.14 2.73 TSX:FNV Franco-Nevada Corporation 83.42 (3.53) (4)% 110.18 84.31 NYSE:SBGL Sibanye Gold Limited 2.36 0.05 2% 6.13 2.02 NYSE:GFI Gold Fields Limited 2.49 (0.05) (2)% 4.70 2.36 TSX:SVM Silvercorp Metals Inc. 3.53 0.01 0% 4.24 2.72 TSX:G Goldcorp Inc. 14.10 (0.42) (3)% 19.32 13.66 TSX:SSRM SSR Mining Inc. 11.36 (0.23) (2)% 14.62 9.66 TSX:GSC Golden Star Resources Ltd. 0.95 0.04 4% 1.17 0.70 TSX:THO Tahoe Resources Inc. 4.49 (0.48) (10)% 8.50 4.51 TSX:GUY Guyana Goldfields Inc. 3.69 (0.05) (1)% 5.42 3.50 TSX:TMR TMAC Resources Inc. 4.71 (0.35) (7)% 11.50 4.61 NYSE:HMY Harmony Gold Mining Company Limi 1.66 0.06 4% 2.53 1.43 TSX:TXG Torex Gold Resources Inc 8.81 0.29 3% 22.01 7.29 TSX:HRT Harte Gold Corp. 0.45 0.15 48% 0.66 0.29 TSX:TML Treasury Metals Inc. 0.37 (0.01) (3)% 0.77 0.33 NYSE:HL Hecla Mining Company 2.84 (0.04) (1)% 5.54 2.62 TSXV:TLG Troilus Gold Corp. 1.09 0.14 15% 2.25 0.95 TSX:IMG IAMGOLD Corporation 5.32 (0.18) (3)% 8.87 5.11 TSX:WDO Wesdome Gold Mines Ltd. 3.28 (0.04) (1)% 3.83 1.64 TSX:IVN Ivanhoe Mines Ltd. 2.32 (0.17) (7)% 5.01 2.00 TSX:WPM Wheaton Precious Metals Corp. 22.36 (1.27) (5)% 29.93 22.51 TSX:K Kinross Gold Corporation 3.90 0.03 1% 5.96 3.66 TSX:YRI Yamana Gold Inc. 3.62 (0.04) (1)% 4.69 3.09 TSX:KL Kirkland Lake Gold Ltd. 24.39 (1.07) (4)% 30.94 14.76
The Weekly Dig 8/31/18
Haywood Mining [email protected] Page 14
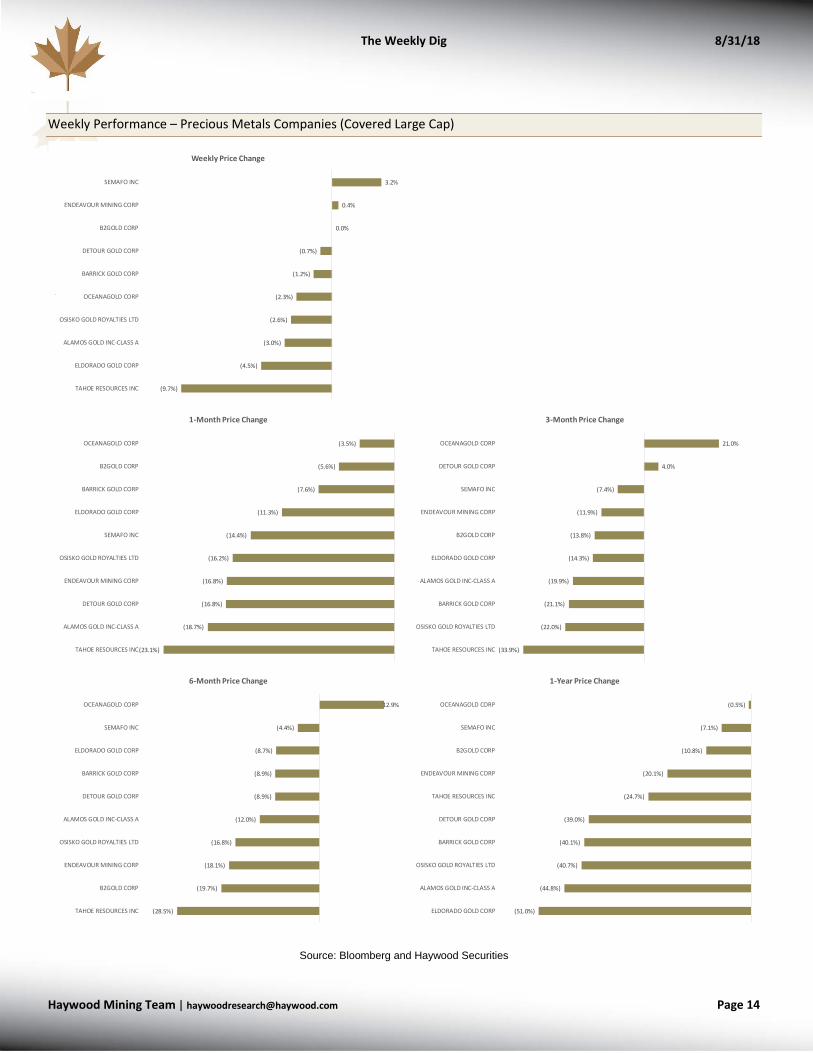
Weekly Performance – Precious Metals Companies (Covered Large Cap)
Source: Bloomberg and Haywood Securities
.
.
3.2%
0.4%
0.0%
(0.7%)
(1.2%)
(2.3%)
(2.6%)
(3.0%)
(4.5%)
(9.7%)
SEMAFO INC
ENDEAVOUR MINING CORP
B2GOLD CORP
DETOUR GOLD CORP
BARRICK GOLD CORP
OCEANAGOLD CORP
OSISKO GOLD ROYALTIES LTD
ALAMOS GOLD INC-CLASS A
ELDORADO GOLD CORP
TAHOE RESOURCES INC
Weekly Price Change
(3.5%)
(5.6%)
(7.6%)
(11.3%)
(14.4%)
(16.2%)
(16.8%)
(16.8%)
(18.7%)
(23.1%)
OCEANAGOLD CORP
B2GOLD CORP
BARRICK GOLD CORP
ELDORADO GOLD CORP
SEMAFO INC
OSISKO GOLD ROYALTIES LTD
ENDEAVOUR MINING CORP
DETOUR GOLD CORP
ALAMOS GOLD INC-CLASS A
TAHOE RESOURCES INC
1-Month Price Change
21.0%
4.0%
(7.4%)
(11.9%)
(13.8%)
(14.3%)
(19.9%)
(21.1%)
(22.0%)
(33.9%)
OCEANAGOLD CORP
DETOUR GOLD CORP
SEMAFO INC
ENDEAVOUR MINING CORP
B2GOLD CORP
ELDORADO GOLD CORP
ALAMOS GOLD INC-CLASS A
BARRICK GOLD CORP
OSISKO GOLD ROYALTIES LTD
TAHOE RESOURCES INC
3-Month Price Change
12.9%
(4.4%)
(8.7%)
(8.9%)
(8.9%)
(12.0%)
(16.8%)
(18.1%)
(19.7%)
(28.5%)
OCEANAGOLD CORP
SEMAFO INC
ELDORADO GOLD CORP
BARRICK GOLD CORP
DETOUR GOLD CORP
ALAMOS GOLD INC-CLASS A
OSISKO GOLD ROYALTIES LTD
ENDEAVOUR MINING CORP
B2GOLD CORP
TAHOE RESOURCES INC
6-Month Price Change
(0.5%)
(7.1%)
(10.8%)
(20.1%)
(24.7%)
(39.0%)
(40.1%)
(40.7%)
(44.8%)
(51.0%)
OCEANAGOLD CORP
SEMAFO INC
B2GOLD CORP
ENDEAVOUR MINING CORP
TAHOE RESOURCES INC
DETOUR GOLD CORP
BARRICK GOLD CORP
OSISKO GOLD ROYALTIES LTD
ALAMOS GOLD INC-CLASS A
ELDORADO GOLD CORP
1-Year Price Change
The Weekly Dig 8/31/18
Haywood Mining [email protected] Page 15
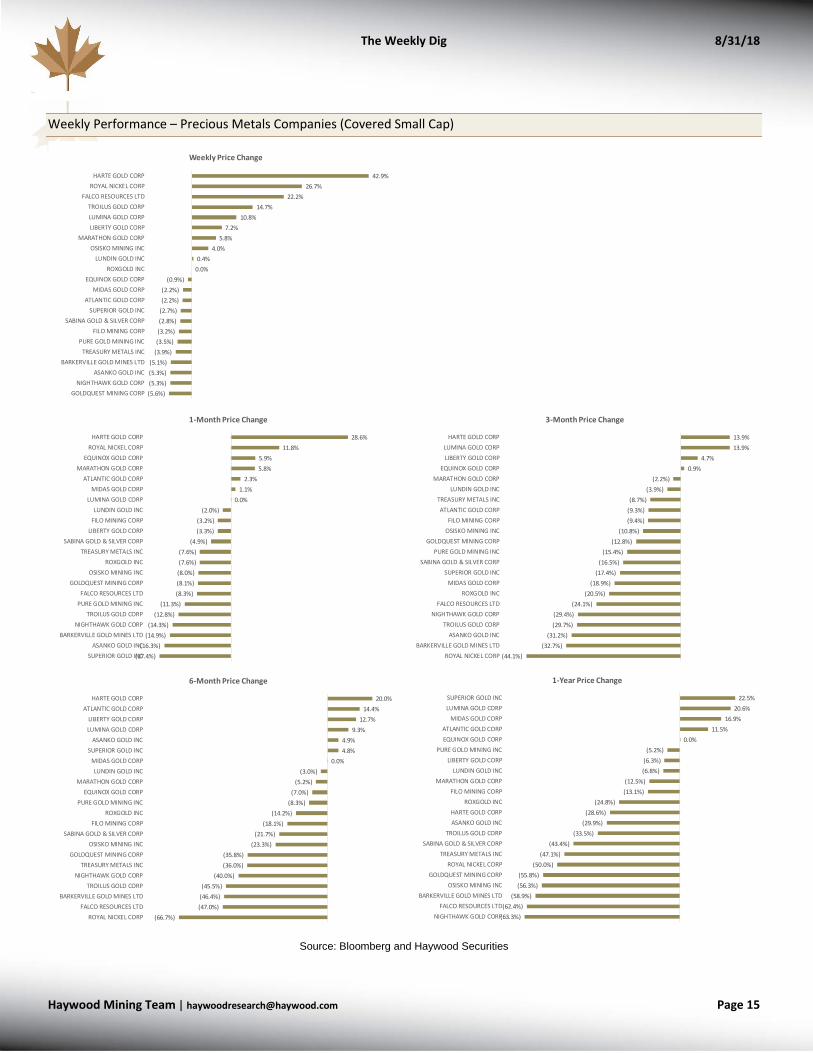
Weekly Performance – Precious Metals Companies (Covered Small Cap)
Source: Bloomberg and Haywood Securities
.
.
42.9% 26.7%
22.2% 14.7%
10.8% 7.2%
5.8% 4.0%
0.4% 0.0%
(0.9%)(2.2%)(2.2%)
(2.7%)(2.8%)(3.2%)(3.5%)
(3.9%)(5.1%)(5.3%)(5.3%)(5.6%)
HARTE GOLD CORPROYAL NICKEL CORP
FALCO RESOURCES LTDTROILUS GOLD CORPLUMINA GOLD CORPLIBERTY GOLD CORP
MARATHON GOLD CORPOSISKO MINING INC
LUNDIN GOLD INCROXGOLD INC
EQUINOX GOLD CORPMIDAS GOLD CORP
ATLANTIC GOLD CORPSUPERIOR GOLD INC
SABINA GOLD & SILVER CORPFILO MINING CORP
PURE GOLD MINING INCTREASURY METALS INC
BARKERVILLE GOLD MINES LTDASANKO GOLD INC
NIGHTHAWK GOLD CORPGOLDQUEST MINING CORP
Weekly Price Change
28.6% 11.8%
5.9% 5.8%
2.3% 1.1%
0.0% (2.0%)
(3.2%)(3.3%)
(4.9%)(7.6%)(7.6%)
(8.0%)(8.1%)(8.3%)
(11.3%)(12.8%)
(14.3%)(14.9%)
(16.3%)(17.4%)
HARTE GOLD CORPROYAL NICKEL CORP
EQUINOX GOLD CORPMARATHON GOLD CORP
ATLANTIC GOLD CORPMIDAS GOLD CORP
LUMINA GOLD CORPLUNDIN GOLD INC
FILO MINING CORPLIBERTY GOLD CORP
SABINA GOLD & SILVER CORPTREASURY METALS INC
ROXGOLD INCOSISKO MINING INC
GOLDQUEST MINING CORPFALCO RESOURCES LTD
PURE GOLD MINING INCTROILUS GOLD CORP
NIGHTHAWK GOLD CORPBARKERVILLE GOLD MINES LTD
ASANKO GOLD INCSUPERIOR GOLD INC
1-Month Price Change
13.9% 13.9%
4.7% 0.9%
(2.2%)(3.9%)
(8.7%)(9.3%)(9.4%)
(10.8%)(12.8%)
(15.4%)(16.5%)
(17.4%)(18.9%)
(20.5%)(24.1%)
(29.4%)(29.7%)
(31.2%)(32.7%)
(44.1%)
HARTE GOLD CORPLUMINA GOLD CORPLIBERTY GOLD CORP
EQUINOX GOLD CORPMARATHON GOLD CORP
LUNDIN GOLD INCTREASURY METALS INCATLANTIC GOLD CORP
FILO MINING CORPOSISKO MINING INC
GOLDQUEST MINING CORPPURE GOLD MINING INC
SABINA GOLD & SILVER CORPSUPERIOR GOLD INC
MIDAS GOLD CORPROXGOLD INC
FALCO RESOURCES LTDNIGHTHAWK GOLD CORP
TROILUS GOLD CORPASANKO GOLD INC
BARKERVILLE GOLD MINES LTDROYAL NICKEL CORP
3-Month Price Change
20.0% 14.4%
12.7% 9.3%
4.9% 4.8%
0.0% (3.0%)
(5.2%)(7.0%)
(8.3%)(14.2%)
(18.1%)(21.7%)
(23.3%)(35.8%)(36.0%)
(40.0%)(45.5%)
(46.4%)(47.0%)
(66.7%)
HARTE GOLD CORPATLANTIC GOLD CORP
LIBERTY GOLD CORPLUMINA GOLD CORP
ASANKO GOLD INCSUPERIOR GOLD INC
MIDAS GOLD CORPLUNDIN GOLD INC
MARATHON GOLD CORPEQUINOX GOLD CORP
PURE GOLD MINING INCROXGOLD INC
FILO MINING CORPSABINA GOLD & SILVER CORP
OSISKO MINING INCGOLDQUEST MINING CORP
TREASURY METALS INCNIGHTHAWK GOLD CORP
TROILUS GOLD CORPBARKERVILLE GOLD MINES LTD
FALCO RESOURCES LTDROYAL NICKEL CORP
6-Month Price Change
22.5% 20.6%
16.9% 11.5%
0.0% (5.2%)
(6.3%)(6.8%)
(12.5%)(13.1%)
(24.8%)(28.6%)
(29.9%)(33.5%)
(43.4%)(47.1%)
(50.0%)(55.8%)(56.3%)
(58.9%)(62.4%)
(63.3%)
SUPERIOR GOLD INCLUMINA GOLD CORP
MIDAS GOLD CORPATLANTIC GOLD CORPEQUINOX GOLD CORP
PURE GOLD MINING INCLIBERTY GOLD CORP
LUNDIN GOLD INCMARATHON GOLD CORP
FILO MINING CORPROXGOLD INC
HARTE GOLD CORPASANKO GOLD INC
TROILUS GOLD CORPSABINA GOLD & SILVER CORP
TREASURY METALS INCROYAL NICKEL CORP
GOLDQUEST MINING CORPOSISKO MINING INC
BARKERVILLE GOLD MINES LTDFALCO RESOURCES LTD
NIGHTHAWK GOLD CORP
1-Year Price Change
The Weekly Dig 8/31/18
Haywood Mining [email protected] Page 16
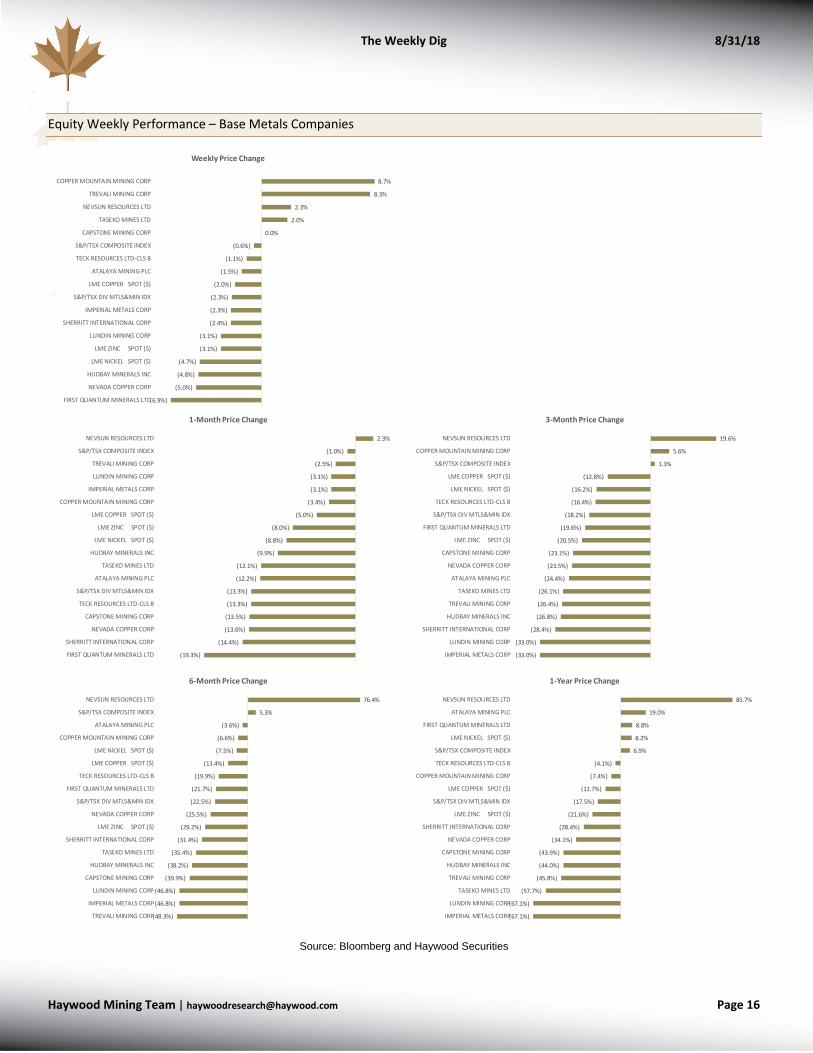
Equity Weekly Performance – Base Metals Companies
Source: Bloomberg and Haywood Securities
.
.
8.7%
8.3%
2.3%
2.0%
0.0%
(0.6%)
(1.1%)
(1.5%)
(2.0%)
(2.3%)
(2.3%)
(2.4%)
(3.1%)
(3.1%)
(4.7%)
(4.8%)
(5.0%)
(6.9%)
COPPER MOUNTAIN MINING CORP
TREVALI MINING CORP
NEVSUN RESOURCES LTD
TASEKO MINES LTD
CAPSTONE MINING CORP
S&P/TSX COMPOSITE INDEX
TECK RESOURCES LTD-CLS B
ATALAYA MINING PLC
LME COPPER SPOT ($)
S&P/TSX DIV MTLS&MIN IDX
IMPERIAL METALS CORP
SHERRITT INTERNATIONAL CORP
LUNDIN MINING CORP
LME ZINC SPOT ($)
LME NICKEL SPOT ($)
HUDBAY MINERALS INC
NEVADA COPPER CORP
FIRST QUANTUM MINERALS LTD
Weekly Price Change
2.3%
(1.0%)
(2.5%)
(3.1%)
(3.1%)
(3.4%)
(5.0%)
(8.0%)
(8.8%)
(9.9%)
(12.1%)
(12.2%)
(13.3%)
(13.3%)
(13.5%)
(13.6%)
(14.4%)
(19.3%)
NEVSUN RESOURCES LTD
S&P/TSX COMPOSITE INDEX
TREVALI MINING CORP
LUNDIN MINING CORP
IMPERIAL METALS CORP
COPPER MOUNTAIN MINING CORP
LME COPPER SPOT ($)
LME ZINC SPOT ($)
LME NICKEL SPOT ($)
HUDBAY MINERALS INC
TASEKO MINES LTD
ATALAYA MINING PLC
S&P/TSX DIV MTLS&MIN IDX
TECK RESOURCES LTD-CLS B
CAPSTONE MINING CORP
NEVADA COPPER CORP
SHERRITT INTERNATIONAL CORP
FIRST QUANTUM MINERALS LTD
1-Month Price Change
19.6%
5.6%
1.3%
(12.8%)
(16.2%)
(16.4%)
(18.2%)
(19.6%)
(20.5%)
(23.1%)
(23.5%)
(24.4%)
(26.1%)
(26.4%)
(26.8%)
(28.4%)
(33.0%)
(33.0%)
NEVSUN RESOURCES LTD
COPPER MOUNTAIN MINING CORP
S&P/TSX COMPOSITE INDEX
LME COPPER SPOT ($)
LME NICKEL SPOT ($)
TECK RESOURCES LTD-CLS B
S&P/TSX DIV MTLS&MIN IDX
FIRST QUANTUM MINERALS LTD
LME ZINC SPOT ($)
CAPSTONE MINING CORP
NEVADA COPPER CORP
ATALAYA MINING PLC
TASEKO MINES LTD
TREVALI MINING CORP
HUDBAY MINERALS INC
SHERRITT INTERNATIONAL CORP
LUNDIN MINING CORP
IMPERIAL METALS CORP
3-Month Price Change
76.4%
5.3%
(3.6%)
(6.6%)
(7.5%)
(13.4%)
(19.9%)
(21.7%)
(22.5%)
(25.5%)
(29.2%)
(31.4%)
(35.4%)
(38.2%)
(39.9%)
(46.8%)
(46.8%)
(48.3%)
NEVSUN RESOURCES LTD
S&P/TSX COMPOSITE INDEX
ATALAYA MINING PLC
COPPER MOUNTAIN MINING CORP
LME NICKEL SPOT ($)
LME COPPER SPOT ($)
TECK RESOURCES LTD-CLS B
FIRST QUANTUM MINERALS LTD
S&P/TSX DIV MTLS&MIN IDX
NEVADA COPPER CORP
LME ZINC SPOT ($)
SHERRITT INTERNATIONAL CORP
TASEKO MINES LTD
HUDBAY MINERALS INC
CAPSTONE MINING CORP
LUNDIN MINING CORP
IMPERIAL METALS CORP
TREVALI MINING CORP
6-Month Price Change
85.7%
19.0%
8.8%
8.2%
6.9%
(4.1%)
(7.4%)
(11.7%)
(17.5%)
(21.6%)
(28.4%)
(34.1%)
(43.9%)
(44.0%)
(45.8%)
(57.7%)
(67.1%)
(67.1%)
NEVSUN RESOURCES LTD
ATALAYA MINING PLC
FIRST QUANTUM MINERALS LTD
LME NICKEL SPOT ($)
S&P/TSX COMPOSITE INDEX
TECK RESOURCES LTD-CLS B
COPPER MOUNTAIN MINING CORP
LME COPPER SPOT ($)
S&P/TSX DIV MTLS&MIN IDX
LME ZINC SPOT ($)
SHERRITT INTERNATIONAL CORP
NEVADA COPPER CORP
CAPSTONE MINING CORP
HUDBAY MINERALS INC
TREVALI MINING CORP
TASEKO MINES LTD
LUNDIN MINING CORP
IMPERIAL METALS CORP
1-Year Price Change
The Weekly Dig 8/31/18
Haywood Mining [email protected] Page 17
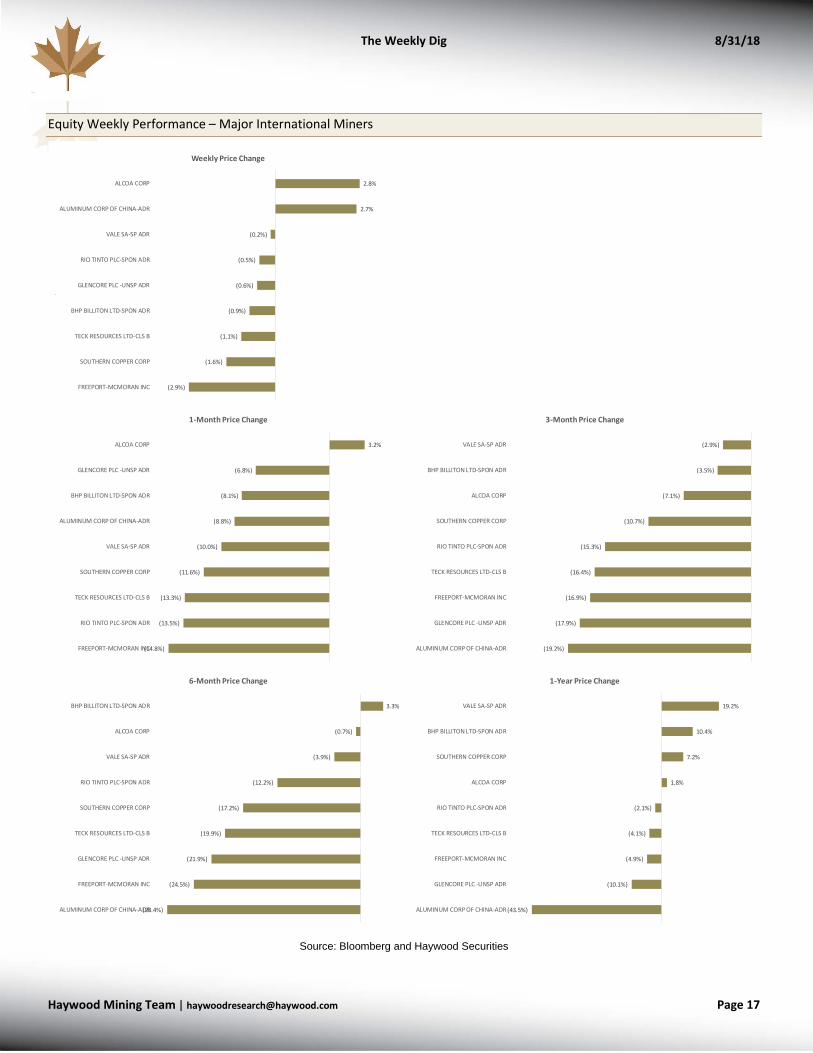
Equity Weekly Performance – Major International Miners
Source: Bloomberg and Haywood Securities
.
.
2.8%
2.7%
(0.2%)
(0.5%)
(0.6%)
(0.9%)
(1.1%)
(1.6%)
(2.9%)
ALCOA CORP
ALUMINUM CORP OF CHINA-ADR
VALE SA-SP ADR
RIO TINTO PLC-SPON ADR
GLENCORE PLC -UNSP ADR
BHP BILLITON LTD-SPON ADR
TECK RESOURCES LTD-CLS B
SOUTHERN COPPER CORP
FREEPORT-MCMORAN INC
Weekly Price Change
3.2%
(6.8%)
(8.1%)
(8.8%)
(10.0%)
(11.6%)
(13.3%)
(13.5%)
(14.8%)
ALCOA CORP
GLENCORE PLC -UNSP ADR
BHP BILLITON LTD-SPON ADR
ALUMINUM CORP OF CHINA-ADR
VALE SA-SP ADR
SOUTHERN COPPER CORP
TECK RESOURCES LTD-CLS B
RIO TINTO PLC-SPON ADR
FREEPORT-MCMORAN INC
1-Month Price Change
(2.9%)
(3.5%)
(7.1%)
(10.7%)
(15.3%)
(16.4%)
(16.9%)
(17.9%)
(19.2%)
VALE SA-SP ADR
BHP BILLITON LTD-SPON ADR
ALCOA CORP
SOUTHERN COPPER CORP
RIO TINTO PLC-SPON ADR
TECK RESOURCES LTD-CLS B
FREEPORT-MCMORAN INC
GLENCORE PLC -UNSP ADR
ALUMINUM CORP OF CHINA-ADR
3-Month Price Change
3.3%
(0.7%)
(3.9%)
(12.2%)
(17.2%)
(19.9%)
(21.9%)
(24.5%)
(28.4%)
BHP BILLITON LTD-SPON ADR
ALCOA CORP
VALE SA-SP ADR
RIO TINTO PLC-SPON ADR
SOUTHERN COPPER CORP
TECK RESOURCES LTD-CLS B
GLENCORE PLC -UNSP ADR
FREEPORT-MCMORAN INC
ALUMINUM CORP OF CHINA-ADR
6-Month Price Change
19.2%
10.4%
7.2%
1.8%
(2.1%)
(4.1%)
(4.9%)
(10.1%)
(43.5%)
VALE SA-SP ADR
BHP BILLITON LTD-SPON ADR
SOUTHERN COPPER CORP
ALCOA CORP
RIO TINTO PLC-SPON ADR
TECK RESOURCES LTD-CLS B
FREEPORT-MCMORAN INC
GLENCORE PLC -UNSP ADR
ALUMINUM CORP OF CHINA-ADR
1-Year Price Change
The Weekly Dig 8/31/18
Haywood Mining [email protected] Page 18
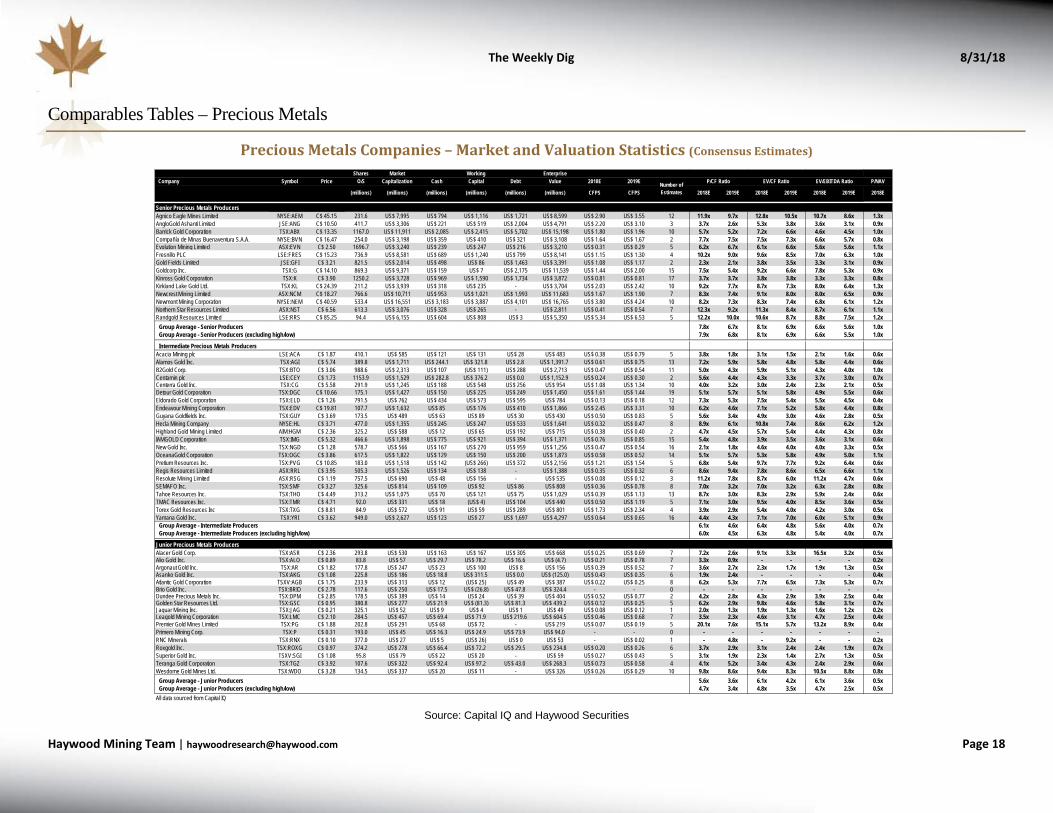
Comparables Tables – Precious Metals
Precious Metals Companies – Market and Valuation Statistics (Consensus Estimates)
Source: Capital IQ and Haywood Securities
Shares Market Working EnterpriseCompany Symbol Price O/S Capitalization Cash Capital Debt Value 2018E 2019E P/NAV
(millions) (millions) (millions) (millions) (millions) (millions) CFPS CFPS 2018E 2019E 2018E 2019E 2018E 2019E 2018E
Senior Precious Metals ProducersAgnico Eagle Mines Limited NYSE:AEM C$ 45.15 231.6 US$ 7,995 US$ 794 US$ 1,116 US$ 1,721 US$ 8,599 US$ 2.90 US$ 3.55 12 11.9x 9.7x 12.8x 10.5x 10.7x 8.6x 1.3xAngloGold Ashanti Limited JSE:ANG C$ 10.50 411.7 US$ 3,306 US$ 221 US$ 519 US$ 2,004 US$ 4,791 US$ 2.20 US$ 3.10 3 3.7x 2.6x 5.3x 3.8x 3.6x 3.1x 0.9xBarrick Gold Corporation TSX:ABX C$ 13.35 1167.0 US$ 11,911 US$ 2,085 US$ 2,415 US$ 5,702 US$ 15,198 US$ 1.80 US$ 1.96 10 5.7x 5.2x 7.2x 6.6x 4.6x 4.5x 1.0xCompañía de Minas Buenaventura S.A.A. NYSE:BVN C$ 16.47 254.0 US$ 3,198 US$ 359 US$ 410 US$ 321 US$ 3,108 US$ 1.64 US$ 1.67 2 7.7x 7.5x 7.5x 7.3x 6.6x 5.7x 0.8xEvolution Mining Limited ASX:EVN C$ 2.50 1696.7 US$ 3,240 US$ 239 US$ 247 US$ 216 US$ 3,210 US$ 0.31 US$ 0.29 5 6.2x 6.7x 6.1x 6.6x 5.6x 5.6x 1.1xFresnillo PLC LSE:FRES C$ 15.23 736.9 US$ 8,581 US$ 689 US$ 1,240 US$ 799 US$ 8,141 US$ 1.15 US$ 1.30 4 10.2x 9.0x 9.6x 8.5x 7.0x 6.3x 1.0xGold Fields Limited JSE:GFI C$ 3.21 821.5 US$ 2,014 US$ 498 US$ 86 US$ 1,463 US$ 3,391 US$ 1.08 US$ 1.17 2 2.3x 2.1x 3.8x 3.5x 3.3x 3.1x 0.9xGoldcorp Inc. TSX:G C$ 14.10 869.3 US$ 9,371 US$ 159 US$ 7 US$ 2,175 US$ 11,539 US$ 1.44 US$ 2.00 15 7.5x 5.4x 9.2x 6.6x 7.8x 5.3x 0.9xKinross Gold Corporation TSX:K C$ 3.90 1250.2 US$ 3,728 US$ 969 US$ 1,590 US$ 1,734 US$ 3,872 US$ 0.81 US$ 0.81 17 3.7x 3.7x 3.8x 3.8x 3.3x 3.3x 0.8xKirkland Lake Gold Ltd. TSX:KL C$ 24.39 211.2 US$ 3,939 US$ 318 US$ 235 - US$ 3,704 US$ 2.03 US$ 2.42 10 9.2x 7.7x 8.7x 7.3x 8.0x 6.4x 1.3xNewcrest Mining Limited ASX:NCM C$ 18.27 766.6 US$ 10,711 US$ 953 US$ 1,021 US$ 1,993 US$ 11,683 US$ 1.67 US$ 1.90 7 8.3x 7.4x 9.1x 8.0x 8.0x 6.5x 0.9xNewmont Mining Corporation NYSE:NEM C$ 40.59 533.4 US$ 16,551 US$ 3,183 US$ 3,887 US$ 4,101 US$ 16,765 US$ 3.80 US$ 4.24 10 8.2x 7.3x 8.3x 7.4x 6.8x 6.1x 1.2xNorthern Star Resources Limited ASX:NST C$ 6.56 613.3 US$ 3,076 US$ 328 US$ 265 - US$ 2,811 US$ 0.41 US$ 0.54 7 12.3x 9.2x 11.3x 8.4x 8.7x 6.1x 1.1xRandgold Resources Limited LSE:RRS C$ 85.25 94.4 US$ 6,155 US$ 604 US$ 808 US$ 3 US$ 5,350 US$ 5.34 US$ 6.53 5 12.2x 10.0x 10.6x 8.7x 8.8x 7.5x 1.2x
Group Average - Senior Producers 7.8x 6.7x 8.1x 6.9x 6.6x 5.6x 1.0xGroup Average - Senior Producers (excluding high/low) 7.9x 6.8x 8.1x 6.9x 6.6x 5.5x 1.0x
Intermediate Precious Metals ProducersAcacia Mining plc LSE:ACA C$ 1.87 410.1 US$ 585 US$ 121 US$ 131 US$ 28 US$ 483 US$ 0.38 US$ 0.79 5 3.8x 1.8x 3.1x 1.5x 2.1x 1.6x 0.6xAlamos Gold Inc. TSX:AGI C$ 5.74 389.8 US$ 1,711 US$ 244.1 US$ 321.8 US$ 2.8 US$ 1,391.7 US$ 0.61 US$ 0.75 13 7.2x 5.9x 5.8x 4.8x 5.8x 4.4x 0.6xB2Gold Corp. TSX:BTO C$ 3.06 988.6 US$ 2,313 US$ 107 (US$ 111) US$ 288 US$ 2,713 US$ 0.47 US$ 0.54 11 5.0x 4.3x 5.9x 5.1x 4.3x 4.0x 1.0xCentamin plc LSE:CEY C$ 1.73 1153.9 US$ 1,529 US$ 282.8 US$ 376.2 US$ 0.0 US$ 1,152.9 US$ 0.24 US$ 0.30 2 5.6x 4.4x 4.3x 3.3x 3.7x 3.0x 0.7xCenterra Gold Inc. TSX:CG C$ 5.58 291.9 US$ 1,245 US$ 188 US$ 548 US$ 256 US$ 954 US$ 1.08 US$ 1.34 10 4.0x 3.2x 3.0x 2.4x 2.3x 2.1x 0.5xDetour Gold Corporation TSX:DGC C$ 10.66 175.1 US$ 1,427 US$ 150 US$ 225 US$ 249 US$ 1,450 US$ 1.61 US$ 1.44 19 5.1x 5.7x 5.1x 5.8x 4.9x 5.5x 0.6xEldorado Gold Corporation TSX:ELD C$ 1.26 791.5 US$ 762 US$ 434 US$ 573 US$ 595 US$ 784 US$ 0.13 US$ 0.18 12 7.3x 5.3x 7.5x 5.4x 5.5x 4.5x 0.4xEndeavour Mining Corporation TSX:EDV C$ 19.81 107.7 US$ 1,632 US$ 85 US$ 176 US$ 410 US$ 1,866 US$ 2.45 US$ 3.31 10 6.2x 4.6x 7.1x 5.2x 5.8x 4.4x 0.8xGuyana Goldfields Inc. TSX:GUY C$ 3.69 173.5 US$ 489 US$ 63 US$ 89 US$ 30 US$ 430 US$ 0.50 US$ 0.83 5 5.6x 3.4x 4.9x 3.0x 4.6x 2.8x 0.5xHecla Mining Company NYSE:HL C$ 3.71 477.0 US$ 1,355 US$ 245 US$ 247 US$ 533 US$ 1,641 US$ 0.32 US$ 0.47 8 8.9x 6.1x 10.8x 7.4x 8.6x 6.2x 1.2xHighland Gold Mining Limited AIM:HGM C$ 2.36 325.2 US$ 588 US$ 12 US$ 65 US$ 192 US$ 715 US$ 0.38 US$ 0.40 2 4.7x 4.5x 5.7x 5.4x 4.4x 4.3x 0.8xIAMGOLD Corporation TSX:IMG C$ 5.32 466.6 US$ 1,898 US$ 775 US$ 921 US$ 394 US$ 1,371 US$ 0.76 US$ 0.85 15 5.4x 4.8x 3.9x 3.5x 3.6x 3.1x 0.6xNew Gold Inc. TSX:NGD C$ 1.28 578.7 US$ 566 US$ 167 US$ 270 US$ 959 US$ 1,256 US$ 0.47 US$ 0.54 16 2.1x 1.8x 4.6x 4.0x 4.0x 3.3x 0.5xOceanaGold Corporation TSX:OGC C$ 3.86 617.5 US$ 1,822 US$ 129 US$ 150 US$ 200 US$ 1,873 US$ 0.58 US$ 0.52 14 5.1x 5.7x 5.3x 5.8x 4.9x 5.0x 1.1xPretium Resources Inc. TSX:PVG C$ 10.85 183.0 US$ 1,518 US$ 142 (US$ 266) US$ 372 US$ 2,156 US$ 1.21 US$ 1.54 5 6.8x 5.4x 9.7x 7.7x 9.2x 6.4x 0.6xRegis Resources Limited ASX:RRL C$ 3.95 505.3 US$ 1,526 US$ 134 US$ 138 - US$ 1,388 US$ 0.35 US$ 0.32 6 8.6x 9.4x 7.8x 8.6x 6.5x 6.6x 1.1xResolute Mining Limited ASX:RSG C$ 1.19 757.5 US$ 690 US$ 48 US$ 156 - US$ 535 US$ 0.08 US$ 0.12 3 11.2x 7.8x 8.7x 6.0x 11.2x 4.7x 0.6xSEMAFO Inc. TSX:SMF C$ 3.27 325.6 US$ 814 US$ 109 US$ 92 US$ 86 US$ 808 US$ 0.36 US$ 0.78 8 7.0x 3.2x 7.0x 3.2x 6.3x 2.8x 0.8xTahoe Resources Inc. TSX:THO C$ 4.49 313.2 US$ 1,075 US$ 70 US$ 121 US$ 75 US$ 1,029 US$ 0.39 US$ 1.13 13 8.7x 3.0x 8.3x 2.9x 5.9x 2.4x 0.6xTMAC Resources Inc. TSX:TMR C$ 4.71 92.0 US$ 331 US$ 18 (US$ 4) US$ 104 US$ 440 US$ 0.50 US$ 1.19 5 7.1x 3.0x 9.5x 4.0x 8.5x 3.6x 0.5xTorex Gold Resources Inc TSX:TXG C$ 8.81 84.9 US$ 572 US$ 91 US$ 59 US$ 289 US$ 801 US$ 1.73 US$ 2.34 4 3.9x 2.9x 5.4x 4.0x 4.2x 3.0x 0.5xYamana Gold Inc. TSX:YRI C$ 3.62 949.0 US$ 2,627 US$ 123 US$ 27 US$ 1,697 US$ 4,297 US$ 0.64 US$ 0.65 16 4.4x 4.3x 7.1x 7.0x 6.0x 5.1x 0.9x
Group Average - Intermediate Producers 6.1x 4.6x 6.4x 4.8x 5.6x 4.0x 0.7xGroup Average - Intermediate Producers (excluding high/low) 6.0x 4.5x 6.3x 4.8x 5.4x 4.0x 0.7x
Junior Precious Metals ProducersAlacer Gold Corp. TSX:ASR C$ 2.36 293.8 US$ 530 US$ 163 US$ 167 US$ 305 US$ 668 US$ 0.25 US$ 0.69 7 7.2x 2.6x 9.1x 3.3x 16.5x 3.2x 0.5xAlio Gold Inc. TSX:ALO C$ 0.89 83.8 US$ 57 US$ 29.7 US$ 78.2 US$ 16.6 US$ (4.7) US$ 0.21 US$ 0.78 7 3.3x 0.9x - - - - 0.2xArgonaut Gold Inc. TSX:AR C$ 1.82 177.8 US$ 247 US$ 23 US$ 100 US$ 8 US$ 156 US$ 0.39 US$ 0.52 7 3.6x 2.7x 2.3x 1.7x 1.9x 1.3x 0.5xAsanko Gold Inc. TSX:AKG C$ 1.08 225.8 US$ 186 US$ 18.8 US$ 311.5 US$ 0.0 US$ (125.0) US$ 0.43 US$ 0.35 6 1.9x 2.4x - - - - 0.4xAtlantic Gold Corporation TSXV:AGB C$ 1.75 233.9 US$ 313 US$ 12 (US$ 25) US$ 49 US$ 387 US$ 0.22 US$ 0.25 8 6.2x 5.3x 7.7x 6.5x 7.3x 5.3x 0.7xBrio Gold Inc. TSX:BRIO C$ 2.78 117.6 US$ 250 US$ 17.5 US$ (26.8) US$ 47.8 US$ 324.4 - - 0 - - - - - - -Dundee Precious Metals Inc. TSX:DPM C$ 2.85 178.5 US$ 389 US$ 14 US$ 24 US$ 39 US$ 404 US$ 0.52 US$ 0.77 2 4.2x 2.8x 4.3x 2.9x 3.9x 2.5x 0.4xGolden Star Resources Ltd. TSX:GSC C$ 0.95 380.8 US$ 277 US$ 21.9 US$ (81.3) US$ 81.3 US$ 439.2 US$ 0.12 US$ 0.25 5 6.2x 2.9x 9.8x 4.6x 5.8x 3.1x 0.7xJaguar Mining Inc. TSX:JAG C$ 0.21 325.1 US$ 52 US$ 9 US$ 4 US$ 1 US$ 49 US$ 0.08 US$ 0.12 1 2.0x 1.3x 1.9x 1.3x 1.6x 1.2x 0.2xLeagold Mining Corporation TSX:LMC C$ 2.10 284.5 US$ 457 US$ 69.4 US$ 71.9 US$ 219.6 US$ 604.5 US$ 0.46 US$ 0.68 7 3.5x 2.3x 4.6x 3.1x 4.7x 2.5x 0.4xPremier Gold Mines Limited TSX:PG C$ 1.88 202.8 US$ 291 US$ 68 US$ 72 - US$ 219 US$ 0.07 US$ 0.19 5 20.1x 7.6x 15.1x 5.7x 13.2x 8.9x 0.4xPrimero Mining Corp. TSX:P C$ 0.31 193.0 US$ 45 US$ 16.3 US$ 24.9 US$ 73.9 US$ 94.0 - - 0 - - - - - - -RNC Minerals TSX:RNX C$ 0.10 377.0 US$ 27 US$ 5 (US$ 26) US$ 0 US$ 53 - US$ 0.02 1 - 4.8x - 9.2x - - 0.2xRoxgold Inc. TSX:ROXG C$ 0.97 374.2 US$ 278 US$ 66.4 US$ 72.2 US$ 29.5 US$ 234.8 US$ 0.20 US$ 0.26 6 3.7x 2.9x 3.1x 2.4x 2.4x 1.9x 0.7xSuperior Gold Inc. TSXV:SGI C$ 1.08 95.8 US$ 79 US$ 22 US$ 20 - US$ 59 US$ 0.27 US$ 0.43 5 3.1x 1.9x 2.3x 1.4x 2.7x 1.3x 0.5xTeranga Gold Corporation TSX:TGZ C$ 3.92 107.6 US$ 322 US$ 92.4 US$ 97.2 US$ 43.0 US$ 268.3 US$ 0.73 US$ 0.58 4 4.1x 5.2x 3.4x 4.3x 2.4x 2.9x 0.6xWesdome Gold Mines Ltd. TSX:WDO C$ 3.28 134.5 US$ 337 US$ 20 US$ 11 - US$ 326 US$ 0.26 US$ 0.29 10 9.8x 8.6x 9.4x 8.3x 10.5x 8.8x 0.8x
Group Average - Junior Producers 5.6x 3.6x 6.1x 4.2x 6.1x 3.6x 0.5xGroup Average - Junior Producers (excluding high/low) 4.7x 3.4x 4.8x 3.5x 4.7x 2.5x 0.5x
All data sourced from Capital IQ
Number of Estimates
P/CF Ratio EV/CF Ratio EV/EBITDA Ratio
The Weekly Dig 8/31/18
Haywood Mining [email protected] Page 19
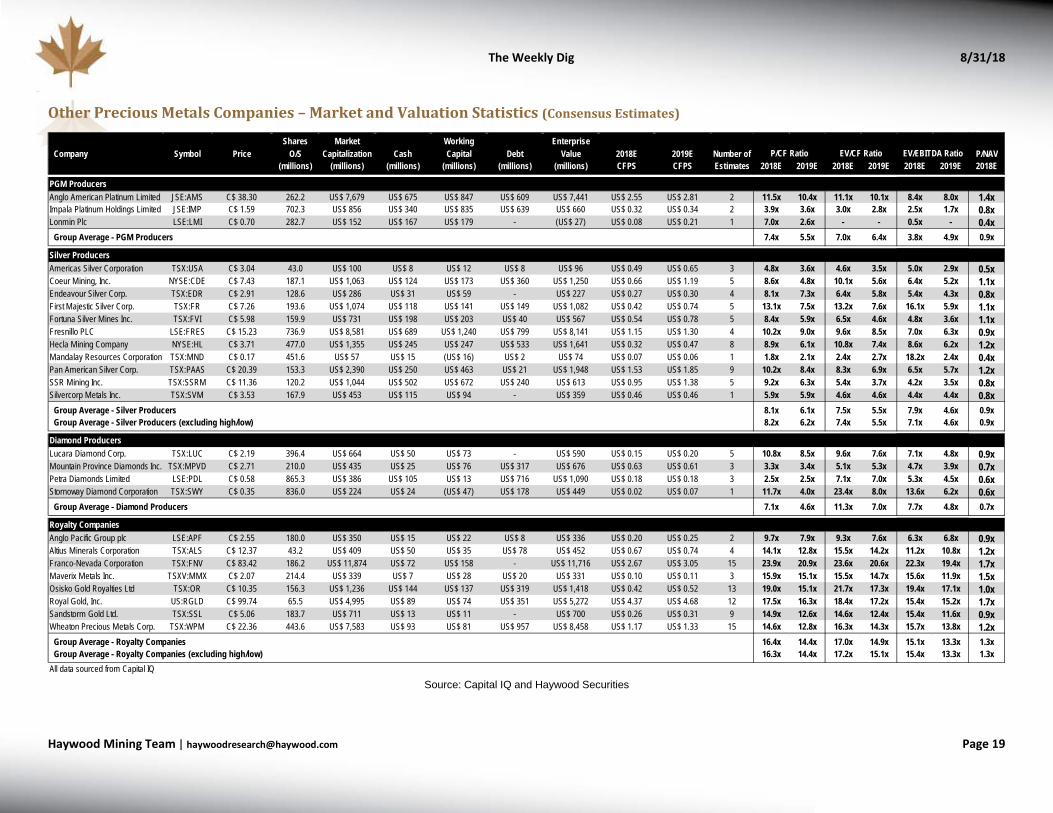
Other Precious Metals Companies – Market and Valuation Statistics (Consensus Estimates)
Source: Capital IQ and Haywood Securities
Shares Market Working EnterpriseCompany Symbol Price O/S Capitalization Cash Capital Debt Value 2018E 2019E Number of P/NAV
(millions) (millions) (millions) (millions) (millions) (millions) CFPS CFPS Estimates 2018E 2019E 2018E 2019E 2018E 2019E 2018E
PGM ProducersAnglo American Platinum Limited JSE:AMS C$ 38.30 262.2 US$ 7,679 US$ 675 US$ 847 US$ 609 US$ 7,441 US$ 2.55 US$ 2.81 2 11.5x 10.4x 11.1x 10.1x 8.4x 8.0x 1.4xImpala Platinum Holdings Limited JSE:IMP C$ 1.59 702.3 US$ 856 US$ 340 US$ 835 US$ 639 US$ 660 US$ 0.32 US$ 0.34 2 3.9x 3.6x 3.0x 2.8x 2.5x 1.7x 0.8xLonmin Plc LSE:LMI C$ 0.70 282.7 US$ 152 US$ 167 US$ 179 - (US$ 27) US$ 0.08 US$ 0.21 1 7.0x 2.6x - - 0.5x - 0.4x
Group Average - PGM Producers 7.4x 5.5x 7.0x 6.4x 3.8x 4.9x 0.9x
Silver ProducersAmericas Silver Corporation TSX:USA C$ 3.04 43.0 US$ 100 US$ 8 US$ 12 US$ 8 US$ 96 US$ 0.49 US$ 0.65 3 4.8x 3.6x 4.6x 3.5x 5.0x 2.9x 0.5xCoeur Mining, Inc. NYSE:CDE C$ 7.43 187.1 US$ 1,063 US$ 124 US$ 173 US$ 360 US$ 1,250 US$ 0.66 US$ 1.19 5 8.6x 4.8x 10.1x 5.6x 6.4x 5.2x 1.1xEndeavour Silver Corp. TSX:EDR C$ 2.91 128.6 US$ 286 US$ 31 US$ 59 - US$ 227 US$ 0.27 US$ 0.30 4 8.1x 7.3x 6.4x 5.8x 5.4x 4.3x 0.8xFirst Majestic Silver Corp. TSX:FR C$ 7.26 193.6 US$ 1,074 US$ 118 US$ 141 US$ 149 US$ 1,082 US$ 0.42 US$ 0.74 5 13.1x 7.5x 13.2x 7.6x 16.1x 5.9x 1.1xFortuna Silver Mines Inc. TSX:FVI C$ 5.98 159.9 US$ 731 US$ 198 US$ 203 US$ 40 US$ 567 US$ 0.54 US$ 0.78 5 8.4x 5.9x 6.5x 4.6x 4.8x 3.6x 1.1xFresnillo PLC LSE:FRES C$ 15.23 736.9 US$ 8,581 US$ 689 US$ 1,240 US$ 799 US$ 8,141 US$ 1.15 US$ 1.30 4 10.2x 9.0x 9.6x 8.5x 7.0x 6.3x 0.9xHecla Mining Company NYSE:HL C$ 3.71 477.0 US$ 1,355 US$ 245 US$ 247 US$ 533 US$ 1,641 US$ 0.32 US$ 0.47 8 8.9x 6.1x 10.8x 7.4x 8.6x 6.2x 1.2xMandalay Resources Corporation TSX:MND C$ 0.17 451.6 US$ 57 US$ 15 (US$ 16) US$ 2 US$ 74 US$ 0.07 US$ 0.06 1 1.8x 2.1x 2.4x 2.7x 18.2x 2.4x 0.4xPan American Silver Corp. TSX:PAAS C$ 20.39 153.3 US$ 2,390 US$ 250 US$ 463 US$ 21 US$ 1,948 US$ 1.53 US$ 1.85 9 10.2x 8.4x 8.3x 6.9x 6.5x 5.7x 1.2xSSR Mining Inc. TSX:SSRM C$ 11.36 120.2 US$ 1,044 US$ 502 US$ 672 US$ 240 US$ 613 US$ 0.95 US$ 1.38 5 9.2x 6.3x 5.4x 3.7x 4.2x 3.5x 0.8xSilvercorp Metals Inc. TSX:SVM C$ 3.53 167.9 US$ 453 US$ 115 US$ 94 - US$ 359 US$ 0.46 US$ 0.46 1 5.9x 5.9x 4.6x 4.6x 4.4x 4.4x 0.8x
Group Average - Silver Producers 8.1x 6.1x 7.5x 5.5x 7.9x 4.6x 0.9xGroup Average - Silver Producers (excluding high/low) 8.2x 6.2x 7.4x 5.5x 7.1x 4.6x 0.9x
Diamond ProducersLucara Diamond Corp. TSX:LUC C$ 2.19 396.4 US$ 664 US$ 50 US$ 73 - US$ 590 US$ 0.15 US$ 0.20 5 10.8x 8.5x 9.6x 7.6x 7.1x 4.8x 0.9xMountain Province Diamonds Inc. TSX:MPVD C$ 2.71 210.0 US$ 435 US$ 25 US$ 76 US$ 317 US$ 676 US$ 0.63 US$ 0.61 3 3.3x 3.4x 5.1x 5.3x 4.7x 3.9x 0.7xPetra Diamonds Limited LSE:PDL C$ 0.58 865.3 US$ 386 US$ 105 US$ 13 US$ 716 US$ 1,090 US$ 0.18 US$ 0.18 3 2.5x 2.5x 7.1x 7.0x 5.3x 4.5x 0.6xStornoway Diamond Corporation TSX:SWY C$ 0.35 836.0 US$ 224 US$ 24 (US$ 47) US$ 178 US$ 449 US$ 0.02 US$ 0.07 1 11.7x 4.0x 23.4x 8.0x 13.6x 6.2x 0.6x
Group Average - Diamond Producers 7.1x 4.6x 11.3x 7.0x 7.7x 4.8x 0.7x
Royalty CompaniesAnglo Pacific Group plc LSE:APF C$ 2.55 180.0 US$ 350 US$ 15 US$ 22 US$ 8 US$ 336 US$ 0.20 US$ 0.25 2 9.7x 7.9x 9.3x 7.6x 6.3x 6.8x 0.9xAltius Minerals Corporation TSX:ALS C$ 12.37 43.2 US$ 409 US$ 50 US$ 35 US$ 78 US$ 452 US$ 0.67 US$ 0.74 4 14.1x 12.8x 15.5x 14.2x 11.2x 10.8x 1.2xFranco-Nevada Corporation TSX:FNV C$ 83.42 186.2 US$ 11,874 US$ 72 US$ 158 - US$ 11,716 US$ 2.67 US$ 3.05 15 23.9x 20.9x 23.6x 20.6x 22.3x 19.4x 1.7xMaverix Metals Inc. TSXV:MMX C$ 2.07 214.4 US$ 339 US$ 7 US$ 28 US$ 20 US$ 331 US$ 0.10 US$ 0.11 3 15.9x 15.1x 15.5x 14.7x 15.6x 11.9x 1.5xOsisko Gold Royalties Ltd TSX:OR C$ 10.35 156.3 US$ 1,236 US$ 144 US$ 137 US$ 319 US$ 1,418 US$ 0.42 US$ 0.52 13 19.0x 15.1x 21.7x 17.3x 19.4x 17.1x 1.0xRoyal Gold, Inc. US:RGLD C$ 99.74 65.5 US$ 4,995 US$ 89 US$ 74 US$ 351 US$ 5,272 US$ 4.37 US$ 4.68 12 17.5x 16.3x 18.4x 17.2x 15.4x 15.2x 1.7xSandstorm Gold Ltd. TSX:SSL C$ 5.06 183.7 US$ 711 US$ 13 US$ 11 - US$ 700 US$ 0.26 US$ 0.31 9 14.9x 12.6x 14.6x 12.4x 15.4x 11.6x 0.9xWheaton Precious Metals Corp. TSX:WPM C$ 22.36 443.6 US$ 7,583 US$ 93 US$ 81 US$ 957 US$ 8,458 US$ 1.17 US$ 1.33 15 14.6x 12.8x 16.3x 14.3x 15.7x 13.8x 1.2x
Group Average - Royalty Companies 16.4x 14.4x 17.0x 14.9x 15.1x 13.3x 1.3xGroup Average - Royalty Companies (excluding high/low) 16.3x 14.4x 17.2x 15.1x 15.4x 13.3x 1.3x
All data sourced from Capital IQ
P/CF Ratio EV/CF Ratio EV/EBITDA Ratio
The Weekly Dig 8/31/18
Haywood Mining [email protected] Page 20
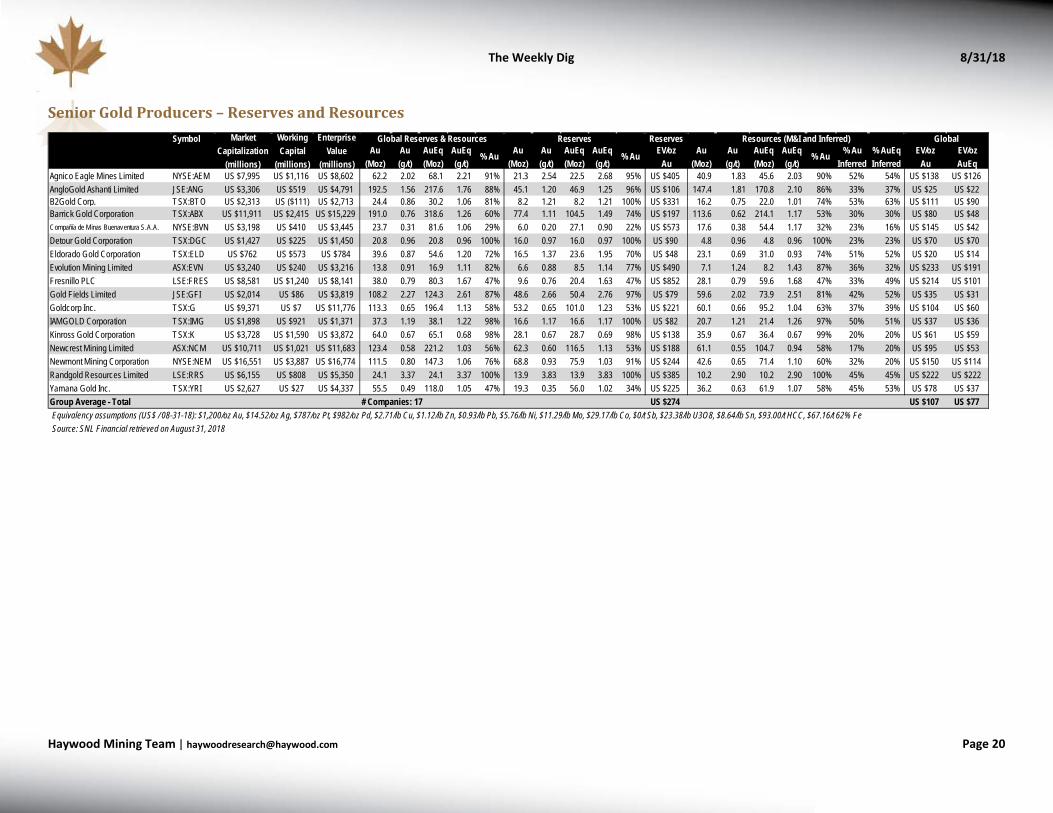
Senior Gold Producers – Reserves and Resources
Symbol Reserves
Agnico Eagle Mines Limited NYSE:AEM US $7,995 US $1,116 US $8,602 62.2 2.02 68.1 2.21 91% 21.3 2.54 22.5 2.68 95% US $405 40.9 1.83 45.6 2.03 90% 52% 54% US $138 US $126AngloGold Ashanti Limited JSE:ANG US $3,306 US $519 US $4,791 192.5 1.56 217.6 1.76 88% 45.1 1.20 46.9 1.25 96% US $106 147.4 1.81 170.8 2.10 86% 33% 37% US $25 US $22B2Gold Corp. TSX:BTO US $2,313 US ($111) US $2,713 24.4 0.86 30.2 1.06 81% 8.2 1.21 8.2 1.21 100% US $331 16.2 0.75 22.0 1.01 74% 53% 63% US $111 US $90Barrick Gold Corporation TSX:ABX US $11,911 US $2,415 US $15,229 191.0 0.76 318.6 1.26 60% 77.4 1.11 104.5 1.49 74% US $197 113.6 0.62 214.1 1.17 53% 30% 30% US $80 US $48Compañía de Minas Buenaventura S.A.A. NYSE:BVN US $3,198 US $410 US $3,445 23.7 0.31 81.6 1.06 29% 6.0 0.20 27.1 0.90 22% US $573 17.6 0.38 54.4 1.17 32% 23% 16% US $145 US $42Detour Gold Corporation TSX:DGC US $1,427 US $225 US $1,450 20.8 0.96 20.8 0.96 100% 16.0 0.97 16.0 0.97 100% US $90 4.8 0.96 4.8 0.96 100% 23% 23% US $70 US $70Eldorado Gold Corporation TSX:ELD US $762 US $573 US $784 39.6 0.87 54.6 1.20 72% 16.5 1.37 23.6 1.95 70% US $48 23.1 0.69 31.0 0.93 74% 51% 52% US $20 US $14Evolution Mining Limited ASX:EVN US $3,240 US $240 US $3,216 13.8 0.91 16.9 1.11 82% 6.6 0.88 8.5 1.14 77% US $490 7.1 1.24 8.2 1.43 87% 36% 32% US $233 US $191Fresnillo PLC LSE:FRES US $8,581 US $1,240 US $8,141 38.0 0.79 80.3 1.67 47% 9.6 0.76 20.4 1.63 47% US $852 28.1 0.79 59.6 1.68 47% 33% 49% US $214 US $101Gold Fields Limited JSE:GFI US $2,014 US $86 US $3,819 108.2 2.27 124.3 2.61 87% 48.6 2.66 50.4 2.76 97% US $79 59.6 2.02 73.9 2.51 81% 42% 52% US $35 US $31Goldcorp Inc. TSX:G US $9,371 US $7 US $11,776 113.3 0.65 196.4 1.13 58% 53.2 0.65 101.0 1.23 53% US $221 60.1 0.66 95.2 1.04 63% 37% 39% US $104 US $60IAMGOLD Corporation TSX:IMG US $1,898 US $921 US $1,371 37.3 1.19 38.1 1.22 98% 16.6 1.17 16.6 1.17 100% US $82 20.7 1.21 21.4 1.26 97% 50% 51% US $37 US $36Kinross Gold Corporation TSX:K US $3,728 US $1,590 US $3,872 64.0 0.67 65.1 0.68 98% 28.1 0.67 28.7 0.69 98% US $138 35.9 0.67 36.4 0.67 99% 20% 20% US $61 US $59Newcrest Mining Limited ASX:NCM US $10,711 US $1,021 US $11,683 123.4 0.58 221.2 1.03 56% 62.3 0.60 116.5 1.13 53% US $188 61.1 0.55 104.7 0.94 58% 17% 20% US $95 US $53Newmont Mining Corporation NYSE:NEM US $16,551 US $3,887 US $16,774 111.5 0.80 147.3 1.06 76% 68.8 0.93 75.9 1.03 91% US $244 42.6 0.65 71.4 1.10 60% 32% 20% US $150 US $114Randgold Resources Limited LSE:RRS US $6,155 US $808 US $5,350 24.1 3.37 24.1 3.37 100% 13.9 3.83 13.9 3.83 100% US $385 10.2 2.90 10.2 2.90 100% 45% 45% US $222 US $222Yamana Gold Inc. TSX:YRI US $2,627 US $27 US $4,337 55.5 0.49 118.0 1.05 47% 19.3 0.35 56.0 1.02 34% US $225 36.2 0.63 61.9 1.07 58% 45% 53% US $78 US $37Group Average - Total # Companies: 17 US $274 US $107 US $77Equivalency assumptions (US$ / 08-31-18): $1,200/oz Au, $14.52/oz Ag, $787/oz Pt, $982/oz Pd, $2.71/lb Cu, $1.12/lb Zn, $0.93/lb Pb, $5.76/lb Ni, $11.29/lb Mo, $29.17/lb Co, $0/t Sb, $23.38/lb U3O8, $8.64/lb Sn, $93.00/t HCC, $67.16/t 62% FeSource: SNL Financial retrieved on August 31, 2018
EV/ozAu
Resources (M&I and Inferred) GlobalAu
(Moz)Au(g/t)
AuEq(Moz)
AuEq(g/t)
% Au % AuInferred
% AuEqInferred
EV/ozAu
EV/ozAuEq
ReservesAu
(Moz)Au(g/t)
AuEq(Moz)
AuEq(g/t)
% Au
MarketCapitalization
(millions)
WorkingCapital
(millions)
EnterpriseValue
(millions)
Global Reserves & ResourcesAu
(Moz)Au(g/t)
AuEq(Moz)
AuEq(g/t)
% Au
The Weekly Dig 8/31/18
Haywood Mining [email protected] Page 21
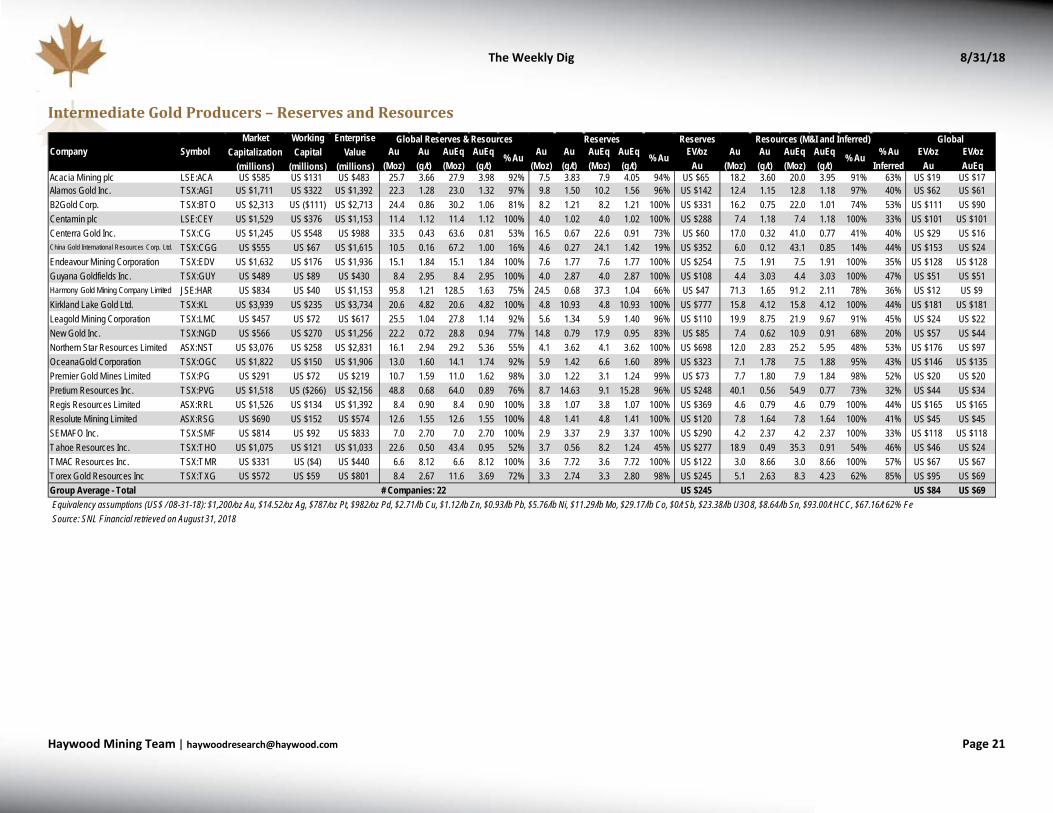
Intermediate Gold Producers – Reserves and Resources
Reserves
Acacia Mining plc LSE:ACA US $585 US $131 US $483 25.7 3.66 27.9 3.98 92% 7.5 3.83 7.9 4.05 94% US $65 18.2 3.60 20.0 3.95 91% 63% US $19 US $17Alamos Gold Inc. TSX:AGI US $1,711 US $322 US $1,392 22.3 1.28 23.0 1.32 97% 9.8 1.50 10.2 1.56 96% US $142 12.4 1.15 12.8 1.18 97% 40% US $62 US $61B2Gold Corp. TSX:BTO US $2,313 US ($111) US $2,713 24.4 0.86 30.2 1.06 81% 8.2 1.21 8.2 1.21 100% US $331 16.2 0.75 22.0 1.01 74% 53% US $111 US $90Centamin plc LSE:CEY US $1,529 US $376 US $1,153 11.4 1.12 11.4 1.12 100% 4.0 1.02 4.0 1.02 100% US $288 7.4 1.18 7.4 1.18 100% 33% US $101 US $101Centerra Gold Inc. TSX:CG US $1,245 US $548 US $988 33.5 0.43 63.6 0.81 53% 16.5 0.67 22.6 0.91 73% US $60 17.0 0.32 41.0 0.77 41% 40% US $29 US $16China Gold International Resources Corp. Ltd. TSX:CGG US $555 US $67 US $1,615 10.5 0.16 67.2 1.00 16% 4.6 0.27 24.1 1.42 19% US $352 6.0 0.12 43.1 0.85 14% 44% US $153 US $24Endeavour Mining Corporation TSX:EDV US $1,632 US $176 US $1,936 15.1 1.84 15.1 1.84 100% 7.6 1.77 7.6 1.77 100% US $254 7.5 1.91 7.5 1.91 100% 35% US $128 US $128Guyana Goldfields Inc. TSX:GUY US $489 US $89 US $430 8.4 2.95 8.4 2.95 100% 4.0 2.87 4.0 2.87 100% US $108 4.4 3.03 4.4 3.03 100% 47% US $51 US $51Harmony Gold Mining Company Limited JSE:HAR US $834 US $40 US $1,153 95.8 1.21 128.5 1.63 75% 24.5 0.68 37.3 1.04 66% US $47 71.3 1.65 91.2 2.11 78% 36% US $12 US $9Kirkland Lake Gold Ltd. TSX:KL US $3,939 US $235 US $3,734 20.6 4.82 20.6 4.82 100% 4.8 10.93 4.8 10.93 100% US $777 15.8 4.12 15.8 4.12 100% 44% US $181 US $181Leagold Mining Corporation TSX:LMC US $457 US $72 US $617 25.5 1.04 27.8 1.14 92% 5.6 1.34 5.9 1.40 96% US $110 19.9 8.75 21.9 9.67 91% 45% US $24 US $22New Gold Inc. TSX:NGD US $566 US $270 US $1,256 22.2 0.72 28.8 0.94 77% 14.8 0.79 17.9 0.95 83% US $85 7.4 0.62 10.9 0.91 68% 20% US $57 US $44Northern Star Resources Limited ASX:NST US $3,076 US $258 US $2,831 16.1 2.94 29.2 5.36 55% 4.1 3.62 4.1 3.62 100% US $698 12.0 2.83 25.2 5.95 48% 53% US $176 US $97OceanaGold Corporation TSX:OGC US $1,822 US $150 US $1,906 13.0 1.60 14.1 1.74 92% 5.9 1.42 6.6 1.60 89% US $323 7.1 1.78 7.5 1.88 95% 43% US $146 US $135Premier Gold Mines Limited TSX:PG US $291 US $72 US $219 10.7 1.59 11.0 1.62 98% 3.0 1.22 3.1 1.24 99% US $73 7.7 1.80 7.9 1.84 98% 52% US $20 US $20Pretium Resources Inc. TSX:PVG US $1,518 US ($266) US $2,156 48.8 0.68 64.0 0.89 76% 8.7 14.63 9.1 15.28 96% US $248 40.1 0.56 54.9 0.77 73% 32% US $44 US $34Regis Resources Limited ASX:RRL US $1,526 US $134 US $1,392 8.4 0.90 8.4 0.90 100% 3.8 1.07 3.8 1.07 100% US $369 4.6 0.79 4.6 0.79 100% 44% US $165 US $165Resolute Mining Limited ASX:RSG US $690 US $152 US $574 12.6 1.55 12.6 1.55 100% 4.8 1.41 4.8 1.41 100% US $120 7.8 1.64 7.8 1.64 100% 41% US $45 US $45SEMAFO Inc. TSX:SMF US $814 US $92 US $833 7.0 2.70 7.0 2.70 100% 2.9 3.37 2.9 3.37 100% US $290 4.2 2.37 4.2 2.37 100% 33% US $118 US $118Tahoe Resources Inc. TSX:THO US $1,075 US $121 US $1,033 22.6 0.50 43.4 0.95 52% 3.7 0.56 8.2 1.24 45% US $277 18.9 0.49 35.3 0.91 54% 46% US $46 US $24TMAC Resources Inc. TSX:TMR US $331 US ($4) US $440 6.6 8.12 6.6 8.12 100% 3.6 7.72 3.6 7.72 100% US $122 3.0 8.66 3.0 8.66 100% 57% US $67 US $67Torex Gold Resources Inc TSX:TXG US $572 US $59 US $801 8.4 2.67 11.6 3.69 72% 3.3 2.74 3.3 2.80 98% US $245 5.1 2.63 8.3 4.23 62% 85% US $95 US $69Group Average - Total # Companies: 22 US $245 US $84 US $69Equivalency assumptions (US$ / 08-31-18): $1,200/oz Au, $14.52/oz Ag, $787/oz Pt, $982/oz Pd, $2.71/lb Cu, $1.12/lb Zn, $0.93/lb Pb, $5.76/lb Ni, $11.29/lb Mo, $29.17/lb Co, $0/t Sb, $23.38/lb U3O8, $8.64/lb Sn, $93.00/t HCC, $67.16/t 62% FeSource: SNL Financial retrieved on August 31, 2018
EnterpriseValue
(millions)Company Symbol
MarketCapitalization
(millions)
WorkingCapital
(millions)
Global Reserves & Resources Reserves Resources (M&I and Inferred)Au
(Moz)Au(g/t)
AuEq(Moz)
AuEq(g/t)
% Au
GlobalEV/oz
Au% Au Au
(Moz)Au(g/t)
AuEq(Moz)
AuEq(g/t)
EV/ozAu
EV/ozAuEq
Au(Moz)
Au(g/t)
AuEq(Moz)
AuEq(g/t)
% Au % AuInferred
The Weekly Dig 8/31/18
Haywood Mining [email protected] Page 22
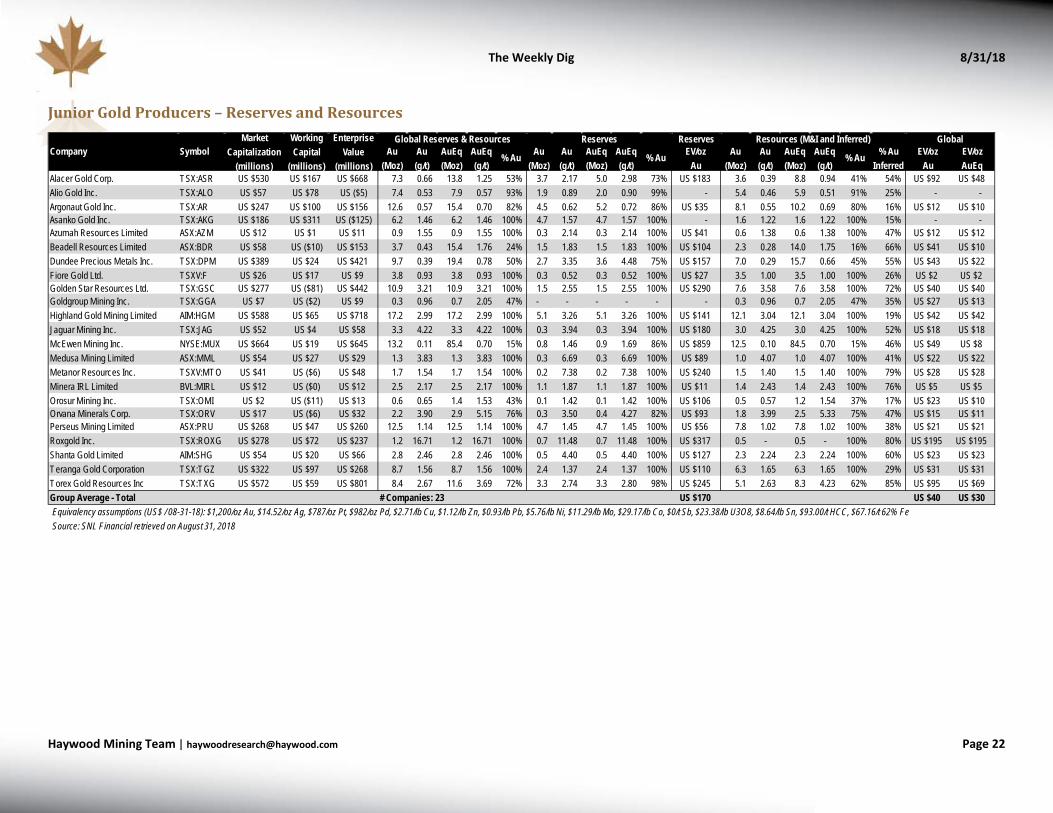
Junior Gold Producers – Reserves and Resources
Reserves
Alacer Gold Corp. TSX:ASR US $530 US $167 US $668 7.3 0.66 13.8 1.25 53% 3.7 2.17 5.0 2.98 73% US $183 3.6 0.39 8.8 0.94 41% 54% US $92 US $48Alio Gold Inc. TSX:ALO US $57 US $78 US ($5) 7.4 0.53 7.9 0.57 93% 1.9 0.89 2.0 0.90 99% - 5.4 0.46 5.9 0.51 91% 25% - - Argonaut Gold Inc. TSX:AR US $247 US $100 US $156 12.6 0.57 15.4 0.70 82% 4.5 0.62 5.2 0.72 86% US $35 8.1 0.55 10.2 0.69 80% 16% US $12 US $10Asanko Gold Inc. TSX:AKG US $186 US $311 US ($125) 6.2 1.46 6.2 1.46 100% 4.7 1.57 4.7 1.57 100% - 1.6 1.22 1.6 1.22 100% 15% - - Azumah Resources Limited ASX:AZM US $12 US $1 US $11 0.9 1.55 0.9 1.55 100% 0.3 2.14 0.3 2.14 100% US $41 0.6 1.38 0.6 1.38 100% 47% US $12 US $12Beadell Resources Limited ASX:BDR US $58 US ($10) US $153 3.7 0.43 15.4 1.76 24% 1.5 1.83 1.5 1.83 100% US $104 2.3 0.28 14.0 1.75 16% 66% US $41 US $10Dundee Precious Metals Inc. TSX:DPM US $389 US $24 US $421 9.7 0.39 19.4 0.78 50% 2.7 3.35 3.6 4.48 75% US $157 7.0 0.29 15.7 0.66 45% 55% US $43 US $22Fiore Gold Ltd. TSXV:F US $26 US $17 US $9 3.8 0.93 3.8 0.93 100% 0.3 0.52 0.3 0.52 100% US $27 3.5 1.00 3.5 1.00 100% 26% US $2 US $2Golden Star Resources Ltd. TSX:GSC US $277 US ($81) US $442 10.9 3.21 10.9 3.21 100% 1.5 2.55 1.5 2.55 100% US $290 7.6 3.58 7.6 3.58 100% 72% US $40 US $40Goldgroup Mining Inc. TSX:GGA US $7 US ($2) US $9 0.3 0.96 0.7 2.05 47% - - - - - - 0.3 0.96 0.7 2.05 47% 35% US $27 US $13Highland Gold Mining Limited AIM:HGM US $588 US $65 US $718 17.2 2.99 17.2 2.99 100% 5.1 3.26 5.1 3.26 100% US $141 12.1 3.04 12.1 3.04 100% 19% US $42 US $42Jaguar Mining Inc. TSX:JAG US $52 US $4 US $58 3.3 4.22 3.3 4.22 100% 0.3 3.94 0.3 3.94 100% US $180 3.0 4.25 3.0 4.25 100% 52% US $18 US $18McEwen Mining Inc. NYSE:MUX US $664 US $19 US $645 13.2 0.11 85.4 0.70 15% 0.8 1.46 0.9 1.69 86% US $859 12.5 0.10 84.5 0.70 15% 46% US $49 US $8Medusa Mining Limited ASX:MML US $54 US $27 US $29 1.3 3.83 1.3 3.83 100% 0.3 6.69 0.3 6.69 100% US $89 1.0 4.07 1.0 4.07 100% 41% US $22 US $22Metanor Resources Inc. TSXV:MTO US $41 US ($6) US $48 1.7 1.54 1.7 1.54 100% 0.2 7.38 0.2 7.38 100% US $240 1.5 1.40 1.5 1.40 100% 79% US $28 US $28Minera IRL Limited BVL:MIRL US $12 US ($0) US $12 2.5 2.17 2.5 2.17 100% 1.1 1.87 1.1 1.87 100% US $11 1.4 2.43 1.4 2.43 100% 76% US $5 US $5Orosur Mining Inc. TSX:OMI US $2 US ($11) US $13 0.6 0.65 1.4 1.53 43% 0.1 1.42 0.1 1.42 100% US $106 0.5 0.57 1.2 1.54 37% 17% US $23 US $10Orvana Minerals Corp. TSX:ORV US $17 US ($6) US $32 2.2 3.90 2.9 5.15 76% 0.3 3.50 0.4 4.27 82% US $93 1.8 3.99 2.5 5.33 75% 47% US $15 US $11Perseus Mining Limited ASX:PRU US $268 US $47 US $260 12.5 1.14 12.5 1.14 100% 4.7 1.45 4.7 1.45 100% US $56 7.8 1.02 7.8 1.02 100% 38% US $21 US $21Roxgold Inc. TSX:ROXG US $278 US $72 US $237 1.2 16.71 1.2 16.71 100% 0.7 11.48 0.7 11.48 100% US $317 0.5 - 0.5 - 100% 80% US $195 US $195Shanta Gold Limited AIM:SHG US $54 US $20 US $66 2.8 2.46 2.8 2.46 100% 0.5 4.40 0.5 4.40 100% US $127 2.3 2.24 2.3 2.24 100% 60% US $23 US $23Teranga Gold Corporation TSX:TGZ US $322 US $97 US $268 8.7 1.56 8.7 1.56 100% 2.4 1.37 2.4 1.37 100% US $110 6.3 1.65 6.3 1.65 100% 29% US $31 US $31Torex Gold Resources Inc TSX:TXG US $572 US $59 US $801 8.4 2.67 11.6 3.69 72% 3.3 2.74 3.3 2.80 98% US $245 5.1 2.63 8.3 4.23 62% 85% US $95 US $69Group Average - Total # Companies: 23 US $170 US $40 US $30Equivalency assumptions (US$ / 08-31-18): $1,200/oz Au, $14.52/oz Ag, $787/oz Pt, $982/oz Pd, $2.71/lb Cu, $1.12/lb Zn, $0.93/lb Pb, $5.76/lb Ni, $11.29/lb Mo, $29.17/lb Co, $0/t Sb, $23.38/lb U3O8, $8.64/lb Sn, $93.00/t HCC, $67.16/t 62% FeSource: SNL Financial retrieved on August 31, 2018
EnterpriseValue
(millions)Company Symbol
MarketCapitalization
(millions)
WorkingCapital
(millions)
Global Reserves & Resources Reserves Resources (M&I and Inferred)Au
(Moz)Au(g/t)
AuEq(Moz)
AuEq(g/t)
% Au
Global
% Au Au(Moz)
Au(g/t)
AuEq(Moz)
AuEq(g/t)
EV/ozAu
EV/ozAuEq
Au(Moz)
Au(g/t)
AuEq(Moz)
AuEq(g/t)
% Au % AuInferred
EV/ozAu
The Weekly Dig 8/31/18
Haywood Mining [email protected] Page 23
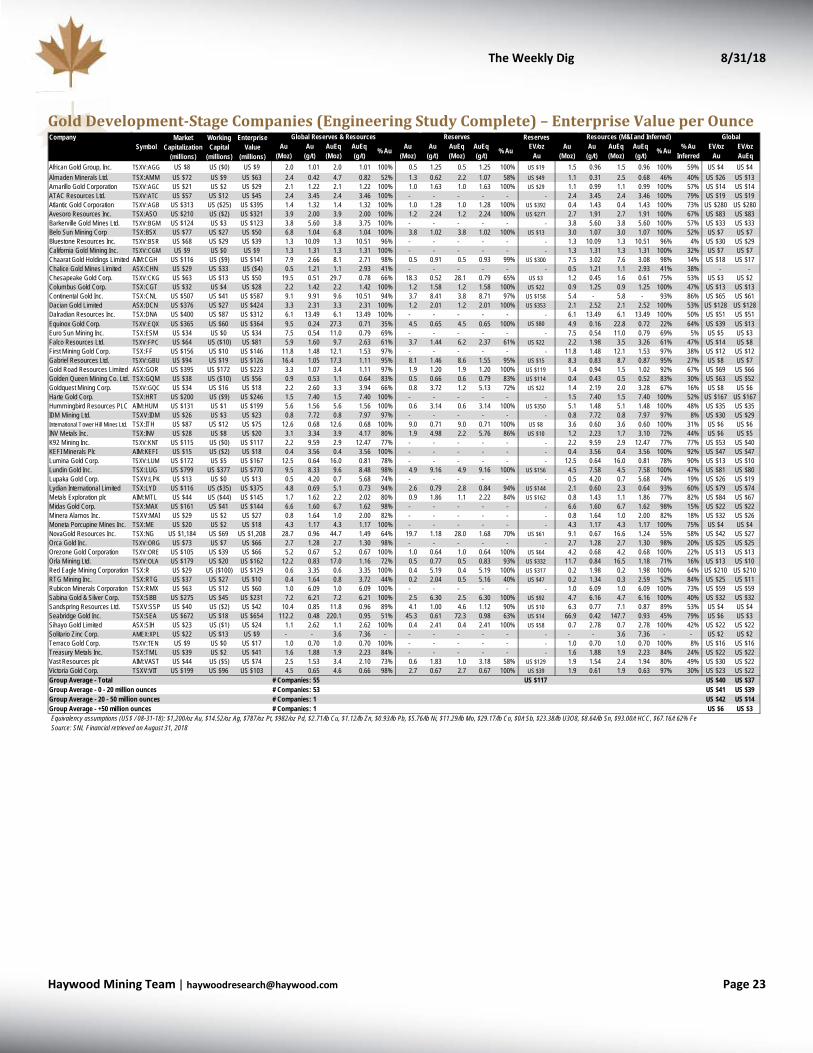
Gold Development-Stage Companies (Engineering Study Complete) – Enterprise Value per Ounce
Company Reserves
African Gold Group, Inc. TSXV:AGG US $8 US ($0) US $9 2.0 1.01 2.0 1.01 100% 0.5 1.25 0.5 1.25 100% US $19 1.5 0.96 1.5 0.96 100% 59% US $4 US $4Almaden Minerals Ltd. TSX:AMM US $72 US $9 US $63 2.4 0.42 4.7 0.82 52% 1.3 0.62 2.2 1.07 58% US $49 1.1 0.31 2.5 0.68 46% 40% US $26 US $13Amarillo Gold Corporation TSXV:AGC US $21 US $2 US $29 2.1 1.22 2.1 1.22 100% 1.0 1.63 1.0 1.63 100% US $29 1.1 0.99 1.1 0.99 100% 57% US $14 US $14ATAC Resources Ltd. TSXV:ATC US $57 US $12 US $45 2.4 3.45 2.4 3.46 100% - - - - - - 2.4 3.45 2.4 3.46 100% 79% US $19 US $19Atlantic Gold Corporation TSXV:AGB US $313 US ($25) US $395 1.4 1.32 1.4 1.32 100% 1.0 1.28 1.0 1.28 100% US $392 0.4 1.43 0.4 1.43 100% 73% US $280 US $280Avesoro Resources Inc. TSX:ASO US $210 US ($2) US $321 3.9 2.00 3.9 2.00 100% 1.2 2.24 1.2 2.24 100% US $271 2.7 1.91 2.7 1.91 100% 67% US $83 US $83Barkerville Gold Mines Ltd. TSXV:BGM US $124 US $3 US $123 3.8 5.60 3.8 3.75 100% - - - - - - 3.8 5.60 3.8 5.60 100% 57% US $33 US $33Belo Sun Mining Corp TSX:BSX US $77 US $27 US $50 6.8 1.04 6.8 1.04 100% 3.8 1.02 3.8 1.02 100% US $13 3.0 1.07 3.0 1.07 100% 52% US $7 US $7Bluestone Resources Inc. TSXV:BSR US $68 US $29 US $39 1.3 10.09 1.3 10.51 96% - - - - - - 1.3 10.09 1.3 10.51 96% 4% US $30 US $29California Gold Mining Inc. TSXV:CGM US $9 US $0 US $9 1.3 1.31 1.3 1.31 100% - - - - - - 1.3 1.31 1.3 1.31 100% 32% US $7 US $7Chaarat Gold Holdings Limited AIM:CGH US $116 US ($9) US $141 7.9 2.66 8.1 2.71 98% 0.5 0.91 0.5 0.93 99% US $300 7.5 3.02 7.6 3.08 98% 14% US $18 US $17Chalice Gold Mines Limited ASX:CHN US $29 US $33 US ($4) 0.5 1.21 1.1 2.93 41% - - - - - - 0.5 1.21 1.1 2.93 41% 38% - - Chesapeake Gold Corp. TSXV:CKG US $63 US $13 US $50 19.5 0.51 29.7 0.78 66% 18.3 0.52 28.1 0.79 65% US $3 1.2 0.45 1.6 0.61 75% 53% US $3 US $2Columbus Gold Corp. TSX:CGT US $32 US $4 US $28 2.2 1.42 2.2 1.42 100% 1.2 1.58 1.2 1.58 100% US $22 0.9 1.25 0.9 1.25 100% 47% US $13 US $13Continental Gold Inc. TSX:CNL US $507 US $41 US $587 9.1 9.91 9.6 10.51 94% 3.7 8.41 3.8 8.71 97% US $158 5.4 - 5.8 - 93% 86% US $65 US $61Dacian Gold Limited ASX:DCN US $376 US $27 US $424 3.3 2.31 3.3 2.31 100% 1.2 2.01 1.2 2.01 100% US $353 2.1 2.52 2.1 2.52 100% 53% US $128 US $128Dalradian Resources Inc. TSX:DNA US $400 US $87 US $312 6.1 13.49 6.1 13.49 100% - - - - - - 6.1 13.49 6.1 13.49 100% 50% US $51 US $51Equinox Gold Corp. TSXV:EQX US $365 US $60 US $364 9.5 0.24 27.3 0.71 35% 4.5 0.65 4.5 0.65 100% US $80 4.9 0.16 22.8 0.72 22% 64% US $39 US $13Euro Sun Mining Inc. TSX:ESM US $34 US $0 US $34 7.5 0.54 11.0 0.79 69% - - - - - - 7.5 0.54 11.0 0.79 69% 5% US $5 US $3Falco Resources Ltd. TSXV:FPC US $64 US ($10) US $81 5.9 1.60 9.7 2.63 61% 3.7 1.44 6.2 2.37 61% US $22 2.2 1.98 3.5 3.26 61% 47% US $14 US $8First Mining Gold Corp. TSX:FF US $156 US $10 US $146 11.8 1.48 12.1 1.53 97% - - - - - - 11.8 1.48 12.1 1.53 97% 38% US $12 US $12Gabriel Resources Ltd. TSXV:GBU US $94 US $19 US $126 16.4 1.05 17.3 1.11 95% 8.1 1.46 8.6 1.55 95% US $15 8.3 0.83 8.7 0.87 95% 27% US $8 US $7Gold Road Resources Limited ASX:GOR US $395 US $172 US $223 3.3 1.07 3.4 1.11 97% 1.9 1.20 1.9 1.20 100% US $119 1.4 0.94 1.5 1.02 92% 67% US $69 US $66Golden Queen Mining Co. Ltd. TSX:GQM US $38 US ($10) US $56 0.9 0.53 1.1 0.64 83% 0.5 0.66 0.6 0.79 83% US $114 0.4 0.43 0.5 0.52 83% 30% US $63 US $52Goldquest Mining Corp. TSXV:GQC US $34 US $16 US $18 2.2 2.60 3.3 3.94 66% 0.8 3.72 1.2 5.13 72% US $22 1.4 2.19 2.0 3.28 67% 16% US $8 US $6Harte Gold Corp. TSX:HRT US $200 US ($9) US $246 1.5 7.40 1.5 7.40 100% - - - - - - 1.5 7.40 1.5 7.40 100% 52% US $167 US $167Hummingbird Resources PLC AIM:HUM US $131 US $1 US $199 5.6 1.56 5.6 1.56 100% 0.6 3.14 0.6 3.14 100% US $350 5.1 1.48 5.1 1.48 100% 48% US $35 US $35IDM Mining Ltd. TSXV:IDM US $26 US $3 US $23 0.8 7.72 0.8 7.97 97% - - - - - - 0.8 7.72 0.8 7.97 97% 8% US $30 US $29International Tower Hill Mines Ltd. TSX:ITH US $87 US $12 US $75 12.6 0.68 12.6 0.68 100% 9.0 0.71 9.0 0.71 100% US $8 3.6 0.60 3.6 0.60 100% 31% US $6 US $6INV Metals Inc. TSX:INV US $28 US $8 US $20 3.1 3.34 3.9 4.17 80% 1.9 4.98 2.2 5.76 86% US $10 1.2 2.23 1.7 3.10 72% 44% US $6 US $5K92 Mining Inc. TSXV:KNT US $115 US ($0) US $117 2.2 9.59 2.9 12.47 77% - - - - - - 2.2 9.59 2.9 12.47 77% 77% US $53 US $40KEFI Minerals Plc AIM:KEFI US $15 US ($2) US $18 0.4 3.56 0.4 3.56 100% - - - - - - 0.4 3.56 0.4 3.56 100% 92% US $47 US $47Lumina Gold Corp. TSXV:LUM US $172 US $5 US $167 12.5 0.64 16.0 0.81 78% - - - - - - 12.5 0.64 16.0 0.81 78% 90% US $13 US $10Lundin Gold Inc. TSX:LUG US $799 US $377 US $770 9.5 8.33 9.6 8.48 98% 4.9 9.16 4.9 9.16 100% US $156 4.5 7.58 4.5 7.58 100% 47% US $81 US $80Lupaka Gold Corp. TSXV:LPK US $13 US $0 US $13 0.5 4.20 0.7 5.68 74% - - - - - - 0.5 4.20 0.7 5.68 74% 19% US $26 US $19Lydian International Limited TSX:LYD US $116 US ($35) US $375 4.8 0.69 5.1 0.73 94% 2.6 0.79 2.8 0.84 94% US $144 2.1 0.60 2.3 0.64 93% 60% US $79 US $74Metals Exploration plc AIM:MTL US $44 US ($44) US $145 1.7 1.62 2.2 2.02 80% 0.9 1.86 1.1 2.22 84% US $162 0.8 1.43 1.1 1.86 77% 82% US $84 US $67Midas Gold Corp. TSX:MAX US $161 US $41 US $144 6.6 1.60 6.7 1.62 98% - - - - - - 6.6 1.60 6.7 1.62 98% 15% US $22 US $22Minera Alamos Inc. TSXV:MAI US $29 US $2 US $27 0.8 1.64 1.0 2.00 82% - - - - - - 0.8 1.64 1.0 2.00 82% 18% US $32 US $26Moneta Porcupine Mines Inc. TSX:ME US $20 US $2 US $18 4.3 1.17 4.3 1.17 100% - - - - - - 4.3 1.17 4.3 1.17 100% 75% US $4 US $4NovaGold Resources Inc. TSX:NG US $1,184 US $69 US $1,208 28.7 0.96 44.7 1.49 64% 19.7 1.18 28.0 1.68 70% US $61 9.1 0.67 16.6 1.24 55% 58% US $42 US $27Orca Gold Inc. TSXV:ORG US $73 US $7 US $66 2.7 1.28 2.7 1.30 98% - - - - - - 2.7 1.28 2.7 1.30 98% 20% US $25 US $25Orezone Gold Corporation TSXV:ORE US $105 US $39 US $66 5.2 0.67 5.2 0.67 100% 1.0 0.64 1.0 0.64 100% US $64 4.2 0.68 4.2 0.68 100% 22% US $13 US $13Orla Mining Ltd. TSXV:OLA US $179 US $20 US $162 12.2 0.83 17.0 1.16 72% 0.5 0.77 0.5 0.83 93% US $332 11.7 0.84 16.5 1.18 71% 16% US $13 US $10Red Eagle Mining Corporation TSX:R US $29 US ($100) US $129 0.6 3.35 0.6 3.35 100% 0.4 5.19 0.4 5.19 100% US $317 0.2 1.98 0.2 1.98 100% 64% US $210 US $210RTG Mining Inc. TSX:RTG US $37 US $27 US $10 0.4 1.64 0.8 3.72 44% 0.2 2.04 0.5 5.16 40% US $47 0.2 1.34 0.3 2.59 52% 84% US $25 US $11Rubicon Minerals Corporation TSX:RMX US $63 US $12 US $60 1.0 6.09 1.0 6.09 100% - - - - - - 1.0 6.09 1.0 6.09 100% 73% US $59 US $59Sabina Gold & Silver Corp. TSX:SBB US $275 US $45 US $231 7.2 6.21 7.2 6.21 100% 2.5 6.30 2.5 6.30 100% US $92 4.7 6.16 4.7 6.16 100% 40% US $32 US $32Sandspring Resources Ltd. TSXV:SSP US $40 US ($2) US $42 10.4 0.85 11.8 0.96 89% 4.1 1.00 4.6 1.12 90% US $10 6.3 0.77 7.1 0.87 89% 53% US $4 US $4Seabridge Gold Inc. TSX:SEA US $672 US $18 US $654 112.2 0.48 220.1 0.95 51% 45.3 0.61 72.3 0.98 63% US $14 66.9 0.42 147.7 0.93 45% 79% US $6 US $3Sihayo Gold Limited ASX:SIH US $23 US ($1) US $24 1.1 2.62 1.1 2.62 100% 0.4 2.41 0.4 2.41 100% US $58 0.7 2.78 0.7 2.78 100% 42% US $22 US $22Solitario Zinc Corp. AMEX:XPL US $22 US $13 US $9 - - 3.6 7.36 - - - - - - - - - 3.6 7.36 - - US $2 US $2Terraco Gold Corp. TSXV:TEN US $9 US $0 US $17 1.0 0.70 1.0 0.70 100% - - - - - - 1.0 0.70 1.0 0.70 100% 8% US $16 US $16Treasury Metals Inc. TSX:TML US $39 US $2 US $41 1.6 1.88 1.9 2.23 84% - - - - - - 1.6 1.88 1.9 2.23 84% 24% US $22 US $22Vast Resources plc AIM:VAST US $44 US ($5) US $74 2.5 1.53 3.4 2.10 73% 0.6 1.83 1.0 3.18 58% US $129 1.9 1.54 2.4 1.94 80% 49% US $30 US $22Victoria Gold Corp. TSXV:VIT US $199 US $96 US $103 4.5 0.65 4.6 0.66 98% 2.7 0.67 2.7 0.67 100% US $39 1.9 0.61 1.9 0.63 97% 30% US $23 US $22Group Average - Total # Companies: 55 US $117 US $40 US $37Group Average - 0 - 20 million ounces # Companies: 53 US $41 US $39Group Average - 20 - 50 million ounces # Companies: 1 US $42 US $14Group Average - +50 million ounces # Companies: 1 US $6 US $3Equivalency assumptions (US$ / 08-31-18): $1,200/oz Au, $14.52/oz Ag, $787/oz Pt, $982/oz Pd, $2.71/lb Cu, $1.12/lb Zn, $0.93/lb Pb, $5.76/lb Ni, $11.29/lb Mo, $29.17/lb Co, $0/t Sb, $23.38/lb U3O8, $8.64/lb Sn, $93.00/t HCC, $67.16/t 62% FeSource: SNL Financial retrieved on August 31, 2018
SymbolMarket
Capitalization(millions)
WorkingCapital
(millions)
EnterpriseValue
(millions)
Global Reserves & ResourcesAu
(Moz)Au
(g/t)AuEq(Moz)
AuEq(g/t) % Au
GlobalEV/oz
AuEV/ozAuEq
Resources (M&I and Inferred)Au
(Moz)Au
(g/t)AuEq(Moz) % AuAuEq
(g/t)% Au
InferredEV/oz
Au
ReservesAu
(Moz)Au
(g/t)AuEq(Moz) % AuAuEq
(g/t)
The Weekly Dig 8/31/18
Haywood Mining [email protected] Page 24
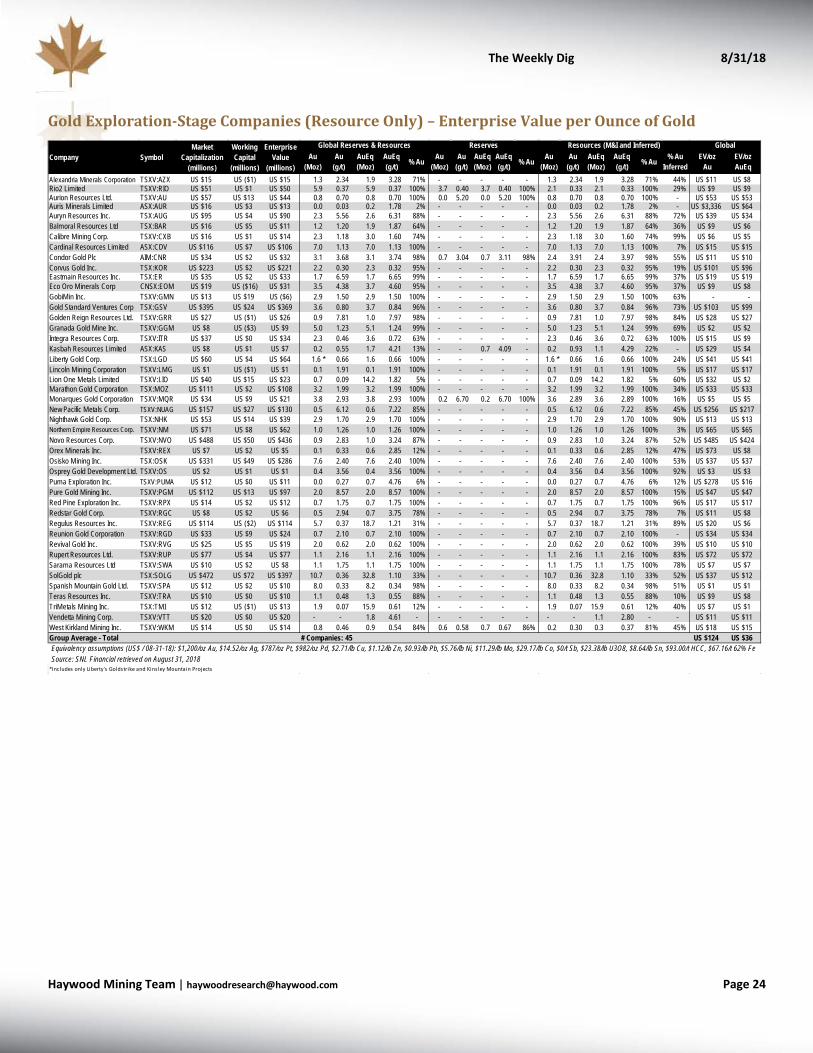
Gold Exploration-Stage Companies (Resource Only) – Enterprise Value per Ounce of Gold
Alexandria Minerals Corporation TSXV:AZX US $15 US ($1) US $15 1.3 2.34 1.9 3.28 71% - - - - - 1.3 2.34 1.9 3.28 71% 44% US $11 US $8Rio2 Limited TSXV:RIO US $51 US $1 US $50 5.9 0.37 5.9 0.37 100% 3.7 0.40 3.7 0.40 100% 2.1 0.33 2.1 0.33 100% 29% US $9 US $9Aurion Resources Ltd. TSXV:AU US $57 US $13 US $44 0.8 0.70 0.8 0.70 100% 0.0 5.20 0.0 5.20 100% 0.8 0.70 0.8 0.70 100% - US $53 US $53Auris Minerals Limited ASX:AUR US $16 US $3 US $13 0.0 0.03 0.2 1.78 2% - - - - - 0.0 0.03 0.2 1.78 2% - US $3,336 US $64Auryn Resources Inc. TSX:AUG US $95 US $4 US $90 2.3 5.56 2.6 6.31 88% - - - - - 2.3 5.56 2.6 6.31 88% 72% US $39 US $34Balmoral Resources Ltd TSX:BAR US $16 US $5 US $11 1.2 1.20 1.9 1.87 64% - - - - - 1.2 1.20 1.9 1.87 64% 36% US $9 US $6Calibre Mining Corp. TSXV:CXB US $16 US $1 US $14 2.3 1.18 3.0 1.60 74% - - - - - 2.3 1.18 3.0 1.60 74% 99% US $6 US $5Cardinal Resources Limited ASX:CDV US $116 US $7 US $106 7.0 1.13 7.0 1.13 100% - - - - - 7.0 1.13 7.0 1.13 100% 7% US $15 US $15Condor Gold Plc AIM:CNR US $34 US $2 US $32 3.1 3.68 3.1 3.74 98% 0.7 3.04 0.7 3.11 98% 2.4 3.91 2.4 3.97 98% 55% US $11 US $10Corvus Gold Inc. TSX:KOR US $223 US $2 US $221 2.2 0.30 2.3 0.32 95% - - - - - 2.2 0.30 2.3 0.32 95% 19% US $101 US $96Eastmain Resources Inc. TSX:ER US $35 US $2 US $33 1.7 6.59 1.7 6.65 99% - - - - - 1.7 6.59 1.7 6.65 99% 37% US $19 US $19Eco Oro Minerals Corp CNSX:EOM US $19 US ($16) US $31 3.5 4.38 3.7 4.60 95% - - - - - 3.5 4.38 3.7 4.60 95% 37% US $9 US $8GobiMin Inc. TSXV:GMN US $13 US $19 US ($6) 2.9 1.50 2.9 1.50 100% - - - - - 2.9 1.50 2.9 1.50 100% 63% - - Gold Standard Ventures Corp TSX:GSV US $395 US $24 US $369 3.6 0.80 3.7 0.84 96% - - - - - 3.6 0.80 3.7 0.84 96% 73% US $103 US $99Golden Reign Resources Ltd. TSXV:GRR US $27 US ($1) US $26 0.9 7.81 1.0 7.97 98% - - - - - 0.9 7.81 1.0 7.97 98% 84% US $28 US $27Granada Gold Mine Inc. TSXV:GGM US $8 US ($3) US $9 5.0 1.23 5.1 1.24 99% - - - - - 5.0 1.23 5.1 1.24 99% 69% US $2 US $2Integra Resources Corp. TSXV:ITR US $37 US $0 US $34 2.3 0.46 3.6 0.72 63% - - - - - 2.3 0.46 3.6 0.72 63% 100% US $15 US $9Kasbah Resources Limited ASX:KAS US $8 US $1 US $7 0.2 0.55 1.7 4.21 13% - - 0.7 4.09 - 0.2 0.93 1.1 4.29 22% - US $29 US $4Liberty Gold Corp. TSX:LGD US $60 US $4 US $64 1.6 * 0.66 1.6 0.66 100% - - - - - 1.6 * 0.66 1.6 0.66 100% 24% US $41 US $41Lincoln Mining Corporation TSXV:LMG US $1 US ($1) US $1 0.1 1.91 0.1 1.91 100% - - - - - 0.1 1.91 0.1 1.91 100% 5% US $17 US $17Lion One Metals Limited TSXV:LIO US $40 US $15 US $23 0.7 0.09 14.2 1.82 5% - - - - - 0.7 0.09 14.2 1.82 5% 60% US $32 US $2Marathon Gold Corporation TSX:MOZ US $111 US $2 US $108 3.2 1.99 3.2 1.99 100% - - - - - 3.2 1.99 3.2 1.99 100% 34% US $33 US $33Monarques Gold Corporation TSXV:MQR US $34 US $9 US $21 3.8 2.93 3.8 2.93 100% 0.2 6.70 0.2 6.70 100% 3.6 2.89 3.6 2.89 100% 16% US $5 US $5New Pacific Metals Corp. TSXV:NUAG US $157 US $27 US $130 0.5 6.12 0.6 7.22 85% - - - - - 0.5 6.12 0.6 7.22 85% 45% US $256 US $217Nighthawk Gold Corp. TSX:NHK US $53 US $14 US $39 2.9 1.70 2.9 1.70 100% - - - - - 2.9 1.70 2.9 1.70 100% 90% US $13 US $13Northern Empire Resources Corp. TSXV:NM US $71 US $8 US $62 1.0 1.26 1.0 1.26 100% - - - - - 1.0 1.26 1.0 1.26 100% 3% US $65 US $65Novo Resources Corp. TSXV:NVO US $488 US $50 US $436 0.9 2.83 1.0 3.24 87% - - - - - 0.9 2.83 1.0 3.24 87% 52% US $485 US $424Orex Minerals Inc. TSXV:REX US $7 US $2 US $5 0.1 0.33 0.6 2.85 12% - - - - - 0.1 0.33 0.6 2.85 12% 47% US $73 US $8Osisko Mining Inc. TSX:OSK US $331 US $49 US $286 7.6 2.40 7.6 2.40 100% - - - - - 7.6 2.40 7.6 2.40 100% 53% US $37 US $37Osprey Gold Development Ltd. TSXV:OS US $2 US $1 US $1 0.4 3.56 0.4 3.56 100% - - - - - 0.4 3.56 0.4 3.56 100% 92% US $3 US $3Puma Exploration Inc. TSXV:PUMA US $12 US $0 US $11 0.0 0.27 0.7 4.76 6% - - - - - 0.0 0.27 0.7 4.76 6% 12% US $278 US $16Pure Gold Mining Inc. TSXV:PGM US $112 US $13 US $97 2.0 8.57 2.0 8.57 100% - - - - - 2.0 8.57 2.0 8.57 100% 15% US $47 US $47Red Pine Exploration Inc. TSXV:RPX US $14 US $2 US $12 0.7 1.75 0.7 1.75 100% - - - - - 0.7 1.75 0.7 1.75 100% 96% US $17 US $17Redstar Gold Corp. TSXV:RGC US $8 US $2 US $6 0.5 2.94 0.7 3.75 78% - - - - - 0.5 2.94 0.7 3.75 78% 7% US $11 US $8Regulus Resources Inc. TSXV:REG US $114 US ($2) US $114 5.7 0.37 18.7 1.21 31% - - - - - 5.7 0.37 18.7 1.21 31% 89% US $20 US $6Reunion Gold Corporation TSXV:RGD US $33 US $9 US $24 0.7 2.10 0.7 2.10 100% - - - - - 0.7 2.10 0.7 2.10 100% - US $34 US $34Revival Gold Inc. TSXV:RVG US $25 US $5 US $19 2.0 0.62 2.0 0.62 100% - - - - - 2.0 0.62 2.0 0.62 100% 39% US $10 US $10Rupert Resources Ltd. TSXV:RUP US $77 US $4 US $77 1.1 2.16 1.1 2.16 100% - - - - - 1.1 2.16 1.1 2.16 100% 83% US $72 US $72Sarama Resources Ltd TSXV:SWA US $10 US $2 US $8 1.1 1.75 1.1 1.75 100% - - - - - 1.1 1.75 1.1 1.75 100% 78% US $7 US $7SolGold plc TSX:SOLG US $472 US $72 US $397 10.7 0.36 32.8 1.10 33% - - - - - 10.7 0.36 32.8 1.10 33% 52% US $37 US $12Spanish Mountain Gold Ltd. TSXV:SPA US $12 US $2 US $10 8.0 0.33 8.2 0.34 98% - - - - - 8.0 0.33 8.2 0.34 98% 51% US $1 US $1Teras Resources Inc. TSXV:TRA US $10 US $0 US $10 1.1 0.48 1.3 0.55 88% - - - - - 1.1 0.48 1.3 0.55 88% 10% US $9 US $8TriMetals Mining Inc. TSX:TMI US $12 US ($1) US $13 1.9 0.07 15.9 0.61 12% - - - - - 1.9 0.07 15.9 0.61 12% 40% US $7 US $1Vendetta Mining Corp. TSXV:VTT US $20 US $0 US $20 - - 1.8 4.61 - - - - - - - - 1.1 2.80 - - US $11 US $11West Kirkland Mining Inc. TSXV:WKM US $14 US $0 US $14 0.8 0.46 0.9 0.54 84% 0.6 0.58 0.7 0.67 86% 0.2 0.30 0.3 0.37 81% 45% US $18 US $15Group Average - Total # Companies: 45 US $124 US $36Equivalency assumptions (US$ / 08-31-18): $1,200/oz Au, $14.52/oz Ag, $787/oz Pt, $982/oz Pd, $2.71/lb Cu, $1.12/lb Zn, $0.93/lb Pb, $5.76/lb Ni, $11.29/lb Mo, $29.17/lb Co, $0/t Sb, $23.38/lb U3O8, $8.64/lb Sn, $93.00/t HCC, $67.16/t 62% FeSource: SNL Financial retrieved on August 31, 2018
*Includes only Liberty's Goldstrike and Kinsley Mountain Projects
EV/ozAu
EV/ozAuEq
Au(Moz)
Au(g/t)
AuEq(Moz)
AuEq(g/t) % Au
Global
% Au% Au Au(Moz)
Au(g/t)
AuEq(Moz)
Global Reserves & Resources Reserves Resources (M&I and Inferred)Au
(Moz)Au
(g/t)AuEq(Moz)
AuEq(g/t)
AuEq(g/t)
% AuInferred
Company SymbolMarket
Capitalization(millions)
WorkingCapital
(millions)
EnterpriseValue
(millions)
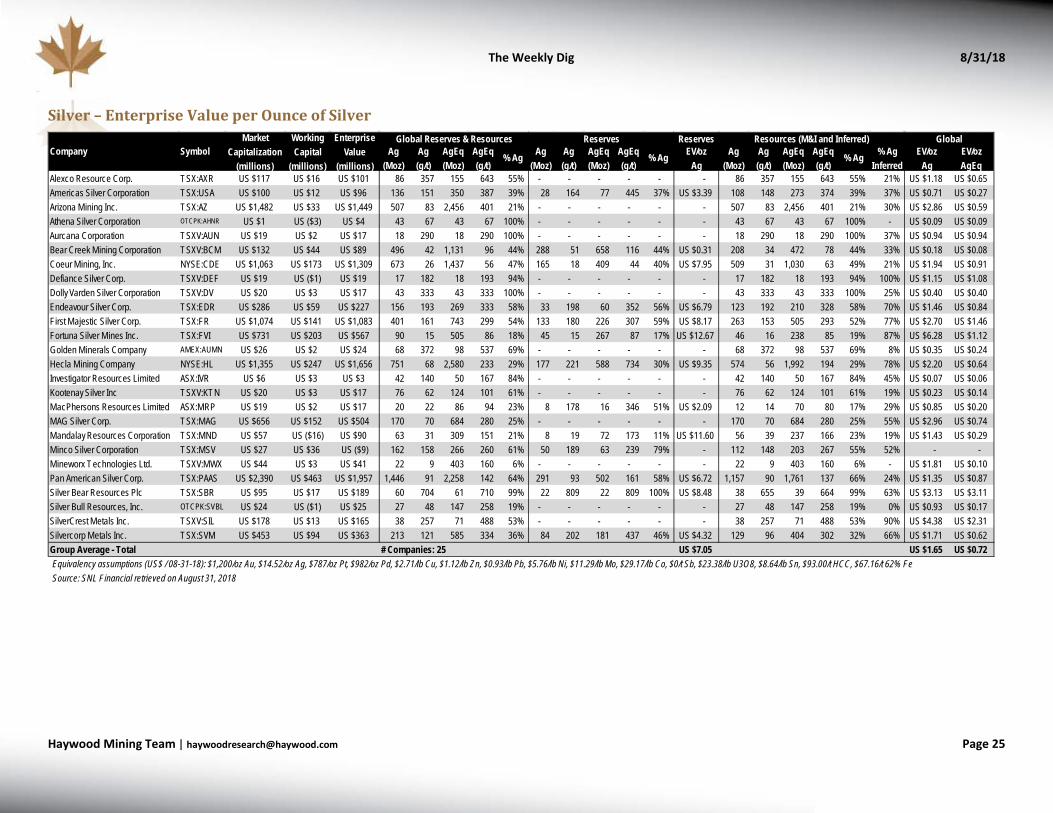
The Weekly Dig 8/31/18
Haywood Mining [email protected] Page 25
Silver – Enterprise Value per Ounce of Silver
Reserves
Alexco Resource Corp. TSX:AXR US $117 US $16 US $101 86 357 155 643 55% - - - - - - 86 357 155 643 55% 21% US $1.18 US $0.65Americas Silver Corporation TSX:USA US $100 US $12 US $96 136 151 350 387 39% 28 164 77 445 37% US $3.39 108 148 273 374 39% 37% US $0.71 US $0.27Arizona Mining Inc. TSX:AZ US $1,482 US $33 US $1,449 507 83 2,456 401 21% - - - - - - 507 83 2,456 401 21% 30% US $2.86 US $0.59Athena Silver Corporation OTCPK:AHNR US $1 US ($3) US $4 43 67 43 67 100% - - - - - - 43 67 43 67 100% - US $0.09 US $0.09Aurcana Corporation TSXV:AUN US $19 US $2 US $17 18 290 18 290 100% - - - - - - 18 290 18 290 100% 37% US $0.94 US $0.94Bear Creek Mining Corporation TSXV:BCM US $132 US $44 US $89 496 42 1,131 96 44% 288 51 658 116 44% US $0.31 208 34 472 78 44% 33% US $0.18 US $0.08Coeur Mining, Inc. NYSE:CDE US $1,063 US $173 US $1,309 673 26 1,437 56 47% 165 18 409 44 40% US $7.95 509 31 1,030 63 49% 21% US $1.94 US $0.91Defiance Silver Corp. TSXV:DEF US $19 US ($1) US $19 17 182 18 193 94% - - - - - - 17 182 18 193 94% 100% US $1.15 US $1.08Dolly Varden Silver Corporation TSXV:DV US $20 US $3 US $17 43 333 43 333 100% - - - - - - 43 333 43 333 100% 25% US $0.40 US $0.40Endeavour Silver Corp. TSX:EDR US $286 US $59 US $227 156 193 269 333 58% 33 198 60 352 56% US $6.79 123 192 210 328 58% 70% US $1.46 US $0.84First Majestic Silver Corp. TSX:FR US $1,074 US $141 US $1,083 401 161 743 299 54% 133 180 226 307 59% US $8.17 263 153 505 293 52% 77% US $2.70 US $1.46Fortuna Silver Mines Inc. TSX:FVI US $731 US $203 US $567 90 15 505 86 18% 45 15 267 87 17% US $12.67 46 16 238 85 19% 87% US $6.28 US $1.12Golden Minerals Company AMEX:AUMN US $26 US $2 US $24 68 372 98 537 69% - - - - - - 68 372 98 537 69% 8% US $0.35 US $0.24Hecla Mining Company NYSE:HL US $1,355 US $247 US $1,656 751 68 2,580 233 29% 177 221 588 734 30% US $9.35 574 56 1,992 194 29% 78% US $2.20 US $0.64Investigator Resources Limited ASX:IVR US $6 US $3 US $3 42 140 50 167 84% - - - - - - 42 140 50 167 84% 45% US $0.07 US $0.06Kootenay Silver Inc TSXV:KTN US $20 US $3 US $17 76 62 124 101 61% - - - - - - 76 62 124 101 61% 19% US $0.23 US $0.14MacPhersons Resources Limited ASX:MRP US $19 US $2 US $17 20 22 86 94 23% 8 178 16 346 51% US $2.09 12 14 70 80 17% 29% US $0.85 US $0.20MAG Silver Corp. TSX:MAG US $656 US $152 US $504 170 70 684 280 25% - - - - - - 170 70 684 280 25% 55% US $2.96 US $0.74Mandalay Resources Corporation TSX:MND US $57 US ($16) US $90 63 31 309 151 21% 8 19 72 173 11% US $11.60 56 39 237 166 23% 19% US $1.43 US $0.29Minco Silver Corporation TSX:MSV US $27 US $36 US ($9) 162 158 266 260 61% 50 189 63 239 79% - 112 148 203 267 55% 52% - - Mineworx Technologies Ltd. TSXV:MWX US $44 US $3 US $41 22 9 403 160 6% - - - - - - 22 9 403 160 6% - US $1.81 US $0.10Pan American Silver Corp. TSX:PAAS US $2,390 US $463 US $1,957 1,446 91 2,258 142 64% 291 93 502 161 58% US $6.72 1,157 90 1,761 137 66% 24% US $1.35 US $0.87Silver Bear Resources Plc TSX:SBR US $95 US $17 US $189 60 704 61 710 99% 22 809 22 809 100% US $8.48 38 655 39 664 99% 63% US $3.13 US $3.11Silver Bull Resources, Inc. OTCPK:SVBL US $24 US ($1) US $25 27 48 147 258 19% - - - - - - 27 48 147 258 19% 0% US $0.93 US $0.17SilverCrest Metals Inc. TSXV:SIL US $178 US $13 US $165 38 257 71 488 53% - - - - - - 38 257 71 488 53% 90% US $4.38 US $2.31Silvercorp Metals Inc. TSX:SVM US $453 US $94 US $363 213 121 585 334 36% 84 202 181 437 46% US $4.32 129 96 404 302 32% 66% US $1.71 US $0.62Group Average - Total # Companies: 25 US $7.05 US $1.65 US $0.72Equivalency assumptions (US$ / 08-31-18): $1,200/oz Au, $14.52/oz Ag, $787/oz Pt, $982/oz Pd, $2.71/lb Cu, $1.12/lb Zn, $0.93/lb Pb, $5.76/lb Ni, $11.29/lb Mo, $29.17/lb Co, $0/t Sb, $23.38/lb U3O8, $8.64/lb Sn, $93.00/t HCC, $67.16/t 62% FeSource: SNL Financial retrieved on August 31, 2018
EV/ozAg
EV/ozAgEq
Ag(Moz)
Ag(g/t)
AgEq(Moz)
AgEq(g/t)
% Ag
Global
% Ag% Ag Ag(Moz)
Ag(g/t)
AgEq(Moz)
Global Reserves & Resources Reserves Resources (M&I and Inferred)Ag
(Moz)Ag(g/t)
AgEq(Moz)
AgEq(g/t)
AgEq(g/t)
% AgInferred
EV/ozAg
Company SymbolMarket
Capitalization(millions)
WorkingCapital
(millions)
EnterpriseValue
(millions)
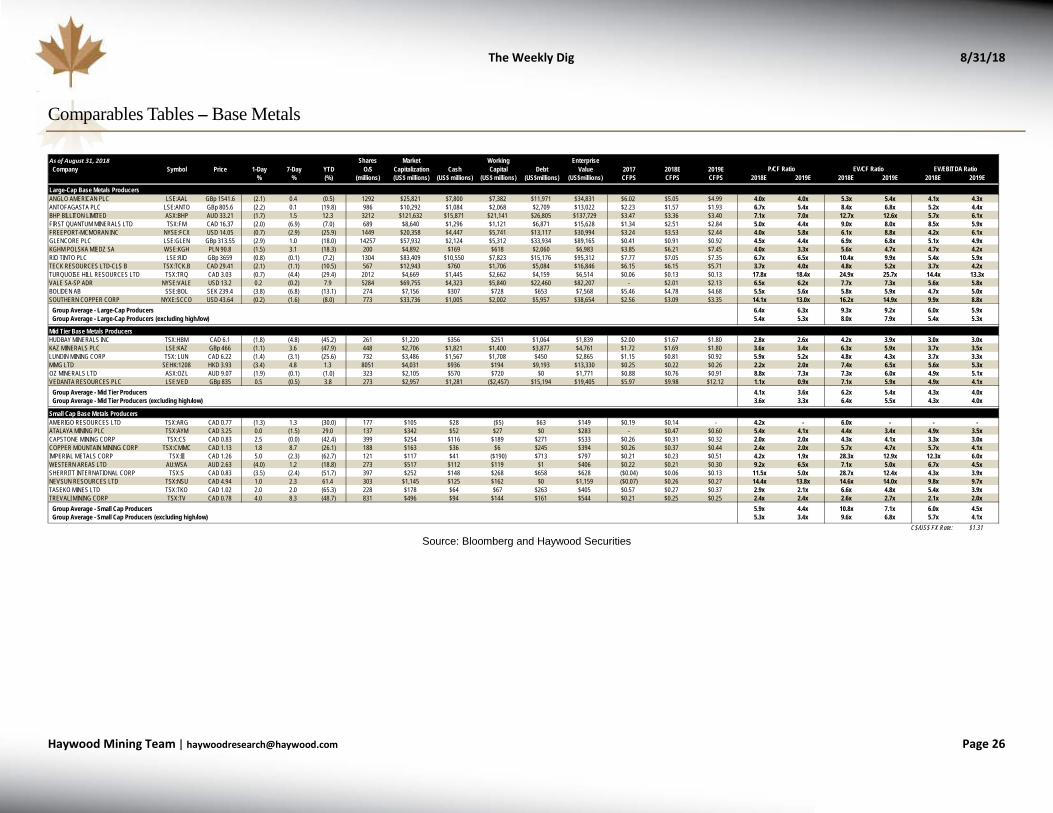
The Weekly Dig 8/31/18
Haywood Mining [email protected] Page 26
Comparables Tables – Base Metals
Source: Bloomberg and Haywood Securities
As of August 31, 2018 Shares Market Working EnterpriseCompany Symbol Price 1-Day 7-Day YTD O/S Capitalization Cash Capital Debt Value 2017 2018E 2019E
% % (%) (millions) (US$ millions) (US$ millions) (US$ millions) (US$millions) (US$millions) CFPS CFPS CFPS 2018E 2019E 2018E 2019E 2018E 2019E
Large-Cap Base Metals ProducersANGLO AMERICAN PLC LSE:AAL GBp 1541.6 (2.1) 0.4 (0.5) 1292 $25,821 $7,800 $7,382 $11,971 $34,831 $6.02 $5.05 $4.99 4.0x 4.0x 5.3x 5.4x 4.1x 4.3xANTOFAGASTA PLC LSE:ANTO GBp 805.6 (2.2) 0.1 (19.8) 986 $10,292 $1,084 $2,068 $2,709 $13,022 $2.23 $1.57 $1.93 6.7x 5.4x 8.4x 6.8x 5.2x 4.4xBHP BILLITON LIMITED ASX:BHP AUD 33.21 (1.7) 1.5 12.3 3212 $121,632 $15,871 $21,141 $26,805 $137,729 $3.47 $3.36 $3.40 7.1x 7.0x 12.7x 12.6x 5.7x 6.1xFIRST QUANTUM MINERALS LTD TSX:FM CAD 16.37 (2.0) (6.9) (7.0) 689 $8,640 $1,296 $1,121 $6,871 $15,628 $1.34 $2.51 $2.84 5.0x 4.4x 9.0x 8.0x 8.5x 5.9xFREEPORT-MCMORAN INC NYSE:FCX USD 14.05 (0.7) (2.9) (25.9) 1449 $20,358 $4,447 $5,741 $13,117 $30,994 $3.24 $3.53 $2.44 4.0x 5.8x 6.1x 8.8x 4.2x 6.1xGLENCORE PLC LSE:GLEN GBp 313.55 (2.9) 1.0 (18.0) 14257 $57,932 $2,124 $5,312 $33,934 $89,165 $0.41 $0.91 $0.92 4.5x 4.4x 6.9x 6.8x 5.1x 4.9xKGHM POLSKA MIEDZ SA WSE:KGH PLN 90.8 (1.5) 3.1 (18.3) 200 $4,892 $169 $618 $2,060 $6,983 $3.85 $6.21 $7.45 4.0x 3.3x 5.6x 4.7x 4.7x 4.2xRIO TINTO PLC LSE:RIO GBp 3659 (0.8) (0.1) (7.2) 1304 $83,409 $10,550 $7,823 $15,176 $95,312 $7.77 $7.05 $7.35 6.7x 6.5x 10.4x 9.9x 5.4x 5.9xTECK RESOURCES LTD-CLS B TSX:TCK.B CAD 29.41 (2.1) (1.1) (10.5) 567 $12,943 $760 $1,706 $5,084 $16,846 $6.15 $6.15 $5.71 3.7x 4.0x 4.8x 5.2x 3.7x 4.2xTURQUOISE HILL RESOURCES LTD TSX:TRQ CAD 3.03 (0.7) (4.4) (29.4) 2012 $4,669 $1,445 $2,662 $4,159 $6,514 $0.06 $0.13 $0.13 17.8x 18.4x 24.9x 25.7x 14.4x 13.3xVALE SA-SP ADR NYSE:VALE USD 13.2 0.2 (0.2) 7.9 5284 $69,755 $4,323 $5,840 $22,460 $82,207 - $2.01 $2.13 6.5x 6.2x 7.7x 7.3x 5.6x 5.8xBOLIDEN AB SSE:BOL SEK 239.4 (3.8) (6.8) (13.1) 274 $7,156 $307 $728 $653 $7,568 $5.46 $4.78 $4.68 5.5x 5.6x 5.8x 5.9x 4.7x 5.0xSOUTHERN COPPER CORP NYXE:SCCO USD 43.64 (0.2) (1.6) (8.0) 773 $33,736 $1,005 $2,002 $5,957 $38,654 $2.56 $3.09 $3.35 14.1x 13.0x 16.2x 14.9x 9.9x 8.8x
Group Average - Large-Cap Producers 6.4x 6.3x 9.3x 9.2x 6.0x 5.9xGroup Average - Large-Cap Producers (excluding high/low) 5.4x 5.3x 8.0x 7.9x 5.4x 5.3x
Mid Tier Base Metals ProducersHUDBAY MINERALS INC TSX:HBM CAD 6.1 (1.8) (4.8) (45.2) 261 $1,220 $356 $251 $1,064 $1,839 $2.00 $1.67 $1.80 2.8x 2.6x 4.2x 3.9x 3.0x 3.0xKAZ MINERALS PLC LSE:KAZ GBp 466 (1.1) 3.6 (47.9) 448 $2,706 $1,821 $1,400 $3,877 $4,761 $1.72 $1.69 $1.80 3.6x 3.4x 6.3x 5.9x 3.7x 3.5xLUNDIN MINING CORP TSX: LUN CAD 6.22 (1.4) (3.1) (25.6) 732 $3,486 $1,567 $1,708 $450 $2,865 $1.15 $0.81 $0.92 5.9x 5.2x 4.8x 4.3x 3.7x 3.3xMMG LTD SEHK:1208 HKD 3.93 (3.4) 4.8 1.3 8051 $4,031 $936 $194 $9,193 $13,330 $0.25 $0.22 $0.26 2.2x 2.0x 7.4x 6.5x 5.6x 5.3xOZ MINERALS LTD ASX:OZL AUD 9.07 (1.9) (0.1) (1.0) 323 $2,105 $570 $720 $0 $1,771 $0.88 $0.76 $0.91 8.8x 7.3x 7.3x 6.0x 4.9x 5.1xVEDANTA RESOURCES PLC LSE:VED GBp 835 0.5 (0.5) 3.8 273 $2,957 $1,281 ($2,457) $15,194 $19,405 $5.97 $9.98 $12.12 1.1x 0.9x 7.1x 5.9x 4.9x 4.1x
Group Average - Mid Tier Producers 4.1x 3.6x 6.2x 5.4x 4.3x 4.0xGroup Average - Mid Tier Producers (excluding high/low) 3.6x 3.3x 6.4x 5.5x 4.3x 4.0x
Small Cap Base Metals ProducersAMERIGO RESOURCES LTD TSX:ARG CAD 0.77 (1.3) 1.3 (30.0) 177 $105 $28 ($5) $63 $149 $0.19 $0.14 - 4.2x - 6.0x - - -ATALAYA MINING PLC TSX:AYM CAD 3.25 0.0 (1.5) 29.0 137 $342 $52 $27 $0 $283 - $0.47 $0.60 5.4x 4.1x 4.4x 3.4x 4.9x 3.5xCAPSTONE MINING CORP TSX:CS CAD 0.83 2.5 (0.0) (42.4) 399 $254 $116 $189 $271 $533 $0.26 $0.31 $0.32 2.0x 2.0x 4.3x 4.1x 3.3x 3.0xCOPPER MOUNTAIN MINING CORP TSX:CMMC CAD 1.13 1.8 8.7 (26.1) 188 $163 $36 $6 $245 $394 $0.26 $0.37 $0.44 2.4x 2.0x 5.7x 4.7x 5.7x 4.1xIMPERIAL METALS CORP TSX:III CAD 1.26 5.0 (2.3) (62.7) 121 $117 $41 ($190) $713 $797 $0.21 $0.23 $0.51 4.2x 1.9x 28.3x 12.9x 12.3x 6.0xWESTERN AREAS LTD AU:WSA AUD 2.63 (4.0) 1.2 (18.8) 273 $517 $112 $119 $1 $406 $0.22 $0.21 $0.30 9.2x 6.5x 7.1x 5.0x 6.7x 4.5xSHERRITT INTERNATIONAL CORP TSX:S CAD 0.83 (3.5) (2.4) (51.7) 397 $252 $148 $268 $658 $628 ($0.04) $0.06 $0.13 11.5x 5.0x 28.7x 12.4x 4.3x 3.9xNEVSUN RESOURCES LTD TSX:NSU CAD 4.94 1.0 2.3 61.4 303 $1,145 $125 $162 $0 $1,159 ($0.07) $0.26 $0.27 14.4x 13.8x 14.6x 14.0x 9.8x 9.7xTASEKO MINES LTD TSX:TKO CAD 1.02 2.0 2.0 (65.3) 228 $178 $64 $67 $263 $405 $0.57 $0.27 $0.37 2.9x 2.1x 6.6x 4.8x 5.4x 3.9xTREVALI MINING CORP TSX:TV CAD 0.78 4.0 8.3 (48.7) 831 $496 $94 $144 $161 $544 $0.21 $0.25 $0.25 2.4x 2.4x 2.6x 2.7x 2.1x 2.0x
Group Average - Small Cap Producers 5.9x 4.4x 10.8x 7.1x 6.0x 4.5xGroup Average - Small Cap Producers (excluding high/low) 5.3x 3.4x 9.6x 6.8x 5.7x 4.1x
. C$/US$ FX Rate: $1.31
P/CF Ratio EV/CF Ratio EV/EBITDA Ratio
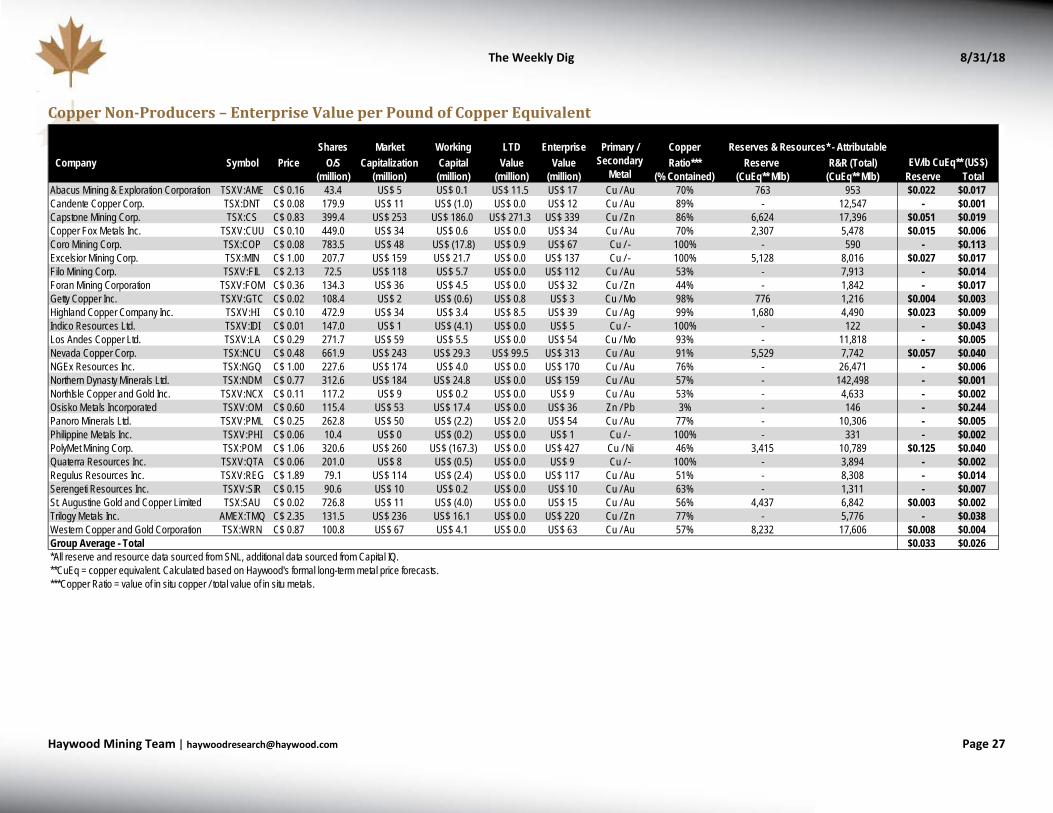
The Weekly Dig 8/31/18
Haywood Mining [email protected] Page 27
Copper Non-Producers – Enterprise Value per Pound of Copper Equivalent
Shares Market Working LTD Enterprise CopperCompany Symbol Price O/S Capitalization Capital Value Value Ratio*** Reserve R&R (Total)
(million) (million) (million) (million) (million) (% Contained) (CuEq** Mlb) (CuEq** Mlb) Reserve TotalAbacus Mining & Exploration Corporation TSXV:AME C$ 0.16 43.4 US$ 5 US$ 0.1 US$ 11.5 US$ 17 Cu / Au 70% 763 953 $0.022 $0.017Candente Copper Corp. TSX:DNT C$ 0.08 179.9 US$ 11 US$ (1.0) US$ 0.0 US$ 12 Cu / Au 89% - 12,547 - $0.001Capstone Mining Corp. TSX:CS C$ 0.83 399.4 US$ 253 US$ 186.0 US$ 271.3 US$ 339 Cu / Zn 86% 6,624 17,396 $0.051 $0.019Copper Fox Metals Inc. TSXV:CUU C$ 0.10 449.0 US$ 34 US$ 0.6 US$ 0.0 US$ 34 Cu / Au 70% 2,307 5,478 $0.015 $0.006Coro Mining Corp. TSX:COP C$ 0.08 783.5 US$ 48 US$ (17.8) US$ 0.9 US$ 67 Cu / - 100% - 590 - $0.113Excelsior Mining Corp. TSX:MIN C$ 1.00 207.7 US$ 159 US$ 21.7 US$ 0.0 US$ 137 Cu / - 100% 5,128 8,016 $0.027 $0.017Filo Mining Corp. TSXV:FIL C$ 2.13 72.5 US$ 118 US$ 5.7 US$ 0.0 US$ 112 Cu / Au 53% - 7,913 - $0.014Foran Mining Corporation TSXV:FOM C$ 0.36 134.3 US$ 36 US$ 4.5 US$ 0.0 US$ 32 Cu / Zn 44% - 1,842 - $0.017Getty Copper Inc. TSXV:GTC C$ 0.02 108.4 US$ 2 US$ (0.6) US$ 0.8 US$ 3 Cu / Mo 98% 776 1,216 $0.004 $0.003Highland Copper Company Inc. TSXV:HI C$ 0.10 472.9 US$ 34 US$ 3.4 US$ 8.5 US$ 39 Cu / Ag 99% 1,680 4,490 $0.023 $0.009Indico Resources Ltd. TSXV:IDI C$ 0.01 147.0 US$ 1 US$ (4.1) US$ 0.0 US$ 5 Cu / - 100% - 122 - $0.043Los Andes Copper Ltd. TSXV:LA C$ 0.29 271.7 US$ 59 US$ 5.5 US$ 0.0 US$ 54 Cu / Mo 93% - 11,818 - $0.005Nevada Copper Corp. TSX:NCU C$ 0.48 661.9 US$ 243 US$ 29.3 US$ 99.5 US$ 313 Cu / Au 91% 5,529 7,742 $0.057 $0.040NGEx Resources Inc. TSX:NGQ C$ 1.00 227.6 US$ 174 US$ 4.0 US$ 0.0 US$ 170 Cu / Au 76% - 26,471 - $0.006Northern Dynasty Minerals Ltd. TSX:NDM C$ 0.77 312.6 US$ 184 US$ 24.8 US$ 0.0 US$ 159 Cu / Au 57% - 142,498 - $0.001NorthIsle Copper and Gold Inc. TSXV:NCX C$ 0.11 117.2 US$ 9 US$ 0.2 US$ 0.0 US$ 9 Cu / Au 53% - 4,633 - $0.002Osisko Metals Incorporated TSXV:OM C$ 0.60 115.4 US$ 53 US$ 17.4 US$ 0.0 US$ 36 Zn / Pb 3% - 146 - $0.244Panoro Minerals Ltd. TSXV:PML C$ 0.25 262.8 US$ 50 US$ (2.2) US$ 2.0 US$ 54 Cu / Au 77% - 10,306 - $0.005Philippine Metals Inc. TSXV:PHI C$ 0.06 10.4 US$ 0 US$ (0.2) US$ 0.0 US$ 1 Cu / - 100% - 331 - $0.002PolyMet Mining Corp. TSX:POM C$ 1.06 320.6 US$ 260 US$ (167.3) US$ 0.0 US$ 427 Cu / Ni 46% 3,415 10,789 $0.125 $0.040Quaterra Resources Inc. TSXV:QTA C$ 0.06 201.0 US$ 8 US$ (0.5) US$ 0.0 US$ 9 Cu / - 100% - 3,894 - $0.002Regulus Resources Inc. TSXV:REG C$ 1.89 79.1 US$ 114 US$ (2.4) US$ 0.0 US$ 117 Cu / Au 51% - 8,308 - $0.014Serengeti Resources Inc. TSXV:SIR C$ 0.15 90.6 US$ 10 US$ 0.2 US$ 0.0 US$ 10 Cu / Au 63% - 1,311 - $0.007St. Augustine Gold and Copper Limited TSX:SAU C$ 0.02 726.8 US$ 11 US$ (4.0) US$ 0.0 US$ 15 Cu / Au 56% 4,437 6,842 $0.003 $0.002Trilogy Metals Inc. AMEX:TMQ C$ 2.35 131.5 US$ 236 US$ 16.1 US$ 0.0 US$ 220 Cu / Zn 77% - 5,776 - $0.038Western Copper and Gold Corporation TSX:WRN C$ 0.87 100.8 US$ 67 US$ 4.1 US$ 0.0 US$ 63 Cu / Au 57% 8,232 17,606 $0.008 $0.004Group Average - Total $0.033 $0.026*All reserve and resource data sourced from SNL, additional data sourced from Capital IQ.**CuEq = copper equivalent. Calculated based on Haywood's formal long-term metal price forecasts.***Copper Ratio = value of in situ copper / total value of in situ metals.
Primary / Secondary
Metal
Reserves & Resources* - AttributableEV/lb CuEq** (US$)
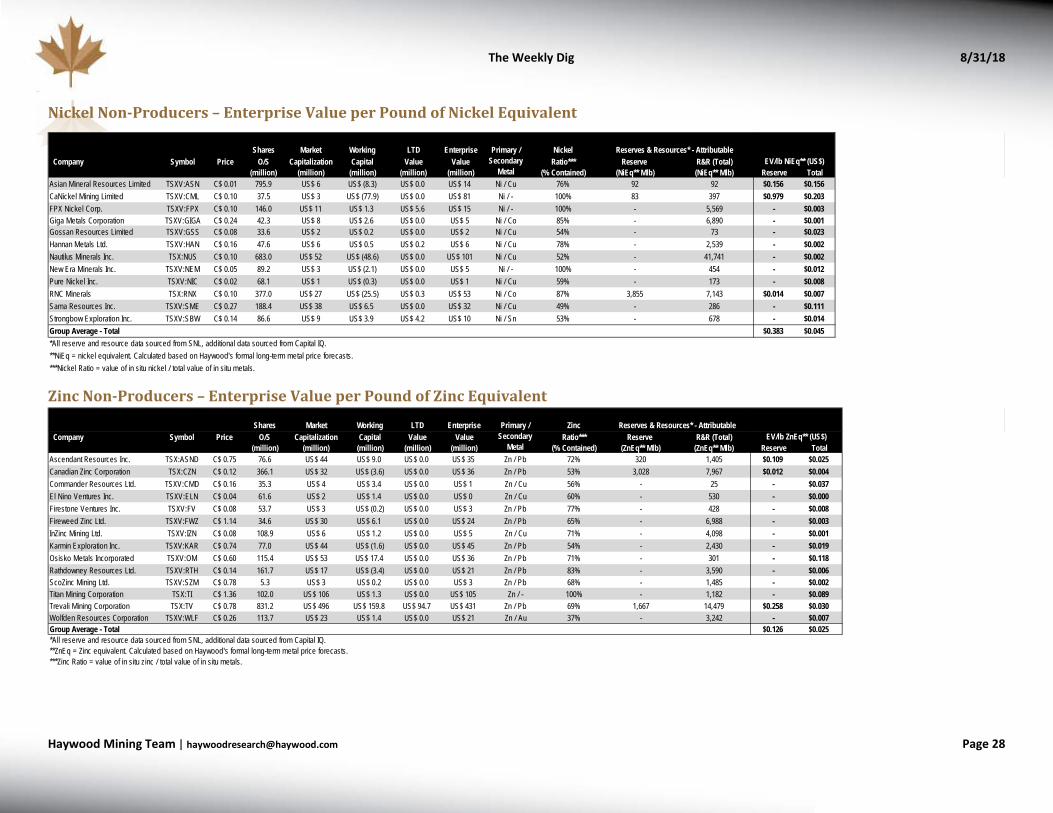
The Weekly Dig 8/31/18
Haywood Mining [email protected] Page 28
Nickel Non-Producers – Enterprise Value per Pound of Nickel Equivalent
Zinc Non-Producers – Enterprise Value per Pound of Zinc Equivalent
Shares Market Working LTD Enterprise NickelCompany Symbol Price O/S Capitalization Capital Value Value Ratio*** Reserve R&R (Total)
(million) (million) (million) (million) (million) (% Contained) (NiEq** Mlb) (NiEq** Mlb) Reserve TotalAsian Mineral Resources Limited TSXV:ASN C$ 0.01 795.9 US$ 6 US$ (8.3) US$ 0.0 US$ 14 Ni / Cu 76% 92 92 $0.156 $0.156CaNickel Mining Limited TSXV:CML C$ 0.10 37.5 US$ 3 US$ (77.9) US$ 0.0 US$ 81 Ni / - 100% 83 397 $0.979 $0.203FPX Nickel Corp. TSXV:FPX C$ 0.10 146.0 US$ 11 US$ 1.3 US$ 5.6 US$ 15 Ni / - 100% - 5,569 - $0.003Giga Metals Corporation TSXV:GIGA C$ 0.24 42.3 US$ 8 US$ 2.6 US$ 0.0 US$ 5 Ni / Co 85% - 6,890 - $0.001Gossan Resources Limited TSXV:GSS C$ 0.08 33.6 US$ 2 US$ 0.2 US$ 0.0 US$ 2 Ni / Cu 54% - 73 - $0.023Hannan Metals Ltd. TSXV:HAN C$ 0.16 47.6 US$ 6 US$ 0.5 US$ 0.2 US$ 6 Ni / Cu 78% - 2,539 - $0.002Nautilus Minerals Inc. TSX:NUS C$ 0.10 683.0 US$ 52 US$ (48.6) US$ 0.0 US$ 101 Ni / Cu 52% - 41,741 - $0.002New Era Minerals Inc. TSXV:NEM C$ 0.05 89.2 US$ 3 US$ (2.1) US$ 0.0 US$ 5 Ni / - 100% - 454 - $0.012Pure Nickel Inc. TSXV:NIC C$ 0.02 68.1 US$ 1 US$ (0.3) US$ 0.0 US$ 1 Ni / Cu 59% - 173 - $0.008RNC Minerals TSX:RNX C$ 0.10 377.0 US$ 27 US$ (25.5) US$ 0.3 US$ 53 Ni / Co 87% 3,855 7,143 $0.014 $0.007Sama Resources Inc. TSXV:SME C$ 0.27 188.4 US$ 38 US$ 6.5 US$ 0.0 US$ 32 Ni / Cu 49% - 286 - $0.111Strongbow Exploration Inc. TSXV:SBW C$ 0.14 86.6 US$ 9 US$ 3.9 US$ 4.2 US$ 10 Ni / Sn 53% - 678 - $0.014Group Average - Total $0.383 $0.045*All reserve and resource data sourced from SNL, additional data sourced from Capital IQ.**NiEq = nickel equivalent. Calculated based on Haywood's formal long-term metal price forecasts.***Nickel Ratio = value of in situ nickel / total value of in situ metals.
EV/lb NiEq** (US$)Primary /
SecondaryMetal
Reserves & Resources* - Attributable
Shares Market Working LTD Enterprise ZincCompany Symbol Price O/S Capitalization Capital Value Value Ratio*** Reserve R&R (Total)
(million) (million) (million) (million) (million) (% Contained) (ZnEq** Mlb) (ZnEq** Mlb) Reserve TotalAscendant Resources Inc. TSX:ASND C$ 0.75 76.6 US$ 44 US$ 9.0 US$ 0.0 US$ 35 Zn / Pb 72% 320 1,405 $0.109 $0.025Canadian Zinc Corporation TSX:CZN C$ 0.12 366.1 US$ 32 US$ (3.6) US$ 0.0 US$ 36 Zn / Pb 53% 3,028 7,967 $0.012 $0.004Commander Resources Ltd. TSXV:CMD C$ 0.16 35.3 US$ 4 US$ 3.4 US$ 0.0 US$ 1 Zn / Cu 56% - 25 - $0.037El Nino Ventures Inc. TSXV:ELN C$ 0.04 61.6 US$ 2 US$ 1.4 US$ 0.0 US$ 0 Zn / Cu 60% - 530 - $0.000Firestone Ventures Inc. TSXV:FV C$ 0.08 53.7 US$ 3 US$ (0.2) US$ 0.0 US$ 3 Zn / Pb 77% - 428 - $0.008Fireweed Zinc Ltd. TSXV:FWZ C$ 1.14 34.6 US$ 30 US$ 6.1 US$ 0.0 US$ 24 Zn / Pb 65% - 6,988 - $0.003InZinc Mining Ltd. TSXV:IZN C$ 0.08 108.9 US$ 6 US$ 1.2 US$ 0.0 US$ 5 Zn / Cu 71% - 4,098 - $0.001Karmin Exploration Inc. TSXV:KAR C$ 0.74 77.0 US$ 44 US$ (1.6) US$ 0.0 US$ 45 Zn / Pb 54% - 2,430 - $0.019Osisko Metals Incorporated TSXV:OM C$ 0.60 115.4 US$ 53 US$ 17.4 US$ 0.0 US$ 36 Zn / Pb 71% - 301 - $0.118Rathdowney Resources Ltd. TSXV:RTH C$ 0.14 161.7 US$ 17 US$ (3.4) US$ 0.0 US$ 21 Zn / Pb 83% - 3,590 - $0.006ScoZinc Mining Ltd. TSXV:SZM C$ 0.78 5.3 US$ 3 US$ 0.2 US$ 0.0 US$ 3 Zn / Pb 68% - 1,485 - $0.002Titan Mining Corporation TSX:TI C$ 1.36 102.0 US$ 106 US$ 1.3 US$ 0.0 US$ 105 Zn / - 100% - 1,182 - $0.089Trevali Mining Corporation TSX:TV C$ 0.78 831.2 US$ 496 US$ 159.8 US$ 94.7 US$ 431 Zn / Pb 69% 1,667 14,479 $0.258 $0.030Wolfden Resources Corporation TSXV:WLF C$ 0.26 113.7 US$ 23 US$ 1.4 US$ 0.0 US$ 21 Zn / Au 37% - 3,242 - $0.007Group Average - Total $0.126 $0.025*All reserve and resource data sourced from SNL, additional data sourced from Capital IQ.**ZnEq = Zinc equivalent. Calculated based on Haywood's formal long-term metal price forecasts.***Zinc Ratio = value of in situ zinc / total value of in situ metals.
Primary / Secondary
Metal
Reserves & Resources* - AttributableEV/lb ZnEq** (US$)
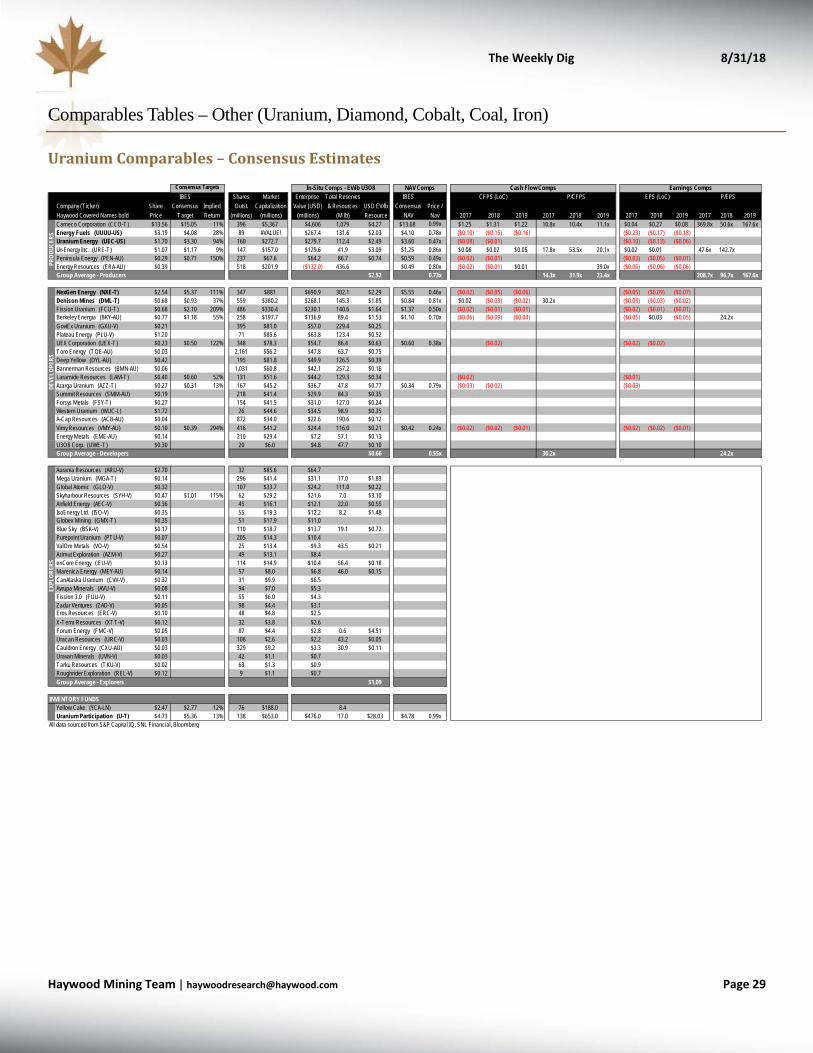
The Weekly Dig 8/31/18
Haywood Mining [email protected] Page 29
Comparables Tables – Other (Uranium, Diamond, Cobalt, Coal, Iron)
Uranium Comparables – Consensus Estimates
IBES Shares Market Enterprise Total Reserves IBESCompany (T icker)Haywood Covered Names bold
Share Price
Consensus Target
Implied Return
Outst. (millions)
Capitalization (millions)
Value (USD)(millions)
& Resources(M lb)
USD EV/lb Resource
Consensus NAV
Price / Nav 2017 2018 2019 2017 2018 2019 2017 2018 2019 2017 2018 2019
Cameco Corporation (CCO-T) $13.56 $15.05 11% 396 $5,367 $4,606 1,079 $4.27 $13.68 0.99x $1.25 $1.31 $1.22 10.8x 10.4x 11.1x $0.04 $0.27 $0.08 369.8x 50.6x 167.6xEnergy Fuels (UUUU-US) $3.19 $4.08 28% 89 #VALUE! $267.4 131.6 $2.03 $4.10 0.78x ($0.10) ($0.15) ($0.16) ($0.23) ($0.17) ($0.18)Uranium Energy (UEC-US) $1.70 $3.30 94% 160 $272.7 $279.7 112.4 $2.49 $3.60 0.47x ($0.08) ($0.01) ($0.10) ($0.13) ($0.06)Ur-Energy Inc. (URE-T) $1.07 $1.17 9% 147 $157.0 $129.6 41.9 $3.09 $1.25 0.86x $0.06 $0.02 $0.05 17.8x 53.5x 20.1x $0.02 $0.01 47.6x 142.7xPeninsula Energy (PEN-AU) $0.29 $0.71 150% 237 $67.6 $64.2 86.7 $0.74 $0.59 0.49x ($0.02) ($0.01) ($0.03) ($0.05) ($0.01)Energy Resources (ERA-AU) $0.39 518 $201.9 ($132.0) 436.6 $0.49 0.80x ($0.02) ($0.01) $0.01 39.0x ($0.05) ($0.06) ($0.06)Group Average - Producers $2.52 0.73x 14.3x 31.9x 23.4x 208.7x 96.7x 167.6x
NexGen Energy (NXE-T) $2.54 $5.37 111% 347 $881 $690.9 302.1 $2.29 $5.55 0.46x ($0.02) ($0.05) ($0.06) ($0.05) ($0.09) ($0.07)Denison Mines (DML-T) $0.68 $0.93 37% 559 $380.2 $268.1 145.3 $1.85 $0.84 0.81x $0.02 ($0.03) ($0.02) 30.2x ($0.03) ($0.03) ($0.02)Fission Uranium (FCU-T) $0.68 $2.10 209% 486 $330.4 $230.1 140.6 $1.64 $1.37 0.50x ($0.02) ($0.01) ($0.01) ($0.02) ($0.01) ($0.01)Berkeley Energia (BKY-AU) $0.77 $1.18 55% 258 $197.7 $136.9 89.4 $1.53 $1.10 0.70x ($0.06) ($0.09) ($0.04) ($0.05) $0.03 ($0.05) 24.2xGoviEx Uranium (GXU-V) $0.21 395 $81.0 $57.0 229.4 $0.25Plateau Energy (PLU-V) $1.20 71 $85.6 $63.8 123.4 $0.52UEX Corporation (UEX-T) $0.23 $0.50 122% 348 $78.3 $54.7 86.4 $0.63 $0.60 0.38x ($0.02) ($0.02) ($0.02)Toro Energy (TOE-AU) $0.03 2,161 $56.2 $47.8 63.7 $0.75Deep Yellow (DYL-AU) $0.42 195 $81.8 $49.9 126.5 $0.39Bannerman Resources (BMN-AU) $0.06 1,031 $60.8 $42.1 257.2 $0.16Laramide Resources (LAM-T) $0.40 $0.60 52% 131 $51.6 $44.2 129.3 $0.34 ($0.02) ($0.01)Azarga Uranium (AZZ-T) $0.27 $0.31 13% 167 $45.2 $36.7 47.8 $0.77 $0.34 0.79x ($0.03) ($0.02) ($0.03)Summit Resources (SMM-AU) $0.19 218 $41.4 $29.9 84.3 $0.35Forsys Metals (FSY-T) $0.27 154 $41.5 $31.0 127.0 $0.24Western Uranium (WUC-L) $1.72 26 $44.6 $34.5 98.9 $0.35A-Cap Resources (ACB-AU) $0.04 872 $34.0 $22.6 190.6 $0.12Vimy Resources (VMY-AU) $0.10 $0.39 294% 416 $41.2 $24.4 116.0 $0.21 $0.42 0.24x ($0.02) ($0.02) ($0.01) ($0.02) ($0.02) ($0.01)Energy Metals (EME-AU) $0.14 210 $29.4 $7.2 57.1 $0.13U3O8 Corp. (UWE-T) $0.30 20 $6.0 $4.8 47.7 $0.10Group Average - Developers $0.66 0.55x 30.2x 24.2x
Aurania Resources (ARU-V) $2.70 32 $85.6 $64.7Mega Uranium (MGA-T) $0.14 296 $41.4 $31.1 17.0 $1.83Global Atomic (GLO-V) $0.32 107 $33.7 $24.2 111.0 $0.22Skyharbour Resources (SYH-V) $0.47 $1.01 115% 62 $29.2 $21.6 7.0 $3.10Anfield Energy (AEC-V) $0.36 45 $16.1 $12.1 22.0 $0.55IsoEnergy Ltd. (ISO-V) $0.35 55 $19.3 $12.2 8.2 $1.48Globex Mining (GMX-T) $0.35 51 $17.9 $11.0Blue Sky (BSK-V) $0.17 110 $18.7 $13.7 19.1 $0.72Purepoint Uranium (PTU-V) $0.07 205 $14.3 $10.4ValOre Metals (VO-V) $0.54 25 $13.4 $9.3 43.5 $0.21Azimut Exploration (AZM-V) $0.27 49 $13.1 $8.4enCore Energy (:EU-V) $0.13 114 $14.9 $10.4 56.4 $0.18Marenica Energy (MEY-AU) $0.14 57 $8.0 $6.8 46.0 $0.15CanAlaska Uranium (CVV-V) $0.32 31 $9.9 $6.5Avrupa Minerals (AVU-V) $0.08 94 $7.0 $5.3Fission 3.0 (FUU-V) $0.11 55 $6.0 $4.3Zadar Ventures (ZAD-V) $0.05 98 $4.4 $3.1Eros Resources (ERC-V) $0.10 48 $4.8 $2.5X-Terra Resources (XTT-V) $0.12 32 $3.8 $2.6Forum Energy (FMC-V) $0.05 87 $4.4 $2.8 0.6 $4.51Uracan Resources (URC-V) $0.03 106 $2.6 $2.2 43.2 $0.05Cauldron Energy (CXU-AU) $0.03 329 $9.2 $3.3 30.9 $0.11Uravan Minerals (UVN-V) $0.03 42 $1.1 $0.7Tarku Resources (TKU-V) $0.02 63 $1.3 $0.9Roughrider Exploration (REL-V) $0.12 9 $1.1 $0.7Group Average - Explorers $1.09
INVENTORY FUNDSYellow Cake (YCA-LN) $2.47 $2.77 12% 76 $188.0 8.4Uranium Participation (U-T) $4.73 $5.36 13% 138 $653.0 $476.0 17.0 $28.03 $4.78 0.99x
All data sourced from S&P Capital IQ, SNL Financial, Bloomberg
Earnings CompsConsensus Targets In-Situ Comps - EV/lb U3O8 NAV Comps Cash Flow CompsEPS (LoC) P/EPS
DEVE
LOPE
RSEX
PLOR
ERS
CFPS (LoC) P/CFPS
PROD
UCER
S
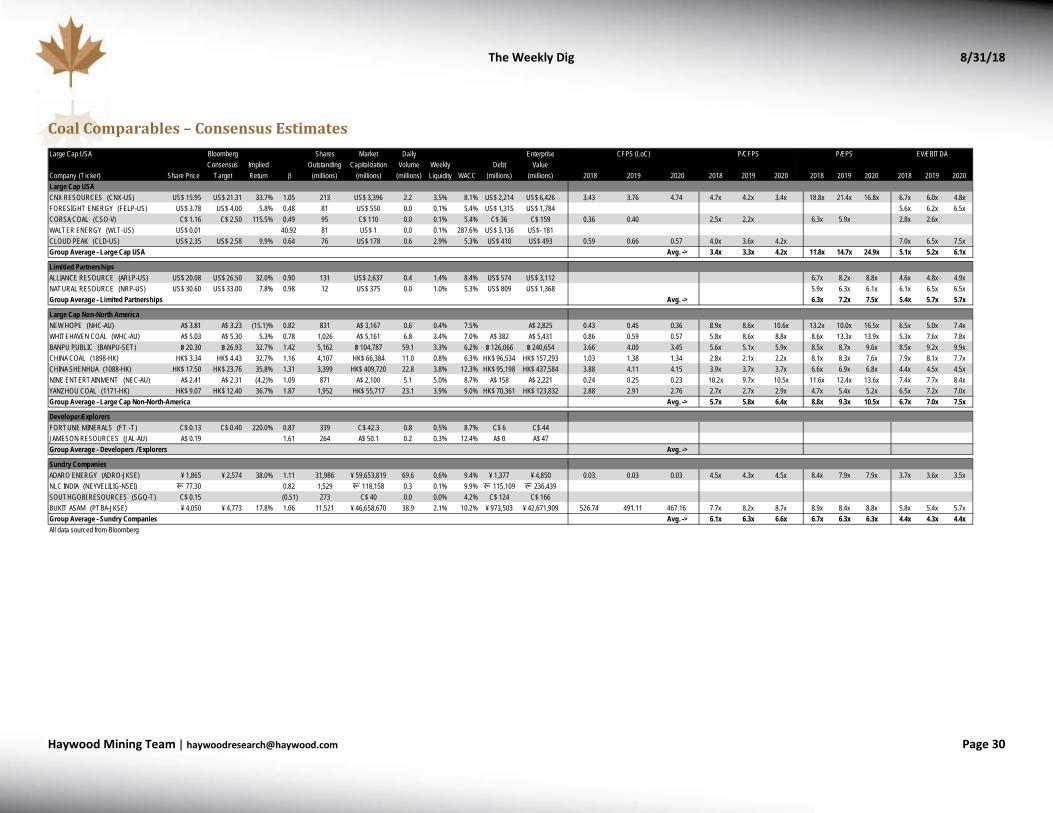
The Weekly Dig 8/31/18
Haywood Mining [email protected] Page 30
Coal Comparables – Consensus Estimates
Large Cap USA Bloomberg Shares Market Daily Enterprise
Company (T icker) Share PriceConsensus
TargetImplied Return β
Outstanding (millions)
Capitalization (millions)
Volume (millions)
Weekly Liquidity WACC
Debt (millions)
Value (millions) 2018 2019 2020 2018 2019 2020 2018 2019 2020 2018 2019 2020
Large Cap USACNX RESOURCES (CNX-US) US$ 15.95 US$ 21.31 33.7% 1.05 213 US$ 3,396 2.2 3.5% 8.1% US$ 2,214 US$ 6,426 3.43 3.76 4.74 4.7x 4.2x 3.4x 18.8x 21.4x 16.8x 6.7x 6.0x 4.8xFORESIGHT ENERGY (FELP-US) US$ 3.78 US$ 4.00 5.8% 0.48 81 US$ 550 0.0 0.1% 5.4% US$ 1,315 US$ 1,784 5.6x 6.2x 6.5xCORSA COAL (CSO-V) C$ 1.16 C$ 2.50 115.5% 0.49 95 C$ 110 0.0 0.1% 5.4% C$ 36 C$ 159 0.36 0.40 2.5x 2.2x 6.3x 5.9x 2.8x 2.6xWALTER ENERGY (WLT-US) US$ 0.01 40.92 81 US$ 1 0.0 0.1% 287.6% US$ 3,136 US$- 181CLOUD PEAK (CLD-US) US$ 2.35 US$ 2.58 9.9% 0.64 76 US$ 178 0.6 2.9% 5.3% US$ 410 US$ 493 0.59 0.66 0.57 4.0x 3.6x 4.2x 7.0x 6.5x 7.5xGroup Average - Large Cap USA Avg. -> 3.4x 3.3x 4.2x 11.8x 14.7x 24.9x 5.1x 5.2x 6.1x
Limitied PartnershipsALLIANCE RESOURCE (ARLP-US) US$ 20.08 US$ 26.50 32.0% 0.90 131 US$ 2,637 0.4 1.4% 8.4% US$ 574 US$ 3,112 6.7x 8.2x 8.8x 4.6x 4.8x 4.9xNATURAL RESOURCE (NRP-US) US$ 30.60 US$ 33.00 7.8% 0.98 12 US$ 375 0.0 1.0% 5.3% US$ 809 US$ 1,368 5.9x 6.3x 6.1x 6.1x 6.5x 6.5xGroup Average - Limited Partnerships Avg. -> 6.3x 7.2x 7.5x 5.4x 5.7x 5.7x
Large Cap Non-North AmericaNEW HOPE (NHC-AU) A$ 3.81 A$ 3.23 (15.1)% 0.82 831 A$ 3,167 0.6 0.4% 7.5% A$ 13 A$ 2,825 0.43 0.45 0.36 8.9x 8.6x 10.6x 13.2x 10.0x 16.5x 6.5x 5.0x 7.4xWHITEHAVEN COAL (WHC-AU) A$ 5.03 A$ 5.30 5.3% 0.78 1,026 A$ 5,161 6.8 3.4% 7.0% A$ 382 A$ 5,431 0.86 0.59 0.57 5.8x 8.6x 8.8x 8.6x 13.3x 13.9x 5.3x 7.6x 7.8xBANPU PUBLIC (BANPU-SET) ฿ 20.30 ฿ 26.93 32.7% 1.42 5,162 ฿ 104,787 59.1 3.3% 6.2% ฿ 126,066 ฿ 240,654 3.66 4.00 3.45 5.6x 5.1x 5.9x 8.5x 8.7x 9.6x 8.5x 9.2x 9.9xCHINA COAL (1898-HK) HK$ 3.34 HK$ 4.43 32.7% 1.16 4,107 HK$ 66,384 11.0 0.8% 6.3% HK$ 96,534 HK$ 157,293 1.03 1.38 1.34 2.8x 2.1x 2.2x 8.1x 8.3x 7.6x 7.9x 8.1x 7.7xCHINA SHENHUA (1088-HK) HK$ 17.50 HK$ 23.76 35.8% 1.31 3,399 HK$ 409,720 22.8 3.8% 12.3% HK$ 95,198 HK$ 437,584 3.88 4.11 4.15 3.9x 3.7x 3.7x 6.6x 6.9x 6.8x 4.4x 4.5x 4.5xNINE ENTERTAINMENT (NEC-AU) A$ 2.41 A$ 2.31 (4.2)% 1.09 871 A$ 2,100 5.1 5.0% 8.7% A$ 158 A$ 2,221 0.24 0.25 0.23 10.2x 9.7x 10.5x 11.6x 12.4x 13.6x 7.4x 7.7x 8.4xYANZHOU COAL (1171-HK) HK$ 9.07 HK$ 12.40 36.7% 1.87 1,952 HK$ 55,717 23.1 3.9% 9.0% HK$ 70,361 HK$ 123,832 2.88 2.91 2.76 2.7x 2.7x 2.9x 4.7x 5.4x 5.2x 6.5x 7.2x 7.0xGroup Average - Large Cap Non-North-America Avg. -> 5.7x 5.8x 6.4x 8.8x 9.3x 10.5x 6.7x 7.0x 7.5x
Developer/ExplorersFORTUNE MINERALS (FT -T) C$ 0.13 C$ 0.40 220.0% 0.87 339 C$ 42.3 0.8 0.5% 8.7% C$ 6 C$ 44JAMESON RESOURCES (JAL-AU) A$ 0.19 1.61 264 A$ 50.1 0.2 0.3% 12.4% A$ 0 A$ 47Group Average - Developers / Explorers Avg. ->
Sundry CompaniesADARO ENERGY (ADRO-JKSE) ¥ 1,865 ¥ 2,574 38.0% 1.11 31,986 ¥ 59,653,819 69.6 0.6% 9.4% ¥ 1,377 ¥ 4,850 0.03 0.03 0.03 4.5x 4.3x 4.5x 8.4x 7.9x 7.9x 3.7x 3.6x 3.5xNLC INDIA (NEYVELILIG-NSEI) � 77.30 0.82 1,529 � 118,158 0.3 0.1% 9.9% � 115,109 � 236,439SOUTHGOBI RESOURCES (SGQ-T) C$ 0.15 (0.51) 273 C$ 40 0.0 0.0% 4.2% C$ 124 C$ 166BUKIT ASAM (PTBA-JKSE) ¥ 4,050 ¥ 4,773 17.8% 1.06 11,521 ¥ 46,658,670 38.9 2.1% 10.2% ¥ 973,503 ¥ 42,671,909 526.74 491.11 467.16 7.7x 8.2x 8.7x 8.9x 8.4x 8.8x 5.8x 5.4x 5.7xGroup Average - Sundry Companies Avg. -> 6.1x 6.3x 6.6x 6.7x 6.3x 6.3x 4.4x 4.3x 4.4xAll data sourced from Bloomberg
EV/EBITDAP/EPSCFPS (LoC) P/CFPS
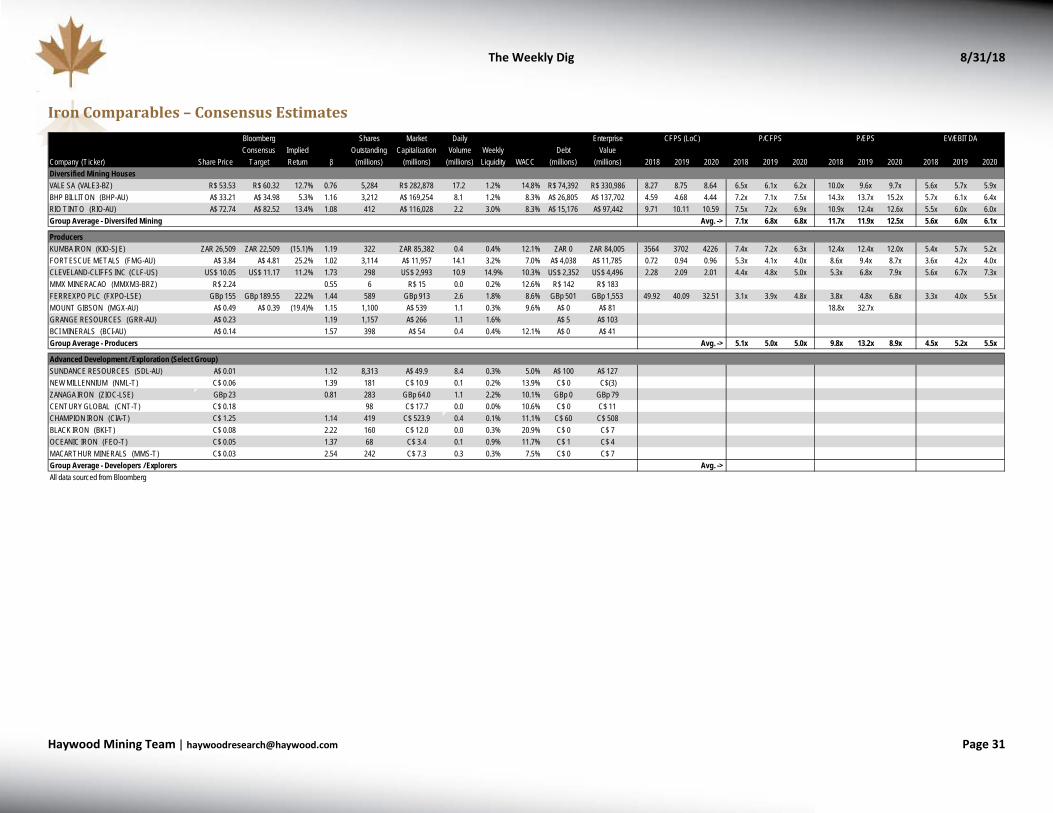
The Weekly Dig 8/31/18
Haywood Mining [email protected] Page 31
Iron Comparables – Consensus Estimates
Bloomberg Shares Market Daily Enterprise
Company (T icker) Share PriceConsensus
TargetImplied Return β
Outstanding (millions)
Capitalization (millions)
Volume (millions)
Weekly Liquidity WACC
Debt (millions)
Value (millions) 2018 2019 2020 2018 2019 2020 2018 2019 2020 2018 2019 2020
Diversified Mining HousesVALE SA (VALE3-BZ) R$ 53.53 R$ 60.32 12.7% 0.76 5,284 R$ 282,878 17.2 1.2% 14.8% R$ 74,392 R$ 330,986 8.27 8.75 8.64 6.5x 6.1x 6.2x 10.0x 9.6x 9.7x 5.6x 5.7x 5.9xBHP BILLITON (BHP-AU) A$ 33.21 A$ 34.98 5.3% 1.16 3,212 A$ 169,254 8.1 1.2% 8.3% A$ 26,805 A$ 137,702 4.59 4.68 4.44 7.2x 7.1x 7.5x 14.3x 13.7x 15.2x 5.7x 6.1x 6.4xRIO TINTO (RIO-AU) A$ 72.74 A$ 82.52 13.4% 1.08 412 A$ 116,028 2.2 3.0% 8.3% A$ 15,176 A$ 97,442 9.71 10.11 10.59 7.5x 7.2x 6.9x 10.9x 12.4x 12.6x 5.5x 6.0x 6.0xGroup Average - Diversifed Mining Avg. -> 7.1x 6.8x 6.8x 11.7x 11.9x 12.5x 5.6x 6.0x 6.1x
ProducersKUMBA IRON (KIO-SJE) ZAR 26,509 ZAR 22,509 (15.1)% 1.19 322 ZAR 85,382 0.4 0.4% 12.1% ZAR 0 ZAR 84,005 3564 3702 4226 7.4x 7.2x 6.3x 12.4x 12.4x 12.0x 5.4x 5.7x 5.2xFORTESCUE METALS (FMG-AU) A$ 3.84 A$ 4.81 25.2% 1.02 3,114 A$ 11,957 14.1 3.2% 7.0% A$ 4,038 A$ 11,785 0.72 0.94 0.96 5.3x 4.1x 4.0x 8.6x 9.4x 8.7x 3.6x 4.2x 4.0xCLEVELAND-CLIFFS INC (CLF-US) US$ 10.05 US$ 11.17 11.2% 1.73 298 US$ 2,993 10.9 14.9% 10.3% US$ 2,352 US$ 4,496 2.28 2.09 2.01 4.4x 4.8x 5.0x 5.3x 6.8x 7.9x 5.6x 6.7x 7.3xMMX MINERACAO (MMXM3-BRZ) R$ 2.24 0.55 6 R$ 15 0.0 0.2% 12.6% R$ 142 R$ 183 FERREXPO PLC (FXPO-LSE) GBp 155 GBp 189.55 22.2% 1.44 589 GBp 913 2.6 1.8% 8.6% GBp 501 GBp 1,553 49.92 40.09 32.51 3.1x 3.9x 4.8x 3.8x 4.8x 6.8x 3.3x 4.0x 5.5xMOUNT GIBSON (MGX-AU) A$ 0.49 A$ 0.39 (19.4)% 1.15 1,100 A$ 539 1.1 0.3% 9.6% A$ 0 A$ 81 18.8x 32.7xGRANGE RESOURCES (GRR-AU) A$ 0.23 1.19 1,157 A$ 266 1.1 1.6% A$ 5 A$ 103 BCI MINERALS (BCI-AU) A$ 0.14 1.57 398 A$ 54 0.4 0.4% 12.1% A$ 0 A$ 41 Group Average - Producers Avg. -> 5.1x 5.0x 5.0x 9.8x 13.2x 8.9x 4.5x 5.2x 5.5x
Advanced Development / Exploration (Select Group)SUNDANCE RESOURCES (SDL-AU) A$ 0.01 1.12 8,313 A$ 49.9 8.4 0.3% 5.0% A$ 100 A$ 127 NEW MILLENNIUM (NML-T) C$ 0.06 1.39 181 C$ 10.9 0.1 0.2% 13.9% C$ 0 C$(3)ZANAGA IRON (ZIOC-LSE) GBp 23 0.81 283 GBp 64.0 1.1 2.2% 10.1% GBp 0 GBp 79 CENTURY GLOBAL (CNT-T) C$ 0.18 98 C$ 17.7 0.0 0.0% 10.6% C$ 0 C$ 11 CHAMPION IRON (CIA-T) C$ 1.25 1.14 419 C$ 523.9 0.4 0.1% 11.1% C$ 60 C$ 508 BLACK IRON (BKI-T) C$ 0.08 2.22 160 C$ 12.0 0.0 0.3% 20.9% C$ 0 C$ 7 OCEANIC IRON (FEO-T) C$ 0.05 1.37 68 C$ 3.4 0.1 0.9% 11.7% C$ 1 C$ 4 MACARTHUR MINERALS (MMS-T) C$ 0.03 2.54 242 C$ 7.3 0.3 0.3% 7.5% C$ 0 C$ 7 Group Average - Developers / Explorers Avg. ->All data sourced from Bloomberg
EV/EBITDAP/EPSCFPS (LoC) P/CFPS
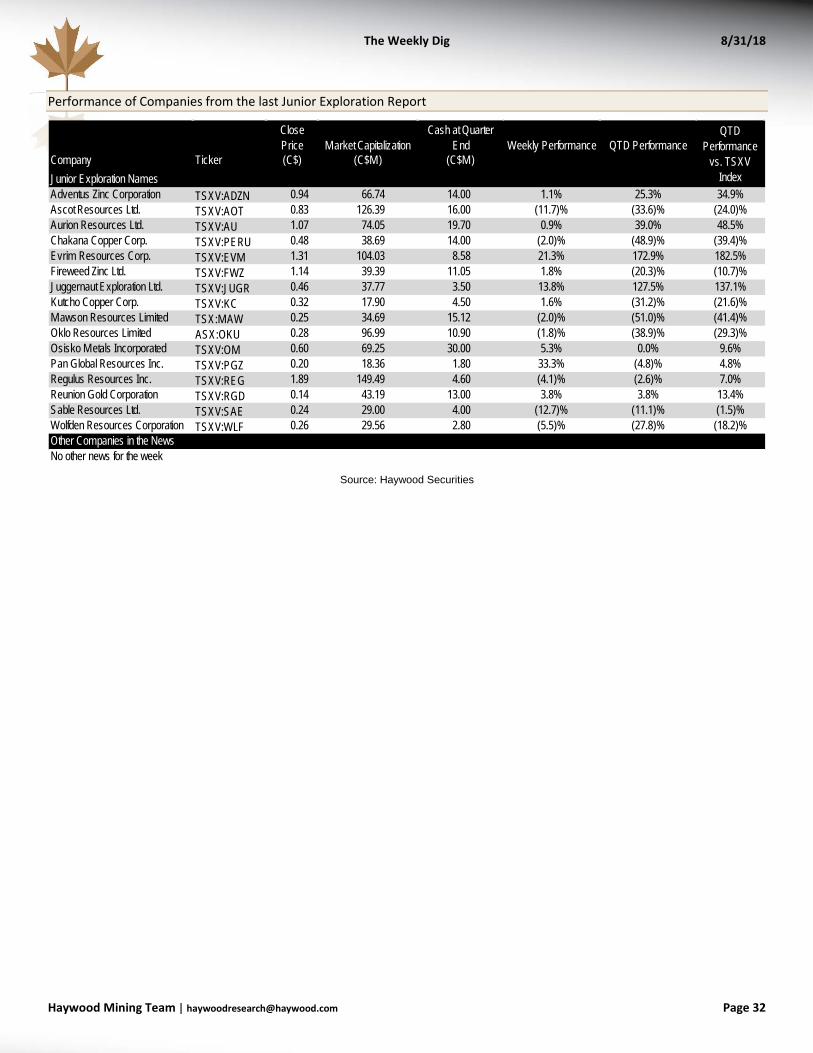
The Weekly Dig 8/31/18
Haywood Mining [email protected] Page 32
Performance of Companies from the last Junior Exploration Report
Source: Haywood Securities
Close Price Market Capitalization
Cash at Quarter End Weekly Performance QTD Performance
Company Ticker (C$) (C$M) (C$M)Junior Exploration Names Adventus Zinc Corporation TSXV:ADZN 0.94 66.74 14.00 1.1% 25.3% 34.9%Ascot Resources Ltd. TSXV:AOT 0.83 126.39 16.00 (11.7)% (33.6)% (24.0)%Aurion Resources Ltd. TSXV:AU 1.07 74.05 19.70 0.9% 39.0% 48.5%Chakana Copper Corp. TSXV:PERU 0.48 38.69 14.00 (2.0)% (48.9)% (39.4)%Evrim Resources Corp. TSXV:EVM 1.31 104.03 8.58 21.3% 172.9% 182.5%Fireweed Zinc Ltd. TSXV:FWZ 1.14 39.39 11.05 1.8% (20.3)% (10.7)%Juggernaut Exploration Ltd. TSXV:JUGR 0.46 37.77 3.50 13.8% 127.5% 137.1%Kutcho Copper Corp. TSXV:KC 0.32 17.90 4.50 1.6% (31.2)% (21.6)%Mawson Resources Limited TSX:MAW 0.25 34.69 15.12 (2.0)% (51.0)% (41.4)%Oklo Resources Limited ASX:OKU 0.28 96.99 10.90 (1.8)% (38.9)% (29.3)%Osisko Metals Incorporated TSXV:OM 0.60 69.25 30.00 5.3% 0.0% 9.6%Pan Global Resources Inc. TSXV:PGZ 0.20 18.36 1.80 33.3% (4.8)% 4.8%Regulus Resources Inc. TSXV:REG 1.89 149.49 4.60 (4.1)% (2.6)% 7.0%Reunion Gold Corporation TSXV:RGD 0.14 43.19 13.00 3.8% 3.8% 13.4%Sable Resources Ltd. TSXV:SAE 0.24 29.00 4.00 (12.7)% (11.1)% (1.5)%Wolfden Resources Corporation TSXV:WLF 0.26 29.56 2.80 (5.5)% (27.8)% (18.2)%Other Companies in the News No other news for the week
QTD Performance
vs. TSXV Index
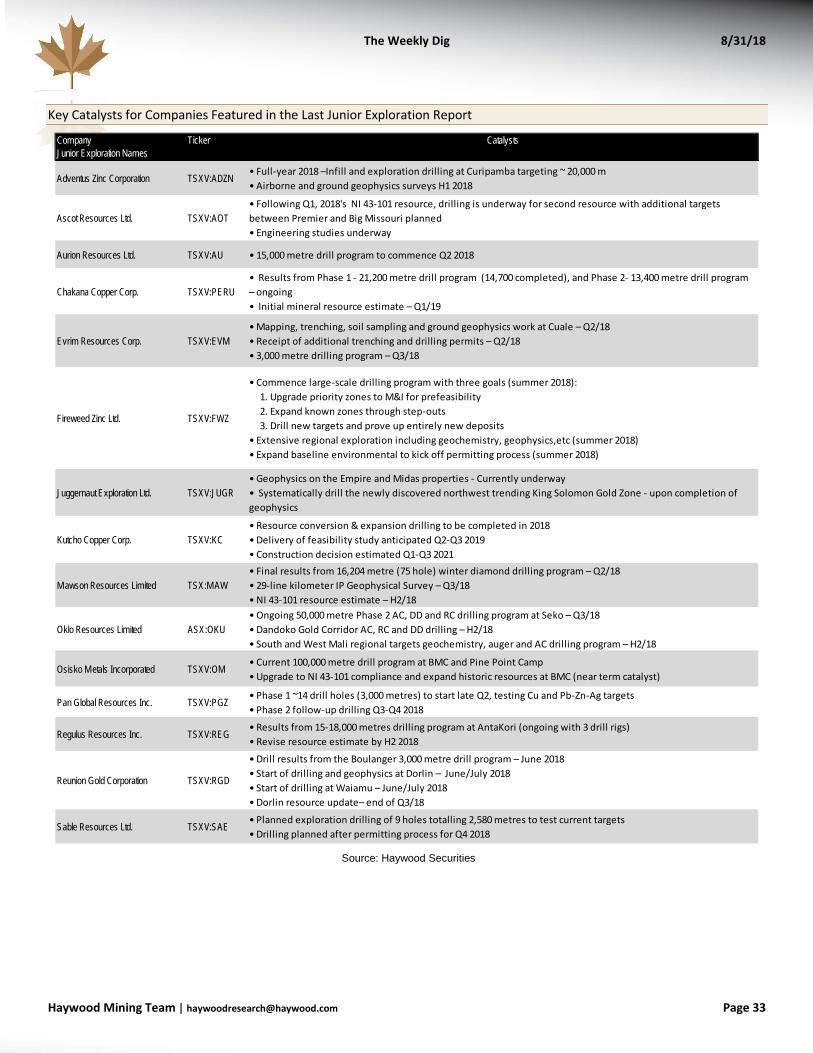
The Weekly Dig 8/31/18
Haywood Mining [email protected] Page 33
Key Catalysts for Companies Featured in the Last Junior Exploration Report
Source: Haywood Securities
Company Ticker CatalystsJunior Exploration Names
Adventus Zinc Corporation TSXV:ADZN• Full-year 2018 –Infill and exploration drilling at Curipamba targeting ~ 20,000 m • Airborne and ground geophysics surveys H1 2018
Ascot Resources Ltd. TSXV:AOT• Following Q1, 2018's NI 43-101 resource, drilling is underway for second resource with additional targets between Premier and Big Missouri planned• Engineering studies underway
Aurion Resources Ltd. TSXV:AU • 15,000 metre drill program to commence Q2 2018
Chakana Copper Corp. TSXV:PERU• Results from Phase 1 - 21,200 metre drill program (14,700 completed), and Phase 2- 13,400 metre drill program – ongoing• Initial mineral resource estimate – Q1/19
Evrim Resources Corp. TSXV:EVM• Mapping, trenching, soil sampling and ground geophysics work at Cuale – Q2/18• Receipt of additional trenching and drilling permits – Q2/18• 3,000 metre drilling program – Q3/18
Fireweed Zinc Ltd. TSXV:FWZ
• Commence large-scale drilling program with three goals (summer 2018): 1. Upgrade priority zones to M&I for prefeasibility 2. Expand known zones through step-outs 3. Drill new targets and prove up entirely new deposits• Extensive regional exploration including geochemistry, geophysics,etc (summer 2018)• Expand baseline environmental to kick off permitting process (summer 2018)
Juggernaut Exploration Ltd. TSXV:JUGR• Geophysics on the Empire and Midas properties - Currently underway • Systematically drill the newly discovered northwest trending King Solomon Gold Zone - upon completion of geophysics
Kutcho Copper Corp. TSXV:KC• Resource conversion & expansion drilling to be completed in 2018• Delivery of feasibility study anticipated Q2-Q3 2019• Construction decision estimated Q1-Q3 2021
Mawson Resources Limited TSX:MAW• Final results from 16,204 metre (75 hole) winter diamond drilling program – Q2/18• 29-line kilometer IP Geophysical Survey – Q3/18• NI 43-101 resource estimate – H2/18
Oklo Resources Limited ASX:OKU• Ongoing 50,000 metre Phase 2 AC, DD and RC drilling program at Seko – Q3/18• Dandoko Gold Corridor AC, RC and DD drilling – H2/18• South and West Mali regional targets geochemistry, auger and AC drilling program – H2/18
Osisko Metals Incorporated TSXV:OM• Current 100,000 metre drill program at BMC and Pine Point Camp• Upgrade to NI 43-101 compliance and expand historic resources at BMC (near term catalyst)
Pan Global Resources Inc. TSXV:PGZ• Phase 1 ~14 drill holes (3,000 metres) to start late Q2, testing Cu and Pb-Zn-Ag targets• Phase 2 follow-up drilling Q3-Q4 2018
Regulus Resources Inc. TSXV:REG• Results from 15-18,000 metres drilling program at AntaKori (ongoing with 3 drill rigs)• Revise resource estimate by H2 2018
Reunion Gold Corporation TSXV:RGD
• Drill results from the Boulanger 3,000 metre drill program – June 2018 • Start of drilling and geophysics at Dorlin – June/July 2018 • Start of drilling at Waiamu – June/July 2018 • Dorlin resource update– end of Q3/18
Sable Resources Ltd. TSXV:SAE• Planned exploration drilling of 9 holes totalling 2,580 metres to test current targets • Drilling planned after permitting process for Q4 2018
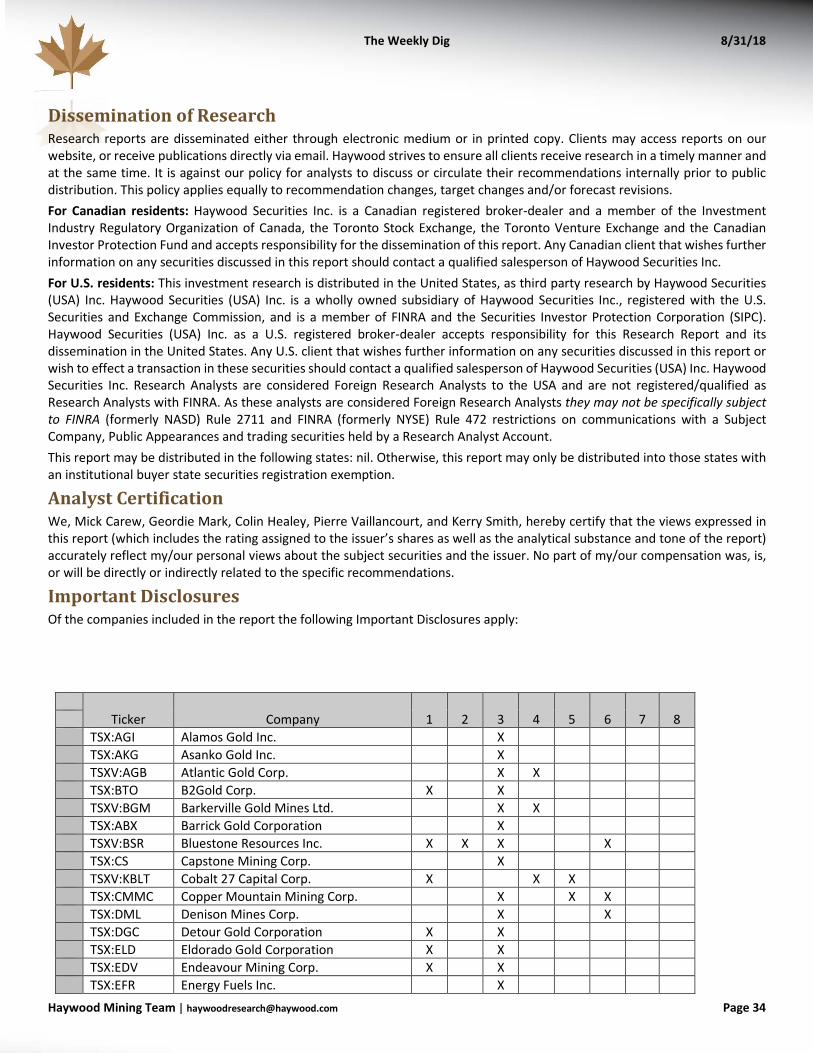
The Weekly Dig 8/31/18
Haywood Mining [email protected] Page 34
Dissemination of Research Research reports are disseminated either through electronic medium or in printed copy. Clients may access reports on our website, or receive publications directly via email. Haywood strives to ensure all clients receive research in a timely manner and at the same time. It is against our policy for analysts to discuss or circulate their recommendations internally prior to public distribution. This policy applies equally to recommendation changes, target changes and/or forecast revisions. For Canadian residents: Haywood Securities Inc. is a Canadian registered broker-dealer and a member of the Investment Industry Regulatory Organization of Canada, the Toronto Stock Exchange, the Toronto Venture Exchange and the Canadian Investor Protection Fund and accepts responsibility for the dissemination of this report. Any Canadian client that wishes further information on any securities discussed in this report should contact a qualified salesperson of Haywood Securities Inc. For U.S. residents: This investment research is distributed in the United States, as third party research by Haywood Securities (USA) Inc. Haywood Securities (USA) Inc. is a wholly owned subsidiary of Haywood Securities Inc., registered with the U.S. Securities and Exchange Commission, and is a member of FINRA and the Securities Investor Protection Corporation (SIPC). Haywood Securities (USA) Inc. as a U.S. registered broker-dealer accepts responsibility for this Research Report and its dissemination in the United States. Any U.S. client that wishes further information on any securities discussed in this report or wish to effect a transaction in these securities should contact a qualified salesperson of Haywood Securities (USA) Inc. Haywood Securities Inc. Research Analysts are considered Foreign Research Analysts to the USA and are not registered/qualified as Research Analysts with FINRA. As these analysts are considered Foreign Research Analysts they may not be specifically subject to FINRA (formerly NASD) Rule 2711 and FINRA (formerly NYSE) Rule 472 restrictions on communications with a Subject Company, Public Appearances and trading securities held by a Research Analyst Account. This report may be distributed in the following states: nil. Otherwise, this report may only be distributed into those states with an institutional buyer state securities registration exemption.
Analyst Certification We, Mick Carew, Geordie Mark, Colin Healey, Pierre Vaillancourt, and Kerry Smith, hereby certify that the views expressed in this report (which includes the rating assigned to the issuer’s shares as well as the analytical substance and tone of the report) accurately reflect my/our personal views about the subject securities and the issuer. No part of my/our compensation was, is, or will be directly or indirectly related to the specific recommendations.
Important Disclosures Of the companies included in the report the following Important Disclosures apply:
Ticker Company 1 2 3 4 5 6 7 8
TSX:AGI Alamos Gold Inc. X TSX:AKG Asanko Gold Inc. X TSXV:AGB Atlantic Gold Corp. X X TSX:BTO B2Gold Corp. X X TSXV:BGM Barkerville Gold Mines Ltd. X X TSX:ABX Barrick Gold Corporation X TSXV:BSR Bluestone Resources Inc. X X X X TSX:CS Capstone Mining Corp. X TSXV:KBLT Cobalt 27 Capital Corp. X X X TSX:CMMC Copper Mountain Mining Corp. X X X TSX:DML Denison Mines Corp. X X TSX:DGC Detour Gold Corporation X X TSX:ELD Eldorado Gold Corporation X X TSX:EDV Endeavour Mining Corp. X X TSX:EFR Energy Fuels Inc. X
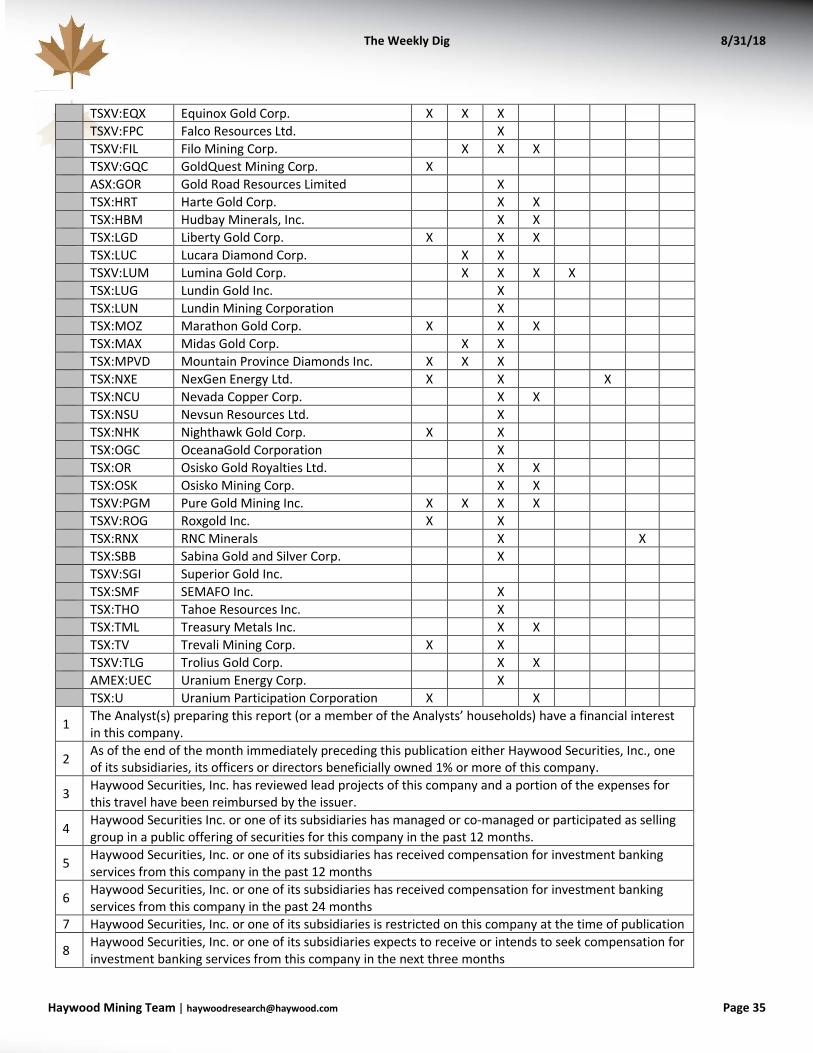
The Weekly Dig 8/31/18
Haywood Mining [email protected] Page 35
TSXV:EQX Equinox Gold Corp. X X X TSXV:FPC Falco Resources Ltd. X TSXV:FIL Filo Mining Corp. X X X TSXV:GQC GoldQuest Mining Corp. X ASX:GOR Gold Road Resources Limited X TSX:HRT Harte Gold Corp. X X TSX:HBM Hudbay Minerals, Inc. X X TSX:LGD Liberty Gold Corp. X X X TSX:LUC Lucara Diamond Corp. X X TSXV:LUM Lumina Gold Corp. X X X X TSX:LUG Lundin Gold Inc. X TSX:LUN Lundin Mining Corporation X TSX:MOZ Marathon Gold Corp. X X X TSX:MAX Midas Gold Corp. X X TSX:MPVD Mountain Province Diamonds Inc. X X X TSX:NXE NexGen Energy Ltd. X X X TSX:NCU Nevada Copper Corp. X X TSX:NSU Nevsun Resources Ltd. X TSX:NHK Nighthawk Gold Corp. X X TSX:OGC OceanaGold Corporation X TSX:OR Osisko Gold Royalties Ltd. X X TSX:OSK Osisko Mining Corp. X X TSXV:PGM Pure Gold Mining Inc. X X X X TSXV:ROG Roxgold Inc. X X TSX:RNX RNC Minerals X X TSX:SBB Sabina Gold and Silver Corp. X TSXV:SGI Superior Gold Inc. TSX:SMF SEMAFO Inc. X TSX:THO Tahoe Resources Inc. X TSX:TML Treasury Metals Inc. X X TSX:TV Trevali Mining Corp. X X TSXV:TLG Trolius Gold Corp. X X AMEX:UEC Uranium Energy Corp. X TSX:U Uranium Participation Corporation X X
1 The Analyst(s) preparing this report (or a member of the Analysts’ households) have a financial interest in this company.
2 As of the end of the month immediately preceding this publication either Haywood Securities, Inc., one of its subsidiaries, its officers or directors beneficially owned 1% or more of this company.
3 Haywood Securities, Inc. has reviewed lead projects of this company and a portion of the expenses for this travel have been reimbursed by the issuer.
4 Haywood Securities Inc. or one of its subsidiaries has managed or co-managed or participated as selling group in a public offering of securities for this company in the past 12 months.
5 Haywood Securities, Inc. or one of its subsidiaries has received compensation for investment banking services from this company in the past 12 months
6 Haywood Securities, Inc. or one of its subsidiaries has received compensation for investment banking services from this company in the past 24 months
7 Haywood Securities, Inc. or one of its subsidiaries is restricted on this company at the time of publication
8 Haywood Securities, Inc. or one of its subsidiaries expects to receive or intends to seek compensation for investment banking services from this company in the next three months
The Weekly Dig 8/31/18
Haywood Mining [email protected] Page 36
Other material conflict of interest of the research analyst of which the research analyst or Haywood Securities Inc. knows or has reason to know at the time of publication or at the time of public appearance:
n/a
Rating Structure Each company within an analyst’s universe, or group of companies covered, is assigned: (i) a recommendation or rating, usually BUY, HOLD, or SELL; (ii) a 12 month target price, which represents an analyst’s current assessment of a company’s potential stock price over the next year; (iii) an overall risk rating which represents an analyst’s assessment of the company’s overall investment risk; and (iv) specific risk ratings or risk profile parameters which in their aggregate support an analyst’s overall risk rating. These ratings are more fully explained below. Before acting on our recommendation we caution you to confer with your Haywood investment advisor to determine the suitability of our recommendation for your specific investment objectives, risk tolerance and investment time horizon.
Recommendation Rating BUY –The analyst believes that the security will outperform other companies in their sector on a risk adjusted basis or for the reasons stated in the research report the analyst believes that the security is deserving of a (continued) BUY rating. HOLD – The analyst believes that the security is expected to perform in line with other companies in their sector on a risk adjusted basis or for the reasons stated in the research report the analyst believes that the security is deserving of a (continued) HOLD rating. SELL – Investors are advised to sell the security or hold alternative securities within the sector. Stocks in this category are expected to under-perform other companies on a risk adjusted basis or for the reasons stated in the research report the analyst believes that the security is deserving of a (continued) SELL rating. TENDER – The analyst is recommending that investors tender to a specific offering for the company’s stock. RESEARCH COMMENT – An analyst comment about an issuer event that does not include a rating or recommendation. UNDER REVIEW – Placing a stock Under Review does not revise the current rating or recommendation of the analyst. A stock will be placed Under Review when the relevant company has a significant material event with further information pending or to be announced. An analyst will place a stock Under Review while he/she awaits sufficient information to re-evaluate the company’s financial situation. COVERAGE DROPPED – Haywood Securities will no longer cover the issuer. Haywood will provide notice to clients whenever coverage of an issuer is discontinued. Haywood’s focus is to search for undervalued companies which analysts believe may achieve attractive risk-adjusted returns. This research coverage on potentially undervalued companies may result in an outweighed percentage of companies rated as BUY. Management regularly reviews rating and targets in all sectors to ensure fairness and accuracy. For further information on Haywood Securities’ research dissemination policies, please visit: http://haywood.com/what-we-offer/research/research-policy
Overall Risk Rating Very High Risk: Venture type companies or more established micro, small, mid or large cap companies whose risk profile parameters and/or lack of liquidity warrant such a designation. These companies are only appropriate for investors who have a very high tolerance for risk and volatility and who are capable of incurring temporary or permanent loss of a very significant portion of their investment capital. High Risk: Typically micro or small cap companies which have an above average investment risk relative to more established or mid to large cap companies. These companies will generally not form part of the broad senior stock market indices and often will have less liquidity than more established mid and large cap companies. These companies are only appropriate for investors who have a high tolerance for risk and volatility and who are capable of incurring a temporary or permanent loss of a significant loss of their investment capital. Medium-High Risk: Typically mid to large cap companies that have a medium to high investment risk. These companies will often form part of the broader senior stock market indices or sector specific indices. These companies are only appropriate for investors who have a medium to high tolerance for risk and volatility and who are prepared to accept general stock market risk including the risk of a temporary or permanent loss of some of their investment capital.
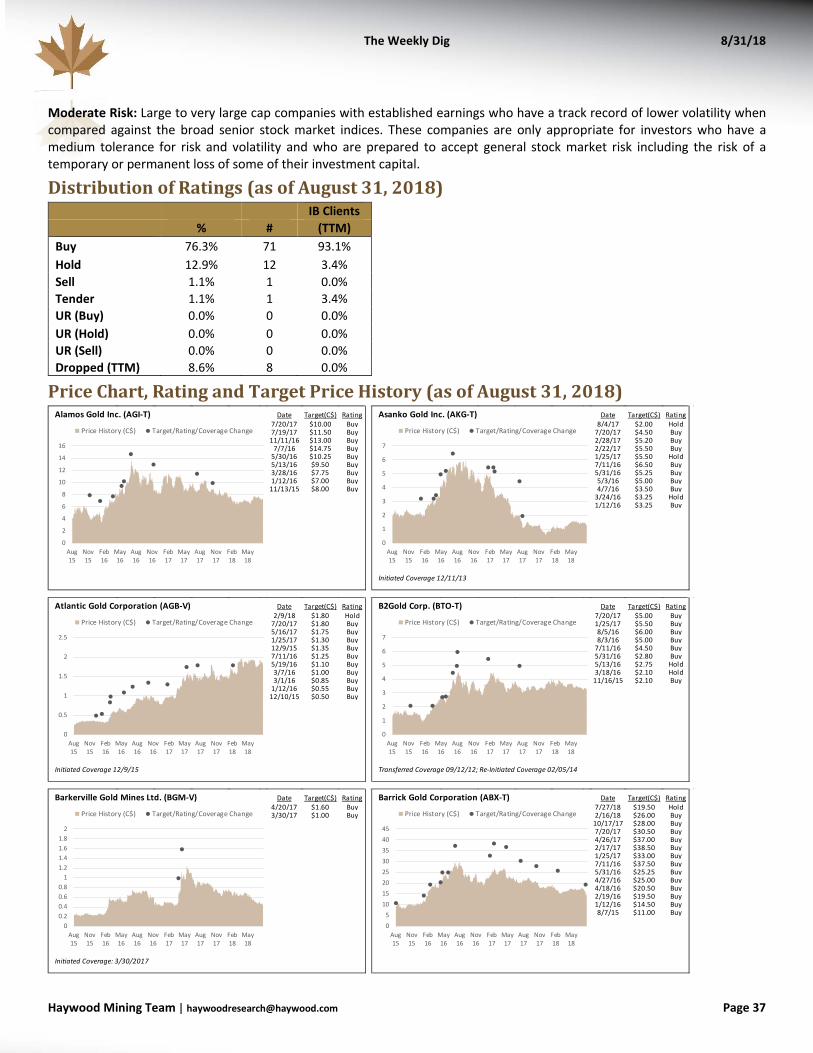
The Weekly Dig 8/31/18
Haywood Mining [email protected] Page 37
Moderate Risk: Large to very large cap companies with established earnings who have a track record of lower volatility when compared against the broad senior stock market indices. These companies are only appropriate for investors who have a medium tolerance for risk and volatility and who are prepared to accept general stock market risk including the risk of a temporary or permanent loss of some of their investment capital.
Distribution of Ratings (as of August 31, 2018) IB Clients
% # (TTM) Buy 76.3% 71 93.1% Hold 12.9% 12 3.4% Sell 1.1% 1 0.0% Tender 1.1% 1 3.4% UR (Buy) 0.0% 0 0.0% UR (Hold) 0.0% 0 0.0% UR (Sell) 0.0% 0 0.0% Dropped (TTM) 8.6% 8 0.0%
Price Chart, Rating and Target Price History (as of August 31, 2018) Alamos Gold Inc. (AGI-T) Date Target(C$) Rating
7/20/17 $10.00 Buy7/19/17 $11.50 Buy
11/11/16 $13.00 Buy7/7/16 $14.75 Buy
5/30/16 $10.25 Buy5/13/16 $9.50 Buy3/28/16 $7.75 Buy1/12/16 $7.00 Buy
11/13/15 $8.00 Buy
0
2
4
6
8
10
12
14
16
Aug15
Nov15
Feb16
May16
Aug16
Nov16
Feb17
May17
Aug17
Nov17
Feb18
May18
Price History (C$) Target/Rating/Coverage Change
Asanko Gold Inc. (AKG-T) Date Target(C$) Rating8/4/17 $2.00 Hold
7/20/17 $4.50 Buy2/28/17 $5.20 Buy2/22/17 $5.50 Buy1/25/17 $5.50 Hold7/11/16 $6.50 Buy5/31/16 $5.25 Buy5/3/16 $5.00 Buy4/7/16 $3.50 Buy
3/24/16 $3.25 Hold1/12/16 $3.25 Buy
Initiated Coverage 12/11/13
0
1
2
3
4
5
6
7
Aug15
Nov15
Feb16
May16
Aug16
Nov16
Feb17
May17
Aug17
Nov17
Feb18
May18
Price History (C$) Target/Rating/Coverage Change
Atlantic Gold Corporation (AGB-V) Date Target(C$) Rating2/9/18 $1.80 Hold
7/20/17 $1.80 Buy5/16/17 $1.75 Buy1/25/17 $1.30 Buy12/9/15 $1.35 Buy7/11/16 $1.25 Buy5/19/16 $1.10 Buy3/7/16 $1.00 Buy3/1/16 $0.85 Buy
1/12/16 $0.55 Buy12/10/15 $0.50 Buy
Initiated Coverage 12/9/15
0
0.5
1
1.5
2
2.5
Aug15
Nov15
Feb16
May16
Aug16
Nov16
Feb17
May17
Aug17
Nov17
Feb18
May18
Price History (C$) Target/Rating/Coverage Change
B2Gold Corp. (BTO-T) Date Target(C$) Rating7/20/17 $5.00 Buy1/25/17 $5.50 Buy8/5/16 $6.00 Buy8/3/16 $5.00 Buy
7/11/16 $4.50 Buy5/31/16 $2.80 Buy5/13/16 $2.75 Hold3/18/16 $2.10 Hold
11/16/15 $2.10 Buy
Transferred Coverage 09/12/12; Re-Initiated Coverage 02/05/14
0
1
2
3
4
5
6
7
Aug15
Nov15
Feb16
May16
Aug16
Nov16
Feb17
May17
Aug17
Nov17
Feb18
May18
Price History (C$) Target/Rating/Coverage Change
Barkerville Gold Mines Ltd. (BGM-V) Date Target(C$) Rating4/20/17 $1.60 Buy3/30/17 $1.00 Buy
Initiated Coverage: 3/30/2017
00.20.40.60.8
11.21.41.61.8
2
Aug15
Nov15
Feb16
May16
Aug16
Nov16
Feb17
May17
Aug17
Nov17
Feb18
May18
Price History (C$) Target/Rating/Coverage Change
Barrick Gold Corporation (ABX-T) Date Target(C$) Rating7/27/18 $19.50 Hold2/16/18 $26.00 Buy
10/17/17 $28.00 Buy7/20/17 $30.50 Buy4/26/17 $37.00 Buy2/17/17 $38.50 Buy1/25/17 $33.00 Buy7/11/16 $37.50 Buy5/31/16 $25.25 Buy4/27/16 $25.00 Buy4/18/16 $20.50 Buy2/19/16 $19.50 Buy1/12/16 $14.50 Buy8/7/15 $11.00 Buy
05
1015202530354045
Aug15
Nov15
Feb16
May16
Aug16
Nov16
Feb17
May17
Aug17
Nov17
Feb18
May18
Price History (C$) Target/Rating/Coverage Change
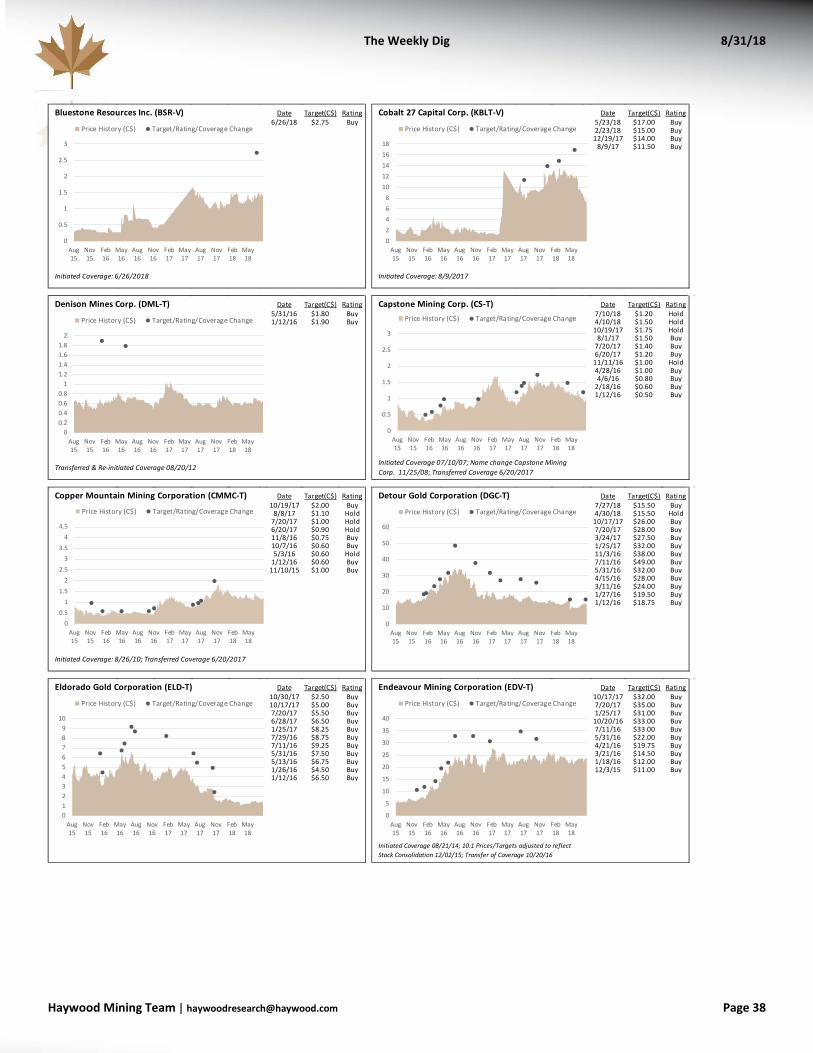
The Weekly Dig 8/31/18
Haywood Mining [email protected] Page 38
Bluestone Resources Inc. (BSR-V) Date Target(C$) Rating6/26/18 $2.75 Buy
Initiated Coverage: 6/26/2018
0
0.5
1
1.5
2
2.5
3
Aug15
Nov15
Feb16
May16
Aug16
Nov16
Feb17
May17
Aug17
Nov17
Feb18
May18
Price History (C$) Target/Rating/Coverage Change
Cobalt 27 Capital Corp. (KBLT-V) Date Target(C$) Rating5/23/18 $17.00 Buy2/23/18 $15.00 Buy
12/19/17 $14.00 Buy8/9/17 $11.50 Buy
Initiated Coverage: 8/9/2017
02468
1012141618
Aug15
Nov15
Feb16
May16
Aug16
Nov16
Feb17
May17
Aug17
Nov17
Feb18
May18
Price History (C$) Target/Rating/Coverage Change
Denison Mines Corp. (DML-T) Date Target(C$) Rating5/31/16 $1.80 Buy1/12/16 $1.90 Buy
Transferred & Re-initiated Coverage 08/20/12
00.20.40.60.8
11.21.41.61.8
2
Aug15
Nov15
Feb16
May16
Aug16
Nov16
Feb17
May17
Aug17
Nov17
Feb18
May18
Price History (C$) Target/Rating/Coverage Change
Capstone Mining Corp. (CS-T) Date Target(C$) Rating7/10/18 $1.20 Hold4/10/18 $1.50 Hold
10/19/17 $1.75 Hold8/1/17 $1.50 Buy
7/20/17 $1.40 Buy6/20/17 $1.20 Buy
11/11/16 $1.00 Hold4/28/16 $1.00 Buy4/6/16 $0.80 Buy
2/18/16 $0.60 Buy1/12/16 $0.50 Buy
Initiated Coverage 07/10/07; Name change Capstone Mining Corp. 11/25/08; Transferred Coverage 6/20/2017
0
0.5
1
1.5
2
2.5
3
Aug15
Nov15
Feb16
May16
Aug16
Nov16
Feb17
May17
Aug17
Nov17
Feb18
May18
Price History (C$) Target/Rating/Coverage Change
Copper Mountain Mining Corporation (CMMC-T) Date Target(C$) Rating10/19/17 $2.00 Buy
8/8/17 $1.10 Hold7/20/17 $1.00 Hold6/20/17 $0.90 Hold11/8/16 $0.75 Buy10/7/16 $0.60 Buy5/3/16 $0.60 Hold
1/12/16 $0.60 Buy11/10/15 $1.00 Buy
Initiated Coverage: 8/26/10; Transferred Coverage 6/20/2017
00.5
11.5
22.5
33.5
44.5
Aug15
Nov15
Feb16
May16
Aug16
Nov16
Feb17
May17
Aug17
Nov17
Feb18
May18
Price History (C$) Target/Rating/Coverage Change
Detour Gold Corporation (DGC-T) Date Target(C$) Rating7/27/18 $15.50 Buy4/30/18 $15.50 Hold
10/17/17 $26.00 Buy7/20/17 $28.00 Buy3/24/17 $27.50 Buy1/25/17 $32.00 Buy11/3/16 $38.00 Buy7/11/16 $49.00 Buy5/31/16 $32.00 Buy4/15/16 $28.00 Buy3/11/16 $24.00 Buy1/27/16 $19.50 Buy1/12/16 $18.75 Buy
0
10
20
30
40
50
60
Aug15
Nov15
Feb16
May16
Aug16
Nov16
Feb17
May17
Aug17
Nov17
Feb18
May18
Price History (C$) Target/Rating/Coverage Change
Eldorado Gold Corporation (ELD-T) Date Target(C$) Rating10/30/17 $2.50 Buy10/17/17 $5.00 Buy7/20/17 $5.50 Buy6/28/17 $6.50 Buy1/25/17 $8.25 Buy7/29/16 $8.75 Buy7/11/16 $9.25 Buy5/31/16 $7.50 Buy5/13/16 $6.75 Buy1/26/16 $4.50 Buy1/12/16 $6.50 Buy
0123456789
10
Aug15
Nov15
Feb16
May16
Aug16
Nov16
Feb17
May17
Aug17
Nov17
Feb18
May18
Price History (C$) Target/Rating/Coverage Change
Endeavour Mining Corporation (EDV-T) Date Target(C$) Rating10/17/17 $32.00 Buy7/20/17 $35.00 Buy1/25/17 $31.00 Buy
10/20/16 $33.00 Buy7/11/16 $33.00 Buy5/31/16 $22.00 Buy4/21/16 $19.75 Buy3/21/16 $14.50 Buy1/18/16 $12.00 Buy12/3/15 $11.00 Buy
Initiated Coverage 08/21/14; 10:1 Prices/Targets adjusted to reflect Stock Consolidation 12/02/15; Transfer of Coverage 10/20/16
0
5
10
15
20
25
30
35
40
Aug15
Nov15
Feb16
May16
Aug16
Nov16
Feb17
May17
Aug17
Nov17
Feb18
May18
Price History (C$) Target/Rating/Coverage Change
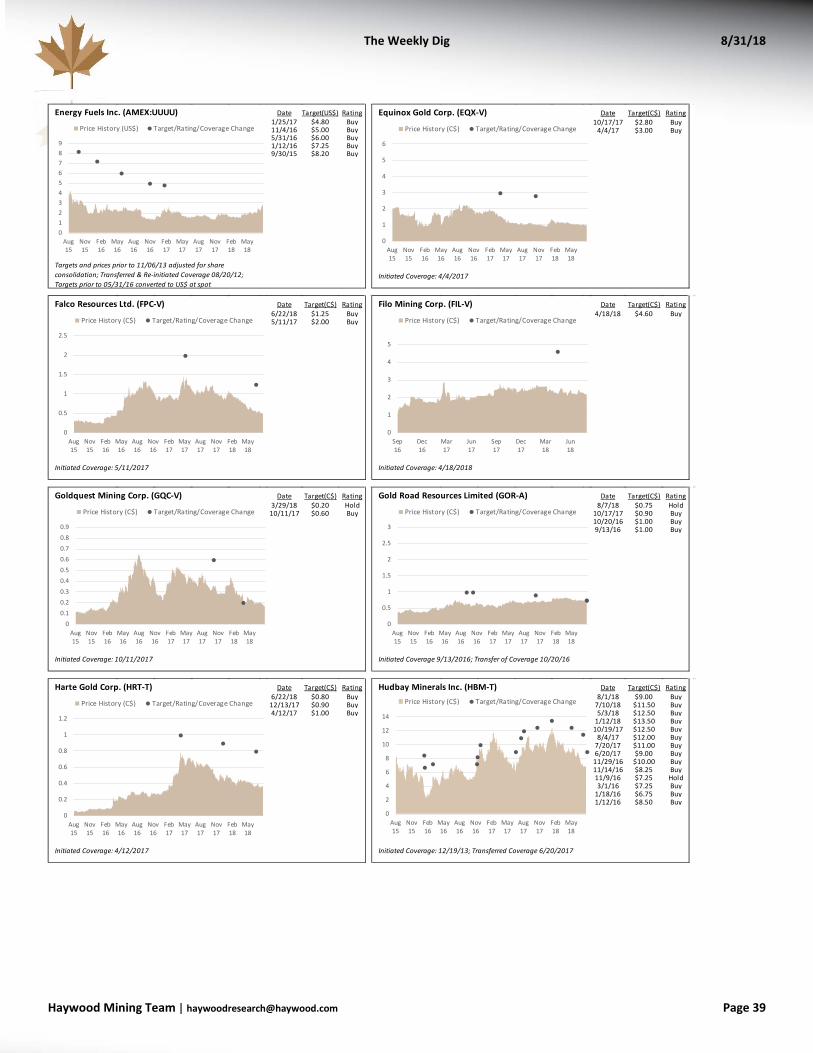
The Weekly Dig 8/31/18
Haywood Mining [email protected] Page 39
Energy Fuels Inc. (AMEX:UUUU) Date Target(US$) Rating1/25/17 $4.80 Buy11/4/16 $5.00 Buy5/31/16 $6.00 Buy1/12/16 $7.25 Buy9/30/15 $8.20 Buy
Targets and prices prior to 11/06/13 adjusted for share consolidation; Transferred & Re-initiated Coverage 08/20/12; Targets prior to 05/31/16 converted to US$ at spot
0123456789
Aug15
Nov15
Feb16
May16
Aug16
Nov16
Feb17
May17
Aug17
Nov17
Feb18
May18
Price History (US$) Target/Rating/Coverage Change
Equinox Gold Corp. (EQX-V) Date Target(C$) Rating10/17/17 $2.80 Buy
4/4/17 $3.00 Buy
Initiated Coverage: 4/4/2017
0
1
2
3
4
5
6
Aug15
Nov15
Feb16
May16
Aug16
Nov16
Feb17
May17
Aug17
Nov17
Feb18
May18
Price History (C$) Target/Rating/Coverage Change
Falco Resources Ltd. (FPC-V) Date Target(C$) Rating6/22/18 $1.25 Buy5/11/17 $2.00 Buy
Initiated Coverage: 5/11/2017
0
0.5
1
1.5
2
2.5
Aug15
Nov15
Feb16
May16
Aug16
Nov16
Feb17
May17
Aug17
Nov17
Feb18
May18
Price History (C$) Target/Rating/Coverage Change
Filo Mining Corp. (FIL-V) Date Target(C$) Rating4/18/18 $4.60 Buy
Initiated Coverage: 4/18/2018
0
1
2
3
4
5
Sep16
Dec16
Mar17
Jun17
Sep17
Dec17
Mar18
Jun18
Price History (C$) Target/Rating/Coverage Change
Goldquest Mining Corp. (GQC-V) Date Target(C$) Rating3/29/18 $0.20 Hold
10/11/17 $0.60 Buy
Initiated Coverage: 10/11/2017
00.10.20.30.40.50.60.70.80.9
Aug15
Nov15
Feb16
May16
Aug16
Nov16
Feb17
May17
Aug17
Nov17
Feb18
May18
Price History (C$) Target/Rating/Coverage Change
Gold Road Resources Limited (GOR-A) Date Target(C$) Rating8/7/18 $0.75 Hold
10/17/17 $0.90 Buy10/20/16 $1.00 Buy9/13/16 $1.00 Buy
Initiated Coverage 9/13/2016; Transfer of Coverage 10/20/16
0
0.5
1
1.5
2
2.5
3
Aug15
Nov15
Feb16
May16
Aug16
Nov16
Feb17
May17
Aug17
Nov17
Feb18
May18
Price History (C$) Target/Rating/Coverage Change
Harte Gold Corp. (HRT-T) Date Target(C$) Rating6/22/18 $0.80 Buy
12/13/17 $0.90 Buy4/12/17 $1.00 Buy
Initiated Coverage: 4/12/2017
0
0.2
0.4
0.6
0.8
1
1.2
Aug15
Nov15
Feb16
May16
Aug16
Nov16
Feb17
May17
Aug17
Nov17
Feb18
May18
Price History (C$) Target/Rating/Coverage Change
Hudbay Minerals Inc. (HBM-T) Date Target(C$) Rating8/1/18 $9.00 Buy
7/10/18 $11.50 Buy5/3/18 $12.50 Buy
1/12/18 $13.50 Buy10/19/17 $12.50 Buy
8/4/17 $12.00 Buy7/20/17 $11.00 Buy6/20/17 $9.00 Buy
11/29/16 $10.00 Buy11/14/16 $8.25 Buy11/9/16 $7.25 Hold3/1/16 $7.25 Buy
1/18/16 $6.75 Buy1/12/16 $8.50 Buy
Initiated Coverage: 12/19/13; Transferred Coverage 6/20/2017
0
2
4
6
8
10
12
14
Aug15
Nov15
Feb16
May16
Aug16
Nov16
Feb17
May17
Aug17
Nov17
Feb18
May18
Price History (C$) Target/Rating/Coverage Change
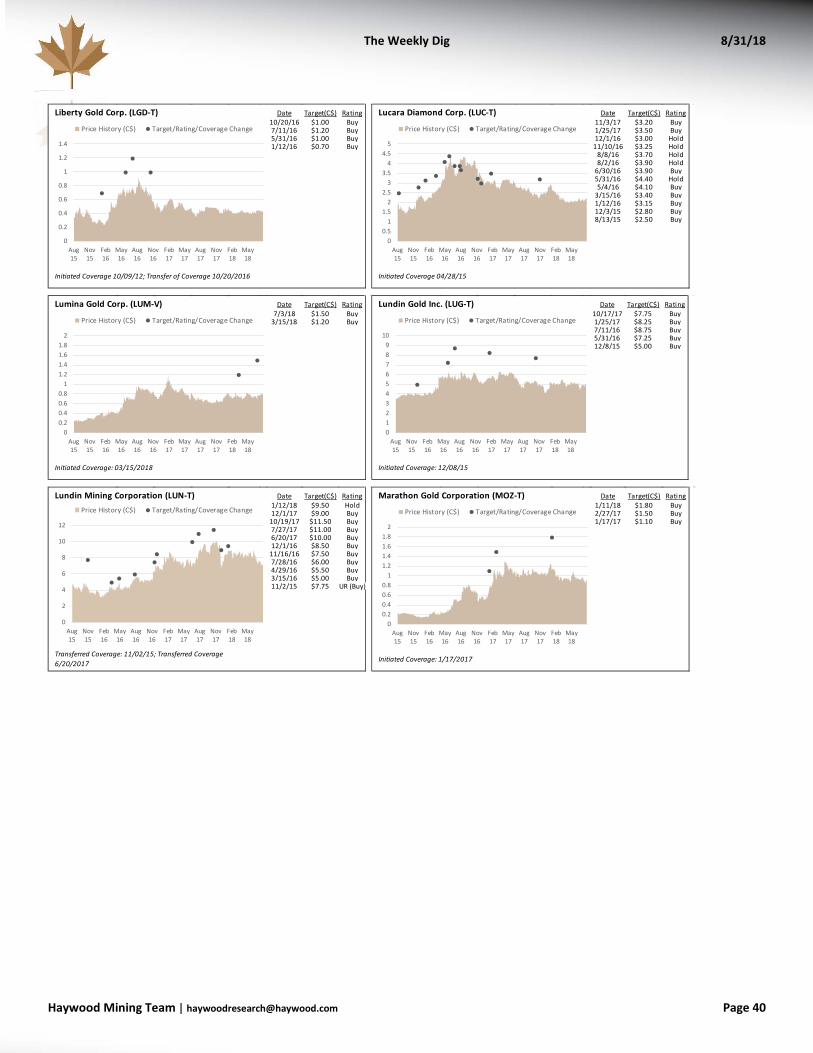
The Weekly Dig 8/31/18
Haywood Mining [email protected] Page 40
Liberty Gold Corp. (LGD-T) Date Target(C$) Rating10/20/16 $1.00 Buy7/11/16 $1.20 Buy5/31/16 $1.00 Buy1/12/16 $0.70 Buy
Initiated Coverage 10/09/12; Transfer of Coverage 10/20/2016
0
0.2
0.4
0.6
0.8
1
1.2
1.4
Aug15
Nov15
Feb16
May16
Aug16
Nov16
Feb17
May17
Aug17
Nov17
Feb18
May18
Price History (C$) Target/Rating/Coverage Change
Lucara Diamond Corp. (LUC-T) Date Target(C$) Rating11/3/17 $3.20 Buy1/25/17 $3.50 Buy12/1/16 $3.00 Hold
11/10/16 $3.25 Hold8/8/16 $3.70 Hold8/2/16 $3.90 Hold
6/30/16 $3.90 Buy5/31/16 $4.40 Hold5/4/16 $4.10 Buy
3/15/16 $3.40 Buy1/12/16 $3.15 Buy12/3/15 $2.80 Buy8/13/15 $2.50 Buy
Initiated Coverage 04/28/15
00.5
11.5
22.5
33.5
44.5
5
Aug15
Nov15
Feb16
May16
Aug16
Nov16
Feb17
May17
Aug17
Nov17
Feb18
May18
Price History (C$) Target/Rating/Coverage Change
Lumina Gold Corp. (LUM-V) Date Target(C$) Rating7/3/18 $1.50 Buy
3/15/18 $1.20 Buy
Initiated Coverage: 03/15/2018
00.20.40.60.8
11.21.41.61.8
2
Aug15
Nov15
Feb16
May16
Aug16
Nov16
Feb17
May17
Aug17
Nov17
Feb18
May18
Price History (C$) Target/Rating/Coverage Change
Lundin Gold Inc. (LUG-T) Date Target(C$) Rating10/17/17 $7.75 Buy1/25/17 $8.25 Buy7/11/16 $8.75 Buy5/31/16 $7.25 Buy12/8/15 $5.00 Buy
Initiated Coverage: 12/08/15
0123456789
10
Aug15
Nov15
Feb16
May16
Aug16
Nov16
Feb17
May17
Aug17
Nov17
Feb18
May18
Price History (C$) Target/Rating/Coverage Change
Lundin Mining Corporation (LUN-T) Date Target(C$) Rating1/12/18 $9.50 Hold12/1/17 $9.00 Buy
10/19/17 $11.50 Buy7/27/17 $11.00 Buy6/20/17 $10.00 Buy12/1/16 $8.50 Buy
11/16/16 $7.50 Buy7/28/16 $6.00 Buy4/29/16 $5.50 Buy3/15/16 $5.00 Buy11/2/15 $7.75 UR (Buy)
Transferred Coverage: 11/02/15; Transferred Coverage 6/20/2017
0
2
4
6
8
10
12
Aug15
Nov15
Feb16
May16
Aug16
Nov16
Feb17
May17
Aug17
Nov17
Feb18
May18
Price History (C$) Target/Rating/Coverage Change
Marathon Gold Corporation (MOZ-T) Date Target(C$) Rating1/11/18 $1.80 Buy2/27/17 $1.50 Buy1/17/17 $1.10 Buy
Initiated Coverage: 1/17/2017
00.20.40.60.8
11.21.41.61.8
2
Aug15
Nov15
Feb16
May16
Aug16
Nov16
Feb17
May17
Aug17
Nov17
Feb18
May18
Price History (C$) Target/Rating/Coverage Change
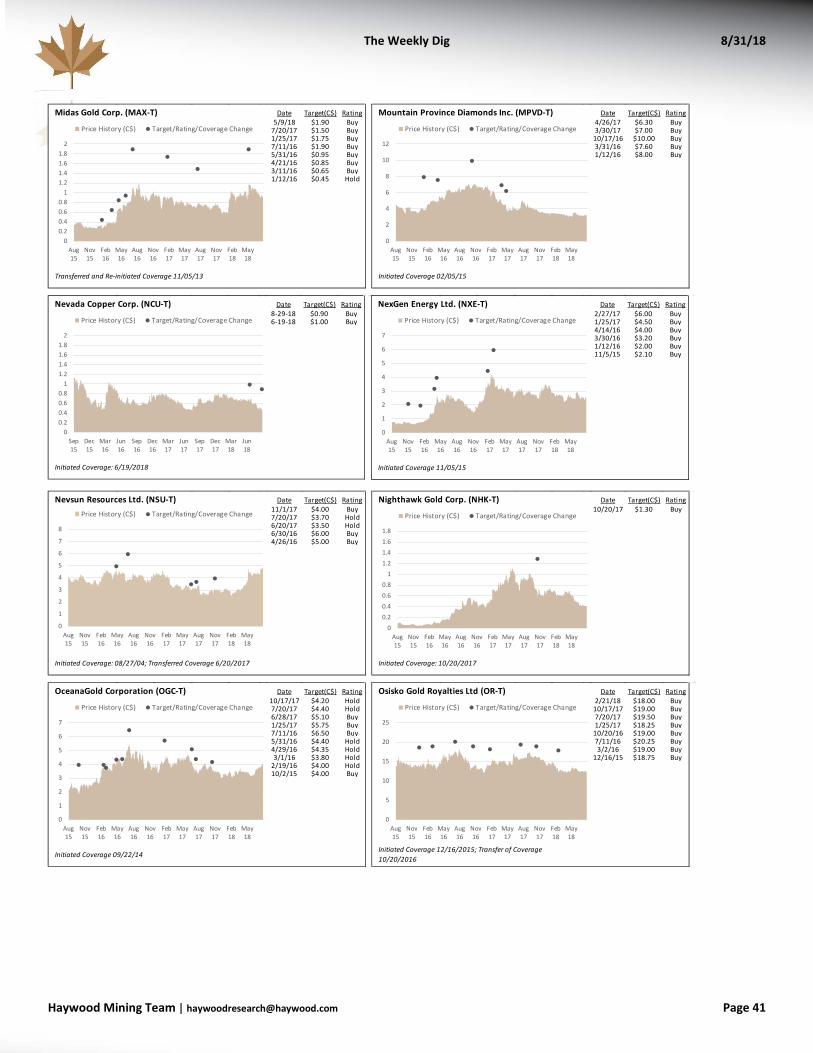
The Weekly Dig 8/31/18
Haywood Mining [email protected] Page 41
Midas Gold Corp. (MAX-T) Date Target(C$) Rating5/9/18 $1.90 Buy
7/20/17 $1.50 Buy1/25/17 $1.75 Buy7/11/16 $1.90 Buy5/31/16 $0.95 Buy4/21/16 $0.85 Buy3/11/16 $0.65 Buy1/12/16 $0.45 Hold
Transferred and Re-initiated Coverage 11/05/13
00.20.40.60.8
11.21.41.61.8
2
Aug15
Nov15
Feb16
May16
Aug16
Nov16
Feb17
May17
Aug17
Nov17
Feb18
May18
Price History (C$) Target/Rating/Coverage Change
Mountain Province Diamonds Inc. (MPVD-T) Date Target(C$) Rating4/26/17 $6.30 Buy3/30/17 $7.00 Buy
10/17/16 $10.00 Buy3/31/16 $7.60 Buy1/12/16 $8.00 Buy
Initiated Coverage 02/05/15
0
2
4
6
8
10
12
Aug15
Nov15
Feb16
May16
Aug16
Nov16
Feb17
May17
Aug17
Nov17
Feb18
May18
Price History (C$) Target/Rating/Coverage Change
Nevada Copper Corp. (NCU-T) Date Target(C$) Rating8-29-18 $0.90 Buy6-19-18 $1.00 Buy
Initiated Coverage: 6/19/2018
00.20.40.60.8
11.21.41.61.8
2
Sep15
Dec15
Mar16
Jun16
Sep16
Dec16
Mar17
Jun17
Sep17
Dec17
Mar18
Jun18
Price History (C$) Target/Rating/Coverage Change
NexGen Energy Ltd. (NXE-T) Date Target(C$) Rating2/27/17 $6.00 Buy1/25/17 $4.50 Buy4/14/16 $4.00 Buy3/30/16 $3.20 Buy1/12/16 $2.00 Buy11/5/15 $2.10 Buy
Initiated Coverage 11/05/15
0
1
2
3
4
5
6
7
Aug15
Nov15
Feb16
May16
Aug16
Nov16
Feb17
May17
Aug17
Nov17
Feb18
May18
Price History (C$) Target/Rating/Coverage Change
Nevsun Resources Ltd. (NSU-T) Date Target(C$) Rating11/1/17 $4.00 Buy7/20/17 $3.70 Hold6/20/17 $3.50 Hold6/30/16 $6.00 Buy4/26/16 $5.00 Buy
Initiated Coverage: 08/27/04; Transferred Coverage 6/20/2017
0
1
2
3
4
5
6
7
8
Aug15
Nov15
Feb16
May16
Aug16
Nov16
Feb17
May17
Aug17
Nov17
Feb18
May18
Price History (C$) Target/Rating/Coverage Change
Nighthawk Gold Corp. (NHK-T) Date Target(C$) Rating10/20/17 $1.30 Buy
Initiated Coverage: 10/20/2017
00.20.40.60.8
11.21.41.61.8
Aug15
Nov15
Feb16
May16
Aug16
Nov16
Feb17
May17
Aug17
Nov17
Feb18
May18
Price History (C$) Target/Rating/Coverage Change
OceanaGold Corporation (OGC-T) Date Target(C$) Rating10/17/17 $4.20 Hold7/20/17 $4.40 Hold6/28/17 $5.10 Buy1/25/17 $5.75 Buy7/11/16 $6.50 Buy5/31/16 $4.40 Hold4/29/16 $4.35 Hold3/1/16 $3.80 Hold
2/19/16 $4.00 Hold10/2/15 $4.00 Buy
Initiated Coverage 09/22/14
0
1
2
3
4
5
6
7
Aug15
Nov15
Feb16
May16
Aug16
Nov16
Feb17
May17
Aug17
Nov17
Feb18
May18
Price History (C$) Target/Rating/Coverage Change
Osisko Gold Royalties Ltd (OR-T) Date Target(C$) Rating2/21/18 $18.00 Buy
10/17/17 $19.00 Buy7/20/17 $19.50 Buy1/25/17 $18.25 Buy
10/20/16 $19.00 Buy7/11/16 $20.25 Buy3/2/16 $19.00 Buy
12/16/15 $18.75 Buy
Initiated Coverage 12/16/2015; Transfer of Coverage 10/20/2016
0
5
10
15
20
25
Aug15
Nov15
Feb16
May16
Aug16
Nov16
Feb17
May17
Aug17
Nov17
Feb18
May18
Price History (C$) Target/Rating/Coverage Change
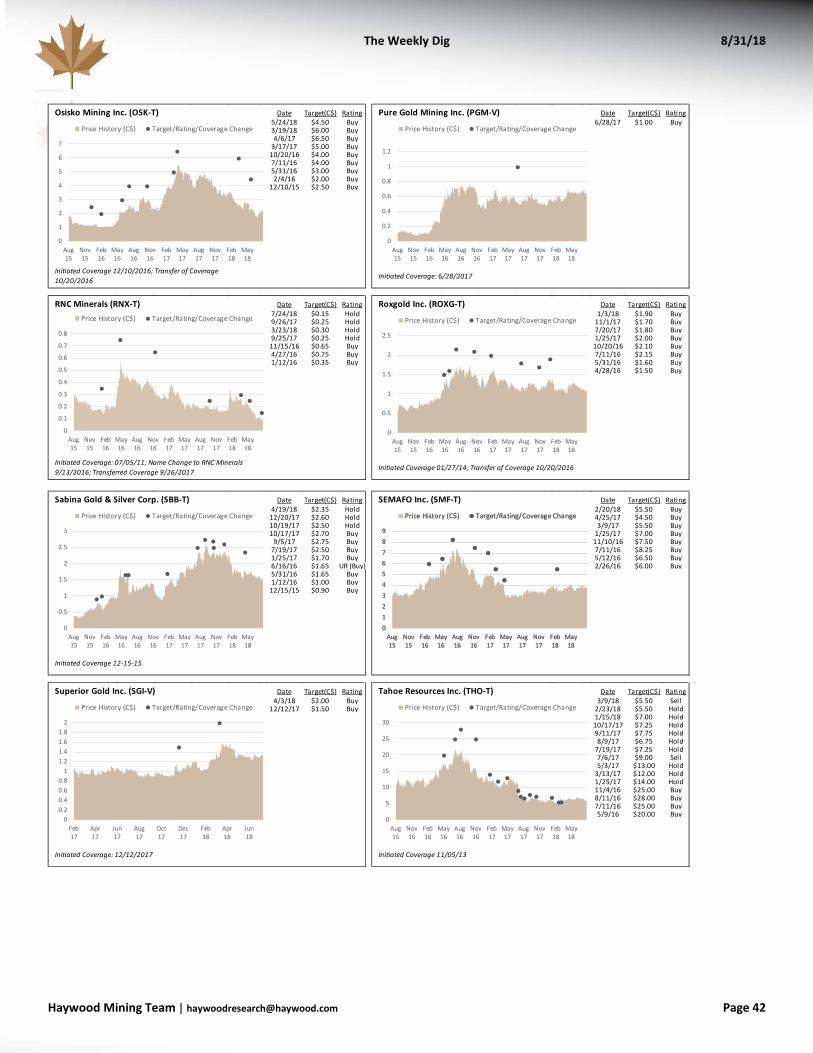
The Weekly Dig 8/31/18
Haywood Mining [email protected] Page 42
Osisko Mining Inc. (OSK-T) Date Target(C$) Rating5/24/18 $4.50 Buy3/19/18 $6.00 Buy4/6/17 $6.50 Buy
3/17/17 $5.00 Buy10/20/16 $4.00 Buy7/11/16 $4.00 Buy5/31/16 $3.00 Buy2/4/16 $2.00 Buy
12/10/15 $2.50 Buy
Initiated Coverage 12/10/2016; Transfer of Coverage 10/20/2016
0
1
2
3
4
5
6
7
Aug15
Nov15
Feb16
May16
Aug16
Nov16
Feb17
May17
Aug17
Nov17
Feb18
May18
Price History (C$) Target/Rating/Coverage Change
Pure Gold Mining Inc. (PGM-V) Date Target(C$) Rating6/28/17 $1.00 Buy
Initiated Coverage: 6/28/2017
0
0.2
0.4
0.6
0.8
1
1.2
Aug15
Nov15
Feb16
May16
Aug16
Nov16
Feb17
May17
Aug17
Nov17
Feb18
May18
Price History (C$) Target/Rating/Coverage Change
RNC Minerals (RNX-T) Date Target(C$) Rating7/24/18 $0.15 Hold9/26/17 $0.25 Hold3/23/18 $0.30 Hold9/25/17 $0.25 Hold
11/15/16 $0.65 Buy4/27/16 $0.75 Buy1/12/16 $0.35 Buy
Initiated Coverage: 07/05/11; Name Change to RNC Minerals 9/13/2016; Transferred Coverage 9/26/2017
0
0.1
0.2
0.3
0.4
0.5
0.6
0.7
0.8
Aug15
Nov15
Feb16
May16
Aug16
Nov16
Feb17
May17
Aug17
Nov17
Feb18
May18
Price History (C$) Target/Rating/Coverage Change
Roxgold Inc. (ROXG-T) Date Target(C$) Rating1/3/18 $1.90 Buy
11/1/17 $1.70 Buy7/20/17 $1.80 Buy1/25/17 $2.00 Buy
10/20/16 $2.10 Buy7/11/16 $2.15 Buy5/31/16 $1.60 Buy4/28/16 $1.50 Buy
Initiated Coverage 01/27/14; Transfer of Coverage 10/20/2016
0
0.5
1
1.5
2
2.5
Aug15
Nov15
Feb16
May16
Aug16
Nov16
Feb17
May17
Aug17
Nov17
Feb18
May18
Price History (C$) Target/Rating/Coverage Change
Sabina Gold & Silver Corp. (SBB-T) Date Target(C$) Rating4/19/18 $2.35 Hold
12/20/17 $2.60 Hold10/19/17 $2.50 Hold10/17/17 $2.70 Buy
9/5/17 $2.75 Buy7/19/17 $2.50 Buy1/25/17 $1.70 Buy6/16/16 $1.65 UR (Buy)5/31/16 $1.65 Buy1/12/16 $1.00 Buy
12/15/15 $0.90 Buy
Initiated Coverage 12-15-15
0
0.5
1
1.5
2
2.5
3
Aug15
Nov15
Feb16
May16
Aug16
Nov16
Feb17
May17
Aug17
Nov17
Feb18
May18
Price History (C$) Target/Rating/Coverage Change
SEMAFO Inc. (SMF-T) Date Target(C$) Rating2/20/18 $5.50 Buy4/25/17 $4.50 Buy3/9/17 $5.50 Buy
1/25/17 $7.00 Buy11/10/16 $7.50 Buy7/11/16 $8.25 Buy5/12/16 $6.50 Buy2/26/16 $6.00 Buy
0123456789
Aug15
Nov15
Feb16
May16
Aug16
Nov16
Feb17
May17
Aug17
Nov17
Feb18
May18
Price History (C$) Target/Rating/Coverage Change
0123456789
Aug15
Nov15
Feb16
May16
Aug16
Nov16
Feb17
May17
Aug17
Nov17
Feb18
May18
Price History (C$) Target/Rating/Coverage Change
Superior Gold Inc. (SGI-V) Date Target(C$) Rating4/3/18 $2.00 Buy
12/12/17 $1.50 Buy
Initiated Coverage: 12/12/2017
00.20.40.60.8
11.21.41.61.8
2
Feb17
Apr17
Jun17
Aug17
Oct17
Dec17
Feb18
Apr18
Jun18
Price History (C$) Target/Rating/Coverage Change
Tahoe Resources Inc. (THO-T) Date Target(C$) Rating3/9/18 $5.50 Sell
2/23/18 $5.50 Hold1/15/18 $7.00 Hold
10/17/17 $7.25 Hold9/11/17 $7.75 Hold8/9/17 $6.75 Hold
7/19/17 $7.25 Hold7/6/17 $9.00 Sell5/3/17 $13.00 Hold
3/13/17 $12.00 Hold1/25/17 $14.00 Hold11/4/16 $25.00 Buy8/11/16 $28.00 Buy7/11/16 $25.00 Buy5/9/16 $20.00 Buy
Initiated Coverage 11/05/13
0
5
10
15
20
25
30
Aug15
Nov15
Feb16
May16
Aug16
Nov16
Feb17
May17
Aug17
Nov17
Feb18
May18
Price History (C$) Target/Rating/Coverage Change
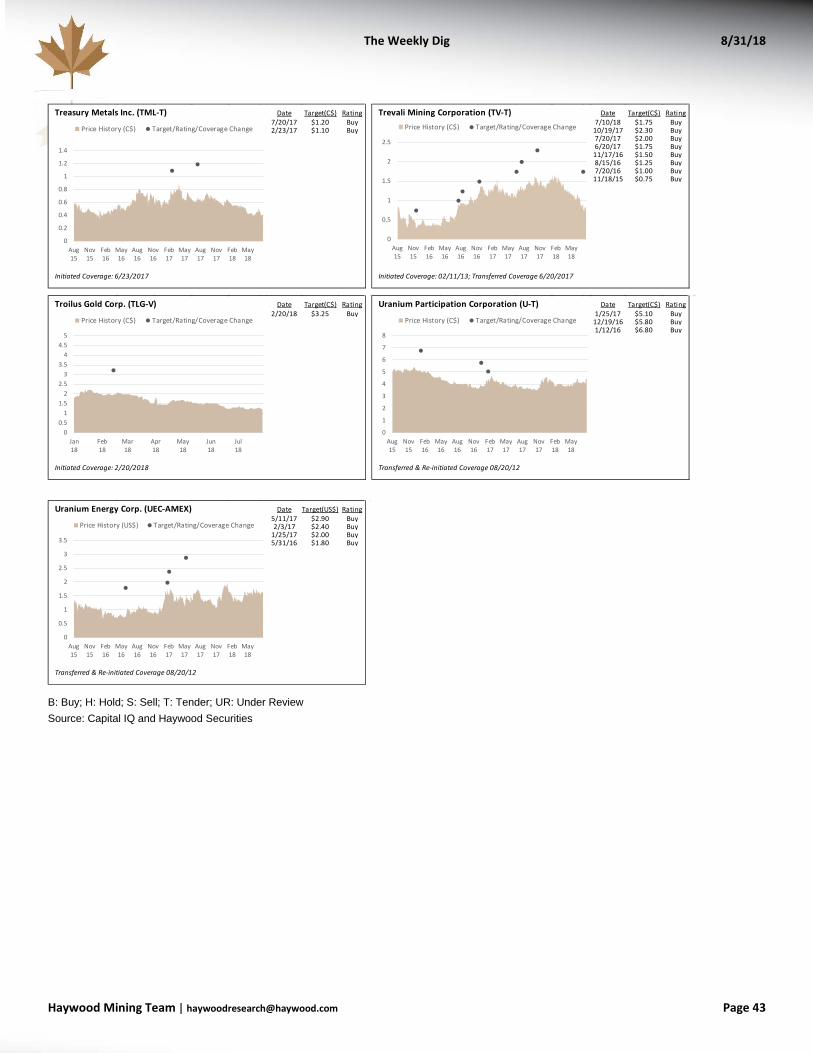
The Weekly Dig 8/31/18
Haywood Mining [email protected] Page 43
B: Buy; H: Hold; S: Sell; T: Tender; UR: Under Review Source: Capital IQ and Haywood Securities
Treasury Metals Inc. (TML-T) Date Target(C$) Rating7/20/17 $1.20 Buy2/23/17 $1.10 Buy
Initiated Coverage: 6/23/2017
0
0.2
0.4
0.6
0.8
1
1.2
1.4
Aug15
Nov15
Feb16
May16
Aug16
Nov16
Feb17
May17
Aug17
Nov17
Feb18
May18
Price History (C$) Target/Rating/Coverage Change
Trevali Mining Corporation (TV-T) Date Target(C$) Rating7/10/18 $1.75 Buy
10/19/17 $2.30 Buy7/20/17 $2.00 Buy6/20/17 $1.75 Buy
11/17/16 $1.50 Buy8/15/16 $1.25 Buy7/20/16 $1.00 Buy
11/18/15 $0.75 Buy
Initiated Coverage: 02/11/13; Transferred Coverage 6/20/2017
0
0.5
1
1.5
2
2.5
Aug15
Nov15
Feb16
May16
Aug16
Nov16
Feb17
May17
Aug17
Nov17
Feb18
May18
Price History (C$) Target/Rating/Coverage Change
Troilus Gold Corp. (TLG-V) Date Target(C$) Rating2/20/18 $3.25 Buy
Initiated Coverage: 2/20/2018
00.5
11.5
22.5
33.5
44.5
5
Jan18
Feb18
Mar18
Apr18
May18
Jun18
Jul18
Price History (C$) Target/Rating/Coverage Change
Uranium Participation Corporation (U-T) Date Target(C$) Rating1/25/17 $5.10 Buy
12/19/16 $5.80 Buy1/12/16 $6.80 Buy
Transferred & Re-initiated Coverage 08/20/12
0
1
2
3
4
5
6
7
8
Aug15
Nov15
Feb16
May16
Aug16
Nov16
Feb17
May17
Aug17
Nov17
Feb18
May18
Price History (C$) Target/Rating/Coverage Change
Uranium Energy Corp. (UEC-AMEX) Date Target(US$) Rating5/11/17 $2.90 Buy2/3/17 $2.40 Buy
1/25/17 $2.00 Buy5/31/16 $1.80 Buy
Transferred & Re-initiated Coverage 08/20/12
0
0.5
1
1.5
2
2.5
3
3.5
Aug15
Nov15
Feb16
May16
Aug16
Nov16
Feb17
May17
Aug17
Nov17
Feb18
May18
Price History (US$) Target/Rating/Coverage Change