Embed Size (px)
Citation preview
Published: July 07, 2011
r 2011 American Chemical Society 14064 dx.doi.org/10.1021/jp203669p | J. Phys. Chem. B 2011, 115, 14064–14067
ARTICLE
pubs.acs.org/JPCB
Melting of the Precipitated Ice IV in LiCl Aqueous Solutionand Polyamorphism of WaterOsamu Mishima*
PolyamorphismGroup, Surface Physics and Structure Unit, National Institute forMaterials Science, 1-1 Namiki, Tsukuba, 305-0044, Japan
1. INTRODUCTION
A seemingly discontinuous change in the slope of the meta-stable melting curve of ice IV was observed in the pressure�temperature diagram of pure H2O (and D2O), and this impliedthe existence of the liquid�liquid phase transition (LLT)between low-density liquid water (LDL) and high-density liquidwater (HDL).1,2 This was consistent with, but did not prove, theliquid�liquid critical point (LLCP) hypothesis of water.3
If the hypothesis is correct, it would affect strongly the studiesof aqueous solutions. There have been the studies of waterpolyamorphism in solutions with molecular dynamics simula-tions or theoretical models discussing how the LLCP and,consequently, LDL and HDL regions can be shifted both inhydrophobic solutions4,5 and in solutions of electrolytes.6
Experimentally, water anomalies are present in liquid solu-tions of electrolytes, as well as in their glassy states, and this ispossibly related to the existence of water polyamorphism inthe solutions.7,8
In the present study, the melting curve of the precipitatedice IV in dilute LiCl�H2O solution was measured, and theconsistency of the results with the polyamorphic viewpoint wasexamined.
2. EXPERIMENT AND RESULTS
The experimental method was the same as that of the purewater.1,2 About 1.1 cm3 of emulsion of LiCl�H2O solution,made by stirring the 2 cm3 of aqueous solution of 2.0 mol % LiCl(or 4.8 mol % LiCl) and a matrix (1 cm3 of methylcyclohexane,1 cm3 of methylcyclopentane, and 100 mg of sorbitan tristerate),was placed in an indium container and compressed to 0.8 GPa at
180 K by using a piston-cylinder apparatus (the piston diameter,15 mm). (Figure 1) The sample was then decompressed to0.6 GPa and heated to 200 K. In these procedures, ice IVprecipitated from the solution in each droplet of 1�10 μm insize; accordingly, the concentration of LiCl in the liquid solutionshould be changed along the liquidus surface of ice IV in thepressure�temperature�concentration phase diagram. This emulsified sample
Figure 1. The experimental setup. The temperature of the emulsifiedsample (small LiCl�H2O droplets in an oil matrix) is measured whilethe pressure is changed. Ice IV was precipitated from the LiCl aqueoussolution in each droplet, and the pressure-induced melting of the ice wasstudied.
Special Issue: H. Eugene Stanley Festschrift
Received: April 20, 2011Revised: June 14, 2011
ABSTRACT: Melting of the precipitated ice IV in supercooled LiCl�H2O solutionwas studied in the range of 0�0.6 MPa and 160�270 K. Emulsified solution was usedto detect this metastable transition. Ice IV was precipitated from the aqueous solutionof 2.0mol % LiCl (or 4.8mol % LiCl) in each emulsion particle at low-temperature andhigh-pressure conditions, and the emulsion was decompressed at different tempera-tures. The melting of ice IV was detected from the temperature change of theemulsified sample during the decompression. There was an apparently sudden changein the slope of the ice IV melting curve (liquidus) in the pressure�temperaturediagram. At the high-pressure and high-temperature side of the change, the solute-induced freezing point depression was observed. At the low-pressure and low-temperature side, ice IV transformed into ice Ih on the decompression, and thetransition was almost unrelated to the concentration of LiCl. These experimentalresults were roughly explained by the presumed existence of two kinds of liquid water (low-density liquid water and high-densityliquid water), or polyamorphism in water, and by the simple assumption that LiCl dissolved maily in high-density liquid water.
14065 dx.doi.org/10.1021/jp203669p |J. Phys. Chem. B 2011, 115, 14064–14067
The Journal of Physical Chemistry B ARTICLE
was decompressed at a rate of ∼0.2 GPa/min at different cylindertemperatures. During decompression, the temperature of the samplewas measured with the thermocouple, which was brought into thesample through a small hole in the piston.
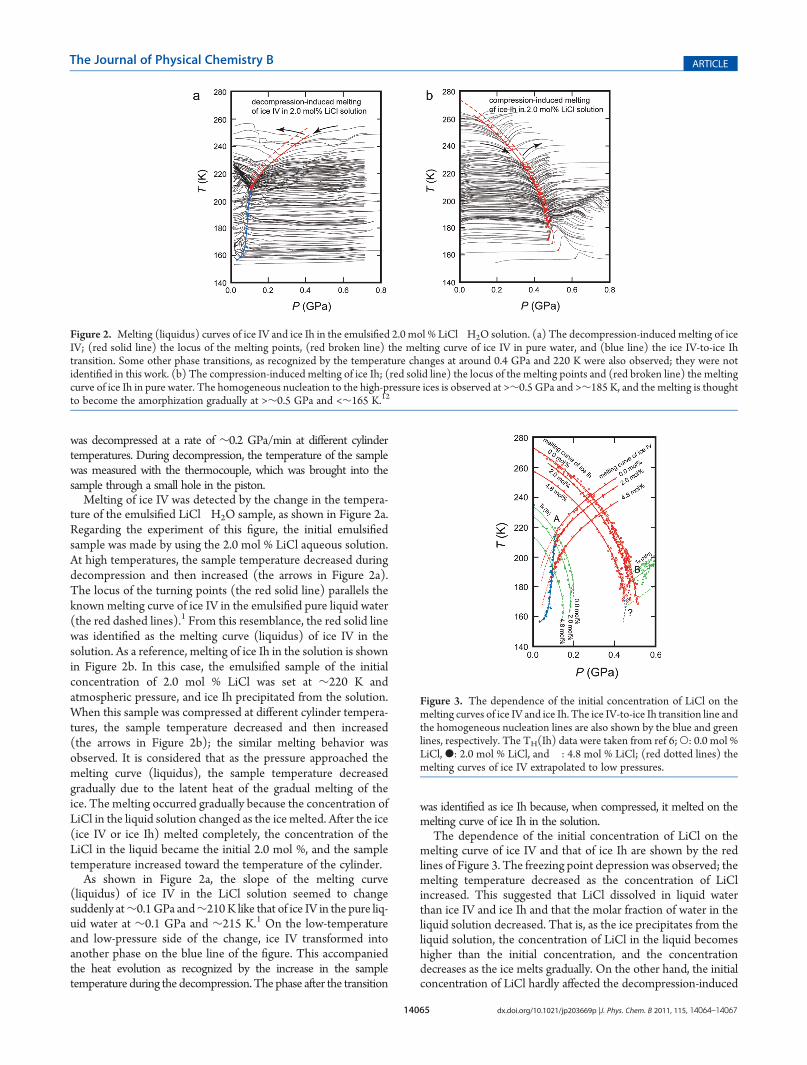
Melting of ice IV was detected by the change in the tempera-ture of the emulsified LiCl�H2O sample, as shown in Figure 2a.Regarding the experiment of this figure, the initial emulsifiedsample was made by using the 2.0 mol % LiCl aqueous solution.At high temperatures, the sample temperature decreased duringdecompression and then increased (the arrows in Figure 2a).The locus of the turning points (the red solid line) parallels theknown melting curve of ice IV in the emulsified pure liquid water(the red dashed lines).1 From this resemblance, the red solid linewas identified as the melting curve (liquidus) of ice IV in thesolution. As a reference, melting of ice Ih in the solution is shownin Figure 2b. In this case, the emulsified sample of the initialconcentration of 2.0 mol % LiCl was set at ∼220 K andatmospheric pressure, and ice Ih precipitated from the solution.When this sample was compressed at different cylinder tempera-tures, the sample temperature decreased and then increased(the arrows in Figure 2b); the similar melting behavior wasobserved. It is considered that as the pressure approached themelting curve (liquidus), the sample temperature decreasedgradually due to the latent heat of the gradual melting of theice. The melting occurred gradually because the concentration ofLiCl in the liquid solution changed as the ice melted. After the ice(ice IV or ice Ih) melted completely, the concentration of theLiCl in the liquid became the initial 2.0 mol %, and the sampletemperature increased toward the temperature of the cylinder.
As shown in Figure 2a, the slope of the melting curve(liquidus) of ice IV in the LiCl solution seemed to changesuddenly at∼0.1GPa and∼210K like that of ice IV in the pure liq-uid water at ∼0.1 GPa and ∼215 K.1 On the low-temperatureand low-pressure side of the change, ice IV transformed intoanother phase on the blue line of the figure. This accompaniedthe heat evolution as recognized by the increase in the sampletemperature during the decompression. The phase after the transition
was identified as ice Ih because, when compressed, it melted on themelting curve of ice Ih in the solution.
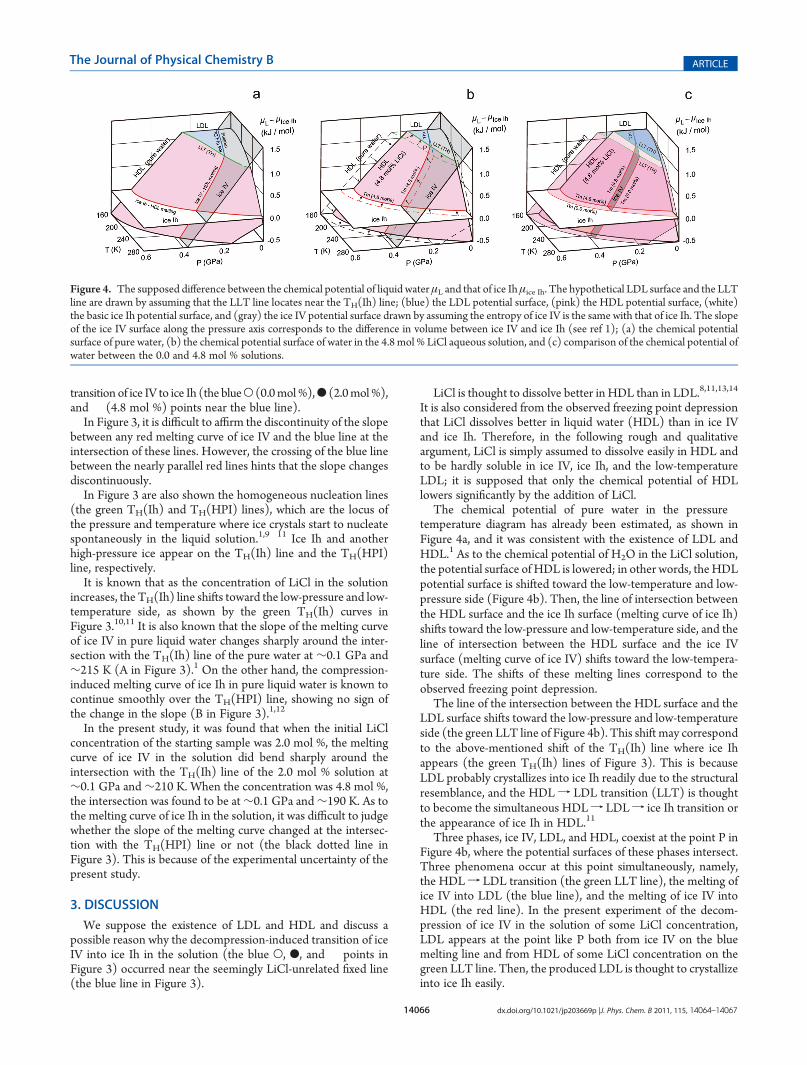
The dependence of the initial concentration of LiCl on themelting curve of ice IV and that of ice Ih are shown by the redlines of Figure 3. The freezing point depression was observed; themelting temperature decreased as the concentration of LiClincreased. This suggested that LiCl dissolved in liquid waterthan ice IV and ice Ih and that the molar fraction of water in theliquid solution decreased. That is, as the ice precipitates from theliquid solution, the concentration of LiCl in the liquid becomeshigher than the initial concentration, and the concentrationdecreases as the ice melts gradually. On the other hand, the initialconcentration of LiCl hardly affected the decompression-induced
Figure 2. Melting (liquidus) curves of ice IV and ice Ih in the emulsified 2.0 mol % LiCl�H2O solution. (a) The decompression-induced melting of iceIV; (red solid line) the locus of the melting points, (red broken line) the melting curve of ice IV in pure water, and (blue line) the ice IV-to-ice Ihtransition. Some other phase transitions, as recognized by the temperature changes at around 0.4 GPa and 220 K were also observed; they were notidentified in this work. (b) The compression-induced melting of ice Ih; (red solid line) the locus of the melting points and (red broken line) the meltingcurve of ice Ih in pure water. The homogeneous nucleation to the high-pressure ices is observed at >∼0.5 GPa and >∼185 K, and the melting is thoughtto become the amorphization gradually at >∼0.5 GPa and <∼165 K.12
Figure 3. The dependence of the initial concentration of LiCl on themelting curves of ice IV and ice Ih. The ice IV-to-ice Ih transition line andthe homogeneous nucleation lines are also shown by the blue and greenlines, respectively. The TH(Ih) data were taken from ref 6;O: 0.0 mol %LiCl, b: 2.0 mol % LiCl, and �: 4.8 mol % LiCl; (red dotted lines) themelting curves of ice IV extrapolated to low pressures.
14066 dx.doi.org/10.1021/jp203669p |J. Phys. Chem. B 2011, 115, 14064–14067
The Journal of Physical Chemistry B ARTICLE
transition of ice IV to ice Ih (the blueO (0.0mol%),b (2.0mol%),and � (4.8 mol %) points near the blue line).
In Figure 3, it is difficult to affirm the discontinuity of the slopebetween any red melting curve of ice IV and the blue line at theintersection of these lines. However, the crossing of the blue linebetween the nearly parallel red lines hints that the slope changesdiscontinuously.
In Figure 3 are also shown the homogeneous nucleation lines(the green TH(Ih) and TH(HPI) lines), which are the locus ofthe pressure and temperature where ice crystals start to nucleatespontaneously in the liquid solution.1,9�11 Ice Ih and anotherhigh-pressure ice appear on the TH(Ih) line and the TH(HPI)line, respectively.
It is known that as the concentration of LiCl in the solutionincreases, the TH(Ih) line shifts toward the low-pressure and low-temperature side, as shown by the green TH(Ih) curves inFigure 3.10,11 It is also known that the slope of the melting curveof ice IV in pure liquid water changes sharply around the inter-section with the TH(Ih) line of the pure water at ∼0.1 GPa and∼215 K (A in Figure 3).1 On the other hand, the compression-induced melting curve of ice Ih in pure liquid water is known tocontinue smoothly over the TH(HPI) line, showing no sign ofthe change in the slope (B in Figure 3).1,12
In the present study, it was found that when the initial LiClconcentration of the starting sample was 2.0 mol %, the meltingcurve of ice IV in the solution did bend sharply around theintersection with the TH(Ih) line of the 2.0 mol % solution at∼0.1 GPa and∼210 K. When the concentration was 4.8 mol %,the intersection was found to be at∼0.1 GPa and∼190 K. As tothe melting curve of ice Ih in the solution, it was difficult to judgewhether the slope of the melting curve changed at the intersec-tion with the TH(HPI) line or not (the black dotted line inFigure 3). This is because of the experimental uncertainty of thepresent study.
3. DISCUSSION
We suppose the existence of LDL and HDL and discuss apossible reason why the decompression-induced transition of iceIV into ice Ih in the solution (the blue O, b, and � points inFigure 3) occurred near the seemingly LiCl-unrelated fixed line(the blue line in Figure 3).
LiCl is thought to dissolve better in HDL than in LDL.8,11,13,14
It is also considered from the observed freezing point depressionthat LiCl dissolves better in liquid water (HDL) than in ice IVand ice Ih. Therefore, in the following rough and qualitativeargument, LiCl is simply assumed to dissolve easily in HDL andto be hardly soluble in ice IV, ice Ih, and the low-temperatureLDL; it is supposed that only the chemical potential of HDLlowers significantly by the addition of LiCl.
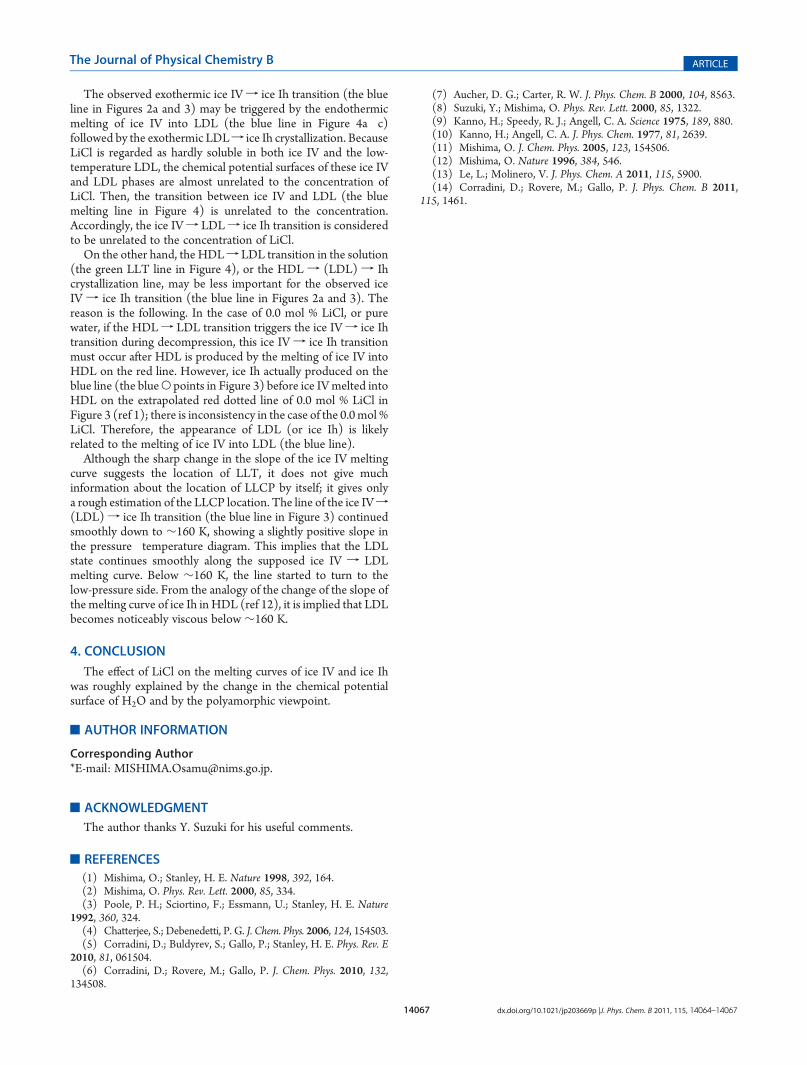
The chemical potential of pure water in the pressure�temperature diagram has already been estimated, as shown inFigure 4a, and it was consistent with the existence of LDL andHDL.1 As to the chemical potential of H2O in the LiCl solution,the potential surface of HDL is lowered; in other words, theHDLpotential surface is shifted toward the low-temperature and low-pressure side (Figure 4b). Then, the line of intersection betweenthe HDL surface and the ice Ih surface (melting curve of ice Ih)shifts toward the low-pressure and low-temperature side, and theline of intersection between the HDL surface and the ice IVsurface (melting curve of ice IV) shifts toward the low-tempera-ture side. The shifts of these melting lines correspond to theobserved freezing point depression.
The line of the intersection between the HDL surface and theLDL surface shifts toward the low-pressure and low-temperatureside (the green LLT line of Figure 4b). This shift may correspondto the above-mentioned shift of the TH(Ih) line where ice Ihappears (the green TH(Ih) lines of Figure 3). This is becauseLDL probably crystallizes into ice Ih readily due to the structuralresemblance, and the HDLf LDL transition (LLT) is thoughtto become the simultaneous HDLf LDLf ice Ih transition orthe appearance of ice Ih in HDL.11
Three phases, ice IV, LDL, and HDL, coexist at the point P inFigure 4b, where the potential surfaces of these phases intersect.Three phenomena occur at this point simultaneously, namely,the HDLf LDL transition (the green LLT line), the melting ofice IV into LDL (the blue line), and the melting of ice IV intoHDL (the red line). In the present experiment of the decom-pression of ice IV in the solution of some LiCl concentration,LDL appears at the point like P both from ice IV on the bluemelting line and from HDL of some LiCl concentration on thegreen LLT line. Then, the produced LDL is thought to crystallizeinto ice Ih easily.
Figure 4. The supposed difference between the chemical potential of liquid water μL and that of ice Ihμice Ih. The hypothetical LDL surface and the LLTline are drawn by assuming that the LLT line locates near the TH(Ih) line; (blue) the LDL potential surface, (pink) the HDL potential surface, (white)the basic ice Ih potential surface, and (gray) the ice IV potential surface drawn by assuming the entropy of ice IV is the same with that of ice Ih. The slopeof the ice IV surface along the pressure axis corresponds to the difference in volume between ice IV and ice Ih (see ref 1); (a) the chemical potentialsurface of pure water, (b) the chemical potential surface of water in the 4.8 mol % LiCl aqueous solution, and (c) comparison of the chemical potential ofwater between the 0.0 and 4.8 mol % solutions.
14067 dx.doi.org/10.1021/jp203669p |J. Phys. Chem. B 2011, 115, 14064–14067
The Journal of Physical Chemistry B ARTICLE
The observed exothermic ice IVf ice Ih transition (the blueline in Figures 2a and 3) may be triggered by the endothermicmelting of ice IV into LDL (the blue line in Figure 4a�c)followed by the exothermic LDLf ice Ih crystallization. BecauseLiCl is regarded as hardly soluble in both ice IV and the low-temperature LDL, the chemical potential surfaces of these ice IVand LDL phases are almost unrelated to the concentration ofLiCl. Then, the transition between ice IV and LDL (the bluemelting line in Figure 4) is unrelated to the concentration.Accordingly, the ice IVf LDLf ice Ih transition is consideredto be unrelated to the concentration of LiCl.
On the other hand, the HDLf LDL transition in the solution(the green LLT line in Figure 4), or the HDL f (LDL) f Ihcrystallization line, may be less important for the observed iceIV f ice Ih transition (the blue line in Figures 2a and 3). Thereason is the following. In the case of 0.0 mol % LiCl, or purewater, if the HDLf LDL transition triggers the ice IVf ice Ihtransition during decompression, this ice IV f ice Ih transitionmust occur after HDL is produced by the melting of ice IV intoHDL on the red line. However, ice Ih actually produced on theblue line (the blueO points in Figure 3) before ice IVmelted intoHDL on the extrapolated red dotted line of 0.0 mol % LiCl inFigure 3 (ref 1); there is inconsistency in the case of the 0.0mol %LiCl. Therefore, the appearance of LDL (or ice Ih) is likelyrelated to the melting of ice IV into LDL (the blue line).
Although the sharp change in the slope of the ice IV meltingcurve suggests the location of LLT, it does not give muchinformation about the location of LLCP by itself; it gives onlya rough estimation of the LLCP location. The line of the ice IVf(LDL)f ice Ih transition (the blue line in Figure 3) continuedsmoothly down to ∼160 K, showing a slightly positive slope inthe pressure�temperature diagram. This implies that the LDLstate continues smoothly along the supposed ice IV f LDLmelting curve. Below ∼160 K, the line started to turn to thelow-pressure side. From the analogy of the change of the slope ofthe melting curve of ice Ih in HDL (ref 12), it is implied that LDLbecomes noticeably viscous below ∼160 K.
4. CONCLUSION
The effect of LiCl on the melting curves of ice IV and ice Ihwas roughly explained by the change in the chemical potentialsurface of H2O and by the polyamorphic viewpoint.
’AUTHOR INFORMATION
Corresponding Author*E-mail: [email protected].
’ACKNOWLEDGMENT
The author thanks Y. Suzuki for his useful comments.
’REFERENCES
(1) Mishima, O.; Stanley, H. E. Nature 1998, 392, 164.(2) Mishima, O. Phys. Rev. Lett. 2000, 85, 334.(3) Poole, P. H.; Sciortino, F.; Essmann, U.; Stanley, H. E. Nature
1992, 360, 324.(4) Chatterjee, S.; Debenedetti, P. G. J. Chem. Phys. 2006, 124, 154503.(5) Corradini, D.; Buldyrev, S.; Gallo, P.; Stanley, H. E. Phys. Rev. E
2010, 81, 061504.(6) Corradini, D.; Rovere, M.; Gallo, P. J. Chem. Phys. 2010, 132,
134508.
(7) Aucher, D. G.; Carter, R. W. J. Phys. Chem. B 2000, 104, 8563.(8) Suzuki, Y.; Mishima, O. Phys. Rev. Lett. 2000, 85, 1322.(9) Kanno, H.; Speedy, R. J.; Angell, C. A. Science 1975, 189, 880.(10) Kanno, H.; Angell, C. A. J. Phys. Chem. 1977, 81, 2639.(11) Mishima, O. J. Chem. Phys. 2005, 123, 154506.(12) Mishima, O. Nature 1996, 384, 546.(13) Le, L.; Molinero, V. J. Phys. Chem. A 2011, 115, 5900.(14) Corradini, D.; Rovere, M.; Gallo, P. J. Phys. Chem. B 2011,
115, 1461.