Embed Size (px)
Citation preview

Melting and freezing behavior of polyethylene oxideR. W. Warfield and Bruce Hartmann Citation: Journal of Applied Physics 44, 708 (1973); doi: 10.1063/1.1662248 View online: http://dx.doi.org/10.1063/1.1662248 View Table of Contents: http://scitation.aip.org/content/aip/journal/jap/44/2?ver=pdfcov Published by the AIP Publishing Articles you may be interested in Shear inhomogeneity in poly(ethylene oxide) melts J. Rheol. 55, 939 (2011); 10.1122/1.3596599 Freezing and melting of water in a single cylindrical pore: The pore-size dependence of freezing and meltingbehavior J. Chem. Phys. 110, 4867 (1999); 10.1063/1.478372 Long-ranged relaxations in poly(ethylene oxide) melts: Evidence for network behavior J. Chem. Phys. 109, 11043 (1998); 10.1063/1.477743 SteadyState Melt Flow Behavior of Polyethylene Blends Trans. Soc. Rheol. 9, 3 (1965); 10.1122/1.548977 Crystallization and Melting Behavior of Polyethylene Oxide Copolymers J. Appl. Phys. 35, 82 (1964); 10.1063/1.1713103
[This article is copyrighted as indicated in the article. Reuse of AIP content is subject to the terms at: http://scitation.aip.org/termsconditions. Downloaded to ] IP:
130.239.20.174 On: Mon, 24 Nov 2014 23:33:08
Melting and freezing behavior of polyethylene oxide * R. W. Warfield and Bruce Hartmann
Chemistry Research Department. Naval Ordnance Laboratory. Silver Spring. Maryland 20910 (Received 18 July 1972)
A compressibility pressure-temperature cycle has been developed for polyethylene oxide (PEO) by which both the melting and freezing points of this polymer are easily determined. It was found that PEO supercools about IO"C and that the pressure dependencies of the melting and freezing points are approximately the same. Using the pressure dependence of the bulk modulus for PEO the Gruneisen constant. y, was calculated to be about 5 and was found to have an anomalous temperature dependence. It is shown that the Gruneisen constant and the Rao constant are approximately equal and that Wada's rule holds for transitions in which the volume does not change.
I. INTRODUCTION
Several investigatorsl- 3 have studied the melting and/or freezing of polymers. The freezing point T, is less than the melting point T m as a result of supercooling, but generally at atmospheric pressure the two differ by only a few degrees. There is no assurance, however, that the pressure dependence of the two is the same, especially .since T m is an equilibrium thermodynamic property whereas T I is not. One of the principal goals of this work is to determine the pressure dependencies of T m and T I for polyethylene oxide (PEO). This polymer was chosen because its T m is conveniently low, 68.5 DC, 4
and because of its marked tendency to supercool. It was found that the pressure dependencies of T m and T I were the same and that the polymer supercools by about 10 DC.
Another point of interest in this work is the relation between the temperature dependence of the bulk modulus above and below the melting point. Wada5 showed that a definite relation of this type exists at the glass tranSition. Since a satisfactory explanation of Wada's rule had not previously been given, it was not known if a similar relation holds at the melting point. It was found that Wada's rule holds only for transitions in which the volume does not change (such as the glass transition) and therefore does not hold at T m'
Finally, it is of interest to compare two approaches to the temperature dependence of the bulk modulus of polymers: the Gruneisen6 equation of state for solids and the Hao7 empirical relation for liquids. It was found that the Gruneisen constant and Hao's constant are approximatelyequal.
II. EXPERIMENTAL
A. Equipment and procedures
All measurements were made in a standard MaxwellMatsuoka piston-type compressibility testerl which has been shown to be well suited to the determination of the compressibility characteristics of polymers. 8 For these measurements, the specimen is 6.35 mm (0.250 in.) in diameter and 7.5 cm (3 in.) long. Load is applied to the piston of the tester to produce a constant deformation rate of 0.635 mm/min (0.025 in. /min) , which corresponds to a strain rate of 0.008 min-l. The source of the pressure is a Baldwin-Southwark 30000-kg-capacity Universal Testing Machine. Heating coils surround the metal tester, and the temperature of the polymer specimen within the tester can be very accurately controlled.
708 J. Appl. Phys., Vol. 44, No.2, February 1973
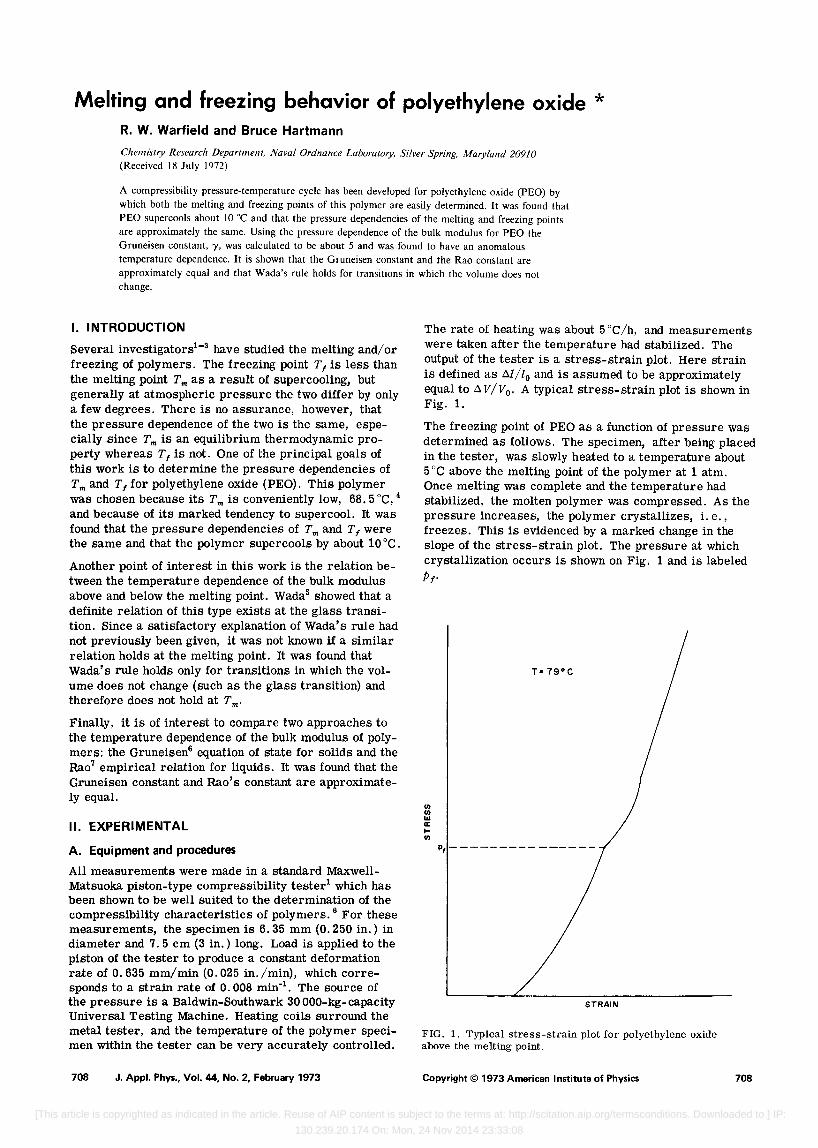
The rate of heating was about 5 DC/h, and measurements were taken after the temperature had stabilized. The output of the tester is a stress-strain plot. Here strain is defined as fl.Z/Zo and is assumed to be approximately equal to fl. vivo' A typical stress-strain plot is shown in Fig. 1.
The freezing point of PEO as a function of pressure was determined as follows. The specimen, after being placed in the tester, was slowly heated to a temperature about 5 DC above the melting point of the polymer at 1 atm. Once melting was complete and the temperature had stabilized, the molten polymer was compressed. As the pressure increases, the polymer crystallizes, i. e., freezes. This is evidenced by a marked change in the slope of the stress-strain plot. The pressure at which crystallization occurs is shown on Fig. 1 and is labeled
P"
en en III II: I-en
p,--------- ------
STRAIN
FIG. 1. Typical stress-strain plot for polyethylene oxide above the melting point.
Copyright © 1973 American Institute of Physics 708
[This article is copyrighted as indicated in the article. Reuse of AIP content is subject to the terms at: http://scitation.aip.org/termsconditions. Downloaded to ] IP:
130.239.20.174 On: Mon, 24 Nov 2014 23:33:08
709 R.W. Warfield and B. Hartmann: Melting and freezing behavior of polyethylene oxide 709
(a)
(/) (/) W Q: l-(/)
(b)
o -------__ C
I: A- B
IT: B- C
m'C---+D
:rsz:' 0- C A --------.... B
PRESSURE
B,C
0
A
STRAIN
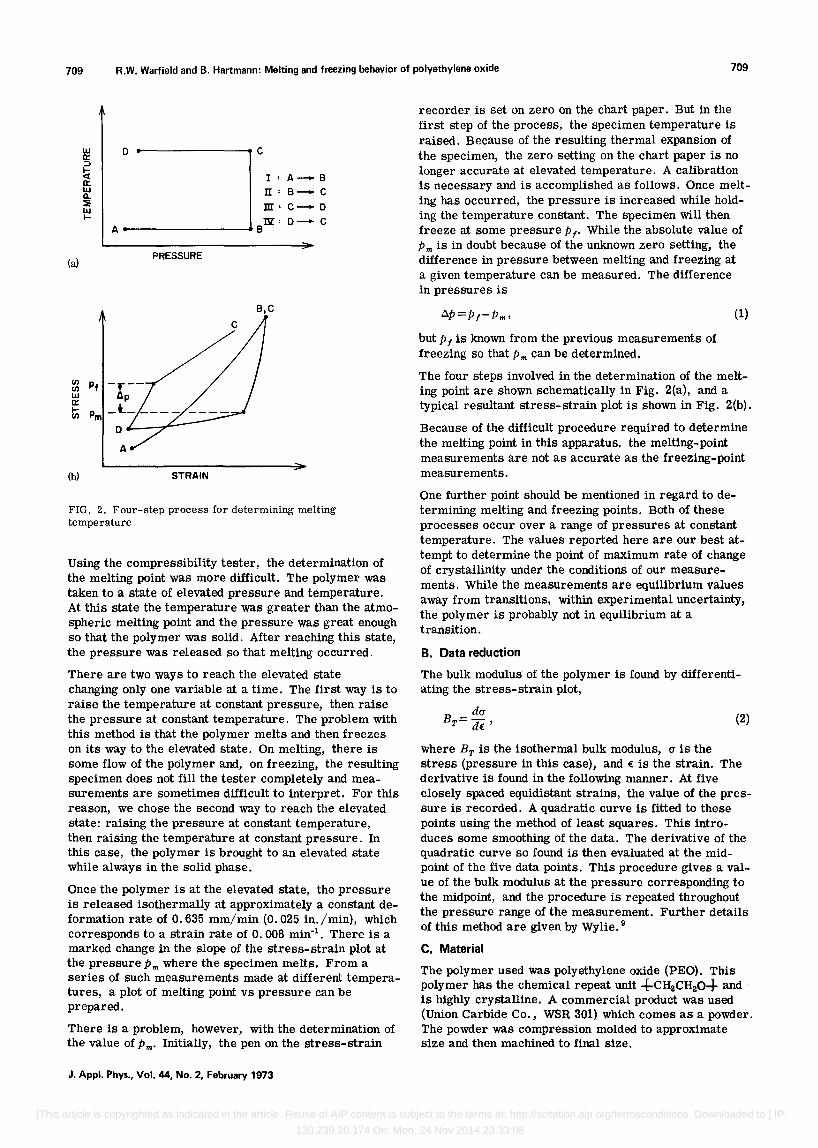
FIG. 2. Four-step process for determining melting temperature
Using the compressibility tester, the determination of the melting point was more difficult. The polymer was taken to a state of elevated pressure and temperature. At this state the temperature was greater than the atmospheric melting point and the pressure was great enough so that the polymer was solid. After reaching this state, the pressure was released so that melting occurred.
There are two ways to reach the elevated state changing only one variable at a time. The first way is to raise the temperature at constant pressure, then raise the pressure at constant temperature. The problem with this method is that the polymer melts and then freezes on its way to the elevated state. On melting, there is some flow of the polymer and, on freezing, the resulting specimen does not fill the tester completely and measurements are sometimes difficult to interpret. For this reason, we chose the second way to reach the elevated state: raiSing the pressure at constant temperature, then raising the temperature at constant pressure. In this case, the polymer is brought to an elevated state while always in the solid phase.
Once the polymer is at the elevated state, the pressure is released isothermally at approximately a constant deformation rate of 0.635 mm/min (0.025 in./min), which corresponds to a strain rate of 0.008 min-i. There is a marked change in the slope of the stress-strain plot at the pressure Pm where the specimen melts. From a series of such measurements made at different temperatures, a plot of melting point vs pressure can be prepared.
There is a problem, however, with the determination of the value of Pm. Initially, the pen on the stress-strain
J. Appl. Phys., Vol. 44, No.2, February 1973
recorder is set on zero on the chart paper. But in the first step of the process, the specimen temperature is raised. Because of the resulting thermal expansion of the specimen, the zero setting on the chart paper is no longer accurate at elevated temperature. A calibration is necessary and is accomplished as follows. Once melting has occurred, the pressure is increased while holding the temperature constant. The specimen will then freeze at some pressure PI' While the absolute value of Pm is in doubt because of the unknown zero setting, the difference in pressure between melting and freezing at a given temperature can be measured. The difference in pressures is
c.p=p,-p m ,
but P I is known from the previous measurements of freezing so that Pm can be determined.
(1)
The four steps involved in the determination of the melting point are shown schematically in Fig. 2(a), and a typical resultant stress-strain plot is shown in Fig. 2(b).
Because of the difficult procedure required to determine the melting point in this apparatus, the melting-point measurements are not as accurate as the freezing-point measurements.
One further point should be mentioned in regard to determining melting and freezing points. Both of these processes occur over a range of pressures at constant temperature. The values reported here are our best attempt to determine the pOint of maximum rate of change of crystallinity under the conditions of our measurements. While the measurements are equilibrium values away from transitions, within experimental uncertainty, the polymer is probably not in equilibrium at a transition.
B. Data reduction
The bulk modulus of the polymer is found by differentiating the stress-strain plot,
dlj B T = dE'
where BT is the isothermal bulk modulus, Ij is the
(2)
stress (pressure in this case), and E is the strain. The derivative is found in the following manner. At five closely spaced equidistant strains, the value of the pressure is recorded. A quadratic curve is fitted to these points using the method of least squares. This introduces some smoothing of the data. The derivative of the quadratic curve so found is then evaluated at the midpoint of the five data points. This procedure gives a value of the bulk modulus at the pressure corresponding to the midpoint, and the procedure is repeated throughout the pressure range of the measurement. Further details of this method are given by Wylie. 9
C. Material
The polymer used was polyethylene oxide (PEO). This polymer has the chemical repeat unit +CHaCHaO+ and is highly crystalline. A commercial product was used (Union Carbide Co., WSR 301) which comes as a powder. The powder was compression molded to apprOXimate size and then machined to final size.
[This article is copyrighted as indicated in the article. Reuse of AIP content is subject to the terms at: http://scitation.aip.org/termsconditions. Downloaded to ] IP:
130.239.20.174 On: Mon, 24 Nov 2014 23:33:08
710 R.W. Warfield and B. Hartmann: Melting and freezing behavior of polyethylene oxide
100
80
u • Id II:: ;:)
Tf" 58 +.009p-21C 10-lp l ~ 4 II:: Id 11. 2 Id ~
0 MELTING POINT, THIS WORK
I!l MELTING POINT, REFERENCE 4 A FREEZING POINT, THIS WORK
50
o 1000 2000 PRESSURE, ATM
3000 4000
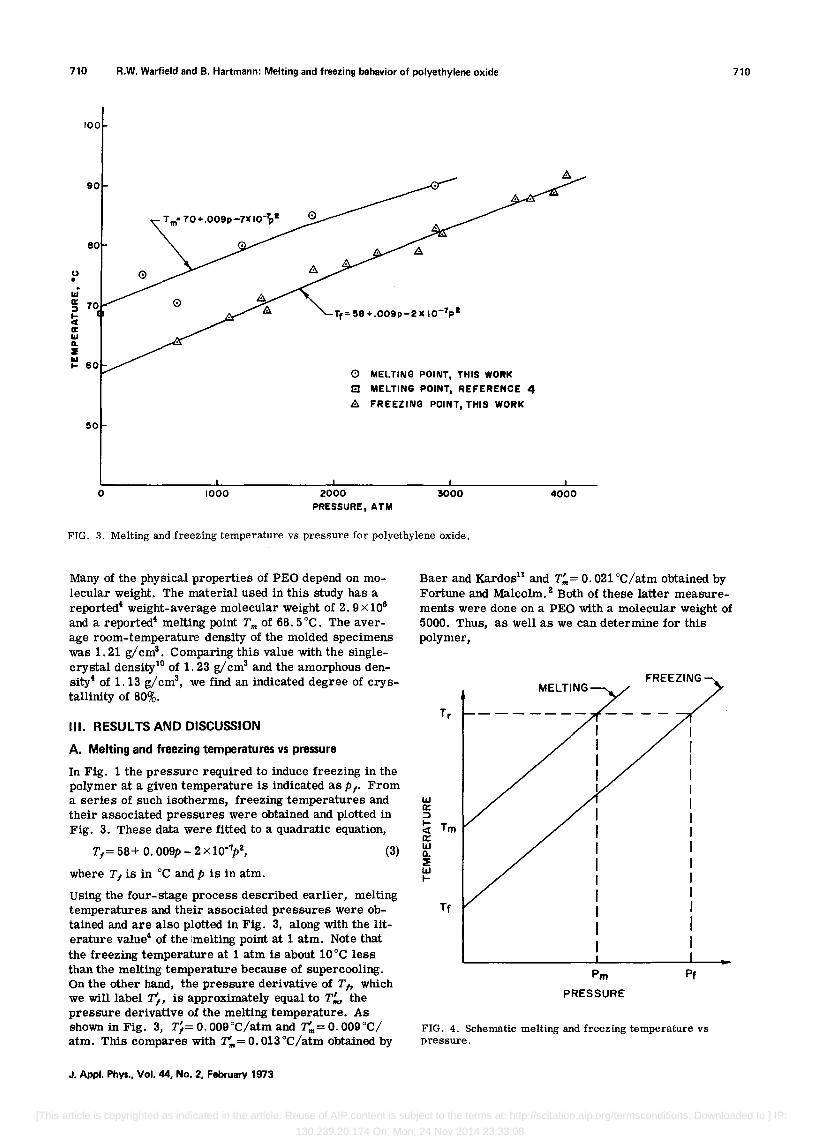
FIG. 3. Melting and freezing temperature vs pressure for polyethylene oxide.
Many of the physical properties of PEO depend on molecular weight. The material used in this study has a reported4 weight-average molecular weight of 2.9 x 10⁶
and a reported4 melting point T m of 68.5 °C. The average room-temperature density of the molded specimens was 1. 21 g/ cm3 • Comparing this value with the singlecrystal densityl0 of 1.23 g/ cm3 and the amorphous density· of 1.13 g/cm3
, we find an indicated degree of crystallinity of 80%.
III. RESULTS AND DISCUSSION
A. Melting and freezing temperatures vs pressure
In Fig. 1 the pressure required to induce freezing in the polymer at a given temperature is indicated as P f' From a series of such isotherms, freezing temperatures and their associated pressures were obtained and plotted in Fig. 3. These data were fitted to a quadratic equation,
Tf = 58+ O. 009p - 2 X 10⁻⁷p2, (3)
where Tf is in °C and p is in atm.
using the four-stage process described earlier, melting temperatures and their associated pressures were obtained and are also plotted in Fig. 3, along with the literature value4 of the ',melting point at 1 atm. Note that the freezing temperature at 1 atm is about 10 °C less than the melting temperature because of supercooling. On the other hand, the pressure derivative of T f , which we will label Tf' is apprOximately equal to T:", the pressure derivative of the melting temperature. As shown in Fig. 3, T,= O. 009°C/atm and ~= O. 009°C/ atm. This compares with T'm= O. 013 °C/atm obtained by
J. Appl. Phys., Vol. 44, No.2, February 1973
Baer and Kardosll and T:"= O. 021 °C/atm obtained by Fortune and Malcolm. 2 Both of these latter measurements were done on a PEO with a molecular weight of 5000. Thus, as well as we can determine for this polymer,
Lt.J 0:: ~
~ Tm 0:: Lt.J a. :!: Lt.J t-
Tf
Pm
PRESSURE
FREEZING
Pf
FIG. 4. Schematic melting and freezing temperature vs pressure.
710
[This article is copyrighted as indicated in the article. Reuse of AIP content is subject to the terms at: http://scitation.aip.org/termsconditions. Downloaded to ] IP:
130.239.20.174 On: Mon, 24 Nov 2014 23:33:08
711 R.W. Warfield and B. Hartmann: Melting and freezing behavior of polyethylene oxide 711
10
9
5
4L-------~----~------~------~----~------~------~------~----~~ o .5 1.0 1.5 2.0 2.5 3.0 3.5 4.0 4.5 PRESSURE, 109 DYNE I CM 2
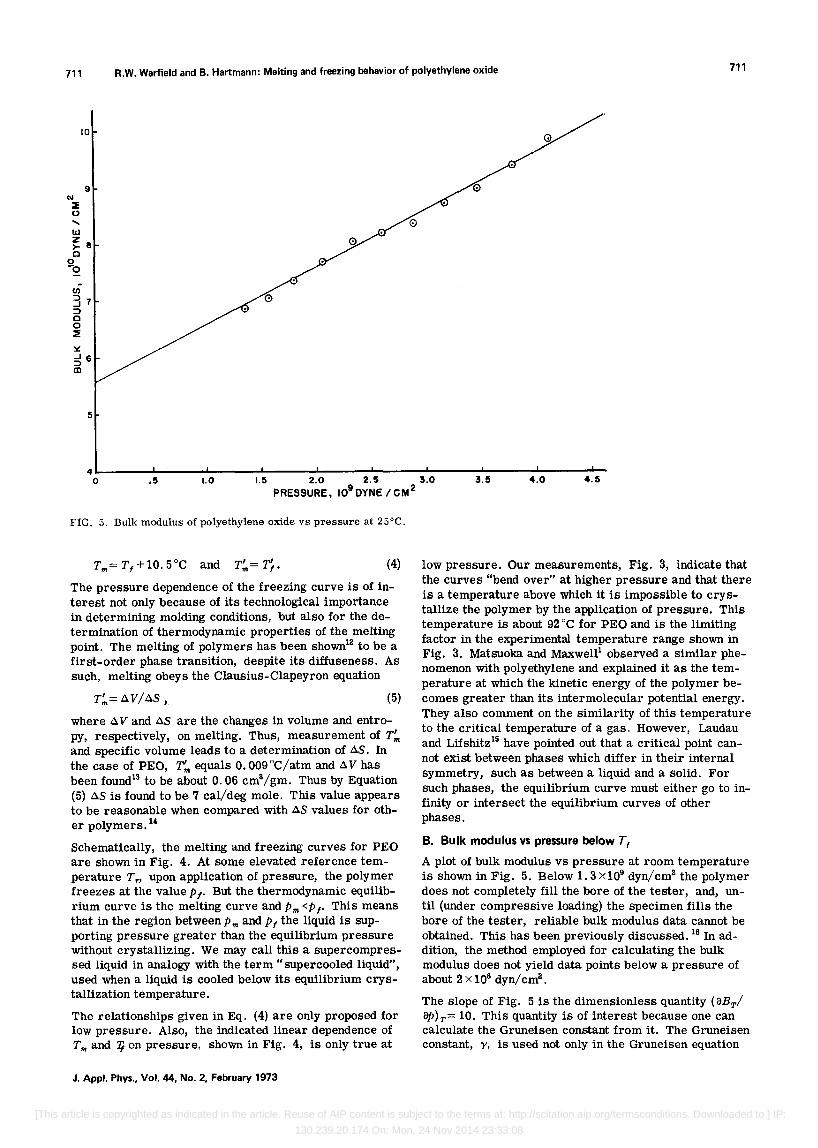
FIG. 5. Bulk modulus of polyethylene oxide vs pressure at 25°C.
(4)
The pressure dependence of the freezing curve is of interest not only because of its technological importance in determining molding conditions, but also for the determination of thermodynamic properties of the melting point. The melting of polymers has been shown12 to be a first-order phase transition, despite its diffuseness. As such, melting obeys the Clausius-Clapeyron equation
T~=AV/AS , (5)
where A V and AS are the changes in volume and entropy, respectively, on melting. Thus, measurement of T~ and specific volume leads to a determination of AS. In the case of PEO, T~ equals 0.009 °C/atm and A V has been found 13 to be about 0.06 cm3/gm. Thus by Equation (5) AS is found to be 7 cal/deg mole. This value appears to be reasonable when compared with AS values for other polymers. 14
Schematically, the melting and freezing curves for PEO are shown in Fig. 4. At some elevated reference temperature T T' upon application of pressure, the polymer freezes at the value P ,. But the thermodynamic equilibrium curve is the melting curve and Pm <P,. This means that in the region between Pm and PI the liquid is supporting pressure greater than the equilibrium pressure without crystallizing. We may call this a supercompressed liquid in analogy with the term "supercooled liquid", used when a liquid is cooled below its equilibrium crystallization temperature.
The relationships given in Eq. (4) are only proposed for low pressure. Also, the indicated linear dependence of T m and 'If on pressure, shown in Fig. 4, is only true at
J. Appl. Phys., Vol. 44, No.2, February 1973
low pressure. Our measurements, Fig. 3, indicate that the curves "bend over" at higher pressure and that there is a temperature above which it is impossible to crystallize the polymer by the application of pressure. This temperature is about 92 DC for PEO and is the limiting factor in the experimental temperature range shown in Fig. 3. Matsuoka and Maxwell1 observed a Similar phenomenon with polyethylene and explained it as the temperature at which the kinetic energy of the polymer becomes greater than its intermolecular potential energy. They also comment on the Similarity of this temperature to the critical temperature of a gas. However, Laudau and Lifshitz15 have pointed out that a critical point cannot exist between phases which differ in their internal symmetry, such as between a liquid and a solid. For such phases, the equilibrium curve must either go to infinity or intersect the equilibrium curves of other phases.
B. Bulk modulus vs pressure below Tf
A plot of bulk modulus vs pressure at room temperature is shown in Fig. 5. Below 1. 3 X10⁹ dyn/cm2 the polymer does not completely fill the bore of the tester, and, until (under compressive loading) the specimen fills the bore of the tester, reliable bulk modulus data cannot be obtained. This has been previously discussed. 16 In addition, the method employed for calculating the bulk modulus does not yield data pOints below a pressure of about 2 x 10⁸ dyn/ cm2 •
The slope of Fig. 5 is the dimensionless quantity (BET/ ap)T= 10. This quantity is of interest because one can calculate the Gruneisen constant from it. The Gruneisen constant, y, is used not only in the Gruneisen equation
[This article is copyrighted as indicated in the article. Reuse of AIP content is subject to the terms at: http://scitation.aip.org/termsconditions. Downloaded to ] IP:
130.239.20.174 On: Mon, 24 Nov 2014 23:33:08
712 R.W. Warfield and B. Hartmann: Melting and freezing behavior of polyethylene oxide 712
\\I ~ o ..... en
5
w 24 >o . en :::J .J
i5 3
o ~
o
o 0
o
o o
o
o~------~------~------~------~----~~----~~------~----~~--20 30 40 50 60 70 80 90 100
TEMPERATURE, °C
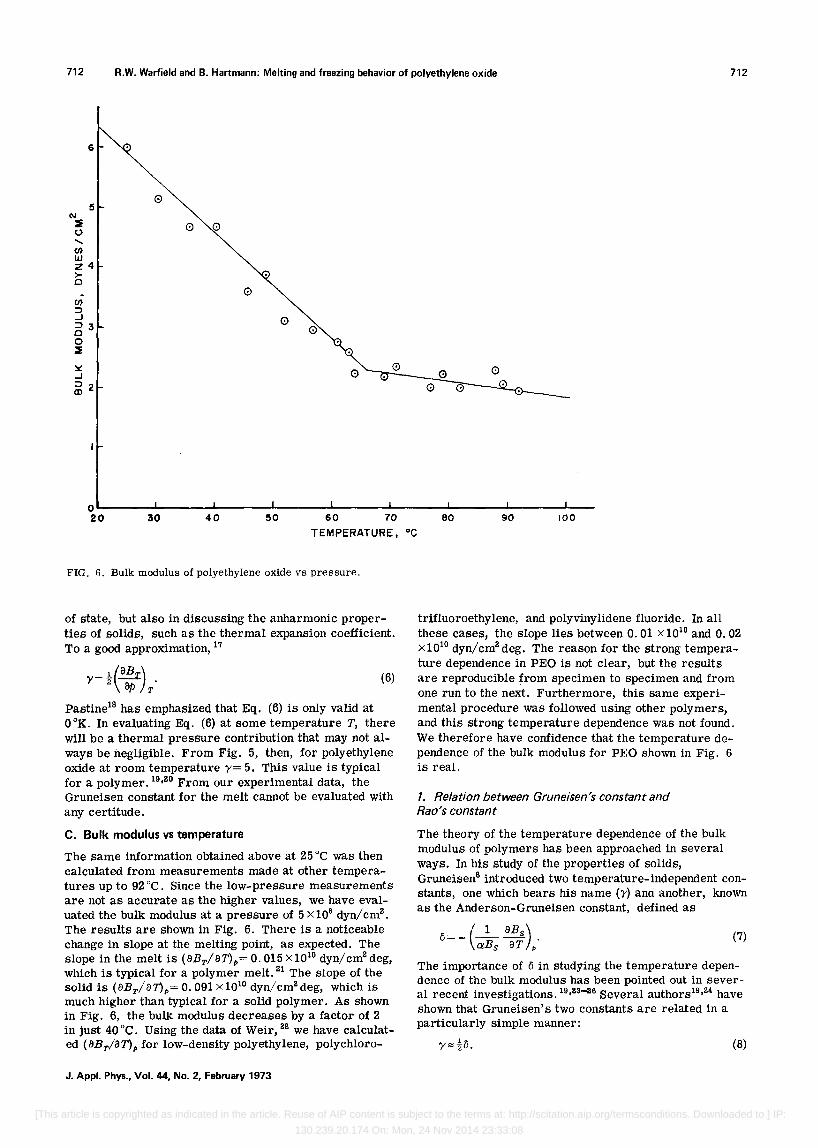
FIG. 6. Bulk modulus of polyethylene oxide vs pressure.
of state, but also in discussing the anharmonic properties of solids, such as the thermal expansion coefficient. To a good approximation, 17
y= t(a~T)T' (6)
Pastine18 has emphasized that Eq. (6) is only valid at OaK. In evaluating Eq. (6) at some temperature T, there will be a thermal pressure contribution that may not always be negligible. From Fig. 5, then, for polyethylene oxide at room temperature y= 5. This value is typical for a polymer. 19,30 From our experimental data, the Gruneisen constant for the melt cannot be evaluated with any certitude.
C. Bulk modulus vs temperature
The same information obtained above at 25 DC was then calculated from measurements made at other temperatures up to 92 DC. Since the low-pressure measurements are not as accurate as the higher values, we have evaluated the bulk modulus at a pressure of 5 x 10⁸ dyn/ cm3
•
The results are shown in Fig. 6. There is a noticeable change in slope at the melting point, as expected. The slope in the melt is (aBT/aT),,= O. 015 xI010 dyn/cm3 deg, which is typical for a polymer melt. 31 The slope of the solid is (aBT/an,,= o. 091 xlOIO dyn/cm2 deg, which is much higher than typical for a solid polymer. As shown in Fig. 6, the bulk modulus decreases by a factor of 2 in just 40 D C. USing the data of Weir, 22 we have calculated (aBT/aT)" for low-density polyethylene, polychloro-
J. Appl. Phys., Vol. 44, No.2, February 1973
trifluoroethylene, and polyvinylidene fluoride. In all these cases, the slope lies between 0.01 x 10¹⁰ and 0.02 xl010 dyn/cm2 deg. The reason for the strong temperature dependence in PEO is not clear, but the results are reproducible from specimen to specimen and from one run to the next. Furthermore, this same experimental procedure was followed using other polymers, and this strong temperature dependence was not found. We therefore have confidence that the temperature dependence of the bulk modulus for PEO shown in Fig. 6 is real.
1. Relation between Gruneisen's constant and Rao's constant
The theory of the temperature dependence of the bulk modulus of polymers has been approached in several ways. In his study of the properties of solids, Gruneisens introduced two temperature-independent constants, one which bears his name (y) and another, known as the Anderson-Gruneisen constant, defined as
6= _ (_1_ aBs) \Q!Bs aT ,,'
(7)
The importance of 6 in studying the temperature dependence of the bulk modulus has been painted out in several recent investigations. 19,23-26 Several authors19 ,24 have shown that Gruneisen's two constants are related in a particularly simple manner:
(8)
[This article is copyrighted as indicated in the article. Reuse of AIP content is subject to the terms at: http://scitation.aip.org/termsconditions. Downloaded to ] IP:
130.239.20.174 On: Mon, 24 Nov 2014 23:33:08
713 R.W. Warfield am4 B. Hartmann: Melting and freezing behavior of polyethylene oxide 713
12
10 0 THIS WORK 0 El REFERENCE 28 0
A CALCULATED FROM DATA OF REFERENCE 29
~ 8 Z ex ... en z 0 0
6 Z
POLYMETHYLMETHACRYLATE UJ en UJ z ~ POLYETHYLENE OXIDE $ 4
POLYETHYLENE
2
O~--~----~~----~------~------~------~----~~----~------~--60 -40 -20 0 20 40 60 80 100 TEMPERATURE, °c
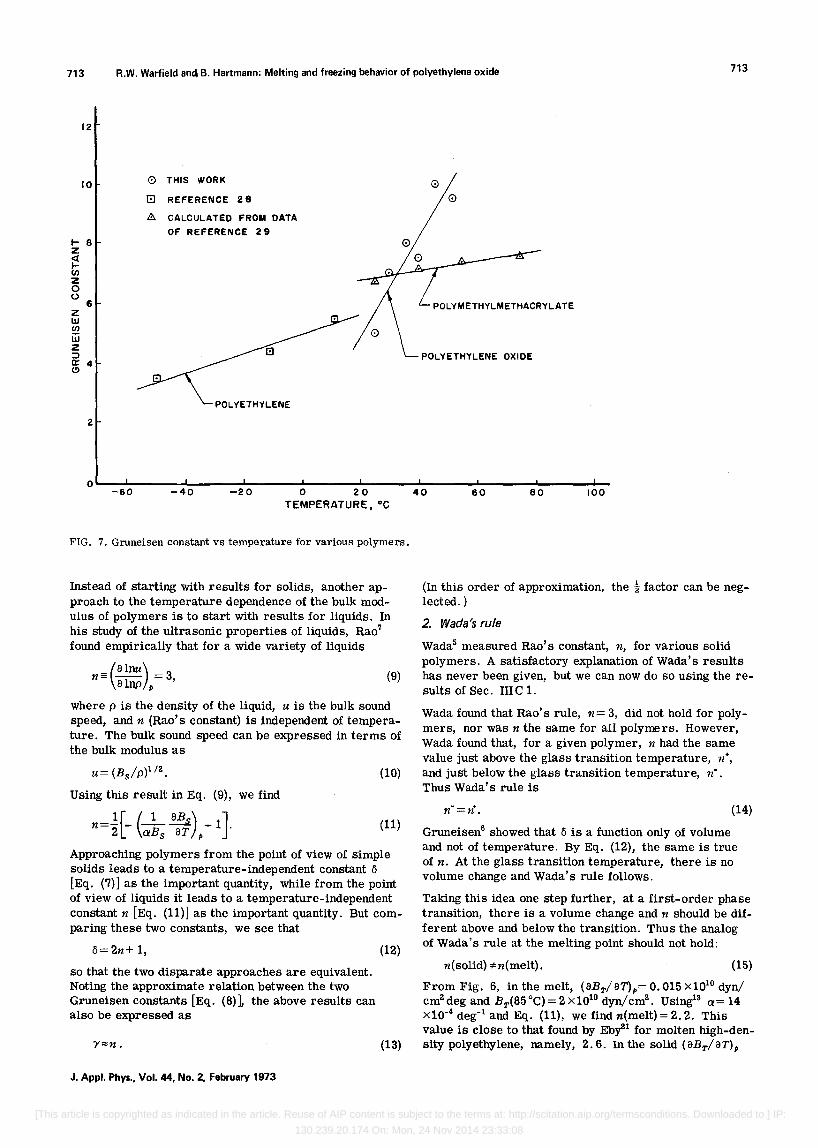
FIG. 7. Gruneisen constant vs temperature for various polymers.
Instead of starting with results for solids, another approach to the temperature dependence of the bulk modulus of polymers is to start with results for liquids. In his study of the ultrasonic properties of liquids, Ra07
found empirically that for a wide variety of liquids
n= (:~:)p = 3, (9)
where p is the density of the liquid, u is the bulk sound speed, and n (Rao's constant) is independent of temperature. The bulk sound speed can be expressed in terms of the bulk modulus as
u= (Bs/p)l/a. (10)
Using this result in Eq. (9), we find
n=.!:[- (_1 ~) -1J. 2 a.Bs aT p
(11)
Approaching polymers from the point of view of simple solids leads to a temperature-independent constant {5
[Eq. (7)] as the important quantity, while from the point of view of liquids it leads to a temperature-independent constant n [Eq. (11)] as the important quantity. But comparing these two constants, we see that
{5= 2n+ 1,
so that the two disparate approaches are equivalent. Noting the approximate relation between the two Gruneisen constants [Eq. (8)], the above results can also be expressed as
J. Appl. Phys., Vol. 44, No.2, February 1973
(12)
(In this order of approximation, the t factor can be neglected. )
2. Wada's rule
Wada5 measured Rao's constant, n, for various solid polymers. A satisfactory explanation of Wada's results has never been given, but we can now do so using the results of Sec. III C 1.
Wada found that Rao's rule, n= 3, did not hold for polymers, nor was n the same for all polyme rs. However, Wada found that, for a given polymer, n had the same value just above the glass transition temperature, nO, and just below the glass transition temperature, n-. Thus Wada's rule is
n-=n+. (14)
Gruneisen6 showed that (5 is a function only of volume and not of temperature. By Eq. (12), the same is true of n. At the glass transition temperature, there is no volume change and Wada's rule follows.
Taking this idea one step further, at a first-order phase transition, there is a volume change and n should be different above and below the transition. Thus the analog of Wada's rule at the melting point should not hold:
n(solid) *" n(melt). (15)
From Fig. 6, in the melt, (aBT/aT)p=O.OI5Xl010dyn/ cmadeg and BT(85°C)=2xI010 dyn/cma. Using13 a.= 14 XlO-4 deg-1 and Eq. (11), we find n(melt) = 2. 2. This value is close to that found by Eby21 for molten high-density polyethylene, namely, 2.6. In the solid (aBT/aT)p
[This article is copyrighted as indicated in the article. Reuse of AIP content is subject to the terms at: http://scitation.aip.org/termsconditions. Downloaded to ] IP:
130.239.20.174 On: Mon, 24 Nov 2014 23:33:08
714 R.W. Warfield and B. Hartmann: Melting and freezing behavior of polyethylene oxide 714
= O. 091 x1010 dyn/cm2 deg, B T (25°C)= 5. 9x10¹⁰ dyn/cm2,
and21 a= 3.3 x 10⁻⁴ deg-1 so that n(solid) = 23. For PEO at least, relation (15) is valid.
3. Temperature dependence of l'
Using Eq. (6), values of the Gruneisen constant as a function of temperature at constant pressure, below the melting point, are shown in Fig. 7. Also shown in Fig. 7 are results of ultrasonic determinations of y for polyethylene27 and polymethylmethacrylate. 28
As with the temperature dependence of the bulk modulus, PEO is seen to have a much stronger temperature dependence than the other polymers. It is assumed6 that y is not a function of temperature at constant volume, but the experiments above were done at constant pressure. Thus changes of y with temperature are due to the fact that the volume changes with temperature at constant pressure or changes of phase. However, the extreme temperature dependence shown above for y indicates a very large thermal pressure contribution to y, and hence the approximation of Eq. (6) is questionable. Using Eq. (13) in the solid gives y= 23, as opposed to y= 5 using Eq. (6).
IV. CONCLUSIONS
Measurements have been made of the temperature and pressure dependence of the bulk modulus of PEO. Based on these measurements, the following conclusions are reached: (a) The freezing point is about 10 °C less than the melting point (68°C), but the pressure dependence of the freezing point is the same as that of the melting point, 0.009°C/atm. (b) Wada's rule does not hold for transitions in which the volume changes. (c) The Gruneisen constant and Rao's constant are approximately equal. (d) The bulk modulus and the calculated Gruneisen constant uncorrected for thermal pressure both have a very strong temperature dependence.
J. Appl. Phys., Vol. 44, No.2, February 1973
*Work supported by the Naval Ordnance Laboratory Independent Research fund and the Office of Naval Research.
IS. Matsuoka and B. Maxwell, J. Polym. Sci. 32,131 (1959). 2L. R. Fortune and G. N. Malcolm, J. Phys. Chern. 64, 934 (1960). 3L. Mandelkern, Crystallization 0/ Polymers (McGraw-Hill, New York,
1963). 4W. Braun, K. H. Hellwege, and W. Knappe, Kolloid-Z. 215, 10
(1967). sy' Wada and K. Yamamoto, J. Phys. Soc. Jap. 11,887 (1956). 6E. Gruneisen, Ann. Phys. 38, 257 (1912). 7M. Rao, J. Chern. Phys. 9, 682 (1941). 8R. W. Warfield, J. App!. Chern. 17,263 (1967); Makromo!' Chern.
116, 78 (1968). 9C. R. Wylie, Advanced Engineering Mathematics, 3rd ed.
(McGraw-Hill, New York, 1966), pp. 134-136. 10H. Tadokoro, Y. Chatani, T. Yoshihara, S. Tahara, and S. Murahashi,
Makromo!' Chern. 73, 109 (1964). liE. Baer and J. L. Kardos, J. Polym. Sci. A 3, 2827 (1965). 12Reference 3, pp. 20-33. 13J. Jarzynski and B. Hartmann, J. Acoust. Soc. Am. 49, 88 (1971). 14Reference 3, p. 119. ISL. O. Landau and E. M. Lifshitz, Statistical Physics (Pergamon,
London, 1958), pp. 259-260. 16R. W. Warfield, J. E. Cuevas, and F. R. Barnet, Rheo!. Acta 9, 439
(1970). 17J. C. Slater, Introduction to Chemical Physics, 1st ed. (McGraw-Hill,
New York, 1939), p. 239. 180. J. Pastine, J. Chern. Phys. 49, 3012 (1968); O. J. Pastine (private
communication). 19M. G. Broadhurst and F. I. Mopsik, J. Chern. Phys. 52, 3634 (1970). 2°0. J. Pastine, Proceedings o/"Colloque lnternationale du CNR.S. sur
Les Proprietes Physiques des Solides Sous Pression" (CNRS, Paris, 1970), p. 49.
21R. K. Eby, J. Acoust. Soc. Am. 36, 1485 (1964). 22C. E. Weir, J. Res. Nat!. Bur. Stand. (U.S.) 53, 245 (1954). 230. L. Anderson, Phys. Rev. 144, 553 (1966). 24y A. Chang, J. Phys. Chern. Solids 28, 697 (1967). 2SV. K. Mathur, S. P. Singh, and O. R. Vij, J. Chern. Phys. 48,4784
(1968). 26S. Rajagopolan, J. Phys. Chern. Solids 31, 1644 (1970). 27y' Wada, A. Itani, T. Nishi, and S. Nagai, J. Polym. Sci. A-2 7, 201
(1969). 28J. R. Asay, O. L. Lamberson, and A. H. Guenther, J. App!. Phys.
40, 1768 (1969).
[This article is copyrighted as indicated in the article. Reuse of AIP content is subject to the terms at: http://scitation.aip.org/termsconditions. Downloaded to ] IP:
130.239.20.174 On: Mon, 24 Nov 2014 23:33:08