Embed Size (px)
Citation preview

1 Sept, 2011 MELIOR DISCOVERY, Inc.: Neurophysiology Models
Nerve Conduction / NeuropathyNeuromuscular Reflex Function
Spinal Reflex ExcitabilityCortical & Neuromuscular Evoked Potentials
Auditory Sensory Gating
Electrophysiology Models
1 Sept, 2011 MELIOR DISCOVERY, Inc.: Neurophysiology Models 2
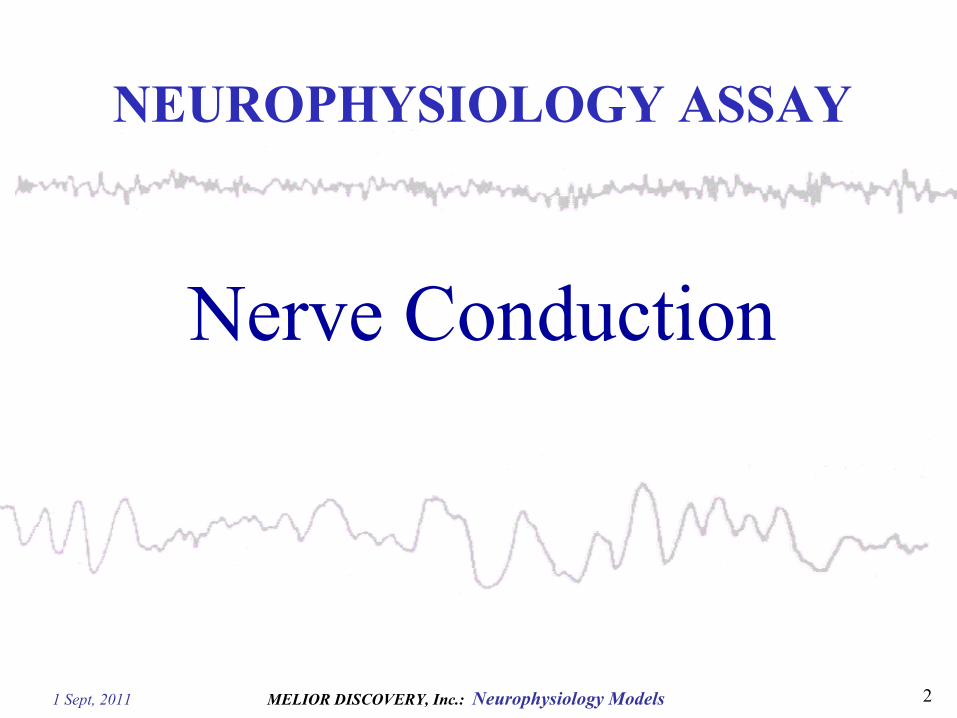
NEUROPHYSIOLOGY ASSAY
Nerve Conduction
1 Sept, 2011 MELIOR DISCOVERY, Inc.: Neurophysiology Models 3
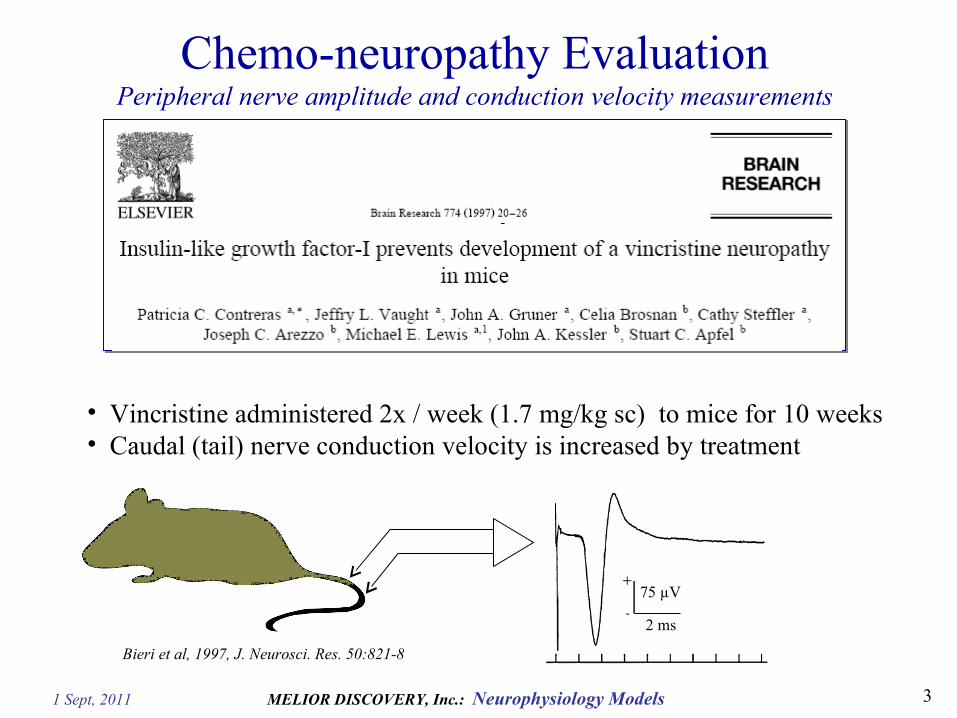
Chemo-neuropathy EvaluationPeripheral nerve amplitude and conduction velocity measurements
• Vincristine administered 2x / week (1.7 mg/kg sc) to mice for 10 weeks• Caudal (tail) nerve conduction velocity is increased by treatment
Bieri et al, 1997, J. Neurosci. Res. 50:821-8
75 µV
2 ms
1 Sept, 2011 MELIOR DISCOVERY, Inc.: Neurophysiology Models4
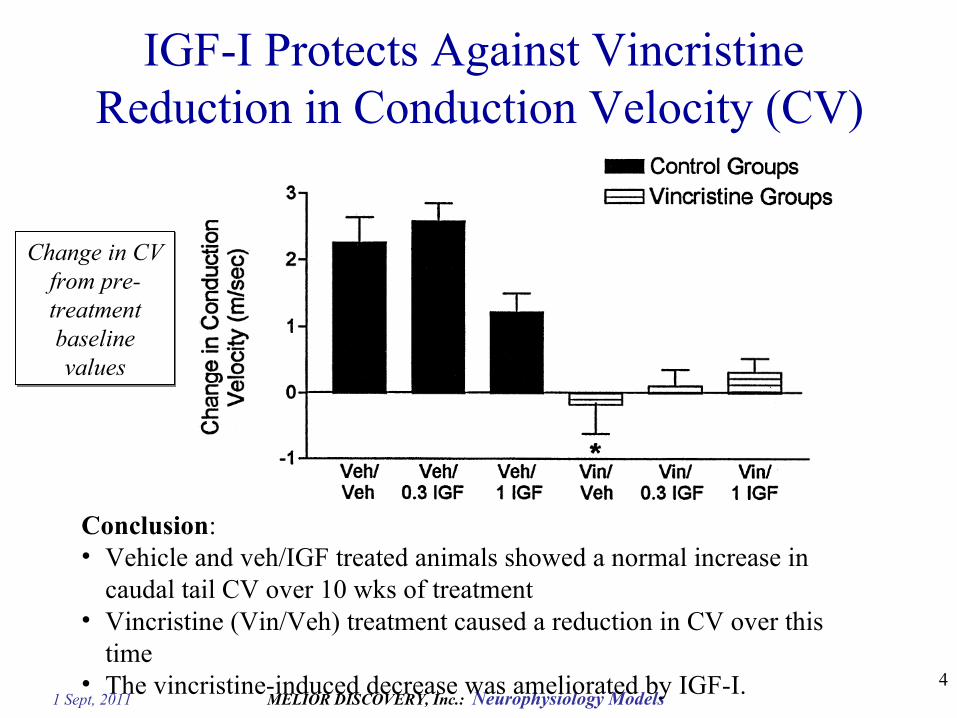
Conclusion: • Vehicle and veh/IGF treated animals showed a normal increase in
caudal tail CV over 10 wks of treatment• Vincristine (Vin/Veh) treatment caused a reduction in CV over this
time• The vincristine-induced decrease was ameliorated by IGF-I.
IGF-I Protects Against Vincristine Reduction in Conduction Velocity (CV)
Change in CV from pre-treatment baseline values
1 Sept, 2011 MELIOR DISCOVERY, Inc.: Neurophysiology Models 5
• Gait measures (ipsi- and contralateral limb support) were reduced by
vincristine treatment. IGF-I (1 mg/kg sc) reduced the effect of
vincristine.
• Hot plate latency was increased by vincristine treatment. The increase
was prevented by IGF-I (1 mg/kg sc).
• Axonal pathology (abnormal axons and myelin) produced by vincristine
treatment was prevented by IGF-I (1 mg/kg sc).
• Body weight was not affected by vincristine or IGF-I.
Behavioral and Morphological Protectionby IGF-I in Vincristine Chemoneuropathy
1 Sept, 2011 MELIOR DISCOVERY, Inc.: Neurophysiology Models 6
American Journal of Pathology, Vol. 155, No. 2, August 1999
Copyright © American Society for Investigative Pathology
Neurophysiological, Behavioral, and Morphological Evaluation of SOD-KO Mice
• Mice lacking cytoplasmic Cu/Zn superoxide dismutase (SOD) were used as a model of the neurodegenerative effects of familial ALS.
• Caudal (mixed, tail), sural (sensory), and tibial (motor) nerve conduction velocity and amplitudes were evaluated at 5 – 7 mos of age.
• Rod-running latency and stride length were evaluated at 4, 6, and 14 mos.• Nerve histology and muscle histochemistry (SDH; red vs white fibers)
were evaluated at 2 and 6 mos.
1 Sept, 2011 MELIOR DISCOVERY, Inc.: Neurophysiology Models 7
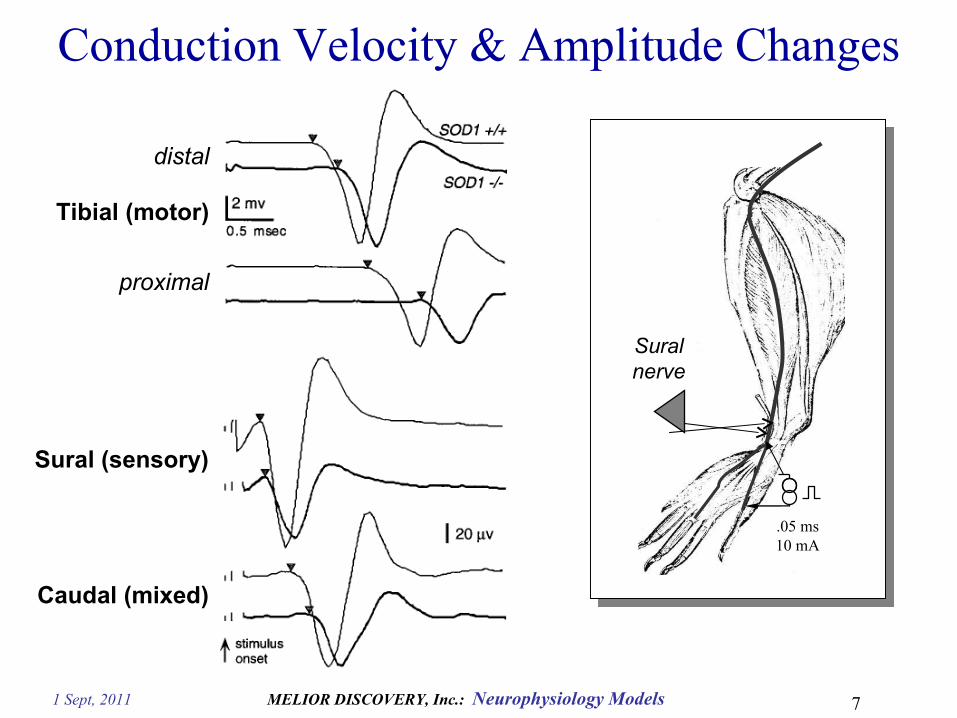
Conduction Velocity & Amplitude Changes
Tibial (motor)
distal
proximal
Sural (sensory)
Caudal (mixed)
Suralnerve
.05 ms10 mA
1 Sept, 2011 MELIOR DISCOVERY, Inc.: Neurophysiology Models 8
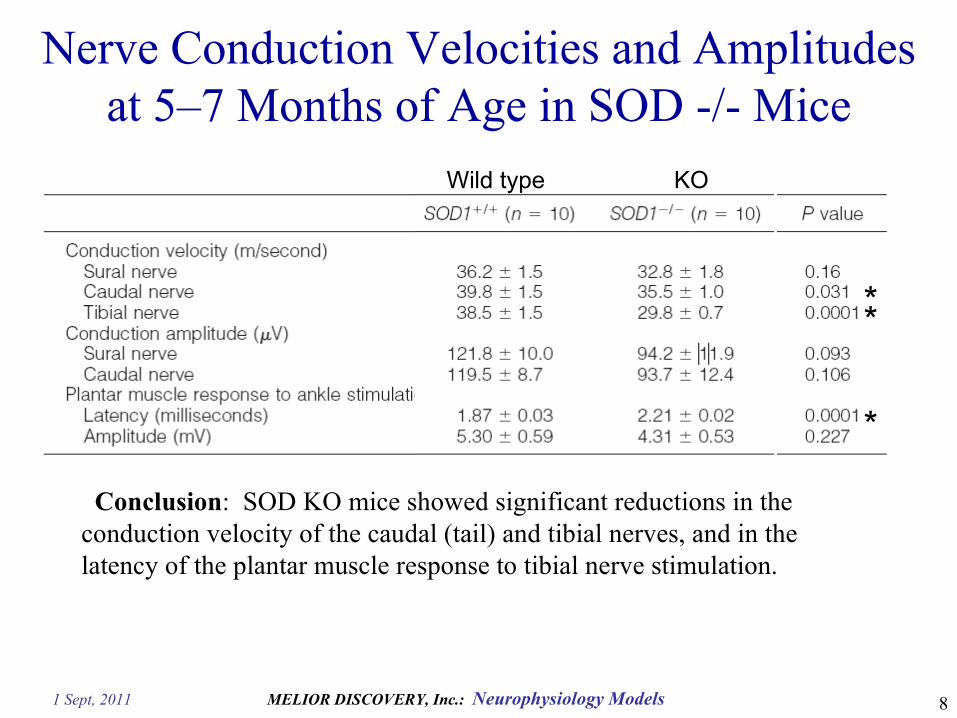
Nerve Conduction Velocities and Amplitudes at 5–7 Months of Age in SOD -/- Mice
Wild type KO
**
*
Conclusion: SOD KO mice showed significant reductions in the conduction velocity of the caudal (tail) and tibial nerves, and in the latency of the plantar muscle response to tibial nerve stimulation.
1 Sept, 2011 MELIOR DISCOVERY, Inc.: Neurophysiology Models
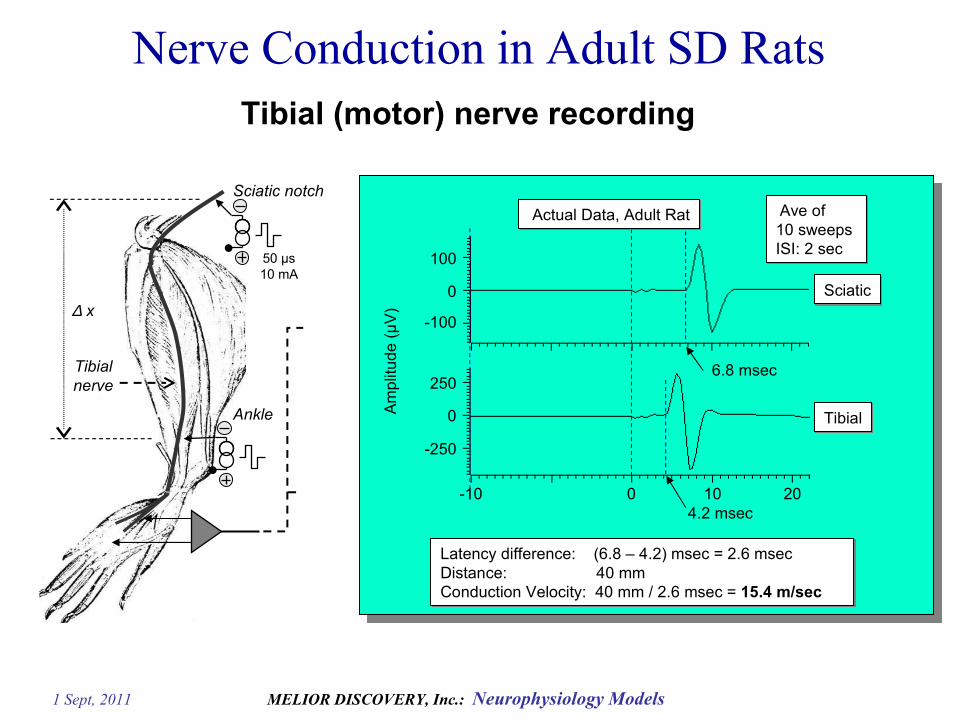
Nerve Conduction in Adult SD Rats
Sciatic notch
Ankle
50 µs10 mA
Tibial (motor) nerve recording
∆ x
Tibialnerve
Ave of10 sweeps ISI: 2 sec
Sciatic
100
0
-100
250
0
-250
Am
plitu
de (
µV
)
4.2 msec
6.8 msec
Latency difference: (6.8 – 4.2) msec = 2.6 msecDistance: 40 mmConduction Velocity: 40 mm / 2.6 msec = 15.4 m/sec
Tibial
0 20-10 10
Actual Data, Adult Rat
1 Sept, 2011 MELIOR DISCOVERY, Inc.: Neurophysiology Models
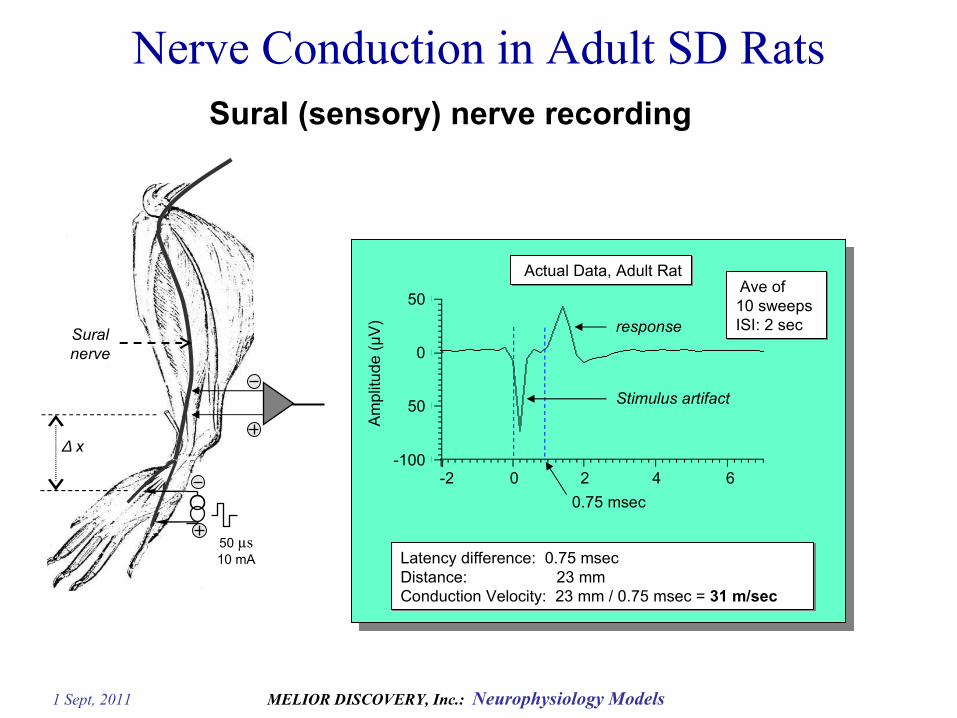
Nerve Conduction in Adult SD Rats
50 µs10 mA
Sural (sensory) nerve recording
Suralnerve
∆ x
Am
plitu
de (
µV
)
0.75 msec
Actual Data, Adult Rat
Latency difference: 0.75 msec Distance: 23 mmConduction Velocity: 23 mm / 0.75 msec = 31 m/sec
50
0
-100
50
0 2 6-2 4
Ave of10 sweeps ISI: 2 sec
Stimulus artifact
response
1 Sept, 2011 MELIOR DISCOVERY, Inc.: Neurophysiology Models
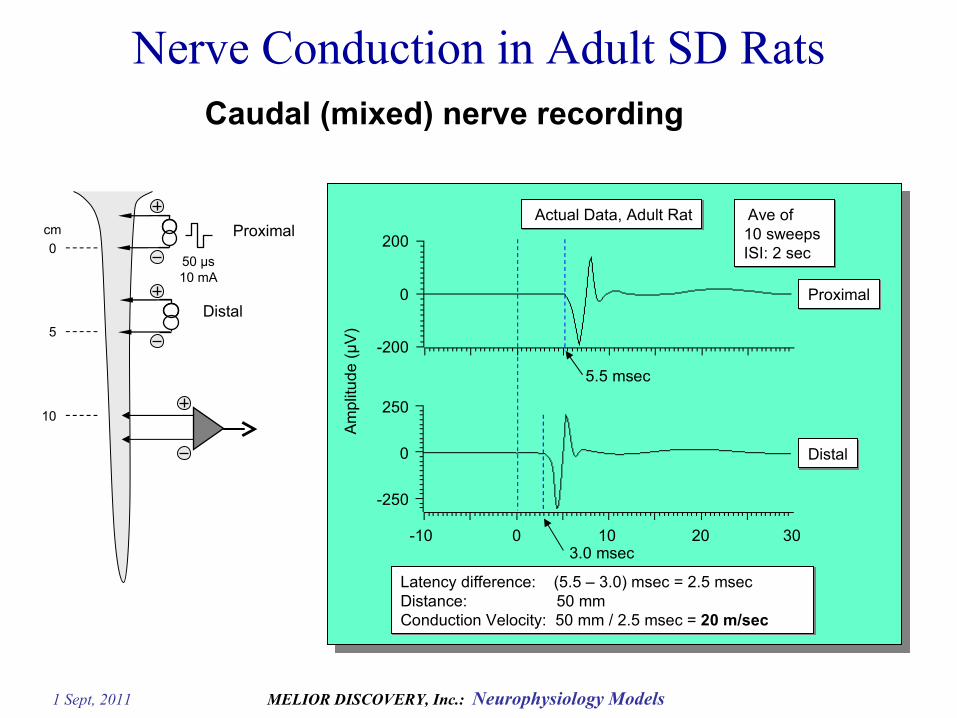
Nerve Conduction in Adult SD Rats
Proximal
Distal
200
0
-200
250
0
-250
Am
plitu
de (
µV
)
0 10 20 30-103.0 msec
5.5 msec
Actual Data, Adult Rat
Latency difference: (5.5 – 3.0) msec = 2.5 msecDistance: 50 mmConduction Velocity: 50 mm / 2.5 msec = 20 m/sec
Ave of10 sweeps ISI: 2 sec
50 µs10 mA
0
5
10
cm Proximal
Distal
Caudal (mixed) nerve recording
1 Sept, 2011 MELIOR DISCOVERY, Inc.: Neurophysiology Models 12
Spinal Reflex Excitability:
C-fiber and Monosynaptic Reflexes
1 Sept, 2011 MELIOR DISCOVERY, Inc.: Neurophysiology Models
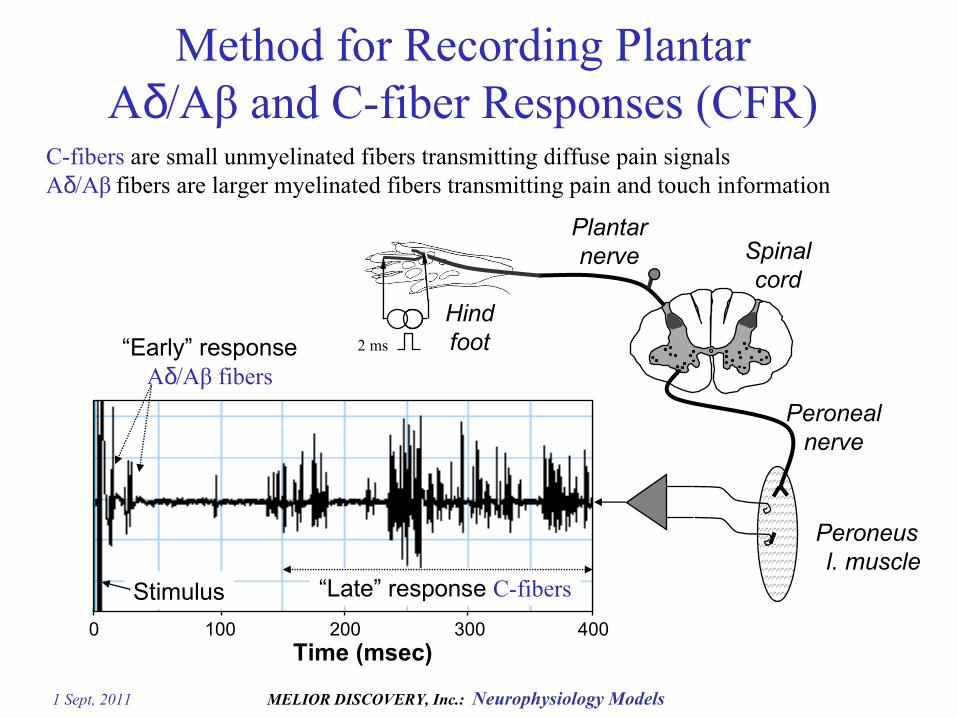
“Early” responseAδ/Aβ fibers
“Late” response C-fibers
100 200 3000 400
Stimulus
Time (msec)
Plantarnerve
Peroneus l. muscle
Spinalcord
Peronealnerve
Hindfoot2 ms
Method for Recording PlantarAδ/Aβ and C-fiber Responses (CFR)
C-fibers are small unmyelinated fibers transmitting diffuse pain signalsAδ/Aβ fibers are larger myelinated fibers transmitting pain and touch information
1 Sept, 2011 MELIOR DISCOVERY, Inc.: Neurophysiology Models
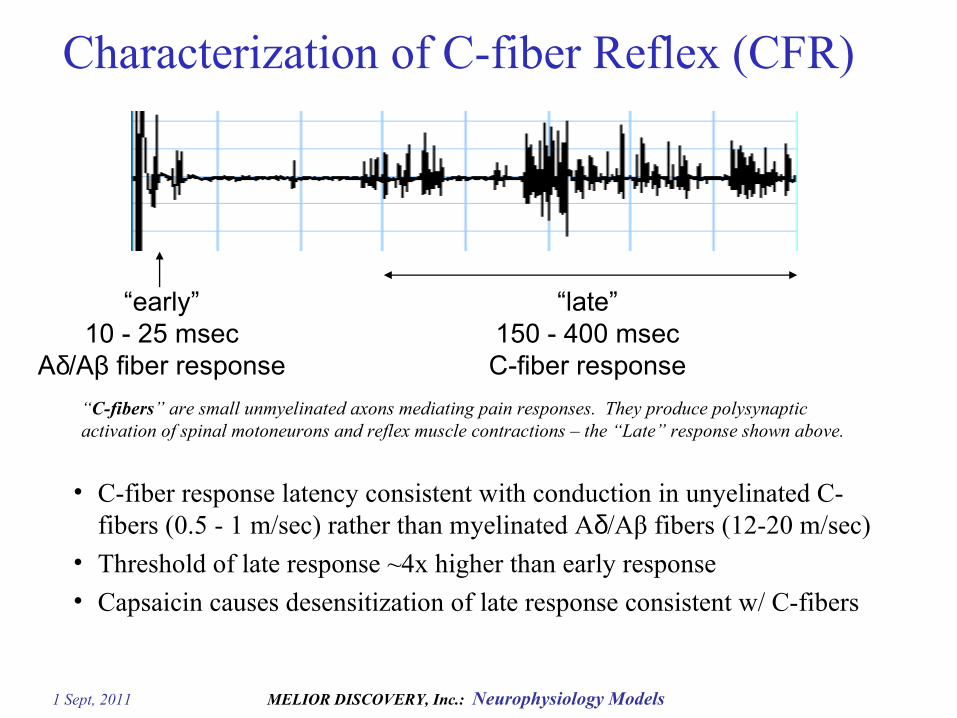
“early”10 - 25 msec
Aδ/Aβ fiber response
“late”150 - 400 msecC-fiber response
Characterization of C-fiber Reflex (CFR)
• C-fiber response latency consistent with conduction in unyelinated C-fibers (0.5 - 1 m/sec) rather than myelinated Aδ/Aβ fibers (12-20 m/sec)
• Threshold of late response ~4x higher than early response
• Capsaicin causes desensitization of late response consistent w/ C-fibers
“C-fibers” are small unmyelinated axons mediating pain responses. They produce polysynaptic activation of spinal motoneurons and reflex muscle contractions – the “Late” response shown above.
1 Sept, 2011 MELIOR DISCOVERY, Inc.: Neurophysiology Models
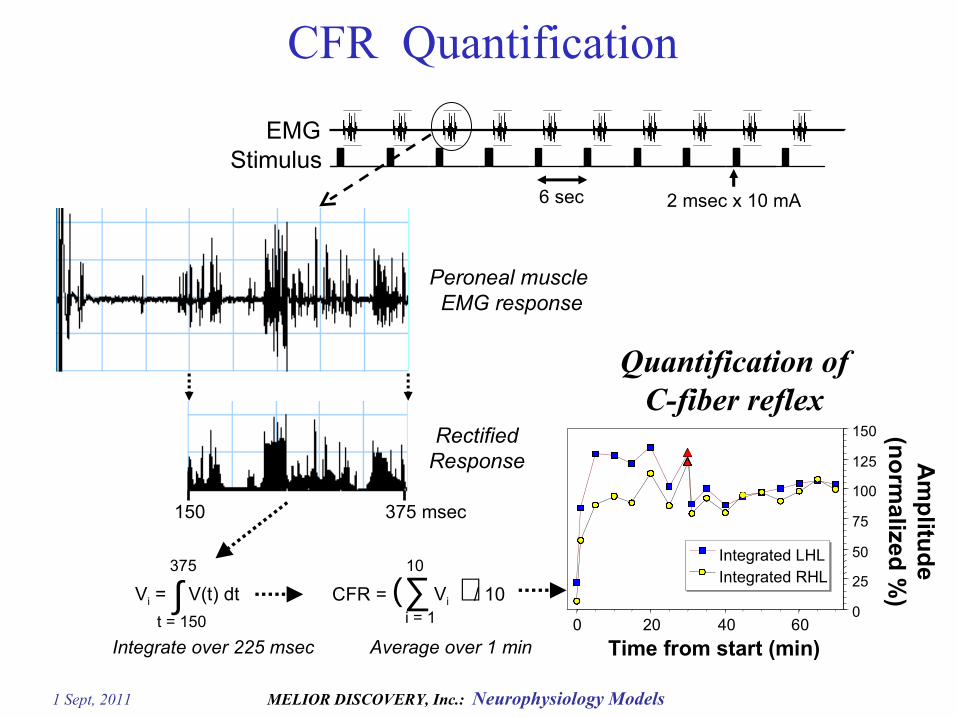
Quantification of C-fiber reflex
Peroneal muscle EMG response
RectifiedResponse
375 msec150
∫375
t = 150
Vi = V(t) dt ∑10
i = 1
ViCFR = ( ) / 10
Average over 1 minIntegrate over 225 msec Time from start (min)
Am
plitu
de
(no
rmalized
%)
6 sec 2 msec x 10 mA
EMGStimulus
0
25
50
75
100
125
150
0 20 40 60
Integrated LHLIntegrated RHLIntegrated LHLIntegrated RHL
CFR Quantification
1 Sept, 2011 MELIOR DISCOVERY, Inc.: Neurophysiology Models
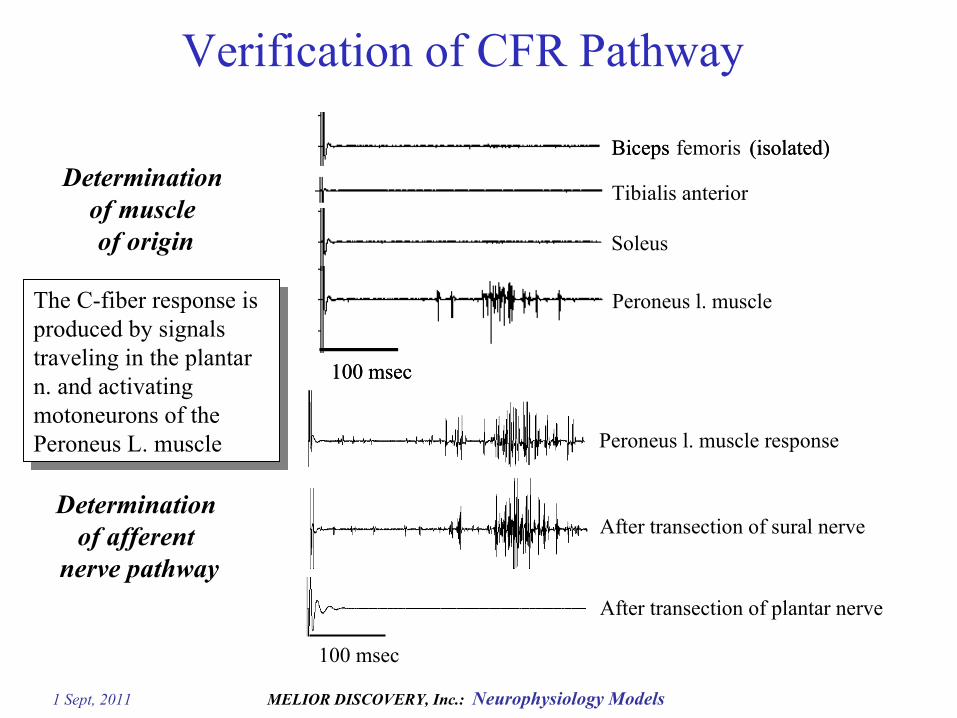
Peroneus l. muscle
Tibialis anterior
Biceps femoris (isolated)
Soleus
100 msec
Biceps (isolated)
100 msec
Determination of afferent
nerve pathway
Determination of muscle of origin
Peroneus l. muscle response
After transection of sural nerve
100 msec
After transection of plantar nerve
Verification of CFR Pathway
The C-fiber response is produced by signals traveling in the plantar n. and activating motoneurons of the Peroneus L. muscle
1 Sept, 2011 MELIOR DISCOVERY, Inc.: Neurophysiology Models
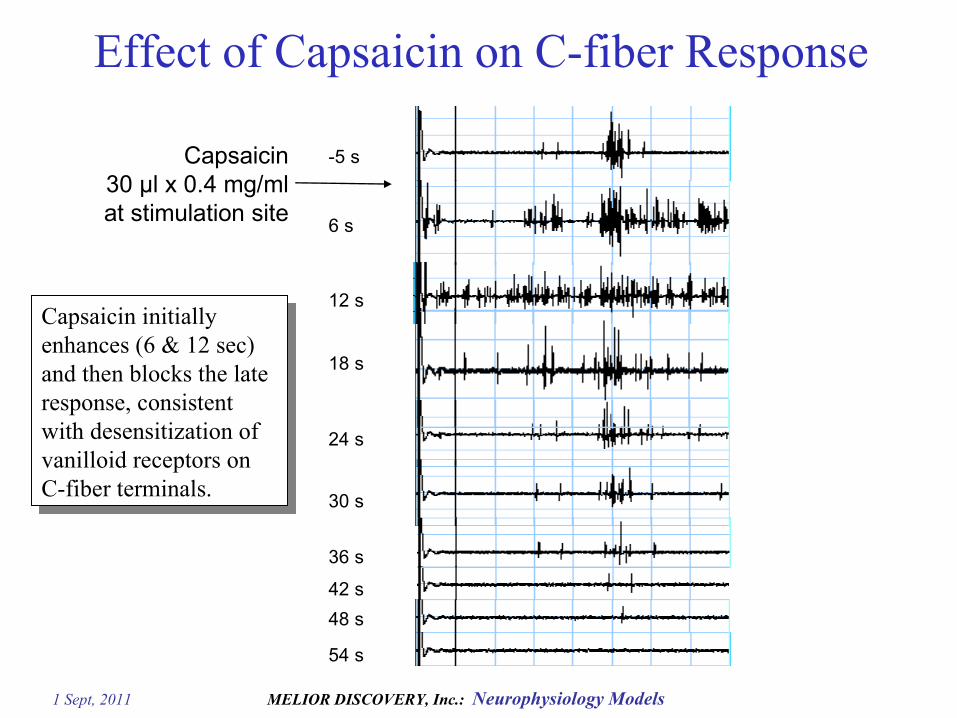
Capsaicin30 µl x 0.4 mg/mlat stimulation site
Effect of Capsaicin on C-fiber Response
18 s
24 s
30 s
36 s
42 s
48 s
54 s
6 s
12 s
-5 s
Capsaicin initially enhances (6 & 12 sec) and then blocks the late response, consistent with desensitization of vanilloid receptors on C-fiber terminals.
1 Sept, 2011 MELIOR DISCOVERY, Inc.: Neurophysiology Models
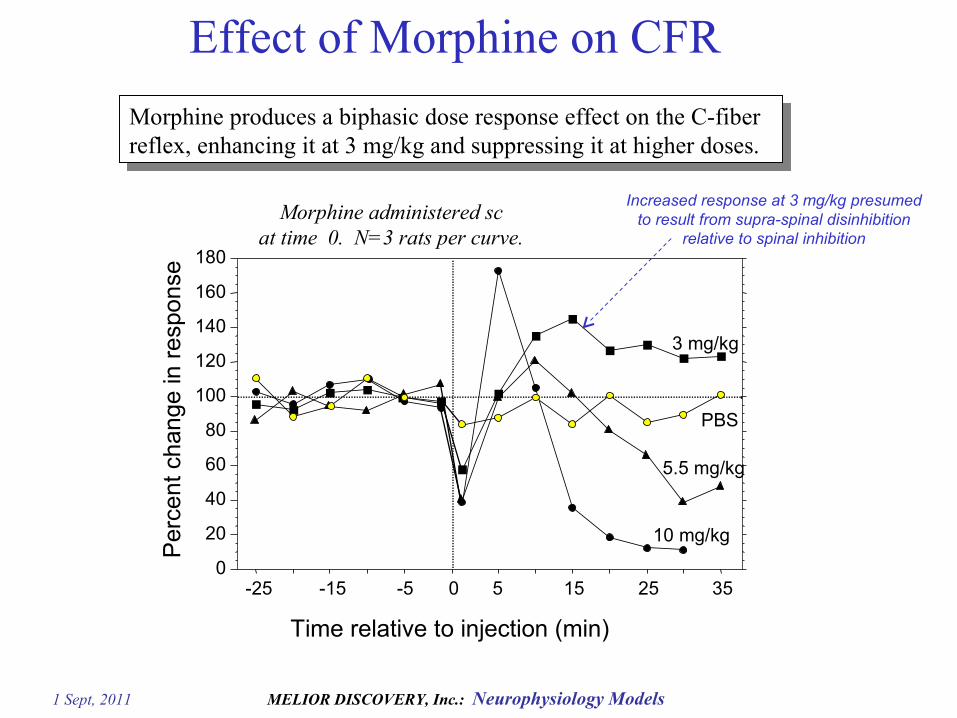
Increased response at 3 mg/kg presumed to result from supra-spinal disinhibition
relative to spinal inhibition
Per
cent
cha
nge
in r
espo
nse
Time relative to injection (min)
0
20
40
60
80
100
120
140
160
180
-25 -15 -5 0 5 15 25 35
10 mg/kg
5.5 mg/kg
3 mg/kg
PBS
Morphine administered scat time 0. N=3 rats per curve.
Effect of Morphine on CFR
Morphine produces a biphasic dose response effect on the C-fiber reflex, enhancing it at 3 mg/kg and suppressing it at higher doses.
1 Sept, 2011 MELIOR DISCOVERY, Inc.: Neurophysiology Models
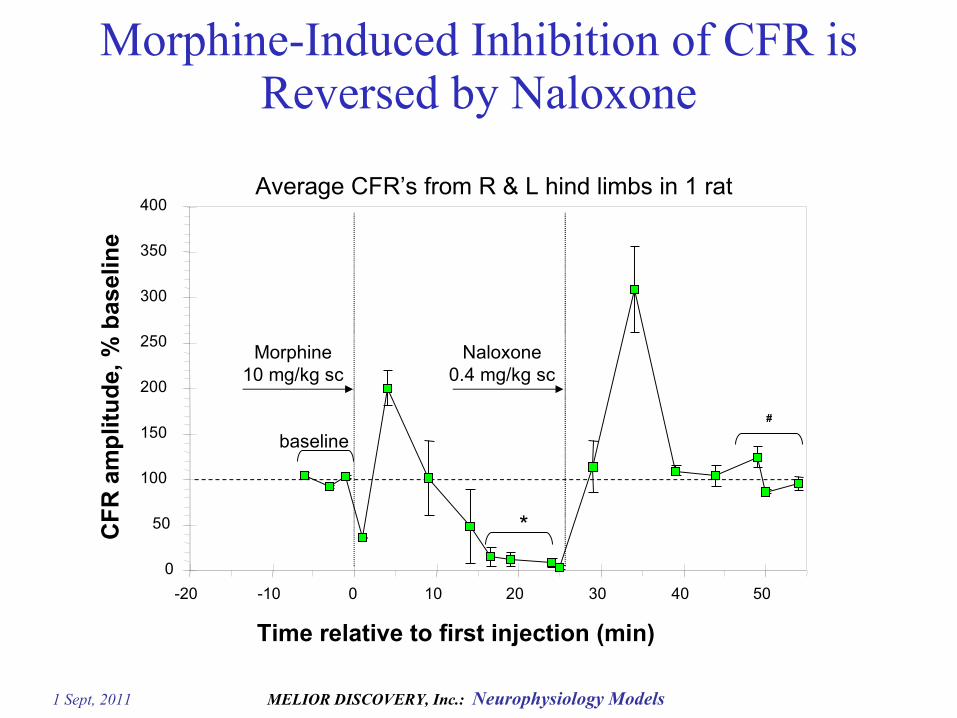
Morphine-Induced Inhibition of CFR is Reversed by Naloxone
Average CFR’s from R & L hind limbs in 1 rat
0
50
100
150
200
250
300
350
400
-20 -10 0 10 20 30 40 50
CF
R a
mp
litu
de,
% b
asel
ine
Morphine10 mg/kg sc
Naloxone0.4 mg/kg sc
Time relative to first injection (min)
baseline
*
#
1 Sept, 2011 MELIOR DISCOVERY, Inc.: Neurophysiology Models
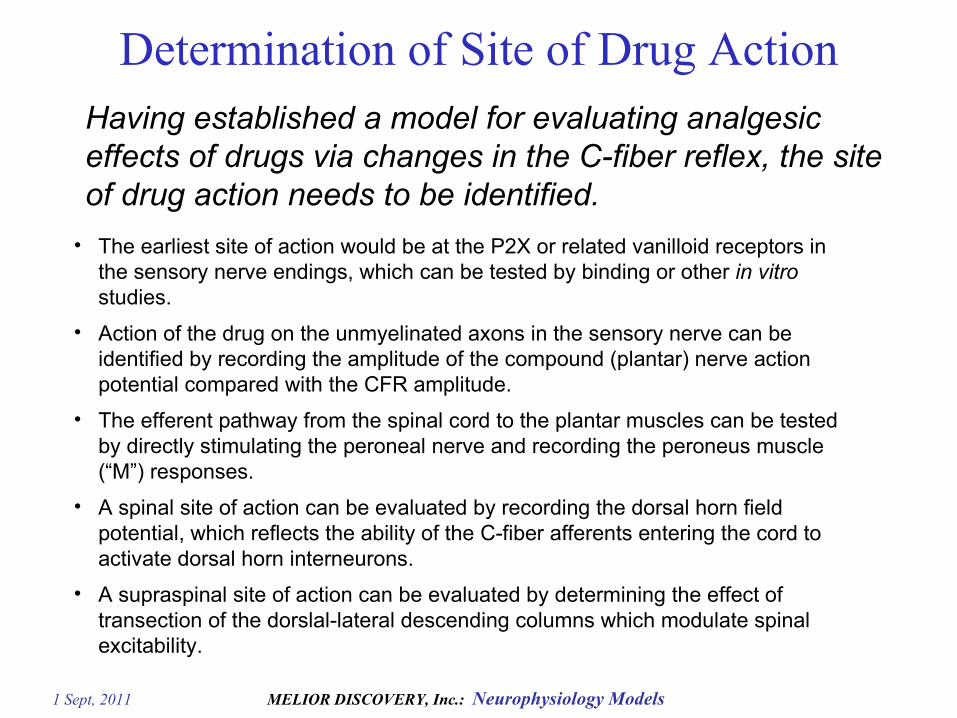
Determination of Site of Drug Action
• The earliest site of action would be at the P2X or related vanilloid receptors in the sensory nerve endings, which can be tested by binding or other in vitro studies.
• Action of the drug on the unmyelinated axons in the sensory nerve can be identified by recording the amplitude of the compound (plantar) nerve action potential compared with the CFR amplitude.
• The efferent pathway from the spinal cord to the plantar muscles can be tested by directly stimulating the peroneal nerve and recording the peroneus muscle (“M”) responses.
• A spinal site of action can be evaluated by recording the dorsal horn field potential, which reflects the ability of the C-fiber afferents entering the cord to activate dorsal horn interneurons.
• A supraspinal site of action can be evaluated by determining the effect of transection of the dorslal-lateral descending columns which modulate spinal excitability.
Having established a model for evaluating analgesic effects of drugs via changes in the C-fiber reflex, the site of drug action needs to be identified.
1 Sept, 2011 MELIOR DISCOVERY, Inc.: Neurophysiology Models
Peroneal muscle EMG
50 msec
Plantar nerve
0
20
40
60
80
100
0 3 6 9 12 15
Stimulus current (mA)
Inte
grat
ed E
MG
/ C
AP
(% m
ax.)
Peroneal m.EMG
Plantar n.APV
Stimulus-Response Recruitment
Peroneus l.muscle
Hind footstimulation
2 ms14 → 0 mA
Spinalcord
Plantar nerve afferent volley
Conduction velocity = 0.5 - 1.0 m/s
Integration window
Plantar n. Afferent Volley versus CFR
1 Sept, 2011 MELIOR DISCOVERY, Inc.: Neurophysiology Models
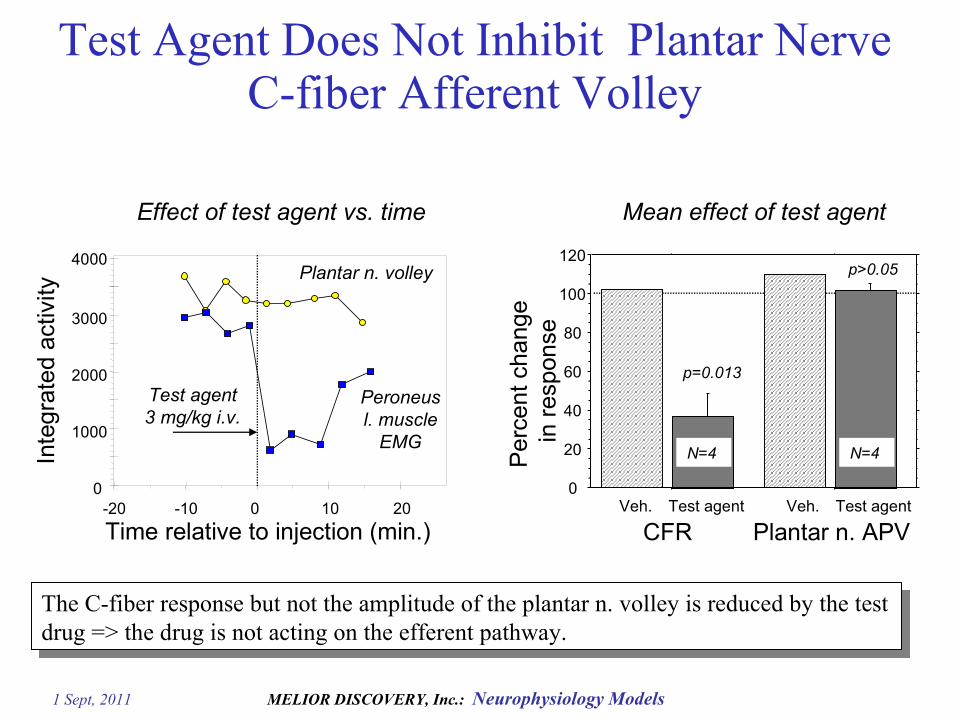
Test Agent Does Not Inhibit Plantar Nerve C-fiber Afferent Volley
Mean effect of test agentEffect of test agent vs. time
Per
cent
cha
nge
in r
espo
nse
CFR Plantar n. APV
0
20
40
60
80
100
120
Veh. Test agent Veh. Test agent
p=0.013
p>0.05
N=4 N=4
0
1000
2000
3000
-20 -10 0 10 20
Inte
grat
ed a
ctiv
ity
Peroneusl. muscle
EMG
Plantar n. volley4000
Time relative to injection (min.)
Test agent3 mg/kg i.v.
The C-fiber response but not the amplitude of the plantar n. volley is reduced by the test drug => the drug is not acting on the efferent pathway.
1 Sept, 2011 MELIOR DISCOVERY, Inc.: Neurophysiology Models
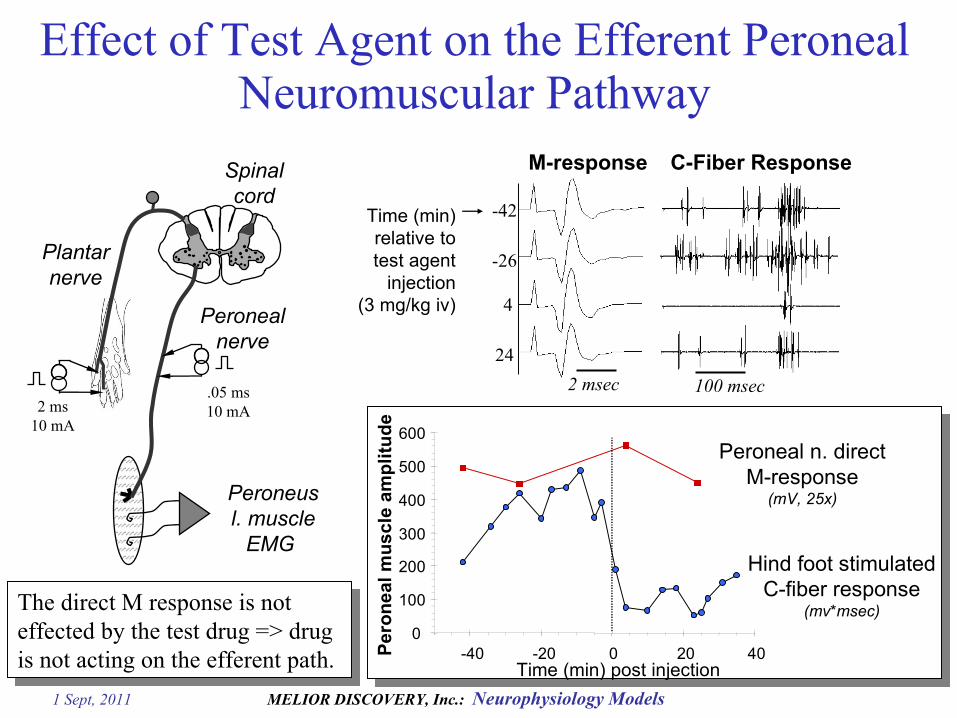
Effect of Test Agent on the Efferent Peroneal Neuromuscular Pathway
Plantarnerve
2 ms10 mA
Spinalcord
Peroneus l. muscle
EMG
Peronealnerve
.05 ms10 mA
0
100
200
300
400
500
600
-40 -20 0 20 40Per
on
eal
mu
scle
am
pli
tud
e
Hind foot stimulatedC-fiber response
(mv*msec)
Peroneal n. directM-response
(mV, 25x)
Time (min) post injection
-42
4
-26
24
2 msec
Time (min)relative totest agent
injection(3 mg/kg iv)
100 msec
M-response C-Fiber Response
The direct M response is not effected by the test drug => drug is not acting on the efferent path.
1 Sept, 2011 MELIOR DISCOVERY, Inc.: Neurophysiology Models
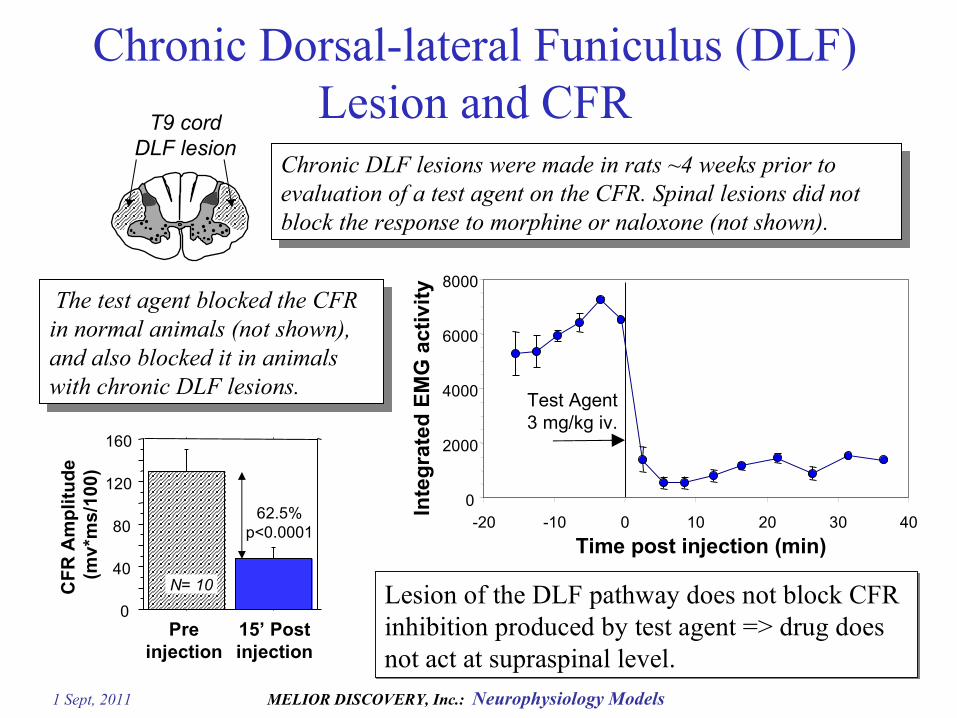
Chronic Dorsal-lateral Funiculus (DLF) Lesion and CFRT9 cord
DLF lesion
Test Agent3 mg/kg iv.
0
2000
4000
6000
8000
-20 -10 0 10 20 30 40
Time post injection (min)
Inte
gra
ted
EM
G a
ctiv
ity
CF
R A
mp
litu
de
(mv*
ms/
100)
0
40
80
120
160
Preinjection
15’ Postinjection
62.5%p<0.0001
N= 10
The test agent blocked the CFR in normal animals (not shown), and also blocked it in animals with chronic DLF lesions.
Chronic DLF lesions were made in rats ~4 weeks prior to evaluation of a test agent on the CFR. Spinal lesions did not block the response to morphine or naloxone (not shown).
Lesion of the DLF pathway does not block CFR inhibition produced by test agent => drug does not act at supraspinal level.
1 Sept, 2011 MELIOR DISCOVERY, Inc.: Neurophysiology Models
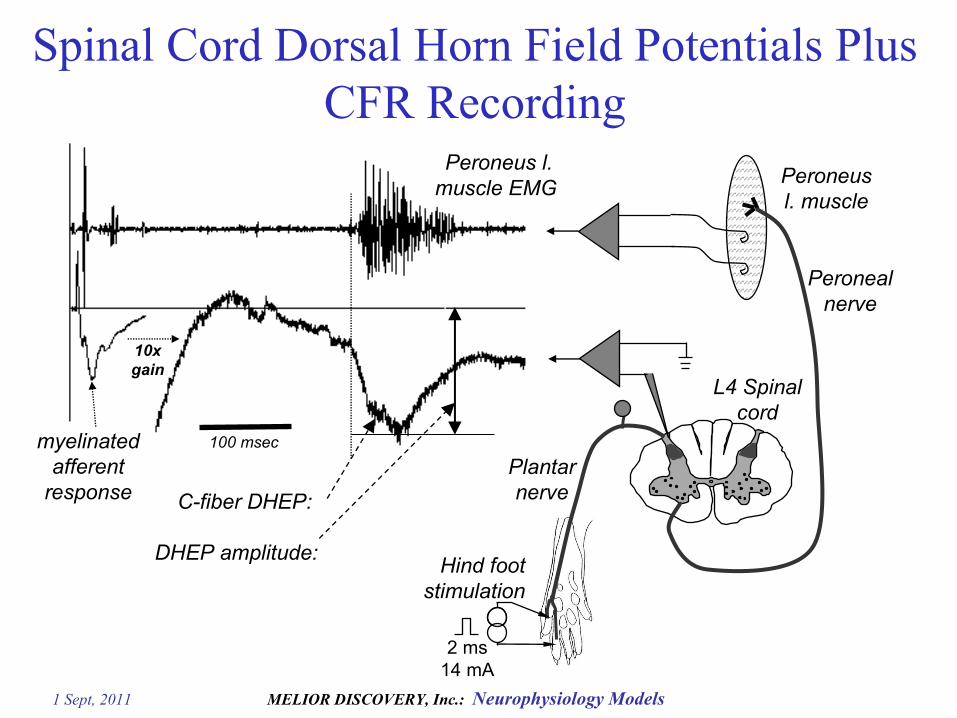
Peroneusl. muscle
100 msec
Plantarnerve
2 ms14 mA
L4 Spinalcord
Peroneus l.muscle EMG
myelinated afferent
response C-fiber DHEP:
DHEP amplitude:Hind foot
stimulation
10xgain
Peronealnerve
Spinal Cord Dorsal Horn Field Potentials Plus CFR Recording
1 Sept, 2011 MELIOR DISCOVERY, Inc.: Neurophysiology Models
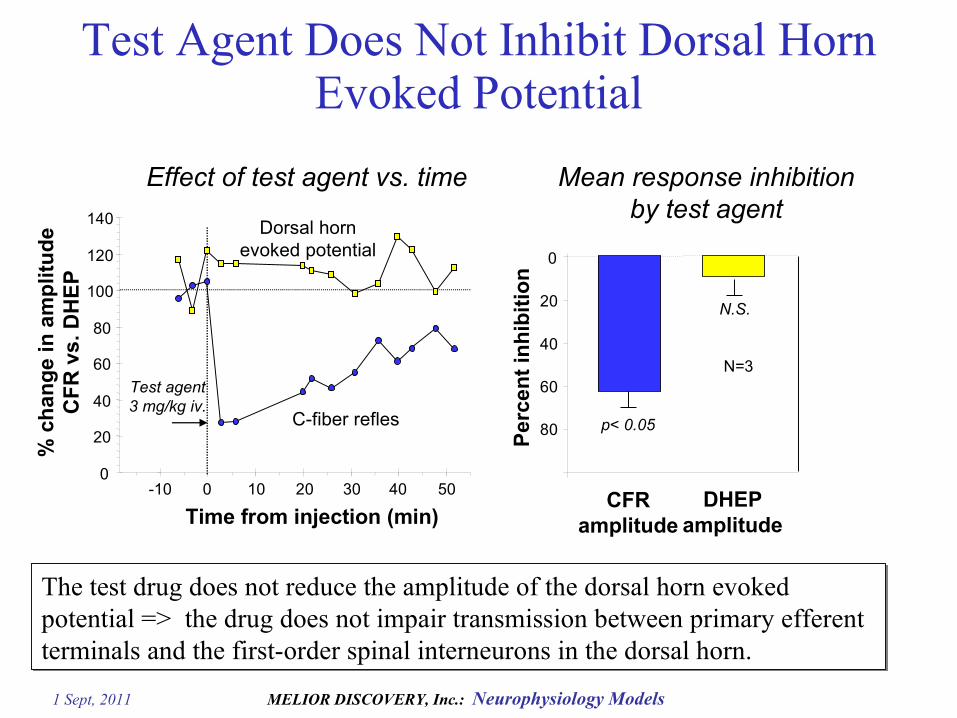
Test Agent Does Not Inhibit Dorsal Horn Evoked Potential
Effect of test agent vs. time Mean response inhibitionby test agent
0
20
40
60
80
100
120
140
-10 0 10 20 30 40 50
% c
han
ge
in a
mp
litu
de
CF
R v
s. D
HE
P
C-fiber refles
Dorsal hornevoked potential
Time from injection (min)
Test agent3 mg/kg iv.
Per
cen
t in
hib
itio
n
80
60
40
20
0
CFRamplitude
DHEPamplitude
N=3
p< 0.05
N.S.
The test drug does not reduce the amplitude of the dorsal horn evoked potential => the drug does not impair transmission between primary efferent terminals and the first-order spinal interneurons in the dorsal horn.
1 Sept, 2011 MELIOR DISCOVERY, Inc.: Neurophysiology Models
Monosynaptic Spinal Reflex
1 Sept, 2011 MELIOR DISCOVERY, Inc.: Neurophysiology Models
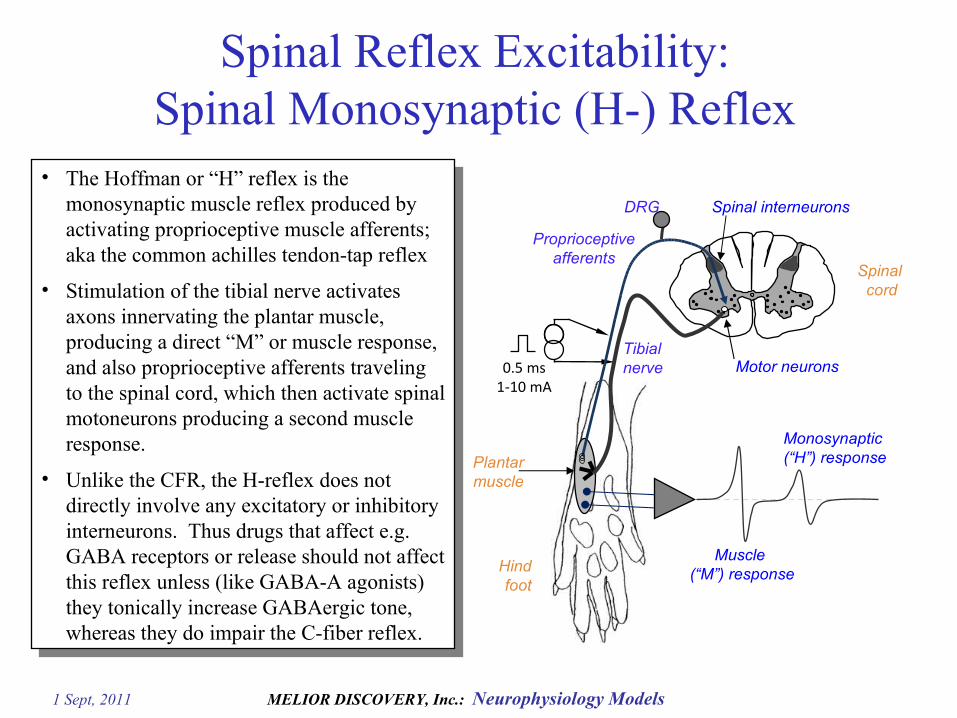
Spinal Reflex Excitability:Spinal Monosynaptic (H-) Reflex
• The Hoffman or “H” reflex is the monosynaptic muscle reflex produced by activating proprioceptive muscle afferents; aka the common achilles tendon-tap reflex
• Stimulation of the tibial nerve activates axons innervating the plantar muscle, producing a direct “M” or muscle response, and also proprioceptive afferents traveling to the spinal cord, which then activate spinal motoneurons producing a second muscle response.
• Unlike the CFR, the H-reflex does not directly involve any excitatory or inhibitory interneurons. Thus drugs that affect e.g. GABA receptors or release should not affect this reflex unless (like GABA-A agonists) they tonically increase GABAergic tone, whereas they do impair the C-fiber reflex.
Proprioceptiveafferents
0.5 ms1-10 mA
Spinal cord
Hindfoot
Tibialnerve
Spinal interneurons
Motor neurons
Plantarmuscle
Muscle (“M”) response
Monosynaptic(“H”) response
DRG
1 Sept, 2011 MELIOR DISCOVERY, Inc.: Neurophysiology Models
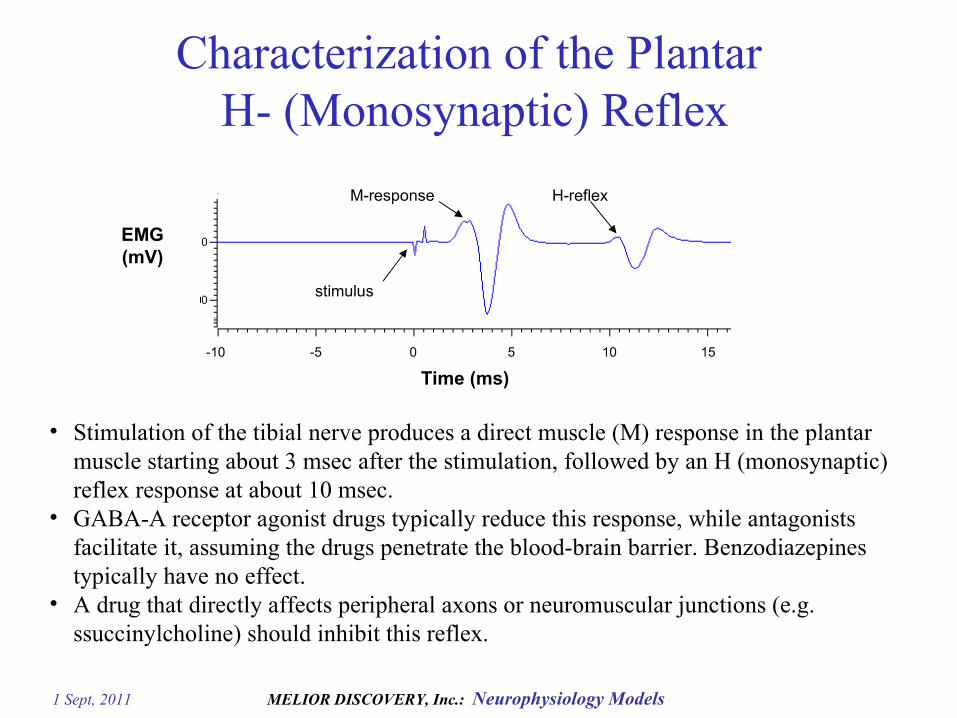
Characterization of the Plantar H- (Monosynaptic) Reflex
-10 -5 0 5 10 15
Time (ms)
EMG(mV)
M-response H-reflex
stimulus
• Stimulation of the tibial nerve produces a direct muscle (M) response in the plantar muscle starting about 3 msec after the stimulation, followed by an H (monosynaptic) reflex response at about 10 msec.
• GABA-A receptor agonist drugs typically reduce this response, while antagonists facilitate it, assuming the drugs penetrate the blood-brain barrier. Benzodiazepines typically have no effect.
• A drug that directly affects peripheral axons or neuromuscular junctions (e.g. ssuccinylcholine) should inhibit this reflex.
1 Sept, 2011 MELIOR DISCOVERY, Inc.: Neurophysiology Models
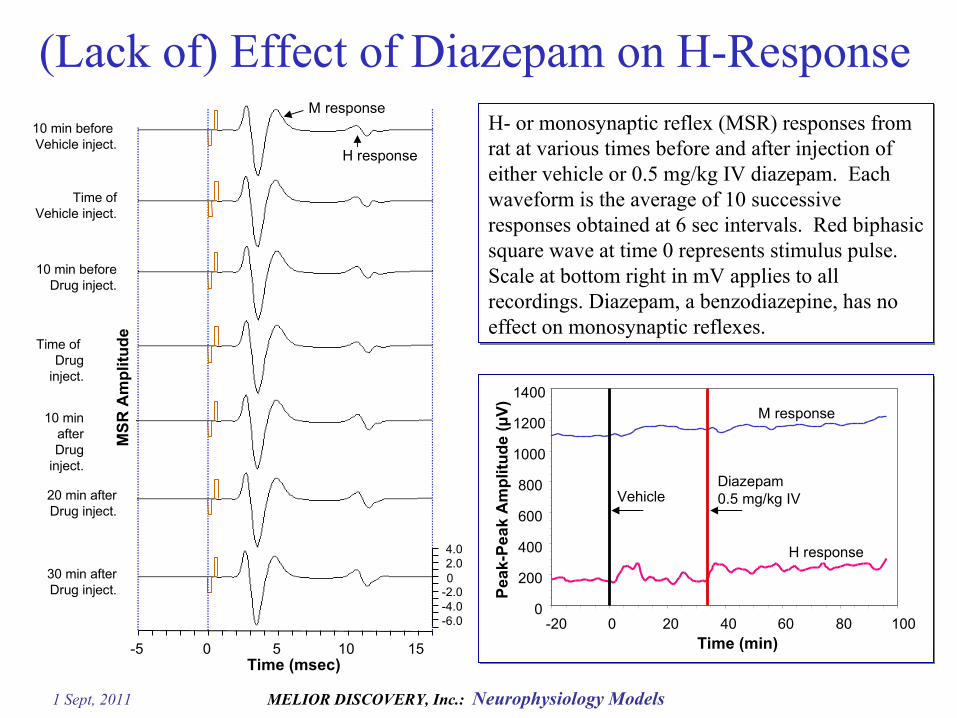
H- or monosynaptic reflex (MSR) responses from rat at various times before and after injection of either vehicle or 0.5 mg/kg IV diazepam. Each waveform is the average of 10 successive responses obtained at 6 sec intervals. Red biphasic square wave at time 0 represents stimulus pulse. Scale at bottom right in mV applies to all recordings. Diazepam, a benzodiazepine, has no effect on monosynaptic reflexes.
10 min before Vehicle inject.
Time ofVehicle inject.
10 min beforeDrug inject.
Time of Drug
inject.
10 min afterDrug
inject.
20 min afterDrug inject.
30 min afterDrug inject.
Time (msec)-5 0 5 10 15
02.04.0
-4.0-2.0
-6.0
MS
R A
mp
litu
de
M response
H response
(Lack of) Effect of Diazepam on H-Response
0
200
400
600
800
1000
1200
1400
-20 0 20 40 60 80 100Time (min)
Pea
k-P
eak
Am
pli
tud
e (µ
V)
M response
Vehicle
H response
Diazepam0.5 mg/kg IV
1 Sept, 2011 MELIOR DISCOVERY, Inc.: Neurophysiology Models 31
Cortical and NeuromuscularEvoked Potentials
1 Sept, 2011 MELIOR DISCOVERY, Inc.: Neurophysiology Models 32
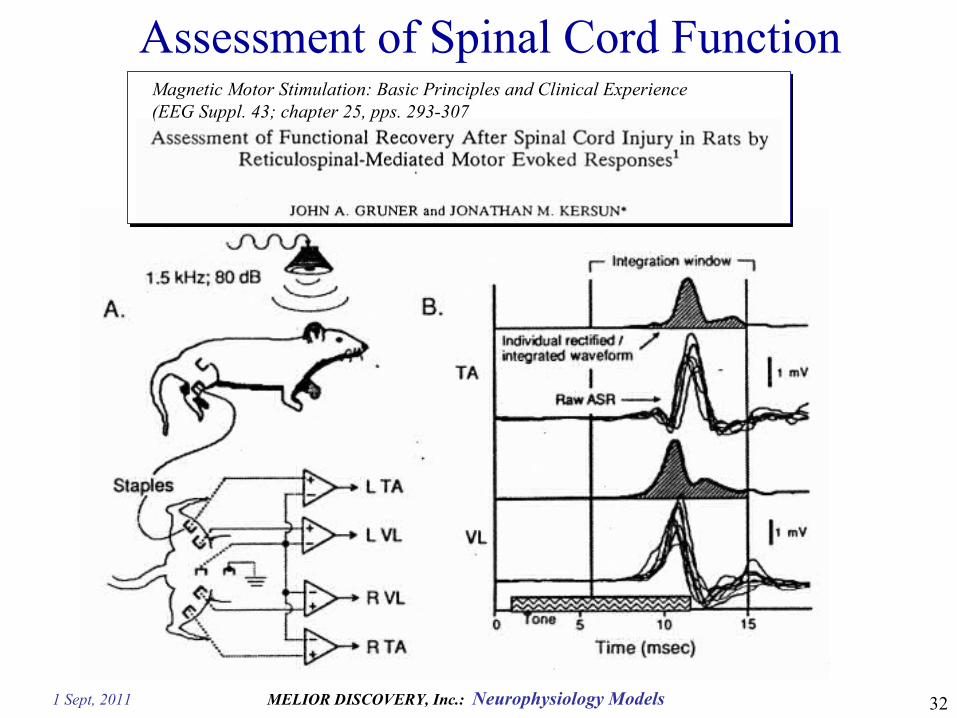
Magnetic Motor Stimulation: Basic Principles and Clinical Experience(EEG Suppl. 43; chapter 25, pps. 293-307
Assessment of Spinal Cord Function
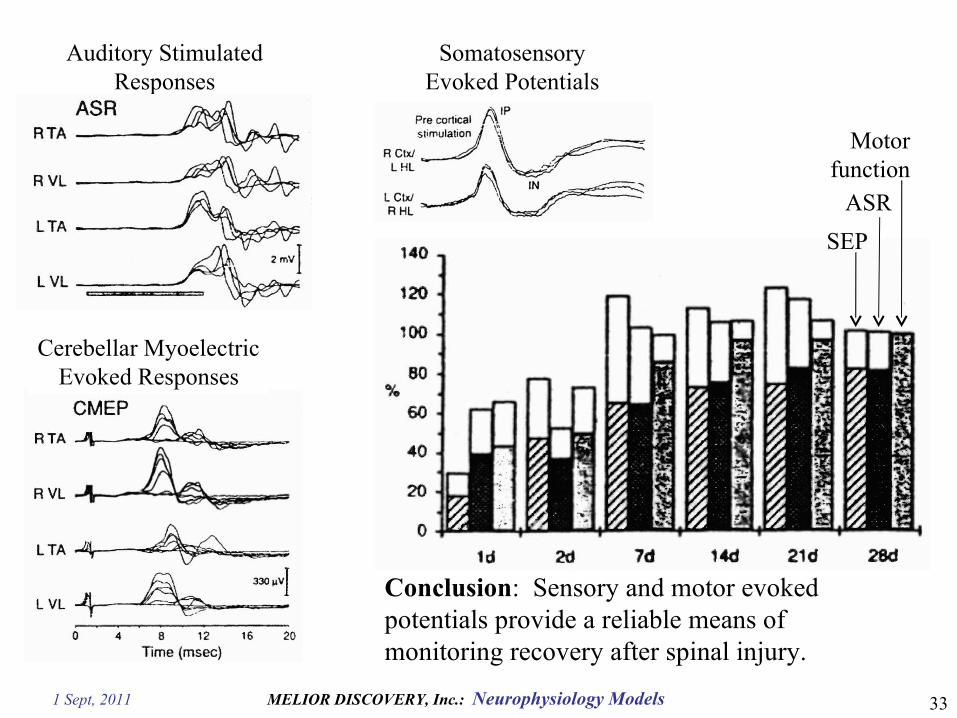
1 Sept, 2011 MELIOR DISCOVERY, Inc.: Neurophysiology Models 33
SEP
ASR
Motorfunction
SomatosensoryEvoked Potentials
Auditory StimulatedResponses
Cerebellar MyoelectricEvoked Responses
Conclusion: Sensory and motor evoked potentials provide a reliable means of monitoring recovery after spinal injury.
1 Sept, 2011 MELIOR DISCOVERY, Inc.: Neurophysiology Models 34
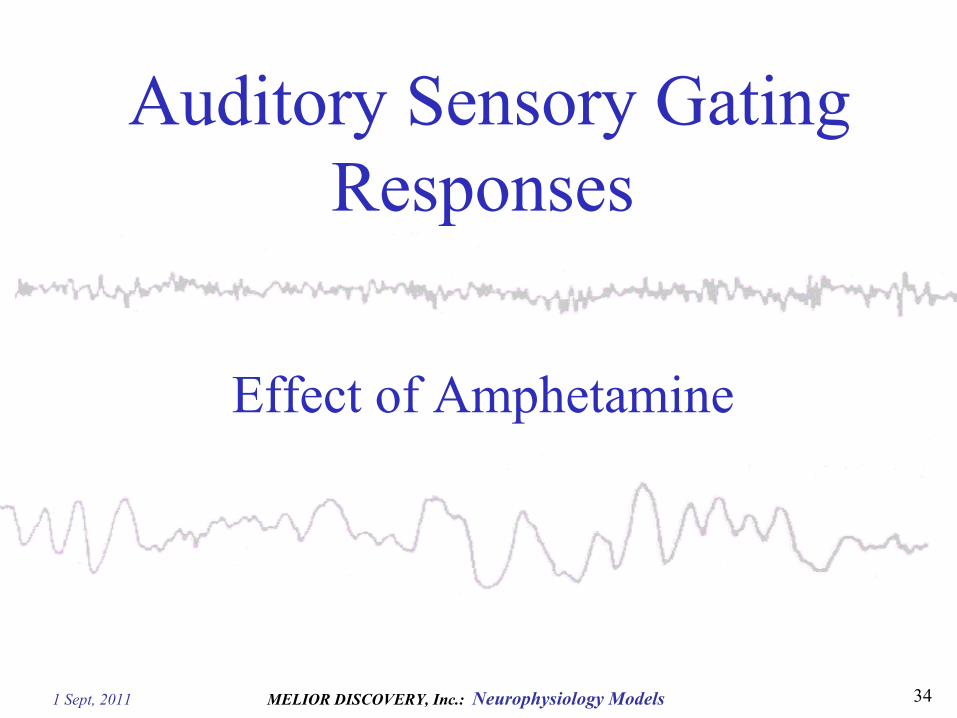
Auditory Sensory Gating Responses
Effect of Amphetamine
1 Sept, 2011 MELIOR DISCOVERY, Inc.: Neurophysiology Models
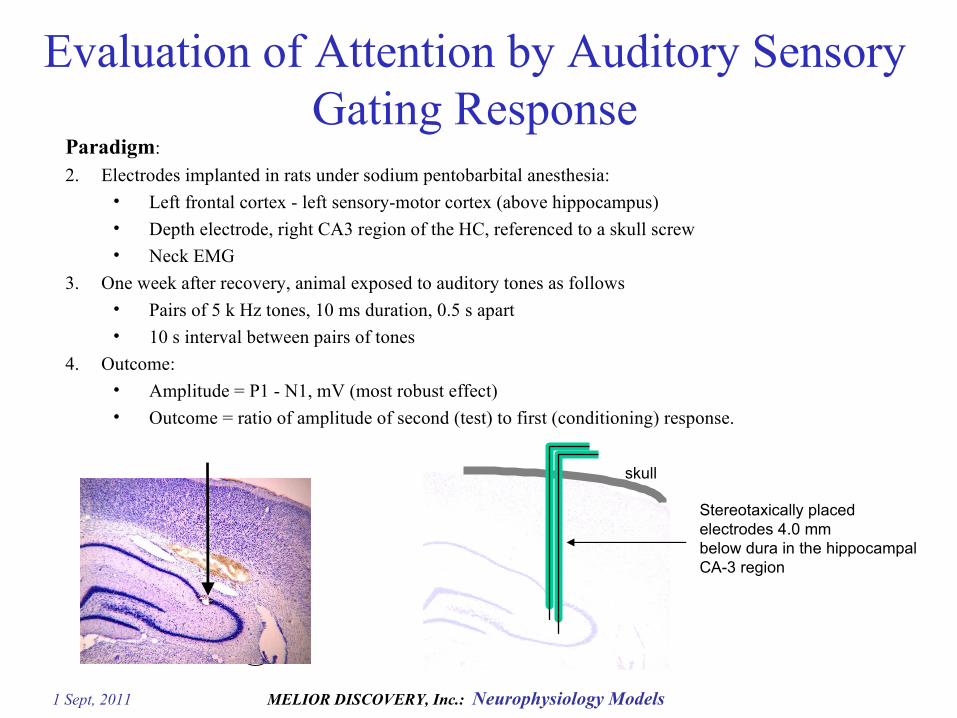
Paradigm:
2. Electrodes implanted in rats under sodium pentobarbital anesthesia:
• Left frontal cortex - left sensory-motor cortex (above hippocampus)
• Depth electrode, right CA3 region of the HC, referenced to a skull screw• Neck EMG
3. One week after recovery, animal exposed to auditory tones as follows
• Pairs of 5 k Hz tones, 10 ms duration, 0.5 s apart
• 10 s interval between pairs of tones
4. Outcome:
• Amplitude = P1 - N1, mV (most robust effect)
• Outcome = ratio of amplitude of second (test) to first (conditioning) response.
Evaluation of Attention by Auditory Sensory Gating Response
Stereotaxically placedelectrodes 4.0 mmbelow dura in the hippocampal CA-3 region
skull
1 Sept, 2011 MELIOR DISCOVERY, Inc.: Neurophysiology Models
Effect of Amphetamine on Auditory Gating Responses
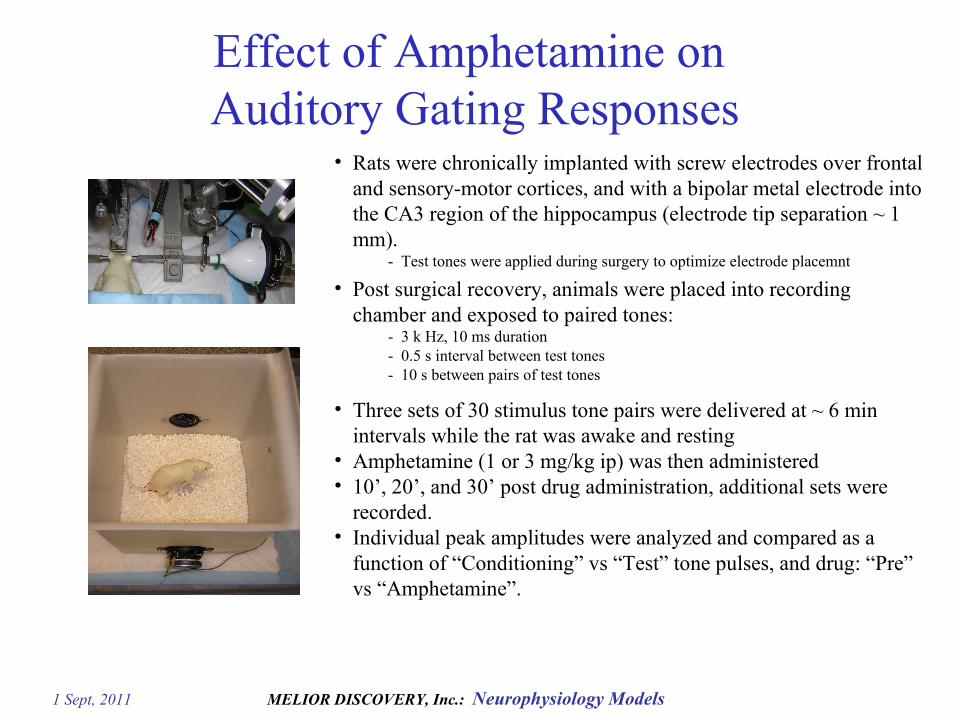
• Rats were chronically implanted with screw electrodes over frontal and sensory-motor cortices, and with a bipolar metal electrode into the CA3 region of the hippocampus (electrode tip separation ~ 1 mm).
- Test tones were applied during surgery to optimize electrode placemnt
• Post surgical recovery, animals were placed into recording chamber and exposed to paired tones:
- 3 k Hz, 10 ms duration- 0.5 s interval between test tones- 10 s between pairs of test tones
• Three sets of 30 stimulus tone pairs were delivered at ~ 6 min intervals while the rat was awake and resting
• Amphetamine (1 or 3 mg/kg ip) was then administered• 10’, 20’, and 30’ post drug administration, additional sets were
recorded.• Individual peak amplitudes were analyzed and compared as a
function of “Conditioning” vs “Test” tone pulses, and drug: “Pre” vs “Amphetamine”.
1 Sept, 2011 MELIOR DISCOVERY, Inc.: Neurophysiology Models
Typical Auditory Evoked Potentials
F011_EEG
-1.0
-0.5
0.0
0.5
1.0
1.5
0 0.05 0.1 0.15
EP
Am
p (m
V) Cond.
Test
N1
P1
N2
P0
Surface recording
F011_CA3
-1.5
-1.0
-0.5
0.0
0.5
1.0
1.5
0 0.05 0.1 0.15
Cond.
Test
N1
P1
N2
P0
CA-3 Recording
Effect of Amphetamine on Auditory Gating Responses
1 Sept, 2011 MELIOR DISCOVERY, Inc.: Neurophysiology Models
Effect of Amphetamine on Auditory Gating Responses
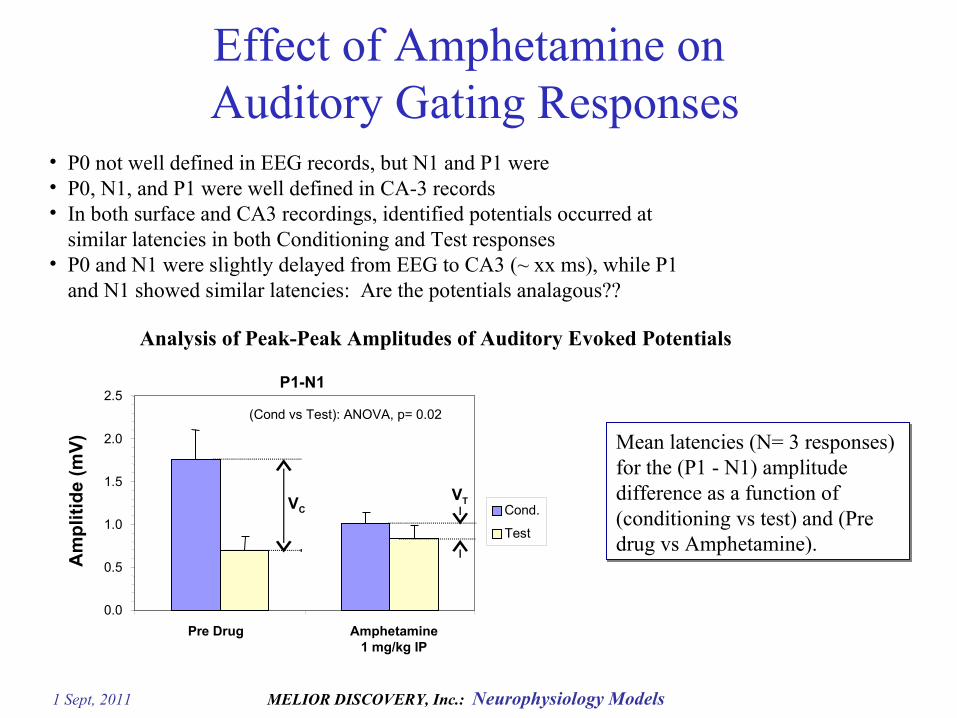
• P0 not well defined in EEG records, but N1 and P1 were• P0, N1, and P1 were well defined in CA-3 records• In both surface and CA3 recordings, identified potentials occurred at
similar latencies in both Conditioning and Test responses• P0 and N1 were slightly delayed from EEG to CA3 (~ xx ms), while P1
and N1 showed similar latencies: Are the potentials analagous??
Analysis of Peak-Peak Amplitudes of Auditory Evoked Potentials
Mean latencies (N= 3 responses) for the (P1 - N1) amplitude difference as a function of (conditioning vs test) and (Pre drug vs Amphetamine).
P1-N1
0.0
0.5
1.0
1.5
2.0
2.5
Pre Drug Amphetamine1 mg/kg IP
Am
pli
tid
e (
mV
)
Cond.
Test
(Cond vs Test): ANOVA, p= 0.02
VCVT
1 Sept, 2011 MELIOR DISCOVERY, Inc.: Neurophysiology Models
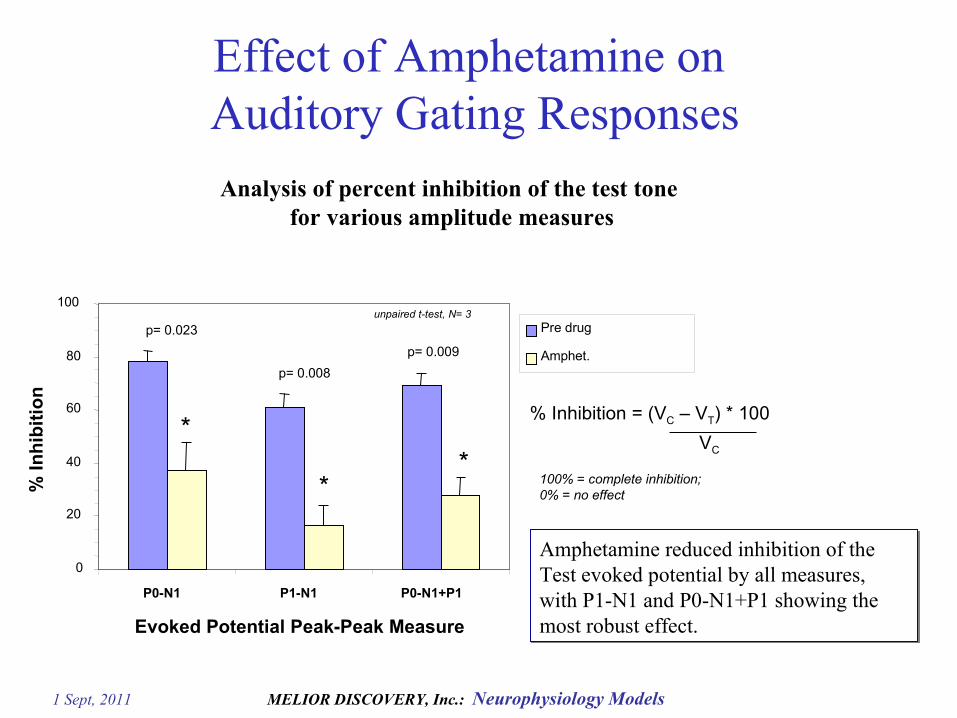
Analysis of percent inhibition of the test tone for various amplitude measures
0
20
40
60
80
100
P0-N1 P1-N1 P0-N1+P1
% I
nh
ibit
ion
Pre drug
Amphet.
*
**
p= 0.023
p= 0.009
p= 0.008
unpaired t-test, N= 3
% Inhibition = (VC – VT) * 100
VC
100% = complete inhibition; 0% = no effect
Amphetamine reduced inhibition of the Test evoked potential by all measures, with P1-N1 and P0-N1+P1 showing the most robust effect.
Effect of Amphetamine on Auditory Gating Responses
Evoked Potential Peak-Peak Measure
1 Sept, 2011 MELIOR DISCOVERY, Inc.: Neurophysiology Models
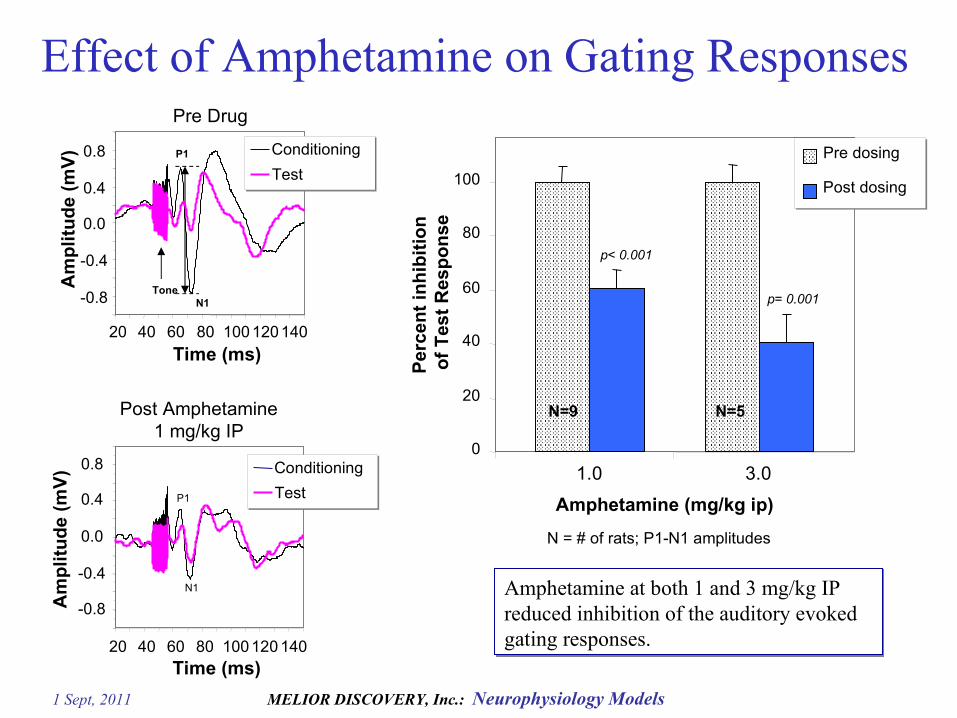
Effect of Amphetamine on Gating ResponsesPre Drug
-0.8
-0.4
0.0
0.4
0.8
20 40 60 80 100 120140
Time (ms)
Am
pli
tud
e (m
V)
N1
P1 Conditioning
Test
Tone
Post Amphetamine1 mg/kg IP
-0.8
-0.4
0.0
0.4
0.8
20 40 60 80 100120 140
Time (ms)
N1
P1
0
20
40
60
80
100
1.0 3.0
Amphetamine (mg/kg ip)
Per
cen
t in
hib
itio
n
of
Tes
t R
esp
on
se
Pre dosing
Post dosing
p< 0.001
p= 0.001
N=9 N=5
N = # of rats; P1-N1 amplitudes
Conditioning
Test
Am
pli
tud
e (m
V)
Amphetamine at both 1 and 3 mg/kg IP reduced inhibition of the auditory evoked gating responses.
1 Sept, 2011 MELIOR DISCOVERY, Inc.: Neurophysiology Models 41
Fini