Embed Size (px)
Citation preview
Dr. Siri Varadan, PE
November 2014
Melding Big Data and CIM for Bold Power System Insights
ICIM Users Group Meeting
© ALSTOM 2013. All rights reserved. Information contained in this document is indicative only. No representation or warranty is given or should be relied on that it is complete or correct or will apply to any particular project. This will depend on the technical and commercial circumstances. It is provided without liability and is subject to change without notice. Reproduction, use or disclosure to third parties, without express written authority, is strictly prohibited.
Presentation title - 10/11/2014 – P 2
Outline
• Big Data
• CIM and Big Data
• Conclusions
• Use Cases
© ALSTOM 2013. All rights reserved. Information contained in this document is indicative only. No representation or warranty is given or should be relied on that it is complete or correct or will apply to any particular project. This will depend on the technical and commercial circumstances. It is provided without liability and is subject to change without notice. Reproduction, use or disclosure to third parties, without express written authority, is strictly prohibited.
Presentation title - 10/11/2014 – P 3
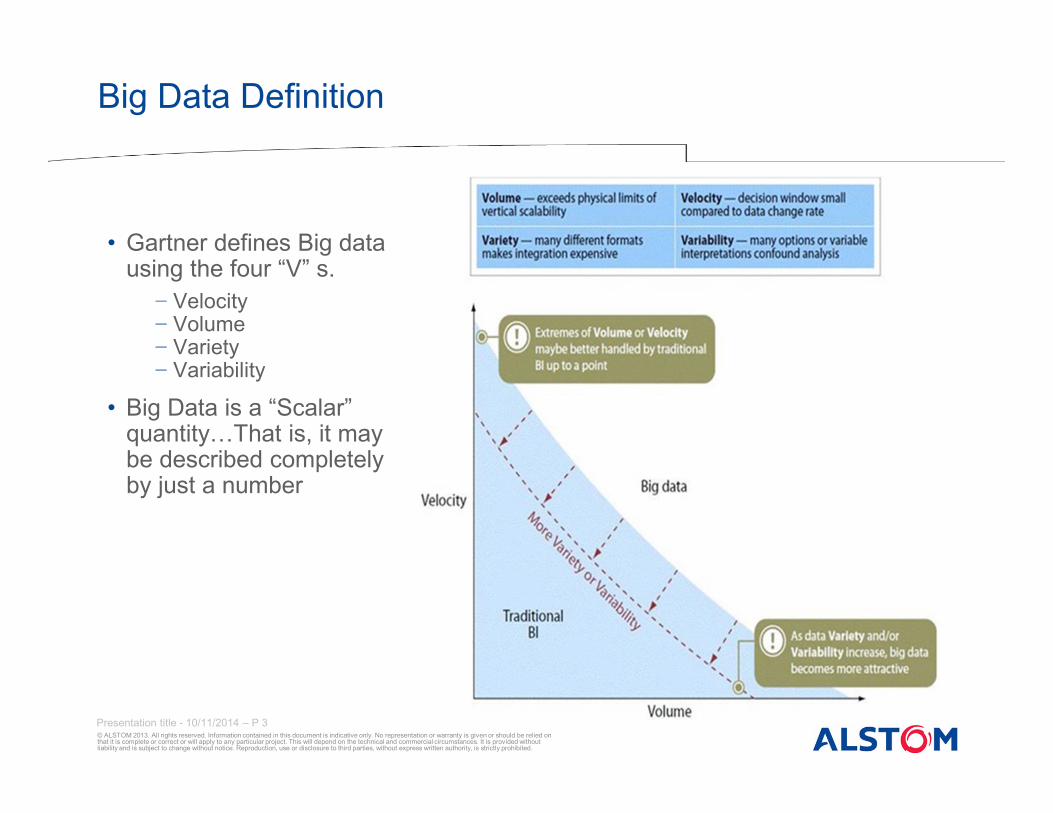
Big Data Definition
• Gartner defines Big data using the four “V” s.
− Velocity− Volume− Variety− Variability
• Big Data is a “Scalar” quantity9That is, it may be described completely by just a number

© ALSTOM 2013. All rights reserved. Information contained in this document is indicative only. No representation or warranty is given or should be relied on that it is complete or correct or will apply to any particular project. This will depend on the technical and commercial circumstances. It is provided without liability and is subject to change without notice. Reproduction, use or disclosure to third parties, without express written authority, is strictly prohibited.
Presentation title - 10/11/2014 – P 4
Big Data in Power Systems
• AMI data
• PMU data
• Data from IEDs
• The Data could include:
− Voltages− Currents− Power flows− Status− Time series data− Temperatures− Pressures− Other (DGA etc.)
• Power system data is Scalar and more9it has location, topology,direction, context and is temporal
• Data correlations for certain data sets in power systems are governed by physical laws

© ALSTOM 2013. All rights reserved. Information contained in this document is indicative only. No representation or warranty is given or should be relied on that it is complete or correct or will apply to any particular project. This will depend on the technical and commercial circumstances. It is provided without liability and is subject to change without notice. Reproduction, use or disclosure to third parties, without express written authority, is strictly prohibited.
Presentation title - 10/11/2014 – P 5
Big Data in Power Systems
The Question
• Scalar data in itself provides insights9Non-scalar data in itself provides insights9Can the two be melded to gain additional, unique insights using Data Analytics?
−Analytics is defined as the discovery and communication of meaningful patterns in data
© ALSTOM 2013. All rights reserved. Information contained in this document is indicative only. No representation or warranty is given or should be relied on that it is complete or correct or will apply to any particular project. This will depend on the technical and commercial circumstances. It is provided without liability and is subject to change without notice. Reproduction, use or disclosure to third parties, without express written authority, is strictly prohibited.
Presentation title - 10/11/2014 – P 6
Big Data in Power Systems
The Answer
• Is not “42”9(Re: Hitchhiker’s Guide to the Galaxy)
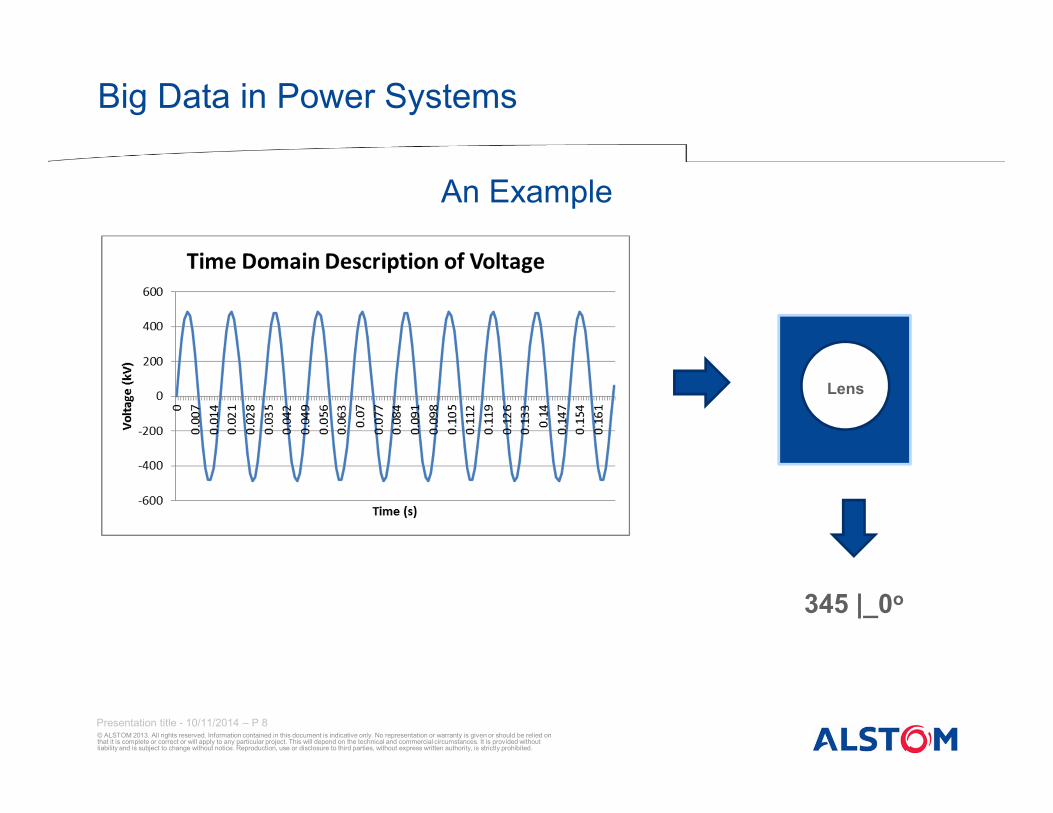
• “It depends”
−On what you are looking for, or the Lens
• Lens is a specific business function that helps summarize
data from a specific perspective
−On the availability of an appropriate Lens and its granularity

© ALSTOM 2013. All rights reserved. Information contained in this document is indicative only. No representation or warranty is given or should be relied on that it is complete or correct or will apply to any particular project. This will depend on the technical and commercial circumstances. It is provided without liability and is subject to change without notice. Reproduction, use or disclosure to third parties, without express written authority, is strictly prohibited.
Presentation title - 10/11/2014 – P 7
Big Data – Putting it all together
Big Data, CIM and Other Systems – The Vision
Operational Data SourcesAsset Connectivity Data
(contextual)
MDM PI
AMI
SCADA
OMS
DMS
GIS
CIM XMLXML, UDF
Data Aggregation
(In Memory)
Advanced Visualization
(Spotfire)Event Detection
& Notification
TLM
− Understanding data in the right context
− Drawing data correlations− Visualization
− Making Hypotheses− Making inferences− Knowledge building
© ALSTOM 2013. All rights reserved. Information contained in this document is indicative only. No representation or warranty is given or should be relied on that it is complete or correct or will apply to any particular project. This will depend on the technical and commercial circumstances. It is provided without liability and is subject to change without notice. Reproduction, use or disclosure to third parties, without express written authority, is strictly prohibited.
Presentation title - 10/11/2014 – P 8
Big Data in Power Systems
An Example
345 |_0o
Lens
© ALSTOM 2013. All rights reserved. Information contained in this document is indicative only. No representation or warranty is given or should be relied on that it is complete or correct or will apply to any particular project. This will depend on the technical and commercial circumstances. It is provided without liability and is subject to change without notice. Reproduction, use or disclosure to third parties, without express written authority, is strictly prohibited.
Presentation title - 10/11/2014 – P 9
Big Data in Power Systems
Kinds of Lenses
• Depends on Area of focus (G, T, D, Beyond the Meter etc.)
• Driven by the business purpose
• Applicable to Real-time or Non-Real time data
−Detection of an “incipient” system separation−Calculation of ATC/TTC−Real-time “Situational Awareness”
−Failure rates of asset classes−Theft detection−“post mortem” analysis

© ALSTOM 2013. All rights reserved. Information contained in this document is indicative only. No representation or warranty is given or should be relied on that it is complete or correct or will apply to any particular project. This will depend on the technical and commercial circumstances. It is provided without liability and is subject to change without notice. Reproduction, use or disclosure to third parties, without express written authority, is strictly prohibited.
Presentation title - 10/11/2014 – P 10
Big Data and CIM
Premise
• Big Data when combined with non-scalar attributes like topology, location within the context of a power system model (as in CIM) provides unique insights.
• Questions:
−What insights?−How?
• Take AMI data and combine it with CIM data for a feeder!
© ALSTOM 2013. All rights reserved. Information contained in this document is indicative only. No representation or warranty is given or should be relied on that it is complete or correct or will apply to any particular project. This will depend on the technical and commercial circumstances. It is provided without liability and is subject to change without notice. Reproduction, use or disclosure to third parties, without express written authority, is strictly prohibited.
Presentation title - 10/11/2014 – P 11
Use Cases
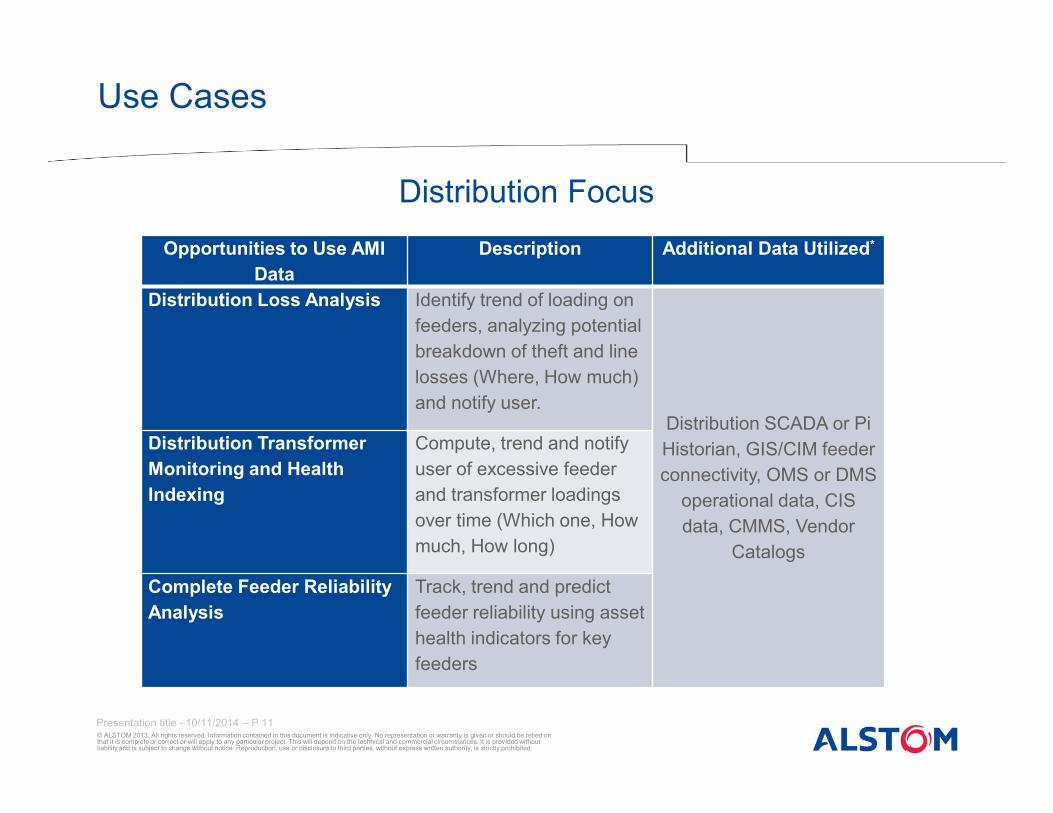
Distribution Focus
Opportunities to Use AMI
Data
Description Additional Data Utilized*
Distribution Loss Analysis Identify trend of loading on
feeders, analyzing potential
breakdown of theft and line
losses (Where, How much)
and notify user.Distribution SCADA or Pi
Historian, GIS/CIM feeder
connectivity, OMS or DMS
operational data, CIS
data, CMMS, Vendor
Catalogs
Distribution Transformer
Monitoring and Health
Indexing
Compute, trend and notify
user of excessive feeder
and transformer loadings
over time (Which one, How
much, How long)
Complete Feeder Reliability
Analysis
Track, trend and predict
feeder reliability using asset
health indicators for key
feeders
© ALSTOM 2013. All rights reserved. Information contained in this document is indicative only. No representation or warranty is given or should be relied on that it is complete or correct or will apply to any particular project. This will depend on the technical and commercial circumstances. It is provided without liability and is subject to change without notice. Reproduction, use or disclosure to third parties, without express written authority, is strictly prohibited.
Presentation title - 10/11/2014 – P 12
Use Cases
Distribution Loss Analysis
• Aggregate AMI data for customers on a per transformer, then feeder basis (CIM model provides topological connectivity, CIS provides customer information) to get a near-real-time load profile at each distribution transformer
• Run a load flow using the topology model (from CIM) and aggregated loads to get line loss for the same time period
• The power flowing out at the feeder head (obtained from SCADA) over the same period should match with the sum of the aggregated loads and loss. If not, loss is detected!
Energy loss, not Power loss, is of interest!
© ALSTOM 2013. All rights reserved. Information contained in this document is indicative only. No representation or warranty is given or should be relied on that it is complete or correct or will apply to any particular project. This will depend on the technical and commercial circumstances. It is provided without liability and is subject to change without notice. Reproduction, use or disclosure to third parties, without express written authority, is strictly prohibited.
Presentation title - 10/11/2014 – P 13
Use Cases
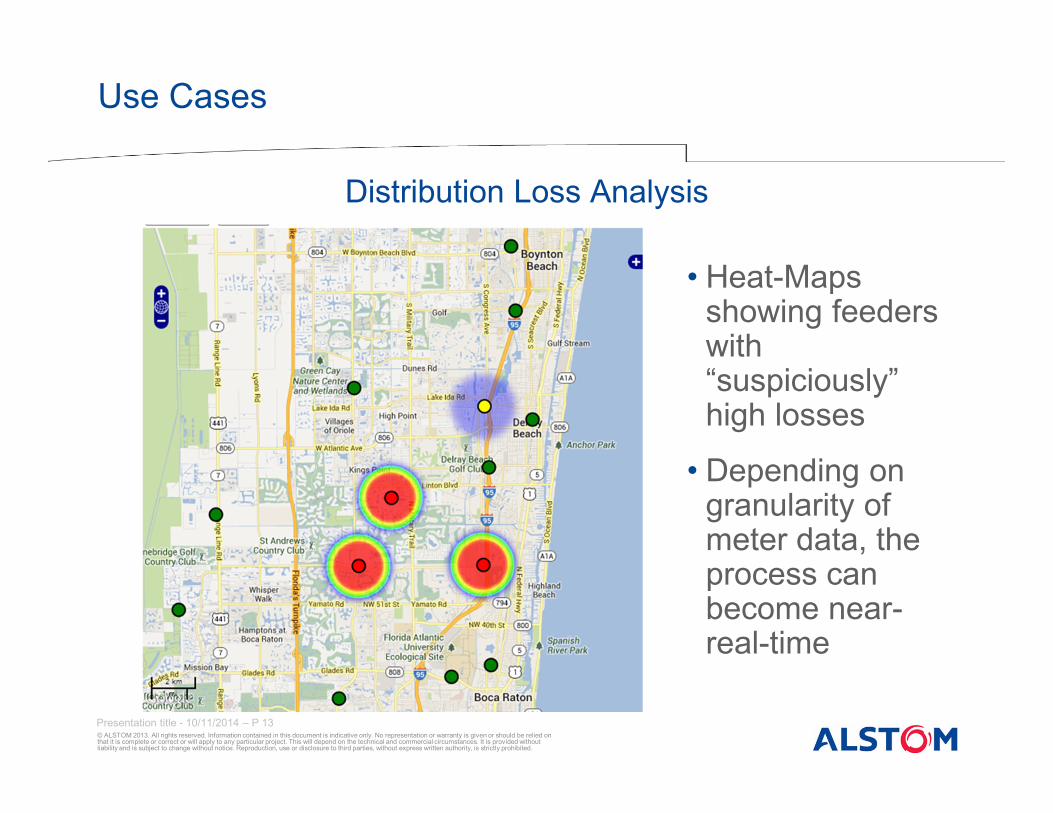
Distribution Loss Analysis
• Heat-Maps showing feeders with “suspiciously” high losses
• Depending on granularity of meter data, the process can become near-real-time
© ALSTOM 2013. All rights reserved. Information contained in this document is indicative only. No representation or warranty is given or should be relied on that it is complete or correct or will apply to any particular project. This will depend on the technical and commercial circumstances. It is provided without liability and is subject to change without notice. Reproduction, use or disclosure to third parties, without express written authority, is strictly prohibited.
Presentation title - 10/11/2014 – P 14
Use Cases
Distribution Transformer Monitoring and Health Indexing
• Define metrics for distribution transformer monitoring based on aggregated AMI data
−Hours in service−# of overloads−Time spent overloaded
• Create “Health” indexes for feeders based on individual metrics that comprise the feeder
• Create “Health” indexes for substations based on performance of connected feeders
AMI Data could be the basis for Transformer Load Monitoring
© ALSTOM 2013. All rights reserved. Information contained in this document is indicative only. No representation or warranty is given or should be relied on that it is complete or correct or will apply to any particular project. This will depend on the technical and commercial circumstances. It is provided without liability and is subject to change without notice. Reproduction, use or disclosure to third parties, without express written authority, is strictly prohibited.
Presentation title - 10/11/2014 – P 15
Use Cases
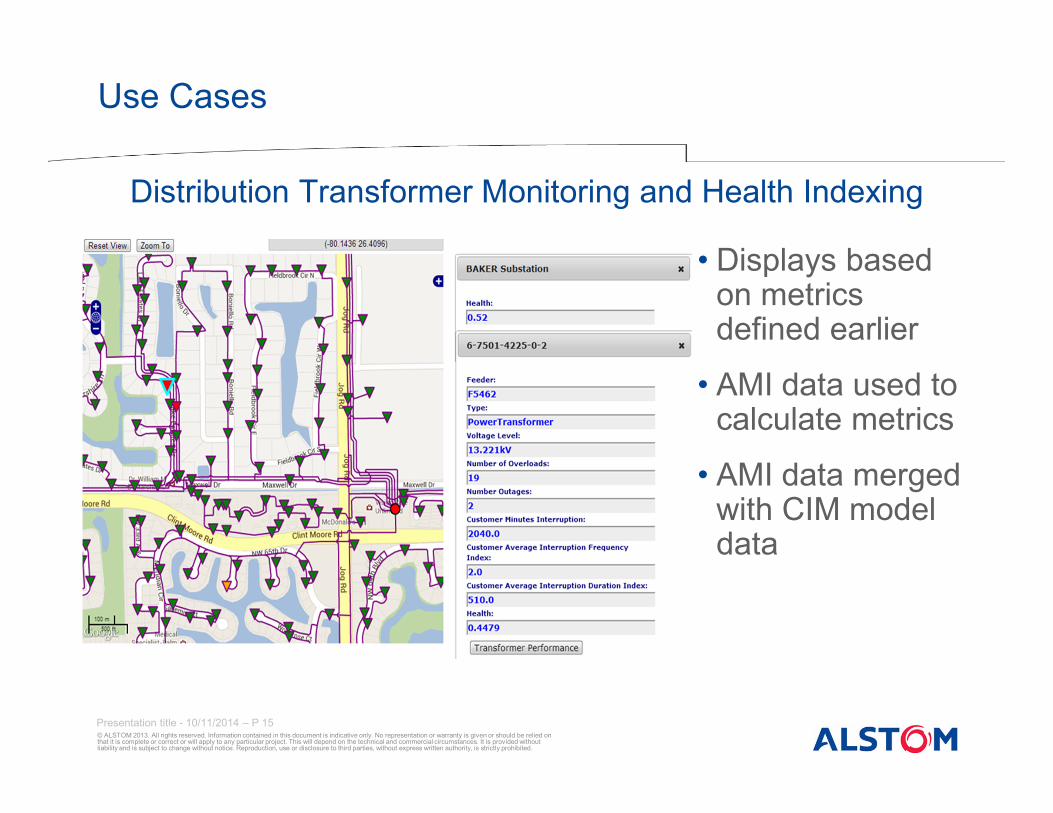
Distribution Transformer Monitoring and Health Indexing
• Displays based on metrics defined earlier
• AMI data used to calculate metrics
• AMI data merged with CIM model data
© ALSTOM 2013. All rights reserved. Information contained in this document is indicative only. No representation or warranty is given or should be relied on that it is complete or correct or will apply to any particular project. This will depend on the technical and commercial circumstances. It is provided without liability and is subject to change without notice. Reproduction, use or disclosure to third parties, without express written authority, is strictly prohibited.
Presentation title - 10/11/2014 – P 16
Use Cases
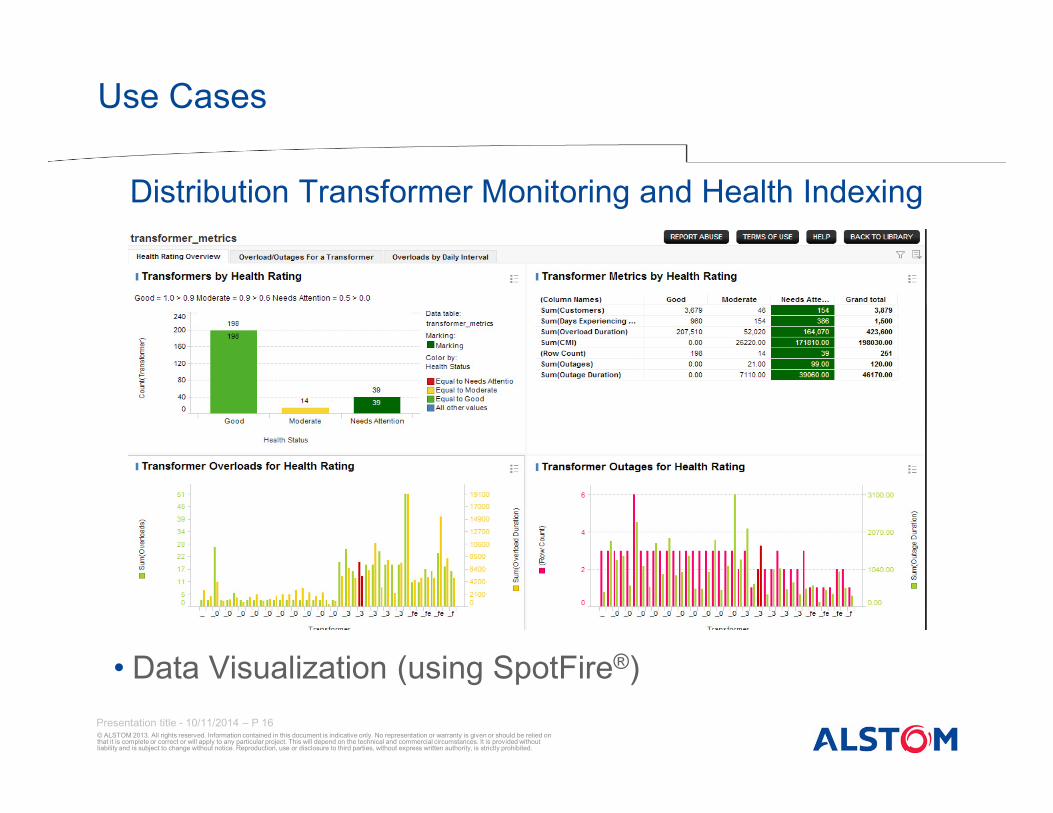
Distribution Transformer Monitoring and Health Indexing
• Data Visualization (using SpotFire®)
© ALSTOM 2013. All rights reserved. Information contained in this document is indicative only. No representation or warranty is given or should be relied on that it is complete or correct or will apply to any particular project. This will depend on the technical and commercial circumstances. It is provided without liability and is subject to change without notice. Reproduction, use or disclosure to third parties, without express written authority, is strictly prohibited.
Presentation title - 10/11/2014 – P 17
Use Cases
Complete Feeder Reliability Analysis
• Define metrics for Feeder performance based on AMI data
• Could essentially establish measures like CAIDI and CAIFI on a per customer basis9These measures will be a true reflection of what the customer experienced!
AMI Data could be the basis for a new set of customer centric standards!
© ALSTOM 2013. All rights reserved. Information contained in this document is indicative only. No representation or warranty is given or should be relied on that it is complete or correct or will apply to any particular project. This will depend on the technical and commercial circumstances. It is provided without liability and is subject to change without notice. Reproduction, use or disclosure to third parties, without express written authority, is strictly prohibited.
Presentation title - 10/11/2014 – P 18
Use Cases
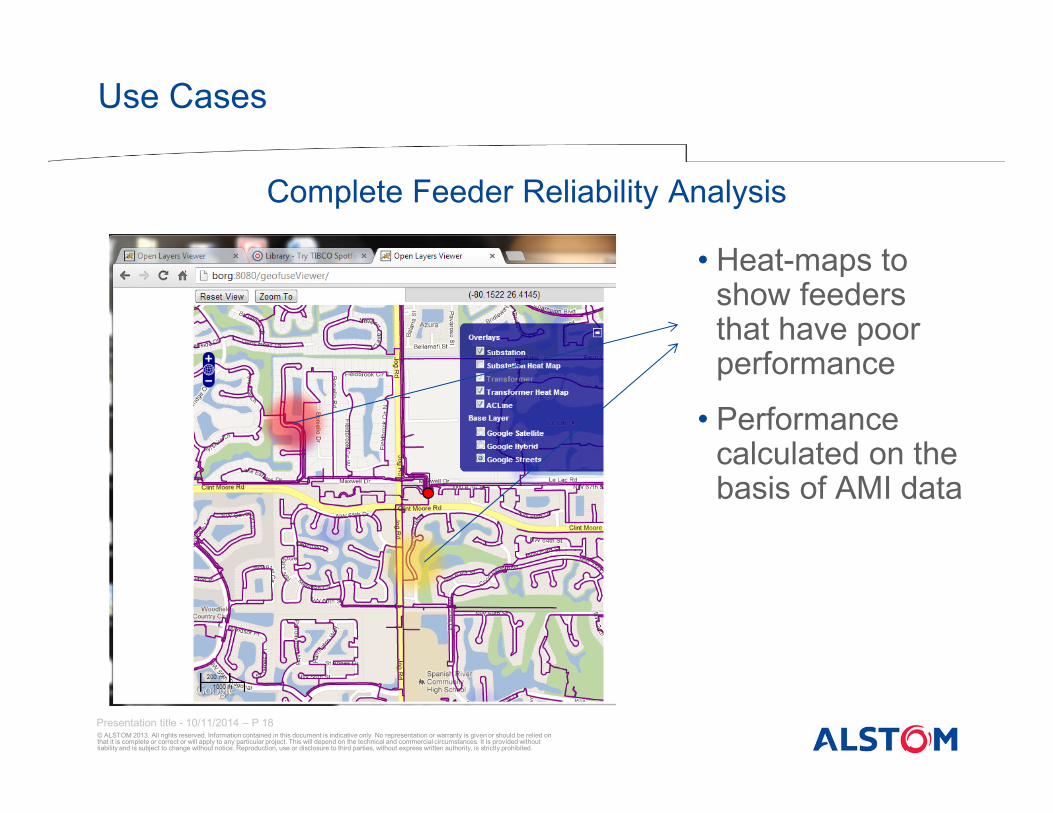
Complete Feeder Reliability Analysis
• Heat-maps to show feeders that have poor performance
• Performance calculated on the basis of AMI data

© ALSTOM 2013. All rights reserved. Information contained in this document is indicative only. No representation or warranty is given or should be relied on that it is complete or correct or will apply to any particular project. This will depend on the technical and commercial circumstances. It is provided without liability and is subject to change without notice. Reproduction, use or disclosure to third parties, without express written authority, is strictly prohibited.
Presentation title - 10/11/2014 – P 19
Use Cases
Other Bold Insights
• Situational Awareness
− Real-time operations and control− Outage Management− Crew dispatch
• Asset Intelligence
− Real-time health indexing− Condition based asset derating− Lifecycle management
• Customer satisfaction
• Beyond the meter applications
• Workforce management
• Planning
Power systems offer infinite possibilities for Data Analytics!

© ALSTOM 2013. All rights reserved. Information contained in this document is indicative only. No representation or warranty is given or should be relied on that it is complete or correct or will apply to any particular project. This will depend on the technical and commercial circumstances. It is provided without liability and is subject to change without notice. Reproduction, use or disclosure to third parties, without express written authority, is strictly prohibited.
Presentation title - 10/11/2014 – P 20
Conclusions
• Big Data Analytics must have a business purpose. That is, the Lens must be business driven
• Depending on the business purpose, the appropriate Lens may be developed
• The amount of business value is clearly dependent on the Lens9You get what you pay for!
• Big Data analytics gets more meaningful in the context of the CIM
• There is a lot of visual appeal to data when combined with GIS based maps for power systems
A picture is worth a thousand words!
© ALSTOM 2013. All rights reserved. Information contained in this document is indicative only. No representation or warranty is given or should be relied on that it is complete or correct or will apply to any particular project. This will depend on the technical and commercial circumstances. It is provided without liability and is subject to change without notice. Reproduction, use or disclosure to third parties, without express written authority, is strictly prohibited.
Presentation title - 10/11/2014 – P 21
Conclusions
Big Data, CIM and Beyond
• CIM is growing rapidly to include T&D
• CIM is growing to encompass asset data pertaining to laboratory tests (for DGA, Oil Analysis) for asset health indexing
• CIM is growing to include other aspects of power systems
−Work Management−Asset Management−Maintenance Management−Customer support−Operations and Network Control
CIM will be the skeleton on which all Data will ultimately hang!
www.alstom.com


![ETSI ISG CIM · [JSON-LD] 20170608 Introduction to ISG CIM CIM-002-UC CIM -003 GAP CIM-004-APIprelim CIM-005-DPP CIM-001-AB ) CIM-006-MOD0. Timeline in ToR 02/2017 First General Meeting](https://img.pdfslide.us/doc/110x75/6002860fd1e0f63f360db5f2/etsi-isg-cim-json-ld-20170608-introduction-to-isg-cim-cim-002-uc-cim-003-gap.jpg)