Embed Size (px)
Citation preview

Melbourne Mining ClubJacynthe CôtéPresident and Chief Executive Officer, Alcan Bauxite and AluminaDecember 6, 2006

© 2 0 06 A L C A N I N C. Slide 3
Forward-Looking Statement
Statements made in the course of this presentation which describe the Company's or management’s objectives, projections, estimates, expectations or predictions may be "forward-looking statements" within the meaning of securities laws.All statements that address the Company's expectations or projections about the future including statements about the Company's growth, cost reduction goals, operations reorganization plans, expenditures and financial results are forward-looking statements.The Company cautions that, by their nature, forward-looking statements involve risk and uncertainty and actual actions or results could differ materially. Reference should be made to the most recent Form 10-Q or 10-K for a summary of factors that could cause such differences. In addition, certain non-GAAP measures are used which are reconciled to the comparable GAAP measures herein or on the Company’s website at www.alcan.com in the “Investors” section.

© 2 0 06 A L C A N I N C. Slide 4
Presentation Outline
Aluminum – the material of choice
Alcan’s Profile
Bauxite & Alumina Industry Fundamentals and Trends
Summary & conclusion
© 2 0 06 A L C A N I N C. Slide 5
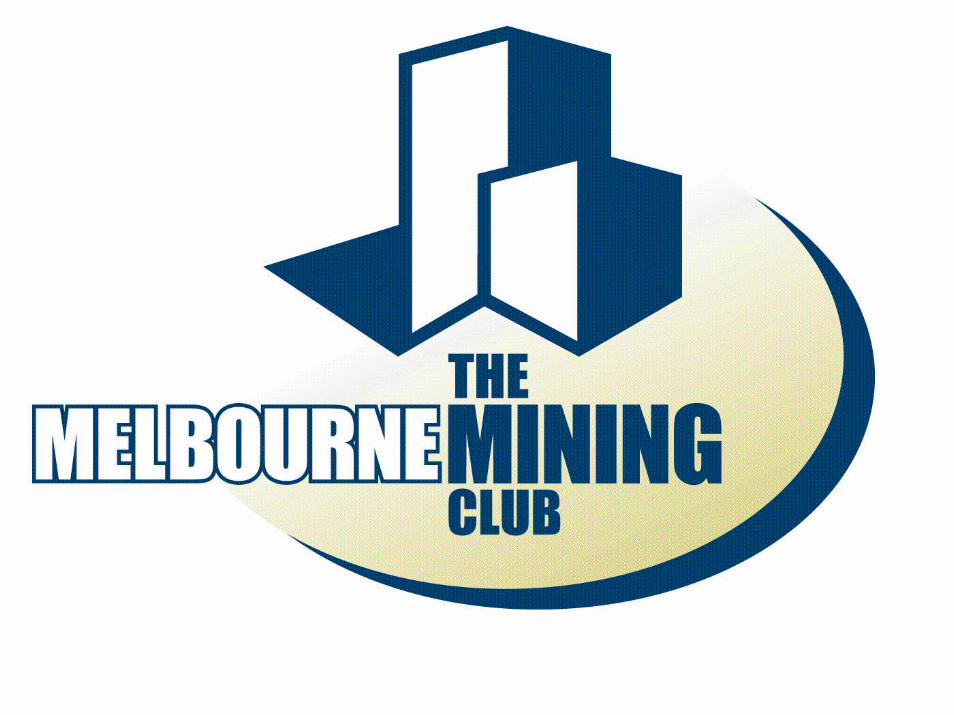
Aluminum — The Material of Choice
Discovered in 1886, the Hall-Héroult electrolysis process opened its use to diverse sectors.
By 1910, the first alloys began the continuing development of its range of applications.
During World War I, aluminum played a decisive role in the development of the aeronautical industry.
After the war, the metal rapidly became part of everyday life.

© 2 0 06 A L C A N I N C. Slide 6
Myriad ApplicationsGlobal Shipments by End Use 2005Myriad ApplicationsGlobal Shipments by End Use 2005
Building & Construction
20%
Automobiles17%
Other Transportation
10%Consumer Durables
7%
Machinery and Equip.
8%
Electrical10%
Cans9%
Other Packaging7%
Other12%

© 2 0 06 A L C A N I N C. Slide 7
Benefits of Aluminum….To name a few
Lightweight – reducing GHG in transportation applications
Infinitely recyclableUse of secondary aluminum requires only 5% of power required to produce primary metal
Flexible and malleable
Excellent electrical and thermal conductivity
Corrosion resistant
© 2 0 06 A L C A N I N C. Slide 8
Presentation Outline
Aluminum – the material of choice
Alcan’s Profile
Bauxite & Alumina Industry Fundamentals and Trends
Summary and conclusion

© 2 0 06 A L C A N I N C. Slide 9
Alcan Business Groups
BAUXITE AND ALUMINA PRIMARY METAL65,000 employees in 61 countries and regions, and posted revenues of US$20.3 billion in 2005
PACKAGINGENGINEERED PRODUCTS

© 2 0 06 A L C A N I N C. Slide 10
Advantaged Platform
Many strengths to build on
Modern, Low Cost Assets
Benchmark Technology
Recognized Leader in Sustainability
Integrated Management System (AIMS)
Leading Market Positions and Strong Customer Relationships

© 2 0 06 A L C A N I N C. Slide 11
Global Asset Distribution
With 14% of the total assets, Australia is the 2nd largest capital base for Alcan
Alcan Fixed Asset Base Distribution (US$ Billion)
1.2
0.2
0.5
0.6
0.7
0.9
1.8
2.3
2.8
8.6
Rest
Brazil
Netherlands
Switzerland
Germany
UK
USA
France
Australia
Canada
Canada 44%USA 9%
South America 1%France 12%
UK 4%Netherlands 3%
Germany 3%Switzerland 3%
Australia 14%Other Asia 1%
© 2 0 06 A L C A N I N C. Slide 12
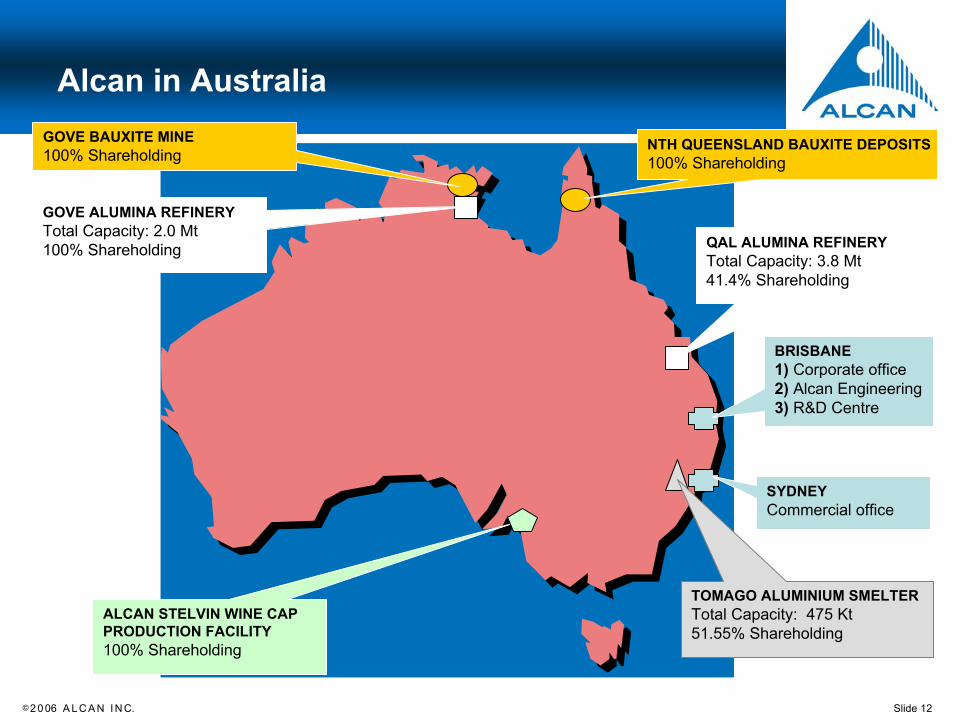
Alcan in AustraliaGOVE BAUXITE MINE100% Shareholding
NTH QUEENSLAND BAUXITE DEPOSITS100% Shareholding
GOVE ALUMINA REFINERYTotal Capacity: 2.0 Mt 100% Shareholding QAL ALUMINA REFINERY
Total Capacity: 3.8 Mt 41.4% Shareholding
BRISBANE1) Corporate office2) Alcan Engineering 3) R&D Centre
TOMAGO ALUMINIUM SMELTERTotal Capacity: 475 Kt 51.55% Shareholding
SYDNEYCommercial office
ALCAN STELVIN WINE CAP PRODUCTION FACILITY 100% Shareholding

© 2 0 06 A L C A N I N C. Slide 13
Bauxite and AluminaA Global Presence
May 2004
Alumina Refinery/Specialty Aluminas
Bauxite Mine/Deposit
Sales Office/Research & Development/Engineering and Other
Gladstone, Australia
Gove, Australia
Brockville, Canada
Saguenay, Canada Teutschenthal, Germany
Sangaredi, GuineaOrissa, India
Mayfield Heights,United States
Gardanne, FranceMontreal, Canada
Brisbane, Australia
Porto Trombetas, Brazil
La Bathie, FranceBeyrède,France
Caracas/Puerto Ordaz,Venezuela
Sao Paulo, Brazil
Awaso, GhanaAccra, Ghana
Takoradi, Ghana
Montroc/Paulinet, France
Sao Luis, Brazil
Paris, France
* Includes joint ventures and bauxite deposits not yet in operation.
Zurich, Switzerland
Ely, Dulhunty, Ducie-
Wenlock, Australia
Beijing, China
Spath Fluor Mine
Large Bauxite Resources
© 2 0 06 A L C A N I N C. Slide 14
Presentation Outline
Aluminum – the material of choice
Alcan’s Profile
Bauxite & Alumina Industry Fundamentals and Trends
Summary and conclusion

© 2 0 06 A L C A N I N C. Slide 15
Bauxite
10% of world bauxite production
Venezuela3%
India5%
CIS6%
China10%Guinea
10%
Australia34%
Others4%
Brazil17%
Surinam2%
Jamaica9%
Bauxite Production by Country
CVG3%
Alcoa24%
Chalco7%
Alcan10%
Comalco7%
New Rusal10%
BHP Billiton6%
Guyana3%
Nalco3%
Others27%
Bauxite Production by Company
Source: James King, B&A analysis

© 2 0 06 A L C A N I N C. Slide 16
Value Drivers in Bauxite Mining
Location
Proximity to alumina refinery
Proximity to port/power grid
Political/economic stability
Quality/Quantity
Low conversion cost rather than absolute quality
High % hydrateLow relative silica
Large reserve/mine life

© 2 0 06 A L C A N I N C. Slide 17
Alumina
9% of world alumina production
Eastern Europe
3%Other Asia6%
CIS10%
Western Europe
10%
Brazil20%
Australia27%
China12%
Africa1%
North America
11%
Source: James King, B&A analysis
Alumina Production by Region
Others27%
Hydro2%
Comalco5%
New Rusal15%
Alcan9%
Chalco11%
BHP Billiton5%
Alcoa / WMC23%
CVG3%
Alumina Production by Company

© 2 0 06 A L C A N I N C. Slide 18
Value Drivers in Alumina Refining
LocationProximity of the bauxite resourceProximity to markets (smelters)Cost of the energy sourceLocal cost of labour
Refinery OperationsTechnology/design/scale Geological characteristics of bauxite
Silica contentAlumina content

© 2 0 06 A L C A N I N C. Slide 19
Raw Material Price & Currency Volatility
The alumina industry has been affected by unprecedented price increases…Oil: SING 380 (US$/bbl)CAGR Jan 98 - Aug 06: 19%
10
20
30
40
50
1.00199
3
1995
1997
1999
2001
2003
2005
60
CAN$AUS$
1.00
1993
1995
1997
1999
2001
2003
20050.40
0.50
0.60
0.70
0.80
0.90
US$
50
100
150
200
250
300
350
400
450 Caustic: ASP North America (US$/DMT)CAGR Jan 00- Aug 06: 22%
0
1.00199
3
1995
1997
1999
2001
2003
2005
2006
2006
1,000
2,000
3,000
4,000
5,000
6,000
7,000Freight: BDI Index ($/day)
CAGR Jan 98 - Aug 06: 13%Add label
1.00199
3
1995
1997
1999
2001
2003
2005
2006
2006

© 2 0 06 A L C A N I N C. Slide 20
Alumina Industry Block Cost 2001-2006
… impacting substantially the industry cost curve
191 $/t183 $/t
28.325.8156 $/t
63.30
Industry AVG Cash Cost
136 $/t 136 $/t 137 $/t
58.82
13.6
49.71Caustic 12.1
40.63
25.50
14.77
37.35
17.7 18.1 $/t
41.9637.36Energy
19.6319.6018.78
16.7315.1228.9428.91
Labour
28.0326.8126.72
Maintenance & Materials
51.3150.3146.02Bauxite 38.9838.45
2001 2002 2003 2004 2005 2006Source: CRU

© 2 0 06 A L C A N I N C. Slide 21
Alumina World Balance
2006 - the turnaround year from supply deficit to surplus
Alumina World Market Balance Forecast
10,000
Sources : CRU, Metal Bulletin (MBR), Brook Hunt, Macquarie Bank, James F. King
Alcan
-1,121
-1,104
-1,338
-1,361
-1,486
2005
Macquarie Bank – July 06
CRU - Apr 06
MBR - Sept 06
Brook Hunt - Aug. 06
James F. King – Aug 06
8,000
[Kto
nnes
]
6,000
4,000
2,000
-
-2,000
447
1,483
2,999
2,626
1,178
2006
929
1,673
6,468
3,079
3,116
2007
1,285
2,015
4,452
5,337
2,221
2008

© 2 0 06 A L C A N I N C. Slide 22
Historical Alumina Prices
Market returns to surplus – immediate impact on spot prices
Spot, Australian Export and LME price evolution with 25-year averages
Spot
-A
us. E
xp. [
%LM
E]
5.0%
10.0%
15.0%
20.0%
San CiprianAughinish Worsley
Alumina oversupply
High metal prices
Hurricane
Eastern block sell-down
Gramercy explosion
Structural tightness (China)
Alunorte
40.0%
35.0%
30.0%
25.0% Hurricane
0.0% 0
1979
1984
1999
2004
1989
1994
Spot Aus. Export Price Source: CRU
© 2 0 06 A L C A N I N C. Slide 23
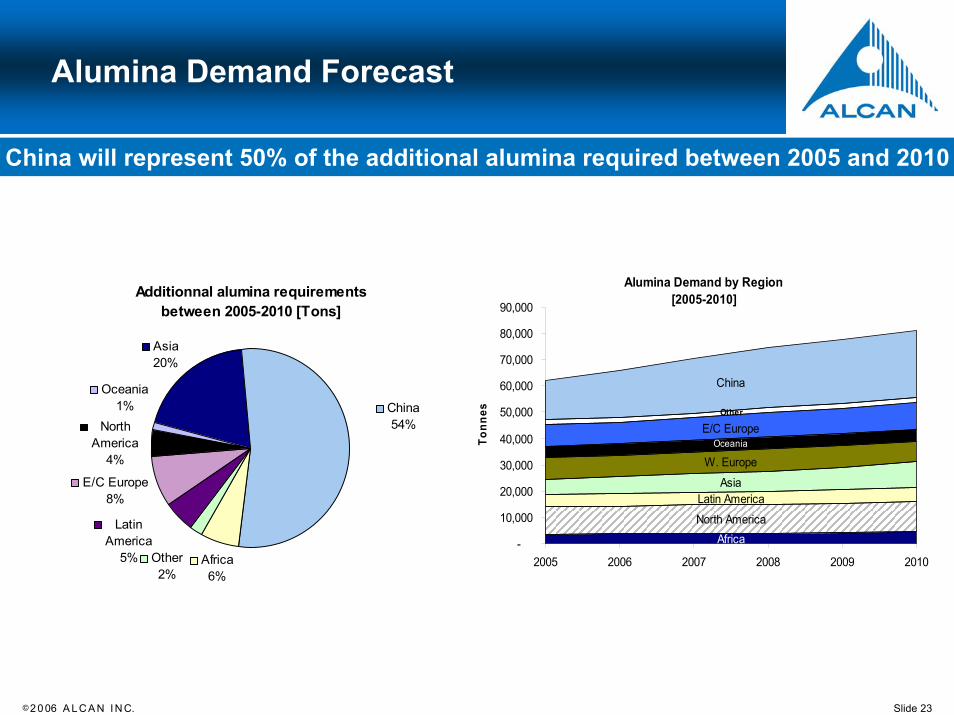
Alumina Demand Forecast
China will represent 50% of the additional alumina required between 2005 and 2010
Additionnal alumina requirements between 2005-2010 [Tons]
North America
4%
E/C Europe8%
Latin America
5% Other2%
Africa6%
Oceania1% China
54%
Asia20%
Alumina Demand by Region [2005-2010]
AfricaNorth America
Latin AmericaAsia
W. EuropeOceania
E/C EuropeOther
China
-
10,000
20,000
30,000
40,000
50,000
60,000
70,000
80,000
90,000
2005 2006 2007 2008 2009 2010
Tonn
es
© 2 0 06 A L C A N I N C. Slide 24
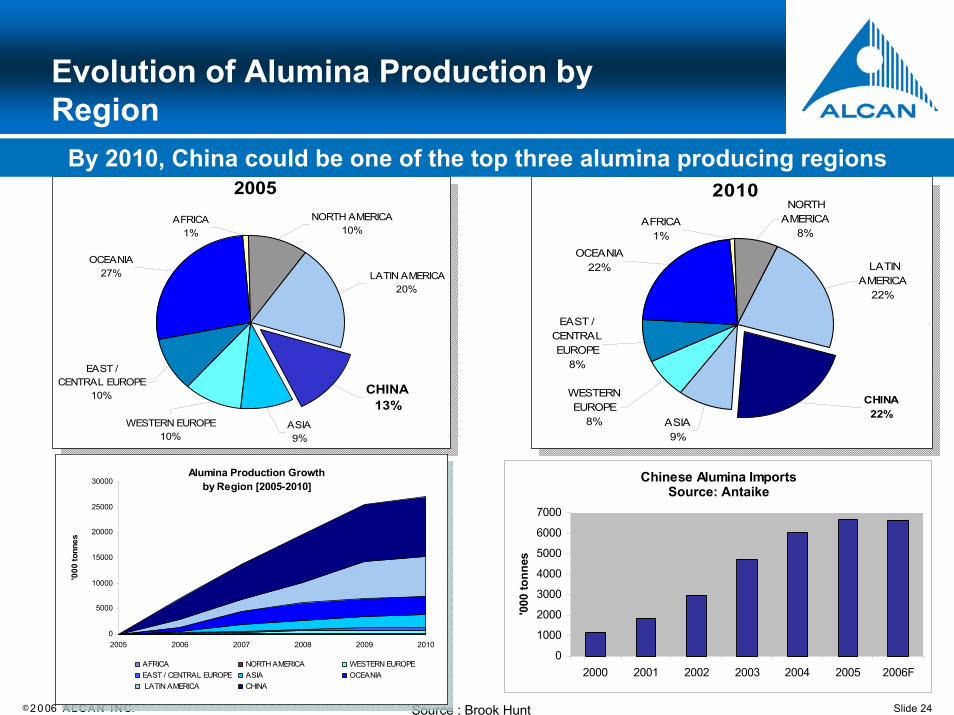
Evolution of Alumina Production by Region
Source : Brook Hunt
2005
WESTERN EUROPE10%
LATIN AMERICA20%
EAST / CENTRAL EUROPE
10%
ASIA9%
CHINA13%
OCEANIA27%
AFRICA1%
NORTH AMERICA10%
2010
WESTERN EUROPE
8%
LATIN AMERICA
22%
EAST / CENTRAL EUROPE
8%
ASIA9%
CHINA22%
OCEANIA22%
AFRICA1%
NORTH AMERICA
8%
Alumina Production Growth by Region [2005-2010]
0
5000
10000
15000
20000
25000
30000
2005 2006 2007 2008 2009 2010
'000
tonn
es
AFRICA NORTH AMERICA WESTERN EUROPEEAST / CENTRAL EUROPE ASIA OCEANIA LATIN AMERICA CHINA
Alumina Production Growth by Region [2005-2010]
0
5000
10000
15000
20000
25000
30000
2005 2006 2007 2008 2009 2010
'000
tonn
es
AFRICA NORTH AMERICA WESTERN EUROPEEAST / CENTRAL EUROPE ASIA OCEANIA LATIN AMERICA CHINA
By 2010, China could be one of the top three alumina producing regions
Chinese Alumina Imports
0
1000
2000
3000
4000
5000
6000
7000
2000 2001 2002 2003 2004 2005 2006F
'000
tonn
es
Source: Antaike
© 2 0 06 A L C A N I N C. Slide 25
Chinese Alumina Landscape
2727
21212222
23231818
17172020
29291010
1313
2525
15151616
2626
11
22
77
3030
33
282844
55
66
88
99
1111
1212
1414
1919
2424
Non-ChalcoChalco
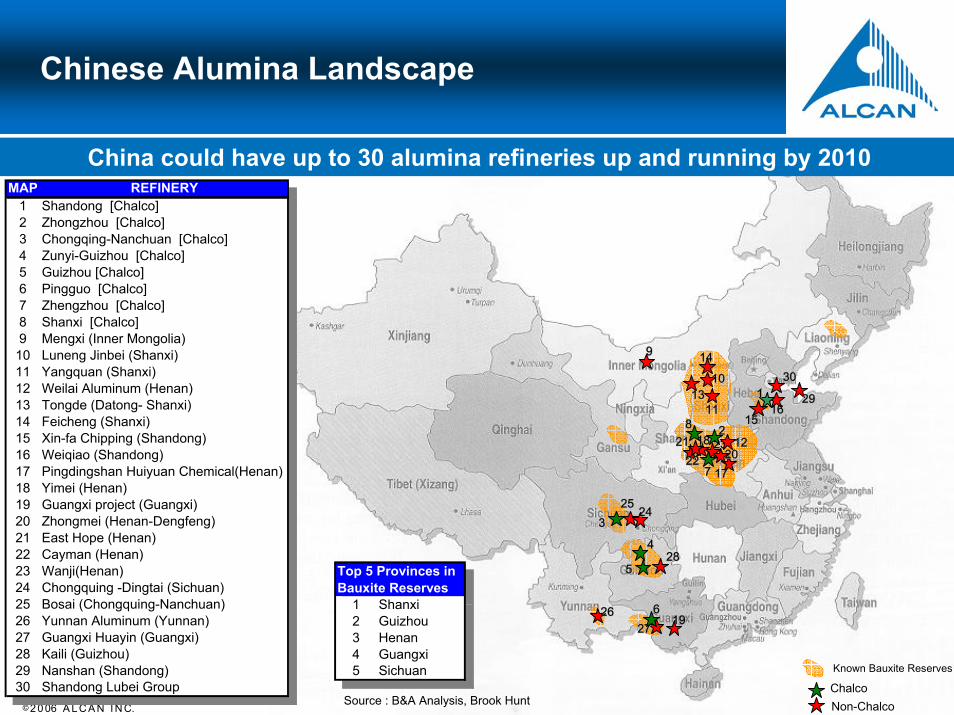
MAP REFINERY1 Shandong [Chalco]2 Zhongzhou [Chalco]3 Chongqing-Nanchuan [Chalco] 4 Zunyi-Guizhou [Chalco]5 Guizhou [Chalco]6 Pingguo [Chalco]7 Zhengzhou [Chalco]8 Shanxi [Chalco]9 Mengxi (Inner Mongolia)
10 Luneng Jinbei (Shanxi)11 Yangquan (Shanxi)12 Weilai Aluminum (Henan)13 Tongde (Datong- Shanxi)14 Feicheng (Shanxi)15 Xin-fa Chipping (Shandong)16 Weiqiao (Shandong)17 Pingdingshan Huiyuan Chemical(Henan)18 Yimei (Henan)19 Guangxi project (Guangxi)20 Zhongmei (Henan-Dengfeng)21 East Hope (Henan)22 Cayman (Henan)23 Wanji(Henan)24 Chongquing -Dingtai (Sichuan)25 Bosai (Chongquing-Nanchuan)26 Yunnan Aluminum (Yunnan)27 Guangxi Huayin (Guangxi)28 Kaili (Guizhou)29 Nanshan (Shandong)30 Shandong Lubei Group
Known Bauxite Reserves
Source : B&A Analysis, Brook Hunt
1 Shanxi2 Guizhou3 Henan4 Guangxi5 Sichuan
Top 5 Provinces in Bauxite Reserves1 Shanxi2 Guizhou3 Henan4 Guangxi5 Sichuan
Top 5 Provinces in Bauxite Reserves
China could have up to 30 alumina refineries up and running by 2010
© 2 0 06 A L C A N I N C. Slide 26
China - Bauxite
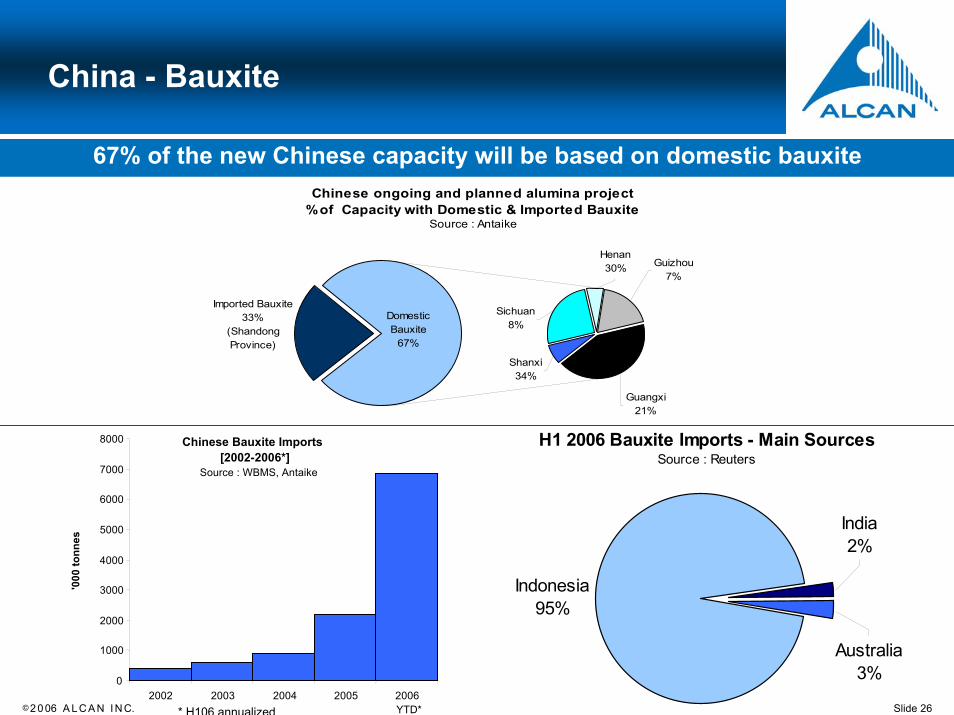
H1 2006 Bauxite Imports - Main SourcesSource : Reuters
Indonesia95%
Australia3%
India2%
Chinese ongoing and planned alumina project % of Capacity with Domestic & Imported Bauxite
Source : Antaike
Sichuan8%
Henan30% Guizhou
7%
Guangxi 21%
Domestic Bauxite
67%
Imported Bauxite33%
(Shandong Province)
Shanxi 34%
Chinese Bauxite Imports[2002-2006*]
Source : WBMS, Antaike
67% of the new Chinese capacity will be based on domestic bauxite
8000
7000
6000
* H106 annualized
0
1000
2000
3000
4000
'000
tonn
es
5000
2002 2003 2004 2005 2006 YTD*

© 2 0 06 A L C A N I N C. Slide 27
2007 Alumina Cash Cost Curve
USD/t
0
50
100
150
200
250
300
350
400
0 10000 20000 30000 40000 50000 60000 70000 80000
tpy of production
Chinese capacity
Price zone
Alumina Demand

© 2 0 06 A L C A N I N C. Slide 28
Presentation Outline
Aluminum – the material of choice
Alcan’s Profile
Bauxite & Alumina Industry Fundamentals and Trends
Summary and conclusion
© 2 0 06 A L C A N I N C. Slide 29
Summary
Aluminum industry – strong fundamentals
Alumina market in surplus for the next 2-3 years
China will represent at least 50% of the alumina demand/supply growth over the next 5 years
Operating costs of new Chinese refineries expected to be in 3rd and 4th
quartiles of industry cost curve
Chinese alumina imports expected to decrease
Industry self-regulating price of alumina should be around 250-300$/mt given forecasted cost structure

© 2 0 06 A L C A N I N C. Slide 30
ALCAN – Bauxite & AluminaKey Priorities
Leverage AIMS – Operational Excellence
Bring 50% of alumina production in lowest cost quartile and 75% in lowest half by 2009 by:
Completing Gove and Alumar expansionsConverting Gove to GasCompleting conversion of Gardanne to specialty aluminasExecuting cost reduction program at Vaudreuil and adjust production level to market conditions
Leverage our sustainability & technology/engineering know-how to pursue growth opportunities of large-scale lowest-quartile costadvantaged assets

© 2 0 06 A L C A N I N C. Slide 31
Additional Value Growth Opportunities
Opportunities in lowest cost quartile
Utkal • Greenfield project of 1.5 Mt in the province of Orissa, India• Alcan owns 45% with Hindalco holding the other 55%• Investment decision expected by H1-2007
Guinea • Greenfield project of 1.5Mt in Guinea• Alcan to own 40% with Alcoa holding another 40%• Basic Agreement with the Government of Guinea now effective• Expect to make a decision on DFS by the end of 2006
Project Description and Benefits
Ghana • MoU signed for the analysis of a mine and an alumina refinery project in joint venture with the State
• Conceptual and pre-feasibility studies underway
• Potential development of a large-scale integrated aluminium facility (bauxite mine + alumina refinery + aluminium smelter)
• Large high-quality bauxite resources
Cameroon
Madagascar• Potential development of bauxite mine and alumina refinery with Access Madagascar Sarl,
• Concept study underway

© 2 0 06 A L C A N I N C. Slide 32