Embed Size (px)
Citation preview

Melbourne Institute Working Paper Series
Working Paper No. 10/14Late Start with Extra Schooling: The Effect of School Entry-Age Increase and the Introduction of Preparatory Year
Nikhil Jha

Late Start with Extra Schooling: The Effect of School Entry-Age Increase
and the Introduction of Preparatory Year*
Nikhil Jha Melbourne Institute of Applied Economic and Social Research
The University of Melbourne
Melbourne Institute Working Paper No. 10/14
ISSN 1328-4991 (Print)
ISSN 1447-5863 (Online)
ISBN 978-0-7340-4349-8
April 2014
* This paper uses the “My School” data provided by the Australian Curriculum, Assessment and Reporting Authority (ACARA). The findings and the views reported in this paper are those of the author and should not be attributed to ACARA. Discussions with Chris Ryan, Cain Polidano and comments from the Melbourne Institute seminar participants are gratefully acknowledged. The usual disclaimer applies. Email: <[email protected]>.
Melbourne Institute of Applied Economic and Social Research
The University of Melbourne
Victoria 3010 Australia
Telephone (03) 8344 2100
Fax (03) 8344 2111
Email [email protected]
WWW Address http://www.melbourneinstitute.com

Abstract
This paper analyzes the combined effect of school entry-age increase and the introduction of
preparatory year (pre-school) on educational achievement using a difference-in-difference
specification. Achievement is assessed using the score on national standardized tests across a
range of subjects. The analysis uses the change in state policy across two states in Australia
to estimate the effect. Policies were enacted in different years and affect different cohorts. I
find positive effects for several subjects across different grades. Results are robust to
falsification tests. However, cohorts starting school during the policy implementation period
seem to have been adversely affected.
JEL classification: I28, J24
Keywords: Educational achievement, human capital

1 IntroductionEducational achievement is an integral component of child development and has impor-tant consequences for human capital formation, both for an individual as well as for thesociety at large. Early investment is generally considered to be cost-effective, in part,due to higher payoffs.1 Conceivably, policies that seek to impact various aspects of themulti-dimensional nature of child development are likely to be substantially more effec-tive. Nonetheless, it is important to quantify the extent to which outcomes improve, if atall, to inform public policy. Moreover, it is also important to know if the effect of theinterventions are transient or whether the effects sustain beyond the early years.
There is a large body of evidence on the effect of interventions and policies targetedat early childhood development (see Barnett (2011) for a recent review). The evidenceon the effects of pre-school on academic achievement is, broadly, positive. In the liter-ature, pre-school often includes kindergarten as well as pre-kindergarten. Both are im-portant in the context of this analysis. Fitzpatrick et al. (2011) finds positive effect ofpre-kindergarten on academic outcomes. For Australia (focus of this paper), Warren andHaisken-DeNew (2013) finds positive effect of attendance in kindergarten on academicachievement. Berlinski et al. (2008, 2009) find positive effects of pre-school in Uruguayand Argentina, respectively. Using large expansion of pre-school for 3 year old and 4 yearold in France, Dumas and Lefranc (2010) find positive effects on schooling and wages.
However, intensity seems to matter as well. DeCicca and Smith (2013) uses policy-generated variation in length of kindergarten in Canada and finds that being in kindergartenlonger increases probability of repeating third grade and decreases tenth grade math andreading scores. Magnuson et al. (2007a), using data from U.S. show that although pre-kindergarten is associated with higher reading and mathematics skills at school entry, it isalso associated with more behavioral problems. Furthermore, they also show that the esti-mated effects on academic skills dissipate quickly (by first grade). The mixed results maybe due to the varying quality of the pre-school and the associated institutional structure(whether it is universally provided, or if it is center-based or school-based). For instance,Gupta and Simonsen (2010) finds no effect on non-cognitive outcomes for pre-school butsignificantly worse effects for those enrolled in family day care. Furthermore, Magnusonet al. (2007b) suggests that the positive gap between students who attended pre-school andthose who do not may be eliminated through more focused learning environment.2
The effect, if any, of optimal school starting age has important practical implicationson educational policies. Within the same cohort, older students seem to do better academ-ically (Bedard and Dhuey, 2006). Yet, the benefits must be weighed against any costs,such as potentially fewer years of education if compulsory school-leaving-age remainsunchanged.3 The “entry-age achievement gap” may emanate from distinct sources or un-der different scenarios with different policy implications (Cascio, 2008). First, the gaparises due to older kindergarten children being bigger and smarter “relative” to their class-mates. Thus, they may be sorted into, for instance, more advanced reading group. Thisis the notion of relative maturity. The second interpretation, “age at entry” argues thatthe advantage older students have is because they are better equipped to succeed at school
1See, for instance, Currie (2001); Cunha et al. (2006); Reynolds and Temple (2008).2They focus on smaller class size and level of academic instruction provided.3Increase in the school entry-age resulted in fewer years of education for the delayed entrant in the US
(Deming and Dynarski, 2008).
1

(due to proportionally greater experience/exposure) regardless of being sorted into ad-vance groups. Finally, the third interpretation, “age at test”, argues that entry-age gap isessentially an artifact of positive correlation between age and skill accumulation outsideof school (Elder and Lubotsky, 2009).
While the “relative age” interpretation implies no average gain for the cohort (the gainfor the older children come at the expense of younger students), the “age at entry” inter-pretation implies that increase in minimum age is likely to increase academic outcomesof a cohort on average. The“age at test” interpretation suggests that the advantage of theadditional stock of knowledge of the older children diminishes over time and therefore,increasing the school entry age is unlikely to have any long-term impacts.
One problem that complicates the analysis of the maturity effects is the practice of“red-shirting”: parents delay their child’s enrollment in the first year of schooling if theyare too young within their cohort. In Japan and Germany, however, each child has to com-plete the compulsory years of schooling regardless of date of birth. For Japan, Kawaguchi(2011) finds that older children in a school cohort obtain higher test score and moreeducation, and subsequently, higher wages while Puhani and Weber (2007) documentslarge positive effect of older entry-age on test scores at the end of primary school and in-creased probability to attend the highest secondary school track in Germany.4 Cascio andSchanzenbach (2007) use the Tennessee STAR data where peers were randomly assignedand finds evidence for relative age gap adversely affecting older-for-cohorts. They arguethat positive peer effect (such as, better behaved peers) on young-for-cohort drive theseresults.5 Black et al. (2011), exploit data from Norway, where time in school is fixed byage at school entry and age at test vary. They find that the (small) entry-age gap6 is due tothe “age at test” and not due to the “age at entry.” In contrast, Bedard and Dhuey (2012)find positive wage effects for U.S. although they do not find any effect on educational at-tainment. Fredriksson and Ockert (2013), using Swedish data, find that there is a positiveeffect of increase in school starting age on education but none for the discounted life-timeearnings. In short, the evidence is mixed.
2 Research QuestionThe focus of this paper is the combined effect of two simultaneous interventions: (i) in-crease in school entry-age and (ii) the introduction of preparatory year of schooling—theyear before formal school starts in the first grade. I exploit the policy changes that ex-ogenously affected cohorts in different states across different periods in Australia. Anydelay in school entry necessarily implies differences to early childhood investments suchas more day-care or more time with parents. This is true regardless of the delay in schoolentry due to, either the child being born after school entry eligibility cut-off, or due to,the change in entry-age policy. As the policy changes introduced the preparatory year ofschooling along with an increase in school entry-age, the analysis provides estimates ofthe net effect of the policy changes. Furthermore, this increase in age is unlikely to be
4Using data from Germany, Muhlenweg and Puhani (2010) show that the negative effects of dis-advantaged students persists when early tracking is practiced.
5This suggests that, on average, the gains to young-for-grade far outweigh the losses to old-for-grade.6They find, on average, no effect on educational attainment and small increase in years of schooling for
women.
2

endogenously determined by parents in the present context but is policy driven.7 Prepara-tory year is generally8 not mandatory in Australia and therefore raises the concern thatparticipating students may be different from the non-participating students. The analysishere can not address this issue. Nonetheless, in Australia, participation in preparatory yearis quite high (Baxter and Hand, 2013, p.7) and therefore selection in to the program isunlikely to be problematic.9
Using the average achievement of a particular grade within a school, I find that aca-demic achievement was boosted by the policy changes. The effects are examined forseveral subjects across two grades—grade 3 and grade 7. Data limitations constraint theanalysis at the grade level. Yet, besides ameliorating measurement error concerns, usingthe grade as the unit of analysis is informative. In particular, the analysis speaks to policyrelevant issue about net potential gains. Bedard and Dhuey (2012) find that increases inthe school entry-age across board leads to higher earnings via increases in within gradehuman capital accumulation. The policy change in Australia did not vary the overall rela-tive age but did increase the age and prior learning for the affected cohort. Therefore, if theolder students, for instance, receive positive reinforcement for academic prowess, it mayfoster greater individual effort by other students as well. For early primary grades, a higherschool entry-age perhaps also implies a less disruptive class. Evidence here suggests thatthe policy changes improved learning while at school.
An obvious concern is for the cohort making transition from one policy environmentto another. As documented (see section 3.1.1 below), the transitioning cohort was substan-tially smaller but more importantly, resource provision for this cohort may have reduced.I find some evidence that suggests the students starting education during the policy transi-tion period were adversely affected by the policy changes.
3 Institutional BackgroundThis paper uses data from Australia. The socio-economic structure in Australia is anal-ogous to that in other rich western countries. For instance, Kalil et al. (2012) highlight,Australia is quite similar to the United States10 with policy in both countries address-ing similar socio-economic concerns. Primary years of schooling is compulsory acrossAustralia and grade-retention is not common.11 Both private and public schools co-exist,although in Australia, non-government sector is substantially larger. Private schools12 en-roll approximately 34 per cent of students across Australia as well as in the two states
7The issue of “red-shirting” for the states examined is discussed below (see section 3.1). Note, however,that not all students are not affected uniformly by entry-age policy change.
8Preparatory year is mandatory in one state, Tasmania.9The low participation rate for Queensland reported in Baxter and Hand (2013) is discussed below.
10The authors point out, for instance, that both, Australia and US are: rich developed countries withsimilar per-capita income; both were former colonies of UK and have an Anglo-Saxon culture but alsosubstantially large immigrant population.
11Less than 10 percent of students repeat a grade in Australia and retention rates are declining (OECD,2013).
12These are either Catholic schools or Independent schools. The later may be denominational or non-denominational and generally charge fees that are substantially higher than that of Catholic schools.
3

considered here (DEEWR, 2011; ABS, 2012).13 Education in Australia is the responsi-bility of the States and of the Territories.14 Therefore, regulations governing public andprivate schooling is managed by the states and territories. Policy change in two states—Queensland and Western Australia—is used in the analysis here. Queensland and WesternAustralia have, respectively, the third and the forth largest student population in Australia.An important similarity is a common structure of schooling where primary school, unlikeother Australian states, includes grade 7.15
3.1 Policy Changes3.1.1 Change in School Entry-Age and Introduction of Preparatory Year
Although states are responsible for their respective school policies, states nonetheless reactto, learn from the experiences of, and co-operate with other states. In fact, the role of theCouncil of Australian Governments (COAG) is to promote policy reform that requirescoordinated action. The policy changes examined here, however, were not concurrent.The preparatory year was introduced, and the school entry-age was increased, in the stateof Western Australia in 2001-2002 and in Queensland in 2007-2008 (ABS, 2012). In thisanalysis, the cohort in grade 7 in the year 2010 is affected by policy change in WesternAustralia. For Queensland, it is the cohort observed in grade 3 in 2011 that is affectedby increase in school entry-age. In each state, the cohort in the preceding year weretransitioning to the new policy environment and were substantially smaller.
Since 2008, children in Queensland need to be six by 30 June of the year they enrollin grade 1. Prior to 2008, the cut-off was December. The change essentially meant thatthe compulsory school starting age increased by six months. Cut-off dates for preparatoryyear was correspondingly changed to align with school entry-age cut-off increase. Earlierin 2002, policy change in Western Australia had similarly increased school entry-age bysix months such that the student had to be six by June 30 in the year of enrollment (seep.36 DET, 2003).
Official data from the Australian Bureau of Statistics shows that the policy increasedaverage age for affected students (grade 3) in Queensland from 7.7 to 8 year. The cor-responding increase in age for treatment group in Western Australia (grade 7 in 2010)was from 11.7 to 12 year.16 These treatment cohorts started their early education afterthe policy transition was complete. The preceding cohort that started education when thepolicy was introduced, is substantially smaller in each state. It is approximately 30 percentsmaller for Queensland and about 35 percent smaller than the previous cohort (see Table8 ABS, 2012). Quite possibly the cohort reduction changed the average class size whichmay impact academic achievement. Consequently, the cohorts after the transition wouldexperience the intended policy environment and is the main focus here.
The other policy change relates to pre-primary education. Pre-primary school policies
13The corresponding proportion is 10 per cent for US (Ewert, 2013) and 6.5 per cent for the UK (Ryanand Sibieta, 2011).
14Australia has six mainland states and two mainland territories.15In most of the other states, students transition to secondary school in grade 7.16See NSSC Table 45a: Average Age of Students, 2012 at:
http://www.abs.gov.au/AUSSTATS/[email protected]/DetailsPage/4221.02012?OpenDocument.
4

have been undergoing changes to provide uniform early childhood education across allstates. Pre-primary year education is quite prevalent in Australia17 and children are gener-ally sorted by age. The school entry age change was, in fact, preceded by the introductionof pre-primary year and by moving the provision of pre-primary education within schoolsettings. Consequently, students in Queensland affected by school entry-age changes wereolder than the previous cohort but also had an additional year of “schooling.” Insofar aspre-school attendance affects educational outcomes positively, the combined effect of thepolicy changes should be substantially large. Dowling and O’Malley (2009), however,state that the policy change was essentially a re-configuration of grades and that it “causedpreschools in that state [Queensland] to be re-badged as the first year of school.” This isevident, they argue, from the observed Australian Bureau of Statistics data documentingthe dramatic fall in the number of preschools in 2008.
Western Australia also saw concurrent change in pre-school policy. Even before theschool entry-age changed, universal access to government-funded educational programswas already available before the start of grade 1 schooling. Nonetheless, the provision ofpre-schooling within the school system would most likely improve achievement.18
However, the shift of resources to incorporate preparatory year within school wouldpossibly reduce resources for pre-preparatory year provisions. The “re-badging” of pre-schools in Queensland mentioned above suggests this. It is conceivable that a similarresource shock was experienced in Western Australia. It is not clear what impact thishas. For instance, childcare provision may be especially beneficial for children with poorlearning environment at home.
An important concern in analyzing policy change is that the policy may be a responseto the underlying circumstances. Queensland, for instance, has generally performed be-low most of the other states across several grades and subjects on the standardized nationaltests (ACARA, 2011). If policy changes that increased school entry-age and introducedpreparatory year were enacted to increase educational achievement, the estimates belowwill be biased upward. These policy changes, however, were enacted to align the educa-tion experience in these states with the rest of Australia (Kronemann, 2001; Dowling andO’Malley, 2009). In fact, discussing the policy change, the Queensland Department ofEducation website states “This means that Queensland children will be starting school atabout the same age as children in other states.”19
The practice of “red-shirting”—parents delay child’s enrollment if the child is tooyoung for their cohort, could also confound school-entry age effect because it is potentiallydriven by the heterogeneity in the treatment effect of educational attainment (Aliprantis,2012; Fiorini et al., 2013). Taylor and Fiorini (2011) document red-shirting practicesacross Australia and for the policy-change states, less than 2 percent of parents hold backyoung-for-cohort children from school enrollment (see Table 2).20 They argue that parents
17A large proportion of eligible student population is enrolled in pre-primary (ABS, 2012). See Dowlingand O’Malley (2009) for an overview of pre-school provision in Australia.
18The change also marginally increased the amount of pre-primary hours available in Western Australia(Kronemann, 2001). Pre-primary provision availability changed from four days to five days starting in 2002.Given the high participation rate, the increase is unlikely to have affected the decision to participate inchild-care.
19See http://education.qld.gov.au/strategic/advice/earlychildhood/faq-prep1.html. Accessed on Dec 11, 2013. Alternate active url: http://www.rochedalss.eq.edu.au/prepinfosheetjune05rev.pdf
20For Queensland and for Western Australia, the percentage of children who enter school on time (i.e.
5
are more likely to red-shirt if change in entry age potentially reduces their child’s age.21 Infact, any change in the entry-age in once-a-year school entry will always make some chil-dren younger for the cohort. Unfortunately, the data does not allow me to examine whetherthose who would be younger-for-cohort if enrolled, are actually delayed. However, thisis a concern only insofar as these children are held back and if they have significantlydifferent outcome than the children held back before the policy change.
3.1.2 Other Policies
One policy that may be potentially important in the context of this analysis is the dissemi-nation of school-quality information. In late January of 2010, “My School” website wentpublic. The website had information on the average standardized test scores for everyschool—public and private—in Australia.22 In fact, this analysis uses the “My School”data.
The dissemination of school quality information possibly affected the academic out-come of schools. Three reasons, however, suggest that it is unlikely that the effect willmanifest before 2011 for the grades examined. First, the school quality information wasmade publicly available only two days before school opening date limiting any “votingby feet” type behavior by parents in response to school quality information. Second, asprimary school ends in grade 7 in these states, grade 8 become a natural point for exer-cising school choice. Finally, the standardized tests were administered in May—just threemonths after school quality information was released. Thus, it seems reasonable to as-sume that the effect of dissemination of public schools would have limited effect, if anyat all, on educational outcomes in 2010. If school-quality dissemination affects grades23
differentially, this effect will bias results for Queensland. This is because, in the data, onlythe 2011 cohort was affected by policy change. For Western Australia, the effect of policychanges can be isolated from the affect of school-quality dissemination by using only 2010data as post-policy period.24
4 Data
4.1 Test ScoresThe analysis uses grade-level school data for two states in Australia—Queensland andWestern Australia. The data spans from the year 2008 through 2011. The outcome ofinterest is the mean grade test score for each individual school. The scores are results fromNational Assessment Program - Literacy and Numeracy (NAPLAN) tests. Beginning in
neither early nor delayed entry) is 99.8 and 98.3, respectively.21When practiced, the delayed entry, in general, ensures that children are older than they would have been
if enrolled when eligible.22It also had information on other characteristics of school such as percent of indigenous students and
other contextual information.23The specifications that employs school-by-grade fixed-effects will likely go someway toward addressing
this concern.24In Western Australia, grade 7 cohort for both years, 2010 and 2011, were affected by policy change.
Results of the main specification below are not sensitive to inclusion to 2011 and are available on request.
6

2008, these standardized tests are administered to all25 students in grades 3, 5, 7 and 9in each of the following 5 domains: reading, writing, spelling, grammar and punctuation,and numeracy. The analysis here uses all subjects except writing for Queensland.26 Allfive subjects are analyzed for Western Australia.
NAPLAN test measures absolute competence, therefore scores are higher in highergrades. Scores range from 0 to 100027. On average, the learning for a single grade yearis roughly 50 points on the test for lower grades and about 25 points for higher grades.Scores are vertically scaled and subject-specific to allow for comparison across grades.Within subject scores are comparable across time. Thus, the educational achievementrepresented by a particular score does not change over time. These features make theNAPLAN test scores an appropriate measure of academic achievement for the empiricalstrategy employed (see section 5 below).
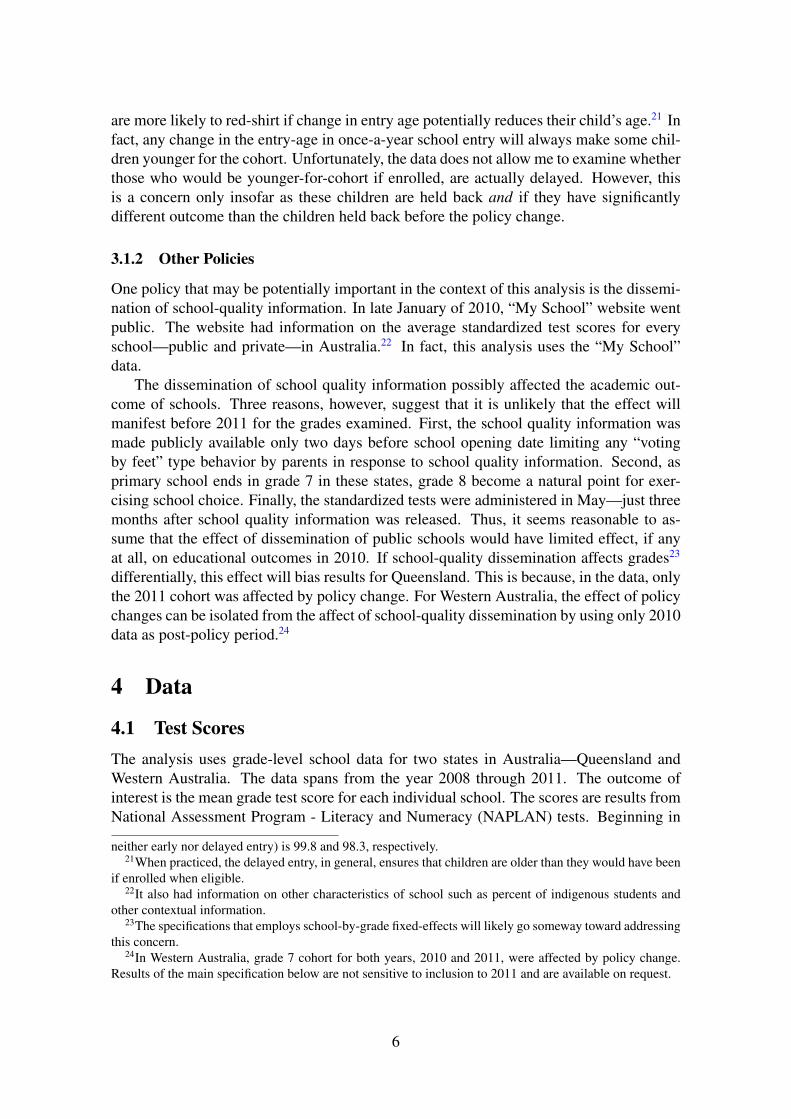
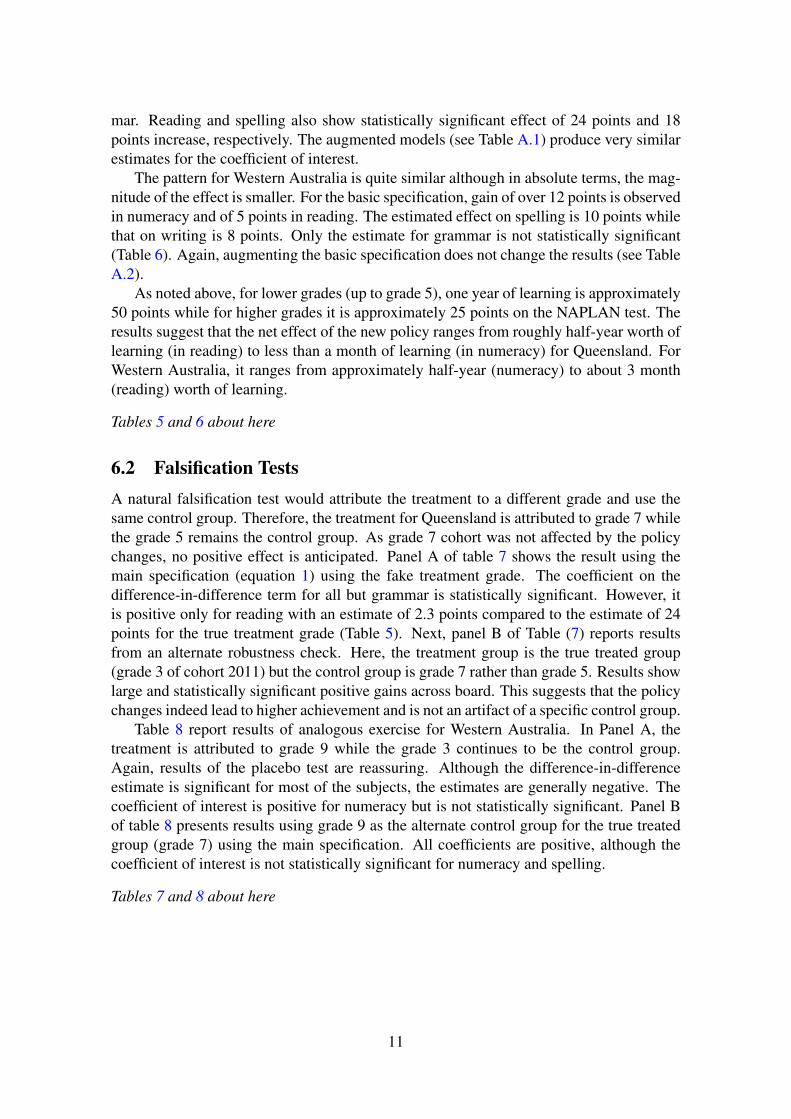
For state of Queensland, grade 3 cohort is the treatment grade (has preparatory year ex-posure and is older than prior cohorts) in the year 2011 and the pre-treatment period is thecohort from the year 2008. The corresponding control group is grade 5 cohort. In West-ern Australia, grade 7 students of cohort 2010 is the treated cohort and the pre-treatmentperiod is the the cohort from the year 2008. The control group for Western Australia arestudents from grade 3. Figures 1 and 2 show the distribution of NAPLAN scores acrossQueensland and Western Australia for pre- and post-treatment period. The figures sug-gest that the distribution of scores for the treated grade has shifted to the right for bothsubjects and for both states. However, the distribution of the control group for numeracyin Queensland and for reading in Western Australia also suggest overall improvement inscores.
Table 1 and table 2 shows the average subject specific NAPLAN scores for the twopolicy change states in greater detail. Two patterns emerge. First, generally large posi-tive growth (except in Numeracy) is observed for the treated group across pre- and post-treatment period. Moreover, the positive growth is observed across both states for schoolsacross all sectors. The negative growth in writing for the Catholic sector in Western Aus-tralia is an exception. Second, the growth is generally the smallest for numeracy. In con-trast to the control group, the change in mean score for the treatment group is substantiallylarger and positive for all subjects.
The growth for the treatment group ranges from 6.6 points (numeracy) to 26.7 points(Grammar) for Queensland (Table 1). The highest growth for the control group acrossany subject within any school sector is 15.9 points (numeracy). In fact, numeracy showedpositive gains for the control group across all sectors. The contrast between the treatedand non-treated is far greater for subjects other than numeracy.
Similar to Queensland (and with the exception of writing score in Catholic schoolsnoted above), the Western Australia treatment group also shows large positive gains acrossall subjects (Table 2) and the growth ranges from 5.3 points (numeracy) to 23.5 points(grammar). Numeracy generally experienced the lowest growth among all subjects. Within
25Some parents may withdraw their children from participation and some students may be exempt orabsent.
26Since 2011, the writing test also assesses persuasive writing in addition to narrative assessment. There-fore, writing results for 2011 are not comparable with prior year writing scores (see http://www.nap.edu.au/information/faqs/naplan--writing-test.html).
27Analysing NAPLAN Data: www.vcaa.vic.edu.au/Documents/naplan/analysingnaplandata.pdf (retrieved on December 13, 2013).
7

the control group, the highest growth is in grammar (15.8 points). For most subjects,across either grades and across either states, the change in scores for government schoolsare quite substantial.
Figures 1 and 2about here
Tables 1 and 2 about here
4.2 School CharacteristicsTable 3 shows that for the state of Queensland, the data is comprised of 1068 primaryschools and 218 combined schools—schools that serve primary as well as secondarygrades. According to official statistics, the corresponding number of unique primaryschools and combined schools in Queensland are 1152 and 251 respectively (ABS, 2012).Similarly, in Western Australia, there were 663 primary schools and 221 combined schools(ABS, 2012) while the data here has 527 unique primary schools and 178 unique combinedschools observed across pre- and post-treatment periods. The requirement that school re-port scores for the pre- and post-treatment period results in the smaller sample. Naturally,this means that the analysis excludes new schools or schools that closed in either period.
Over 75 percent of independent schools in Queensland and Western Australia are com-bined schools. Majority of Catholic schools (about 92 percent) and public schools (about90 percent) are primary schools in Queensland. A similar pattern is also observed forWestern Australia. For both states, majority of schools are located in metropolitan areasor suburbs. This is especially true for independent (non-Catholic private) schools. Thelocation of Catholic schools observed in the Western Australia sample is anomalous withsubstantially greater proportion in suburbs than in metropolitan areas. Main results (be-low) are robust to using public schools only.28 Finally, for either states, public schoolsand Catholic schools, as may be expected, are more likely to be located in remote or veryremote location.
Table 3 about here
Table 4 presents the average school characteristics in the pre- and post-treatment periodfor private and public school in Queensland and Western Australia. The ICSEA29 is anindex of socio-educational advantage measure of student population of the school. Onaverage, the ICSEA has been increasing for private schools while declining (or increasingvery marginally) for public school. For Queensland, the difference between the ICSEAbefore- and after-treatment period is statistically significant for all private school sectors.30
The increase in ICSEA across private schools suggests that the student population may bechanging. Thus, if other unobservables that improve achievement are also changing, the
28Results available on request. Note that public schools constitutes two-thirds of the sample.29Index of Community Socio-Educational Advantage (ICSEA) is a means of making a comparison of
the levels of educational advantage or disadvantage that students bring to their academic studies. ICSEAvalues range from around 500 (extremely educationally disadvantaged backgrounds) to about 1300 (veryeducationally advantaged backgrounds).
30Watson and Ryan (2010) found that almost 60 per cent of the decline in government school enrollmentsbetween 1975 and 2006 occurred in the top half of the socioeconomic status distribution.
8

estimates below will be biased upward.31 However, as noted above, all results are robustto limiting the sample to public schools only.
An important factor in assessing socio-economic index is the percent of indigenousstudents in the school. On average, approximately 10-14 percent of student population inpublic schools, are indigenous in either states in the sample used. Across Australia, publicschools accounted for 85 percent of all Indigenous student enrollment in 2010 (DEEWR,2011). Although the number of indigenous students in non-government schools has beenincreasing in recent years (ABS, 2012), the percent of indigenous students observed forprivate sector in Western Australia in the sample is substantially high (24 percent and 14percent for Catholic and independent sector, respectively) possibly due to higher propor-tion observed in primary schools. As anticipated, proportion of indigenous students hasbeen increasing in public schools. Notwithstanding these general trends, there is varia-tion in the student composition with each sector. For instance, even some Independentschools may draw their total enrollment from students of low socio-economic status (p.11DEEWR, 2011).
Table 4 also documents the student enrolled, the proportion of female students and thestudent-teacher ratio across the two state in the relevant periods. None of the changes arestatistically significant.
Table 4 about here
5 Estimation StrategyI use the policy induced variation in exposure to preparatory year and the age at schoolentry within school settings across cohorts to identify the effect of increase in school en-try age on the NAPLAN test scores. The policy change lends itself to the difference-in-difference framework. A standard specification, for the present context, is:
Agst = α + βXst + γTreatmentgs + τPostt + θTreatmentgs ∗ Postt + εgst (1)
Agst is the average academic achievement of grade g students in school s in year t. Aca-demic achievement is measured using score on standardized test (see section 4) acrossa range of subjects including numeracy and reading. Treatment is an indicator variablefor student in the treated grade (3 and 7 for Queensland and Western Australia, respec-tively). Post is an indicator variable for the period after treatment. For Queensland, thepre-treatment cohort corresponds to the year 2008 while the post-treatment correspondsto the year 2011. For Western Australia, the pre-treatment cohort corresponds to the year2008 while the post-treatment corresponds to the year 2010.
The control group is an alternate grade for the pre- and post-policy change period. ForQueensland, the control group is grade 5 while the control group for Western Australia isgrade 3. X are school-level, time-varying as well as time-invariant, controls that accountfor observable differences. These are: ICSEA (socio-economic index), percent of indige-nous students, percent of female students, total enrollment, indicators for school sector (fore.g. private or public) and for school type (for e.g. combined or primary), and interaction
31If, as is likely, individuals from higher socio-economic group send their children to private schools arealso less likely to be, for instance, unemployed in last 12 months–one of the characteristics that affectsICSEA, then ICSEA will be rising in private schools.
9

of school sector and school type with post-treatment year dummy to allow for differentialtrends.32 The coefficient of interest, θ, identifies the effect of the policy changes.33
The difference-in-difference estimator assumes that the potential outcome is a linearfunction of the time dummy (indicator for post) and the group dummy (treatment). Theidentification is based on the well known, albeit inherently untestable, “common trend”assumption: the change in average outcome across the treatment and the control groupwould be same in the absence of treatment.34
The control group is an alternate grade in the same state across the pre- and post-treatment period. In particular, that alternate grade is preferably common to the schoolwith the treatment grade. It then seems reasonable to assume that each state is likely tofollow similar strategies to improve achievement especially for grades within school typessuch as primary or secondary. Finally, the composition is less likely to be changing acrosscohorts within a state than across states.
An additional requirement for unbiased estimates is that the composition of the treat-ment group is stable. This is especially a concern when using cross-sectional data. Here,the pre- and post-treated group belong to different cohorts. However, it is reasonable toassume that, on average, the performance of cohorts would be similar. That is, academicperformance is unlikely to be systematically different across these cohorts for both treat-ment as well as the control grades except due to the policy change. Note that the generalyear-on-year increasing trend in test scores is captured by the variable Post. Systematicmanipulation of grade assignment is also unlikely to be a concern as the unit of analysis isgrade. The augmented models discussed in the appendix (section A) examine additionalconcerns that may potentially bias the results above.
6 Results
6.1 Main ResultsTable 5 presents result for the coefficient of interest for the basic difference-in-differencespecifications for Queensland. Full results and estimates of augmented models are rele-gated to the Appendix (section A). The large negative coefficient on the variable Treatmentis expected to reflect the approximately 90 points lower score that is expected in grade 3(treated grade) relative to the score in grade 5 (control group) due to the vertical scaling oftest scores. Average time-trend across both grades is negative as shown by coefficient forthe variable Post. The coefficient on the variable Treatment*Post (θ) captures the effectof the policy change. It shows a positive effect of increase in school entry-age (Table 5).The effect ranges from 3.3 points increase in numeracy to 25.5 points increase in gram-
32Estimates are qualitatively similar when X is not included. Results available on request.33In particular, under full compliance to the treatment, this is the average treatment effect on the treated
(ATT). In the present context, the assumption of full compliance requires that all units in the cohorts affectedby treatment should be older for the grade and have had preparatory year exposure. In the absence of perfectcompliance, the difference-in-difference identifies the Intention-to-Treatment (ITT) effect. ITT estimatesthe average effect of the treatment on the outcome of all eligible units, regardless of their participation.
34A difference-in-difference-in-difference specification is also feasible where the control group is thesame grade as the treated grade but from an alternate state. A non-treated grade is an additional control. Re-sults are qualitatively similar but are less credible as the identification assumes that the trend in the treatmentgrade is same across different states. Results are available on request.
10
mar. Reading and spelling also show statistically significant effect of 24 points and 18points increase, respectively. The augmented models (see Table A.1) produce very similarestimates for the coefficient of interest.
The pattern for Western Australia is quite similar although in absolute terms, the mag-nitude of the effect is smaller. For the basic specification, gain of over 12 points is observedin numeracy and of 5 points in reading. The estimated effect on spelling is 10 points whilethat on writing is 8 points. Only the estimate for grammar is not statistically significant(Table 6). Again, augmenting the basic specification does not change the results (see TableA.2).
As noted above, for lower grades (up to grade 5), one year of learning is approximately50 points while for higher grades it is approximately 25 points on the NAPLAN test. Theresults suggest that the net effect of the new policy ranges from roughly half-year worth oflearning (in reading) to less than a month of learning (in numeracy) for Queensland. ForWestern Australia, it ranges from approximately half-year (numeracy) to about 3 month(reading) worth of learning.
Tables 5 and 6 about here
6.2 Falsification TestsA natural falsification test would attribute the treatment to a different grade and use thesame control group. Therefore, the treatment for Queensland is attributed to grade 7 whilethe grade 5 remains the control group. As grade 7 cohort was not affected by the policychanges, no positive effect is anticipated. Panel A of table 7 shows the result using themain specification (equation 1) using the fake treatment grade. The coefficient on thedifference-in-difference term for all but grammar is statistically significant. However, itis positive only for reading with an estimate of 2.3 points compared to the estimate of 24points for the true treatment grade (Table 5). Next, panel B of Table (7) reports resultsfrom an alternate robustness check. Here, the treatment group is the true treated group(grade 3 of cohort 2011) but the control group is grade 7 rather than grade 5. Results showlarge and statistically significant positive gains across board. This suggests that the policychanges indeed lead to higher achievement and is not an artifact of a specific control group.
Table 8 report results of analogous exercise for Western Australia. In Panel A, thetreatment is attributed to grade 9 while the grade 3 continues to be the control group.Again, results of the placebo test are reassuring. Although the difference-in-differenceestimate is significant for most of the subjects, the estimates are generally negative. Thecoefficient of interest is positive for numeracy but is not statistically significant. Panel Bof table 8 presents results using grade 9 as the alternate control group for the true treatedgroup (grade 7) using the main specification. All coefficients are positive, although thecoefficient of interest is not statistically significant for numeracy and spelling.
Tables 7 and 8 about here
11

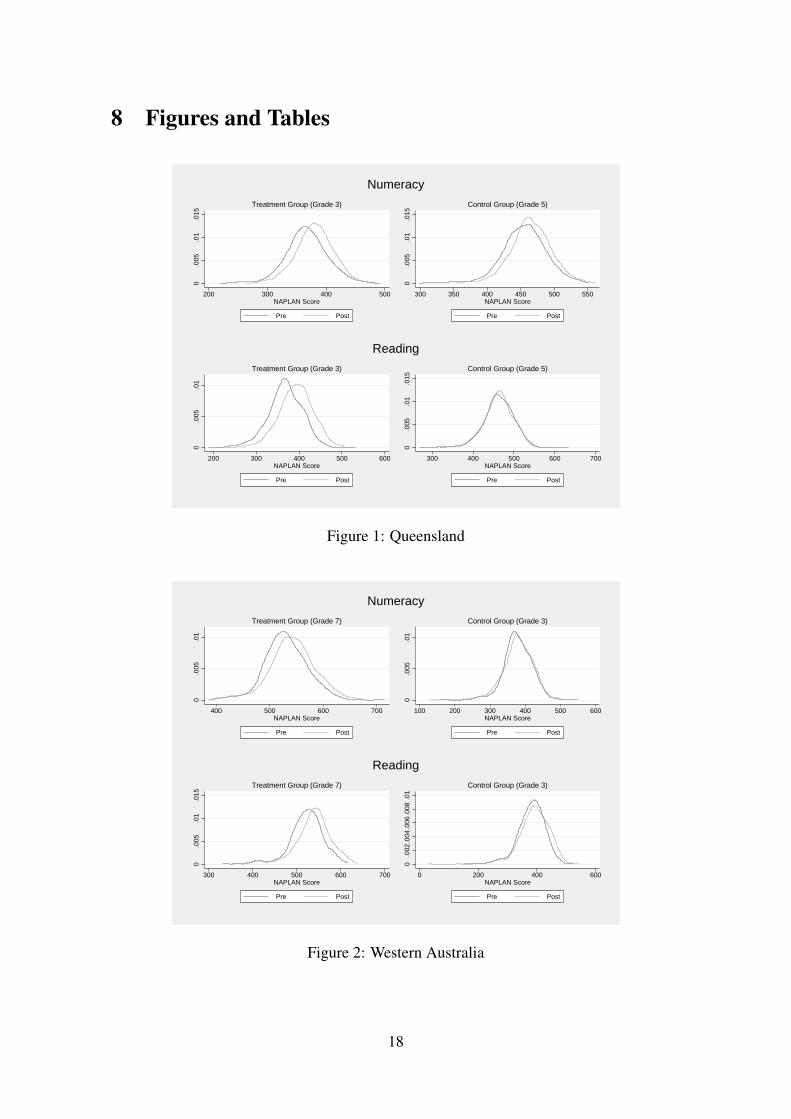
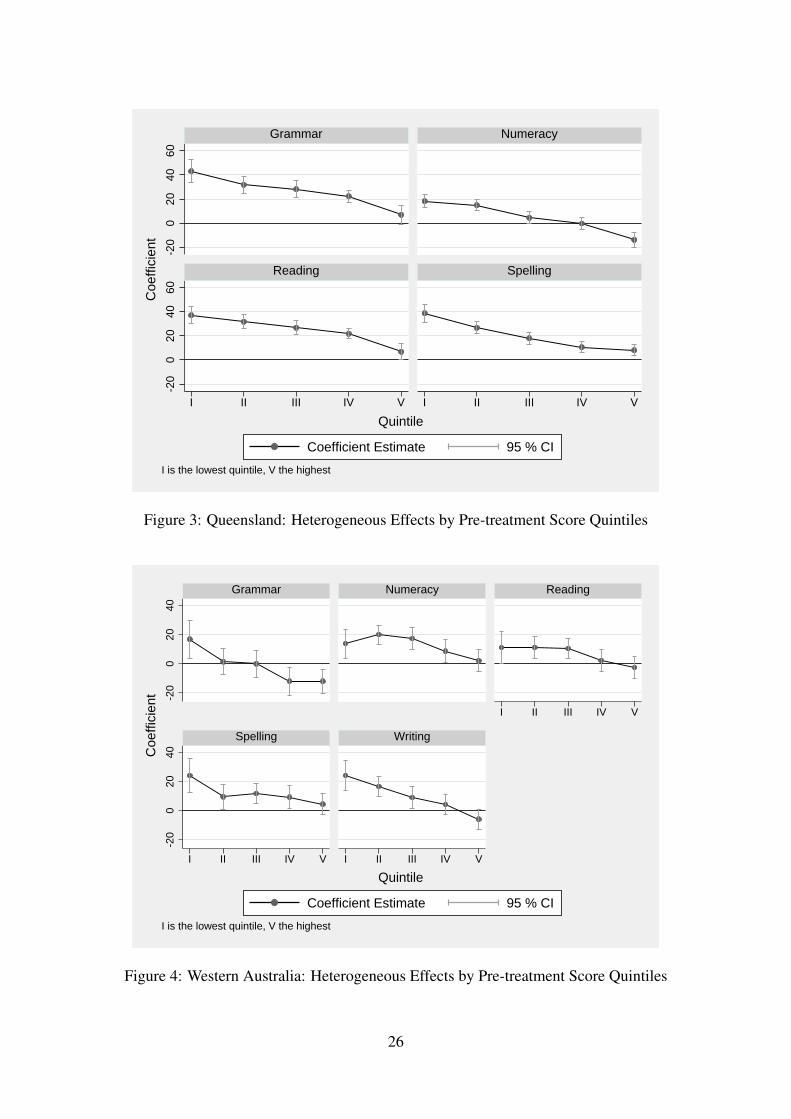
6.3 Heterogeneous EffectsThe provision of (non-compulsory) preparatory year and the increase in entry-age mayhave different effect on achievement.35 If schools continue to draw similar students acrosspre- and post-treatment periods, it is possible to examine how the effect of entry-age variesby school quality as measured by test scores.
To assess this potential heterogeneity in the observed effects, I divide the sample of allgovernment schools36 in 5 quintiles based on the average score of the treated grade in thepre-treatment period. Thus, for Queensland, the quintiles are based on the score of grade3 (treated grade) in the year 2008 (pre-treatment period). Schools in Quintile I have thelowest score in the pre-treatment year while schools in Quintile V have the highest.
Figures 3 and 4 show a fairly consistent pattern. Effects are generally decreasing inquintiles. The smallest effect observed for the top quintile (highest scoring) school is dueto the nature of the standardized tests. The NAPLAN tests primarily assesses basic literacyand numeracy skills. Therefore, schools that are already performing very well are unlikelyto show substantial (or even any) gains due to increase in the school entry-age for specificcohort. In effect, the test is not appropriate for examining the effect for the top quintile. Inshort, any ceiling effect of the test will be exacerbated for the top quintile.
However, there is no reason, a-priori, to expect the combined effect of preparatory yearand maturity to have a negative effect.37 In all likelihood, no effect should be observedfor this group. Indeed, except for numeracy in Queensland and for grammar in WesternAustralia, none of the estimates of the effect of increased entry-age are both negative aswell as statistically significant. Thus, it is possible that even students within higher quintileschools were positively affected. Analogous reasoning would argue that the largest effectshould be observed for the lowest quintile schools. On average, at least 60 per cent (or thebottom three quintiles) of the public schools seem to experience gain on tests measuringessential numeracy and reading skills.
Figures 3 and 4 about here
6.4 Effect on the Transition CohortAs noted earlier, the treatment cohort in the analysis above is not the first cohort affectedby the policy. In addition to the cohort being substantially smaller, the transition mayaffect child development resources due to change in policy. This seems to be the case forQueensland where the provision of preparatory year lead to re-badging of pre-schools andmay have been the case for Western Australia as well. Conceivably, this would adverselyaffect pre-school provision (i.e pre-kindergarten) prior to preparatory year. Although forthe affected cohort, pre-kindergarten would be substituted with preparatory year, it is notclear that pre-kindergarten and preparatory year are substitutes. Furthermore, because theaffected cohort was smaller, average class size may have changed, and in turn, affectedachievement. Consequently, the net effect is an empirical issue.
35For instance, boys may experience greater gain, especially in lower grades. Unfortunately, there is noinformation about proportion of boys at grade level.
36Using only government school ensures a more homogeneous group. Moreover, interventions will bealso be homogeneous, for instance, for failing schools.
37It is quite unlikely that these schools receive a greater proportion of student who are indirectly affectedby the increase in entry-age (i.e. now younger-within-cohort due to policy change).
12

Individual heterogeneity would clearly be an important factor in how a particular childwill be affected by these changes. Nonetheless, re-estimation of the main specificationabove (equation 1) using the transition cohort as the treatment cohort is informative. Thetreatment cohort for Queensland is the same grade as before (grade 3) but in the firstaffected year – 2010 (instead of 2011). The control grade is grade 5 as before. As the testsare every alternate year, the pre-treatment year is 2009 (instead of 2008). For WesternAustralia, the transitioning treatment cohort is grade 7 in the year 2009 (instead of 2010)while the both the control grade (grade 3) and pre-treatment period (2008) is the same as inthe earlier analysis. Table 9 presents the result for the transitioning grade in Queensland(inPanel A of the table). Panel B reports the results from Table 5 (for the non-transitioninggrade) to facilitate comparision. It shows that, compared to the non-transitioning grade,the policy changes did not produce as large gains. All gains were reduced by at least halfand for spelling achievement, there is a statistically significant negative shock. Table 10reports the corresponding estimation results for Western Australia. Although a similarreduction in the gain is observed for numeracy and writing, for all other subjects thereare losses. The negative shocks for both reading and spelling are statistically significant.These results suggest that the transition may have adversely affected these cohorts.
Tables 9 and 10 about here
7 ConclusionThis analysis estimates the combined effect of the increase in school entry-age and theintroduction of (non-compulsory) preparatory year within the school system on standard-ized test scores in Australia. On average, the policy change manifest sizable gains acrosstwo different states. For policy, understanding the economic significance of these effectsis important. Two reasons suggest that these policy changes matter. First, recall that onthe NAPLAN tests, approximately 25 points on the test scores is equivalent to one year oflearning. For lower grades such as grade 3, one year of learning equates with roughly 50points on NAPLAN test score. Therefore, as the estimates of positive effect for Queens-land are around 20 points (except for 3 point effect on numeracy), these are large effects.The gains are smaller in magnitude at grade 7 for Western Australia. They range from5.8 points for reading to 12.5 points for numeracy. The economic significance rangesfrom one-quarter to one-half of a year worth of learning. This is roughly similar to thatobserved for Queensland. Second, recall that the unit of analysis here is a grade. Thus,even if few students are adversely affected, for instance, by the entry-age increase, overallbenefits are sufficiently large to manifest a positive effect.
The proportionate effect of either policy (preparatory year provision and entry-age in-crease) can not be assessed due to data limitations. To my knowledge, no appropriateempirical evidence is available to ascertain the impact of introduction of preparatory yearwithin the school system. I plan to explore this in future research. Although there is someevidence on the positive effect of increase in the school entry-age, there is no consensus.Furthermore, the fact that policy change shifts the age distribution suggests complex ef-fects. If indeed the increased entry-age and the exposure to preparatory year within schoolsystem have positive effects, just the effect of preparatory year could be large enoughto account for the half-year worth of additional learning. Notwithstanding the economic
13

significance of the effect, the magnitude of the combined effect then is, surprisingly, mod-est. The small effect could be due to three reasons. First, the introduction of prep yearwithin schools, may limit availability of or level of resources available for kindergarten.As shown, this is probably true for the transitioning cohort but may well have affected,albeit less severely, other cohorts too. Second, the observed heterogeneous effects acrossdifferent schools is plausibly indicative of why the effects are not much larger. Arguably,if the measure of academic achievement did not have a ceiling effect, then a sizable effectwould be observed even for high performing schools. Finally, either one of the two policiescould have had a negative effect on the entire cohort or on some sub-groups within.
The analysis highlights other policy implications as well. On the one hand, the policychange implies that any comparisons of aggregate performance across states wherein stu-dents had different schooling experience in terms of entry-age as well as pre-compulsoryyear of schooling are not valid. The analysis above shows that the effects sustain, atleast, up to grade 7. In the second place, comparisons even within states across two co-horts with different institutional structures is also un-informative about improvements ordecline in academic performance. It is important to be cognizant of these cohort widedifferences when, either other policy effects are evaluated or when school performance isevaluated using aggregate NAPLAN scores. The non-compulsory nature of preparatoryschooling complicates comparisons further. For instance, cohorts exposed to preparatoryyear when it is first introduced may have substantially different take-up rates than those inlater cohorts. Furthermore, as schools and teachers engaged in prep education gain moreexperience, even the effect of prep may be very different across cohorts.
Finally, from a policy perspective, it is also important to understand if these gains areevenly distributed, for instance, across students and across gender38. And if not, whatunderlying mechanisms generate the differential returns. It seems that, due to these policychanges, there is better learning while at school, at least for students who did not transitionto school during policy change years. Does the higher human capital augmentation lead togreater educational attainment in Australia? Or to higher returns in the labor market? Andhow large is the impact, if any at all? The current study can not explore these questions butit underscores the importance of continued research on policies affecting early childhooddevelopment.
ReferencesABS (2012): “Schools, Australia,” Tech. Rep. 4221.0, Australian Bureau of Statistics,
Canberra.
ACARA (2011): “National Assessment Program Literacy and Numeracy Achievement inReading, Persuasive Writing, Language Conventions and Numeracy: National Reportfor 2011,” Australian Curriculum, Assessment and Reporting Authority, Sydney.
ALIPRANTIS, D. (2012): “Redshirting, compulsory schooling laws, and educational at-tainment,” Journal of Educational and Behavioral Statistics, 37, 316–338.38In the context of school entry-age, Fiorini et al. (2013) find that to the extent red-shirting occurs, boys
are more likely to be held back. And, Bedard and Dhuey (2012), do not find evidence of positive effect onfemales.
14

BARNETT, W. S. (2011): “Effectiveness of early educational intervention,” Science, 333,975–978.
BAXTER, J. AND K. HAND (2013): Access to early childhood education in Australia,Australian Institute of Family Studies.
BEDARD, K. AND E. DHUEY (2006): “The persistence of early childhood maturity: In-ternational evidence of long-run age effects,” The Quarterly Journal of Economics, 121,1437–1472.
——— (2012): “School-Entry Policies and Skill Accumulation Across Directly and Indi-rectly Affected Individuals,” Journal of Human Resources, 47, 643–683.
BERLINSKI, S., S. GALIANI, AND P. GERTLER (2009): “The effect of pre-primary edu-cation on primary school performance,” Journal of Public Economics, 93, 219–234.
BERLINSKI, S., S. GALIANI, AND M. MANACORDA (2008): “Giving children a betterstart: Preschool attendance and school-age profiles,” Journal of Public Economics, 92,1416–1440.
BLACK, S. E., P. J. DEVEREUX, AND K. G. SALVANES (2011): “Too young to leave thenest? The effects of school starting age,” The Review of Economics and Statistics, 93,455–467.
CASCIO, E. AND D. W. SCHANZENBACH (2007): “First in the class? Age and the edu-cation production function,” Tech. rep., National Bureau of Economic Research.
CASCIO, E. U. (2008): “How and why does age at kindergarten entry matter?” FRBSFEconomic Letter.
CUNHA, F., J. J. HECKMAN, L. LOCHNER, AND D. V. MASTEROV (2006): “Interpretingthe evidence on life cycle skill formation,” Handbook of the Economics of Education,1, 697–812.
CURRIE, J. (2001): “Early childhood education programs,” The Journal of EconomicPerspectives, 15, 213–238.
DECICCA, P. AND J. SMITH (2013): “The long-run impacts of early childhood education:Evidence from a failed policy experiment,” Economics of Education Review.
DEEWR (2011): “Review of Funding for Schooling,” Report, Department of Educationand Workplace Relations (DEEWR).
DEMING, D. AND S. DYNARSKI (2008): “The Lengthening of Childhood,” The Journalof Economic Perspectives, 22, 71–92.
DET (2003): “Annual-Report 2002-2003,” Tech. rep., Department of Education andTraining, Government of Western Australia.
DOWLING, A. AND K. O’MALLEY (2009): “Preschool education in Australia,” PolicyBriefs, 1.
15

DUMAS, C. AND A. LEFRANC (2010): “Early schooling and later outcomes: Evidencefrom pre-school extension in France,” THEMA Working Papers 2010-07, THEMA(THorie Economique, Modlisation et Applications), Universit de Cergy-Pontoise.
ELDER, T. E. AND D. H. LUBOTSKY (2009): “Kindergarten entrance age and children’sachievement impacts of state policies, family background, and peers,” Journal of HumanResources, 44, 641–683.
EWERT, S. (2013): “The Decline in Private School Enrollment,” SEHSD Working PaperFY12-117, U.S. Census Bureau.
FIORINI, M., K. STEVENS, M. TAYLOR, AND B. EDWARDS (2013): “MonotonicallyHopeless? Monotonicity in IV and fuzzy RD designs,” Tech. rep.
FITZPATRICK, M. D., D. GRISSMER, AND S. HASTEDT (2011): “What a difference aday makes: Estimating daily learning gains during kindergarten and first grade using anatural experiment,” Economics of Education Review, 30, 269–279.
FREDRIKSSON, P. AND B. OCKERT (2013): “Life-cycle effects of age at school start,”The Economic Journal.
GUPTA, N. D. AND M. SIMONSEN (2010): “Non-cognitive child outcomes and universalhigh quality child care,” Journal of Public Economics, 94, 30 – 43.
KALIL, A., R. HASKINS, AND J. CHESTERS (2012): Investing in Children: Work, Edu-cation, and Social Policy in Two Rich Countries, Brookings Institution Press.
KAWAGUCHI, D. (2011): “Actual age at school entry, educational outcomes, and earn-ings,” Journal of the Japanese and International Economies, 25, 64 – 80.
KRONEMANN, M. (2001): “The Western Australian model of preschool education,” Tech.rep., Australian Education Union.
MAGNUSON, K. A., C. RUHM, AND J. WALDFOGEL (2007a): “Does prekindergartenimprove school preparation and performance?” Economics of Education Review, 26,33–51.
——— (2007b): “The persistence of preschool effects: Do subsequent classroom experi-ences matter?” Early Childhood Research Quarterly, 22, 18–38.
MUHLENWEG, A. M. AND P. A. PUHANI (2010): “The evolution of the school-entry ageeffect in a school tracking system,” Journal of Human Resources, 45, 407–438.
OECD (2013): “PISA 2012 Results: What Makes Schools Successful? Resources, Poli-cies and Practices (Volume IV),” OECD Publishing.
PUHANI, P. AND A. WEBER (2007): “Does the early bird catch the worm?” EmpiricalEconomics, 32, 359–386.
REYNOLDS, A. J. AND J. A. TEMPLE (2008): “Cost-Effective Early Childhood Develop-ment Programs from Preschool to Third Grade,” Annual Review of Clinical Psychology,4, 109–39.
16

RYAN, C. AND L. SIBIETA (2011): “A comparison of private schooling in the UnitedKingdom and Australia,” Australian Economic Review, 44, 295–307.
TAYLOR, M. AND M. FIORINI (2011): “Who gets the ‘gift of time’ in Australia? Explor-ing delayed primary school entry,” Australian Review of Public Affairs, 10, 41–60.
WARREN, D. AND J. P. HAISKEN-DENEW (2013): “Early Bird Catches the Worm: TheCausal Impact of Pre-school Participation and Teacher Qualifications on Year 3 NationalNAPLAN Cognitive Tests,” Tech. rep., Melbourne Institute of Applied Economic andSocial Research, The University of Melbourne.
WATSON, L. AND C. RYAN (2010): “Choosers and Losers: The Impact of GovernmentSubsidies on Australian Secondary Schools.” Australian Journal of Education, 54, 86–107.
17
8 Figures and Tables
0.0
05.0
1.0
15
200 300 400 500NAPLAN Score
Pre Post
Treatment Group (Grade 3)
0.0
05.0
1.0
15
300 350 400 450 500 550NAPLAN Score
Pre Post
Control Group (Grade 5)
Numeracy0
.005
.01
200 300 400 500 600NAPLAN Score
Pre Post
Treatment Group (Grade 3)
0.0
05.0
1.0
15
300 400 500 600 700NAPLAN Score
Pre Post
Control Group (Grade 5)
Reading
Figure 1: Queensland
0.0
05.0
1
400 500 600 700NAPLAN Score
Pre Post
Treatment Group (Grade 7)
0.0
05.0
1
100 200 300 400 500 600NAPLAN Score
Pre Post
Control Group (Grade 3)
Numeracy
0.0
05.0
1.0
15
300 400 500 600 700NAPLAN Score
Pre Post
Treatment Group (Grade 7)
0.0
02.0
04.0
06.0
08.0
1
0 200 400 600NAPLAN Score
Pre Post
Control Group (Grade 3)
Reading
Figure 2: Western Australia
18

Table 1: Average Test Scores by School Sector for Queensland
Catholic SchoolsTreatment Group (Grade 3) Control Group (Grade 5)
Pre Post Diff (se) Pre Post Diff (se)NUMERACY 376.830 383.470 6.640 (2.670) 465.949 470.359 4.410 (2.692)READING 384.530 404.550 20.020 (3.210) 478.515 476.171 -2.344 (2.991)GRAMMAR 383.220 406.610 23.390 (3.830) 489.031 492.010 2.979 (3.429)SPELLING 376.590 389.040 12.450 (2.780) 469.663 469.217 -0.446 (2.565)
Government SchoolsTreatment Group (Grade 3) Control Group (Grade 5)
Pre Post Diff (se) Pre Post Diff (se)NUMERACY 359.870 375.860 15.980 (1.690) 448.864 460.314 11.450 (1.571)READING 358.470 384.830 26.350 (1.930) 453.926 455.566 1.640 (1.773)GRAMMAR 357.570 389.130 31.560 (2.270) 464.403 469.457 5.053 (2.034)SPELLING 354.810 375.480 20.670 (1.740) 451.907 452.269 0.362 (1.476)
Independent SchoolsTreatment Group (Grade 3) Control Group (Grade 5)
Pre Post Diff (se) Pre Post Diff (se)NUMERACY 393.420 402.780 9.360 (3.930) 477.177 487.816 10.639 (3.847)READING 396.270 422.990 26.710 (4.900) 490.824 491.036 0.212 (4.184)GRAMMAR 391.770 427.280 35.510 (5.800) 499.691 505.184 5.493 (4.861)SPELLING 384.060 407.380 23.310 (4.100) 474.574 479.922 5.348 (3.413)
19

Table 2: Average Test Scores by School Sector for Western Australia
Catholic SchoolsTreatment Group (Grade 7) Control Group (Grade 3)
Pre Post Diff (se) Pre Post Diff (se)NUMERACY 525.192 530.575 5.383 (8.570 ) 367.212 366.100 -1.112 (10.090)READING 518.271 532.604 14.333 (9.837 ) 375.212 390.080 14.868 (10.861)GRAMMAR 492.388 515.979 23.591 (15.693) 369.519 380.360 10.841 (13.615)SPELLING 516.163 526.042 9.878 (10.489) 368.289 368.800 0.512 (10.576)WRITING 519.894 514.938 -4.956 (14.064) 384.404 385.080 0.676 (12.277)
Government SchoolsTreatment Group (Grade 7) Control Group (Grade 3)
Pre Post Diff (se) Pre Post Diff (se)NUMERACY 527.607 540.025 12.418 (2.643) 376.576 376.633 0.057 (2.589)READING 518.463 534.683 16.219 (2.483) 376.938 386.497 9.559 (3.071)GRAMMAR 504.148 518.946 14.799 (3.043) 370.643 386.538 15.895 (3.446)SPELLING 517.533 531.897 14.364 (2.341) 370.877 373.698 2.821 (2.782)WRITING 512.291 522.017 9.726 (2.807) 388.905 390.127 1.222 (2.720)
Independent SchoolsTreatment Group (Grade 7) Control Group (Grade 3)
Pre Post Diff (se) Pre Post Diff (se)NUMERACY 551.301 560.639 9.337 (6.459) 404.131 399.689 -4.442 (6.403)READING 542.952 555.929 12.978 (5.949) 409.333 416.396 7.062 (7.163)GRAMMAR 527.723 546.631 18.908 (7.027) 403.405 408.901 5.496 (8.036)SPELLING 536.060 544.083 8.023 (5.985) 394.119 391.341 -2.778 (6.418)WRITING 523.274 536.659 13.385 (8.554) 407.869 402.868 -5.001 (5.650)
20

Table 3: School Type and Location for Treatment States
QueenslandCatholic Government Independent Total
School Type: Count†Combined 13 90 115 218Primary 191 843 34 1,068Total 204 933 149 1,286
Location (% in)Metropolitan 54.90 39.34 65.10 44.79Provincial 35.78 48.66 34.23 44.95Remote 4.90 6.97 0.00 5.83Very Remote 4.41 5.04 0.67 4.43
Western AustraliaCatholic Government Independent Total
School Type: CountCombined 17 82 79 178Primary 38 461 28 527Total 55 543 107 705
Location (% in)Metropolitan 10.91 52.49 67.29 51.49Provincial 56.36 24.31 22.43 26.52Remote 12.73 14.00 1.87 12.06Very Remote 20.00 9.21 8.41 9.93
21

Tabl
e4:
Scho
olC
hara
cter
istic
sby
Scho
olTy
pefo
rQ
ueen
slan
dan
dW
este
rnA
ustr
alia
Que
ensl
and
Cat
holic
Scho
olPu
blic
Scho
olIn
depe
nden
tSch
ool
Mea
nD
iffM
ean
Diff
Mea
nD
iffPr
ePo
stPr
ePo
stPr
ePo
stIC
SEA
992.
470
1038
.505
46.0
36**
*96
5.27
295
8.66
9-6
.603
999.
829
1053
.451
53.6
22**
*To
talE
nrol
lmen
t36
2.51
539
5.67
733
.162
349.
110
356.
894
7.78
362
6.73
866
2.93
336
.195
Perc
entI
ndig
enou
s4.
791
5.33
70.
546
10.3
0311
.147
0.84
45.
469
5.46
3-0
.006
Perc
entF
emal
e0.
502
0.50
30.
000
0.48
20.
480
-0.0
030.
507
0.52
80.
021
Stud
ent-
Teac
herR
atio
16.7
6416
.899
0.13
514
.422
14.7
200.
298
14.3
5714
.409
0.05
2W
este
rnA
ustr
alia
Cat
holic
Scho
olPu
blic
Scho
olIn
depe
nden
tSch
ool
Mea
nD
iffM
ean
Diff
Mea
nD
iffPr
ePo
stPr
ePo
stPr
ePo
stIC
SEA
913.
477
942.
236
28.7
6096
7.00
297
0.20
73.
204
993.
594
1017
.664
24.0
69To
talE
nrol
lmen
t32
2.78
233
4.94
612
.164
289.
540
302.
937
13.3
9846
6.51
450
0.71
034
.196
Perc
entI
ndig
enou
s25
.867
24.7
45-1
.122
13.8
9314
.083
0.19
015
.974
14.9
63-1
.011
Perc
entF
emal
e0.
507
0.50
60.
000
0.48
20.
484
0.00
10.
492
0.51
20.
020
Stud
ent-
Teac
herR
atio
14.6
8014
.331
-0.3
4914
.368
14.5
160.
147
13.2
4813
.132
-0.1
16**
*p<
0.01
,**
p<0.
05,*
p<0.
10
22

Table 5: Queensland Results
NUMERACY READING GRAMMAR SPELLINGTreatment -88.163*** -94.672*** -106.285*** -95.405***
(0.911) (0.941) (1.068) (0.806)Post -5.590* -15.227*** -10.616*** -13.005***
(2.999) (3.427) (3.795) (2.848)Treatment*Post 3.327*** 24.113*** 25.524*** 18.473***
(1.113) (1.227) (1.483) (1.083)
Observations 4,434 4,434 4,434 4,434R-squared 0.822 0.810 0.798 0.824School FE No No No No
Post = Year 2011 dummy; Treatment is Grade 3; Control is Grade 5Standard errors (in parentheses) clustered at school level*** p<0.01, ** p<0.05, * p<0.1
Table 6: Western Australia Results
NUMERACY READING GRAMMAR SPELLING WRITINGTreatment 149.531*** 140.350*** 130.957*** 145.728*** 122.516***
(1.305) (1.255) (1.626) (1.379) (1.298)Post -14.919*** 6.810 12.500** -4.745 -8.096*
(4.114) (4.973) (5.839) (4.515) (4.443)Treatment*Post 12.585*** 5.822*** 0.623 10.766*** 8.382***
(1.726) (1.851) (2.169) (1.803) (1.697)
Observations 2,368 2,374 2,371 2,371 2,371R-squared 0.916 0.908 0.868 0.913 0.900School FE No No No No No
Post = Year 2010 dummy; Treatment is grade 7; Control is grade 3Standard errors (in parentheses) clustered at school level*** p<0.01, ** p<0.05, * p<0.1
23

Table 7: Queensland Robustness Test
NUMERACY READING GRAMMAR SPELLINGPanel A: Alternate Treatment (Gr7); Same Control Group (Gr5)
Treatment 80.318*** 63.295*** 42.208*** 65.252***(0.839) (0.842) (0.942) (0.777)
Post 3.190 -9.969*** -4.251 -0.529(3.827) (3.809) (4.422) (3.401)
Treatment*Post -12.338*** 2.382** -0.710 -1.885*(1.076) (1.095) (1.273) (1.055)
Observations 4,436 4,439 4,439 4,439R-squared 0.787 0.782 0.679 0.762School FE No No No No
Panel B: Same Treatment (Gr3); Alternate Control Group (Gr7)Treatment -168.523*** -158.011*** -148.663*** -160.757***
(0.947) (0.942) (1.052) (0.883)Post -8.984** -3.002 -1.790 -0.307
(4.061) (3.828) (4.674) (3.746)Treatment*Post 15.804*** 21.871*** 26.536*** 20.443***
(1.163) (1.216) (1.399) (1.142)
Observations 4,388 4,383 4,384 4,384R-squared 0.924 0.917 0.879 0.921School FE No No No NoPost = Year 2011 dummy; True Treatment is grade 3; True Control is grade 5Standard errors (in parentheses) clustered at school level*** p<0.01, ** p<0.05, * p<0.1
24

Table 8: Western Australia Robustness Results
NUMERACY READING GRAMMAR SPELLING WRITINGPanel A: Alternate Treatment Group (Gr-9); Same Control Group (Gr-3)
Treatment 182.638*** 182.163*** 173.078*** 186.540*** 160.292***(3.278) (3.164) (3.379) (2.640) (3.456)
Post -12.496*** 6.930 3.826 -0.434 1.027(4.561) (5.419) (5.823) (4.861) (4.606)
Treatment*Post 3.277 -21.301*** -10.009* -4.946 -7.417*(4.235) (4.547) (5.138) (4.168) (4.379)
Observations 1,608 1,608 1,610 1,610 1,608R-squared 0.894 0.881 0.856 0.891 0.888School FE No No No No No
Panel B: Same Treatment Group (Gr-7); Alternate Control Group (Gr -9)Treatment -35.593*** -43.114*** -49.552*** -36.588*** -38.505***
(2.200) (2.203) (3.273) (2.666) (3.184)Post -11.797*** -16.227*** 1.339 -7.591** -15.553***
(3.463) (3.270) (5.352) (3.699) (3.880)Treatment*Post 3.977 21.975*** 13.544*** 5.597 9.246**
(3.255) (3.225) (4.290) (3.653) (3.984)
Observations 1,492 1,502 1,499 1,499 1,499R-squared 0.697 0.762 0.730 0.696 0.751School FE No No No No NoPost = Year 2010 dummy; True Treatment is grade 7; True Control is grade 3Standard errors (in parentheses) clustered at school level*** p<0.01, ** p<0.05, * p<0.1
25
-20
020
4060
-20
020
4060
I II III IV V I II III IV V
Grammar Numeracy
Reading Spelling
Coefficient Estimate 95 % CI
Coe
ffici
ent
Quintile
I is the lowest quintile, V the highest
Figure 3: Queensland: Heterogeneous Effects by Pre-treatment Score Quintiles
-20
020
40-2
00
2040
I II III IV V
I II III IV V I II III IV V
Grammar Numeracy Reading
Spelling Writing
Coefficient Estimate 95 % CI
Coe
ffici
ent
Quintile
I is the lowest quintile, V the highest
Figure 4: Western Australia: Heterogeneous Effects by Pre-treatment Score Quintiles
26

Table 9: Queensland Transition Cohort
NUMERACY READING GRAMMAR SPELLINGPanel A: Transitioning Cohort
Treatment -96.402*** -90.051*** -92.629*** -88.888***(0.937) (0.985) (1.012) (0.846)
Post -7.502** -21.900*** -17.710*** -10.287***(2.990) (3.117) (3.476) (2.635)
Treatment*Post 0.821 11.260*** 3.433** -8.550***(1.277) (1.298) (1.449) (1.157)
Observations 4,358 4,357 4,362 4,362R-squared 0.790 0.776 0.754 0.806School FE No No No No
Panel B: Non-Transitioning CohortTreatment -88.163*** -94.672*** -106.285*** -95.405***
(0.911) (0.941) (1.068) (0.806)Post -5.590* -15.227*** -10.616*** -13.005***
(2.999) (3.427) (3.795) (2.848)Treatment*Post 3.327*** 24.113*** 25.524*** 18.473***
(1.113) (1.227) (1.483) (1.083)
Observations 4,434 4,434 4,434 4,434R-squared 0.822 0.810 0.798 0.824School FE No No No NoPost (pre) = Year 2010 (2009) dummy; Treatment is grade 3; Control is grade 5Standard errors (in parentheses) clustered at school level*** p<0.01, ** p<0.05, * p<0.1
27

Table 10: Western Australia Transitioning Cohort Results
NUMERACY READING GRAMMAR SPELLING WRITINGPanel A: Transitioning Cohort
Treatment 150.051*** 141.004*** 131.078*** 145.813*** 122.994***(1.266) (1.218) (1.573) (1.321) (1.258)
Post -7.167* 12.911*** 20.740*** 10.103*** 6.184(3.732) (4.121) (6.024) (3.873) (4.123)
Treatment*Post 3.121* -5.024*** -1.565 -9.393*** 3.654**(1.640) (1.713) (2.086) (1.729) (1.765)
Observations 2,414 2,417 2,422 2,422 2,419R-squared 0.913 0.906 0.868 0.906 0.890School FE No No No No No
Panel B: Non-Transitioning CohortTreatment 149.531*** 140.350*** 130.957*** 145.728*** 122.516***
(1.305) (1.255) (1.626) (1.379) (1.298)Post -14.919*** 6.810 12.500** -4.745 -8.096*
(4.114) (4.973) (5.839) (4.515) (4.443)Treatment*Post 12.585*** 5.822*** 0.623 10.766*** 8.382***
(1.726) (1.851) (2.169) (1.803) (1.697)
Observations 2,368 2,374 2,371 2,371 2,371R-squared 0.916 0.908 0.868 0.913 0.900School FE No No No No NoPost = Year 2009 dummy for Transitioning cohort; Treatment is grade 7; Control is grade 3Standard errors (in parentheses) clustered at school level*** p<0.01, ** p<0.05, * p<0.1
28

A Appendix
A.1 Augmented ModelsFirst, it is possible that schools even within a state and with a common policy environment,pursue different strategies or draw enrollments from disparate population that differentiallyaffects educational achievement. For instance, strategies for primary schools may differfrom combined schools. Indeed, since 2001, growth of combined schools have exhibited astrong upward trend unlike primary or secondary schools (ABS, 2012). Furthermore, therelatively high proportion of private schools in Australia—approximately 34 per cent39 ofstudents in Australia are enrolled in the private sector—suggests other differences acrossthe education sectors. In fact, even among public schools there is heterogeneity. In West-ern Australia, under the Independent Public School initiative, increasing number of publicschools are being given additional management autonomy.40
In order to mitigate these concerns, school fixed effects is included. Consequently, thecontrol group is a different grade within the same school. It is reasonable to assume thatschools will have similar strategy for grades within same school type ( i.e. primary). Itis then conceivable that unobserved difference between the treatment and control groupwould be same over time. Similarly, the other important source of potential bias—sortingof students across public-private schools due to time-invariant school characteristics wouldalso be ameliorated by the inclusion of school fixed-effects. The updated equation, then,is:
Agst = α + βXst + γTreatmentgs + τPostt + θTreatmentgs ∗ Postt + κs + εgst (2)
where κs is the school fixed effect and other variable are as defined above.The implication of including school fixed effects is that the estimates are identified
using within school variation across the two grades under consideration. In particular, theidentifying assumption is that variation in the score for the treatment grade in a specificsubject over and above the variation in average score for treatment and control grade withina particular school is orthogonal to unobservables across the treatment and control group.
A second potential threat to identification relates to time-varying unobservables. Forthe estimates above to be biased, the time-varying factors would need to differentiallyaffect different school types and schools in different sectors so as to be systematically re-lated to the specific treatment and control grades. For instance, quality of students thatare enrolled by private schools or combined schools may vary over time. If so, it may bethat the unobservables differ by grade over time. For example, the 2011 cohort affectedby the entry-age increase in Queensland would be in the first grade at the inception of theintroduction of standardized testing. Therefore, schools may have a different strategiespreparing them for their tests two years hence. Similarly, the 2011 treated cohort of West-ern Australia coincides with the last grade for primary schools and so may be differentiallyaffected by public availability of school-quality information.
Another possibility is that the individual schools, when making teaching and alloca-tion decision for specific grades, weigh the performance of competing schools in those
39See DEEWR (2011).40This initiative provides the principals with greater autonomy to develop staffing profiles, and select and
appoint staff. As of 2013, there are 255 Independent Public Schools operating; 34 of these commenced in2010 (see http://www.det.wa.edu.au/independentpublicschools/detcms/portal/).
29

grades. Consequently, the treatment cohort of 2011 for Western Australia is excluded41
to deal with the potential effect of the nation-wide school quality information dissemina-tion in 2010. Nonetheless, some schools, especially private schools, may be more likelyto experience and respond to parental pressures to improve outcomes for specific grade.Furthermore, the data does not permit such exclusion for Queensland as the 2011 cohortis the only treated group. Thus, school-grade fixed effect is incorporated in the analysis. Itwill capture any systematic difference across grades in a school that is common across alltime periods. Thus, it accounts for school specific teaching practice or curriculum acrossgrades. Naturally, it also absorbs the indicator for treatment which is grade specific. Note,however, that to deal with bias due to time-varying unobservables, the preferred specifica-tion would need to account for time-varying factors across grades within school. This isnot feasible since the grade-cohort variation is used for identification. Consequently, thefollowing specification with school specific grade effects is estimated :
Agst = α + βXst + τPostt + θTreatmentgs ∗ Postt + µgs + εgst (3)
In the equation above, µgs is school-by-grade fixed effect. The effect of policy changeis identified by the variation in treated grade over and above the average score for eachspecific grade within the school.42 Insofar as schools are comprised of grades and to theextent that time-varying factors are differentially affecting specific grades, these factorswould also be affecting schools and therefore this estimation equation is similar to theschool fixed-effect specification.
41Results are qualitatively similar with the inclusion of the year 2011. Available on request.42An alternate approach would use school-by-year fixed effects. This would isolate variation across year
for all common grades. Results are similar to grade-by-year fixed effects and is available on request.
30

Table A.1: Queensland Results
NUMERACY READING GRAMMAR SPELLINGPanel A
Treatment -88.163*** -94.672*** -106.285*** -95.405***(0.911) (0.941) (1.068) (0.806)
Post -5.590* -15.227*** -10.616*** -13.005***(2.999) (3.427) (3.795) (2.848)
Treatment*Post 3.327*** 24.113*** 25.524*** 18.473***(1.113) (1.227) (1.483) (1.083)
Observations 4,434 4,434 4,434 4,434R-squared 0.822 0.810 0.798 0.824School FE No No No No
Panel B: With FETreatment -88.608*** -95.015*** -106.925*** -95.527***
(0.867) (0.879) (1.013) (0.771)Post 10.744*** 0.292 4.472*** 0.777
(1.017) (1.075) (1.300) (1.003)Treatment*Post 3.813*** 24.588*** 26.377*** 18.701***
(1.074) (1.170) (1.426) (1.055)
Observations 4,434 4,434 4,434 4,434R-squared 0.873 0.844 0.835 0.878Number of schools 1,216 1,215 1,216 1,216School FE Yes Yes Yes Yes
Panel C: With School by Grade Fixed EffectsPost 7.506*** -0.077 5.210 7.023
(2.376) (2.641) (3.201) (9.550)Treatment*Post 3.678*** 23.964*** 26.156*** 18.333***
(1.061) (1.158) (1.436) (1.059)
Observations 4,434 4,434 4,434 4,434R-squared 0.201 0.277 0.295 0.220Number of school-grades 2,358 2,354 2,356 2,356School-Grade FE Yes Yes Yes Yes
Post = Year 2011 dummy; Treatment is Grade 3; Control is Grade 5Standard errors (in parentheses) clustered at school level*** p<0.01, ** p<0.05, * p<0.1
31
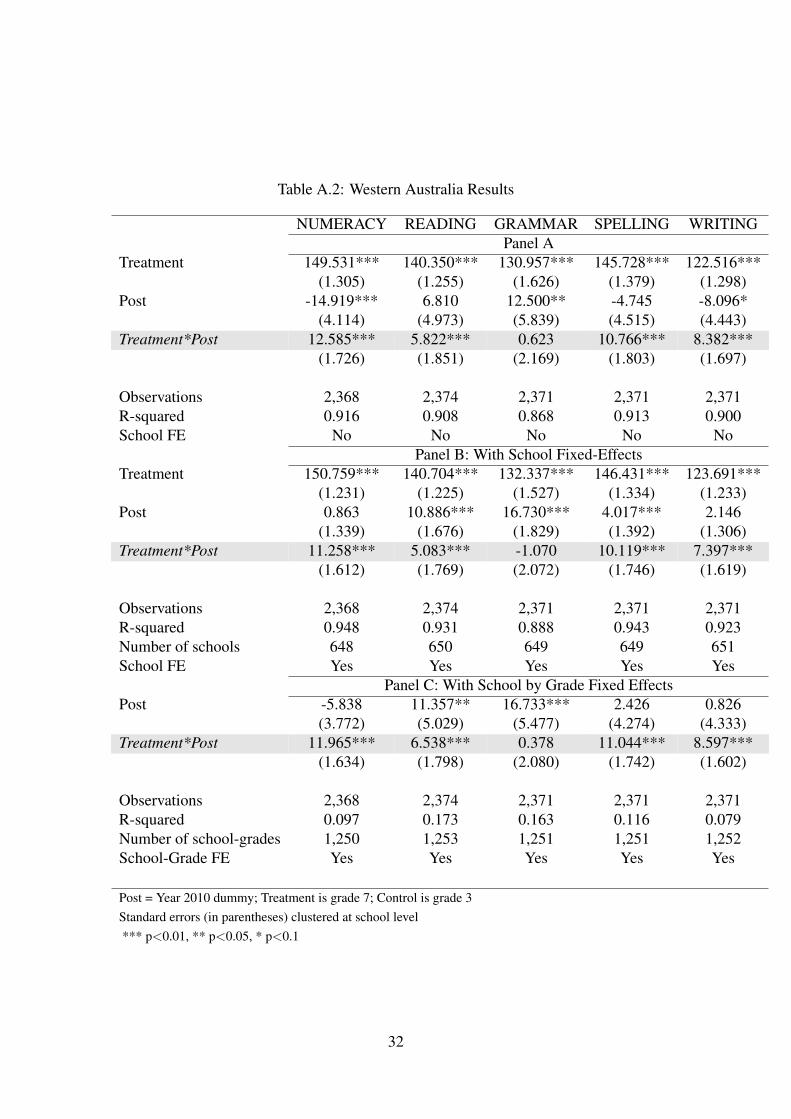
Table A.2: Western Australia Results
NUMERACY READING GRAMMAR SPELLING WRITINGPanel A
Treatment 149.531*** 140.350*** 130.957*** 145.728*** 122.516***(1.305) (1.255) (1.626) (1.379) (1.298)
Post -14.919*** 6.810 12.500** -4.745 -8.096*(4.114) (4.973) (5.839) (4.515) (4.443)
Treatment*Post 12.585*** 5.822*** 0.623 10.766*** 8.382***(1.726) (1.851) (2.169) (1.803) (1.697)
Observations 2,368 2,374 2,371 2,371 2,371R-squared 0.916 0.908 0.868 0.913 0.900School FE No No No No No
Panel B: With School Fixed-EffectsTreatment 150.759*** 140.704*** 132.337*** 146.431*** 123.691***
(1.231) (1.225) (1.527) (1.334) (1.233)Post 0.863 10.886*** 16.730*** 4.017*** 2.146
(1.339) (1.676) (1.829) (1.392) (1.306)Treatment*Post 11.258*** 5.083*** -1.070 10.119*** 7.397***
(1.612) (1.769) (2.072) (1.746) (1.619)
Observations 2,368 2,374 2,371 2,371 2,371R-squared 0.948 0.931 0.888 0.943 0.923Number of schools 648 650 649 649 651School FE Yes Yes Yes Yes Yes
Panel C: With School by Grade Fixed EffectsPost -5.838 11.357** 16.733*** 2.426 0.826
(3.772) (5.029) (5.477) (4.274) (4.333)Treatment*Post 11.965*** 6.538*** 0.378 11.044*** 8.597***
(1.634) (1.798) (2.080) (1.742) (1.602)
Observations 2,368 2,374 2,371 2,371 2,371R-squared 0.097 0.173 0.163 0.116 0.079Number of school-grades 1,250 1,253 1,251 1,251 1,252School-Grade FE Yes Yes Yes Yes Yes
Post = Year 2010 dummy; Treatment is grade 7; Control is grade 3Standard errors (in parentheses) clustered at school level*** p<0.01, ** p<0.05, * p<0.1
32

Table A.3: Queensland
NUMERACY READING GRAMMAR SPELLINGICSEA 0.264*** 0.311*** 0.304*** 0.207***
(0.010) (0.010) (0.012) (0.009)% Indigenous 0.174*** 0.214*** -0.161* -0.098
(0.063) (0.065) (0.092) (0.075)% Female 3.150 35.066*** 53.192*** 35.816***
(6.929) (6.730) (8.924) (7.019)Student-Teacher ratio 0.325 0.465* 0.584 0.315
(0.326) (0.281) (0.388) (0.238)Total Enrollment 0.004*** 0.008*** 0.007*** 0.011***
(0.001) (0.001) (0.002) (0.001)Primary -0.679 2.346 2.124 3.769
(2.686) (2.745) (3.344) (2.457)Post -5.590* -15.227*** -10.616*** -13.005***
(2.999) (3.427) (3.795) (2.848)Primary*Post -4.272 -4.301 -4.345 0.039
(2.658) (3.030) (3.335) (2.469)Public -9.266*** -15.639*** -12.847*** -10.967***
(1.900) (1.938) (2.282) (1.780)Independent 11.262*** 9.662*** 8.120** 5.175*
(2.956) (3.177) (3.584) (2.812)Public*Post 20.998*** 20.448*** 19.669*** 13.881***
(1.900) (2.098) (2.296) (1.778)Independent*Post -1.957 -1.965 -0.617 4.549
(3.178) (3.708) (4.060) (2.978)Treatment -88.163*** -94.672*** -106.285*** -95.405***
(0.911) (0.941) (1.068) (0.806)Treatment*Post 3.327*** 24.113*** 25.524*** 18.473***
(1.113) (1.227) (1.483) (1.083)Constant 195.615*** 139.421*** 147.980*** 234.146***
(9.882) (10.663) (12.439) (10.015)
Observations 4,434 4,434 4,434 4,434R-squared 0.822 0.810 0.798 0.824School FE No No No NoPost = Year 2011 dummy; Treatment = Grade 3; Control is Grade 5Standard errors (in parentheses) clustered at school level*** p<0.01, ** p<0.05, * p<0.1
33

Table A.4: Western Australia
NUMERACY READING GRAMMAR SPELLING WRITINGICSEA 0.304*** 0.297*** 0.331*** 0.233*** 0.227***
(0.013) (0.012) (0.013) (0.011) (0.010)% Indigenous 0.122 -0.099 -0.248*** -0.226*** -0.608***
(0.085) (0.087) (0.096) (0.075) (0.089)% Female -5.419 22.940*** 24.609*** 27.198*** 46.145***
(6.803) (6.726) (8.045) (7.093) (7.156)Student-Teacher ratio -0.053 0.334 0.358 0.814** 0.237
(0.354) (0.331) (0.347) (0.323) (0.267)Total Enrollment -0.001 -0.001 0.001 0.005** 0.004*
(0.003) (0.002) (0.003) (0.003) (0.002)Primary -1.983 -1.181 -0.279 -0.262 1.363
(3.224) (3.086) (3.827) (3.159) (3.146)Primary*Post 3.976 -1.260 -4.015 -0.838 -0.147
(3.590) (4.033) (4.472) (3.430) (3.744)Public -2.779 -8.072** -5.030 -5.751 -7.092
(3.581) (3.684) (5.444) (3.832) (4.411)Independent 4.694 5.973 4.620 -2.521 -6.032
(4.348) (4.512) (5.795) (4.463) (5.133)Public*Post 10.920*** 3.492 5.210 7.906** 9.367**
(3.687) (4.311) (5.338) (3.900) (3.873)Independent*Post 2.215 -9.524 -11.195* -4.894 -2.559
(5.191) (5.829) (6.536) (5.609) (5.005)Post -14.919*** 6.810 12.500** -4.745 -8.096*
(4.114) (4.973) (5.839) (4.515) (4.443)Treatment 149.531*** 140.350*** 130.957*** 145.728*** 122.516***
(1.305) (1.255) (1.626) (1.379) (1.298)Treatment*Post 12.585*** 5.822*** 0.623 10.766*** 8.382***
(1.726) (1.851) (2.169) (1.803) (1.697)Constant 88.078*** 82.919*** 40.195*** 125.880*** 154.306***
(14.620) (13.672) (14.490) (12.203) (11.878)
Observations 2,368 2,374 2,371 2,371 2,371R-squared 0.916 0.908 0.868 0.913 0.900School FE No No No No NoPost = Year 2010 dummy; Treatment = Grade 7; Control is Grade 3Standard errors (in parentheses) clustered at school level*** p<0.01, ** p<0.05, * p<0.1
34