Embed Size (px)
Citation preview

RECORD No. 1966/15
MENZIES AND LEONORAAIRBORNE MAGNETIC
AND RADIOMETRIC SURVEY,WA 1964
by
G.A. YOUNG and D.B. TIPPER
The information contained in this report has been obtained bythe Department of National Development as part of the policyof the Commonwealth Government to assist in the explorationand development of mineral resources. It may not be publishedin any form or used in a company prospectus or statement withoutthe permission in writing of the Director, Bureau of MineralResources, Geology and Geophysics.

CONTENTS
SUMMARY
1. INTRODUCTION
2. PREVIOUS GEOPHYSICAL INVESTIGATIONS
3. GEOLOGY
4. MAGNETIC RESULTS AND INTERPRETATION
5. RADIOMETRIC RESULTS AND INTERPRETATION
6. CONCLUSIONS AND RECOMMENDATIONS
7. REFERENCES
APPENDIX 1^Outboard radiometric anomalies
APPENDIX 2 - Operation details
--ILLUSTRATIONS
Figure 1. Total magnetic intensity profiles produced by induction Faoing
inclination - 65 °^(Drawing No. H51/B1-44)of thin infinite sheets in the Earth's field with
^149-
Figure 2. Types of radiometric anomalies^(R51/B1-42) -^13
Figure 3. Histograms of amplitude and frequency of 7=1 3)of radiometric anomalies^ 14
Relations between radiometric anomaly amplitude, frequency,Figure 4. and resolution^ (HSO11-43)^14
Plate 1. Locality map^ (Drawing No. H51/B1-21)
Plate 2. Geophysical interpretation and geology,Menzies
Plate 3. Geophysical interpretation and geology,Leonora
Plate 4. Total magnetic
Plate .5• Total magnetic
Plate 6. Total magneticMenzies
Plate 7. Total magnetic intensity profiles andLeonora
Plate 8. Radiometric profiles, Menzies
Plate 9. Radiometric profiles, LeonoraPlate 10. Radiometric results and geology, Menzies-
Plate 11. Radiometric results and geology, Leonora
Page
1
1
2
5.
9
10
10
13
16
(HSO1 - 38)
(H51/B1-37)intensity profiles, Menzies (H51/B1-26)intensity profiles, Leonora (H51/B1 -24)intensity profiles and magnetic trends,
(H51/B1-5) 5'?magnetic trends,
(H51/B1a2.1). S4
(H51/81-34)(H51/B1-33)(0/B4,;56)
.
(151/B1-35)
1966/15

SUMMARY
An airborne magnetic and radiometric survey of the Menzies andLeonora 1:250,000 map areas was flown by the Bureau of Mineral Resourcesin 1964.
tInterpretation of the magnetic data is primarily qualit:tive
and incorporates the resolution of magnetic trends and the subdi ision ofthe survey area into zones of specified magnetic character. The geologicalsignificance of these zones has been tentatively ascribed to certain rocktypes.
Allimited interpretation of regional geological structure has beenmade from gstudy of zonal configurations and the repetition of intrazonalmagnetic anomalies, supplemented by qualitative and quantitative dipanalyses.
Seven major east-west dykes have been defined, which generallyappear to have widths of 1000 feet, near-vertical dips, and depths ofburial within 100 feet of the surface. Two dykes have reversed magnetisation,the remainder appear nnally polarised.
The convergence of magneto and interpreted geological featuresat latitude 29 33'S, longitude 120 11'E, defines a locality that warrantsground investigation.
cont.e4r presentation of radiometric data reveals a generalcorrelati'on beti6en variations in gamma radiation and both the known geologyand that interpreted from magnetic data. Sixty four radiometric anomaliesof restricted source have been detected, of which forty sevan'are recommendedfor ground investigation.

1. INTRODUCTION
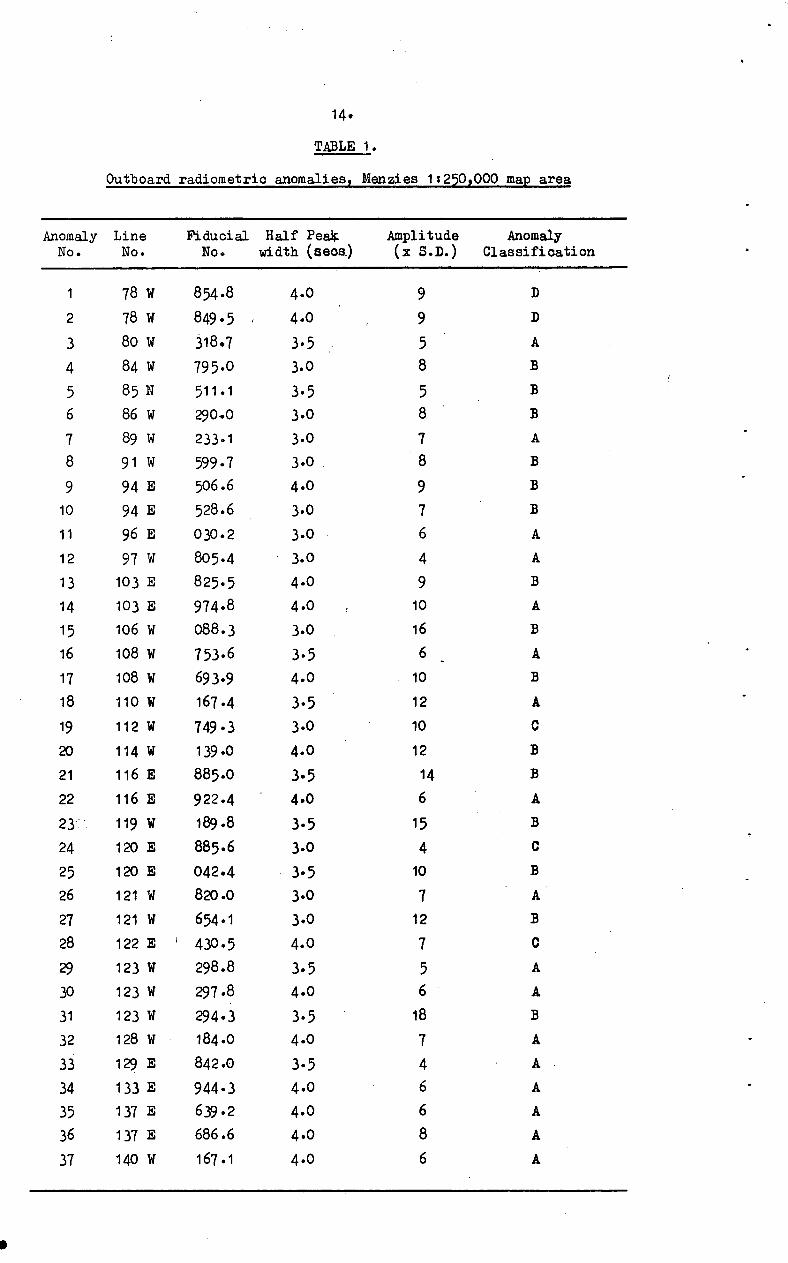
The Bureau of Mineral Resources (BMR) commenced airbornemagnetic and radiometric surveys in the goldfields region of Western Australiain 1956, and by 1960 hid completed the surveys of the 1:250,000 map areasof Southern Cross, Kalgoorlie, Barlee, Jackson, Kurnalpi, Widgiemooltha,.Boorabbin, Norseman, and Lake Johnston. During October. and November. 1964,, ;
this programme was continued with the surveying, by -the,BMR DC-3 aircraftVH-MIN, of the Menzies and Leonora 1:259000 map areas, which form anortherly extension of the previously surveyed region (Plate 1). Thisrecord deals with the interpretation of the magnetic and radiometric resultsof the 1964 survey.
The goldfields in the area included in Plato 1 are locatedin the Precambrian Shield area of Western Australia, which is a complex of .meta-igneous and meta-sedimentary rocks with a variety of intrusive andreplacement rocks.
Forman (1953) classifies the basic meta-igneous and meta-sedimentary rocks of this Precambrian Shield into three series :
1. The Older Greenstone Series2. The Whitestone Series3. The Younger Greenstone Series.
These series have a dominant structural trend in a north-north-west to 'north-west direction. A further subdivision has been made of the Older GreenstoneSeries into basic lavas and a suite of ultra-basic rocks (Low, 1960).Both the Older Greenstone Series and the Whitestone Series contain minordevelopments of banded iron formations or jaspilites.
Mineralization, of which gold has the greatest economicimportance, is predominantly confined to the greenstones, though bearingan association with intrusive granite. The concept of 'favourable beds'
'gold lines' is supported in most geological reports on the goldfields.
The objective of this survey was to provide data to assistin the future regional'mapping of the area rather than to-attempt..to detecteconomic -mineralisation directly':
2. PREVIOUS GEOPHYSICAL INVESTIGATIONS
There is no reference to any previous geophysical workin the Menzies or Leonora 1:250,000 map areas, but limited work is at presentbeing carried out by Western Mining Corporation Ltd.
The use of the airborne magnetic method in the goldfieldsarea was advocated by Miles (1953) with the object of delineating the ( 'banded iron formations, which might serve in establishing the control ongeological structures and ore genesis in areas of extensive alluvium cover.It was not suggested that direct detection of economic mineralisation wouldbe possible in this locality.
Airborne magnetic and radiometric surveys have been flownover the following 1:250,000 map areas: Kalgoorlie, Southern Cross, Barlee,and Jackson (Spencei1958), Kurnalpi and Widgiemooltha (Carter, 1959) Boorabbinand Norseman (Forsyth, 1961), and Lake Johnston (Wells, 1962). It has beenshown (Quilty, in preparation) that the banded iron (jaspilite) formationswithin the Archaean metamorphosed sediments and lavas are clearly delineatedin the contours of total magnetic intensity and serve as marker horizons intracing the major fold axes. The correlation of aeromagnetic data withgeological mapping in the Boorabbin 1:250,000 map area (BMR, 1963) showedthat the more intense anomalies are associated.with ultra-basic rocks andbasic lavas of the "greenstoneu phase and also with meta-dolomitic rocksof the Whitestone Phase. Quilty (in preparation) is uncertain whether all

2.
these iron-rich rocks are interbedded units of the metamorphic belts; heconsiders that their general conformity with the typical. pattern of jaspiliteoutcrops sugiests that they are.
'Suites of basic intrusives occupying fie .ures produced by
cross-folding of the metamorphic belts have also been ret Ognized by theirdistinctive magnetic properties.
A review of geophysical surveys in ghe MiOeeman area (Daly,1963) indicates that the reconnaissance airborne magneti method is notsuccessful in providing direct information on the occurrence of orebodies.In the Mararoa area, taken as typical for orebodies not closely associated,with banded iron formations, it. did not appear that this type of magneticsurvey could be relied upon to give definite information on the geologicalstructure in the greenstonell.
In the case of the Iron King orebody, which is associatedwith structure in the banded iron formation, ground magnetic surveysshowed a feature correlating With the structure; however, this feature isnot visible on the aeromagnetio contour map produced from the results offlight lines spaced at 1-mile intervals across the magnetic strike.
1Interpretation of the airborne radiometric data has indicated
the presence of numerous anomalies that markedly exceed the average intensityof gamma radiation. Many of these anomalies are attributed to outcrops ofgranite. However, in the Southern Cross-Kalgoorlie region (Mulder, 1960),84 anomalies were recommended for ground investigation following a low-levelairborne radiometric survey.
3. GEOLOGY
The geology of the region about and to the south of :thesurvey area is of ancient, strongly folded, and highly metamorphosed igneousand sedimentary rocks that have been subjected to granitic intrusion,granitisation, and invasion by dyke suites *ical.of a Precambrian shieldarea.
The metamorphic rocks are generally exposed in belts thatshow a . regional north-north-west trend. Major folding of the meta-igneousand meta-sedimentary rocks, generally parallels this axis, the subsidiaryfolds being tightly packed and often isoclinal with some overturning.
A system of subordinate folding, whose axial trend iseast-north-east to north-east, is superimposed on the major regional foldingand has had a significant role in localising mineralisation (Ellis, 1939& MdMath, 1953).
In the Yilgarn Goldfield a suite of late basic intrusiverocks shows an east-north-east trend and bears .a 'close relationship tothe axis of cross-folding in the metamorphic . belts -(Qmilty, in preparation).
The geological mapping of the Menzies and Leonora 1:250,000map areas involves little more than a distinction of regions as eithergranitic or greenstone types.
Menzies 1:250,000 map:area
The geology shown in Plate 2 is based on data compiled byTalbot (1912) and on the Teolionic Map of Australia-(BMR, 1960). 1,44egeological information other than, major rock type divisions is available.Detailed or 801i-detailed mapping is confined to small areas about miningtownships such as Menzies (Woodward,-1906), Mulline, Riverina, and Ularring

3.
(Feldtmann, 1915), Kookynie, Niagara, and Tampa (Jutson, 1921a). CometVale (Jutson, 1921b), and Mount Ida (Gibson, 1907 & Tomich, 1955), andis discussed briefly below. .
In the western part of the Menzies area, Talbot (1912)makes the broad division of rock types into granitic and greenstone areas,often on a basis of vegetation or soil tYpe because of the limited exposuresof rock in situ.
The greenstones mainly occur in long comparatively narrowbelts which trend north-north-west. According to Talbot (1912) thesegreenstones consist principally of epidiorites with some amphibolites, thelatter due to. metamorphosed dykes of no great extent.
High serrated ridges formed by ferruginous quartz schistsare found in all the greenstone areas; in some localities the bands occuracross the full width of the greenstone belts, in others only at one edge.Talbot is not sure Whether these ferruginous quartz schists represent shearzones or Whether they may be highly metamorphosed sediments. They areusually inclined at a very high angle and folding is very marked in theBrooking Hills.
Numerous acidic dykes, which probably emanated from themain mass of intrusive granite, have been noted by Talbot in severallocalities in the different greenstone areas.
'The geology of the mining centres is summarised as follows:.
Menzies. Rock types distinguished are recent alluvium and laterites,crystalline and altered rocks, which are subdivided into basic and acididgroups, and igneous rocks that occur as dykes.
Mullins, Riverina, and Ularring. Rocks of the district areclassified as amphibolites (including epidiorites and hornblende schists),granite, acidic dykes, basic dykes, and recent superficial deposits.
Kookinie, Niagara, and Tampa. The rocks of the area are almostwholly, if not entirely, of igneous origin. They form a comprehensivegroup, varying in composition from moderately basic rocks to highly .acidicones, ultra-basic rocks being almost entirely absent. Therrodks have beengenerally classified as basic and intermediate rocks of igneous origin,acidic rocks of igneous origin, schistose rocks of uncertain origin, andrecent superficial deposits.
The geological trend of the area is generally east-north-east,faulting not being discovered to any extent.
Comet Vale. The rocksof the district are divided into three maingroups: basic and ultra-basic rocks, the acidic rocks, and the recentsuperficial deposits.
As in other mining areas auriferous mineralisation is mainly!confined to quartz reefs and lode formations that are frequently containedin the fine-grained epidiorites and amphibolites of the basic and ultra-basicrock group.
Mount Ida. In general the district is one of greenstones (clasticand igneous), tiasic intrusives, porphyriee .,,jaspilites, and erosion Sedimentsintruded by three more-or-less separate masses of granite. The interbeddedrock formations are steeply inclined and strongly folded and exhibit a highdegree of metamorphism, although the metamorphic grade varies.
The oldest rocks are a series of meta-sedimentary andbasic flows or tuffs of high metamorphic- grade. Interipedded in this seriesis.a band of coarse-grained hornblende-feldspar rock, which is considered

4.
to be a sill (Tomich, 1955). All known auriferous mineralisation occurs inthis greenstone series, which is also intruded by a suite of basic dykeswith north-east to north-north-east trend.
Another series of interbedded igneous greenstones and sedimentsoccurs with strong folding along a north-west to north-north-west axis.
Jaspilites are associated with both series of metamorphicrocks, but they are more ferruginous and less massive in the latter series.
Of the granitic masses, the central and eastern granitesare concordant, foliated, or gneissic types in which the foliation is parallelto that of the enclosing greenstones, whereas the western granite appearsto be discordant.
A number of olivine dolerite dykes with uniform east-weststrike transgress all rock formations including the granite.
Structurally the central granite mass occupies the core ofa south-pitching anticline. No large faults have been recognized in thearea; orebodies have, however, been influenced in deposition by a shearpattern.
Leonora 1:250,000 map area
The geology shown in Plate 3 is based on data compiled byTalbot (1912) and Clarke (1925), little geological information other thanthe broad rock type divisions being known. Detailed mapping is again confinedto small areas about mining townships such as Lawlers (Gibson, 1907) andLeonora (Noldart & Bock, 1960).
The geology of the western part of the Leonora area issimilar to that of the region immediately to th, south, which has been dealtwith already (western part of the Menzies area)i.
The eastern part of the area consists mainly of a greenstonebelt, which trends north-north-west and passes through Lawlers and Leonoraand thence continues into the Edjudina 1:250,000 map area. The greenstonebelt includes a wide assortment of rocks of which the most important arethe various epidiorites, amphibolites, chlorite-carbonate rocks, etc., towhich the terms "greenstone" or "diorite" are generally applied. The presentcharacter dthese rocks results from great local and regional metamorphism.A minor but by no means insignificant feature of the greenstones is thedevelopment of moreAikdi'dic rocks both intrusive and effusive varying fromandesites and porphyrites to rhyolites and quartz porphyries. What areapparently metamorphosed sediments are also included in this group.(Clarke, 1925, p. 22-23).
A series of acidic rocks have intruded the greenstone areasto form the granitic areas enclosing the greenstone belts.
Dykes ranging from oamptonites to basaltic dolerites havebeen found to intrude both granite and greenstone.
Rather siliceous ferruginous quartzites are exposed in thegreenstone belt between Gwalia and Mount Newman. Shear planes and quartzveins striking more or less at right angles to the main north-north-westshearlines and veins were noted by Clarke (1925) in the Leonora-Duketownarea in addition to some ferruginous quartzites, which have an east-westcourse.
No continuation , of the north branch of the Mount Celia-Yundamindera fault (Honman, 1917); Edjudina 1:250,000 map area) is, knownin'Ahis area.

5-
The geology of the mining centres is summarised as follows:.
Lawlers. The rooks have been divided into two main classes, thegranites and the greenstones.
Acidic dykes are found most largely developed close to thejunction of the granite and greenstones and vary, from-coarse-grained granitethrough aplites and quartz-porphyries to fine-grained compact felsites androcks having the appearance of quartzites.
Basic dykes (dolerite) intrude the granite but cannot bedistinguished in the greenstones.
Leonora. Rock types in an area of 400 square miles centred onLeonora are classified into Quaternary alluvium, surface cements, and laterites;?Tertiary iron cappings; and Precambrian intrusives and meta-sedimentaryand igneous rocks of the Margaret "System". The Precambrian intrusives includegranitic rocks and quartz reefs. The Margaret "System" includes jaspilites,quartz-kyanite schists, sericitic schists, basic lavas, and epidiorites.Noldart and Bock (1960, p. 81) made the following comments regarding thestructural and economic geology of this district:
"Major faulting was not observed^ although small scalefaulting is present^ The area forms protion of the western flank ofa large synclinorium extending in a general north-north-west direction fromKookynie (Menzies 1:250,000 ) area) through Leonora to beyond Mt. Clifford^Variations in the trends of...the jaspilitic horizons suggest strong west-north-westerly trending anticlinal cross-folding through the point of maximumflexure of the main range. A similar, and probably stronger crossfold, ispostulated following approximately along the drainage channel occupied byLake Raeside^
Easterly of the main range is.a system of sub-parallelanticlines and synclines trending in the same general direction as the range ^Repetition of the jaspilite beds by isoclinal foldinehas probably taken place
^
. but no evidence is available^
4. MAGNETIC RESULTS AND INTERPRETATION
Magnetic profiles reduced to an east-west scale of1:250,000 are shown for all flight lines in the Menzies and Leonora areasin Plates 4and 5, respectively. A north-south scale of 1:62,500 has beenused to improve data presentation. The magnetic profiles are accuratelypositioned near longitudes 120 °22'
0E and 121 OTP0E. The maximum probable
,error, at longitudes 120 OE, 120 45 E, ^121 30 1 E i
^
W^ s - mile east-west.
Every fourth magnetic profile, together with magnetic trends,are shown for the Menzies and Leonora 1:250,000 map areas in Plates 6 and 7respectively. In order to illustrate the magnetic trends that strike east-west,Plates 7 and 8 . also show the magnetic profiles obtained from the tie-linesystems.
Owing to the sparsity of geological information availablein the Leonora and Menzies 1$250,000 map areas, a basically qualitativeinterpretation of the magnetic data has been applied. Magnetic trends havebeen resolved and the survey area' has been zoned by consideration of magneticcharacter (Plates 2 and 3). Well defined anomalies have been analysedquantitatively assuming the magnetisation is wholly induced, and a qualitativeassessment of structural dip has been made. Listed below are the zones witha brief description and their magnetic character.

6.
.Zone^ Magnetic character
1^Random magnetic disturbance mainly less than 50 gammas2^Random magnetic disturbance mainly in range 50-150 gammas3^Random magnetic distObance mainly in range 150-250 gammas4^Random magnetic disturbance mainly eater than 250 gammas5^Magnetic lineations with amplitudes Mainly less than 150 gammas6^Magnetic lineations with amplitudes mainly in range 150150 gammas7^Magnetic lineations with amplitudes mainly in range 250- CO gammas8^Magnetic lineations with amplitudes mainly greater than 500 gammas
Geological significance of zones
Zones 1 and 2;, are interpreted as either relatively homogeneousacidic igneous rocks or non-maOnetic sedimentary sequences. This interpretationis based upon the magnetic profiles being generally smooth, the lack ofcontinuity of magnetic feature between adjacent flight lines, and the generally.lower magnetic intensity as compared with neighbouring zones.
Zone 1 regions are irregularly shaped; nevertheless, eitherindividually or in groups they show some evidence of elongation trending^•north-north-west to north-west. If these regions are the magnetic expressionof igneous rocks, this elongation may be interpreted as evidence for foldaxes trending north-north-west.
Zone 2 regions cover much of the area and are extremelyirregular in shape. It is probable that a number of rock types are represented,possibly including slightly more basic variations of the rocks of Zone 1.
Zone 3 regions are restricted to the western parts of theLeonora and Menzies 1:250,000 map areas. This zone is interpreted as the
13
magnetic . ression of heterogeneous igneous bodies that are of greaterbasicity t an rocks included in Zones 1 and 2..
Zone 4 . includes magnetid - ahothiiies characterised by-highamplitudes and random shape. Such anomalies are typical of major basicintrusions.
Zones 5 and 6 are transitional between Zones 1 and .2 andZones 7 and 8. The linearity and moderaWy.low amplitudes of the anomaliesevident in Zones 5 and 6 suggest stratigraphic sequences possibly comprisinglavas and sediments. Regions of both zones show a somewhat elongatedcharacter. The division between Zones 5 and 6 is based on average anomalyamplitudes. It is not implied that the two zones necessarily represent twodistinct geological provinces, but l'ather a gradation in basicity.
Zone 7 has a high degree of linearity and elongation ofregions. This is interpreted as being due to a series of basic lavas andsediments.
Zone 8 is characterised by very high amplitudes and verypronounced linearity. The anomalies may be conveniently grouped into twodistinct categories, those of the order of 1000 gammas and those many Wildsgreater. Estimates ofgusceptibilitijes range from 2 x 10⁻³ to 3 x 10- ' CGS'units and from 25 x 10 -' to 40 x 10 -' CGS unitp, for the two groups respectively.The former anomalies are interpreted as being due to serpentinite bodies andthe latter due to banded iron formations. Quilty (in preparation) recordssusceptibility values as high as 200 x 10-3 CGS units, Which is comparableto the value obtained for the magnetic anomaly evident in the extreme southwest of the Menzies area.

7
Analysis of magnetic trend lines oriented approximately north-south
The resolution of trend lines bears in general a directrelation to anomaly amplitude. ThOsolated trend lines ithin Zones 1, and2 are relatively short and are possibly caused by either dykes or granitisationof pre-existing magnetic bodies. Trend lines become pronounced in Zones 5and 6. The continuous strong lineations are almost wholly confined to theintense anomalies of Zones 7 and 8 in the Menzies area and the moderatelyintense anomalies of Zone 6 .in the Leonora area.
Within Zone 2 and the transitional Zones 5 and 6 it is notuncommon for a trend line to pass from one zone to another. This illustratesthe lack .of well defined interzonal contacts and the limited difference ofgeological significance between these zones. Conversely, trends withinZones 7 and 8 remain, with very few exceptions, confined to their respectivezones, suggesting distinct lithologies.
Menzies 1:250,000 map area. The greatest concentrations oftrend lines occur in the western half of the area and are directed north-nOrth-west to nortliwest. This general direction, paralleled by mostother trends, is in4icative of the regional strike for the entire area.Whilst individual trend lines follow the general pattern, there are localvariations, most, but not all of which are located near the western boundaryof the area, where positional accuracy is at a minimum.
Leonora 1:250,000 map area. Trend lines are mostly concentratedin the northern and eastern parts of the area, with a dominant trenddirection north-north-west indicative of the regional strike. An exceptionto this is the group of trend lines directed north-north-east in the north-west of 'the area. This major local variation possibly results from outcropscontrolled by the intersection of major fold axes. Immediately to thesouth, the east-west trend lines probably result from dykes.
Sharp flexures in trend linesare again probably relatedto positional inaccuracies of the magnetic data.
Analysis of magnetic trend lines oriented approximately east-west
The tie-line profiles shown in Plates 6 and 7 reveal thepresence of seven major dykes of similar character to those reported byQuilty (in preparation). Quantitative analysis of three major; dykes inthe Menzies area show them to be identical in form, having widths ofapproximately 1000 feet and depths of burial 50 to 100Jeet below groundlevel. The pronounced magnetic 'lows' associated withDykes A and B (Plate2) have been interpreted as the effect of reganent magnetisation inclinedto the south and downwards at an angle of 60 to the horizontal, whereasthe anomaly associated.with Dyke C has been produced primarily by inducedmagnetisation. From tgis interpretation, the three dykes are calculatedto dip southerly at 80 . Calculated values of apparent intensities ofmagnetisation for the dykes are as follows -
Dyke A^0.017 x 10⁻³CGS unitsDyke B^0.004 x 10⁻³CGS unitsDyke C^0.012 x 10⁻³CGS units
Inspection of the magnetic anomalies associated with theremaining four .dykes indicates that these dykes are in general similar toDyke C.

8.
Analysis of dips
There is no direct evidence that remanent magnetisationis associated with meridional-trending magnetic anomalies; accordingly,interpretation is based on the assumption that sources are magnetised byinduction only. Most of these anomalies are characterised by pronouncednorth-south elongation and a high degree of east-west symmetry. Themagnetic anomalies are therefore interpreted as being produced by two-dimensional thin sheet structures with high dip angle. Calculations of dipusing Moo's method (Moo, 1965) show that with few exceptions tyeicalanomalies yield angles ranging from .70 W through vertical to 70 E. Thisresult is comparable with that obtained by Quilty (in preparation).Figure 1 illustrates the form of magnetic anomalies oproduced by inductlonof these infinite sheets, which strike north or N22 W and have dips 70 E,90 , or 70 W. These anomaly forms are based on standard curves producedby Parker Gay (1963). They are similar to many of the anomalies shown inPlates 4 and 5.
The absence of magnetic 'lows' flanking positive anomaliesis indicative of sources with large vertical extent.
A comprehensive calculation of dip angles has not beenmade owing to the uncertainty that exists regarding the basic assumptionthat remanent magnetisation is negligible. When regional geological mappingis carried out, re-interpretation of aeromagnetic data would be invaluableas the presence of remanent magnetisation could be ascertained by referenceto the geological data.
Regional geological structure
A few major structural features have been interpreted fromthe magnetic data by a combined study of zonal configuration, magneticanomaly repetition, and major displacements of magnetic trend lines. Thisis a development of the approach advocated by Ellis (1939) and adopted byQuilty (in preparation), which involved the study dmagnetic patterns producedby arcuate remnants of banded iron formations. Interpreted fold axes areshown in Plates 2 and 3 together with the locations of major dykes.
Menzies 1:250,000 map area. The limited geological control atpresent available in the northern part of the Kalgoorlie 1:250,000 maparea indicates that major anticlinal axes are commonly defined by outcroppinggranite, and minor synclinal axes by basic rocks of the Greenstone Series(Kteiwaldt, pers. comm.).
The major fold axis striking north-north-west and lying inthe central part of the Menzies 1:250,000 map area is interpreted as anticlinal.Evidence for this is the large region of Zone 1 flanked on both sides byareas of Zone 6 through Zone 7 to Zone 8. The convergence of magnetic trendlines near Lake Ballard indicates a northerly pitch to this anticline.Two possible major anticlines parallel to this central anticline are alsoshown in Plate 2.
A number of probable and possibly associated minor synclines,which are probably isoclinal in form, have been interpreted throughoutthe area. In the centre of the area, synclinal axes lie on either side ofthe anticlinal axis (striking north-north-west) and converge near Lake Ballard.This suggests a possible cross-fold axis, which is interpreted as beingsynclinal and coincident with the major Dyke B. In the north-east quadrantof the area, a coupling of the postulated cross-fold axis with the threeSynclinal axes might explain the symmetry in the zonal configurations.
Leonora 1:250,000 map area. The south-western part of this areashows a continuation of the relatively simple zonal configuration apparentin the Menzies area. The high degree of zonal complexity in the remainderof the area will, however, require extensive geological control to revealits significance.

To face page 8
FIG
-7 -6 -5 -4 -3'---"
Strike North
Dip 70°
5 ;; ~
-7 - 6 -5 -4 -3 -2
6 7
Slrike Norlh 22°We3tDip 70°
Strike North
Dip 90°
-7 -6 -5 -4 -3_,...i.-~
-2 -I 0
\- '"f --r----r-r- - --".---'
2 :3 4 5 G 7
Strike North 22° Wes'
Dip 90°
Slrike North 22° WeltDip 700
o
~-3 -2
Strike NorthDip 70°
~,'-----r---TI1-,---~,----=--34 ==----56 7-5 -4 -3 -2 -I 0 2
'~1-7 -6
Horizonlol dillonce Is expressed in unils of depth Z
TOTAL INTENSITY MAGNETIC PROFILES PRODUCED.BY INDUCTION OF THIN INFINITE SHEETS IN THEEARTH'S FIELD WITH INCLINATION - 65°.
To Accompany Record N° 1966/15 Geophysical Branch. 8urQcu of MinDrnJ D _ ,. - _.-
H51/BI-44

9 .
A few short fold axes have been resolved as shown inPlate 3. The possibility of additional folding is recognized from the magneticdata; however, the limited degree of certainty does not warrant the displayof these axes.
There is no magnetic or geological evidence to suggest thecause for the trend line convergence in the north of the area, although it-almost certainly results from intersection of-major fold axes.
The two major dykes do not appear to have had any recognizablecontrol on the geological structure.
5. RADIOMETRIC RESULTS AND INTERPRETATION
Radiometric data were recorded on two'scintillometers.The inboard scintillometer recorded the general level of radioactivity'over the area to aid geological mapping. The purpose of the outboardscintillometer was to detect localised sources of radioactivity.
Inboard scintillometer
Profiles of radioactive intensity recorded by the inboardscintillometer have been reduced to an east-west scale of 1:250,000 andare shown for the Leonora and Menzies areas in Plates 8 and '9. A north-south scale of 1162,500 has been used to improve data presentation. Errors .
in the position of the profile data are the same as those already statedfor the presentation of magnetic data. Contour presentations of thisradiometric data for the Leonora and Menzies areas 'Ire shown in Plates 10and 11 together with the known geology. Some smoothing of the contours •has been carried out in an attempt to minimise contour ,distortions producedby a combination of errors, which. include the variation in aircraft-to-terrainclearance, parallax error due to delay in 'instrument response resultingfrom the ten-second - time constant, curvilinear record, temperature-affectedinstrumental drift, and variation in instrument sensitivity.
Plates 10 and 11 show that generally low gamma radiationis associated with areas mapped as greenstones. Areas of signiticantanomalous amplitude have a well defined association either with the mappedrock outcrops, which commonly occur in Zones 1, 2, and 3 and are interpretedas granitic rocks,or with salt lake deposits. The anomalous areas associatedwith salt lake deposits are more interesting, although the source of thegamma radiation might be explained by the isotope K40. A signigicant,correlation was observed between anomalous gamma radiation and the colourof the small salt lakes and clay pans to the immediate north of 19 MileRocks (Plate 10). Anomalous gamma radiation was seen to be greatest overthe evaporites coloured brown, and least over those coloured white.Detailed photographic coverage has been made for some of these anomaliesto assist ground surveying.
Outboard scintillometer
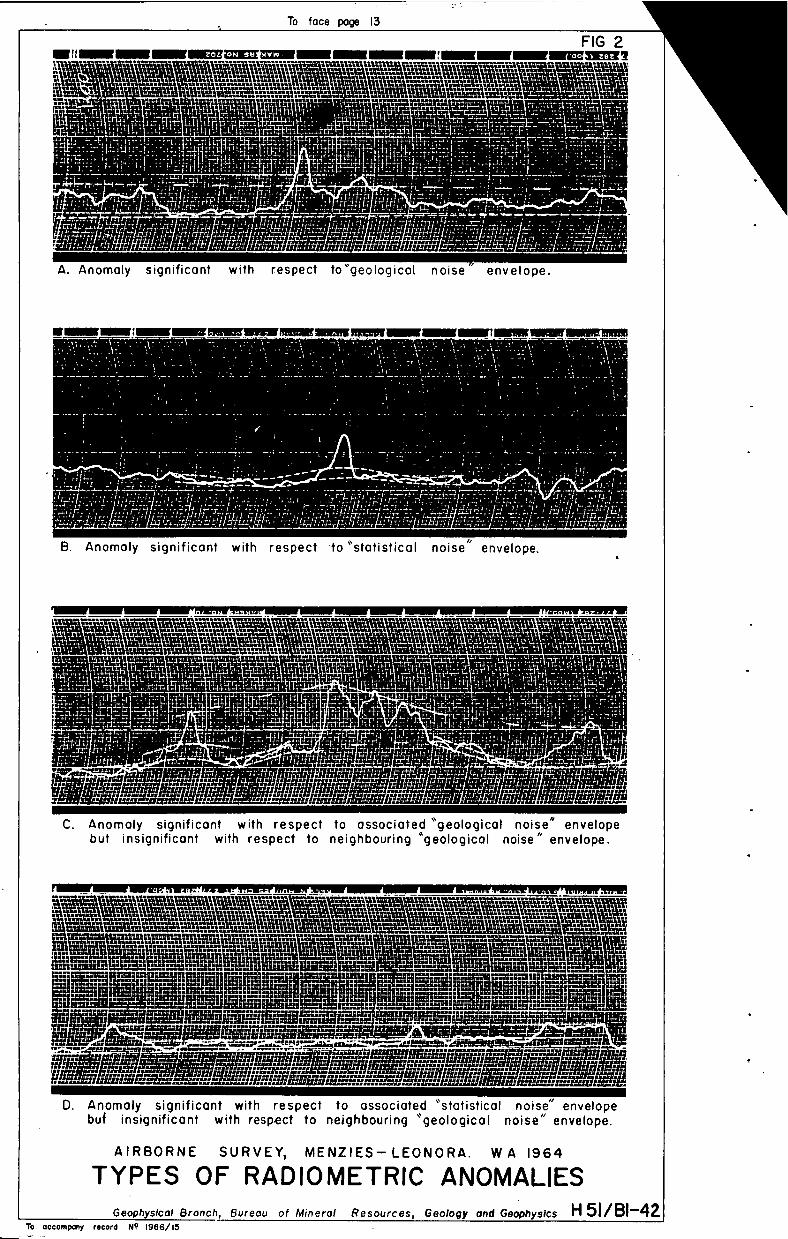
Anomalies from restricted sources detected by the outboardscintillometer in the Leonora and °Menzies areas are listed in Tables 1 and2 (Appendix 1) and are shown in Plates 10 and 11 respectively. Thecriteria used in selecting these anomalies are discussed in Appendix 1.The anomalies are classified in four categories, A, B, C, and D, which areillustrated in Figure 2 (facing page 13).
It is not possible to determine the significarOze\of theseanomalies in either the Leonora or Manzies:1:250,000 map areas owing to the

10.
lack of detailed geological information. To make such a determination itwould be necessary to carry out a geological inspection and a groundradiometric survey; however, only anomalies of categoriSs A and B warrantinvestigation, as categories C and D may prove very difficult to detect byground work and their significance is marginal.
6. CONCLUSIONS AND REGOMMENLATIONS
The magnetic trend assessment and zOnal interpretation ofthe survey area should be of considerable value to regional geologicalmapping. ,However, the significance of each zone can only be ascertainedduring the course of such mapping.
0 Dip angles calculated from meridional magnetic anomaliesrange from 70 to 90 and are similar to those interpreted from previousairborne surveys in this region. Remanent magnetisation has again beenfound to be associated withsome, but not all, of the east-west dykes.
It is advocated that re-interpretation of the magnetic. data,in particular dip analysis, be made in conjunction with future regionalgeological mapping This would tesythe -Validity, and possibly ledd - tothe expansion, of the limited interPretatibd_df -geological structure.
The convergence of magnetic and interpreted geologiCal featuresat latitude 29 ° 33'S, longitude 120 ° 11'E, warrants detailed ground investigationto determine whether mineralisation exists.
Data obtained from the inboard scintillometer have beensuccessfully contoured using a contour interval of 50 counts per second.There is a general correlation between the_contours and both the knowngeology and that interpreted from the magnetic data. The anomalous areascommonly associated with salt lake evaporites require ground investigationto ascertain the origin of the radioactivity.
The outboard scintillometer detected 64 restricted sourceanomalies, of which 47 warrant investigation to determine any possibleeconomic significance.
7. REFERENCES
EMR^ 1960 Tectonic Map of Australia.
CARTER, R.M.^1959 A preliminary report of an - airbornemagnetic and radiometric survey of theKurnalpi-1406.0mooltha areas, 7:WA.. 1958.Bur. Min. Resour. Aust. Rec. 1959/1.37 (unpubl.)
CLARKE, E. de C.^1925 The field geology and broader miningfeatures of the Leonora-Duketown District.Bull. Geol.E4rv. W. Aust. 84.
DALY, J.^1963 Norseman geophysical surveys, WA 1946 and1953.Bur. Min. Resour. Aust. Rec. 1963/62. .
ELLIS, H.A.^1939 The geology of the Yilgarn Goldfield, Southof the -Gleat Ziétern Railway,Bull. Geol. Surv. W. Aust. 97..

11.
FELLTMANN, P.R.
FORMAN ) F.G.
FORSYTH W. A. L
GIBSON, C.G.
HONMAN, G.B.
JUTSON, J.T.
LOW, C.H■
1915 Geological observations in the Mulline,Riverina, and Ulatring centres, NorthCoolgardie\ Goldfield.Bull. Geol. Surv. W. Aust...64,
1953 The geological structure of the shieldin southern Western Australia in relationto mineralization. In GEOLOGY OF AUSTRALIANORE DEPOSITS.Aust. Inst. Min. Metall.
1961 Boorabbin and Norseman airborne magneticand radiometric surveys, WA 1959.Bur. Min. Resour. Aust. Rec. 1961/55.
1907 The geology and mineral resources of Lawlers,Sir Samuel l and.Darlot (East Murchison Gold-field), Mount Ida (North Coolgardie Goldfield),and a portiOnof the Mt. Margaret Goldfield.Bull. Geol. Surv. W. Aust. 28.
1917 The geology of the North Coolgardie Goldfield.The Yerilla District.Bull. Geol. Surv. W. Aust. 73.
1921a The mining geology of Kookynie, Niagara,and Tampa, North Coolgardie Goldfield.Bull. Geol. Surv. W. Aust. 78.
1921b The mining geology of Comet Vale and Goongarrie,North Coolgardie Goldfield.Bull. Geol. Surv. W. Aust. 79.
1960 Progress report on the survey of the Widgiemooltharea, Coolgardie Goldfield.Ann. Rep. Dep. Min. W. Aust. 1959.
McMATH, J.C. 1953 The geology of the countryCoolgardire . Goldfield, W.A.geology. .Bull. Geol. .Surv. W. Aust.
about Coolgardie,Part I - Regional
107.
MILES, K.R.^1953 Banded iron formations in Western Australia.In GEOLOGY OF AUSTRALIAN ORE DEPOSITS.Aust. Inst. Min.,Metall.
MOO, J.K.C.^1965 Analytical aeromagnetic interpretation. The
Geophys. Prosp. 13(2), 203-224.
MULDER, J.M.^1960 Southern Cross and Kalgoorlie regions airborneradiometric survey, WA 1958.Bur. Min. Resour. Aust. Rec. 1960/120 (unpubl.).
NOLDART, A.J., BOCK, W.14.1960 Notes on the geology of portion of the Mt.Malcolm District, Mt. Margaret Goldfield.Ann. Rep. Dep. Min. W. Aust. 1959.
1963 Standard curves for interpretation of magneticanomalies over long tabular bodies.Geophysics, 28(2), 161-200.
QUILTY, J.^ Interpretation of aeromagnetic data, Goldfieldregion, Western Australia.Bur. Min. Resour. Aust. Rec. (in preparation).
PARKER, GAY. / S •

12.
BMR
SPENCE, A.G.
TALBOT, H.W.B.
TOMICH, S.A.
WELLS, R.
WOODWARD, H.P.
1963 Boorabbin, WA, 1:250,000 geological series,Sheet SH/51-13.Bur. Min. Resour. Aust. &plan. Notes.
1958 Preliminary report on airborne magnetic andradiometric surveys in Kalgoorlie-SouthernCross region/ Western Australia (1956-1957).Bur. Min. Resour. Aust. Rec. 1958/45 (tanpubl.).
1912 Geological investigations in the North Coolgardieand East Murchison Goldfields.Bull. Geol. Surv. W. Aust. 45.
1955 Summary report on the geology of portion ofthe Mt. Ida district, North CoolgardieGold field.Ann. Rep. Dep. Min. W. Aust. 1953.
1962 Lake Johnston area airborne magnetic andradiometric survey, WA 1960.Bur. Min. Resour. Aust. Rec. 1962/100.
1906 The auriferous deposits and mines of Menzies,North Coolgardie Goldfield.Bull. Geol. Surv. W. Aust. 22
D. Anomaly significant with respect to associated statistical noise" envelopebuf insignificant with respect to neighbouring geological noise" envelope.
AIRBORNE SURVEY, MENZIES- LEONORA. WA 1964
TYPES OF RADIOMETRIC ANOMALIESGeophysical Branch, Bureau of Mineral Resources, Geology and Geophysics H 51/BI-42
FIG 2
^
im t I 1•111111111MINII MIIIIIIIIE:12 ZIMEZIZCAll MI=1•111.11117v1.111111114trillIMM.u...:■•=,,....1.411111INFIr^M1:1721211,^2
^
+,-,1,\L ,^.,x_4 -,'• '^atirlriztratil^, ity....---,413 !4.. ,_,:: ,,.\_
^
`-.1■\\l^,cf-,^ • t.,......t.ii,•• •••, .t utraltin . ,^nuu..urn. ,_•-• r^'1 u . u^-^IIT'v-,. -'-,- 4, 1^■ 1.-.........1:-.J., ...._,_„2 ..„., ,^r ,...41,,,, , -,.•^.^ r1^.••••^I 1-• • t •-rrn •-, 1 i_^It.--^• i^it ! -. ' • ' C't I^1,4•,-h"•44 '.7:..1"..1^t-?4.T. L'Itti3--14_ ,.L. ..:.i A"-Lp, t:., _ ;•. .-_,...ti:.,:t.- _-..C-7L •-:.X.L.li. -...-i ...._:. ,
I -7`..-rh.■ Flt. \ / i' t.' n '" t_1 : 4 \ .2 ,-;..t: ' ,:4 ''t T ' -1--,- t-- t' ,4 , ,.ILT. 4. 1--, -T--.1.-i :'-', .._ -..-,1 ':1-• - ::11:7-.,,* ' - :-',20 I ' I- -1,t'Ti_n_i_i4t4 .V-: I F:in11- 1.01 1.il " -Ili .-- 5V_TT ,.iVxT ‘-- ,'''-4- tz_FL-.4 t1T-_ - ..,___.1-. ,..--t , .. t T-----,t. 1 ._^ i
^
,^ 41,-^ .-or ^"^T I '-,,-:::),-.1 .4^+-t-. - -- --4-4..-- -t-^- ___:_ -4.^.477. 4 4'4:4 '4'4 - ■ , 4.474,4,44.76114 4 iIV." t .: 414 t 4 '1. 1- 4 I tlItt f 1:-4 4-T ti4-4. 14 1.14' t- 4t- i,,,_' ti LI-9 i ;-4:, t..^.t7 F^ :.1:...)4. 'T . , I . -:-:-- -' ----7:,^'.....^. ..,^1. .t.•^.L.^1, 1 )-t, ;t1i^, - , L ,4.24, 4^- .--4 .^;7 1^I . rt,.-^4^,,,...^_^.........,^-1......^.-..--, -^ T,r,tir-wi . -1n . 4r--4 ,, , -,^-,4 , .....m,4_, L ., 4F4.1 .. , ..i...,^,^ ,, ^i^, ^..._.....
-; 1 -- -- . 1- . 4,' 1- ,^- --dir ,, r: -..4-A., , , •41., , ,v,Ii-,-,-t.- _..:LiHt-ar- .rhi:; , 11 :- .1=---i-"' - I- r`t:^- It •a::;T:___,. i...t..... ^: 1.;_,af!, , • -;. .; i . ",-1-1-, _1. r 74_7-- "7- ±,-.77 -- .."•-•;.-- - , ' '•-.1---,••-:--i^ 2- - - -7-----."-.--.14 - - -
- I i^''''-'^! ; , • 1174." ; • I' •••••••••• • t • 1 11.1•" ! -r ' ^-...........^.;-.......^i 9-.-. ^........-^. '^i ; , ,.., I . 1^_^; L.^,■:-....7-1.1-1 ,,t^4.,H^.....,..;
t^.., 4^a t ;^!.^I^ 1-,:-•..•• r'^•.- -^; •..- i -i •• , - i^- -.
-I •tL_^' r t i r - t-'^t . ". 1 /14 / ; '• C'14- , -;^b.' i r^'
^
; 1.1L,! •^''•^' :tr; !^ 1^• . 4^•^ -1^.t:•: +,„,_„...,■■• - '1:1/.71,-/-111 F4t.:11rt
'7.7.....- 17 ./...,r,...:.,....^_^,,- •rr:",j=:PrZr'•.rlr•. 4.....• ...., ',.^-•,..," ,^...mr.7.1 rairmar.,... rar...................■,.....-.........,........ ",/..■...,- .^I -- ,: . 11.7,11,, ,i',,.;:p 71, f,t7t'iti.t..1"..1:7F1.1^7ti.2.-- /..7.:„4. .1't ; :1 iti d- 1-77...' *7}7141li::-.2r,i71,111-11^- ;- / qi.-_-"7 ' ,:-^4 '-.-•:_rly : II i ' 7..;_;:. ',
^
, 14-Pt^4-7,.,:i!J.t.1L,^ 111rq^' .rt. rf .41,41:,','SF-:/ -;47 7t1 il ':Li •-..;11- :,...':•-r. ,Ti:441..^J.-••••• -.Vz.,r ii ritr.',/t , '17^i•410,,,. ,!:',-,,PF,•••,4 F.,^ ' ^':it&A
A. Anomaly significant with respect tegeological noise^envelope.
t^Wr PRIMINWINAW RIM 1111/3 1111111111111=11111^Now Imearsoirremmumme
B. Anomaly significant with respect to 'statistical noise" envelope.
Mt 1 , •-.;^0^1.1 , r,^-,.....^r,,--,-r,^,-.
^
t.,‘t^...., ',4 ,' ,^
, . ,.^• 0 4 •-..--,■,.■k1.4.1 .: :::,\ =.... r:.^' t ' -, -^It^' tt ■^4 1 t.W4t.^r• --v-AA.4;II'''. '1C'Al-,\' -`11,1-E.-. tt.,-. 1--*-^,,st-- - -1/4 ‘4; ‘-; .^ \ .1• 0*•\-S:‘32rLit.\ - '-'1•A'r:^',iittrt; I.,41-t., 0 rl v.^1 .1;"7'1A '':; ' 't- • IA4- ,--'4 .-Vr'AI, `-'^1;7^C\.V1^_I: .4.:-.\\*:11.1.‘,-;;:,^IA- t.r.111.1--,4.- ;. \--.1:11.1.1 .-.1^},-.01._t 1 -
t:::,1 . :1^•^ft t --- '11'1- t4 ' 1-'0:*-4"1-4'^'- ;tr.". -,--_•, 4 1,.- '1;1; ,-0.4 -i,^r: v..: 7, rl.,- v 11 4t.: , --14.1. '^\ : ri''''.
^
l.....:ii ,,,z. :t.^i'ta.'1 'tit 1.,^M- 'Ili r.1' 1 : ■:- 11A-V t- - 1 't+11-:: -7.1 -t-, , 'C: , :1, ,:::. , . -1.:i,1'71 14I:11 -7' 4.'0:^t 1-mit,-,;Y-L,+.4T.,.• -A,:^,ral- -.1,1 , ,,-„,, ,.-ii .,\Ry..,-,-. ,,-..-..: . , ,,n,..,:144111-' .,^T; -: - AT --;,..'^,^' 4 114:^.1.1.i 1. i .-{^.44^1 .^4"^...-.1' 4,.71.1.•1.4^,1:11“04.li4A
. ^1 11■.-4:r "1:1 1:F5711Lt:^.1:■}3. ti^1^.^4 "4,34:11-, II-I I. t I. ' 4, 1. .- • " , 1 • I .. ■^• • t. ,-:, ...i ;_: i , - ro t4.-"_, i-.1.; ,:-.7.1-1-,.1..-.74:11-..,':.:^,. 't.1- -..:1-4, -^.--61 :t . si-I r r :.- „I: ,^1 ., ■
J.1." ..1_:-.-.4.--1 .: _ : .. , I^.1.^ ir4!...'f.:. lit.%^-1....'.•..•...,^.---.... ,717'. t- t ii -,.4;, ., i,..^,,, . if. . ,..t; t7:-' - '''''t.: - --4":". ; ._ _ 14 7i....;_at.r . , -11'-..,--:',7,r, ;,:TV t.7 11-1,;44, :71,4:•-4.1 ir_-,41, -_ ,:- :71 v. , L,`7,-- ..^ ..1; ;441 frq ;. ;_.1 ;^;11+4
^
.,0 ..,,..1 ti. ,-. 't- i• '^'F.
,„...,^,, ::,:.^.
-I.;; , :i"r!r,...l',! .1 .til:11:4-it.1.41....fli_li'f riviti:.::_i -^, • -4- •-1 , -,
ti 7 ii,t .L177171'.11 .^...I-^-r 114 # - --,.,-471_ .:-,rT4r--' -Tr"-Fhfr-42-1-r 1--i-gx-if:z4#/-1. .-;---t-.^j723:111117, Il iitil,;4.1 ;..
: 1 I I; , ti,- L
^
.,^ 1' t^'-', - '4 '''' .4 4 -?.rUilt-r7/ tifiri Ji-44#1":" : 7 `
• Anomaly significant with respect to associated geological noise" envelopebut insignificant with respect to neighbouring "geological noise" envelope.
:
To accompany record N9 1966/15
13.
APPENDIX 1
Outboard tadiometric Anomalies
Anomaly interpretation criteria
Amplitude. For an anomaly to be resolved from the normal gammaray background noise the amplitude of the anomaly must be statisticallysignificant. The acceptance level is set at:—
Anomaly amplitude to be greater than 3 timesstandard deviation of gamma ray background noise.
Gamma ray background noise. Two distinct types of gamma raybackground noise are recognized; they are produced by:--
1. Statistical variation of the recorded gamma ray intensityfrom a homogeneous source, the standard deviation (S.D.)of the count rate being determinable from the equation:.
S.D. . IN/2T
where N is the count rate and T is the time constant of the counter.
2. Variation of the gamma ray intensity from a heterogeneous sourcei..which may be produced by a geological environment involvingvariations in overburden above a homogeneous source.
The envelopes containing both forms of gamma ray backgroundnoise have aheight of 4 times standard deviation of that noise. Typicalrecords illustrating noise and anomalies are shown in Figure 2.
Form. Anomaly shape depends upon the configuration of the sourceand its location relative to the aircraft. The width of an anomaly athalf peak amplitude is related to these factors and the acceptance limitsset are:.4..
Anomaly width at half peak amplitude to be greaterthan 3 seconds and less than 4 seconds.
This width criterion results in the acceptance of acontinuous series of sources, which is limited by sources with radii of300 feet centred on the aircraft's line of flight and by point sourceslocated within 300 feet of the aircraft's line of flight.
Tables 1 and 2 (pages 14 and 15) show the reslAts of theapplication of the above criteria to the radiometric records.
Alalysis of radiometric anomalies
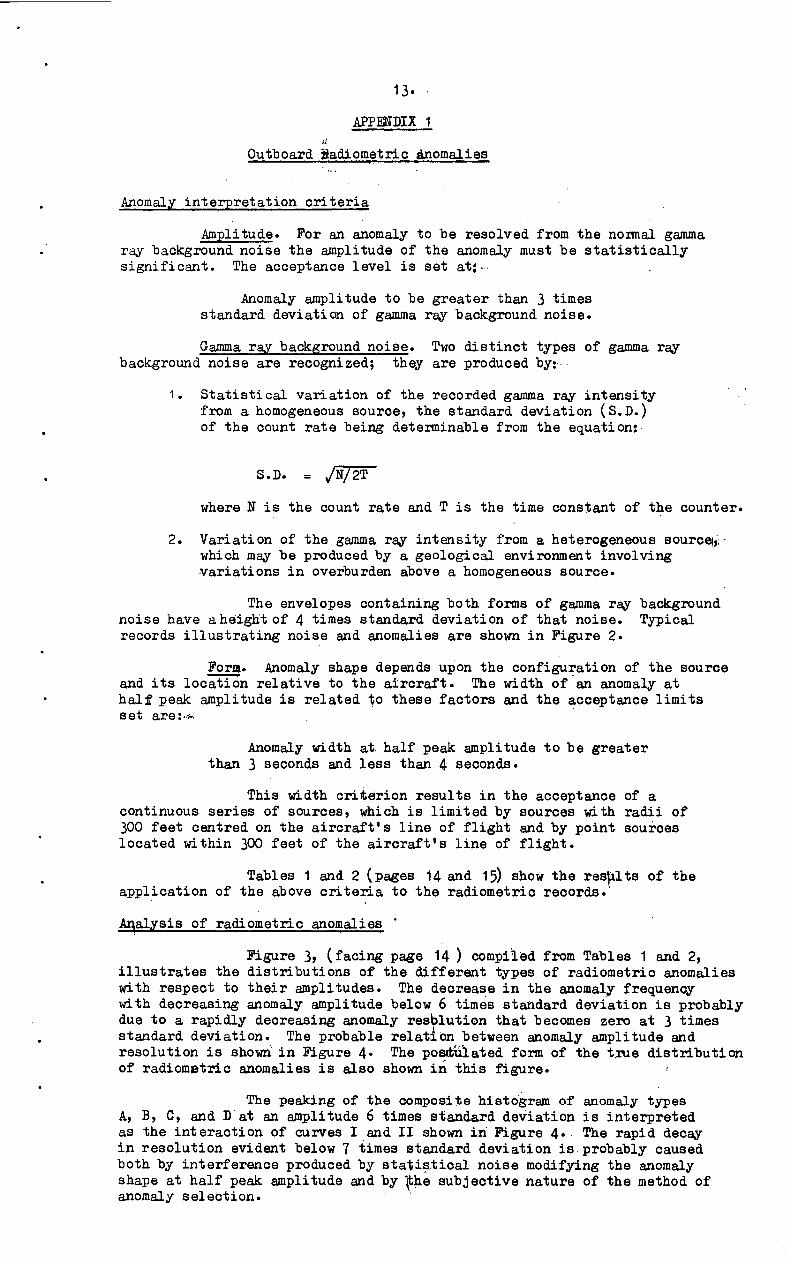
Figure 3, (facing page 14) compiled from Tables 1 and 2 9
illustrates the distributions of the different types of radiometric anomalieswith respect to their amplitudes. The decrease in the anomaly frequencywith decreasing anomaly amplitude below 6 times standard deviation is probablydue to a rapidly decreasing anomaly resblution that becomes zero at 3 timesstandard deviation. The probable relation between anomaly amplitude andresolution is shown in Figure 4. The poseilated form of the true distributionof radiometric anomalies is also shown in this figure.
The peaking of the composite histogram of anomaly typesA, B, C, and Vat an amplitude 6 times standard deviation is interpretedas the interaction of curves I and II shown in Figure 4.. The rapid decayin resolution evident below 7 times standard deviation isprdbably causedboth by interference produced by statistical noise modifying the anomalyshape at half peak amplitude and by he subjective nature of the method ofanomaly selection.
14.
TABLE 1.
Outboard radiometric anomalies, Menzies 1:250,000 map area
AnomalyNo.
LineNo.
Fiducial^Half Fe4No.^width (sem)
Amplitude(x S.D.)
AnomalyClassification
1 78W 854.8 4.0 9 D
2 78 W 849-5 4.0 9 D
3 80 w 318.7 3.5 5 A
4 84w 795.0 3.0 8 B
5 85 N 511.1 3.5 5 B
6 86w 290.0 3.0 8 B
7 89W 233.1 3.0 7 A
8 91W 599.7 3.0 8 B
9 94 E 506.6 4.0 9 B
10 94 E 528.6 3.0 7 B
11 96 E 030.2 3.0 6 A
12 97 w 805.4 3.0 4 A
13 103 E 825.5 4.0 9 B
14 103 E 974.8 4.0 10 A
15 106 w 088.3 3.0 16 B
16 108 w 753.6 3-5 6_ A
17 108 w 693.9 4.0 10 B
18 110 w 167.4 3-5 12 A
19 112 W 749.3 3.0 10 C
20 114 W 139.0 4.0 12 B
21 116 E 885.0 3-5 14 B
22 116 E 922.4 4.0 6 A
23:. w 189.8 3-5 15 B
24 120 E 885.6 3.0 4 C
25 120 E 042.4 3.5 10 B
26 121 w 820.0 3.0 7 A
27 121 W 654.1 3.0 12 B
28 122 E ; 430.5 4.0 7 C
29 123 W 298.8 3.5 5 A
30 123 W 297.8 4.0 6 A
31 123 W 294-3 3.5 18 B
32 128 w 184.0 4.0 7 A
33 129 E 842.0 3.5 4 A
34 133 E 944.3 4.0 6 A
35 137 E 639.2 4.0 6 A
36 137 E 686.6 4.0 8 A
37 140 w 167.1 4.0 6 A

To toce page 14
FIG 3
A+B+C+D
Anomaly
1^Frequency
5
I^I
2015Anomaly Am
10plitude (in units of standard
A
deviation)
Anomaly
Frequency
3^5^ 10^ 15^ 20Anomoly Amplitude (in units of standard deviation )
10^ 15
Anomaly Amplitude (in units of standard deviation )
tAnomaly
Frequency
Anomaly
Frequency
3^5
I L50^ 55
Anomaly Amplitude ( in units of standard deviation
:;^Anomaly
Frequency
10Anomaly Amplitude (in units of stondard deviation)
HISTOGRAMS OF AMPLITUDE AND FREQUENCYOF OCCURENCE OF RADIOMETRIC ANOMALIES
PROBABLE RELATIONSHIPS BETWEENANOMALY AMPLITUDE, FREQUENCY,
AND RESOLUTION
FIG 4
I — I
IT
1 0Anomaly Amplitude ( in units of standard deviation)
To accompany Record N. 1966/15H51/BI- 43
eophysicai Branch, Bureau of Mineral Resources, Geology and Geophysics.

1 5.
TABLE 2
Outboard radiometric anomalies t:Leonora 1:250,000 map area
AnomalyNo.
LineNo.
FiducialNo.
Half Peakwidth (secs)
Amplitude(x.S.D.)
AnomalyClassification
1 4W 179.8 3.5 4 D
2 5E 364.3 3.5 7 D
3 6W 624.7 4.0 4 c
4 7 E 764.5 3.5 4 D
5 8 w 234.0 3.956 P
6 12 W , 144.7 3.5 7 D
7 15 E 749.8 3.0 4 A
8 17 E 256.3 3.0 6 B
9 23 E 799.6 c 3.5 5 B
10 27 E 743.5 4.0 9 D
11 28 W 176.5 4.0 4 B
12 29 E 316.2 4.0 6 D
13 31 E 902.6 3.0 5 B
14 32 W 134.0 4.0 5 B
15 44 E 378.0 3.5 5 A
16 48 E 194.1 4.0 8 A
17 51 E 709.6 3.0 6 D
18 55 E 692.1 4.0 26 B
19 57 E 718.3 4.0 6 D
20 57 E 739.7 3.0 5 A
21 59 E 144.5 4.0 lo B
22 60 W 934.4 4.0 12 A
23 61 E 691.7 3.5 6 A
24 62 W 511.7 4.0 15 B
25 62 W 474.4 3.0 8 D
26 64 E 209.7 4.0 5 A
27 66 E 820.6 S*5 5 D

16.
APPENDIX 2
Operational details
Staff
Party leaderGeophysicistSenior radio technicianDraught ing assistantGeophysical assistants
Pilots (TAA)
Aircraft maintenance engineer(TAA)
s G. A. Youngs D. B. Tippers P. B. Turners P. Kersuliss K.A. Mort
D. ParkI. Parkinson
s Capt. T. NewmanFirst Officer D. BrownFirst Officer J. Ralston
B. Hall
Equipment
AircraftMagnetometer
Scintillographs
CameraRadio altimeterAir position indicator
Magnetometer
Survey specifications
AltitudeLine spacingLine orientationTie system
Navigation controlRecord sensitivity MFS-5
Inboard acintillemeterOutboard scintillometer
Scintillometer time constantsInboardOutboard
$ DC-3 VH-MINs MFS-5 saturable core fluxgate,
tail-boom installation coupledto 'Speedomax' and digital recorders.
s Twin crystal MEL scintillationdetector heads inboard and outboard(the latter suspended from a cable290 feet below aircraft). Outputs .coupled to Kelvin Hughes recorders
s "Aeropath", 35-mm. stripSTR30B, frequency modulated typeTrack recorded by Eaterline-Angusrecorder
$ MFD6.3 saturable core fluxgate,ground installation for stormwarning.
$ 500 feet above ground level: 1 miles East/west
Single lines spaced 15 miles apart,double lines at eastern and westernboundaries of individual 1:250,000map areas
: Aerial photographss 100 gammas/inch: 100 cis per centimetre: 100 c/s per centimetre
: 10 seconds$ 1 second

121°30'^
123°28°
LAVERTONLAvEPTON
MT. MARGARETLEON RA^/
MALCOLMLake
YOUANMI
• L.Berlee
MENZ/ESt\k
33o ^118°30'
NERRE.OtN
K A L G 0 0
SOUTHERN^
NORTH
:BR ADEAST/LARROW: /1\1 5)FTE ;
K U RN A /L P 1/11111(E . / 0 /N. F. tBal/LOER COOLGARDIEA-At000Rug
.,.....4r, .^AR/D/E/ 4
EASTCoala
r .^,^co° GARDIE:
F.
"
C
AMAOPI"
SOUTNERN CROSS
COOLGARDIE^
/ / ^.....
//001EMOOLTHw I
DcpG4491E M 0 .0 L T H
BOORAB BIN
.. Atit1,9.4,14. * 4N
oRsErmy
4 e(lt; GA. F.
/ /NORSEMAN
33o- 123'
Y I LGAR N////
JACKS ON
HYDEN
•
'k
RYDEN
G.^F..// /
120°
• LAKE JOHNSTONE
PHILLIPSRIVER
DUNDAS
121°30
3 1 0
PLATE I
LOCALITY MAP
AIRBORNE MAGNETOMETER AND SCINTILLOGRAPH SURVEY^1964
MENZIES - LEONORA AREA WASCALE IN MILES
40^0^40^80^120
al■r
Perth
LOCATION DIAGRAM
Geophysical Branch, Bureau of M/here/ Resources Geology & Geophysics. H51/BI-21To accompany record N. 1966/15
AREA PREVIOUSLY SURVEYED
1964 SURVEY BOUNDARY
• • •^GOLDFIELDS BOUNDARIES