Embed Size (px)
Citation preview
Meeting the Safety Challenge
Jeffrey W. Runge, M.D.Administrator
National Highway Traffic Safety Administration
Automotive News World Congress January 14, 2003
3DTPC/SC 2002-2003 #1/Runge's Auto News speech Jan 2003
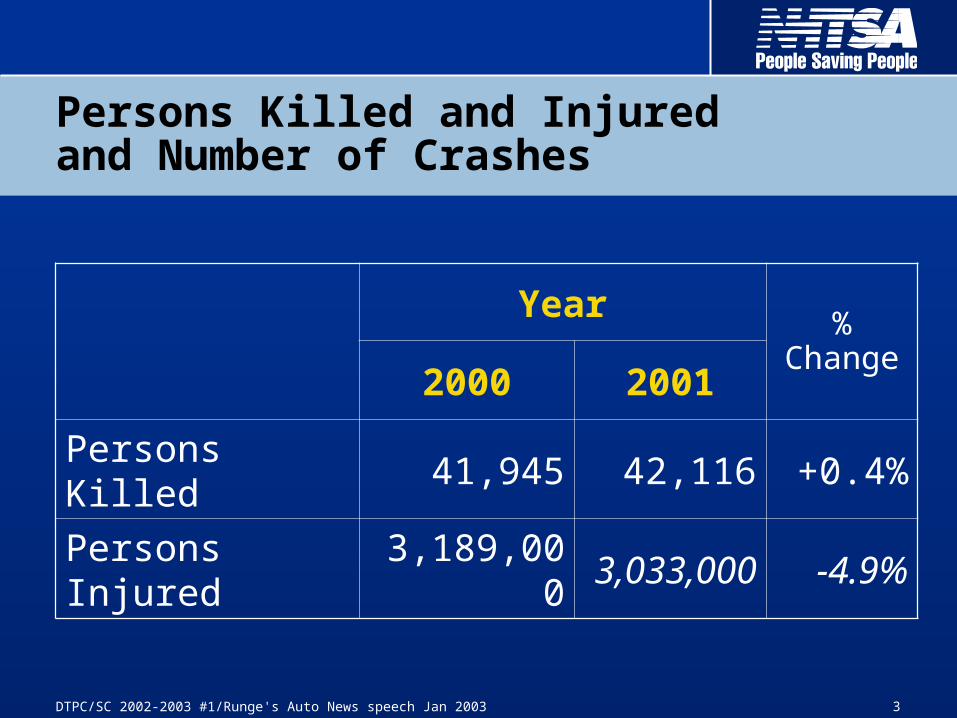
Year % Change2000 2001
Persons Killed 41,945 42,116 +0.4%
Persons Injured
3,189,0003,033,00
0-4.9%
Persons Killed and Injured and Number of Crashes
4DTPC/SC 2002-2003 #1/Runge's Auto News speech Jan 2003
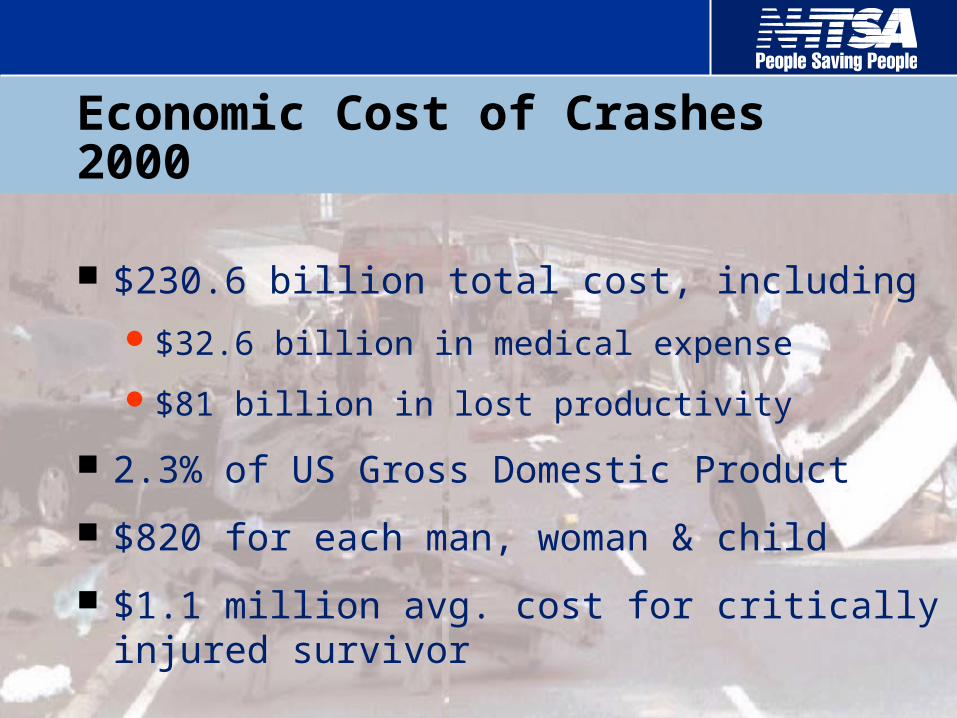
Economic Cost of Crashes 2000
$230.6 billion total cost, including
$32.6 billion in medical expense
$81 billion in lost productivity
2.3% of US Gross Domestic Product
$820 for each man, woman & child
$1.1 million avg. cost for critically injured survivor
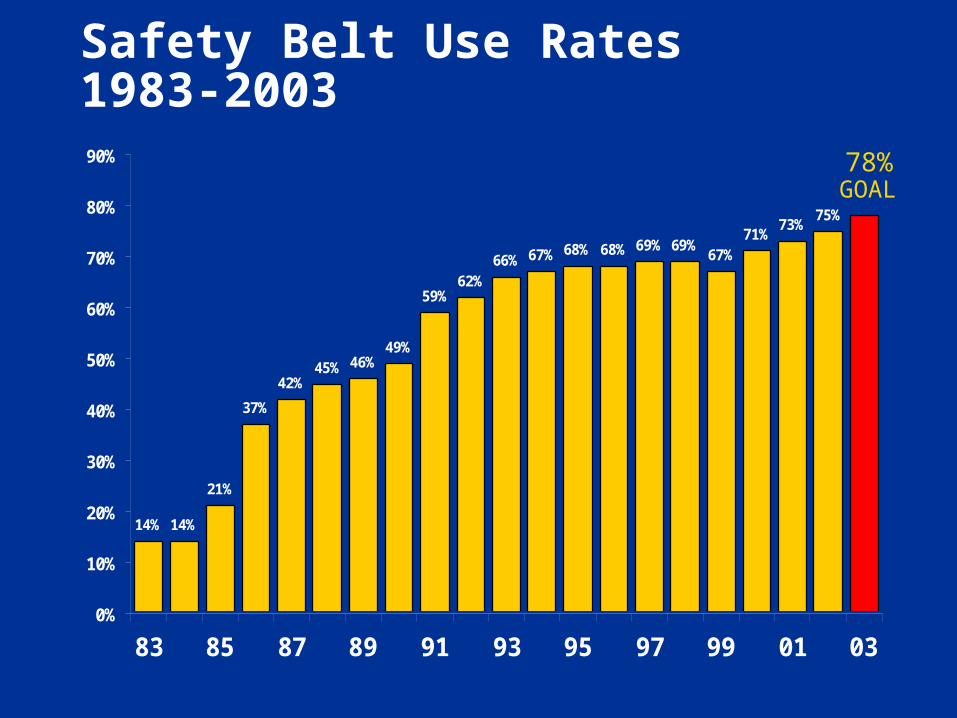
Safety Belt Use Rates 1983-2003
14% 14%
21%
37%
42%45% 46%
49%
59%62%
66% 67% 68% 68% 69% 69%67%
71%73%
75%
0%
10%
20%
30%
40%
50%
60%
70%
80%
90%
83 85 87 89 91 93 95 97 99 01 03
78%GOAL
6DTPC/SC 2002-2003 #1/Runge's Auto News speech Jan 2003
Failure to Use Safety Belts
9,200 fatalities
143,000 people injured
$26 billion in costs incurred
7DTPC/SC 2002-2003 #1/Runge's Auto News speech Jan 2003
Safety Belt Benefits
For each 1% increase in safety belt use:2.8 million more people buckling up270 lives saved$800 million cost savedReduce severity of 6,400 serious injuries
Belt use at 90%:6,600 lives saved each year

AVI file for Unbelted 50th Percentile
Male Driver
AVI file for Unbelted 50th Percentile
Male Driver
11DTPC/SC 2002-2003 #1/Runge's Auto News speech Jan 2003
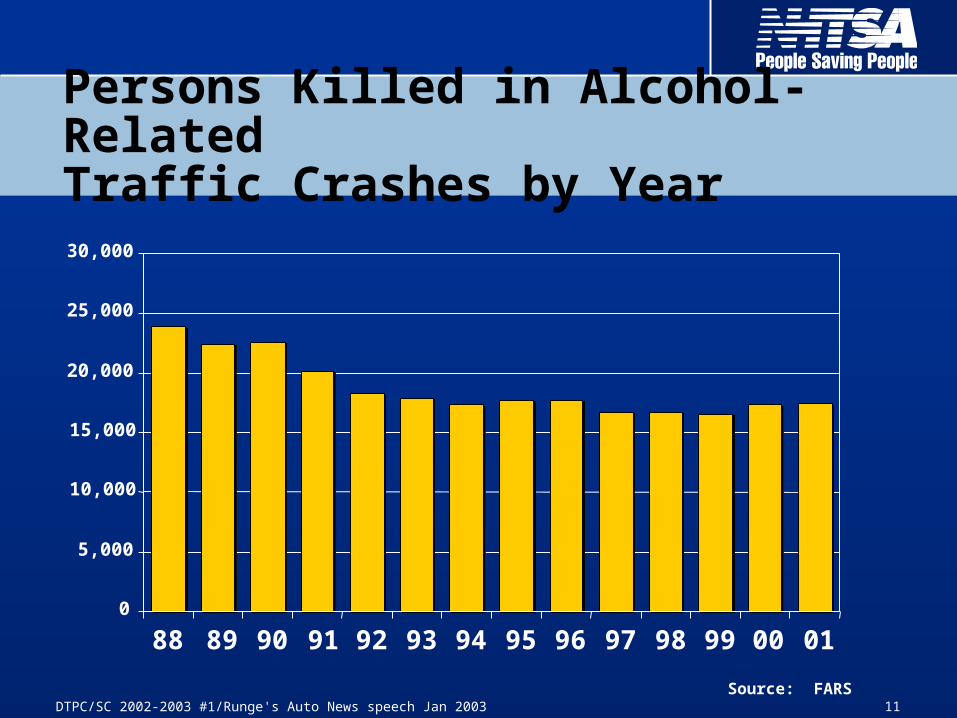
0
5,000
10,000
15,000
20,000
25,000
30,000
88 89 90 91 92 93 94 95 96 97 98 99 00 01
Source: FARS
Persons Killed in Alcohol-Related Traffic Crashes by Year
12DTPC/SC 2002-2003 #1/Runge's Auto News speech Jan 2003
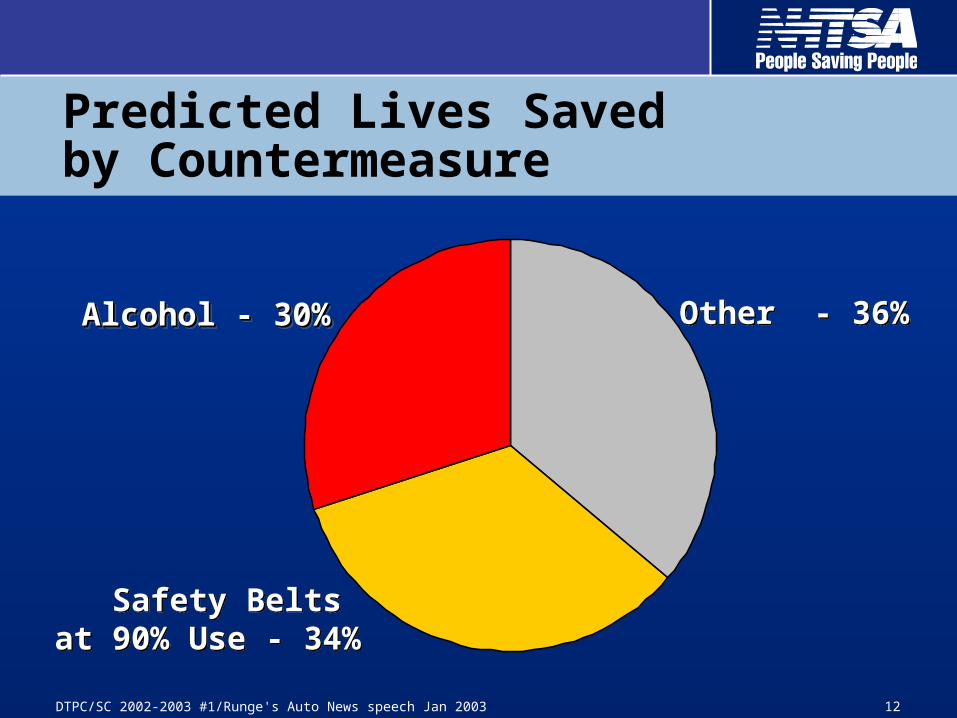
Other - 36%Other - 36%
Safety Belts at 90% Use - 34%
Safety Belts at 90% Use - 34%
Alcohol - 30%Alcohol - 30%Alcohol - 30%Alcohol - 30%
Predicted Lives Saved by Countermeasure
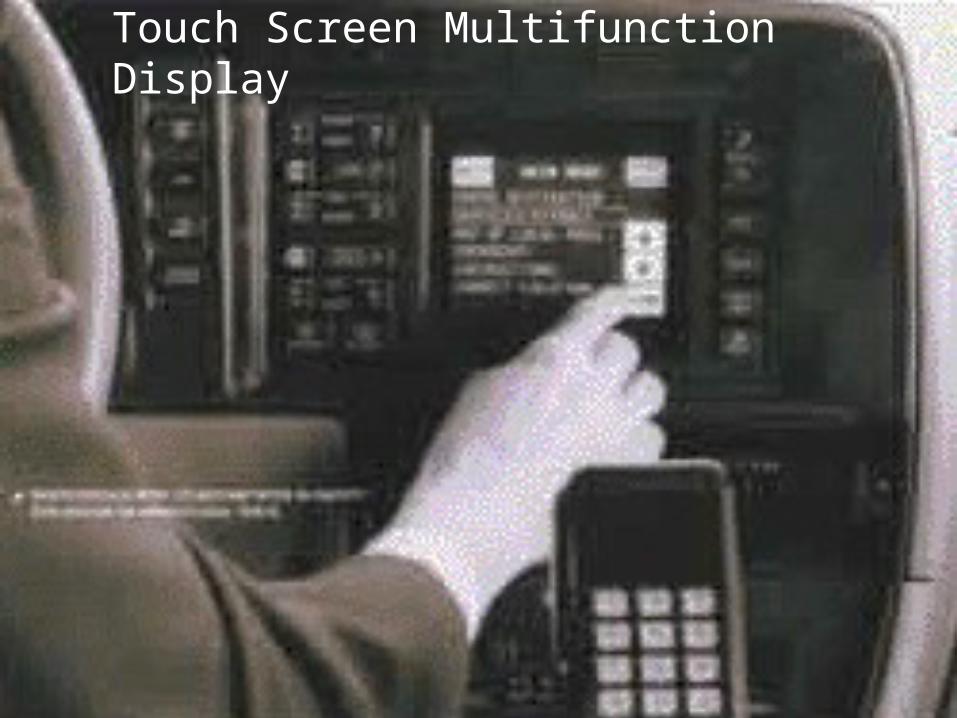
Touch Screen Multifunction Display

14DTPC/SC 2002-2003 #1/Runge's Auto News speech Jan 2003 1 5D T P C / S C 2 0 0 2 - 2 0 0 3 # 1 / R u n g e 's A u to N e w s s p e e c h J a n 2 0 0 3
V e h ic le S a fe ty P r io r it ie s
C o m p a tib ility
R o llo ve r p re v e n tio n & p ro te c t io n
C o m p a tib ility
R o llo ve r p re v e n tio n & p ro te c t io n
A dvanced A ir B ags S ide Im pact O ffset F ronta l
A dvanced D um m ies R ear Im pact
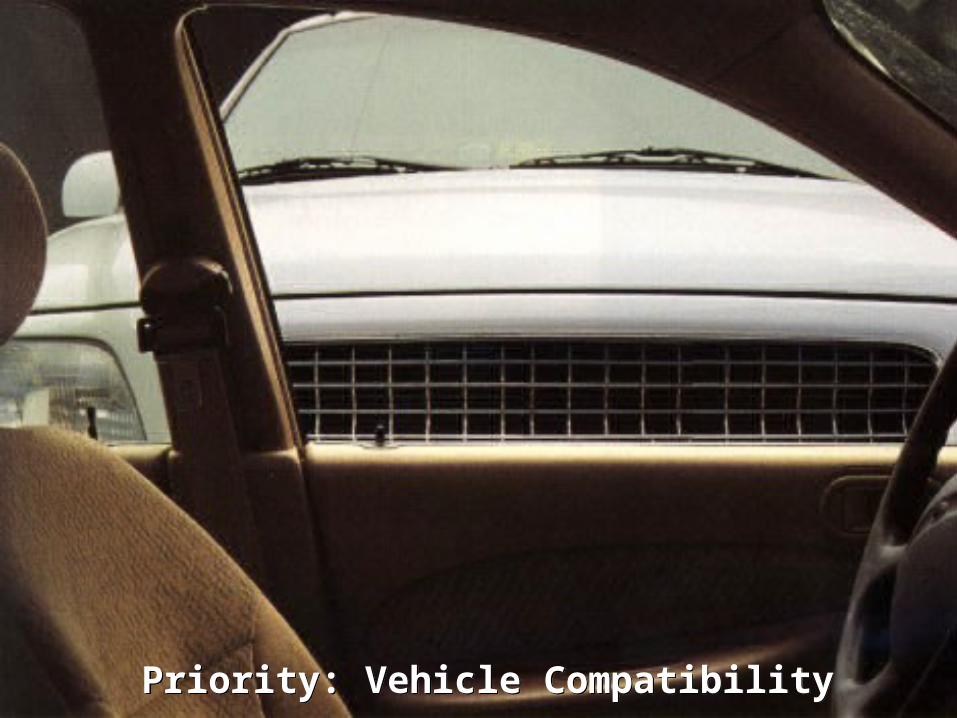
Priority: Vehicle CompatibilityPriority: Vehicle Compatibility
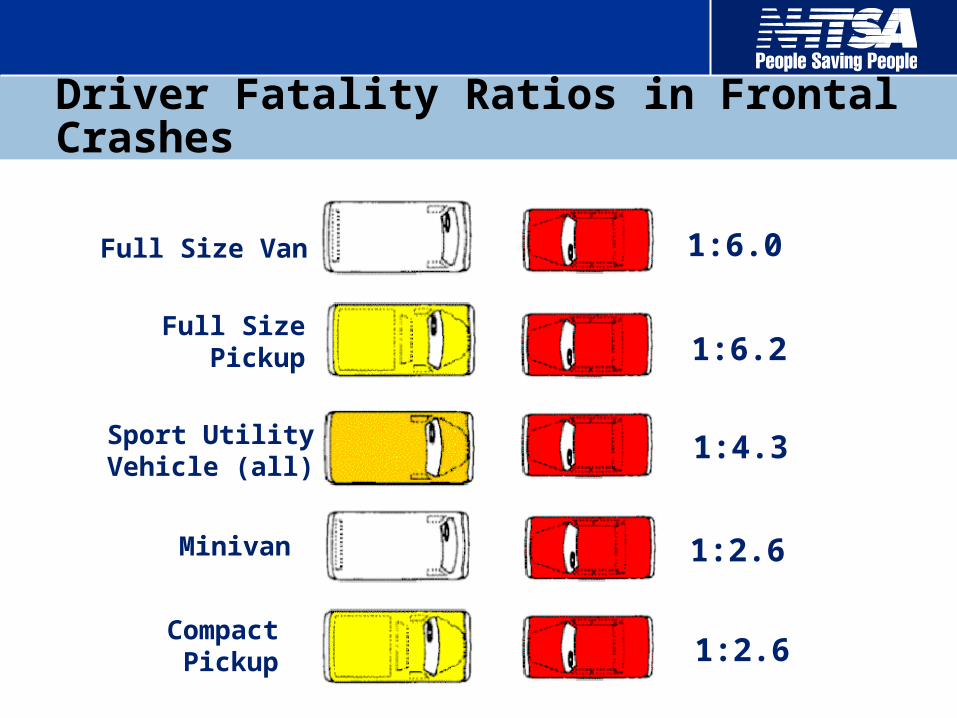
16DTPC/SC 2002-2003 #1/Runge's Auto News speech Jan 2003 Source: FARS 1995-1999
Full Size Van
Full SizePickup
Sport UtilityVehicle (all)
Minivan
CompactPickup
1:6.0
1:6.2
1:4.3
1:2.6
1:2.6
Driver Fatality Ratios in Frontal Crashes
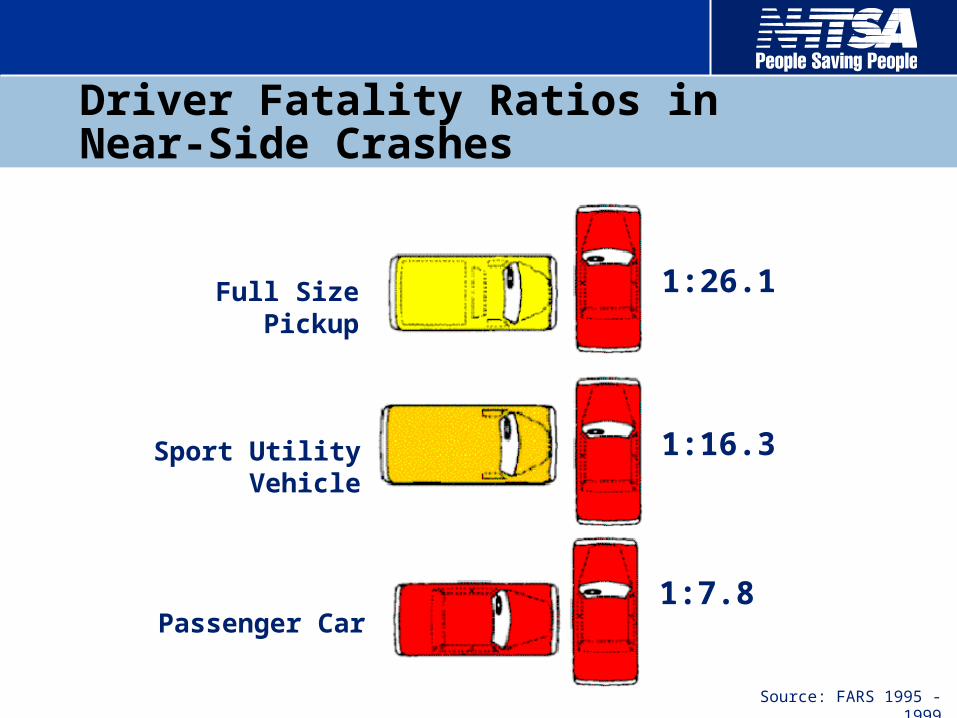
17DTPC/SC 2002-2003 #1/Runge's Auto News speech Jan 2003
Sport Utility Vehicle
Passenger Car
Full Size Pickup 1:26.1
1:16.3
1:7.8
Source: FARS 1995 - 1999
Driver Fatality Ratios in Near-Side Crashes
18DTPC/SC 2002-2003 #1/Runge's Auto News speech Jan 2003
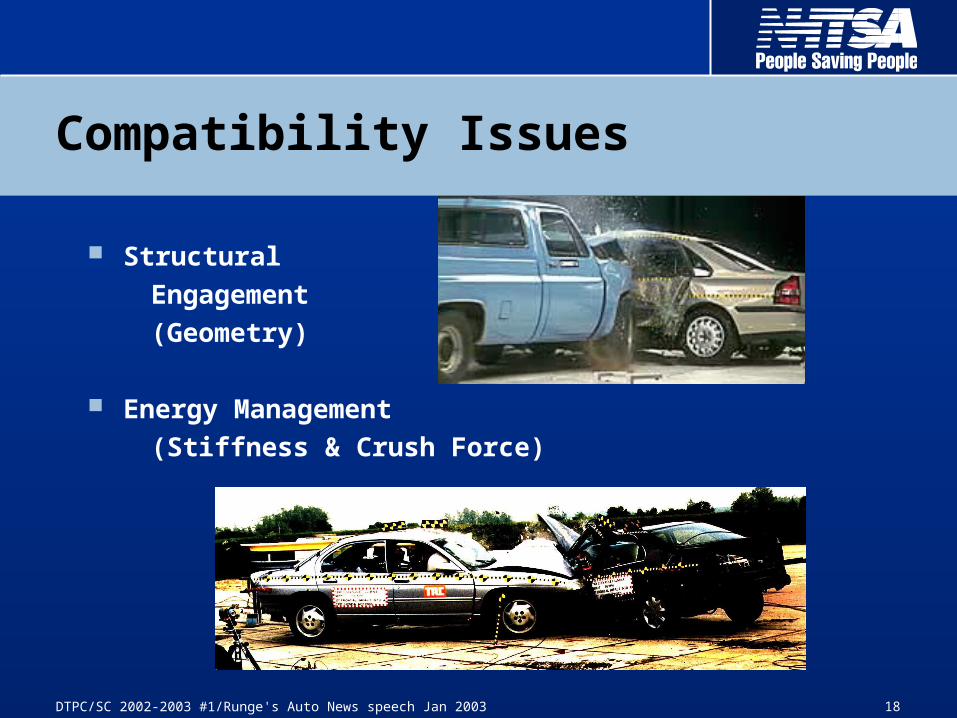
Structural Engagement (Geometry)
Energy Management (Stiffness & Crush Force)
Compatibility Issues
19DTPC/SC 2002-2003 #1/Runge's Auto News speech Jan 2003
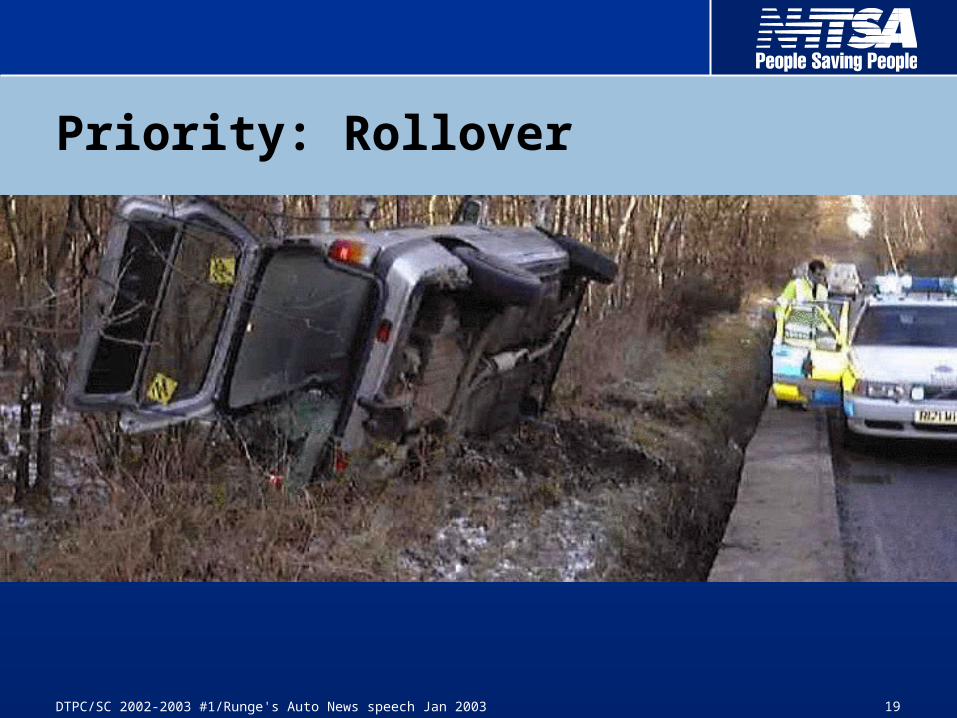
Priority: Rollover
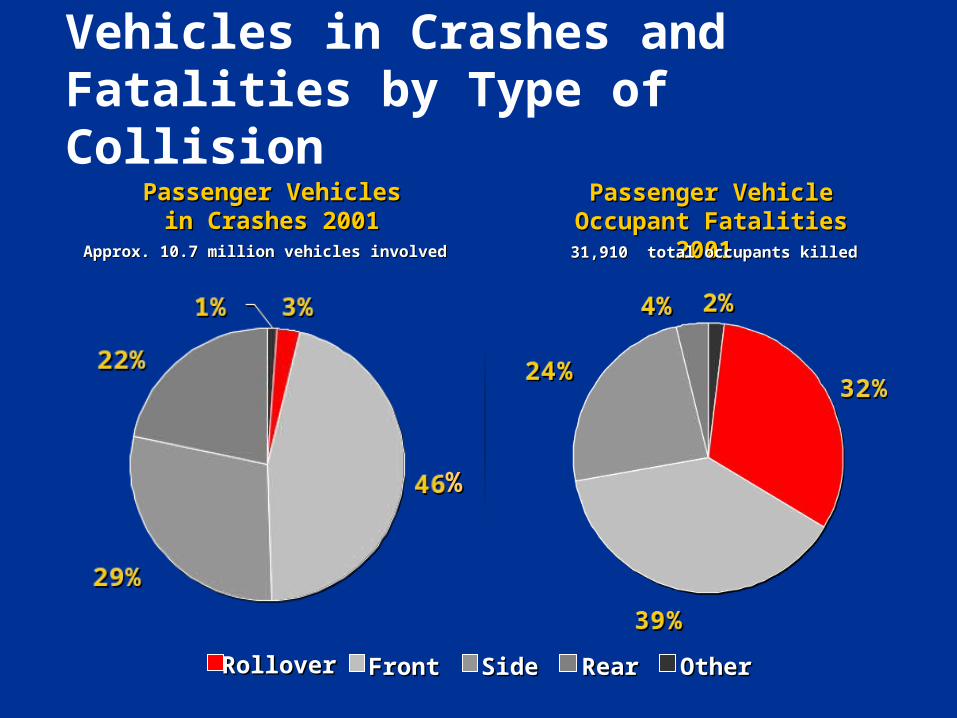
RolloverRollover FrontFront SideSide RearRear OtherOther
Passenger VehiclesPassenger Vehiclesin Crashes 2001in Crashes 2001
Approx. 10.7 million vehicles involved Approx. 10.7 million vehicles involved
Passenger VehiclePassenger VehicleOccupant Fatalities Occupant Fatalities
2001 2001 31,910 total occupants killed31,910 total occupants killed
Vehicles in Crashes and Fatalities by Type of Collision
%%
21DTPC/SC 2002-2003 #1/Runge's Auto News speech Jan 2003
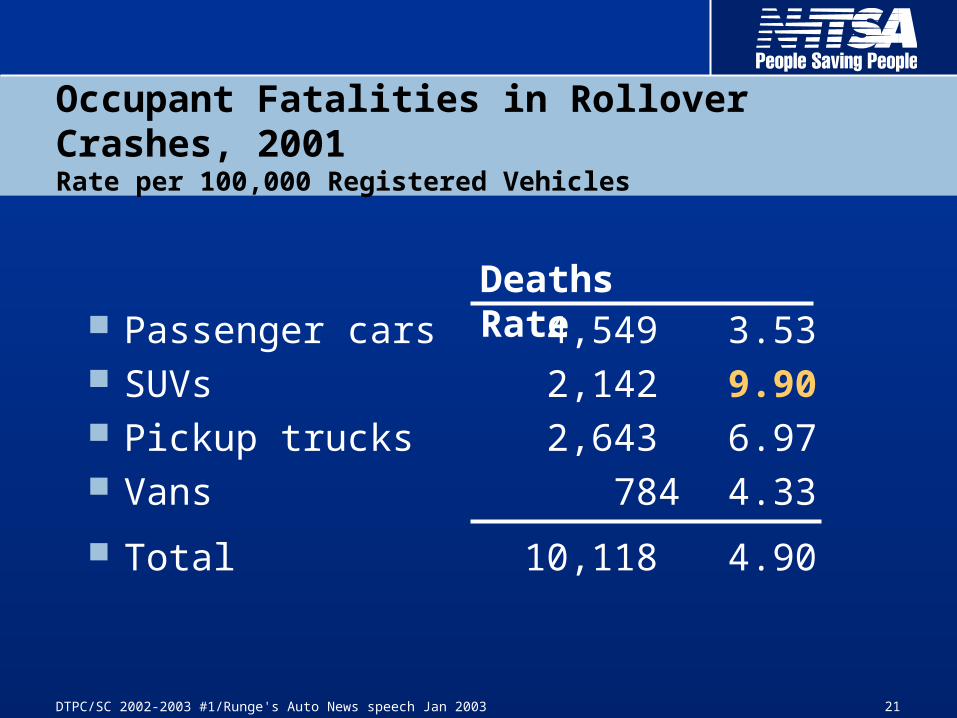
Occupant Fatalities in Rollover Crashes, 2001Rate per 100,000 Registered Vehicles
Passenger cars 4,549 3.53 SUVs 2,142 9.90 Pickup trucks 2,643 6.97 Vans 784 4.33
Total 10,118 4.90
Deaths Rate
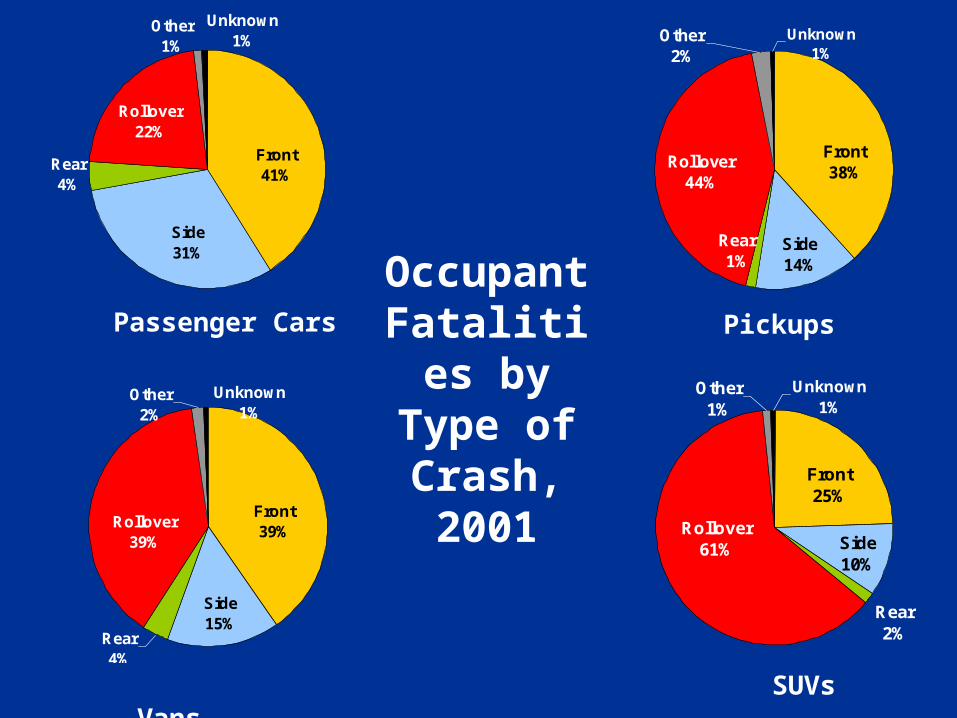
Unknown1%
Other1%
Rollover61% Side
10%
Front25%
Rear2%
Side31%
Rear4%
Front41%
Rollover22%
Other1%
Unknown1% Unknown
1%Other
2%
Side14%
Rear1%
Rollover44%
Front38%
Rear4%
Side15%
Rollover39%
Front39%
Other2%
Unknown1%
Passenger Cars Pickups
Vans
SUVs
Occupant
Fatalities by
Type of Crash,2001
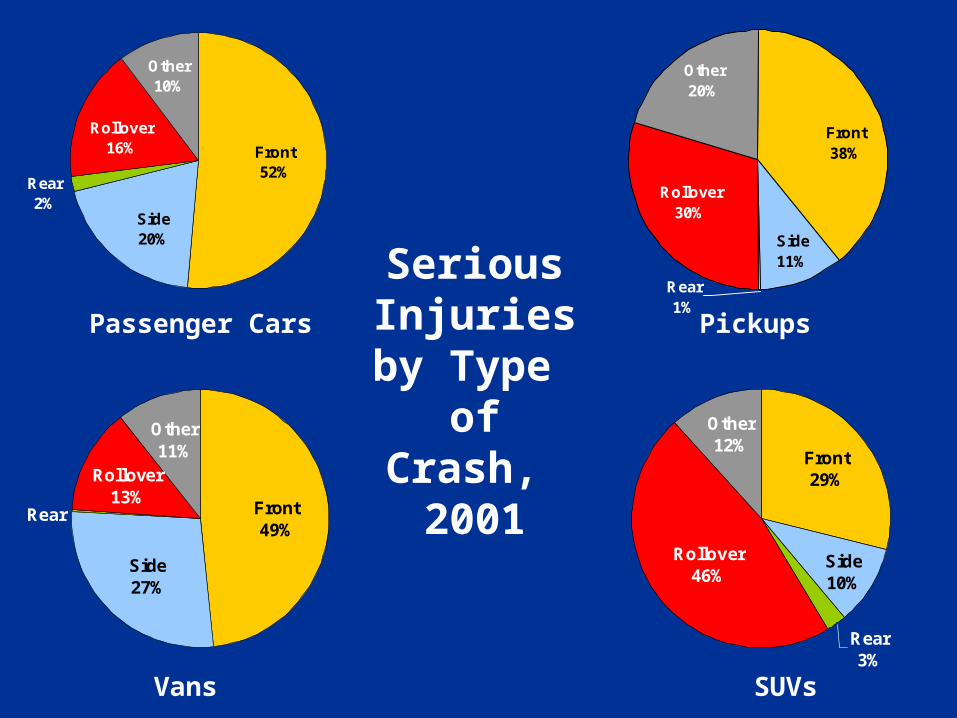
Rear2%
Rollover16%
Other10%
Front52%
Side20%
Rear1%
Side11%
Front38%
Other20%
Rollover30%
Rear
Side27%
Rollover13%
Other11%
Front49%
Rear3%
Side10%
Front29%
Other12%
Rollover46%
Passenger Cars Pickups
Vans SUVs
Serious Injuries by Type of Crash,
2001
24DTPC/SC 2002-2003 #1/Runge's Auto News speech Jan 2003
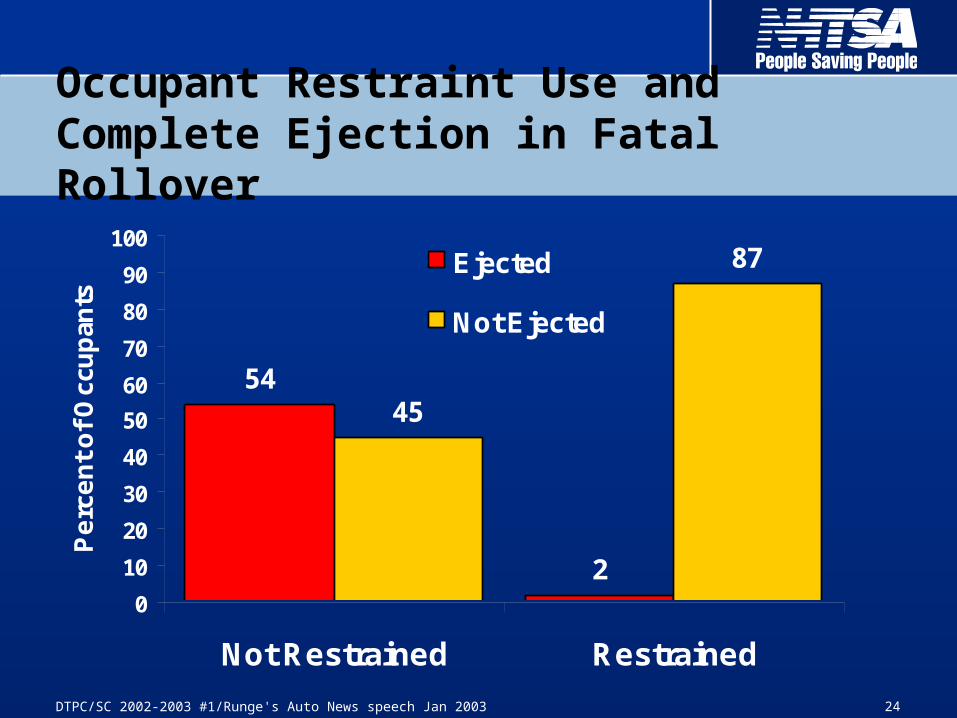
Occupant Restraint Use and Complete Ejection in Fatal Rollover
54
2
45
87
0
10
20
30
40
50
60
70
80
90
100
Not Restrained Restrained
Pe
rce
nt
of
Occ
up
ants
Ejected
Not Ejected

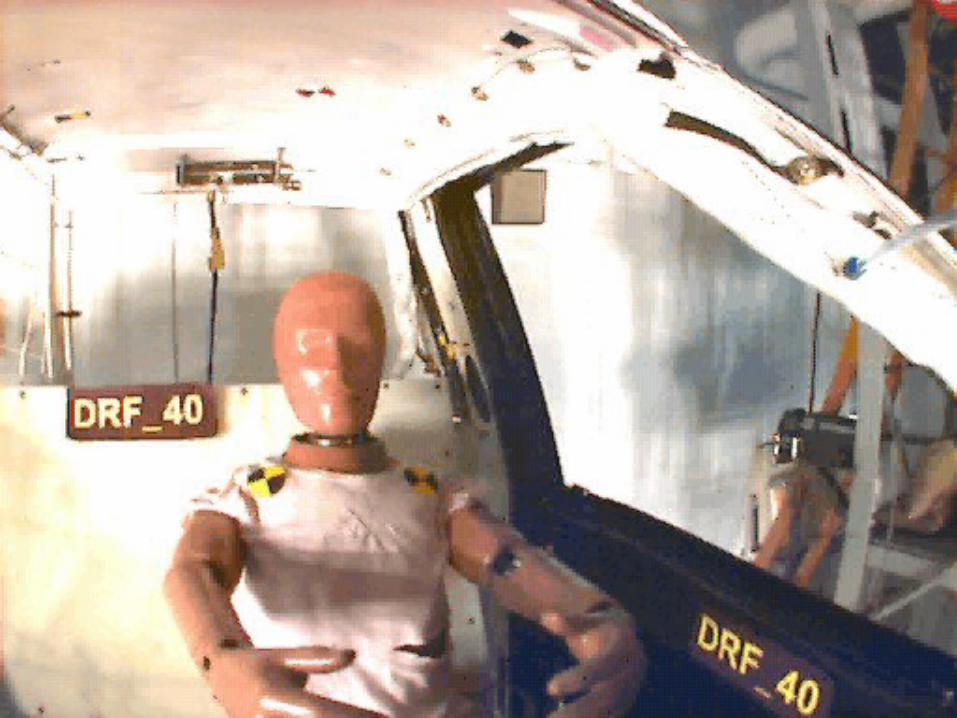
AVI file for DRF-Dynamic Rollover
Fixture
AVI file for DRF-Dynamic Rollover
Fixture
27DTPC/SC 2002-2003 #1/Runge's Auto News speech Jan 2003
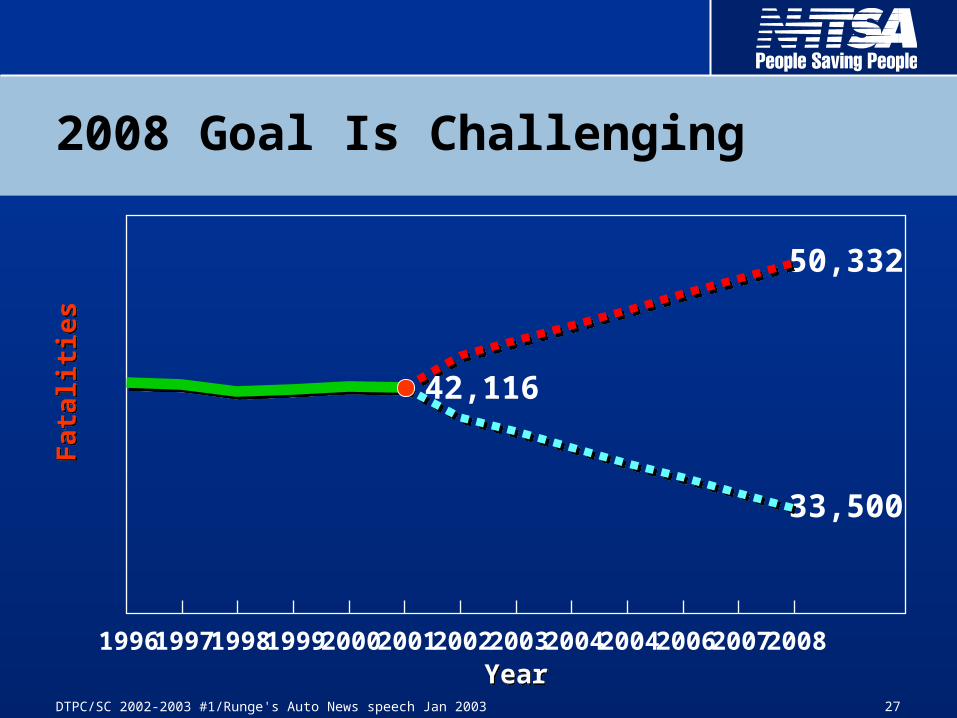
1996 1997 1998 1999 2000 2001 2002 2003 2004 2004 2006 2007 2008
Fat a
l iti e
sFa
t al it
i es
50,332
33,500
YearYear
42,116
2008 Goal Is Challenging