Embed Size (px)
Citation preview

GAOUnited States General Accounting Office
Report to Congressional Requesters
February 2001 PUBLIC EDUCATION
Meeting the Needs of Students With Limited English Proficiency
GAO-01-226

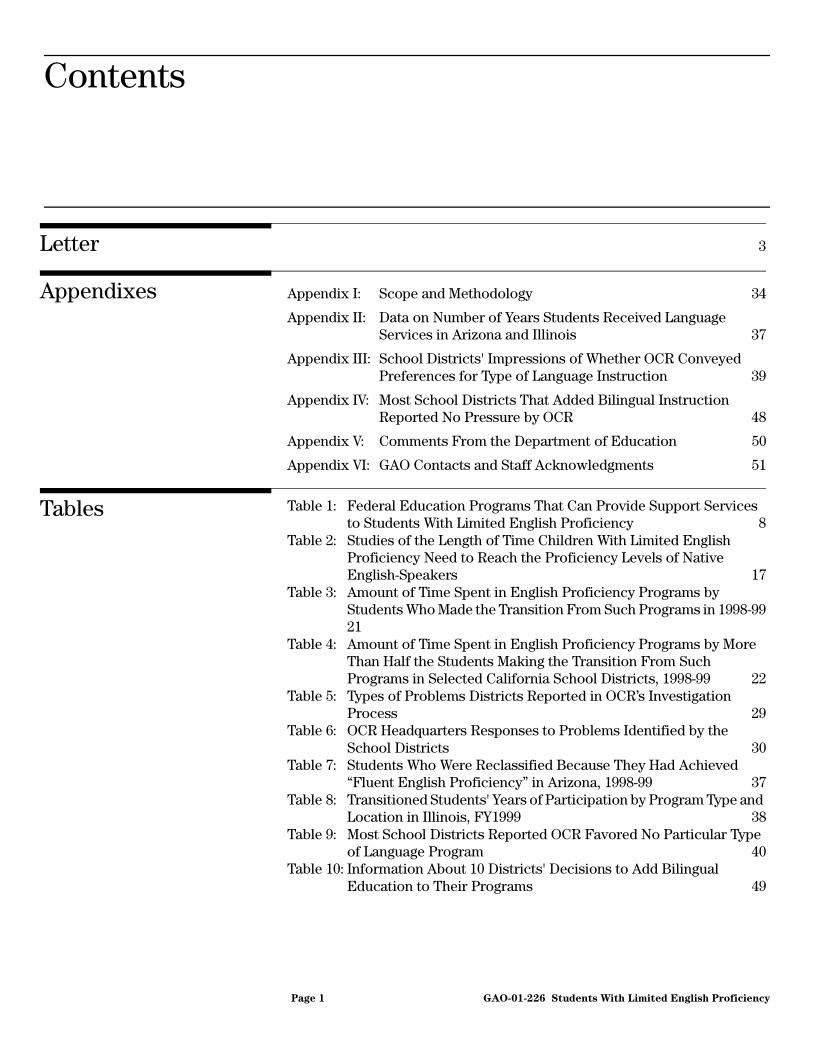
Contents
Letter 3
Appendixes Appendix I: Scope and Methodology 34
Appendix II: Data on Number of Years Students Received Language Services in Arizona and Illinois 37
Appendix III: School Districts' Impressions of Whether OCR Conveyed Preferences for Type of Language Instruction 39
Appendix IV: Most School Districts That Added Bilingual Instruction Reported No Pressure by OCR 48
Appendix V: Comments From the Department of Education 50
Appendix VI: GAO Contacts and Staff Acknowledgments 51
Tables Table 1: Federal Education Programs That Can Provide Support Services to Students With Limited English Proficiency 8
Table 2: Studies of the Length of Time Children With Limited English Proficiency Need to Reach the Proficiency Levels of Native English-Speakers 17
Table 3: Amount of Time Spent in English Proficiency Programs by Students Who Made the Transition From Such Programs in 1998-9921
Table 4: Amount of Time Spent in English Proficiency Programs by More Than Half the Students Making the Transition From Such Programs in Selected California School Districts, 1998-99 22
Table 5: Types of Problems Districts Reported in OCR’s Investigation Process 29
Table 6: OCR Headquarters Responses to Problems Identified by the School Districts 30
Table 7: Students Who Were Reclassified Because They Had Achieved “Fluent English Proficiency” in Arizona, 1998-99 37
Table 8: Transitioned Students' Years of Participation by Program Type and Location in Illinois, FY1999 38
Table 9: Most School Districts Reported OCR Favored No Particular Type of Language Program 40
Table 10: Information About 10 Districts' Decisions to Add Bilingual Education to Their Programs 49
Page 1 GAO-01-226 Students With Limited English Proficiency

Contents
Figures Figure 1: OCR Title VI Investigation Process in Five Cases Reviewed 11Figure 2: The Majority of School Districts Reported OCR Favored No
Particular Type of Language Program 26Figure 3: Type of Language Program in School Districts Before and After
OCR Investigation 27Figure 4: School Districts’ Characterizations of Interactions With OCR 28
Abbreviations
EEOA Equal Educational Opportunities ActERIC National Educational Resources Information CenterESL English as a second languageOCR Office for Civil Rights
Page 2 GAO-01-226 Students With Limited English Proficiency

Page 3
United States General Accounting Office
Washington, D.C. 20548
Page 3
Letter
February 23, 2001
The Honorable John A. BoehnerChairman, Committee on
Education and the WorkforceHouse of Representatives
The Honorable Michael N. CastleChairman, Subcommittee on
Education ReformCommittee on Education and the WorkforceHouse of Representatives
Over 3.4 million children with limited proficiency in English were in U.S. elementary and secondary schools in school year 1996-97.1 These children face a double challenge: learning to speak, read, and write English as well as learning the content of academic subjects. America’s schools have achieved limited success in meeting the needs of these students, who have four times the dropout rate of their peers who are fluent in English, as well as higher grade repetition rates. Moreover, because schools often do not know what these students have achieved in subjects other than English, they may be overlooked for programs and educational services that may be appropriate for some of them, such as gifted and talented programs. Attempts to create policy and effective curricula to help solve these problems have been hampered by the continuing controversy about which approach can better meet the needs of these children—English-based or bilingual—and about how long special help should be given to these students.
Although educating children is primarily a state and local responsibility, the federal government has a substantial role in ensuring that the educational needs of children with limited English proficiency are met—a role that is based on title VI of the Civil Rights Act of 1964 and court decisions interpreting it. The Office for Civil Rights (OCR) in the Department of Education has been tasked with enforcing the rights of these students under title VI. Questions have been raised about whether the federal government is achieving the right balance between ensuring that states and local education agencies meet the needs of these children as defined by the courts and giving local districts the flexibility they need to implement
1This figure is the latest available estimate.
GAO-01-226 Students With Limited English ProficiencyGAO-01-226 Students With Limited English Proficiency

programs that respond to their own unique circumstances. The Congress has provided oversight on this issue. In February 1998, April 1998, and June 1999, two separate subcommittees of the House Committee on Education and the Workforce held hearings on bilingual education and oversight of the Department of Education’s OCR. During these hearings, questions were raised about whether OCR had pressured school districts it had investigated to implement bilingual approaches—teaching students in native-language-based programs—to educate students with limited English proficiency. As a result of your long-standing concerns and issues raised at these hearings, you asked us to answer the following questions:
• How long do children with limited English proficiency need to become proficient in English?
• What approaches are used to teach children with limited English proficiency, and how long do students remain in language assistance programs?
• What are the requirements for children with limited English proficiency that OCR expects school districts to meet, how are they set forth, and what has been the nature of the interactions between OCR and school districts in those instances in which OCR has entered into an agreement with the school district concerning language assistance programs?
To answer the first question, we reviewed available studies on second-language learning and talked to experts in the field.2 To answer the second question, we reviewed the literature, spoke to experts, and reviewed Education’s survey data. In addition, we contacted 12 states with substantial concentrations of students with limited English proficiency, 6 of which—Arizona, Florida, Illinois, New Jersey, Texas, and Washington—had information on the length of time students spent in language assistance programs. We also conducted site visits in 10 school districts (2 in each state) in Arizona, Florida, Illinois, North Carolina, and Texas to obtain information on teaching approaches used. These states have large or growing populations of children with limited English proficiency. To answer the third question, we interviewed OCR officials; reviewed case law
2We conferred with a number of experts on second-language learning, searched relevant education research databases, and reviewed the following National Research Council report: Diane August and Kenji Hakuta, eds., Improving Schooling for Language-Minority Children: A Research Agenda (Washington, D.C.: National Academy Press, 1997) to identify relevant studies that appeared to meet our criteria. Ultimately, we reviewed and analyzed 70 studies, program evaluations, and published articles concerning second-language learning and eliminated all but the three that met our criteria.
Page 4 GAO-01-226 Students With Limited English Proficiency

and OCR memos regarding students with limited English proficiency; reviewed one case related to students with limited English proficiency in each of five states: Colorado, California, Massachusetts, Michigan, and Texas;3 and surveyed all 293 school districts that had entered into corrective action agreements with OCR from 1992 through 1998 to provide services to students with limited English proficiency.4 Of these, 245 (84 percent) responded. Appendix I provides additional information about our methodology. We conducted our work between September 1999 and January 2001 in accordance with generally accepted government auditing standards.
Results in Brief No clear consensus exists on the length of time children with limited English proficiency need to become proficient in English. Several factors make it difficult to generalize about how much time is needed. First, the two main categories of instructional approaches used to teach children are designed to take different lengths of time, from 2 to 3 years for English-based approaches to much longer for approaches that make extensive use of a child’s native language. Second, no agreement exists about how proficiency should be defined or measured. Conversational skills may be developed within 2 years, while achieving broader academic proficiency, such as the ability to read or communicate abstract ideas at grade level, may take several years more.5 Third, even if there were agreement on instructional approaches and the meaning of proficiency, individual differences among children and their family situations make generalizations difficult. Finally, very few studies have focused specifically
3We chose these states to ensure that we included the greatest number of regional offices when selecting cases to review from the list you provided us of 15 cases in which you were interested.
4OCR began using its automated data system in 1992. When we began our study, the latest year for which we could obtain information was 1998.
5See, for example, James Cummins, “The Role of Primary Language Development in Promoting Educational Success for Language Minority Students,” Schooling and Language Minority Students: A Theoretical Framework, developed by the California State Department of Education, Office of Bilingual Bicultural Education (Los Angeles, Calif.: California State University, Evaluation, Dissemination, and Assessment Center); Kenji Hakuta, Yuko Goto Butler, and Daria Witt, “How Long Does It Take English Learners to Attain Proficiency?” Policy Report No. 2000-1 (Palo Alto, Calif.: University of California Linguistic Minority Research Institute, 1999); and Barry McLaughlin, Second-Language Acquisition in Childhood: Volume 2—School Age Children, 2nd ed. (Hillsdale, N.J.: Lawrence Erlbaum Associates, 1985).
Page 5 GAO-01-226 Students With Limited English Proficiency

on how long students need to attain English proficiency. Of the 70 studies we reviewed, only 3 both addressed this topic and met the other criteria for inclusion in our analysis.6 These three studies assessed students in English-based programs and found that it may take 4 to 8 years to develop the language skills needed to perform on a par with native English-speakers in all core academic subject areas (reading, language arts, social studies, science, and mathematics). However, some researchers have concluded that fewer years are needed.7
Of the two main instructional approaches, English-based instruction is more common than instruction in which a student’s native language is used (hereafter referred to as bilingual education). Three-fourths of the nation’s children with limited English proficiency attend schools where both instructional approaches are used. National data on the length of time students spend in language assistance programs are not available. However, we identified six states that collected such information at the state level. Taken together, most students in these six states spent 4 years or less in these programs; however, the proportion of students in the individual states spending 4 years or less in these programs varied from 46 to 90 percent.
In addition to the challenge of determining how best to meet the needs of children with limited English proficiency, school districts are also required to ensure that English-language instruction is adequate and to provide these children with equal educational opportunities, as required under title VI of the Civil Rights Act. OCR has adopted procedural requirements and criteria for judging the adequacy of local English-language instruction programs in meeting those needs. In three policy documents issued between 1970 and 1991, OCR set forth requirements that school districts must meet to pass a three-pronged test established by the courts. When the adequacy of local English-language instruction programs is questioned, OCR investigates, and, if problems are found, it enters into an agreement with the district specifying how the district will address the issues. Most
6To be included in our analysis, a study had to (1) focus on the length of time children need to become proficient in English, (2) reach specific conclusions about the length of time needed, (3) have English as the second language learned by the students, and (4) involve original research supported by published data.
7See, for example, Keith Baker, “What Bilingual Education Research Tells Us,” The Failure of Bilingual Education, Jorge Amselle, ed. (Washington, D.C.: Center for Equal Opportunity, 1996), and Christine H. Rossell and Keith Baker, Bilingual Education in Massachusetts: The Emperor Has No Clothes (Boston, Mass.: Pioneer Institute, 1996).
Page 6 GAO-01-226 Students With Limited English Proficiency

school districts that were involved in these agreements between 1992 and 1998 (77 percent) reported that in their interactions with OCR regional staff, OCR did not appear to favor any particular approach to English-language instruction or pressure the districts to adopt a particular approach. Moreover, they reported that OCR staff were generally courteous and attempted to minimize the disruptions to the districts’ operations resulting from their visits and inquiries. However, some school districts reported specific problems related to their interactions with OCR. The two most frequently reported problems were districts’ feeling pressure to change aspects of their programs not related to the instruction approach, such as the way they identify students in need of services, and untimely or inadequate communications by OCR with school districts. The districts also made suggestions for how OCR could improve its relations with school districts in areas such as minimizing data requests and being clear about when the period for monitoring the implementation of the corrective action plan would end. OCR headquarters officials have acknowledged that problems have occurred and have told us that some of the concerns identified by the districts have already been identified by OCR. These officials have presented us with a set of specific actions they are taking to address problem areas, such as working more collaboratively with school districts during investigations to alleviate pressure and limiting the amount of data they request from school districts.
Background States and localities play the principal role in educating all students, including those with limited English proficiency, with most states providing supplemental aid specifically to address the special needs of these students. According to a November 1997 report (the latest available) by the Institute for Research in English Acquisition and Development, 39 states have some form of regulations targeting these students, ranging from a mandate in Texas that school districts provide bilingual instruction in at least some grades to a mandate in California that school districts provide instruction only in English.
For the past 30 years, the federal government has served students with limited English proficiency primarily through title I of the Elementary and Secondary Education Act.8 The Bilingual Education Act, enacted in 1968, also serves a small percentage of these students under a supplemental
8Public Education: Title I Services Provided to Students With Limited English Proficiency (GAO/HEHS-00-25, Dec. 10, 1999).
Page 7 GAO-01-226 Students With Limited English Proficiency

grant program that assists local school districts in teaching students who do not know English. Other programs that may address, at least in part, the educational needs of children with limited English proficiency include the Emergency Immigrant Education Program, the Migrant Education Program, the Carl D. Perkins Vocational and Applied Technology Education Act programs, and the Individuals With Disabilities Education Act programs (see table 1). The only programs that serve primarily children with limited English proficiency are those associated with the Bilingual Education Act.
Table 1: Federal Education Programs That Can Provide Support Services to Students With Limited English Proficiency
aOther federal programs may also support services to students with limited English proficiency if these students qualify to receive services under the programs’ guidelines for participation.
Programa
FY 2000 funding (estimate)b Description
Education for Disadvantaged Children (title I, Elementary and Secondary Education Act)(20 U.S.C. 6300)
$8.7 billion Helps educationally disadvantaged children succeed in school. Students with limited English proficiency may participate in this program if they come from disadvantaged backgrounds and are at risk of failing in school or if they attend a school that has a schoolwide program.
Bilingual Education Act programs (instructional services, support services, training grants, and immigrant education)(20 U.S.C. 7401-91)c
248 million Helps ensure that students with limited English proficiency master English and develop high levels of academic attainment in content areas. Provides both state and local grants.
Emergency Immigrant Education Program(20 U.S.C. 7541-49)
150 million Provides grants to school districts with unexpectedly large increases in their student population due to immigration.
Migrant Education Program(20 U.S.C. 6391-99)
355 million Provides funds to states to help educate the children of migrant agricultural workers, including migratory fishers and dairy workers.
Carl D. Perkins Vocational and Applied Technology Education Act programs (basic state grants, Indian and Hawaiian natives set-aside, territorial set-asides, technical-preparation education, tribally controlled postsecondary vocational institutions, research, and National Occupational Information Coordination Committee)(20 U.S.C. 2301 et seq.)
1.5 billion Provides funds to improve the quality of vocational education and to provide access to vocational training to special populations, such as disadvantaged and disabled students.
Individuals With Disabilities Education Act programs (grants to states; preschool grants; grants for infants and families; state improvement, research, and innovation; technical assistance and dissemination; personnel preparation; parent information centers; and technology and media)(20 U.S.C. 1400 )
5.1 billion Supports special education for infants, toddlers, children, and youth with disabilities.
Page 8 GAO-01-226 Students With Limited English Proficiency

bBudget of the United States Government, Fiscal Year 2001 (Washington, D.C.: Government Printing Office, 2000).cThese are the only programs that target all their benefits to students with limited English proficiency.
Federal policy for ensuring equal educational opportunity for children with limited English proficiency has been largely shaped by title VI of the Civil Rights Act of 1964, the Equal Educational Opportunities Act (EEOA), and related court decisions. Title VI bans discrimination on the basis of race, color, or national origin in any program or activity receiving federal financial assistance. In Lau v. Nichols,9 the Supreme Court held that a school district’s failure to provide English-language instruction to non-English-speakers violated title VI.10 Like title VI, the EEOA also protects the civil rights of students with limited English proficiency. Under the EEOA, it is unlawful for an educational agency to fail to take “appropriate action to overcome language barriers that impede equal participation by its students in instructional programs.”11 In 1981, a federal court of appeals decision, Castaneda v. Pickard,12 created a test for evaluating the adequacy of a school district’s approach to addressing the needs of its non-English-speaking students and limited-English-speaking students.13 The Department of Education uses the test set forth in the Castaneda decision as the basis for determining whether a school district program for serving students with limited English proficiency is complying with title VI.
9414 U.S. 563 (1974).
10Because the case established children with limited English proficiency as a protected group under title VI, the investigations OCR conducts regarding the rights of children with limited English proficiency are frequently referred to as Lau investigations. In reaching its conclusion, the Supreme Court upheld a May 25, 1970, Department of Health, Education, and Welfare memorandum still used by OCR today.
1120 U.S.C. 1703.
12648 F.2d 989 (5th Cir. 1981) .
13The court created this test on the basis of language in the EEOA.
Page 9 GAO-01-226 Students With Limited English Proficiency

Headquartered in Washington, D.C., Education’s OCR has 12 regional offices that enforce title VI and other civil rights statutes.14 In the five cases we reviewed, OCR initiated investigations independently15 or after deciding that a complaint brought by an individual or group met certain criteria.16 To determine which school districts had potential problems with their programs and therefore warranted a compliance review, OCR gathered and analyzed statistical data and other information from state education agencies, advocacy groups, parents, and OCR surveys. Once OCR selected a school district for review, it requested data from the school district and, if necessary, conducted on-site visits to schools in the district. If OCR found a school district was not in compliance with civil rights laws, it worked with the district to negotiate an agreement on the problems and the steps required to address those problems (the corrective action plan). During the period in which OCR monitored the implementation of the corrective action plan, school districts periodically submitted information to OCR regarding their programs for children with limited English proficiency. Figure 1 shows the title VI investigative process used by OCR in the five cases we reviewed in depth.
14In addition to title VI, OCR enforces section 504 of the Rehabilitation Act of 1973, title II of the Americans With Disabilities Act of 1990, title IX of the Education Amendments of 1972, and the Age Discrimination Act of 1975.
15An investigation initiated by OCR is called a compliance review. A compliance review assesses whether a school district is in compliance with the requirements of title VI.
16According to the Investigation Procedures Manual, for OCR to begin an investigation, a complaint must contain the name and address of the complainant; identify the person or group injured by the alleged discrimination; identify the program or activity alleged to have discriminated; describe the discrimination in sufficient detail; say when it occurred; be in writing; and be signed. In addition, OCR must establish that the program or activity receives federal financial assistance and the type of discrimination alleged, and that the complaint is timely.
Page 10 GAO-01-226 Students With Limited English Proficiency

Figure 1: OCR Title VI Investigation Process in Five Cases Reviewed
Source: GAO analysis.
Page 11 GAO-01-226 Students With Limited English Proficiency

In November 1994, OCR changed the procedural guidance it followed from the Investigation Procedures Manual to the Case Resolution Manual. OCR officials told us that since about 1995 they have implemented a more cooperative approach to their reviews. Under this approach, OCR has focused on finding early resolutions to problems and working cooperatively throughout the process with school district and state officials. Also, under this approach, a letter of findings is issued only when problems remain unresolved.
Length of Time Needed for Proficiency Depends on Many Factors
No clear consensus exists among researchers and educators on the length of time needed for children with limited English proficiency to become proficient in English. Four factors make generalizations difficult: (1) differences in instructional approaches used to teach children English and the quality of that instruction, (2) differences in the ways states measure proficiency, (3) differences in student characteristics, and (4) the lack of definitive research on this issue.
Types of Language Assistance for Students With Limited English Proficiency Vary
Two basic approaches are used to instruct students with limited English skills. One uses English and makes little use of a student’s native language (English-based approach), while the other makes much more extensive use of a student’s native language, often for a number of years (bilingual approach). Proponents of an English-based approach expect children to learn English fairly quickly, in 2 to 3 years. For example, in Monroe County, Florida, one of the districts we visited, elementary school children with limited English proficiency receive all formal content area instruction in English, alongside their English-fluent peers. District officials told us they chose this English-based approach in part because they believe children learn English more quickly when they are immersed in it. On average, elementary school students enrolled in the district’s English-language acquisition programs receive services for 3 years.
The bilingual approach is designed to take much longer—often 5 years or more. While bilingual programs vary in both their goals and length, those programs that promote native-language literacy as well as English-language literacy may take 5 to 7 years to complete. For example, the San Antonio School District develops early literacy in Spanish, beginning with prekindergarten instruction. The program is designed to simultaneously develop English literacy, with a full transition to English-only instruction by the sixth grade. District officials said they believe it is important to develop bilingual citizens in a city that has a long bilingual tradition. Most of the
Page 12 GAO-01-226 Students With Limited English Proficiency

city’s population is Hispanic, and a large proportion of the city’s residents speak both Spanish and English.
The National Research Council has determined that there is “little value in conducting evaluations to conclude which type of program is best. The key issue is not finding a program that works for all children and all localities, but rather finding a set of program components that works for the children in the community of interest, given that community’s goals, demographics, and resources.”17
Whether a school district chooses an English-based or bilingual approach to teaching students with limited English proficiency, instructional quality will ultimately affect children’s academic achievement. Characteristics that contribute to high-quality programs, according to some educators, include adequately trained teachers, clearly articulated goals, systematic assessments, and opportunities for children to practice their English.18 In our site visits, for example, we visited one classroom in Cicero, Illinois, in which a bilingual education teacher who had been recruited from a Spanish-speaking country was using audiotapes to teach students English during the daily period dedicated to learning English. The students listened and followed along in their workbooks as a speaker on the tape read them a children’s story in English. There was no interaction between the teacher and the students. In contrast, in a Key West, Florida, classroom we visited, the bilingual education classroom teacher did not use audiotapes but instead read aloud a children’s story to his students. This teacher paused frequently to quiz the students on what they had heard. This activity not only gave the teacher an opportunity to see what his students understood of the story but also gave the students an opportunity to speak and practice English.
States Define Proficiency Differently
No clear consensus exists about how proficiency should be defined or measured. Educators and researchers have observed that children who speak little or no English may develop “verbal proficiency”—that is, conversational skills on a par with those of their English-speaking peers—
17August and Hakuta, eds., Improving Schooling for Language-Minority Children.
18Kenji Hakuta, Supplemental Declaration in Plaintiff’s Legal Brief Requesting Preliminary Injunction on Proposition 227, U.S. District Court, San Francisco, the Honorable Charles A. Legge presiding, July 15, 1998, and Charles Glenn, “Rethinking Bilingual Education,” Agenda for Leadership 1998, Gabriela Mrad, ed. (Boston, Mass.: Pioneer Institute, 1998).
Page 13 GAO-01-226 Students With Limited English Proficiency

in 2 years or less. Broader “academic proficiency,” such as the reading and communicating of abstract ideas required for grade-level academic performance, can take several more years to acquire.
Little agreement exists on an appropriate standard against which English proficiency should be measured. Some educators and language experts believe that a child should perform at age- or grade-appropriate levels in reading and other core academic subjects on standardized tests performed in English before the child can be considered English-proficient. This means that the child should score at or above the 50th percentile on a standardized achievement test.19 In contrast, some states consider students English-proficient when they score at the 40th percentile or even at the 32nd. Some critics question the validity of using these types of standardized achievement tests to measure whether a student’s achievement in English is better than, the same as, or worse than that of other children in his or her age group. These critics argue that a student’s performance on these tests does not necessarily reflect mastery or lack of mastery of certain English skills because the tests are designed to assess a student’s mastery of other subjects.
Performance on standardized achievement tests is just one of several criteria states and districts may use to determine if a child is proficient in English. We found that in Rockford, Illinois, officials combined the results of an academic achievement test, English proficiency tests, and an academic review conducted by school and district officials to determine a child’s English proficiency level. In contrast, we found that in Texas students could be considered proficient by scoring at or above the 40th
19However, students whose native language is English can also post scores that are below the cutoff score. For example, during our site visit, the deputy superintendent of the Denver Public Schools pointed out that 40 percent of his students did not score above the cutoff score (40 percent) set by the courts and used by OCR. He said that insofar as the students with limited English proficiency shared the characteristics of those low-performing native-English-speakers, they might never reach the required scores on the standardized tests. The deputy superintendent did not think students should be in bilingual classes “forever.”
Page 14 GAO-01-226 Students With Limited English Proficiency

percentile on both the English reading and language arts sections of a state-approved norm-referenced academic assessment.20
Time Needed to Attain Proficiency Can Vary With Student Characteristics
Research indicates that the length of time needed to become proficient in English can vary from child to child. It can be affected by such factors as the child’s age, socioeconomic background, and amount of formal schooling already received in another language. For example, a 1997 study concluded that the most striking feature about learning a second language is the variability in outcomes.21 A frequently cited factor is a child’s age. Older children generally make faster initial progress than very young children do. For example, a study of students with limited English proficiency attending school in Fairfax County, Virginia, found that students who arrived in this country between ages 8 and 11 needed 5 to 7 years to compete with native speakers in all subject areas, while children who arrived when they were aged 4 to 7 needed 7 to 10 years. Researchers have proposed that this difference perhaps reflects the fact that older learners have developed more sophisticated language and thinking skills before beginning to learn English.22 Educators have also observed that students with prior formal schooling and higher socioeconomic backgrounds tend to learn a second language more easily. Other characteristics tied to differences in success rates include the amount of exposure students have already had to English; the level of parental support they have at home; and their classroom, school, and community environments. Any of these factors could affect how long students need to catch up with native speakers.
20Norm-referenced academic assessments are constructed to yield a measure of relative performance of the individual or group by comparison with the performance of other individuals or groups taking the same test. For example, fourth-graders taking a mathematics test that has national norms would have their scores reported in terms of the scores of other fourth-graders who took that test, so their performance could be compared with that of fourth-graders nationally. In school year 2000-01, the list of approved assessments in Texas included the TerraNova (CTBS/5), the Iowa Test of Basic Skills, the Iowa Tests of Educational Development, the Metropolitan Achievement Test, and the Stanford Achievement Tests.
21August and Hakuta, eds., Improving Schooling for Language-Minority Children.
22Virginia Collier, “The Effect of Age on Acquisition of a Second Language for School,” New Focus (winter 1987-88).
Page 15 GAO-01-226 Students With Limited English Proficiency

Research on Time Needed to Attain Proficiency Is Not Definitive
While many evaluations of programs serving children with limited English proficiency have been conducted, we identified very few that focused specifically on the length of time students need to become proficient in English. Our review of existing research yielded three studies that met the following criteria: (1) they addressed the acquisition of English rather than other languages, (2) they focused specifically on the length of time required to become proficient, (3) they reached a specific conclusion about the length of time needed to become proficient in English (as described in app. I), and (4) they had been published. Two of these studies were carried out in Canada and one in the United States (see table 2). The students in each of these studies were schooled primarily in English. In general, the studies concluded that children with limited English proficiency need 4 years or more to develop the language skills needed to perform in academic subject areas on a par with native English-speakers. However, with so few studies available, the results should not be viewed as definitive,23 and other researchers in the field have challenged some of the results.24
23While children may require many years to achieve a degree of proficiency at which they can perform academically at age- and grade-appropriate levels, we are not implying that they will require targeted language assistance—either in English-based or native-language-based programs—in a classroom separate from their peers during this entire period of time. Some education experts have suggested that children may need language assistance for substantially less time than is needed to reach academic proficiency.
24See, for example, Keith Baker, “What Bilingual Education Research Tells Us,” and Christine H. Rossell and Keith Baker, Bilingual Education in Massachusetts.
Page 16 GAO-01-226 Students With Limited English Proficiency

Table 2: Studies of the Length of Time Children With Limited English Proficiency Need to Reach the Proficiency Levels of Native English-Speakers
aJames Cummins, “Age on Arrival and Immigrant Second Language Learning in Canada: A Reassessment,” Applied Linguistics, Vol. 11, No. 2 (summer 1981), pp. 132-49.bVirginia P. Collier, “Age and Rate of Acquisition of Second Language for Academic Purposes,” TESOL Quarterly, Vol. 21, No. 4 (1987), pp. 617-41, and Virginia P. Collier and Wayne P. Thomas, “How Quickly Can Immigrants Become Proficient in School English?” The Journal of Educational Issues of Language Minority Students, Vol. 5 (fall 1989), pp. 26-39.cHarold Klesmer, “Assessment and Teacher Perceptions of ESL Student Achievement,” English Quarterly, Vol. 26, No. 3 (spring 1994), pp. 8-11.
The three studies we identified examined students’ progress in English with respect to two different sets of skills. The two Canadian studies focused on language skills alone, examining the point at which students’ scores on tests of vocabulary, auditory perception, and other language skills approached those of native English-speakers. The Fairfax County study focused on students’ academic achievement in English, measuring the point at which students’ performance on tests in reading, mathematics, and other subjects, given in English, began to approach that of native-English-speaking students. The Fairfax study showed that children took longer to reach grade norms in reading than in other subjects. For example, even among the highest performing subgroup of children (those who arrived in this county between ages 8 and 11), the performance in different subject areas varied widely, averaging 2 years to reach national norms in mathematics, 3 years in language arts, and 5 years or more in reading.
Study Measure of proficiency
Length of time needed to reach proficiency levels of native English-speakers
Toronto (Canada) Board of Educationa
Grade-level norms on English vocabulary and language competency tests
At least 5 years
Fairfax County (Virginia) School Districtb
Grade-level norms on academic achievement tests in all areas (reading, language arts, social studies, science, and mathematics [given in English])
At least 4 to 8 years
North York (Canada) Board of Educationc
Age-level norms on tests measuring English speaking, listening, reading, and writing skills
At least 6 years
Page 17 GAO-01-226 Students With Limited English Proficiency

English-Based Approaches Predominate; In the Six States Reviewed, Most Children Receive Services for 4 Years or Less
English-based instruction is more commonly found in the nation’s public schools than bilingual instruction is. However, most students with limited English proficiency attend schools in which both approaches are used. In the six states we reviewed, most children received services for 4 years or less.
English-Based Approaches Are More Common Than Bilingual Approaches
More children with limited English proficiency receive instruction through an English-based approach than through an approach that makes use of their native language, according to data from the Department of Education’s most recent survey on the subject.25 About 76 percent of students with limited proficiency in English receive English-based instruction (such as English as a second language [ESL]); 40 percent receive bilingual instruction aimed at teaching subject matter in the student’s home language (such as teaching math in Spanish); and slightly fewer, 37 percent, receive instruction aimed at maintaining or improving fluency in their home language (such as Spanish language lessons for Spanish speakers.)26
The Education survey, which covered the 1993-94 school year, also asked schools about the types of instructional programs they offer and found that more schools offer English-based programs than bilingual programs. For example, about 85 percent of schools enrolling students with limited English proficiency offer ESL programs, and about 36 percent offer bilingual programs in which the student’s native language is used to varying degrees.27 Nearly three-fourths of all children with limited English
25U.S. Department of Education, National Center for Education Statistics, A Profile of Policies and Practices for Limited English Proficient Students: Screening Methods, Program Support, and Teacher Training (SASS 1993-94) (NCES 97-472) (Washington, D.C.: Department of Education, Jan. 1997).
26Percentages do not total 100 because students could, and often did, receive more than one type of instruction during a school day.
27Percentages do not total 100 because about one-third of all schools offer both ESL and bilingual programs.
Page 18 GAO-01-226 Students With Limited English Proficiency

proficiency attend schools with both types of programs. We visited 10 school districts in Arizona, Florida, Illinois, North Carolina, and Texas and found that 6 of the 10 used both English-based and bilingual instruction.
The survey also found that students often receive more than one type of instruction during a school day. For example, ESL is often a component of programs classified as bilingual education programs—that is, although explanations and some content areas may be taught in the student’s native language, ESL techniques may be used to teach English. However, the study’s data were not collected in a way that would allow accurate estimates of the proportion of students who received a combination of services.
Determining the type of instruction students actually receive is more complicated than these results would indicate for two reasons. First, the instructional approaches used to teach children with limited English proficiency are far more varied than the categories typically used to capture this information. For example, a program model called “structured immersion” uses simplified English to teach subject matter and sometimes allows for the teacher’s use of students’ native language for clarification. While clearly not a bilingual approach, some might classify this approach with English-based approaches, such as ESL; others might classify it as a distinct third approach that makes limited use of students’ native language. Second, the broad program labels used by educators may not reflect actual classroom practices. For example, in the Monroe School District, Florida, we observed a language arts class designed to teach ESL to Spanish-speaking students. Normally, such an approach would involve little or no use of Spanish. In this case, however, the teacher was not only specially trained to teach English language arts to speakers of other languages, but also fluent in Spanish. She provided instruction first in English and then translated much of that instruction into Spanish.
Page 19 GAO-01-226 Students With Limited English Proficiency

Most Children in the Six States Reviewed Spend 4 Years or Less in Programs Aimed at Increasing English Proficiency
We found no national data on the length of time children with limited English proficiency actually spend in programs aimed at helping them become proficient in English. Thus, we contacted education agencies in 12 states with substantial concentrations of students with limited English proficiency to collect any available state-level data on this issue.28 Of the 12 states contacted, 6 had information on the length of time children with limited English proficiency spent in language assistance programs. Data from these six states—Arizona, Florida, Illinois, New Jersey, Texas, and Washington—indicate that in 1998-99 (the latest year for which data are available), the majority of children with limited English proficiency who made the transition from English-language programs spent 4 years or less in language assistance programs.29 As table 3 shows, at least two-thirds of the children in Florida, Illinois, New Jersey, and Washington made the transition from programs within 4 years. In Arizona and Texas, the portion that made the transition within 4 years was lower: closer to one-half. In five states, 12 percent or fewer of the children were out within 1 year. In the sixth state—New Jersey—about one-third exited within 1 year. At the other end of the scale, 10 percent of the students with limited English proficiency in New Jersey spent 5 years or more in programs, while 41 percent of such students in Arizona spent more than 5 years.
28Alaska, Arizona, California, Florida, Illinois, Massachusetts, Nevada, New Jersey, New Mexico, New York, Texas, and Washington.
29“Making the transition” generally means that these children met the program’s criteria for proficiency.
Page 20 GAO-01-226 Students With Limited English Proficiency

Table 3: Amount of Time Spent in English Proficiency Programs by Students Who Made the Transition From Such Programs in 1998-99
aPercentages are cumulative.bAppendix II contains data for Arizona students receiving language assistance services for as long as 13 years.cAppendix II contains additional analyses of years of participation in language assistance programs by type of program (bilingual or ESL).dTen percent of New Jersey students with limited English proficiency who exited a program in school year 1998-99 had been enrolled in language assistance programs for 5 years or more. The percentage of students staying 5 years or less cannot be determined. eData are based on a 5-year study of children with limited English proficiency enrolled in Texas public schools between 1992-93 and 1996-97. The percentage of students staying beyond 5 years cannot be determined.fThese percentages include students who graduated from high school but may not have met program exit criteria.gWashington reported that 14 percent of students spent more than 5 years in the program. These percentages do not total 100 because of rounding.
California, with about 40 percent of the nation’s students with limited English proficiency in 1996-97,30 did not have statewide data that could be used to determine how long children were spending in its programs. To provide an indication of what was happening there, we obtained data from four large school districts with large numbers of students with limited English proficiency: Los Angeles, San Francisco, Santa Ana, and San Diego (see table 4).
State
Percentagea of students who spent . . .
1 year orless
2 years orless
3 years orless
4 yearsor less
5 years orless
Arizona 12.0 24.0 36.0 49.0 59.0b
Florida 10.0 23.0 39.0 66.0 79.0
Illinoisc 0.1 23.0 40.0 67.0 86.0
New Jersey 29.0 57.0 78.0 90.0 d
Texas 10.0 21.0 37.0 57.0 e
Washingtonf 17.0 36.0 57.0 77.0 87.0g
30Reynaldo F. Macias, Summary Report of the Survey of the States’ Limited English Proficient Students and Available Educational Program and Services (Washington, D.C.: National Clearinghouse for Bilingual Education, George Washington University, 1998).
Page 21 GAO-01-226 Students With Limited English Proficiency

Table 4: Amount of Time Spent in English Proficiency Programs by More Than Half the Students Making the Transition From Such Programs in Selected California School Districts, 1998-99
aData are for school year 1999-2000.
Because of the limited number of states and school districts from which the data were drawn, these results should be interpreted cautiously. Differences in the way these states and school districts define proficiency for exiting such programs, as well as the types of tests used to measure proficiency, make direct comparisons across states and districts nearly impossible. In addition, districts may also decide on their own whether to apply additional criteria beyond the requirements set by their states. Moreover, in June 1998, California passed Proposition 227, mandating English-based instruction in California public schools (although waivers have been granted under this system, and bilingual programs still operate in some California public schools). This new requirement may have an impact on future data coming from these districts.
As school districts address the various challenges associated with meeting the educational needs of children with limited English proficiency, districts are also required to provide these children equal educational opportunities under title VI of the Civil Rights Act. We now focus on the requirements that Education’s OCR expects school districts to meet and how OCR interacted with school districts whose language assistance programs it investigated from 1992 to 1998.
OCR’s Interactions With School Districts Were Generally Positive; Some Specific Problems Reported
During the 6 years covered by our review, OCR relied on the three policy documents regarding children with limited English proficiency discussed below. These documents incorporate the Castaneda decision’s three-pronged test for assessing the adequacy of programs for students with limited English proficiency to determine whether school districts are in
District Time spent
Los Angeles 5 years or more
San Francisco 5 years or less
Santa Anaa 5 years or less
San Diego 7 years or more
Page 22 GAO-01-226 Students With Limited English Proficiency

compliance with title VI.31 OCR did not promulgate Castaneda’s requirements as regulations, instead setting them forth in policy documents.32 OCR used compliance reviews to monitor school districts’ compliance with these requirements. School districts that were found out of compliance with the title VI requirements were required to enter into negotiated agreements with OCR to correct their programs for students with limited English proficiency.
Our survey and case reviews of school districts involved in negotiated agreements resulting from OCR’s compliance reviews between 1992 and 1998 revealed that the interaction between OCR and school districts has been generally positive. A majority of districts indicated that OCR regional staff did not favor, or pressure them to adopt, a particular language approach, and almost all of the 245 respondents indicated that OCR was courteous and minimized disruption of daily activities when visiting school districts. However, some school officials reported problems in their interactions with OCR, most frequently related to feeling pressured to change aspects of their programs not related to the language approach used and to OCR’s untimely or inadequate communication with school districts.
OCR’s Title VI Requirements Are Set Forth in Three Policy Documents
Castaneda set forth a three-part test for determining whether a school district has adopted a satisfactory method for teaching children with limited English proficiency. The federal courts and OCR now generally accept this test as a threshold for determining compliance with title VI. The test is based on a combination of education theory, practice, and results and requires that school district programs (1) be based on sound educational principles, (2) effectively implement the educational principles, and (3) have succeeded in alleviating language barriers.
OCR requirements for title VI compliance are articulated through three policy documents known as the May 1970 memorandum, the December
31As of December 2000, OCR was still using this test.
32OCR officials said that they disseminated information about a school district’s requirements for serving students with limited English proficiency through workshops, conferences, meeting with state agencies, written materials, and technical assistance activities. In December 1999, OCR made available another resource for understanding title VI requirements—Programs for English Language Learners: Resource Materials for Planning and Self Assessments—available on the Internet at http://www.ed.gov/ocr/ELL.
Page 23 GAO-01-226 Students With Limited English Proficiency

1985 memorandum, and the September 1991 policy update. The May 1970 memorandum required school districts to meet four basic criteria for title VI compliance:
• districts must take “affirmative steps” to rectify the language deficiency of students with limited English proficiency;
• students may not be designated as academically deficient on the basis of English language skills;
• the school system’s tracking system for students with limited English proficiency must be designed to meet their needs as soon as possible, and it must not work to lock students into a particular curriculum; and
• schools must notify parents of school activities in a language they can understand.
The second document, the December 1985 memorandum, stipulates that OCR does not require schools to adopt any particular educational or language-teaching approach and that OCR will determine title VI compliance on a case-by-case basis. Any sound educational approach that ensures the effective participation of students with limited English proficiency is acceptable. The December memorandum also outlines steps OCR staff should take to determine whether there is a need for an alternative language program for students with limited English proficiency and whether the district’s program is adequate for meeting the needs of these students.
The September 1991 policy update provides additional guidance for applying the May 1970 and December 1985 memorandums. The 1991 document describes the legal standard set forth by the court in Castaneda and therefore contains more specific standards for staffing requirements, criteria for student completion of language assistance programs, and program evaluation. Policy issues related to access to special education programs and gifted/talented programs, as well as OCR’s policy with regard to segregation of students with limited English proficiency, are also highlighted in this update.
OCR Staff Generally Did Not Pressure Districts to Adopt a Bilingual Approach and Were Courteous and Professional
Over three-fourths of the school districts responding to our survey (77 percent) reported that when investigating cases OCR staff did not appear to favor bilingual instruction over English-based instruction. For example, one school district noted that OCR staff made no mention of bilingual instruction as a recommendation, but rather they emphasized meeting the needs of students with limited English proficiency. But three districts felt
Page 24 GAO-01-226 Students With Limited English Proficiency

pressure to increase emphasis on bilingual instruction.33 While most school districts indicated that OCR appeared to be neutral regarding instructional approach, about 18 percent reported OCR favored the bilingual approach and about 4 percent reported that OCR favored English-based instruction (see fig. 2). The 38 districts that reported that OCR favored bilingual education were located in every OCR region except for Region 6 (the District of Columbia regional office). More than half of these districts had cases that were handled by either the San Francisco or Denver regional office, two regions that serve almost half the students with limited English proficiency. (See app. III for more detailed information on the cases related to students with limited English proficiency by district, the percentage of students in each of the regions, and the districts’ views about whether OCR favored a particular approach.)
33Two districts in California that had both bilingual and English-only programs before the OCR investigation reported that they felt pressure to increase emphasis on the bilingual approach. One district in Oklahoma that had an English-only program before the OCR investigation felt pressure to add bilingual instruction to its program.
Page 25 GAO-01-226 Students With Limited English Proficiency

Figure 2: The Majority of School Districts Reported OCR Favored No Particular Type of Language Program
In addition, in the school districts investigated by OCR, the kind of program offered after the corrective action plan had been implemented changed little. Further, some school district officials indicated that OCR did not influence the type of language assistance program implemented. Figure 3 shows the distribution of the instructional approaches school districts offered before and after OCR investigation. (See app. IV for further details.)
0
10
20
30
40
50
60
70
80
OtherEnglish-BasedBilingualNo ParticularType
77
18
41
Percentage
Type of Language Program Favored by OCR
Page 26 GAO-01-226 Students With Limited English Proficiency

Figure 3: Type of Language Program in School Districts Before and After OCR Investigation
Overall, school districts reported that their interactions with OCR staff during investigations were positive in three areas: courtesy, minimization of disruption of daily activities, and consideration of the rationale for the school district’s existing program (see fig. 4).
0
10
20
30
40
50
60
BilingualEnglish-BasedEnglish-Basedand Bilingual
52 53
4240
4 5
Before OCR Investigation
After OCR Investigation
Percentage
Type of Program
Page 27 GAO-01-226 Students With Limited English Proficiency

Figure 4: School Districts’ Characterizations of Interactions With OCR
In comments written on their questionnaires, 13 school districts reported that services to students with limited English proficiency had improved as a result of OCR’s investigation. For example, one respondent indicated that OCR had pointed out identification and assessment procedures that the school district had not previously implemented, and that, as a result of the OCR investigation, improved procedures were adopted. In addition, some respondents called OCR’s approach “collaborative” or “professional.” Similarly, during our site visits, officials in two school districts noted that their interactions with OCR staff were positive. For example, one superintendent said that OCR staff were very professional, the goal of both OCR staff and school officials during the investigation was to meet the needs of students with limited English proficiency, and the students had benefited from OCR’s assistance. In another school district, officials told us that OCR staff were pleasant and cordial and that they showed an interest in how the district was delivering alternative language services to children with limited English proficiency.
0
10
20
30
40
50
60
70
80
90
100
ConsideringRationale
MinimizingDisruption
BeingCourteous
Percentage
Very Good/Good Poor/Very Poor
Dimensions of Interactions
89
4
81
5
75
5
Page 28 GAO-01-226 Students With Limited English Proficiency

Some School Districts Reported Problems With OCR’s Investigation
As part of our survey, we gave school district officials the opportunity to make suggestions on how OCR could improve its investigation procedures and to offer any additional comments about OCR’s investigation of their school district. Of the 245 questionnaires returned by school districts, almost half (47 percent) contained comments on what OCR could do to be more effective or improve its investigative process, and over half (53 percent) made additional comments about OCR’s investigation of their school district. Although district officials generally reported positive interactions between their school district and OCR, some respondents commented on the types of problems they encountered during OCR’s investigation process. We sorted these problems into seven categories and have listed them in table 5 in descending order of the frequency of the comments. Several of the problems reported in the survey comments also surfaced in our case investigations.
Table 5: Types of Problems Districts Reported in OCR’s Investigation Process
Problem type
Number ofdistricts
reportingproblem Specific example cited
OCR “applied pressure.” 50 OCR told districts that federal funds would be taken away if districts did not comply with OCR’s recommendations, used attorneys in negotiations, and was inflexible during negotiations with school districts.
OCR’s communications were untimely or inadequate.
40 OCR did not provide enough feedback on data and reports submitted; several districts reported that OCR took as long as a year to give districts feedback on data and reports.
Districts lacked sufficient resources to address problems.
26 Several districts commented that they were unable to successfully recruit qualified bilingual teachers, particularly in rural areas.
OCR made burdensome data requests.
22 One official reported that it took over 600 staff-hours to collect the data requested by OCR.
OCR investigators lacked educational expertise in a variety of areas.
20 OCR teams were not knowledgeable in language instruction or acquisition, state bilingual mandates, bilingual program operations, or school district operations.
OCR was not clear enough about case closure practices.
20 OCR was not clear about when and under what circumstances it would close a district’s case.
State and federal requirements differed.
17 Districts in California, Illinois, Indiana, Massachusetts, Michigan, New Jersey, New Mexico, Texas, and Washington cited examples suggesting that conflicts existed between state and federal requirements and that the lack of coordination between OCR and state agencies had been problematic for the district.
Page 29 GAO-01-226 Students With Limited English Proficiency

Some districts suggested that OCR could address some of these issues by ensuring that communications were timely, providing more feedback in response to submitted reports, understanding the constraints within which districts have to operate, attempting to minimize paperwork requirements, including educators on OCR’s investigative teams, and being clear about when the monitoring period would end and the case would be closed. In addition, some districts suggested that OCR should work more closely with state education agencies and involve the state in the early stages of the investigations to deal with situations in which state guidance differs from federal guidance on meeting the needs of students with limited English proficiency.
We asked OCR headquarters officials to respond to the problems school districts identified. In doing so, OCR headquarters officials indicated that OCR had also identified some of the issues and that it, in conjunction with regional office staff, was already taking the following steps to address them (see table 6).
Table 6: OCR Headquarters Responses to Problems Identified by the School Districts
Problem type OCR response
OCR “applied pressure.” Although OCR is increasingly working in collaboration with school districts and reviews are now partnership-oriented, it is still OCR’s responsibility to ensure that school districts comply with the law.
OCR’s communications were untimely or inadequate.
OCR examines how long cases are taking to resolve and works with the field offices to correct problems if cases are not being resolved in a timely manner. Also, OCR now maintains closer contact with school districts during the investigation and the monitoring period, as required in the Case Resolution Manual.
Districts lacked sufficient resources to address problems.
Serving students with limited English proficiency takes time and costs money. OCR attempts to be flexible with school districts. For example, in the negotiated agreements, OCR gives school districts time to hire the necessary qualified teachers. In some cases, OCR has worked with universities to put teacher-training programs into place; it has also worked to increase certification opportunities for teachers.
OCR made burdensome data requests.
OCR is refining its approach to data requests. Having moved to the Case Resolution Manual, OCR’s emphasis is now on resolving compliance issues in partnership with school districts instead of on making findings. This often results in less burdensome data requests.
OCR investigators lacked educational expertise in a variety of areas.
OCR is addressing this issue through conferences for OCR enforcement staff. OCR has established employee groups organized by subject matter to discuss policy and legal decisions related to students with limited English proficiency. Through these groups, guest speakers and other resources are now readily available. In addition, the Lau Articulation Project produced a list of educational resources that OCR enforcement staff use.
OCR was not clear enough about case closure practices.
Although negotiated agreements do not specify when the monitoring period will end, the agreements discuss evaluation expectations. OCR is working on building appropriate evaluation measures into the agreements. OCR is also holding discussions with school districts to identify those that are successful in helping students with limited English proficiency and to share their practices with other school districts.
Page 30 GAO-01-226 Students With Limited English Proficiency

Concluding Observations
Policymakers are faced with particularly difficult decisions with regard to students with limited English proficiency because their needs are varied and experts disagree about the best methods to teach them. Moreover, there is no clear time line for acquiring English proficiency. Even though different approaches to English language instruction may be effective, many variables may influence the choice of program used by a school, such as the percentage of students with limited English proficiency, the number of languages spoken by students, and students’ family backgrounds. As a result, local decisions about the amount of time needed to attain proficiency and the amount of language support that should be provided may differ.
Available research does not definitively indicate the best teaching methods to use or the amount of time support should be provided. However, guidance from OCR provides the framework and standards that school districts must meet to ensure that students with limited English proficiency have a meaningful opportunity to participate in public education. School districts have the flexibility to select methods of instruction that they deem will produce the best results for their students, so long as they meet OCR requirements.
We found that when OCR followed up on complaints or engaged in compliance reviews, for the most part, it worked effectively with districts. Moreover, few districts changed their approach to teaching students with limited English proficiency after OCR investigations. There have been some problems, however, with OCR’s working relationships with districts, which OCR acknowledges and is taking steps to improve.
Agency Comments In commenting on a draft of this report, the Department of Education generally agreed with its findings and said it was particularly gratified by the survey results (see app. V). Education also provided technical comments, which we incorporated as appropriate.
State and federal requirements differed.
Where federal and state requirements differ for students with limited English proficiency, OCR staff discuss the issues with state education officials. Also, state education officials accompany OCR staff on some reviews.
(Continued From Previous Page)
Problem type OCR response
Page 31 GAO-01-226 Students With Limited English Proficiency

We are sending copies of this report to the Honorable Roderick R. Paige, Secretary of Education; appropriate congressional committees; and other interested parties. We will also make copies available to others upon request.
If you or your staff have any questions about this report, please call me on (202) 512-7215. Other GAO contacts and staff acknowledgments are listed in appendix VI.
Marnie S. ShaulDirector, Education, Workforce,
and Income Security Issues
Page 32 GAO-01-226 Students With Limited English Proficiency

Page 33 GAO-01-226 Students With Limited English Proficiency

Appendix I
AppendixesScope and Methodology Appendix I
To determine how long students with limited English proficiency need to become proficient in English, we identified potential studies for review and selected studies that met four criteria. To ensure quality and relevance, the study had to (1) focus on the length of time children need to become proficient in English, (2) reach a specific conclusion about the length of time, (3) have English as the second language learned by the students, and (4) involve original research supported by published data.
We identified potential studies for review by searching two national databases for information on second-language learning—the National Clearinghouse for Bilingual Education (Department of Education) and the National Educational Resources Information Center (ERIC)—and by contacting experts to obtain both their recommendations on research regarding second-language learning and information on any research they might have conducted on second-language learning. We contacted the following.
• Mr. Jorge Amselle, Executive Director, Center for Equal Opportunity, Washington, D.C.
• Dr. Keith Baker, Education Consultant• Dr. James Cummins, Ontario Institute for Studies in Education• Dr. Russell Gersten, University of Oregon• Dr. Kenji Hakuta, Stanford University• Dr. Stephen Krashen, University of Southern California• Dr. Rosalie Porter, Editor, READ Perspectives• Dr. Christine Rossell, Boston University• Dr. J. David Ramirez, California State University Long Beach
We also reviewed research summaries, including Improving Schooling for Language-Minority Children: A Research Agenda, by the National Research Council, National Academy of Sciences (1997). We also used the bibliographies of all the studies we identified and reviewed to obtain additional relevant research. From these efforts, we obtained over 70
Page 34 GAO-01-226 Students With Limited English Proficiency

Appendix I
Scope and Methodology
published articles and other reports that appeared relevant and reviewed each of them. Only three met all four of our selection criteria.1
To determine what approaches are used to teach children with limited English proficiency, we reviewed the literature, spoke with experts, and reviewed the results of survey data collected by the Department of Education.2 We also obtained information on the approaches used in 10 school districts we visited in Arizona, Florida, Illinois, North Carolina, and Texas—states with large or growing populations of students with limited English proficiency. To determine how long students remained in language assistance programs, because national data are not available, we contacted 12 states in spring 2000, each with over 40,000 students who have limited English proficiency or with populations of such students constituting over 9 percent of the student population (that is, states with substantial concentrations of students with limited English proficiency): Alaska, Arizona, California, Florida, Illinois, Massachusetts, Nevada, New Jersey, New Mexico, New York, Texas, and Washington. We obtained state-level data from the six states that had such data: Arizona, Florida, Illinois, New Jersey, Texas, and Washington. Although no state data were available for California, we did obtain data from four districts in that state: Los Angeles, San Francisco, and San Diego for school year 1998-99 and Santa Ana for school year 1999-2000 (the only data available).
To determine the requirements for children with limited English proficiency that the Department of Education's Office for Civil Rights (OCR) expects school districts to meet and how they are set forth, we interviewed OCR officials, searched the Education Web site, and reviewed OCR policy documents and case law regarding students with limited English proficiency. To determine the nature of the interactions between OCR and school districts in those instances in which OCR has entered into an agreement with the school district concerning language assistance
1James Cummings, “Age on Arrival and Immigrant Second Language Learning in Canada: A Reassessment,” Applied Linguistics, Vol. 11, No. 2 (summer 1981); Virginia P. Collier, “Age and Rate of Acquisition of Second Language for Academic Purposes,” TESOL Quarterly; Virginia P. Collier and Wayne P. Thomas, “How Quickly Can Immigrants Become Proficient in School English?” The Journal of Educational Issues of Language Minority Students; and Harold Klesmer, “Assessment and Teacher Perceptions of ESL Student Achievement,” English Quarterly.
2Department of Education, National Center for Education Statistics, A Profile of Policies and Practices for Limited English Proficient Students: Screening Methods, Program Support, and Teacher Training (SASS 1993-94).
Page 35 GAO-01-226 Students With Limited English Proficiency

Appendix I
Scope and Methodology
programs, we investigated 5 of the 15 cases suggested by your staff in California, Colorado, Massachusetts, Michigan, and Texas. We also surveyed 293 school districts listed by OCR as having entered into corrective action agreements with OCR for providing services to students with limited English proficiency from 1992 through 1998. Of the 293, 245 responded (84 percent). We also reviewed the transcripts of three congressional hearings before the Subcommittee on Early Childhood, Youth, and Families of the Committee on Education and the Workforce:
• Bilingual Education Reform, San Diego, Calif., February 18, 1998. Serial No. 105-75
• Reforming Bilingual Education, Washington, D.C., April 30, 1998. Serial No. 105-101
• The Review and Oversight of the Department of Education's Office for Civil Rights, Washington, D.C., June 22, 1999. Serial No. 106-49
We also contacted Mr. James M. Littlejohn of Jim Littlejohn Consulting, The Sea Ranch, California. Mr. Littlejohn worked for OCR for 27 years. From 1981 to 1993, he was policy director of OCR in Washington and, according to the director of the Denver Regional Office, during the years covered by our study, Mr. Littlejohn trained most of the OCR investigators in how to properly conduct a Lau investigation (those title VI investigations related to children with limited English proficiency). He retired from OCR in 1996 and now works as a consultant to school systems around the country and on several federal court cases involving bilingual education. Mr. Littlejohn was a key information source for the Committee, testifying and providing key analyses.3
3Jim Littlejohn, Federal Control Out of Control: The Office for Civil Rights' Hidden Policies on Bilingual Education (Washington, D.C.: Center for Equal Opportunity, Nov. 1998).
Page 36 GAO-01-226 Students With Limited English Proficiency

Appendix II
Data on Number of Years Students Received Language Services in Arizona and Illinois Appendix II
Arizona was the only state we reviewed that had detailed breakdowns by year on how long students who had received bilingual or English-as-a-second-language (ESL) services did so before making the transition out of these services (see table 7).
Table 7: Students Who Were Reclassified Because They Had Achieved “Fluent English Proficiency” in Arizona, 1998-99
Source: Report of the superintendent of public instruction to the Arizona legislature: English Acquisition Services: A Summary of Bilingual and English as a Second Language Programs for School Year 1998–99.
Years students received ESLor bilingual services
Cumulative percentage of studentsachieving English proficiency
1 11.8
2 23.6
3 36.4
4 48.8
5 59.2
6 67.8
7 75.7
8 81.0
9 86.1
10 92.8
11 96.4
12 98.4
13 100.0
Page 37 GAO-01-226 Students With Limited English Proficiency

Appendix II
Data on Number of Years Students Received
Language Services in Arizona and Illinois
Illinois was the only state that had data broken down by type of program (ESL or bilingual) (see table 8).
Table 8: Transitioned Students' Years of Participation by Program Type and Location in Illinois, FY1999
aIn Illinois these programs are called Transitional Programs of Instruction.bPercentages were calculated on the basis of the total number of students who made the transition out of services (15,778).
Source: Illinois State Board of Education.
Years in program
Transitional bilingual education programs ESL programsa
Chicago Rest of the state Chicago Rest of the state
Number Percentageb Number Percentageb Number Percentageb Number Percentageb
Less than 1 132 0.84 434 2.75 40 0.25 623 3.95
1 to 2 600 3.8 623 3.95 100 0.63 1,015 6.43
2 to 3 1,030 6.53 677 4.29 217 1.38 844 5.35
3 or more 6,211 39.36 1,669 10.58 537 3.40 1,026 6.5
Total 7,973 3,403 894 3,508
Page 38 GAO-01-226 Students With Limited English Proficiency

Appendix III
School Districts' Impressions of Whether OCR Conveyed Preferences for Type of Language Instruction Appendix III
We asked school district officials to answer the following question: “Did OCR staff, as a whole, convey the impression that they favored English-only instruction, they favored bilingual education, they favored another language program, or they were neutral on the question?”
Of the 225 districts responding, 77 percent replied that OCR did not convey an impression that it favored any particular type of instruction. However, 23 percent indicated that OCR did convey a preference:
• 18 percent indicated that, in their opinion, OCR favored bilingual education;
• 4 percent indicated that, in their opinion, OCR favored English-only instruction; and
• 1 percent indicated that, in their opinion, OCR favored another type of language program. (See table 9.)
Page 39 GAO-01-226 Students With Limited English Proficiency

Appendix III
School Districts' Impressions of Whether
OCR Conveyed Preferences for Type of
Language Instruction
Table 9: Most School Districts Reported OCR Favored No Particular Type of Language Program
Regional percentage of national total of students with limited English proficiency School district
Did OCR staff as a whole, convey the impression that they ...
FavoredEnglish-only
education?
Favoredbilingual
education?
Favoredanother
languageprogram?
Were neutral onthe question?
OCR's Region 1—Boston
2.3 Bristol School District, CT X
Danbury School District, CT X
East Hartford School District, CT X
New Britain School District, CT X
Stratford School District, CT X
West Hartford School District, CT X
Lowell School District, MA X
Quincy School District, MA X
Revere School District, MA X
Somerville School District, MA X
Manchester School District, NH X
Pawtucket School District, RI X
Providence School District, RI X
Woonsocket School District, RI X
OCR's Region 2—New York
7.9 Atlantic City, NJ X
Linden City, NJ X
Newark City, NJ X
Passaic City, NJ X
Brentwood Unified School District, NY X
Mineola Unified School District, NY X
Ossining Unified School District, NY X
Port Chester-Rye Unified School District, NY X
Westbury Unified School District, NY X
OCR's Region 3—Philadelphia
2.0 Jefferson County, KY X
Avon Grove School District, PA X
Central York School District, PA X
Gettysburg Area School District, PA X
Page 40 GAO-01-226 Students With Limited English Proficiency

Appendix III
School Districts' Impressions of Whether
OCR Conveyed Preferences for Type of
Language Instruction
Neshaminy School District, PA X
Upper Adams School District, PA X
West York Area School District, PA X
OCR's Region 4—Atlanta
8.2 DeKalb County School District, GA X
Gwinnett County School District, GA X
Aiken County School District, SC X
Beaufort County School District, SC X
Charleston County School District,SC X
Greenville County School District, SC X
Pickens County School District, SC X
Richland School District 01, SC X
Nashville-Davidson County School District, TN X
Rutherford County School District, TN X
Shelby County School District, TN X
OCR's Region 5—Dallas
16.3 Orleans Parish School Board, LA X
DeSoto County School District, MS X
Blackwell, OK X
Oklahoma City, OK X
Stillwater, OK X
Anna Independent School District, TX X
Corpus Christi Independent School District, TX X
Donna Independent School District, TX X
Fort Worth Independent School District, TX X
Lubbock Independent School District, TX X
McAllen Independent School District, TX X
(Continued From Previous Page)
Regional percentage of national total of students with limited English proficiency School district
Did OCR staff as a whole, convey the impression that they ...
FavoredEnglish-only
education?
Favoredbilingual
education?
Favoredanother
languageprogram?
Were neutral onthe question?
Page 41 GAO-01-226 Students With Limited English Proficiency

Appendix III
School Districts' Impressions of Whether
OCR Conveyed Preferences for Type of
Language Instruction
OCR's Region 6—Washington, D.C.
1.0 District of Columbia Public Schools, DC X
Harnett County Schools, NC X
Yadkin County Schools, NC X
OCR's Region 7—Chicago
5.6 Aurora East Unit School District 1, IL X
School District 46, IL X
School City of East Chicago, IN X
Elkhart Community Schools, IN X
Fort Wayne Community Schools, IN X
Gary Community School Corp., IN X
School City of Hobart, IN X
Indianapolis Public Schools, IN X
Lake Station Community School, IN X
MSD Lawrence Township, IN X
Merrillville Community School, IN X
MSD Perry Township, IN X
MSD Pike Township, IN X
River Forest Community School County, IN X
South Bend Community School Corp., IN X
MSD Warren Township, IN X
MSD Washington Township, IN X
Whiting School City, IN X
Faribault, MN X
Willmar, MN X
Racine School District, WI X
(Continued From Previous Page)
Regional percentage of national total of students with limited English proficiency School district
Did OCR staff as a whole, convey the impression that they ...
FavoredEnglish-only
education?
Favoredbilingual
education?
Favoredanother
languageprogram?
Were neutral onthe question?
Page 42 GAO-01-226 Students With Limited English Proficiency

Appendix III
School Districts' Impressions of Whether
OCR Conveyed Preferences for Type of
Language Instruction
OCR's Region 8—Cleveland
1.4 Bloomfield Hills School District, MI X
Capac Community School District, MI X
Dearborn City School District, MI X
East Lansing School District, MI X
Farmington Public School District, MI X
Ferndale Public Schools, MI X
Flint City School District, MI X
Hazel Park City School District, MI X
Oak Park City School District, MI X
Pontiac City School District, MI X
School District City of Royal Oak, MI X
Southfield Public School District, MI X
Troy School District, MI X
Walled Lake Consolidated School District, MI X
West Bloomfield School District, MI X
South-Western City School District, OH X
OCR's Region 9—Kansas City
1.5Columbus Community School District, IA X
Des Moines Independent Community School District, IA X
Muscatine Community School District, IA X
South Tama County Community School District, IA X
Storm Lake Community School District, IA X
Washington Community School District, IA X
West Liberty Community School District, IA X
Dodge City, KS X
(Continued From Previous Page)
Regional percentage of national total of students with limited English proficiency School district
Did OCR staff as a whole, convey the impression that they ...
FavoredEnglish-only
education?
Favoredbilingual
education?
Favoredanother
languageprogram?
Were neutral onthe question?
Page 43 GAO-01-226 Students With Limited English Proficiency

Appendix III
School Districts' Impressions of Whether
OCR Conveyed Preferences for Type of
Language Instruction
Emporia, KS X
Garden City, KS X
Holcomb, KS X
Junction City, KS X
Kansas City, KS X
Kismet-Plains, KS X
Liberal, KS X
Shawnee Mission Public Schools, KS X
Wichita, KS X
Winfield, KS X
McDonald County R-1, MO X
University City, MO X
Lincoln Public Schools, NE X
Grand Island Public Schools, NE X
Madison Public Schools, NE X
Mitchell Public Schools, NE X
Scottsbluff Public Schools, NE X
South Sioux City Public Schools, NE X
Hill City 51-2, SD X
OCR's Region 10—Denver
7.5 Nogales Unified District, AZ X
Washington Elementary District, AZ X
Yuma Elementary District, AZ X
Alamos RE-11J, CO X
Brighton 27J, CO X
Brush RE-2(J), CO X
Colorado Springs 11, CO X
Durango 9-R, CO X
Gilcrest RE-1, CO X
Ignacio 11JT, CO X
Johnstown-Milliken RE-5J, CO X
Lamar RE-2, CO X
Mesa County Valley 51, CO X
(Continued From Previous Page)
Regional percentage of national total of students with limited English proficiency School district
Did OCR staff as a whole, convey the impression that they ...
FavoredEnglish-only
education?
Favoredbilingual
education?
Favoredanother
languageprogram?
Were neutral onthe question?
Page 44 GAO-01-226 Students With Limited English Proficiency

Appendix III
School Districts' Impressions of Whether
OCR Conveyed Preferences for Type of
Language Instruction
Pueblo City 60, CO X
Roaring Fork RE-1, CO X
Sierra Grande R-30, CO X
Weld County RE-8, CO X
Westminster 50, CO X
Artesia Public Schools, NM X
Espanola Municipal Schools, NM X
Famington Municipal Schools, NM X
Gallup-McKinley County Schools, NM X
Hobbs Municipal Schools, NM X
Las Cruces Public Schools, NM X
Portales Municipal Schools, NM X
Silver City Consolidated Schools, NM X
Davis School District, UT X
Duchesne School District, UT X
Granite School District, UT X
Jordan School District, UT X
Ogden School District, UT X
Washington School District, UT X
OCR's Region 11—San Francisco
41.0 Alameda City Unified, CA X
Atwater Elementary, CA X
Beaumont Unified, CA X
Bellevue Union Elementary, CA X
Brawley Union High, CA X
Burbank Unified, CA X
Cajon Valley Union Elementary, CA X
Centralia Elementary, CA X
Chino Unified, CA X
Colton Joint Unified, CA X
East Side Union High, CA X
Empire Union Elementary, CA X
Franklin-McKinley Elementary, CA X
(Continued From Previous Page)
Regional percentage of national total of students with limited English proficiency School district
Did OCR staff as a whole, convey the impression that they ...
FavoredEnglish-only
education?
Favoredbilingual
education?
Favoredanother
languageprogram?
Were neutral onthe question?
Page 45 GAO-01-226 Students With Limited English Proficiency

Appendix III
School Districts' Impressions of Whether
OCR Conveyed Preferences for Type of
Language Instruction
Fremont Union High, CA X
Fresno Unified, CA X
Golden Plains Unified, CA X
Grant Joint Union High, CA X
Hacienda La Puente Unified, CA X
Hanford Joint Union High, CA X
Inglewood Unified, CA X
Lindsay Unified, CA X
Lynwood Unified, CA X
Manteca Unified, CA X
Merced City Elementary, CA X
Milpitas Unified, CA X
Monterey Peninsula Unified, CA X
Moreland Elementary, CA X
Moreno Valley Unified, CA X
Napa Valley Unified, CA X
Newport-Mesa Unified, CA X
Norwalk-La Mirada Unified, CA X
Ocean View Elementary, CA X
Ojai Unified, CA X
Orange Center Elementary, CA X
Orland Joint Unified, CA X
Porterville Elementary, CA X
Poterville Union High, CA X
Roseland Elementary, CA X
Saddleback Valley Unified, CA X
San Rafael City Elementary, CA X
San Rafael City High, CA X
Santa Ana Unified, CA X
Santa Cruz City Elementary, CA X
Santa Cruz City High, CA
Sweetwater Union High, CA X
Ventura Unified, CA X
(Continued From Previous Page)
Regional percentage of national total of students with limited English proficiency School district
Did OCR staff as a whole, convey the impression that they ...
FavoredEnglish-only
education?
Favoredbilingual
education?
Favoredanother
languageprogram?
Were neutral onthe question?
Page 46 GAO-01-226 Students With Limited English Proficiency
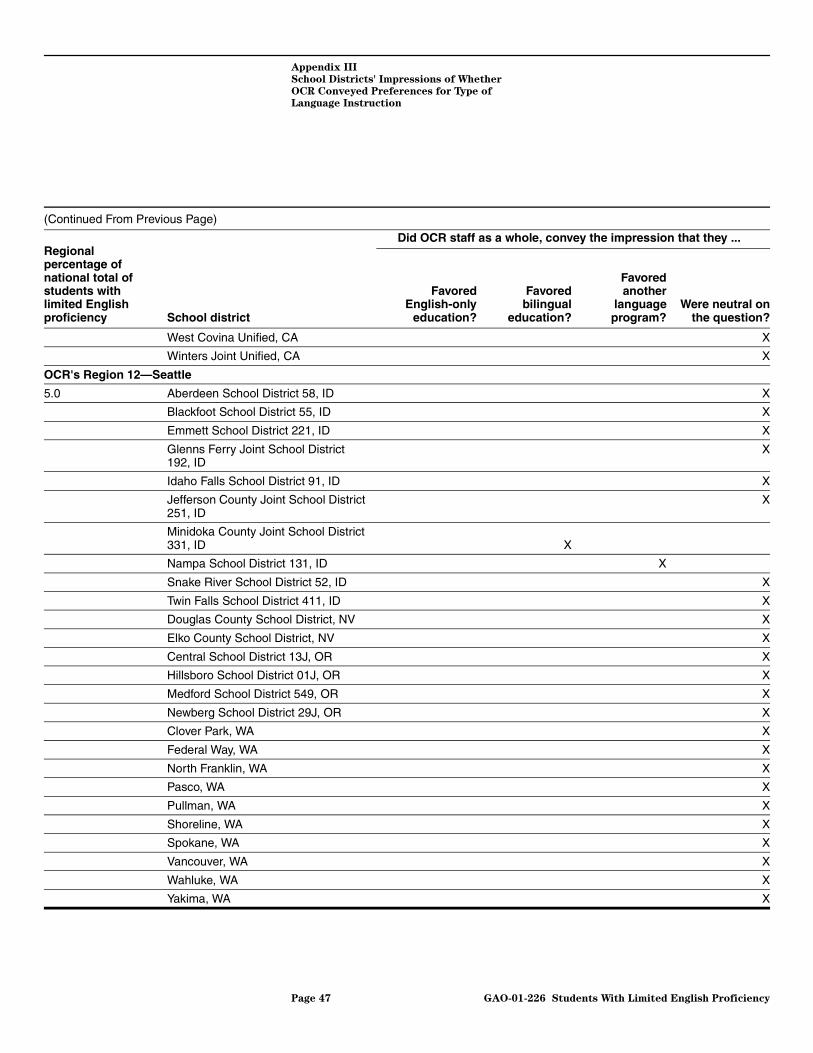
Appendix III
School Districts' Impressions of Whether
OCR Conveyed Preferences for Type of
Language Instruction
West Covina Unified, CA X
Winters Joint Unified, CA X
OCR's Region 12—Seattle
5.0 Aberdeen School District 58, ID X
Blackfoot School District 55, ID X
Emmett School District 221, ID X
Glenns Ferry Joint School District 192, ID
X
Idaho Falls School District 91, ID X
Jefferson County Joint School District 251, ID
X
Minidoka County Joint School District 331, ID X
Nampa School District 131, ID X
Snake River School District 52, ID X
Twin Falls School District 411, ID X
Douglas County School District, NV X
Elko County School District, NV X
Central School District 13J, OR X
Hillsboro School District 01J, OR X
Medford School District 549, OR X
Newberg School District 29J, OR X
Clover Park, WA X
Federal Way, WA X
North Franklin, WA X
Pasco, WA X
Pullman, WA X
Shoreline, WA X
Spokane, WA X
Vancouver, WA X
Wahluke, WA X
Yakima, WA X
(Continued From Previous Page)
Regional percentage of national total of students with limited English proficiency School district
Did OCR staff as a whole, convey the impression that they ...
FavoredEnglish-only
education?
Favoredbilingual
education?
Favoredanother
languageprogram?
Were neutral onthe question?
Page 47 GAO-01-226 Students With Limited English Proficiency
Appendix IV
Most School Districts That Added Bilingual Instruction Reported No Pressure by OCR Appendix IV
We asked school districts a number of questions about the type of program they had that was specifically designed to meet the English-language needs of students with limited English proficiency (solely bilingual education, English-only instruction, both bilingual and English-only instruction, or another type of language program) before and after the OCR investigation. We also asked about any changes in the type of program used by the district as a result of OCR actions.
Ten school districts added bilingual instruction to their English-language learning program after OCR intervention. Of these, six indicated that before OCR's investigation they had not planned to change the type of language program they used; three indicated that before the OCR investigation they had planned to change the type of program they used and that the changes that resulted from OCR's investigation were consistent with the changes they had planned to make; and one district did not indicate whether or not it had planned to change the type of language program used before the OCR investigation. One of the 10 school districts indicated that it felt pressured by OCR to change the type of language program it was using.
Our analysis indicated that of the 89 school districts that indicated they had English-only programs before OCR's investigation,
• 10 added bilingual education to their English-only programs and• no school district changed from English-only to solely bilingual.
Table 10 lists these 10 school districts and their corresponding OCR regional offices and provides details about the changes made in the districts' English-language acquisition programs.
Page 48 GAO-01-226 Students With Limited English Proficiency

Appendix IV
Most School Districts That Added Bilingual
Instruction Reported No Pressure by OCR
Table 10: Information About 10 Districts' Decisions to Add Bilingual Education to Their Programs
aThis district had planned no change.
District
Planned change before OCR investigation
Change consistent with planned change
Change due to pressure by OCR
Region 2—New York
New York City Board of Education, NY No response a No
Region 5—Dallas
Blackwell Public Schools, OK No a Yes
Region 8—Cleveland
Toledo Public Schools, OH No a No
Region 9—Kansas City
Washington Community School District, IA No a No
Garden City Unified School District #457, KS No a No
Region 10—Denver
Jefferson County Public Schools, CO No a No
Washington School District #6, AZ Yes Yes No
Region 11—San Francisco
Winters Joint Unified School District, CA No a No
Region 12—Seattle
Medford School District, OR Yes Yes No
Vancouver School District No. 37, WA Yes Yes No
Page 49 GAO-01-226 Students With Limited English Proficiency
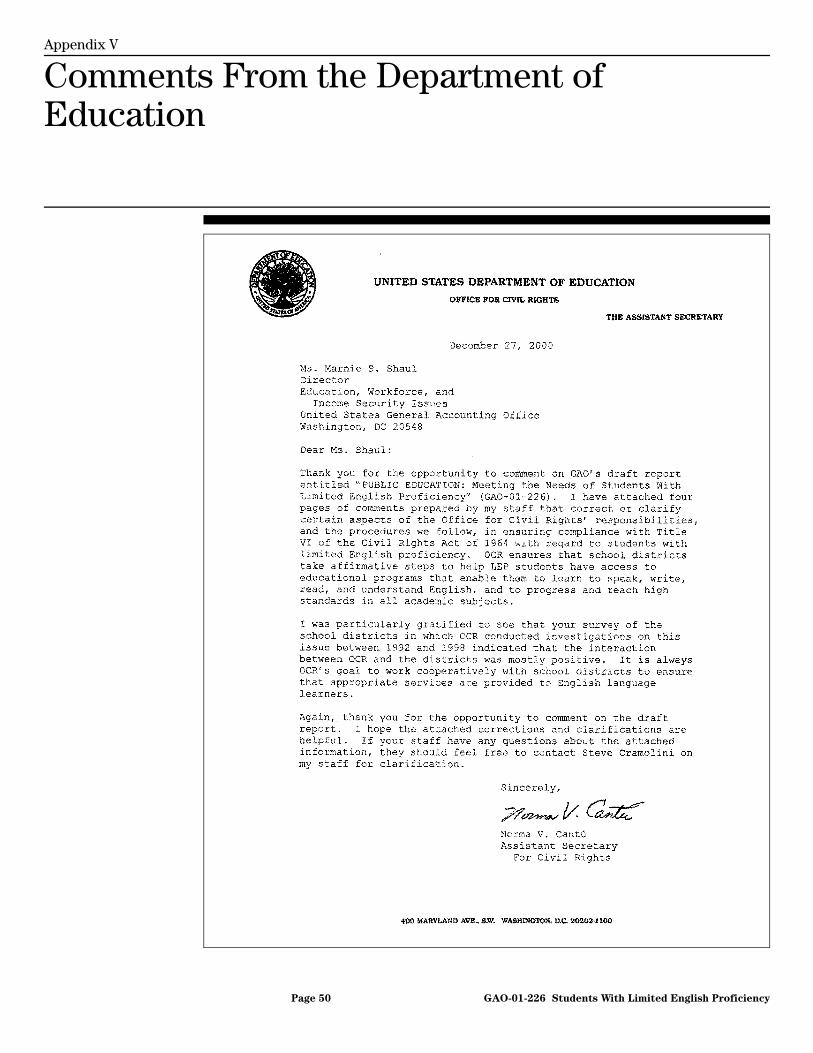
Appendix V
Comments From the Department of Education Appendix V
Page 50 GAO-01-226 Students With Limited English Proficiency

Appendix VI
GAO Contacts and Staff Acknowledgments Appendix VI
GAO Contacts Eleanor L. Johnson, (202) 512-7209Benjamin F. Jordan, Jr., (202) 512-4876
Staff Acknowledgments
In addition to those named above, Malcolm Drewery, Behn Miller, Ellen Soltow, and Virginia Vanderlinde made key contributions to this report.
Page 51 GAO-01-226 Students With Limited English Proficiency
(104983) Letter
Ordering Information The first copy of each GAO report is free. Additional copies of reports are $2 each. A check or money order should be made out to the Superintendent of Documents. VISA and MasterCard credit cards are accepted, also.
Orders for 100 or more copies to be mailed to a single address are discounted 25 percent.
Orders by mail:U.S. General Accounting OfficeP.O. Box 37050Washington, DC 20013
Orders by visiting:Room 1100700 4th St. NW (corner of 4th and G Sts. NW)U.S. General Accounting OfficeWashington, DC
Orders by phone:(202) 512-6000fax: (202) 512-6061TDD (202) 512-2537
Each day, GAO issues a list of newly available reports and testimony. To receive facsimile copies of the daily list or any list from the past 30 days, please call (202) 512-6000 using a touchtone phone. A recorded menu will provide information on how to obtain these lists.
Orders by Internet:For information on how to access GAO reports on the Internet, send an e-mail message with “info” in the body to:
or visit GAO’s World Wide Web home page at:
http://www.gao.gov
To Report Fraud, Waste, or Abuse in Federal Programs
Contact one:
• Web site: http://www.gao.gov/fraudnet/fraudnet.htm
• e-mail: [email protected]
• 1-800-424-5454 (automated answering system)


United StatesGeneral Accounting OfficeWashington, D.C. 20548-0001
Official BusinessPenalty for Private Use $300
Address Correction Requested
Presorted StandardPostage & Fees Paid
GAOPermit No. GI00