Embed Size (px)
Citation preview

IWC 14-20
Meeting Nevada DEP-BMRR Profile II
Parameters with Electrocoagulation-
Based Treatment Solutions
B. DENNEY EAMES
Water Tectonics, Inc.
Everett, Washington
BRYAN NIELSEN
Water Tectonics, Inc.
Everett, Washington
CHARLES LANDIS
Halliburton, Inc.
Houston, Texas
IWC 14-20
KEYWORDS: Electrocoagulation, water treatment, mining, coagulation, wastewater, arsenic,
antimony, colloids, Nevada Profile II parameters.
ABSTRACT
Although the basic concepts of electrocoagulation (EC) have been known for nearly 100 years,
it was not until the past few years that the technology became commercially viable for large
scale, high flow rate applications. EC now provides an innovative and cost-effective approach to
the treatment of water impacted with colloidal solids, emulsified oils, heavy metals, and other
undesirable constituents. EC has been effectively used to treat mine wastewater from various
mine sites to meet the NDEP/BMRR Profile II parameters, specifically meeting the arsenic and
antimony treatment target levels.

IWC 14-20
EXECUTIVE SUMMARY
Although the basic concepts of
electrocoagulation (EC) have been known
for nearly 100 years, it was not until the past
few years that the technology became
commercially viable for large scale, high
flow rate applications. Through innovations
in electric power management, electrode
configuration and geometry, in-line real-time
sensor monitoring and integrated control,
and the ability to efficiently treat large water
flows, EC now provides an innovative and
cost-effective approach to the treatment of
water impacted with colloidal solids,
emulsified oils, heavy metals, and other
undesirable constituents. As a work horse
technology for the removal of total
suspended solids and heavy metals, EC is
an ideal treatment option for the mining
industry and has significant operational
advantages when compared to traditional
coagulation technology.
EC has been effectively used to treat mine
wastewater from various mine sites in the
United States, Australia, and Canada.
Pollutants effectively removed from the
wastewater streams by EC included:
arsenic, antimony, aluminum, iron,
manganese, cadmium, copper, chrome,
nickel, zinc, silica, total suspended solids
(TSS), fats, oils, and grease (FOG), total
petroleum hydrocarbons (TPH), turbidity,
and other contaminants. Ranges of
parameter concentration removal as a result
of EC processing were: up to 95-99.9%
(method detection limit based) for metals
(As, Sb, Cd, Cu, Cr, Ni, Zn, Fe, Al); 55-98%
for manganese; 71-98% for silica; up to
99% of FOG and TPH, up to 98% of TSS;
and 97-99.9% of turbidity.
The focus of this presentation will review the
treatment of impacted mine waters and the
treatment processes used to meet the
Nevada Division of Environmental
Protection (NDEP) and the Nevada Bureau
of Mining Regulation and Reclamation
(BMRR) Profile II parameter targets.
Results of water treated using EC and
electro-oxidation (EOX) will be presented.
PROJECT BACKGROUND
The State of Nevada through the NDEP and
BMRR has established water quality
standards as guidance for permitting of
various activities in the mining industry.
These standards are known as their Profile
II standards, and are accompanied by their
predecessor roster of standards called
Profile I. These parameters cover a broad
range of analytes of concern in waters at
concentrations that require a high level of
analytical rigor to analyze and an even
higher level of reaction optimization to
address. In the state of Nevada, these
parameters consist of three categories;
Profile I, Profile II, and Profile III; and are
used as reference standards for water
permitting projects, including; mine
permitting, mine reclamation, and permitting
related to the treatment and discharge of
water and stormwater to a public waterway
(Reid, Michele R. 2013).
The focus of this paper was to evaluate the
efficacy of using EC to treat mine impacted
water from multiple mine sites with the
target goal of meeting the NEDP/BMRR
Profile II specification. The Profile II
specification is defined in Table 1. Only the
analytes with reference values are listed.
The Profile II specification provided by the
NDEP includes other values that are
monitored but do not have reference values
(NDEP Profile II, July 1, 2014).

IWC 14-20
Table 1. Profile II Reference Values
Analytical
Parameter
Description
Units Limit
Value
Aluminum mg/L 0.2
Antimony mg/L 0.006
Arsenic mg/L 0.010
Barium mg/L 2.0
Beryllium mg/L 0.0004
Cadmium mg/L 0.005
Chloride mg/L 400
Chromium mg/L 0.1
Copper mg/L 1.0
Fluoride mg/L 4.0
Iron mg/L 0.6
Lead mg/L 0.015
Magnesium mg/L 150
Manganese mg/L 0.10
Mercury mg/L 0.002
Nickel mg/L 0.1
Nitrate + Nitrite
(as N)
mg/L 10
Nitrogen, Total
(as N)
mg/L 10
pH (standard units) s.u. 6.5 - 8.5
Selenium mg/L 0.05
Silver mg/L 0.1
Sulfate mg/L 500
Thallium mg/L 0.002
Total Dissolved
Solids
mg/L 1,000
WAD Cyanide mg/L 0.2
Zinc mg/L 5.0
Note: All analyses for the dissolved fraction.
Coagulation is one of the most important
physiochemical reactions used in water
treatment. The precipitation of ions (heavy
metals) and colloids (organic and inorganic)
are mostly held in solution by electrical
charges. By the addition of ions of opposite
charges these colloids can be destabilized,
and coagulation can be achieved by
chemical or electrical methods. Typically,
the coagulant is added in the form of
suitable chemical substances. Alum
[3Al2(SO4).18H2O] is a coagulant which is
widely used for water and wastewater
treatment. Ferric Chloride (FeCl3) is also
widely used. Both of these metal salts add
anions in the form of sulfate (SO42-) and
chloride (Cl-) that compete for the ionic
reactions in the water chemistry, and
increase the relative particle size of targeted
contaminants in conjunction with the
coagulant, allowing them to settle out of or
be filtered from a solution.
In addition, when metal salt coagulants are
used to coagulate contaminants, they leave
behind the anion portion of the salts. As
Profile II parameters include both sulfate
and chloride, the use of metal salts as
coagulants may be limited by these
mandated anion concentrations. In some
instances where the TDS concentration is
already close to the limit of 1,000 mg/L, the
use of any chemical coagulant is not
possible. This is because the “residue” left
behind by the chemical causes the treated
water to exceed the TDS limit for Profile II.
The mechanism of coagulation has been
the subject of continual review. It is
generally accepted that coagulation is

IWC 14-20
driven primarily by a reduction of the net
surface charge to a point where the colloidal
particles, previously stabilized by
electrostatic repulsion, can approach close
enough for van der Waals forces to hold
them together and allow aggregation. The
reduction of the surface charge is a
consequence of the decrease of the
repulsive potential of the electrical double
layer by the presence of an electrolyte
having an opposite charge.
EC offers an alternative to the use of metal
salts or polymers and polyelectrolyte
addition for breaking stable emulsions and
suspensions. The technology causes
coagulation by introducing highly-charged
polymeric metal hydroxide species. These
species neutralize the electrostatic charges
on suspended solids and oil droplets to
facilitate agglomeration or coagulation and
resultant separation from the aqueous
phase. The treatment prompts the
precipitation of many metals and salts.
In the EC process, the coagulant is
generated in situ by electrolytic oxidation of
an appropriate anode material. In this
process, charged ionic species (metals or
other contaminants) are removed from
wastewater by allowing them to react with
an ion having an opposite charge, or with
floc of metallic hydroxides generated within
the effluent. One advantage to this
technique is that there is no by-product
anion “left behind” as unreacted analytes.
This reaction enjoys several advantages in
water treatment as mentioned by Benefield,
Judkins, and Weand:
Chemical coagulation has been used for
decades to destabilize suspensions and
to effect precipitation of soluble metals
species, as well as other inorganic
species from aqueous streams, thereby
permitting their removal through
sedimentation or filtration. Alum, lime
and/or polymers have been the
chemical coagulants used. These
processes, however, tend to generate
large volumes of sludge with high bound
water content that can be slow to filter
and difficult to dewater. These treatment
processes also tend to increase the total
dissolved solids (TDS) content of the
effluent, making it unacceptable for
reuse within industrial applications.
(1982, p. 212)
Similar findings are expressed by
Tchobanoglous and Burton:
Although the electrocoagulation
mechanism resembles chemical
coagulation in that the cationic species
are responsible for the neutralization of
surface charges, the characteristics of
the electrocoagulated flock differ
dramatically from those generated by
chemical coagulation. An
electrocoagulated flock tends to contain
less bound water, is more shear
resistant and is more readily filterable.
(1991, p. 301-303)
The EC treatment process is shown
conceptually in Figure 1. Direct current
(DC) is applied to a cathode in a water
bath/stream. As the electrons pass
between the cathode and anode, two
simultaneous reactions occur. Water (H2O)
is split at the cathode forming H2 (gas) and
OH-(aqueous) at the cathode. Metal (Me+) is
released through electrolytic oxidation at the
anode. If Iron (Fe) is used the Fe2+ will
quickly oxidize to Fe3+ dependent on the
water characteristics such as pH, oxidation-
reduction potential (ORP), dissolved oxygen
(DO), and others. The coagulation metal
(Me+) and hydroxide (OH-) are suddenly
above the saturation constant and
precipitate and coagulate. These particles

IWC 14-20
attract and retain other contaminants in the
water through agglomeration and co-
precipitation, causing a stable floc to form.
This flocculation (“floc maturation”) process
can be encouraged by physiochemical
adjustments such as pH, temperature, and
flow rates/residency times.
Dependent on the floc characteristics of size
and density, a portion of the small amount
of hydrogen gas formed at the cathode
attaches to the floc providing lift and can
form a stable surface floc. Floc particles
with higher density settle to form a sludge
layer (dependent on the fluid hydraulic
characteristics). Figure 1 is a conceptual
diagram of these processes.
Figure 1. EC Treatment Process
Arsenic (As) and antimony (Sb) are found in
many mine wastewaters above the Profile II
limits. Arsenic is typically found in these
wastewaters as Arsenite [As(iii)]. Figure 2
is a diagram of Arsenite species
dissociation in the full pH range.

IWC 14-20
Figure 2. Dissociation of Arsenite [As(iii)]
In the neutral pH of 6 to 9, Arsenite is
mostly H3AsO3. This form of Arsenite is
very stable and does not react well or co-
precipitate with iron or other coagulants.
Through oxidation, Arsenite can be changed
to Arsenate [As(v)]. In this same neutral pH
range, Arsenate is found as H2AsO4- and
HAsO42-. These species are much more
reactive with iron and can be co-precipitated
in an iron-hydroxide floc, as shown in Figure
3.
Figure 3. Dissociation of Arsenate [As(v)]

IWC 14-20
By controlling the oxidation state of the
species and the pH of a solution, Arsenic
can be very effectively co-precipitated in an
iron-hydroxide floc. Since As and Sb are in
the same group, they have similar electron
outer layers and react in a similar fashion.
The Pourbaix diagrams shown in Figure 4
and Figure 5 illustrate this chemical reaction
for both arsenic and antimony. The
treatment method was designed and
optimized to specifically target As and Sb.
Figure 4. Arsenic (As) Pourbaix Diagram
Figure 5. Antimony (Sb) Pourbaix Diagram

IWC 14-20
METHODS
Three different mine water samples were
collected. Each sample collected was
homogenized prior to sampling. Influent
samples were collected from untreated raw
water. Effluent samples were collected after
the following treatment processes were
performed.
Each sample was aerated and the ORP was
raised using an EOX solution generated
onsite. The EOX solution is a salt solution
run through an electrolytic cell to generate a
mixed oxidant mainly consisting of
hypochlorous acid. Following aeration, the
fluid was passed through a laboratory EC
cell at a current setting scalable to a
standard full-scale EC treatment system.
The samples were mixed for floc
development and allowed to settle.
Following settling, the supernate was
filtered using a polyacrylonitrile (PAN)
hollow fiber ultrafiltration membrane.
RESULTS
Mine Water Sample #1 was a mixture of
mine surface water and rain water mixed to
simulate a stormwater sample. The
untreated influent sample contained
elevated antimony and arsenic. All analysis
was conducted by a third-party laboratory.
The treated effluent sample meets the
Profile II parameter limits. The data appear
in Table 2.
Mine Water Sample #2 was collected from a
mine storage pond. The untreated influent
sample contained elevated antimony,
arsenic, and thallium. Duplicate samples of
the EC treated effluent were evaluated by
two independent laboratories. Both of the
treated effluent samples meet the Profile II
parameter limits. There was a very good
correlation in the duplicate data provided by
both labs. The data appear in Table 3.
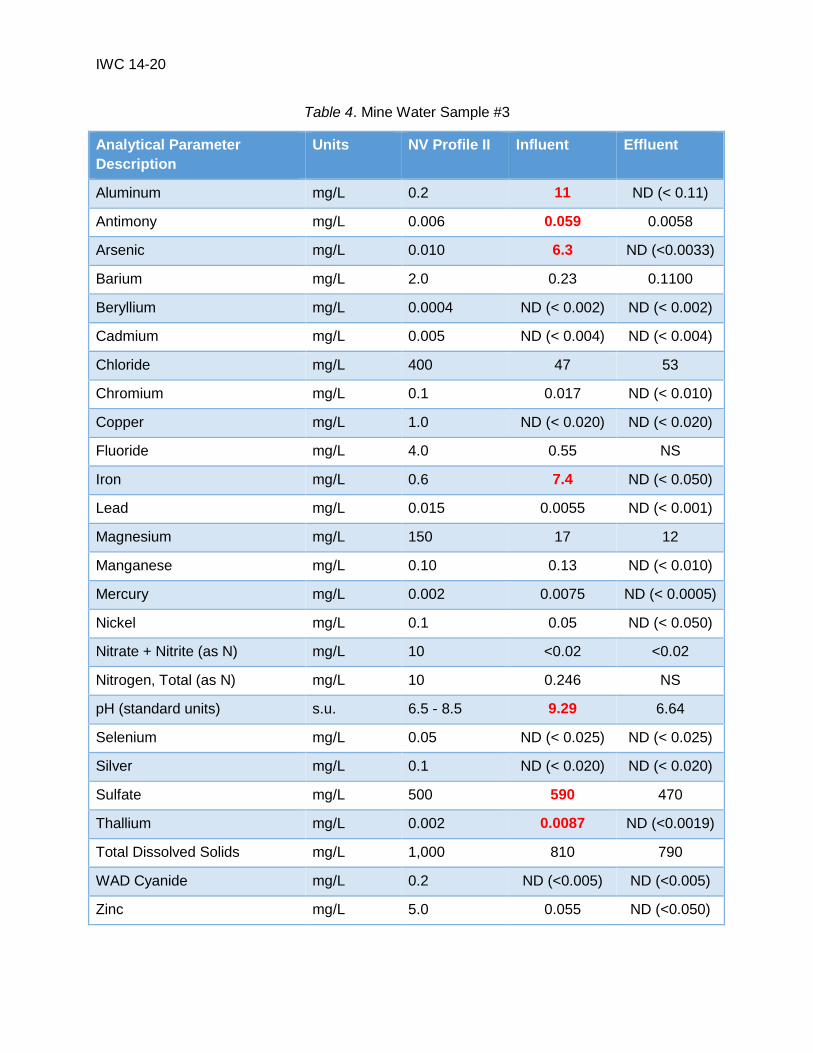
Mine Water Sample #3 was also collected
from a man-made mine water storage pond.
The untreated influent sample contained
elevated Aluminum, Antimony, Arsenic,
Iron, Sulfate and Thallium. The sample also
had an elevated pH level. The EC treated
effluent sample meets the Profile II
parameter limits. The data appear in Table
4.
Arsenic (As) and antimony (Sb) were found
to be above the Profile II limits in all of the
mine wastewaters. These two
contaminants are very prevalent in many
mine wastewater samples. The EC
treatment method effectively removed these
contaminants without increasing the
chloride or TDS above the Profile II limits.
All other Profile II parameters above the
limit were treated to below the target in the
effluent.

IWC 14-20
Table 2. Mine Water Sample #1
Analytical Parameter
Description
Units NV Profile II Influent Effluent
Aluminum mg/L 0.2 ND < 0.2 ND < 0.2
Antimony mg/L 0.006 0.017 ND < 0.005
Arsenic mg/L 0.010 1.5 ND < 0.003
Barium mg/L 2.0 ND < 0.05 ND < 0.05
Beryllium mg/L 0.0004 ND < 0.004 ND < 0.004
Cadmium mg/L 0.005 ND < 0.004 ND < 0.004
Chloride mg/L 400 14 170
Chromium mg/L 0.1 ND < 0.01 ND < 0.01
Copper mg/L 1.0 ND < 0.02 ND < 0.02
Fluoride mg/L 4.0 0.15 0.13
Iron mg/L 0.6 ND < 0.56 ND < 0.56
Lead mg/L 0.015 ND < 0.015 ND < 0.015
Magnesium mg/L 150 3.5 3.5
Manganese mg/L 0.10 ND < 0.011 ND < 0.011
Mercury mg/L 0.002 ND < 0.0005 ND < 0.0005
Nickel mg/L 0.1 ND < 0.05 ND < 0.05
Nitrate + Nitrite (as N) mg/L 10 0.49 0.52
Nitrogen, Total (as N) mg/L 10 1.08 0.94
pH (standard units) s.u. 6.5 - 8.5 7.45 6.57
Selenium mg/L 0.05 ND < 0.005 ND < 0.005
Silver mg/L 0.1 ND < 0.02 ND < 0.02
Sulfate mg/L 500 150 150
Thallium mg/L 0.002 ND < 0.002 ND < 0.002
Total Dissolved Solids mg/L 1,000 250 400
WAD Cyanide mg/L 0.2 ND < 0.005 ND < 0.005
Zinc mg/L 5.0 ND < 0.05 ND < 0.05

IWC 14-20
Table 3. Mine Water Sample #2
Analytical Parameter
Description
Units NV Profile II Influent Effluent
Lab #1
Effluent
Lab #2
Aluminum mg/L 0.2 0.09 ND < 0.056 0.0126
Antimony mg/L 0.006 0.03 0.0042 0.0053
Arsenic mg/L 0.010 0.28 ND <0.003 0.0021
Barium mg/L 2.0 0.0959 0.0810 0.0789
Beryllium mg/L 0.0004 ND < 0.0014 ND < 0.0014 ND < 0.0014
Cadmium mg/L 0.005 ND <0.0002 ND <0.0002 ND <0.0002
Chloride mg/L 400 69.9 190 204.4
Chromium mg/L 0.1 ND <0.0006 ND <0.0006 ND <0.0006
Copper mg/L 1.0 0.0034 0.078 0.0069
Fluoride mg/L 4.0 0.5 ND <0.02 ND <0.02
Iron mg/L 0.6 0.27 0.20 0.25
Lead mg/L 0.015 0.052 0.0056 0.0047
Magnesium mg/L 150 30.1 27.4 30.3
Manganese mg/L 0.10 0.047 0.076 0.079
Mercury mg/L 0.002 ND < 0.0001 ND < 0.0001 ND < 0.0001
Nickel mg/L 0.1 0.0066 0.0028 0.0208
Nitrate + Nitrite (as N) mg/L 10 0.05 ND <0.02 ND <0.02
Nitrogen, Total (as N) mg/L 10 0.69 0.72 1.37
pH (standard units) s.u. 6.5 - 8.5 8.22 6.96 7.29
Selenium mg/L 0.05 0.0046 0.0106 0.0086
Silver mg/L 0.1 ND <0.0002 ND <0.0002 ND <0.0002
Sulfate mg/L 500 61 59.6 55.7
Thallium mg/L 0.002 0.0025 ND <0.002 ND <0.002
Total Dissolved
Solids
mg/L 1,000 403 590 585
WAD Cyanide mg/L 0.2 ND < 0.005 ND < 0.005 ND < 0.005
Zinc mg/L 5.0 0.0556 0.0569 0.0571
IWC 14-20
Table 4. Mine Water Sample #3
Analytical Parameter
Description
Units NV Profile II Influent Effluent
Aluminum mg/L 0.2 11 ND (< 0.11)
Antimony mg/L 0.006 0.059 0.0058
Arsenic mg/L 0.010 6.3 ND (<0.0033)
Barium mg/L 2.0 0.23 0.1100
Beryllium mg/L 0.0004 ND (< 0.002) ND (< 0.002)
Cadmium mg/L 0.005 ND (< 0.004) ND (< 0.004)
Chloride mg/L 400 47 53
Chromium mg/L 0.1 0.017 ND (< 0.010)
Copper mg/L 1.0 ND (< 0.020) ND (< 0.020)
Fluoride mg/L 4.0 0.55 NS
Iron mg/L 0.6 7.4 ND (< 0.050)
Lead mg/L 0.015 0.0055 ND (< 0.001)
Magnesium mg/L 150 17 12
Manganese mg/L 0.10 0.13 ND (< 0.010)
Mercury mg/L 0.002 0.0075 ND (< 0.0005)
Nickel mg/L 0.1 0.05 ND (< 0.050)
Nitrate + Nitrite (as N) mg/L 10 <0.02 <0.02
Nitrogen, Total (as N) mg/L 10 0.246 NS
pH (standard units) s.u. 6.5 - 8.5 9.29 6.64
Selenium mg/L 0.05 ND (< 0.025) ND (< 0.025)
Silver mg/L 0.1 ND (< 0.020) ND (< 0.020)
Sulfate mg/L 500 590 470
Thallium mg/L 0.002 0.0087 ND (<0.0019)
Total Dissolved Solids mg/L 1,000 810 790
WAD Cyanide mg/L 0.2 ND (<0.005) ND (<0.005)
Zinc mg/L 5.0 0.055 ND (<0.050)
IWC 14-20
CONCLUSIONS
The increasingly challenging treatment
targets in mine wastewater treatment
require a constant effort to evaluate new
treatment technologies. The trend to
address relatively high concentrations of
more and more metals, as well as other
contaminants, requires the water treatment
process to complete multiple chemical
reactions simultaneously and more
efficiently than in the past. Treatment
reactions that require trade-offs allowing
one contaminant to be addressed, while
exacerbating another, are no longer
sustainable.
The use of EC technology is an opportunity
to meet this new dimension of compliance.
The NDEP-BMMR Profile II standard is an
excellent example of the breadth of the
treatment obligations now required to
provide flexible reuse of impaired mine
waters. Electrocoagulation is shown to
simultaneously meet the stringent metals
and anion targets by simply targeting
specific anodic materials in optimized water
conditions to meet the Profile II parameters
without trade-offs in other aspects of
compliance.

IWC 14-20
References:
Benefield, L. D., Judkins, J. F., & Weand, B. L. (1982). Process Chemistry for Water and
Wastewater Treatment. Englewood Cliffs, NJ: Prentice-Hall.
Kumar, P. R., Chaudhari, S., Khilar, K.C., & Mahajan, S.P. (2004). Removal of Arsenic from
Water by Electrocoagulation. Chemosphere, 55(9), 1245-1252.
Lakshmanan, D., Clifford, D. A., Samanta, G. (2010). Comparative Study of Arsenic Removal by
Iron Using Electrocoagulation and Chemical Coagulation. Water Research, 44, 5641-5652.
NDEP Profile II. (2014, July 1). [PDF]. Retrieved from
http://ndep.nv.gov/bmrr/file/ndep_profile_2.pdf
Reid, M. (2013). Stormwater Discharges Associated with Industrial Activity from Metals Mining
Activities – Sector G Permit No. NVR300000 Fact Sheet. [PDF]. Retrieved from
http://ndep.nv.gov/bwpc/docs/mining_fact_sheet_web_site.pdf
Tchobanoglous, G., & Burton, F. (1991). Wastewater Engineering: Treatment, Disposal, and
Reuse. New York, NY: McGraw-Hill.
![Corrosion behaviour of aluminium alloys used in heat …...Figure 19 - Pourbaix Diagram for the system Al- H2O at 25 C [15]. ..... 37 Figure 20 - Autocatalytic process occurring in](https://img.pdfslide.us/doc/110x75/607e668aa886c8176c5a6555/corrosion-behaviour-of-aluminium-alloys-used-in-heat-figure-19-pourbaix-diagram.jpg)