Embed Size (px)
Citation preview
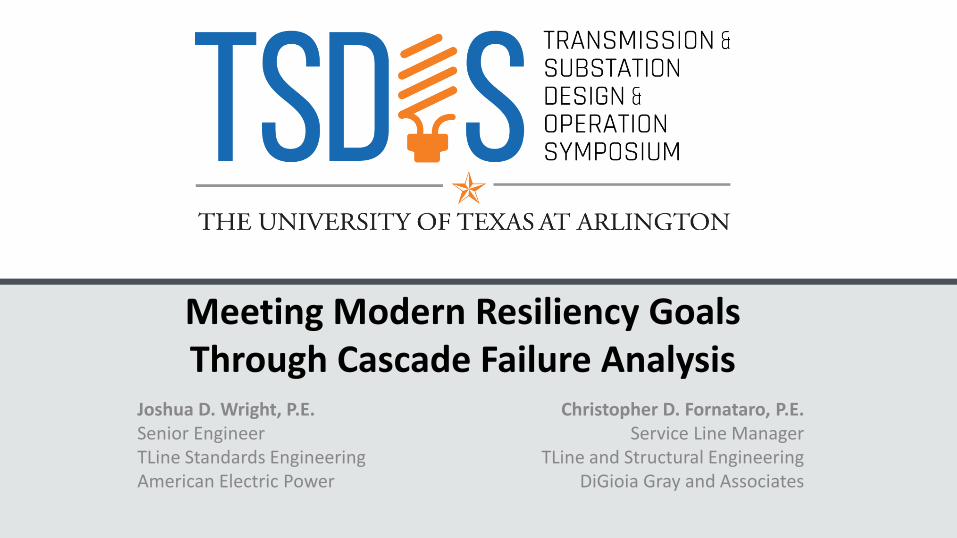
SEPTEMBER 4 - 6, 2019
Meeting Modern Resiliency GoalsThrough Cascade Failure Analysis
Joshua D. Wright, P.E.Senior EngineerTLine Standards EngineeringAmerican Electric Power
Christopher D. Fornataro, P.E.Service Line Manager
TLine and Structural EngineeringDiGioia Gray and Associates
SEPTEMBER 4 - 6, 2019
Agenda
• Background• Line Configurations• Industry Practice• CASE Method and CASE Tool• Case Studies• Results
SEPTEMBER 4 - 6, 2019
Background
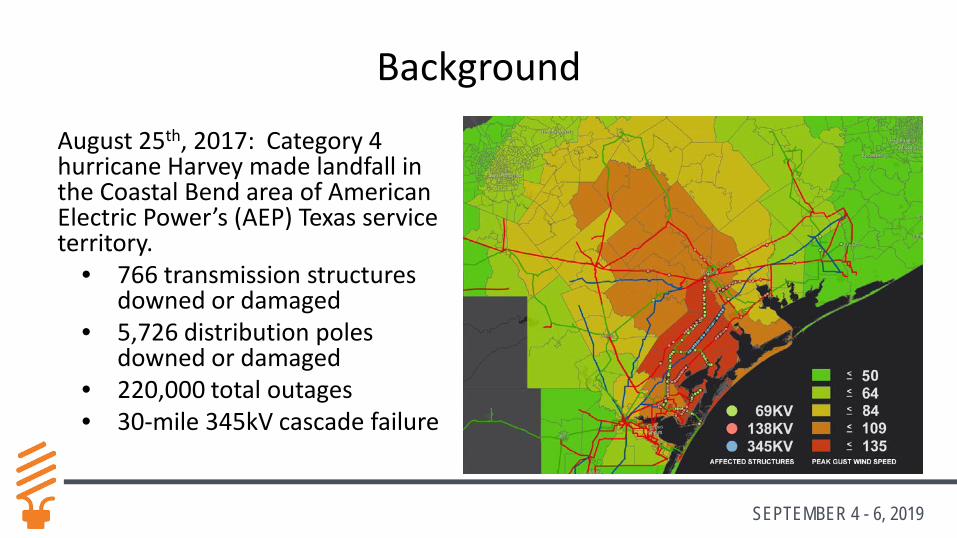
August 25th, 2017: Category 4 hurricane Harvey made landfall in the Coastal Bend area of American Electric Power’s (AEP) Texas service territory.
• 766 transmission structures downed or damaged
• 5,726 distribution poles downed or damaged
• 220,000 total outages• 30-mile 345kV cascade failure
SEPTEMBER 4 - 6, 2019
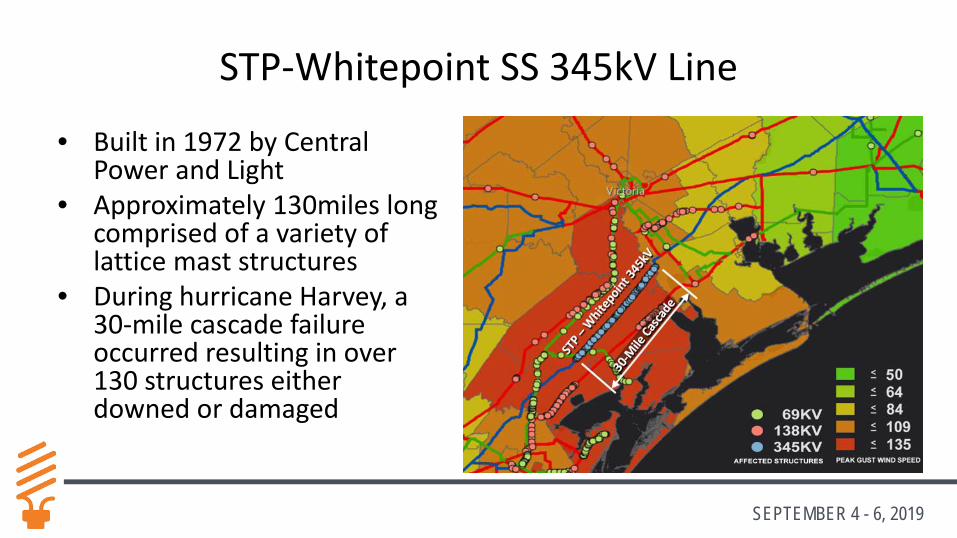
STP-Whitepoint SS 345kV Line
• Built in 1972 by Central Power and Light
• Approximately 130miles long comprised of a variety of lattice mast structures
• During hurricane Harvey, a 30-mile cascade failure occurred resulting in over 130 structures either downed or damaged
SEPTEMBER 4 - 6, 2019
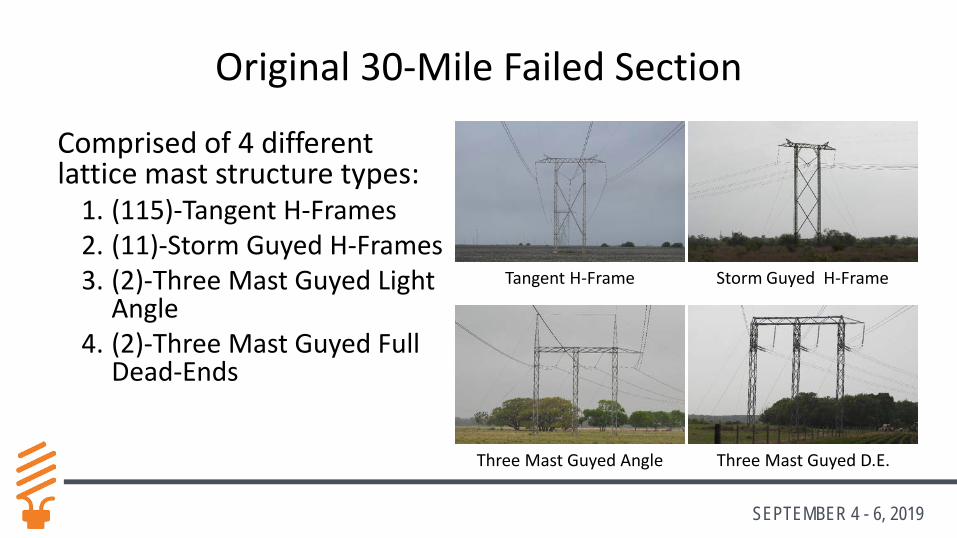
Original 30-Mile Failed Section
Comprised of 4 different lattice mast structure types:
1. (115)-Tangent H-Frames2. (11)-Storm Guyed H-Frames3. (2)-Three Mast Guyed Light
Angle4. (2)-Three Mast Guyed Full
Dead-Ends
Tangent H-Frame Storm Guyed H-Frame
Three Mast Guyed Angle Three Mast Guyed D.E.
SEPTEMBER 4 - 6, 2019
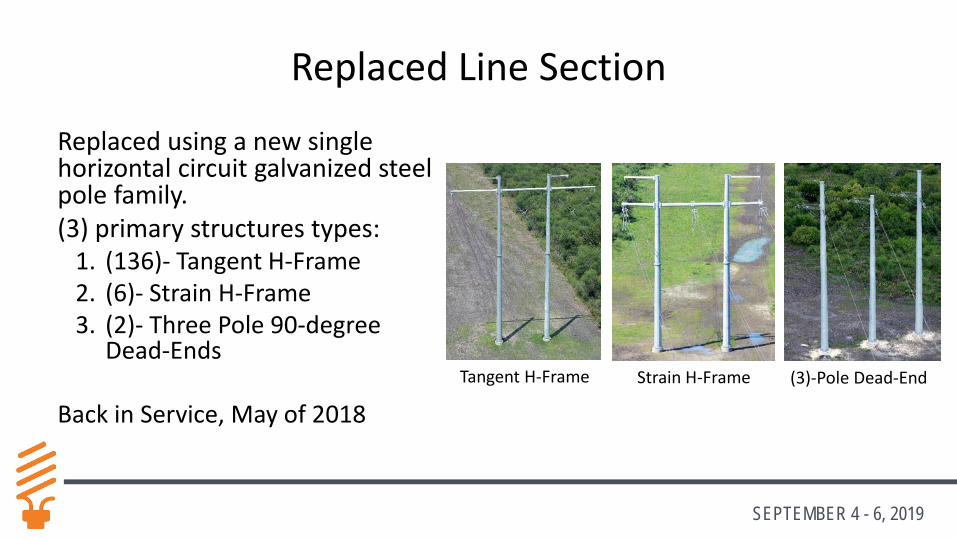
Replaced Line Section
Replaced using a new single horizontal circuit galvanized steel pole family.(3) primary structures types:
1. (136)- Tangent H-Frame2. (6)- Strain H-Frame3. (2)- Three Pole 90-degree
Dead-Ends
Back in Service, May of 2018Tangent H-Frame Strain H-Frame (3)-Pole Dead-End
SEPTEMBER 4 - 6, 2019
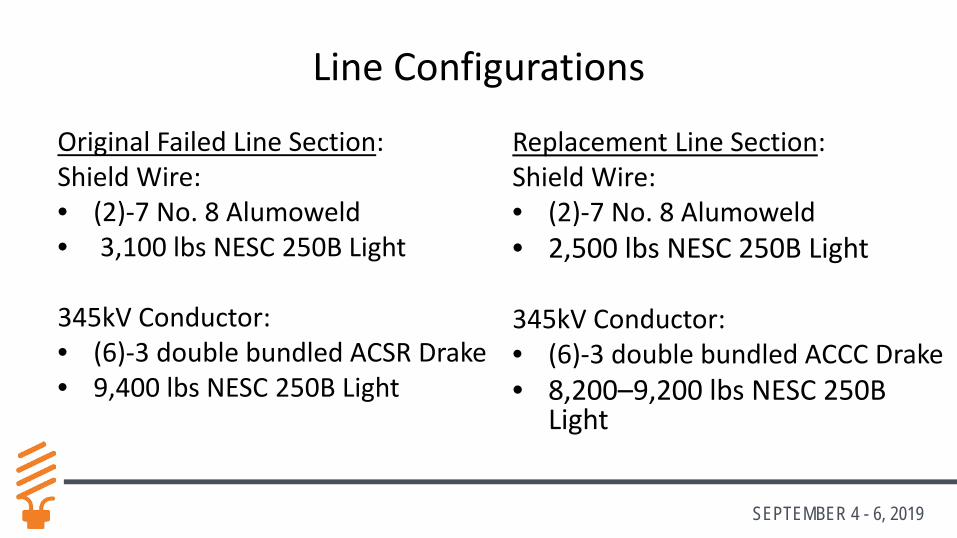
Line Configurations
Original Failed Line Section:Shield Wire:• (2)-7 No. 8 Alumoweld• 3,100 lbs NESC 250B Light
345kV Conductor:• (6)-3 double bundled ACSR Drake• 9,400 lbs NESC 250B Light
Replacement Line Section:Shield Wire:• (2)-7 No. 8 Alumoweld• 2,500 lbs NESC 250B Light
345kV Conductor:• (6)-3 double bundled ACCC Drake• 8,200–9,200 lbs NESC 250B
Light
SEPTEMBER 4 - 6, 2019
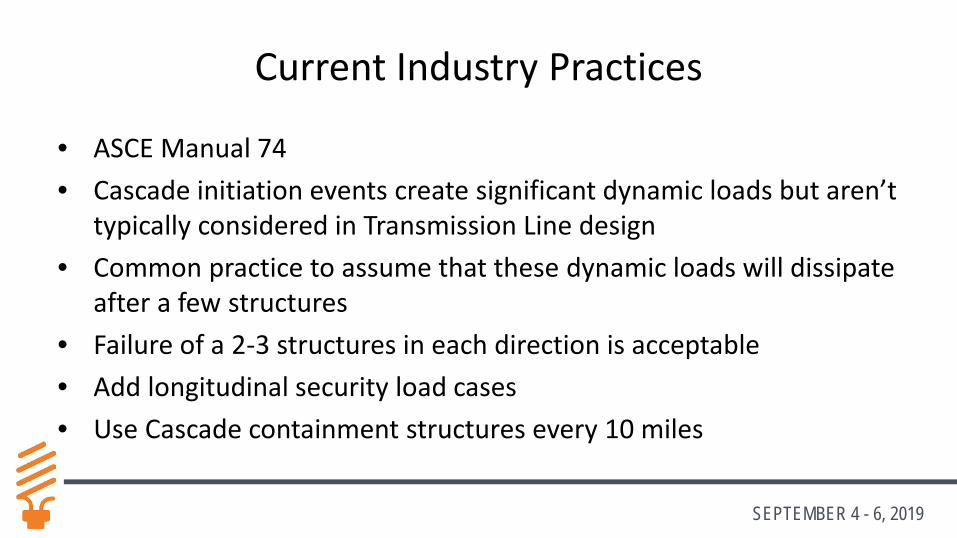
Current Industry Practices
• ASCE Manual 74• Cascade initiation events create significant dynamic loads but aren’t
typically considered in Transmission Line design• Common practice to assume that these dynamic loads will dissipate
after a few structures• Failure of a 2-3 structures in each direction is acceptable• Add longitudinal security load cases• Use Cascade containment structures every 10 miles
SEPTEMBER 4 - 6, 2019
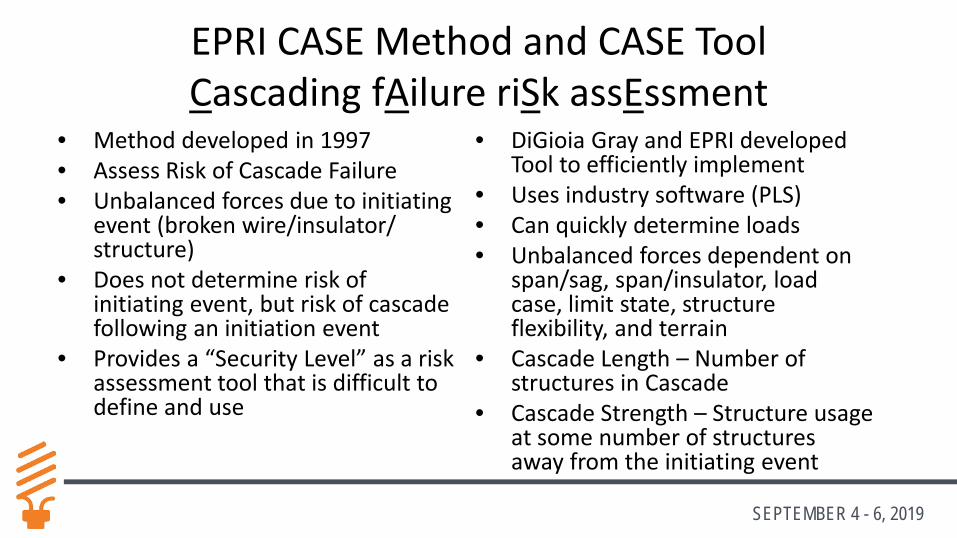
EPRI CASE Method and CASE ToolCascading fAilure riSk assEssment
• Method developed in 1997• Assess Risk of Cascade Failure• Unbalanced forces due to initiating
event (broken wire/insulator/ structure)
• Does not determine risk of initiating event, but risk of cascade following an initiation event
• Provides a “Security Level” as a risk assessment tool that is difficult to define and use
• DiGioia Gray and EPRI developed Tool to efficiently implement
• Uses industry software (PLS)• Can quickly determine loads• Unbalanced forces dependent on
span/sag, span/insulator, load case, limit state, structure flexibility, and terrain
• Cascade Length – Number of structures in Cascade
• Cascade Strength – Structure usage at some number of structures away from the initiating event
SEPTEMBER 4 - 6, 2019
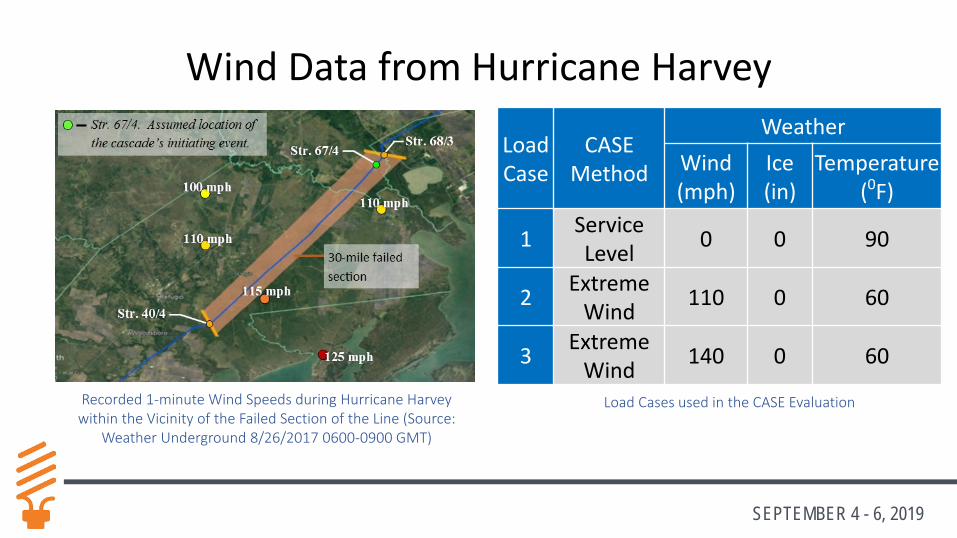
Wind Data from Hurricane Harvey
Load Case
CASE Method
WeatherWind (mph)
Ice (in)
Temperature(0F)
1 Service Level 0 0 90
2 Extreme Wind 110 0 60
3 Extreme Wind 140 0 60
Recorded 1-minute Wind Speeds during Hurricane Harvey within the Vicinity of the Failed Section of the Line (Source:
Weather Underground 8/26/2017 0600-0900 GMT)
Load Cases used in the CASE Evaluation
SEPTEMBER 4 - 6, 2019
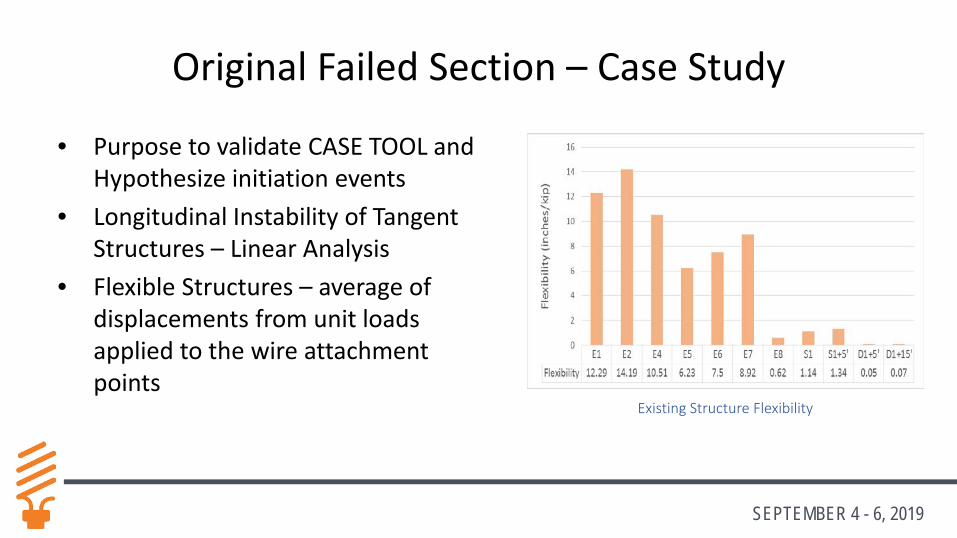
Original Failed Section – Case Study
• Purpose to validate CASE TOOL and Hypothesize initiation events
• Longitudinal Instability of Tangent Structures – Linear Analysis
• Flexible Structures – average of displacements from unit loads applied to the wire attachment points
Existing Structure Flexibility
SEPTEMBER 4 - 6, 2019
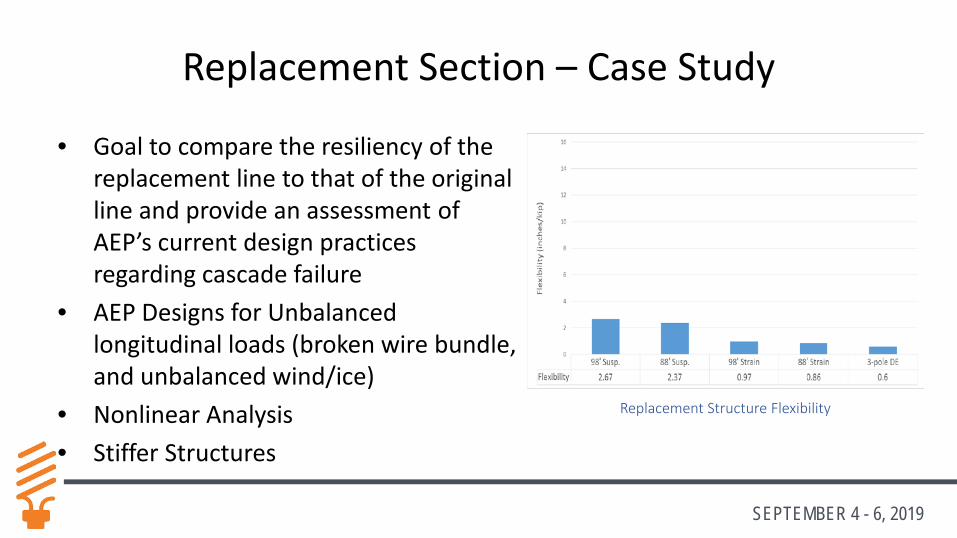
Replacement Section – Case Study
• Goal to compare the resiliency of the replacement line to that of the original line and provide an assessment of AEP’s current design practices regarding cascade failure
• AEP Designs for Unbalanced longitudinal loads (broken wire bundle, and unbalanced wind/ice)
• Nonlinear Analysis• Stiffer Structures
Replacement Structure Flexibility
SEPTEMBER 4 - 6, 2019
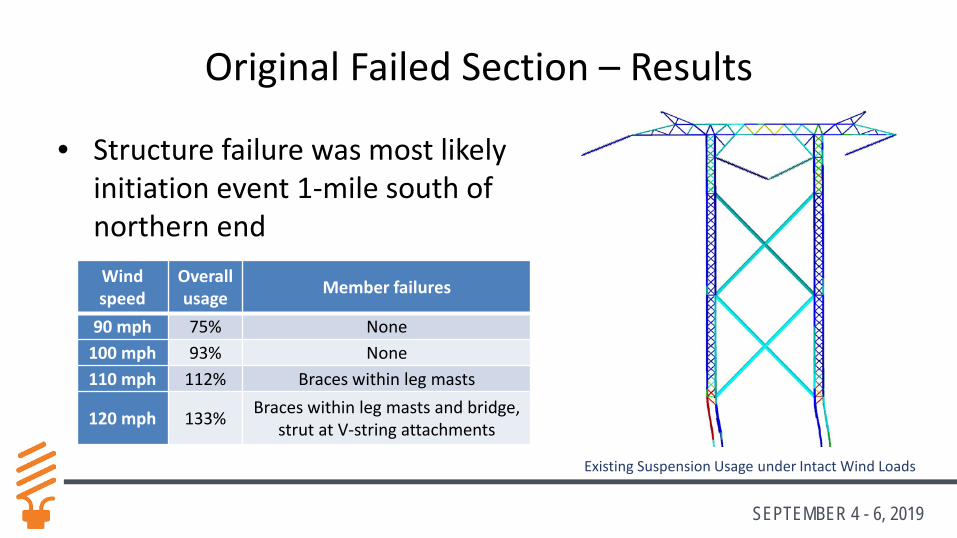
Original Failed Section – Results
Wind speed
Overall usage Member failures
90 mph 75% None100 mph 93% None110 mph 112% Braces within leg masts
120 mph 133% Braces within leg masts and bridge, strut at V-string attachments
• Structure failure was most likely initiation event 1-mile south of northern end
Existing Suspension Usage under Intact Wind Loads
SEPTEMBER 4 - 6, 2019
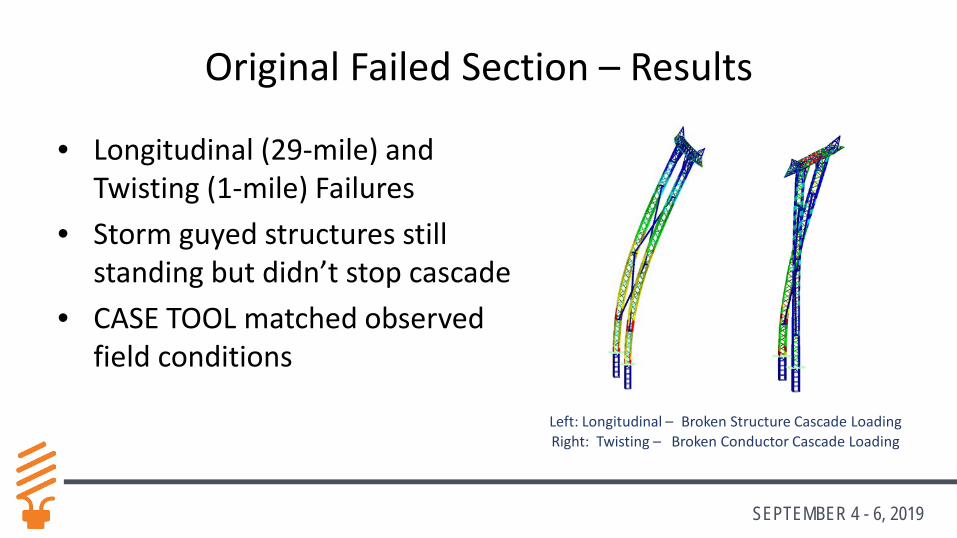
• Longitudinal (29-mile) and Twisting (1-mile) Failures
• Storm guyed structures still standing but didn’t stop cascade
• CASE TOOL matched observed field conditions
Left: Longitudinal – Broken Structure Cascade LoadingRight: Twisting – Broken Conductor Cascade Loading
Original Failed Section – Results
SEPTEMBER 4 - 6, 2019
Replacement Section – Results
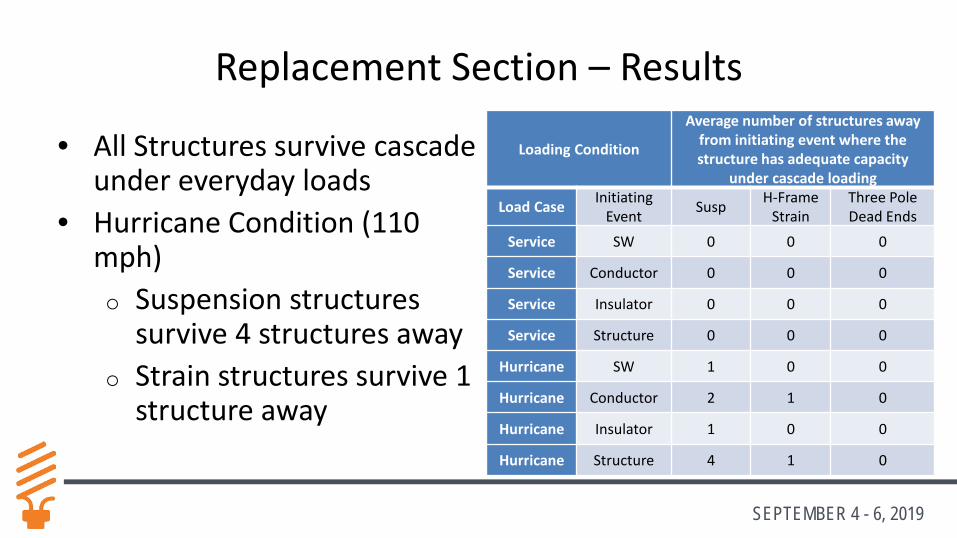
• All Structures survive cascade under everyday loads
• Hurricane Condition (110 mph)o Suspension structures
survive 4 structures awayo Strain structures survive 1
structure away
Loading Condition
Average number of structures away from initiating event where the structure has adequate capacity
under cascade loading
Load Case Initiating Event Susp H-Frame
Strain Three Pole Dead Ends
Service SW 0 0 0
Service Conductor 0 0 0
Service Insulator 0 0 0
Service Structure 0 0 0
Hurricane SW 1 0 0
Hurricane Conductor 2 1 0
Hurricane Insulator 1 0 0
Hurricane Structure 4 1 0
SEPTEMBER 4 - 6, 2019
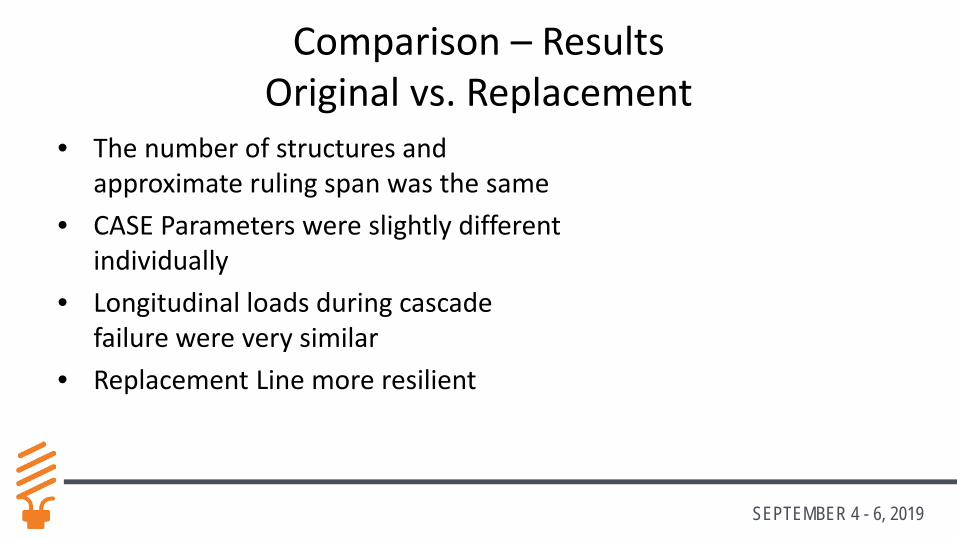
Comparison – ResultsOriginal vs. Replacement
• The number of structures and approximate ruling span was the same
• CASE Parameters were slightly different individually
• Longitudinal loads during cascade failure were very similar
• Replacement Line more resilient
SEPTEMBER 4 - 6, 2019
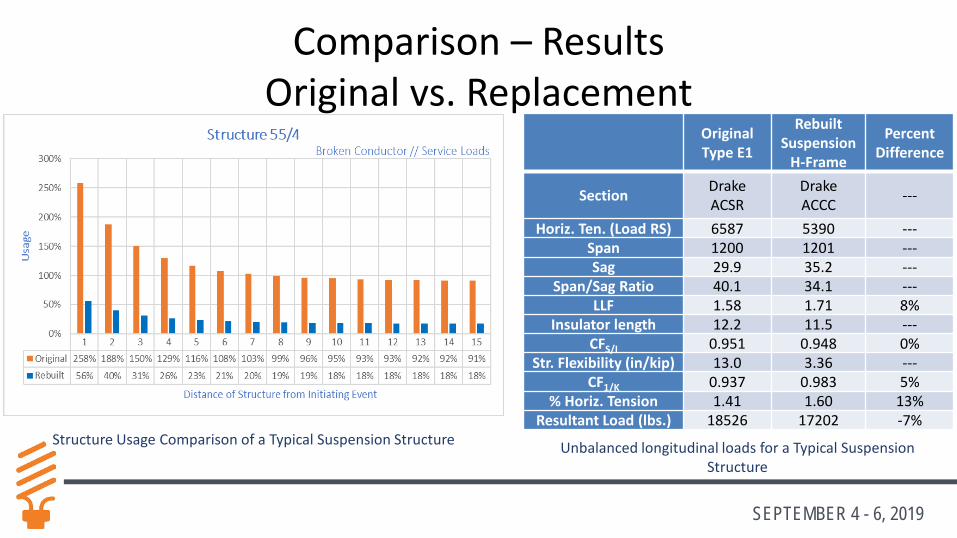
Comparison – ResultsOriginal vs. Replacement
Unbalanced longitudinal loads for a Typical Suspension Structure
OriginalType E1
Rebuilt Suspension
H-Frame
Percent Difference
Section Drake ACSR
DrakeACCC ---
Horiz. Ten. (Load RS) 6587 5390 ---Span 1200 1201 ---Sag 29.9 35.2 ---
Span/Sag Ratio 40.1 34.1 ---LLF 1.58 1.71 8%
Insulator length 12.2 11.5 ---CFS/I 0.951 0.948 0%
Str. Flexibility (in/kip) 13.0 3.36 ---CF1/K 0.937 0.983 5%
% Horiz. Tension 1.41 1.60 13%Resultant Load (lbs.) 18526 17202 -7%
Structure Usage Comparison of a Typical Suspension Structure
SEPTEMBER 4 - 6, 2019
Comparison – ResultsIndustry Practice
• Meets or exceeds ASCE Manual 74• Acceptable to have 2 structures in each direction fail
o Replacement line’s suspension structures have 0 under service loads; 4 under 110 mph
o Under 140 mph wind, suspension structures do not surviveo Strain and Dead-end structures 0 up to 110 mpho Strain structures 2 at 140 mph; Dead-end structures 1 at 140 mph
• Acceptable to have 10-mile interval for containment structureso Replacement line includes 5-mile intervals
SEPTEMBER 4 - 6, 2019
Conclusions
• CASE TOOL allows risk to be evaluated under various weather conditions• CASE TOOL gives both global and discrete risk• Replacement Line meets industry standards• AEP’s current design standards stand up well to cascade risk analysis• Remaining existing line being evaluated for hardening
o Strengthen the existing H-frame structureso Increase the frequency of containment structureso Rebuild the remaining sections
SEPTEMBER 4 - 6, 2019
Joshua D. Wright, P.E.Senior EngineerTLine Standards EngineeringAmerican Electric Power
Christopher D. Fornataro, P.E.Service Line Manager
TLine and Structural EngineeringDiGioia Gray and Associates
Thank you, Questions?