Embed Size (px)
Citation preview

University of Nebraska at OmahaDigitalCommons@UNO
Psychology Faculty Publications Department of Psychology
3-2011
Meeting Design Characteristics and AttendeePerceptions of Staff/Team Meeting QualityMelissa A. CohenCarlson Marketing
Steven G. RogelbergUniversity of North Carolina at Charlotte
Joseph A. AllenUniversity of Nebraska at Omaha, [email protected]
Alexandra LuongUniversity of Minnesota - Duluth
Follow this and additional works at: https://digitalcommons.unomaha.edu/psychfacpub
Part of the Psychology Commons
This Article is brought to you for free and open access by the Departmentof Psychology at DigitalCommons@UNO. It has been accepted forinclusion in Psychology Faculty Publications by an authorizedadministrator of DigitalCommons@UNO. For more information, pleasecontact [email protected].
Recommended CitationCohen, Melissa A.; Rogelberg, Steven G.; Allen, Joseph A.; and Luong, Alexandra, "Meeting Design Characteristics and AttendeePerceptions of Staff/Team Meeting Quality" (2011). Psychology Faculty Publications. 96.https://digitalcommons.unomaha.edu/psychfacpub/96

Meeting Design Characteristics and Attendee Perceptions of Staff/Team Meeting Quality
By:
Melissa A. Cohen Decision Sciences, Carlson Marketing, Plymouth, MN
Steven G. Rogelberg Organizational Science, University of North Carolina Charlotte
Joseph A. Allen Department of Psychology, Creighton University
Alexandra Luong Department of Psychology, University of Minnesota Duluth
Acknowledgement: Portions of this article were presented at the 17th Annual Conference of the Society for Industrial and Organizational Psychology in Orlando, FL, April 2003, and other portions were presented at the 69th Annual Conference of the Academy of Management in Chicago, IL, August 2009. We thank Milt Hakel, Anne Gordon, Matt Sederburg, and Des Leach for their valuable advice and input into this study. This article is a modified version of the first author's master's thesis conducted at Bowling Green State University.
Correspondence concerning this article should be addressed to: Melissa A. Cohen, Carlson Marketing, 1405 Xenium Lane Suite 150, Plymouth, MN 55441 Electronic Mail may be sent to: [email protected].

Meetings, a common tool in organizations, are used for a variety of purposes. These purposes include information sharing ( McComas, 2003; Napier & Gershenfeld, 1989), training ( Clark, 1998; Thomsett, 1989), brainstorming ( Reinig & Shin, 2003), problem solving and decision making ( McComas, Tuit, Waks, & Sherman, 2007; Thomsett, 1989), and socializing ( Kieffer, 1988). Given their multitude of uses, it is not surprising that meetings are quite prevalent. One estimate suggests that there are 11 million meetings each day in the United States alone ( MCI Inc., 1998). Tobia and Becker (1990) found that the average senior manager spends about 23 hr per week either preparing for, attending, or following up on meetings, with middle managers spending about 11 or 12 hr per week on those activities. More recently, Van Vree (1999) found that managers in small companies spend approximately 10% of their time on these activities, whereas managers in large companies spend closer to 75% of their total time.
Despite the prevalence of meetings, surveys suggest that they are often unproductive and costly. Mosvick and Nelson (1987) indicated that over 50% of meeting time is wasted, and that the compounded loss of person-hours represents a significant drain on American productivity. Some argue that, in total, unproductive meetings cost United States corporations around $37 billion in lost time and resources ( Sheridan, 1989). Similarly, Mosvick and Nelson lamented that “poorly planned and poorly run meetings are the worst kept secret of America's vaunted business skills. Yet, few companies have even begun to take a serious look at the largest remaining item of containable costs [i.e., misused meetings] in most organizations” (pp. 4–5).
Present Study
In this study, we focused on how meetings are designed, which we refer to as meeting design characteristics. Design characteristics have the ability to be identified, measured, and purposefully planned into a meeting. They relate to the temporal, attendee, physical, and procedural natures of the meeting.
Previous research on design characteristics is quite limited. We do know that there is considerable variability in meeting design ( Volkema & Niederman, 1995), and that professional meeting facilitators broadly view design characteristics as highly important to preparing for and executing successful meetings ( Niederman & Volkema, 1999). Meeting modality (e.g., face-to-face vs. technology-facilitated) can impact meeting processes and satisfaction (e.g., Lantz, 2001). Other studies manipulate a single design factor to show its importance, such as Bluedorn, Turban, and Love's (1999) examination of meeting posture's (i.e., stand up or sit down) effect on meeting length and group decision-making quality. Sit-down meetings were 34% longer than stand-up meetings, with no decision quality improvement. Most recently and comprehensively, Leach, Rogelberg, Warr, and Burnfield (2009) studied a small set of design characteristics on perceived meeting effectiveness and found that agenda use, meeting punctuality, and facility quality were related to more positive perceptions of meeting effectiveness.
In this study, we expanded greatly on extant work, particularly Leach et al. (2009), by examining the largest set of design characteristics to date. Specifically, we studied four classes encompassing 18 design characteristics associated with staff/team meetings, which we speculate to be highly relevant to perceptions of meeting quality. These include the five characteristics in Leach et al., plus 13 other characteristics that have not been previously studied empirically but have been advocated in the trade literature. Several of these additional characteristics drill deeper into meeting design (e.g., more detail on meeting facilities).
Ultimately, we sought to aid practitioners with evidence-based suggestions for improving meetings as well as to add to the emerging scientific literature on meetings and perceptions of meeting quality in particular. Although the trade literature advocates for each of these 18 design characteristics and they are

accepted as industry best practices, most have not had empirical validation. Thus, a principal part of this work's contribution to the meeting and group literature was to empirically assess the effectiveness of these accepted practices. More specifically, our primary research goal was to examine the relationship between each of these 18 design characteristics and perceptions of meeting quality. Table 1 shows the expected pattern of relationships based on the existing empirical and trade literature.
Meeting Design Characteristics
In the most basic sense, meetings are essentially communication tools used by groups and teams to accomplish organizational goals ( Maitlis, 2005). Like other tools, meetings have certain design characteristics that are usually determined, or at least have the potential to be determined, by the meeting leaders or organizers. These characteristics include a variety of objective features, such as where the meeting is held, if minutes are kept, how long the meeting lasts, if roles are assigned, how the room is configured, and whether an agenda is distributed. Meeting organizers often make decisions about these and other meeting characteristics, either consciously or unconsciously, and those decisions may ultimately impact meeting outcomes.
This research is akin to the type of design research that is common in the fields of human factors and sociotechnical theory. Human factors considers human capabilities and tendencies when designing systems and tools to ensure effective, efficient, and safe function ( Howell, 1991). Put differently, it “discovers and applies information about human behavior, abilities, limitations, and other characteristics to the design of tools, machines, systems, tasks, jobs, and environments for productive, safe, comfortable, and effective human use” ( Sanders & McCormick, 1987, p. 5). When viewed this way, meetings can be thought of as tools and thus can be designed systematically to promote positive human–tool synergy. The sociotechnical approach to work design emphasizes “creating work systems in which the social and technical aspects of those systems are integrated and as supportive of one another as possible” ( Hackman & Oldham, 1980, p. 62). Furthermore, this theory emphasizes the importance of collecting diagnostic data about a work system before redesigning it ( Hackman & Oldham, 1980).
We identified 18 meeting design characteristics using a thorough manual search of the extant trade and empirical literature on meetings, including journal articles, magazine articles, and books, PsycINFO, the ABI/INFORM database, and Internet search engines. Across these sources, we found a great deal of convergence about what design characteristics meetings may have. Included design characteristics were required to meet the following criteria: (a) are generally under the control of the meeting organizer; (b) are related to the meeting's conduct, composition, or setting; and (c) can be thought of, identified, and either planned in advance or initiated at the meeting. The design characteristics are summarized and defined in Table 1.
Temporal Characteristics
Temporal characteristics relate to how meeting time is used. These characteristics include meeting length, promptness of meeting start and end, and use of a break. Meetings that follow good temporal courtesy (e.g., start on time, etc.) are viewed as less disruptive ( Luong & Rogelberg, 2005) and may assist with work scheduling and task coordination. At the same time, well-designed temporal characteristics can maximize time focused on task-related activities (e.g., as opposed to waiting on a late member).
Physical Characteristics
Physical characteristics pertain to aspects of the meeting setting and environment. These characteristics include lighting, meeting space, meeting modality (i.e., face-to-face or technology-facilitated), noise,

refreshments, seating arrangement, meeting space arrangement, and temperature. Research and theory suggest that environmental characteristics are important determinants of employee attitudes and behavior and can shape temporary affect ( Weiss & Cropanzano, 1996). Furthermore, positive physical characteristics of the meeting setting can lead to greater comfort for attendees and create an environment that facilitates the attendee's ability to focus on the meeting task without distraction ( Bluedorn et al., 1999; Leach et al., 2009).
Procedural Characteristics
Procedural characteristics concern how the meeting is conducted. These characteristics include a formal agenda, a meeting agreement, whether minutes are taken, and whether the meeting is electronically recorded. Previous research has suggested that procedural characteristics (e.g., agenda use) are important to meeting effectiveness ( Leach et al., 2009). In addition, running meetings effectively by implementing appropriate procedural characteristics may increase focus on the meeting task, assist in accomplishing meeting goals, and enhance follow-up processes (e.g., sharing minutes; Litsikas, 1995).
Attendee Characteristics
Attendee characteristics refer to the number of attendees and the presence of a meeting facilitator. With regard to the latter, a meeting facilitator controls the flow of information within the meeting, assists in the decision-making process, and helps allay meeting derailment ( Niederman & Volkema, 1999). In addition, based on group research ( Kerr, MacCoun, & Kramer, 1996), as the number of meeting attendees increases (group size), the amount of participation per participant is likely to decrease. Both of these characteristics should impact the use of time and participation and, thus, relate to perceptions of meeting quality.
Group decision-making research has shown that group size fundamentally alters group processes and group performance ( Ingham, Levinger, Graves, & Peckham, 1974; Mullen, 1991). Larger groups have greater coordination needs ( Gladstein, 1984) and can suffer from reduced involvement ( Wicker, Kirmeyer, Hanson, & Alexander, 1976). Consequently, design characteristics may have differential effects based on meeting size. Thus, we also examined meeting size as a moderator between design characteristics and perceptions of meeting quality.
Perceptions of Meeting Quality
Participant's evaluation of meeting quality is an important criterion variable for several reasons. As noted by Ajzen and Fishbein (1980), how we perceive our environment helps us form attitudes toward that environment, which in turn affects how we think about and behave in that environment now and in the future. It follows that how employees perceive meetings can have important attitudinal and behavioral implications as well. Such perceptions impact how current and future meetings are viewed, used, and supported, and can ultimately impact a meeting's ability to accomplish its goals. For example, negative meeting perceptions may lead attendees to have pessimistic attitudes toward meetings, avoid meetings, undermine and not support meeting outcomes, or behave dysfunctionally in meetings ( Bennett, 1998). Therefore, providing meeting attendees with more positive meeting experiences may have a lasting impact beyond the meeting at hand. For example, recent research has found that employee meeting satisfaction is an important predictor of employee job satisfaction ( Rogelberg, Allen, Shanock, Scott, & Shuffler, 2010). Furthermore, many employees publicly state strong negative feelings about meetings ( Rogelberg, Scott, & Kello, 2007). These employee complaints (e.g., waste of time; not allowing me to do my “real” work) appear common (e.g., Sandberg, 2008). Akin to common reasons for studying job satisfaction ( Smith, Kendall, & Hulin, 1969), examinations of employees' feelings about meetings is a

legitimate goal in and of itself. Given how often we ask individuals to participate in meetings, it is our responsibility to understand and work to improve these perceptions, even if such attitudes are not directly related to behavior.
Method
Participants
A total of 1,988 potential participants were invited to participate. After excluding individuals for methodological reasons (e.g., the direction to complete the survey within 48 hr of the meeting was not followed) or analytic reasons (e.g., the meeting was reported to have lasted 0 min), 367 participants remained in the final sample (18.5% response rate). Women ( n = 240) made up 65% of the final sample. Participant age ranged from 18 to 70 years ( M = 36.96 years, SD = 10.07), and 91% had at least some college education. The mean organization position level was 2.95 ( SD = 1.03) on a scale of 1 ( lowest) to 5 ( highest). Approximately half (51%, n = 188) of the sample were supervisors, and the majority were employed full time (77%, n = 284). Median organizational tenure was 37 months ( M = 64.44 months, SD = 69.62), and the mean hours worked per week were 39.73 hr ( SD = 11.79). Participants were employed in a variety of industries (e.g., education, manufacturing), with the largest group (19%) in service industries. Most participants (66%) were employed at private (i.e., private for profit, self-employed, other) as opposed to civic organizations (i.e., government, educational, private not for profit).
Design and Procedure
Participants were recruited from the StudyResponse Center for Online Research. As of August 10, 2005, StudyResponse had registered 95,574 individuals willing to complete academic research surveys. StudyResponse samples have been used in many published research studies (more than 250) and have been published in a variety of academic journals (e.g., Piccolo & Colquitt, 2006; Rogelberg, Leach, Warr, & Burnfield, 2006). We provided our respondent parameters (working adults) to StudyResponse, which drew a random sample of 1,988 individuals from its database, sent a recruitment e-mail, and sent a follow-up e-mail 10 days later to nonresponders. Typical response rates through StudyResponse at the time were 10–20%.
The recruitment e-mail indicated that, to participate in this study, individuals were required to attend a regularly scheduled staff/team meeting, defined as follows: (a) is a scheduled gathering of two or more individuals for the purpose of a work-related interaction, (b) is primarily attended by employees of their organization and those with whom they work regularly (e.g., in their work group, team, etc.), (c) occurs on a regular basis, and (d) is scheduled in advance. This definition was developed using Luong and Rogelberg's (2005) definition, existing meetings literature, and open-ended descriptions of staff/team meetings provided by pilot test participants. Participants were required to complete the survey within 48 hr of attending the target meeting. To participate in an optional random drawing for a cash prize ($300), we instructed respondents to provide their unique Study Response identifier in their responses.
Materials
Study materials were posted on an Internet website. The instructions contained an explanation of the study and its goals, potential benefits to participants, a description of the monetary incentive, participation requirements, an informed consent section, contact information for the researchers, and response submission instructions. Participants were told that the purpose of the study was to examine employees' experiences with meetings at work to learn how meetings are currently being designed and conducted,

and that the researchers hoped to use what was learned from the study to help organizations improve how they use meetings.
Design characteristics. Each design characteristic was assessed using a closed-ended item, described in Table 1. For questions with instructions to check all options that apply, each response was assigned its own variable; if a response was checked, it was coded as 1, and if the response was not checked, it was coded as 0. For yes–no questions, “yes” responses were coded as 1 and “no” responses were coded as 0. In addition, participants were asked to report whether they themselves played the role of facilitator in their staff/team meeting.
Perceptions of meeting quality. Perceptions of meeting quality were measured using a 14-item scale of adjectives that was modeled after and adapted from the Job Descriptive Index (JDI; Smith et al., 1969). The adjectives used for these scales either were taken directly from the JDI or were similar to the type of adjectives used in the JDI to evaluate quality of the attitude object. Sample items include efficient, useful, worthwhile, and helpful. Participants were asked to report whether the adjective described their meeting, somewhat described their meeting, or did not describe their meeting. All negatively worded items were reverse coded; therefore, higher numbers indicated more positive ratings. A pilot sample of eight individuals (age: M = 27.27 years, SD = 6.48) who were employed full time, attended work-related meetings, and worked in a variety of industries was recruited to examine the scale and comment on its content validity.
The 14 items were factor analyzed using a principal-axis factor analysis with varimax rotation, and based on the scree plot and the eigenvalues, a single-factor solution (eigenvalue = 8.90, explaining 63.5% of the variance) was strongly suggested. All items were retained with the exception of economical, as its factor loading (.55) was lower than the retention criteria of a factor loading of .60. Therefore, the final scale consisted of 13 items (α = .96) and was called the Perceptions of Meeting Quality (PMQ) Scale. The PMQ score is the mean across the 13 items.
Results
Descriptive Statistics and Correlations
Table 2 includes the means, standard deviations, and Pearson product–moment intercorrelations for the continuous and dichotomous variables under consideration. All correlations between dichotomous design characteristics (e.g., use of a facilitator, use of a meeting agreement) are point-biserial correlations. On a scale of 1 to 3 (higher numbers indicate more positive ratings), PMQ had a mean of 2.56 ( SD = 0.54). These results indicate that in general participants found their meeting experiences to be relatively positive. This is consistent with other recently published research on meetings ( Rogelberg et al., 2006). It is interesting that the individuals who considered themselves to be meeting facilitators reported significantly greater PMQ than those who did not ( M = 2.73, SD = 0.43; M = 2.52, SD = 0.55, respectively), t(365) = −2.97, p < .05.
Demographic characteristics significantly correlated with PMQ include participants' level of education ( r = −.12), organization type ( r = .20), and organizational position level ( r = .12), such that individuals with a lower level of education, those who worked for private as opposed to civic organizations, and those who had a higher organizational position level tended to perceive their meetings as of higher quality ( p < .05). Of note, the following demographic characteristics were not significantly correlated with PMQ: age, employment status, gender, number of hours worked per week, supervisory status, and time employed with the organization, p > .05.

Relationships Between Design Characteristics and PMQ
Temporal design characteristics. Meetings that start and end on time were rated more favorably than those that did not, r = .29 and r = .16, respectively, with PMQ, p < .05. Meeting length and break use were unrelated to PMQ, p > .05.
Physical design characteristics. PMQ correlated significantly, p < .05, with space ( r = .29; higher numbers indicate a more appropriate space), refreshments ( r = .11; food or beverages), temperature ( r = .17; higher ratings indicate more comfortable temperatures), and lighting ( r = .25; higher ratings indicate more appropriate lighting). As a categorical variable, the relationship between types of meeting space arrangements (e.g., circular-shaped table) and PMQ was tested with an analysis of variance (ANOVA), F(8, 358) = 0.765, which was nonsignificant, p > .05. Meeting modality, noise, and formal seating arrangement were unrelated to PMQ, p > .05.
Procedural design characteristics. Use of a meeting agreement (i.e., meeting ground rules) correlated with PMQ, r = .14, p < .05. The variable regarding the use of a formal agenda was analyzed in combination with a follow-up item: “If the meeting had a formal agenda, was it accessible prior to the meeting?” Therefore, this item was recoded into three categories: no formal agenda, formal agenda without prior access, and formal agenda with prior access. An ANOVA demonstrated that there were significant differences in PMQ, F(2, 359) = 4.19, across these three groups, p < .05. Follow-up Tukey HSD tests indicated that those with a formal agenda with prior access had significantly higher PMQ than either of the other two groups of attendees, p < .05, and those who had a formal agenda without prior access did not have significantly different PMQ from those who did not have a formal agenda, p > .05. Whether the meeting was recorded electronically and minutes were taken were unrelated to PMQ, p > .05.
Attendee design characteristics. The total number of meeting attendees correlated with PMQ, r = −.11, p < .05, with larger meetings seen as having lower quality. The use of a facilitator was not related to PMQ, p > .05.
Interaction Between Design Characteristics and Meeting Size
A direct effect of the number of meeting attendees on PMQ has already been established. However, to understand the impact in relation to the other design characteristics, we examined the interaction of the number of meeting attendees with each of the design characteristics. Each design characteristic was centered around zero to increase the interpretability of the interactions and also to limit the effect of multicollinearity ( Aiken & West, 1991). The original centered variables and the interaction term were entered into a series of regression equations. The only significant interaction, which was positive, was between meeting size and the presence of a facilitator, p < .05, such that larger meetings saw an increasingly positive impact on PMQ for meetings with a facilitator. This indicates that having a facilitator is a key factor for larger meetings. It is notable that we did not find a significant direct relationship between the presence of a facilitator and PMQ. All other interactions were nonsignificant, p > .05.
Discussion
In this study, we examined 18 meeting design characteristics from the empirical and trade literature, and we demonstrated that nine of these characteristics, spanning all four categories of design characteristics (i.e., temporal, physical, procedural, and attendee), significantly predicted PMQ. Furthermore, our study validates and greatly extends the significant design characteristics identified in Leach et al. (2009), namely agenda use, meeting punctuality, and facility quality, as well as the finding that participants who

serve as the meeting facilitator give a more positive rating of meeting quality. In addition, this study identifies specific relationships for several facility quality characteristics, including lighting, meeting space, refreshments, and temperature, and expands our knowledge of key characteristics by identifying agreement use and the number of attendees as important. Taken together, these findings suggest that effective meeting design warrants holistic attention to all meeting aspects.
As four of the nine significant characteristics were physical elements, having the right meeting surroundings and environment seems to be crucial. This aligns well with affective events theory, which proposes that work environment and events impact employee moods and emotions (i.e., affect), which in turn influence work attitudes and behaviors. Weiss and Cropanzano (1996) stated that “overall, the evidence suggests that a wide variety of environmental factors influence individual affect levels. By and large, these operate in the background but it seems clear that their consequences on organizational behaviors as mediated by mood states, are likely to be important” (p. 40). Our findings concur, suggesting that the meeting environment has the potential to alter affect, which in turn can lead to enhanced feelings of meeting satisfaction. These positive physical environment characteristics may also increase meeting focus by limiting the effect of distracting, uncomfortable, or upsetting surroundings.
Our finding that the number of meeting attendees has an inverse relationship with perceived quality also fits with having the “right” meeting environment. Meeting attendees themselves are part of the meeting environment, and having too many or unnecessary attendees may serve as a detraction, lead to additional inefficiencies, and in general create the feeling that time is not being used effectively. Expectation fulfillment is another trend seen throughout these findings: PMQ is heightened by characteristics that help set meeting expectations (i.e., premeeting agenda, meeting agreement), and conversely, PMQ is lessened when attendee expectations about time (i.e., meeting start and end times) are not met. Our finding that having an agenda without premeeting access is no better than not having an agenda at all further supports the need to set expectations prior to the meeting. Simply having a meeting guide or agenda that does not allow for premeeting preparation does not seem to add value.
Not all design characteristics, however, affected attendee PMQ. One obvious explanation is that some design characteristics may simply be unimportant in determining meeting outcomes (e.g., if the meeting was recorded electronically). Another is that some design characteristics may not be important to PMQ specifically but may impact other meeting outcomes, such as meeting goal attainment (e.g., meeting modality), or postmeeting productivity (e.g., if minutes were taken). Other design characteristics may only show their impact through an interaction with another design characteristic. We saw this result with the use of a facilitator, which did not have a direct effect on PMQ but did significantly interact with the number of attendees. A final reason for nonsignificance may be related to how the design characteristics were measured; we inquired whether or not a characteristic was present, not how well it was integrated or used.
Several factors other than design characteristics also showed significant relationships with PMQ. Respondents who served as meeting facilitators and those in higher organizational positions provided higher PMQ ratings, suggesting that employees in positions of power within meetings find these meetings to be of higher quality, whereas those not in positions of power find them to be of lower quality. This self-serving bias in perceiving activities for which one is responsible to have greater effectiveness is not surprising. Psychological research has shown that it is a common bias to evaluate subjective situations in a way favorable to one's own interests ( Kruger, 1999; Roese & Olson, 2007), which here involves believing that a meeting they facilitated was of a higher quality than attendees without a self-interest in the meeting quality. Given this apparent disparity in PMQ, to more accurately assess their meeting's

PMQ, meeting leaders may benefit from communicating with nonleader attendees to obtain a more objective assessment of the meeting's quality. This is worth exploring in greater depth in future research.
In summary, our pattern of significant and nonsignificant findings suggests that individual design characteristics have differential effects on meeting attendees' perceptions of meeting quality. Furthermore, the results regarding meeting size and presence of a facilitator indicate that the effects of individual design characteristics are not universal across all types of meetings. Therefore, each meeting must be evaluated individually in order to apply the most effective design.
Practical Implications
Our study's findings suggest that organizations would experience an increase in PMQ by considering design characteristics both prior to and during meetings. Prior to the meeting, meeting organizers should carefully consider the list of meeting attendees, and only attendees central to the meeting's purpose should be invited. Once the attendee list is finalized, the organizer should select an appropriately sized meeting space given the number of attendees, the meeting's purpose, and the meeting's technological and practical needs (e.g., Is a computer projector or whiteboard necessary? Will any attendees attend via a conference call?). The organizer should also create an agenda and distribute it to all attendees prior to the meeting to enable attendees to prepare for the designated topics. Lastly, the building facilities staff should consistently evaluate each meeting room's temperature and lighting levels to ensure that they are within desired parameters and will not adversely affect employees' ability to conduct business.
At the start of the meeting, the meeting organizer should ensure that the meeting begins at the predetermined start time, even if all attendees have not yet arrived. If appropriate, beverages, snacks, or a meal if the meeting is held during a mealtime should be arranged in advance. If beverages or food are provided, attendees should be allowed to serve themselves before beginning the meeting so as to not distract from the meeting's core purpose. Then, a meeting agreement (this can be informal) that addresses the meeting's topical and behavioral ground rules should be set forth. Lastly, the meeting should end at or before the predetermined end time.
Training should be provided to all employees who either organize or attend meetings to help ensure that these meeting design parameters are meaningfully integrated into an organization's meeting process. Training should include the fundamentals of how to incorporate these design characteristics into meetings as well as why they are important and the potential benefits employees and the business are likely to realize. This procedure will increase the likelihood that the new process will be understood, accepted, and implemented by employees. Employees who typically do not organize meetings but attend meetings may receive a lighter version of the training that focuses on the elements most relevant to their role in meetings (e.g., arriving promptly), as that will aid both the meeting organizers in executing this new process as well as the organization as a whole in bringing about any culture changes that may be necessary.
Limitations and Future Research
A limitation of our study's method was our use of correlational analysis and the resulting inability to draw causal conclusions. This could be addressed by conducting future research using an experimental methodology, thus allowing the direction of causality to be clearly identified. Furthermore, PMQ may change over time. Future research may consider gathering this rating both right after the meeting and at a later date to further understand this possible effect.
Another limitation of this study was that both the predictor and outcome variables were measured using the same method; therefore, it is possible that the results may at least partially be a result of common

method bias (CMB). Although recent scholarship has suggested that the impact of CMB is overstated (e.g., Conway & Lance, 2010), it is important to note the following. First, consistent with the reasoning of Frese and Zapf (1988), we suggest that our predictors were generally objective and thus not subject to method bias. Second, our pattern of findings is not suggestive of CMB. If CMB were at play, one would expect all design characteristics to be significantly related to the outcome variable as well as a baseline level of correlation among all variables assessed on the survey ( Spector, 2006). That was not the case, as we had a plethora of significant and nonsignificant design factors. Lastly, according to Podsakoff, MacKenzie, Lee, and Podsakoff (2003), using a variety of scale formats and endpoints, as we did in our study, can mitigate CMB. Still, future work will benefit from alternative approaches for measuring design characteristics (e.g., observation).
Low response rates are becoming more and more the norm in applied survey research ( Anseel, Lievens, Schollaert, & Choragwicka, 2010); as our final response rate was only 18.5%, there is the potential for nonresponse bias. We would argue, however, that based on several factors, this bias does not seem to be at play. First, nonresponse bias is more likely to impact measures of central tendency and not bivariate relationships ( Rogelberg et al., 2003), and our dependent variable had a good amount of variation with no evidence of range restriction. Second, age and gender are often predictors of nonresponse ( Rogelberg & Stanton, 2007), and neither was significantly related to our dependent measure. Finally, our sample was very diverse demographically (e.g., position rank, length of employment, hours worked, age, education level), and the pattern of results was nearly the same for each of these participant breakouts.
Perceptions of meetings are but one meeting outcome, and many others, such as actual effectiveness and efficiency, exist. Although group decision-making research has found that participants' perceptions of group performance are useful indicators of actual group performance (e.g., Rogelberg, Barnes-Farrell, & Lowe, 1992), actual meeting quality would have been a valuable outcome to examine. Relatedly, designing meetings as suggested here may improve meeting perceptions, but the effect of such designs on other meeting outcomes is yet unknown. Furthermore, by improving one facet of meeting outcomes (i.e., PMQ), other outcomes (e.g., cohesion) may inadvertently be affected either positively or negatively.
Conclusion
As discussed earlier, participants' evaluation of meeting quality is an important criterion variable for a number of reasons. First, given the number of meetings employees attend, affective reactions to them are important to understand. Second, how we perceive our environment helps us form attitudes toward that environment, which in turn affects how we think about and behave in that environment at present and in the future. It follows that employee perceptions of meetings can have important attitudinal and behavioral implications as well, which can impact how meetings are viewed, attended, used, and supported, and can ultimately affect a meeting's ability to accomplish its goals. Therefore, finding ways to provide meeting attendees with more positive meeting experiences may have a lasting effect that extends beyond the meeting at hand.
Although future research is needed to sort out the boundaries of our results, our findings have the potential to energize new research on meetings. In addition, our data have pragmatic value. If an organization's goal is to improve or promote meeting quality, this study's results could be quite useful. Admittedly, some design characteristics are more challenging to control than others (e.g., the only meeting space available may be too small or too large); however, all are potentially within the meeting organizer's control, and as such, organizers should consider these design characteristics when planning and conducting staff/team meetings. Furthermore, organizations should support employee efforts to hold

better designed meetings by ensuring appropriate meeting space availability, employee training, and organizational culture change.


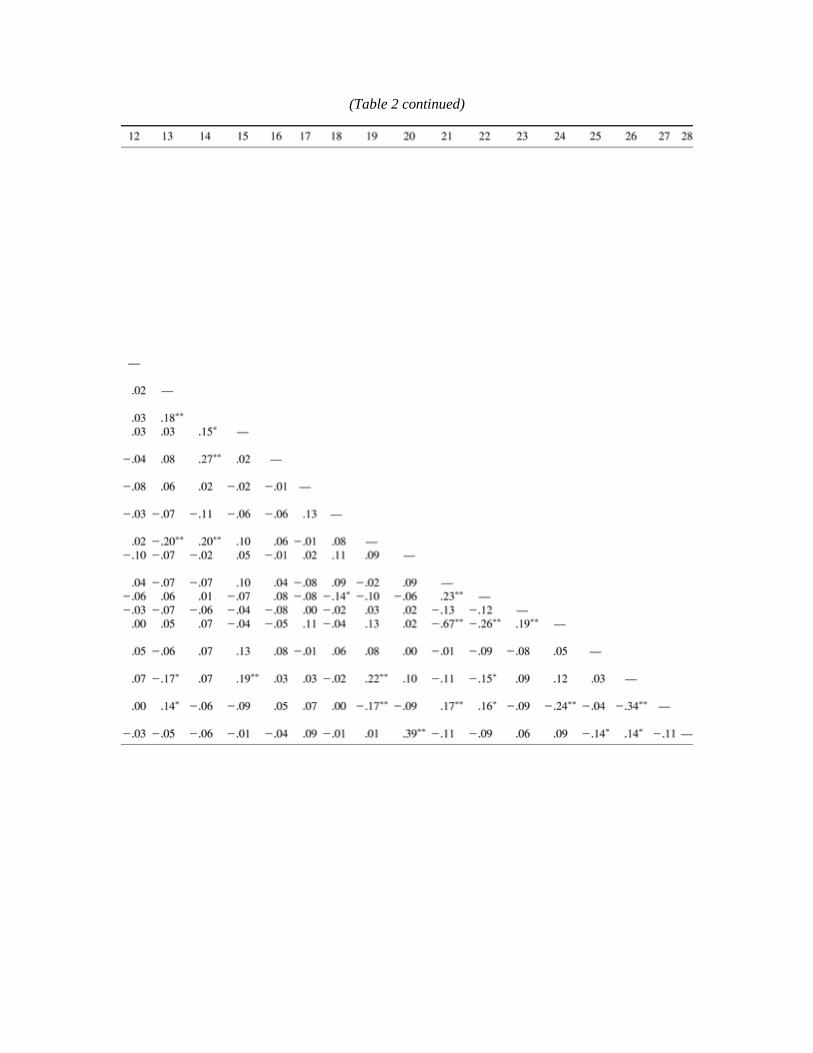
(Table 2 continued)

References
Aiken, L. S., & West, S. G. ( 1991). Multiple regression: Testing and interpreting interactions. Newbury Park, CA: Sage.
Ajzen, I., & Fishbein, M. ( 1980). Understanding attitudes and predicting social behavior. Englewood Cliffs, NJ: Prentice Hall.
Anseel, F., Lievens, F., Schollaert, E., & Choragwicka, B. ( 2010). Response rates in organizational science, 1995–2008: A meta-analytic review and guidelines for survey researchers. Journal of Business and Psychology, 25, 335– 350.
Belbin, M. ( 1997). Conventional wisdom. People Management, 3( 23), 34– 38. Bennett, R. J. ( 1998). Perceived powerlessness as a cause of employee deviance. In R.
W.Griffin, A.O'Leary-Kelly, & J. M.Collins ( Eds.) , Dysfunctional behavior in organizations: Violent and deviant behavior (pp. 221– 239). Stamford, CT: JAI Press.
Bluedorn, A. C., Turban, D. B., & Love, M. S. ( 1999). The effects of stand-up and sit-down meeting formats on meeting outcomes. Journal of Applied Psychology, 84, 277– 285.
Bradford, L. P. ( 1976). Making meetings work. San Diego, CA: University Associates. Clark, T. ( 1998). Teaching students to enhance the ecology of small group meetings. Business
Communication Quarterly, 61, 40– 52. Conway, J. M., & Lance, C. E. ( 2010). What reviewers should expect from authors regarding
common method bias in organizational research. Journal of Business and Psychology, 25, 325– 334.
Frese, M., & Zapf, D. ( 1988). Methodological issues in the study of work stress: Objective vs. subjective measurement and the question of longitudinal studies. In C. L.Cooper & R.Payne ( Eds.) , Causes, coping, and consequences of stress at work (pp. 375– 411). New York: Wiley.
Gastil, J. ( 1993). Identifying obstacles to small group democracy. Small Group Research, 24, 5– 27.
Gladstein, D. L. ( 1984). Groups in context: A model of task group effectiveness. Administrative Science Quarterly, 29, 499– 517.
Hackman, J. R., & Oldham, G. R. ( 1980). Work redesign. Reading, MA: Addison Wesley. Howell, W. C. ( 1991). Human factors in the workplace. In M. D.Dunnette & L. M.Hough (
Eds.) , Handbook of industrial and organizational psychology ( Vol. 2, 2nd ed., pp. 209– 269). Palo Alto, CA: Consulting Psychologists Press.
Ingham, A. G., Levinger, G., Graves, J., & Peckham, V. ( 1974). The Ringelmann effect: Studies of group size and group performance. Journal of Experimental Social Psychology, 10, 371– 384.
Jackson, N. F., Aiken, M. W., Vanjani, J. B., & Hasan, B. S. ( 1995). Support group decisions via computer systems. Quality Progress, 28( 5), 75– 78.
Johansen, R., Vallee, J., & Spangler, K. ( 1979). Electronic meetings: Technical alternatives and social choices. Menlo Park, CA: Addison Wesley.
Kerr, N. L., MacCoun, R. J., & Kramer, G. P. ( 1996). Bias in judgment: Comparing individuals and groups. Psychological Review, 103, 687– 719.
Kieffer, G. D. ( 1988). The strategy of meetings. New York: Warner. Kruger, J. ( 1999). Lake Wobegon be gone! The “below-average effect” and the egocentric
nature of comparative ability judgments. Journal of Personality and Social Psychology, 77, 221– 232.

Lantz, A. ( 2001). Meetings in a distributed group of experts: Comparing face-to-face, chat and collaborative virtual environments. Behaviour & Information Technology, 20, 111– 117.
Leach, D. J., Rogelberg, S. G., Warr, P. B., & Burnfield, J. L. ( 2009). Perceived meeting effectiveness: The role of design characteristics. Journal of Business and Psychology, 24, 65– 76.
Litsikas, M. ( 1995). Overcome team problems. Quality, 34( 9), 26–28, 30, 32. Luong, A., & Rogelberg, S. G. ( 2005). Meetings and more meetings: The relationship between
meeting load and the daily well-being of employees. Group Dynamics: Theory, Research, and Practice, 9, 58– 67.
Maitlis, S. ( 2005). The social processes of organizational sensemaking. Academy of Management Journal, 48, 21– 49.
Mariotti, J. ( 1997). Had any good hallway meetings lately?Industry Week, 246( 22), 50. McComas, K. A. ( 2003). Citizen satisfaction with public meetings used for risk communication.
Journal of Applied Communication Research, 31, 164– 184. McComas, K. A., Tuit, L. S., Waks, L., & Sherman, L. A. ( 2007). Predicting satisfaction and
outcome acceptance with advisory committee meetings: The role of procedural justice. Journal of Applied Social Psychology, 37, 905– 927.
MCI Inc. ( 1998). Meetings in America: A study of trends, costs and attitudes toward business travel, teleconferencing and their impact on productivity. Retrieved from http://e-meetings.verizonbusiness.com/global/en/meetingsinamerica/uswhitepaper.php
Mosvick, R. K., & Nelson, R. B. ( 1987). We've got to start meeting like this! A guide to successful business meeting management. Glenview, IL: Scott Foresman.
Mullen, B. ( 1991). Group composition, salience, and cognitive representations: The phenomenology of being in a group. Journal of Experimental Social Psychology, 22, 297– 323.
Napier, R. W., & Gershenfeld, M. K. ( 1989). Groups: Theory and experience. Boston: Houghton Mifflin.
Niederman, F., & Volkema, R. J. ( 1999). The effects of facilitator characteristics on meeting preparation, set up, and implementation. Small Group Research, 30, 330– 360.
Piccolo, R. F., & Colquitt, J. A. ( 2006). Transformational leadership and job behaviors: The mediating role of core job characteristics. Academy of Management Journal, 49, 327– 340.
Podsakoff, P. M., MacKenzie, S. B., Lee, J. Y., & Podsakoff, N. P. ( 2003). Common method biases in behavioral research: A critical review of the literature and recommended remedies. Journal of Applied Psychology, 88, 879– 903.
Reinig, B. A., & Shin, B. ( 2003). The dynamic effects of group support systems on group meetings. Journal of Management Information Systems, 19, 303– 325.
Roese, N. J., & Olson, J. M. ( 2007). Better, stronger, faster: Self-serving judgment, affect regulation, and the optimal vigilance hypothesis. Perspectives on Psychological Science, 2, 124– 141.
Rogelberg, S. G., Allen, J. A., Shanock, L., Scott, C. W., & Shuffler, M. ( 2010). Employee satisfaction with their meetings: A unique predictor of job satisfaction. Human Resource Management, 49, 149– 172.
Rogelberg, S. G., Barnes-Farrell, J. L., & Lowe, C. A. ( 1992). The Stepladder Technique: A structure facilitating effective group decision making. Journal of Applied Psychology, 77, 730– 737.

Rogelberg, S. G., Conway, J. M., Sederburg, M. E., Spitzmueller, C., Aziz, S., & Knight, W. E. ( 2003). Profiling active and passive nonrespondents to an organizational survey. Journal of Applied Psychology, 88, 1104– 1114.
Rogelberg, S. G., Leach, D. J., Warr, P. B., & Burnfield, J. L. ( 2006). “Not another meeting!” Are meeting time demands related to employee well-being?Journal of Applied Psychology, 91, 86– 96.
Rogelberg, S. G., Scott, C. S., & Kello, J. ( 2007). The science and fiction of meetings. MIT Sloan Management Review, 48, 18– 21.
Rogelberg, S. G., & Stanton, J. M. ( 2007). Understanding and dealing with organizational survey nonresponse. Organizational Research Methods, 10, 195– 209.
Sandberg, J. ( 2008, April5). Another meeting? Good. Another chance to hear myself talk. The Wall Street Journal Online. Retrieved from http://www.livemint.com/2008/04/05003008/Another-meeting-Good-Another.html
Sanders, M. S., & McCormick, E. J. ( 1987). Human factors in engineering and design ( 6th ed.). New York: McGraw-Hill.
Sheridan, J. H. ( 1989). A $37 billion waste. Industry Week, 238( 17), 11– 12. Smith, P. C., Kendall, L. M., & Hulin, C. L. ( 1969). The measurement of satisfaction in work
and retirement. Chicago: Rand-McNally. Spector, P. E. ( 2006). Method variance in organizational research: Truth or urban
legend?Organizational Research Methods, 9, 221– 232. Thomsett, M. C. ( 1989). The little black book of business meetings. New York: American
Management Association. Tobia, P. M., & Becker, M. C. ( 1990). Making the most of meeting time. Training &
Development Journal, 34( 8), 34– 38. Tropman, J. E., & Morningstar, G. C. ( 1985). Meetings: How to make them work for you. New
York: Van Nostrand Reinhold. Van Vree, W. ( 1999). Meetings, manners and civilization: The development of modern meeting
behaviour. London: Leicester University Press. Volkema, R. J., & Niederman, F. ( 1995). Organizational meetings: Formats and information
requirements. Small Group Research, 26, 3– 24. Waddell, W. C., & Rosko, T. A. ( 1993). Conducting an effective off-site meeting. Management
Review, 82( 2), 40– 44. Weiss, H. M., & Cropanzano, R. ( 1996). An affective events approach to job satisfaction. In B.
M.Staw & L. L.Cummings ( Eds.) , Research in organizational behavior ( Vol. 18, pp. 1– 74). Greenwich, CT: JAI Press.
Wicker, A. W., Kirmeyer, S. L., Hanson, L., & Alexander, D. ( 1976). Effects of manning levels of subjective experiences, performance, and verbal interaction in groups. Organizational Behavior and Human Performance, 17, 251– 274.