Embed Size (px)
Citation preview
Methodology for Ecodesign of Energy‐related Products
MEErP 2011 Consultation Forum 20.1.2012
COWI Belgium sprl ‐in association with‐ Van Holsteijn en Kemna B.V. (VHK)
Prepared for the European Commission, DG Enterprise and Industry U i B1 S i bl I d i l P liUnit B1 Sustainable Industrial Policy
under specific contract SI2.581529, Technical Assistance for the update of the under specific contract SI2.581529, Technical Assistance for the update of the Methodology for the Ecodesign of Energy‐using products (MEEuP), within the framework service contract TREN/R1/350‐2008 Lot 3
R é K ( l )René Kemna (p.l.) Brussels/ Delft, 28 Nov. 2011
DISCLAIMER:The sole responsibility for the content of this report lies with the authors. It does not necessarily reflectp y p ythe opinion of the European Communities. The European Commission is not responsible for any use that
may be made of the information contained therein.
The authors have produced this report to their best ability and knowledge, nevertheless they assume noliability for any damages, material or immaterial, that may arise from the use of the report or its content.
MEErP 2011 Methodology Reports
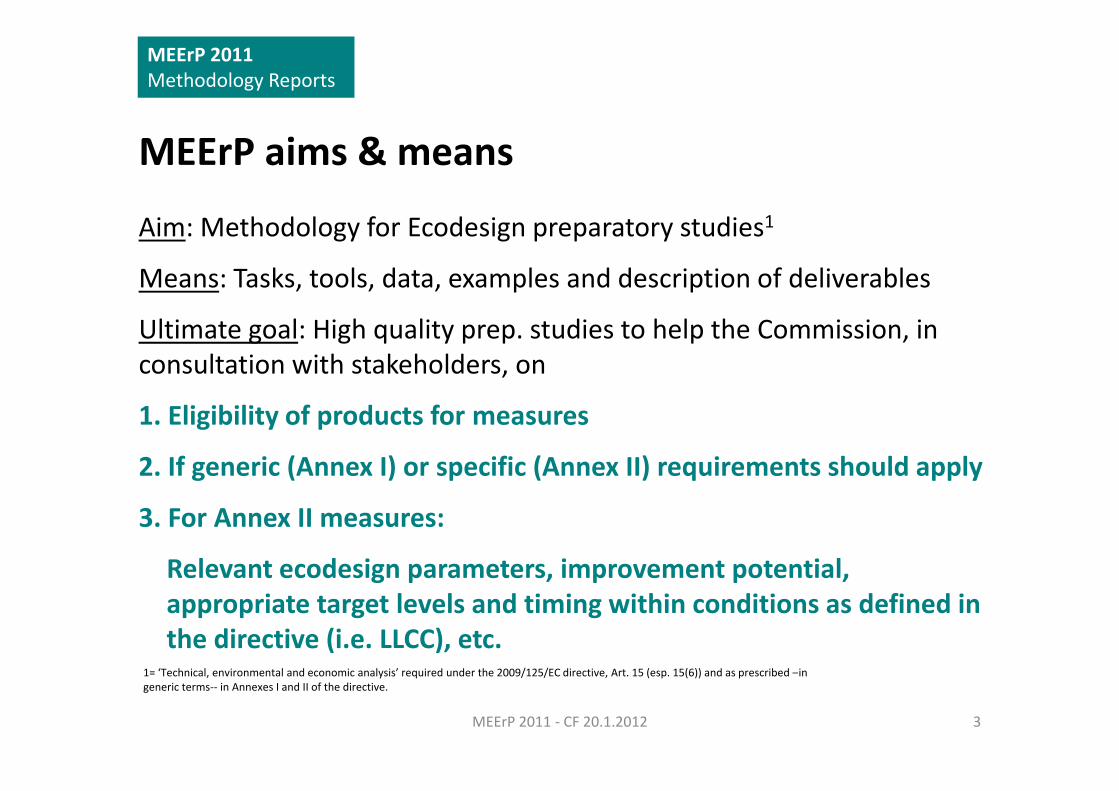
MEErP aims & means1Aim: Methodology for Ecodesign preparatory studies1
Means: Tasks, tools, data, examples and description of deliverables
Ultimate goal: High quality prep. studies to help the Commission, in consultation with stakeholders, on
1. Eligibility of products for measures
2. If generic (Annex I) or specific (Annex II) requirements should apply
3. For Annex II measures:
Relevant ecodesign parameters, improvement potential,Relevant ecodesign parameters, improvement potential, appropriate target levels and timing within conditions as defined in the directive (i.e. LLCC), etc.
3MEErP 2011 ‐ CF 20.1.2012
1= ‘Technical, environmental and economic analysis’ required under the 2009/125/EC directive, Art. 15 (esp. 15(6)) and as prescribed –in generic terms‐‐ in Annexes I and II of the directive.
MEErP 2011 Methodology Reports
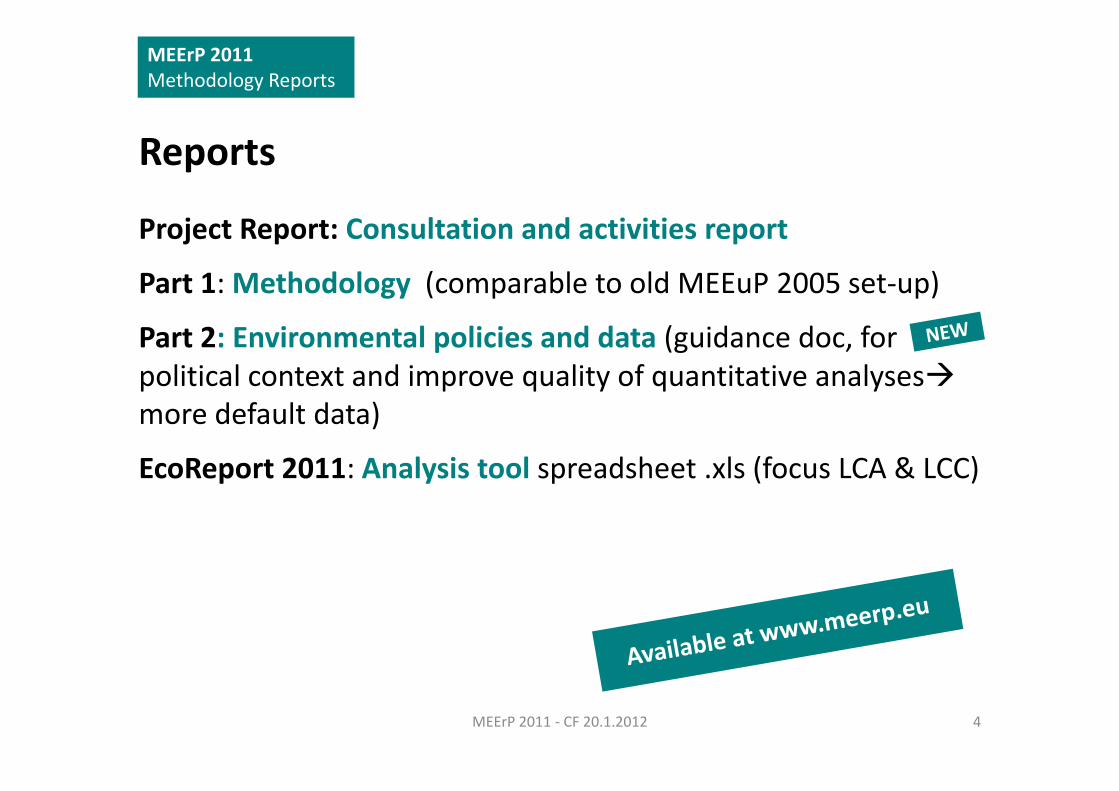
Reports
Project Report: Consultation and activities report
Part 1: Methodology (comparable to old MEEuP 2005 set‐up)
Part 2: Environmental policies and data (guidance doc, for political context and improve quality of quantitative analysesmore default data)
EcoReport 2011: Analysis tool spreadsheet .xls (focus LCA & LCC)
4MEErP 2011 ‐ CF 20.1.2012
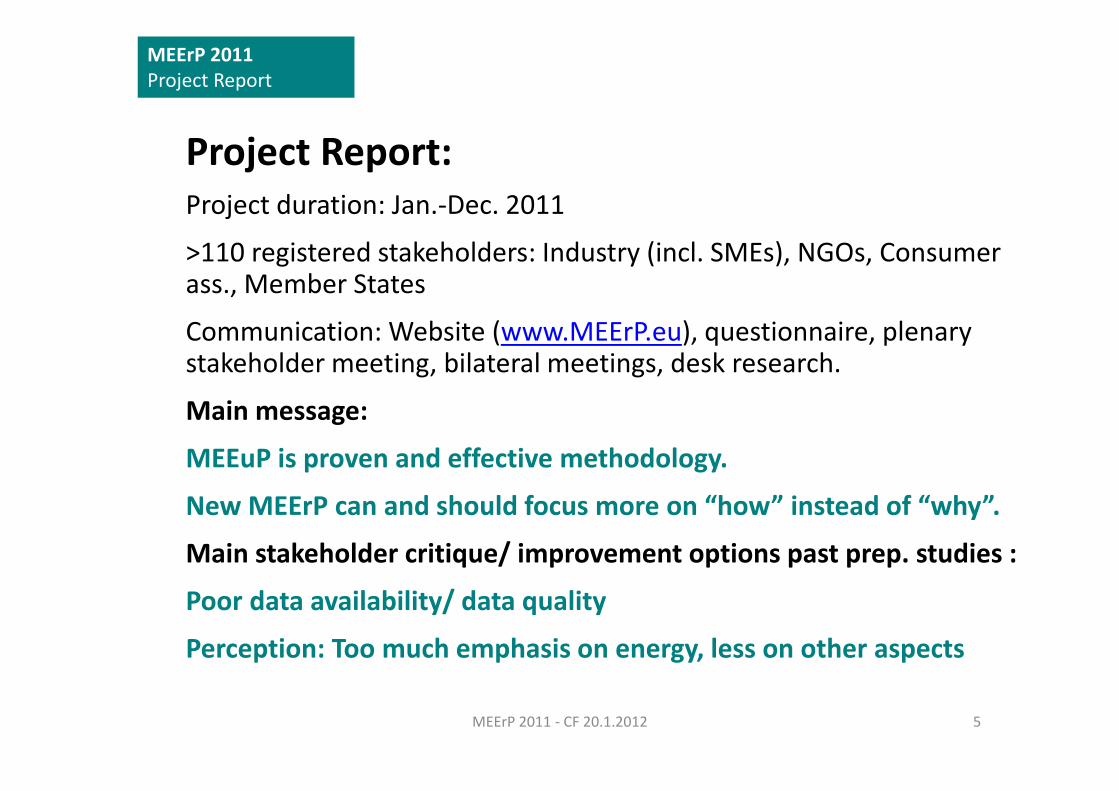
MEErP 2011 Project Report
Project Report:Project duration: Jan.‐Dec. 2011j
>110 registered stakeholders: Industry (incl. SMEs), NGOs, Consumer ass., Member States
Communication: Website (www.MEErP.eu), questionnaire, plenary stakeholder meeting, bilateral meetings, desk research.
Main message:
MEEuP is proven and effective methodology.
New MEErP can and should focus more on “how” instead of “why”.
Main stakeholder critique/ improvement options past prep. studies :
Poor data availability/ data quality
Perception: Too much emphasis on energy, less on other aspects
5MEErP 2011 ‐ CF 20.1.2012
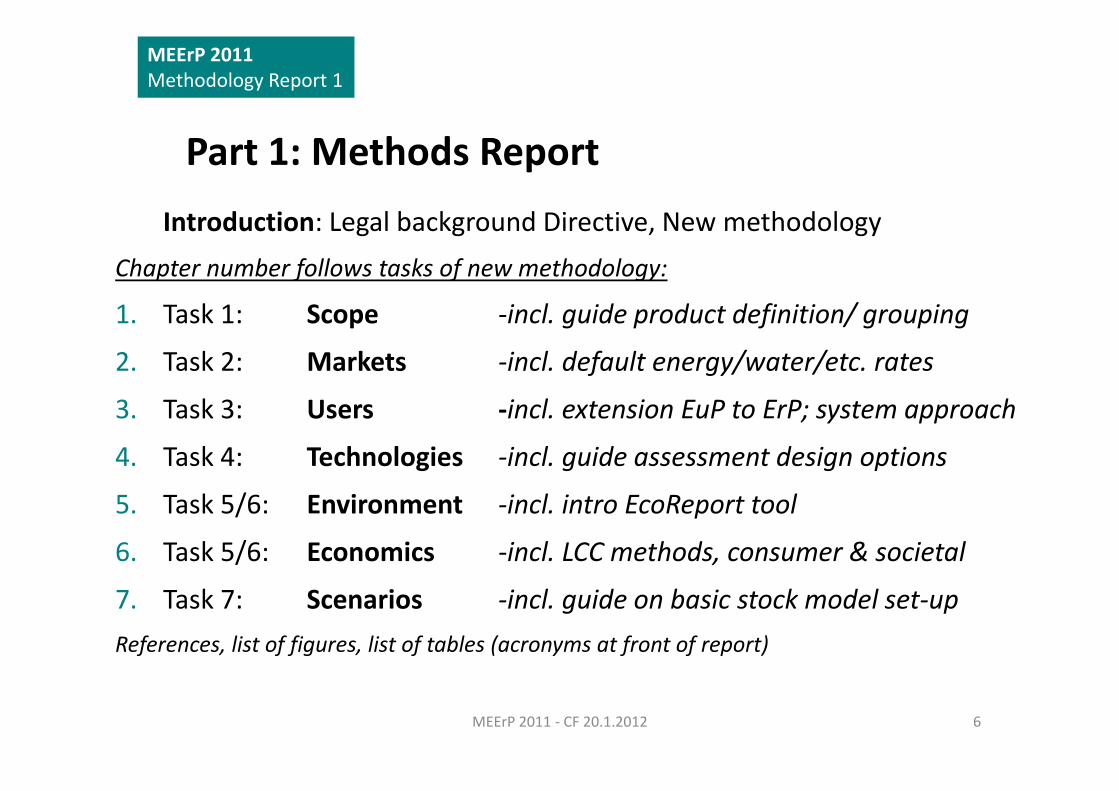
MEErP 2011 Methodology Report 1
Part 1: Methods ReportI t d ti L l b k d Di ti N th d lIntroduction: Legal background Directive, New methodology
Chapter number follows tasks of new methodology:
1 T k 1 S i l id d d fi i i / i1. Task 1: Scope ‐incl. guide product definition/ grouping
2. Task 2: Markets ‐incl. default energy/water/etc. rates
3. Task 3: Users ‐incl. extension EuP to ErP; system approach
4. Task 4: Technologies ‐incl. guide assessment design options
5. Task 5/6: Environment ‐incl. intro EcoReport tool
6. Task 5/6: Economics ‐incl. LCC methods, consumer & societal
7. Task 7: Scenarios ‐incl. guide on basic stock model set‐up References, list of figures, list of tables (acronyms at front of report)
6MEErP 2011 ‐ CF 20.1.2012
MEErP 2011 Methodology Reports
Part 2: Policies & Date Report structure
Materials
RecyclingEcoReport Unit Indicators
Climate, Energy & BuildingsEnergy
Water
, gy g
PeopleWater
Waste
Emissions
Other impacts
7MEErP 2011 ‐ CF 20.1.2012
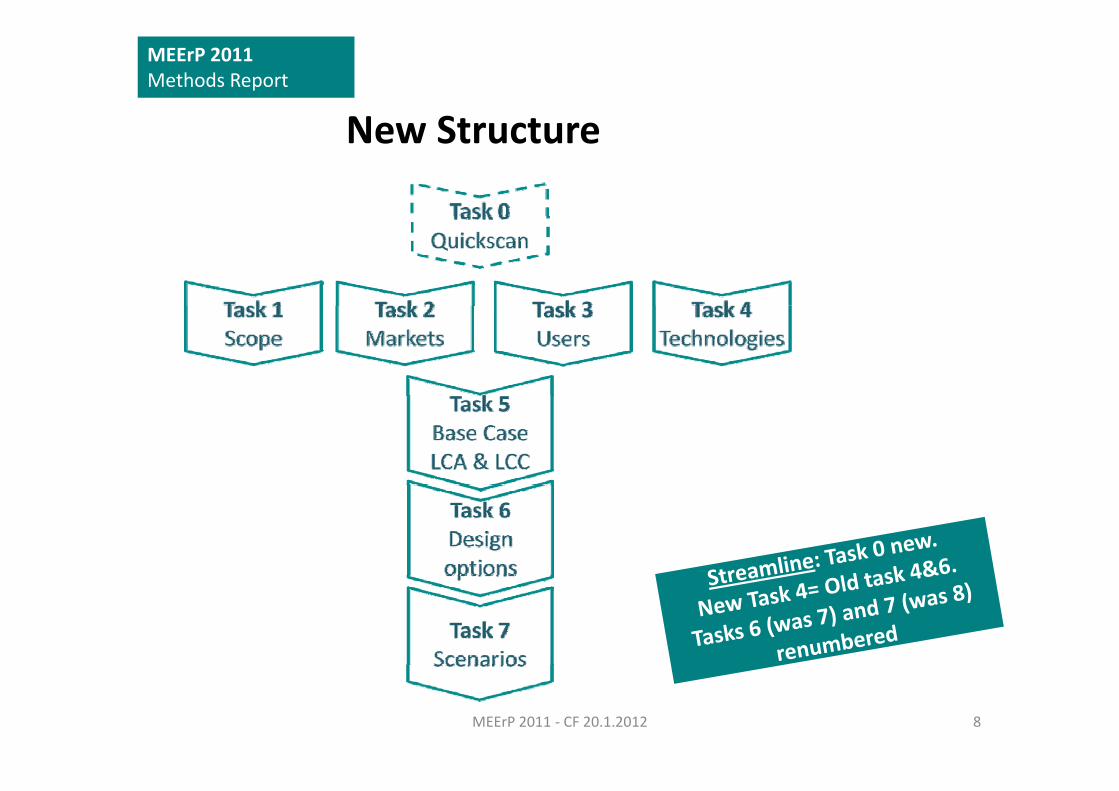
New Structure
MEErP 2011 Methods Report
New Structure
8MEErP 2011 ‐ CF 20.1.2012
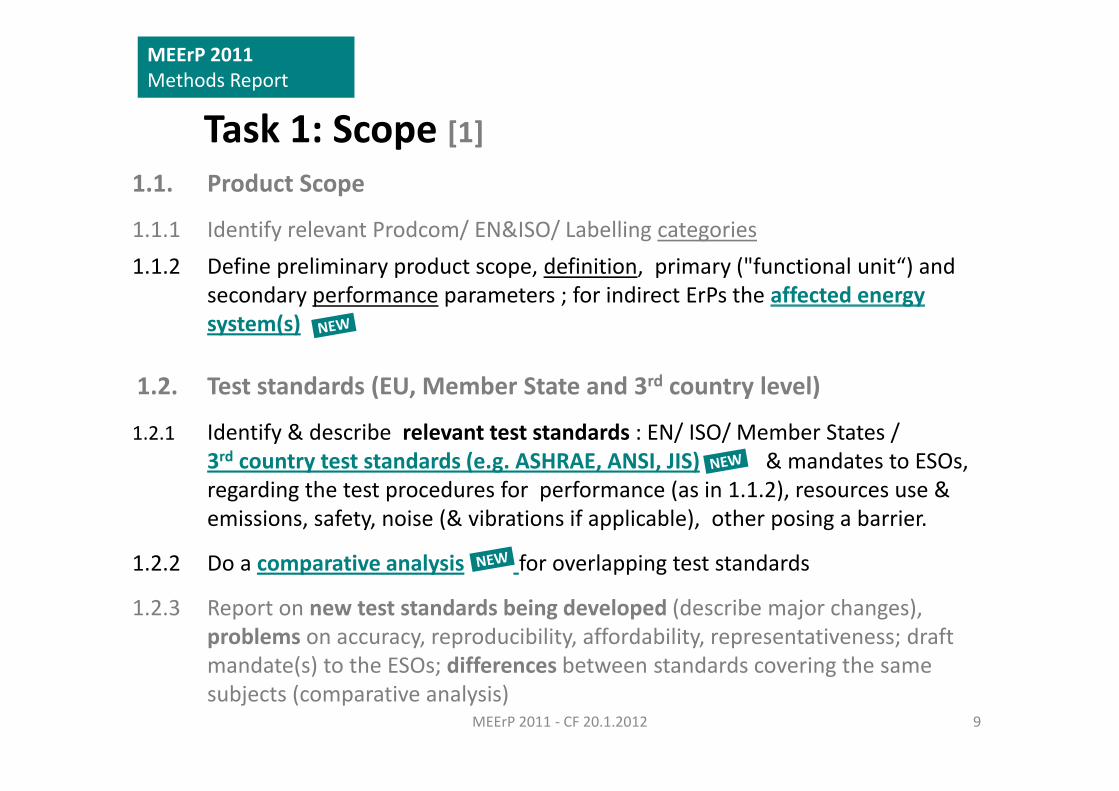
Task 1: Scope [1]
MEErP 2011 Methods Report
Task 1: Scope [1]1.1. Product Scope
1.1.1 Identify relevant Prodcom/ EN&ISO/ Labelling categories1.1.2 Define preliminary product scope, definition, primary ("functional unit“) and
secondary performance parameters ; for indirect ErPs the affected energy y p p gysystem(s)
1.2. Test standards (EU, Member State and 3rd country level)( , y )
1.2.1 Identify & describe relevant test standards : EN/ ISO/ Member States / 3rd country test standards (e.g. ASHRAE, ANSI, JIS) & mandates to ESOs,
di th t t d f f ( i 1 1 2) ®arding the test procedures for performance (as in 1.1.2), resources use & emissions, safety, noise (& vibrations if applicable), other posing a barrier.
1.2.2 Do a comparative analysis for overlapping test standards
1.2.3 Report on new test standards being developed (describe major changes), problems on accuracy, reproducibility, affordability, representativeness; draft mandate(s) to the ESOs; differences between standards covering the samemandate(s) to the ESOs; differences between standards covering the same subjects (comparative analysis)
9MEErP 2011 ‐ CF 20.1.2012
Task 1 [2]
MEErP 2011 Methods Report
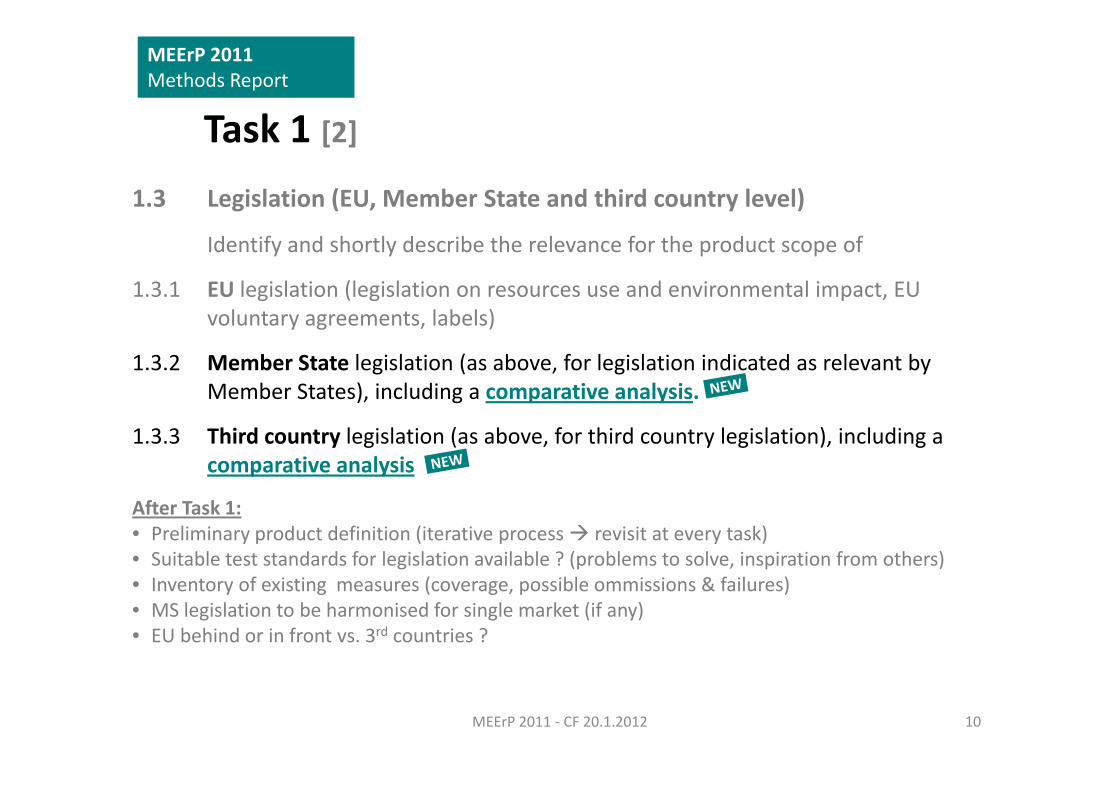
Task 1 [2]1.3 Legislation (EU, Member State and third country level)
Identify and shortly describe the relevance for the product scope of
1.3.1 EU legislation (legislation on resources use and environmental impact, EU voluntary agreements, labels)
1.3.2 Member State legislation (as above, for legislation indicated as relevant by Member States) including a comparative analysis.Member States), including a comparative analysis.
1.3.3 Third country legislation (as above, for third country legislation), including a comparative analysis
After Task 1: • Preliminary product definition (iterative process revisit at every task)• Suitable test standards for legislation available ? (problems to solve, inspiration from others)• Inventory of existing measures (coverage, possible ommissions & failures)• MS legislation to be harmonised for single market (if any)• EU behind or in front vs. 3rd countries ?
10MEErP 2011 ‐ CF 20.1.2012
Task 2: Markets [1]
MEErP 2011 Methods Report
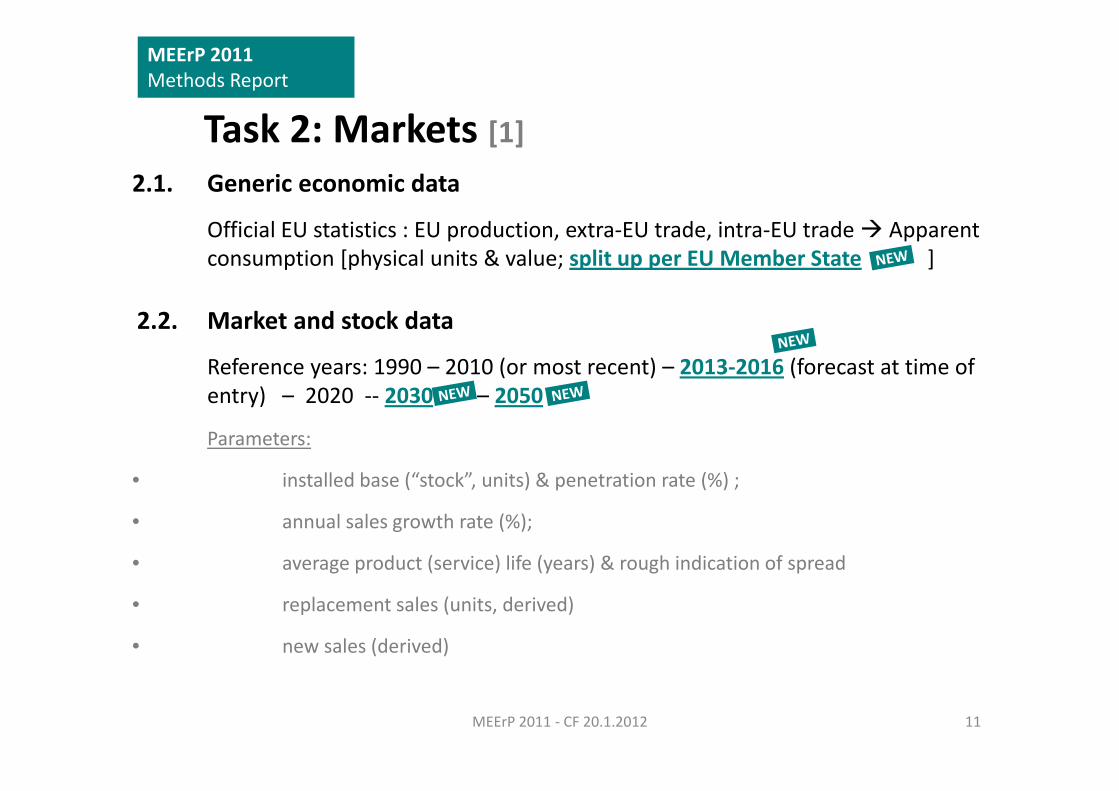
Task 2: Markets [1]2.1. Generic economic data
Official EU statistics : EU production, extra‐EU trade, intra‐EU trade Apparent consumption [physical units & value; split up per EU Member State ]
2.2. Market and stock data
Reference years: 1990 – 2010 (or most recent) – 2013‐2016 (forecast at time of entry) – 2020 2030 – 2050entry) – 2020 ‐‐ 2030 – 2050
Parameters:
• installed base (“stock”, units) & penetration rate (%) ;installed base ( stock , units) & penetration rate (%) ;
• annual sales growth rate (%);
• average product (service) life (years) & rough indication of spread
• replacement sales (units, derived)
• new sales (derived)
11MEErP 2011 ‐ CF 20.1.2012
Task 2: Markets [2]
MEErP 2011 Methods Report
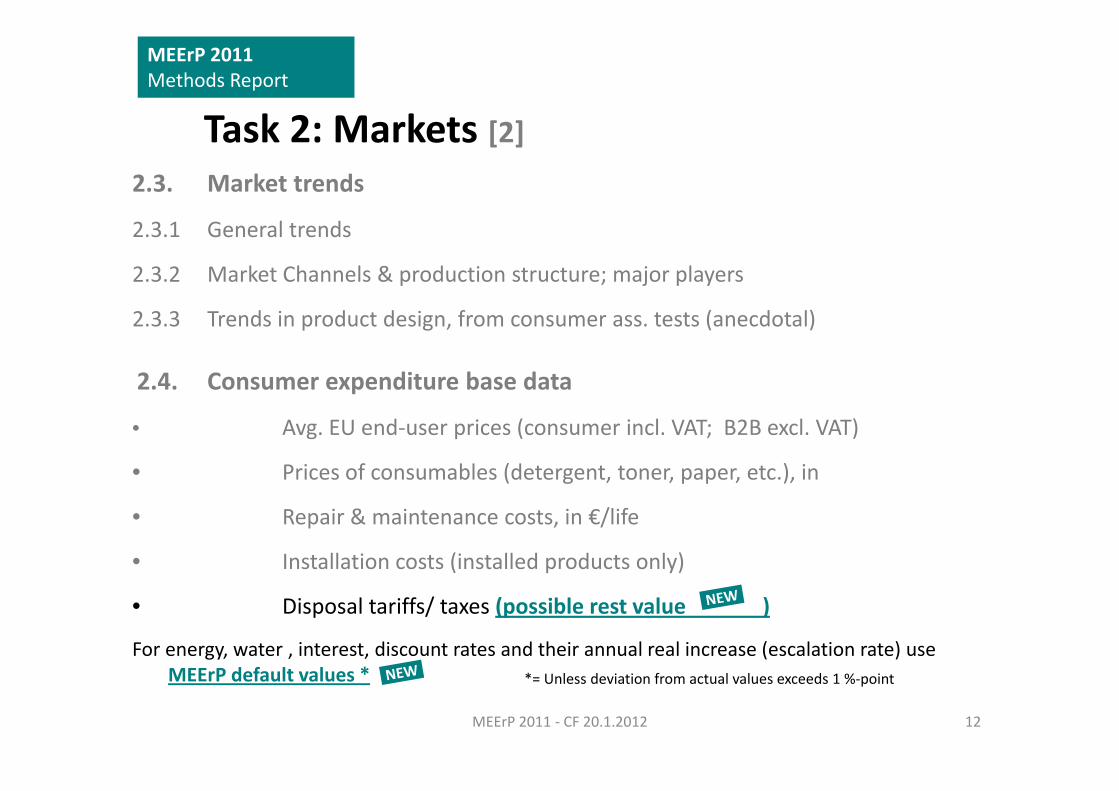
Task 2: Markets [2]2.3. Market trends
2.3.1 General trends
2.3.2 Market Channels & production structure; major players
2.3.3 Trends in product design, from consumer ass. tests (anecdotal)
2.4. Consumer expenditure base data
• Avg. EU end‐user prices (consumer incl. VAT; B2B excl. VAT)
• Prices of consumables (detergent, toner, paper, etc.), in
• Repair & maintenance costs, in €/life
• Installation costs (installed products only)
• Disposal tariffs/ taxes (possible rest value )
For energy, water , interest, discount rates and their annual real increase (escalation rate) use MEErP default values *
12MEErP 2011 ‐ CF 20.1.2012
*= Unless deviation from actual values exceeds 1 %‐point
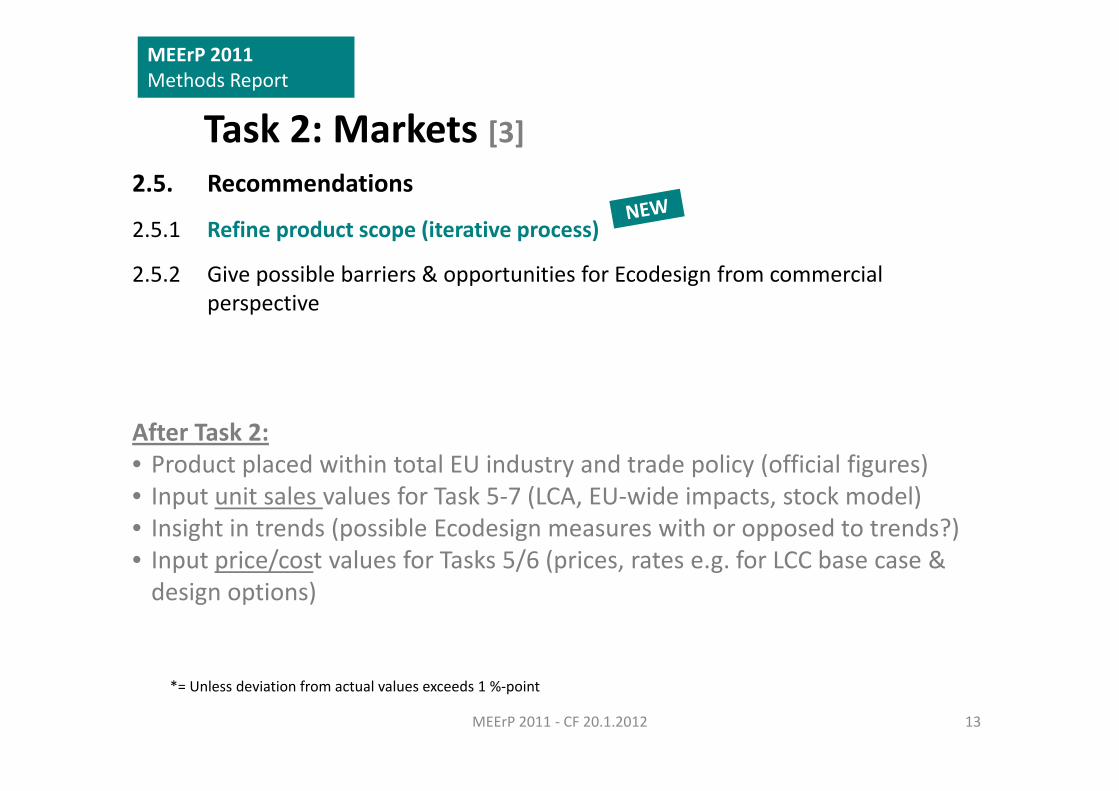
Task 2: Markets [3]
MEErP 2011 Methods Report
Task 2: Markets [3]2.5. Recommendations
2.5.1 Refine product scope (iterative process)
2.5.2 Give possible barriers & opportunities for Ecodesign from commercial perspectiveperspective
After Task 2: • Product placed within total EU industry and trade policy (official figures)• Input unit sales values for Task 5‐7 (LCA, EU‐wide impacts, stock model)• Insight in trends (possible Ecodesign measures with or opposed to trends?)• Input price/cost values for Tasks 5/6 (prices, rates e.g. for LCC base case & design options)
13MEErP 2011 ‐ CF 20.1.2012
*= Unless deviation from actual values exceeds 1 %‐point
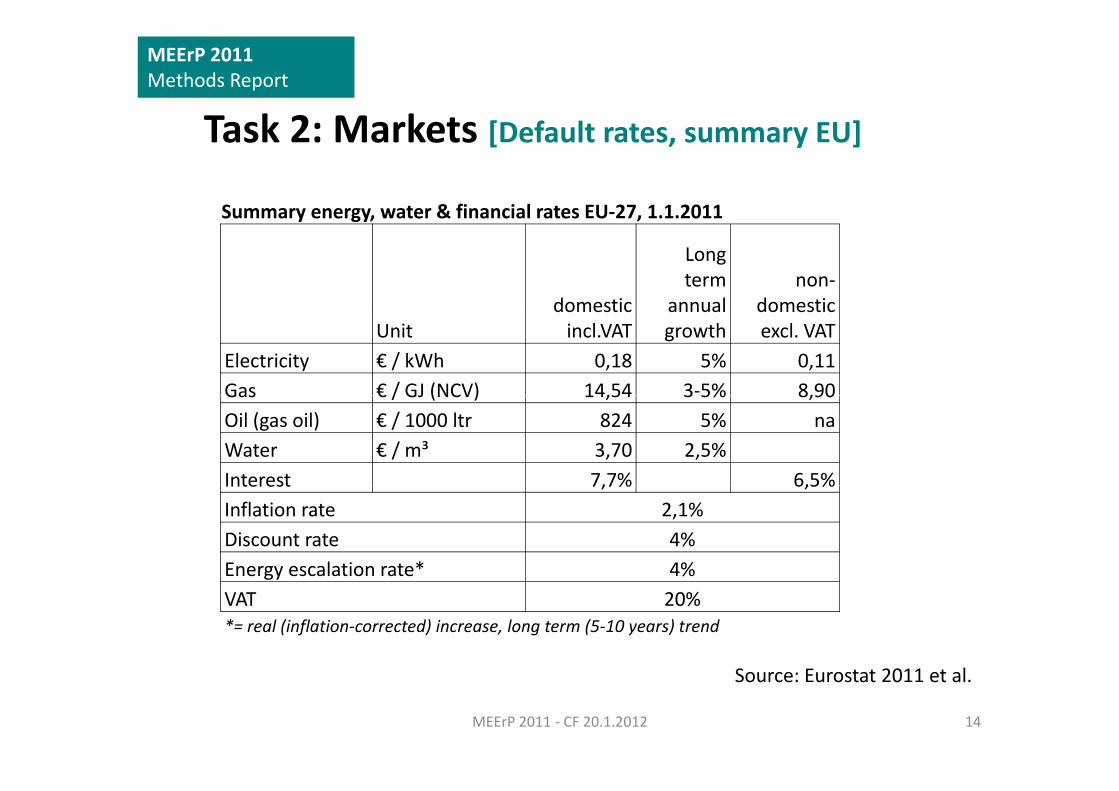
Task 2: Markets [D f lt t EU]
MEErP 2011 Methods Report
Task 2: Markets [Default rates, summary EU]
Summary energy, water & financial rates EU‐27, 1.1.2011Summary energy, water & financial rates EU 27, 1.1.2011
domestic
Long term
annualnon‐
domesticUnit
domestic incl.VAT
annual growth
domestic excl. VAT
Electricity € / kWh 0,18 5% 0,11Gas € / GJ (NCV) 14,54 3‐5% 8,90Gas € / GJ (NCV) 14,54 3 5% 8,90Oil (gas oil) € / 1000 ltr 824 5% naWater € / m³ 3,70 2,5%Interest 7,7% 6,5%Interest 7,7% 6,5%Inflation rate 2,1%Discount rate 4%Energy escalation rate* 4%Energy escalation rate 4%VAT 20%*= real (inflation‐corrected) increase, long term (5‐10 years) trend
14MEErP 2011 ‐ CF 20.1.2012
Source: Eurostat 2011 et al.
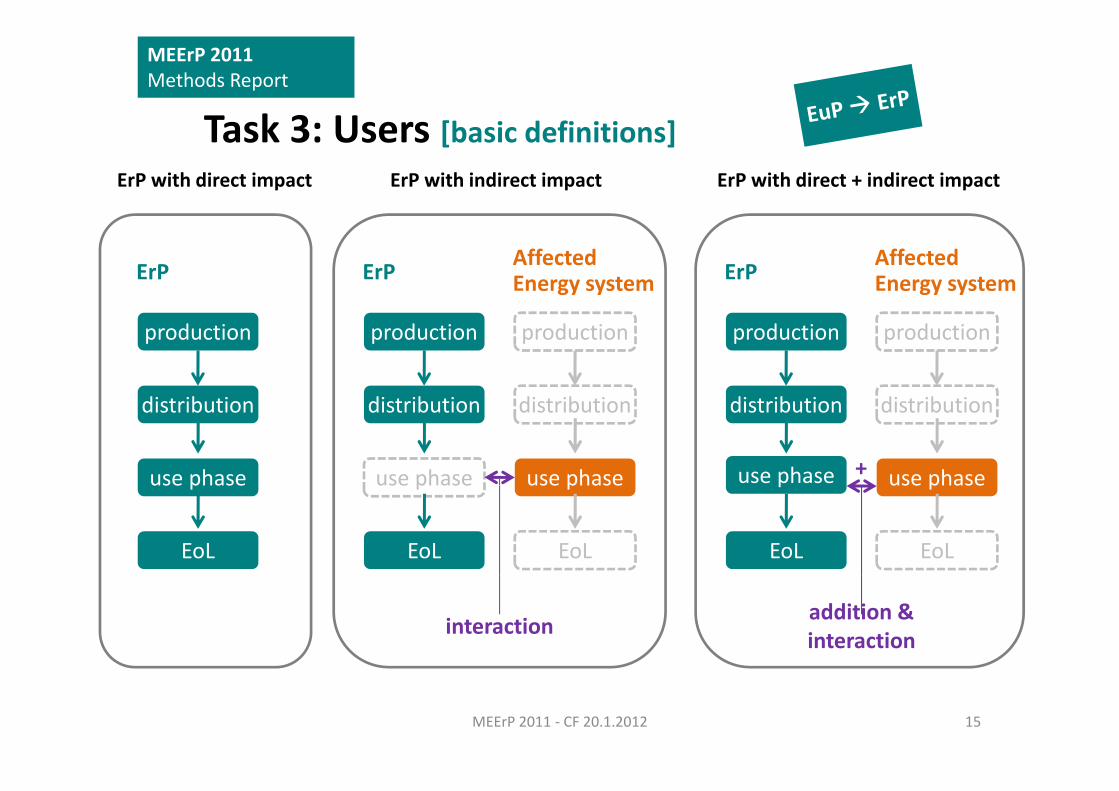
Task 3: Users [b i d fi iti ]
MEErP 2011 Methods Report
Task 3: Users [basic definitions]ErP with direct impact ErP with indirect impact ErP with direct + indirect impact
ErP ErP Affected Energy systemErP Affected
Energy system
production production productionproduction production
distribution
use phase
distribution distribution
use phaseuse phase +
distribution
use phase
distribution
use phaseuse phase
EoL EoL
use phase
EoL
puse phase
EoL
use phase
EoL
addition & interactioninteraction
15MEErP 2011 ‐ CF 20.1.2012
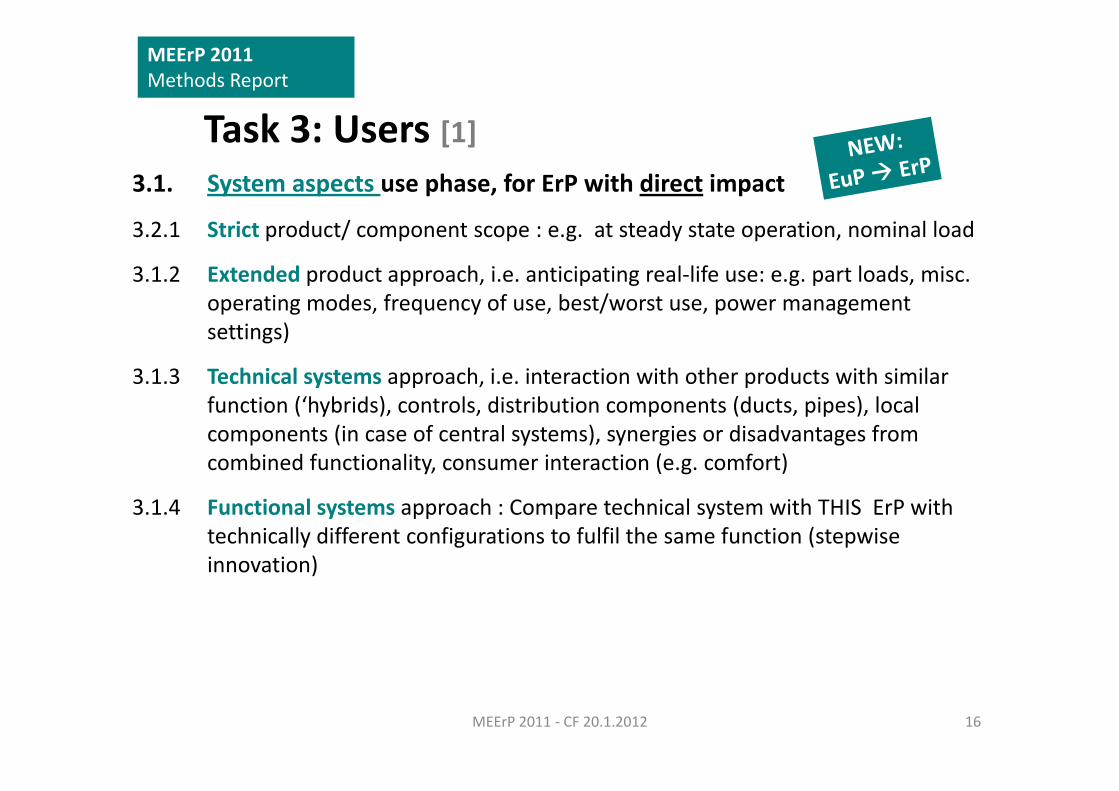
Task 3: Users [1]
MEErP 2011 Methods Report
Task 3: Users [1]3.1. System aspects use phase, for ErP with direct impact
3.2.1 Strict product/ component scope : e.g. at steady state operation, nominal load
3.1.2 Extended product approach, i.e. anticipating real‐life use: e.g. part loads, misc. operating modes frequency of use best/worst use power managementoperating modes, frequency of use, best/worst use, power management settings)
3.1.3 Technical systems approach, i.e. interaction with other products with similar function (‘hybrids), controls, distribution components (ducts, pipes), local components (in case of central systems), synergies or disadvantages from combined functionality, consumer interaction (e.g. comfort)
3.1.4 Functional systems approach : Compare technical system with THIS ErP with technically different configurations to fulfil the same function (stepwise innovation))
16MEErP 2011 ‐ CF 20.1.2012
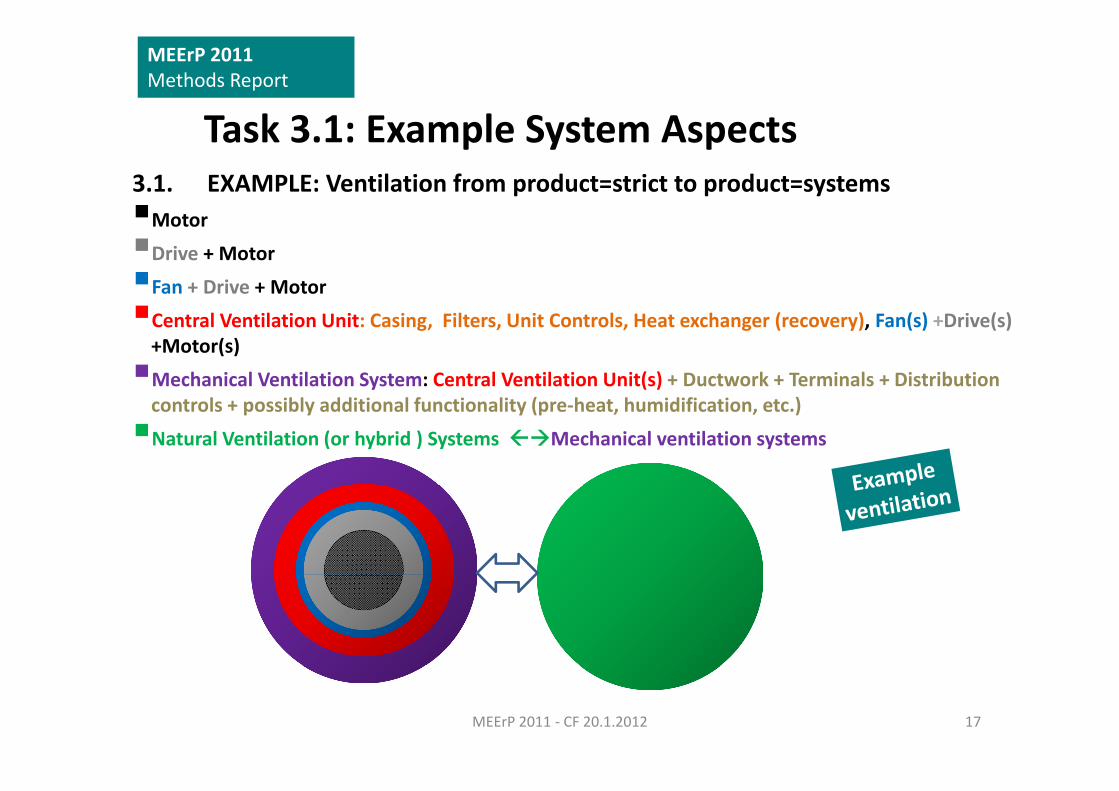
Task 3 1: Example System Aspects
MEErP 2011 Methods Report
Task 3.1: Example System Aspects3.1. EXAMPLE: Ventilation from product=strict to product=systemsM tMotor
Drive + Motor
Fan + Drive + Motor
Central Ventilation Unit: Casing, Filters, Unit Controls, Heat exchanger (recovery), Fan(s) +Drive(s) +Motor(s)
Mechanical Ventilation System: Central Ventilation Unit(s) + Ductwork + Terminals + Distribution controls + possibly additional functionality (pre‐heat, humidification, etc.)
Natural Ventilation (or hybrid ) Systems Mechanical ventilation systems
17MEErP 2011 ‐ CF 20.1.2012
Task 3: Users [2]
MEErP 2011 Methods Report
Task 3: Users [2]3.2. System aspects use phase, for ErP with indirect impact
Impacts during the use phase with impact levels subdivided in
3.2.1 Identify and describe affected energy system(s), including ‐generically‐ interaction
3.1.2 Repeat Tasks 1.2, 1.3 (test standards, legislation) and 2 (market) for affected energy system, but only for technical parameters relevant for interaction with ErP
3 1 3 Data retrieval of use phase energy consumption (and related emissions) of affected3.1.3 Data retrieval of use phase energy consumption (and related emissions) of affected energy system (=Task 3.1 repeat for affected system)
3.1.4 Technical detailed description of interaction between ErP and affected system ( )(backed up by statistics, field data)
3.1.5 Quantify energy use and related environmental impacts of the affected energy system during the use phase, in as much as it depends on the interaction with thesystem during the use phase, in as much as it depends on the interaction with the ErP
18MEErP 2011 ‐ CF 20.1.2012
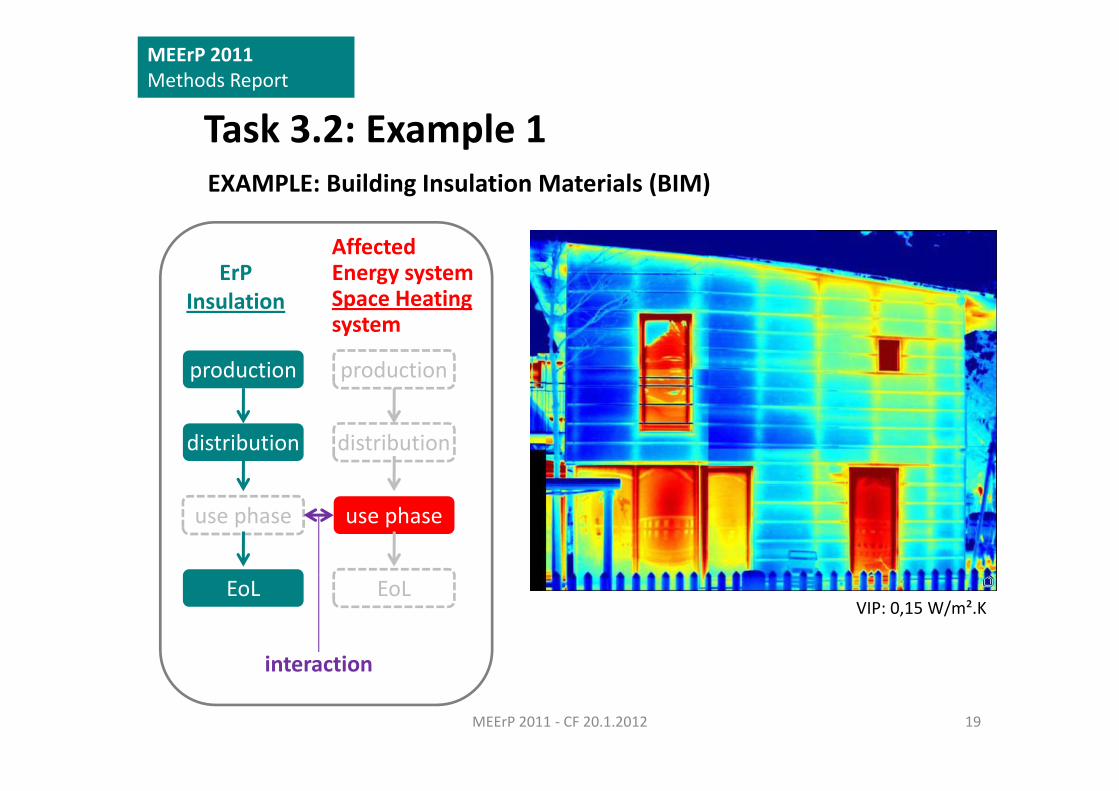
Task 3 2: Example 1
MEErP 2011 Methods Report
Task 3.2: Example 1EXAMPLE: Building Insulation Materials (BIM)
ErPInsulation
Affected Energy system Space Heating
production production
Insulation Space Heating system
distribution distribution
use phase use phase
EoL EoL
interaction
VIP: 0,15 W/m².K
19MEErP 2011 ‐ CF 20.1.2012
interaction
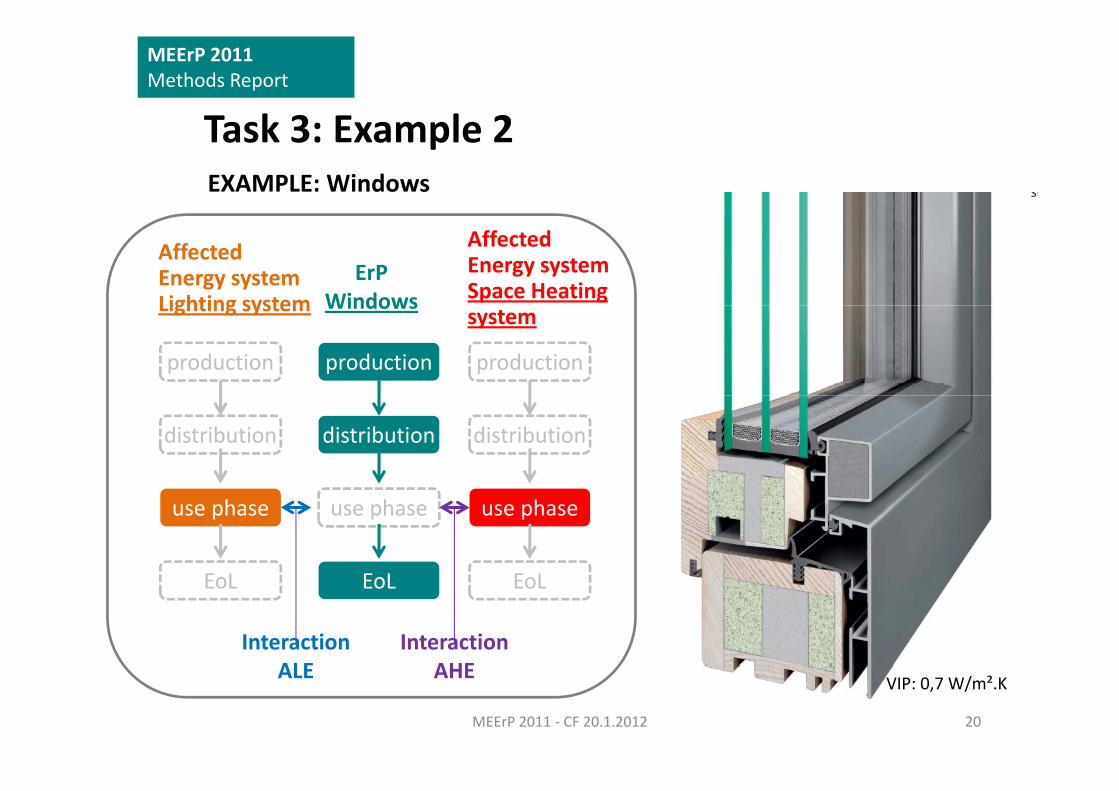
Task 3: Example 2
MEErP 2011 Methods Report
Task 3: Example 2EXAMPLE: Windows
ErPWindows
Affected Energy system Space Heating
Affected Energy system Lighting system
production production
Windowssystem
production
Lighting system
distribution distributiondistribution
use phase
E L
use phase
E L
use phase
E L EoL EoL
Interaction AHE
EoL
Interaction ALE
20MEErP 2011 ‐ CF 20.1.2012
AHEALE VIP: 0,7 W/m².K
Task 3: Users [3]
MEErP 2011 Methods Report
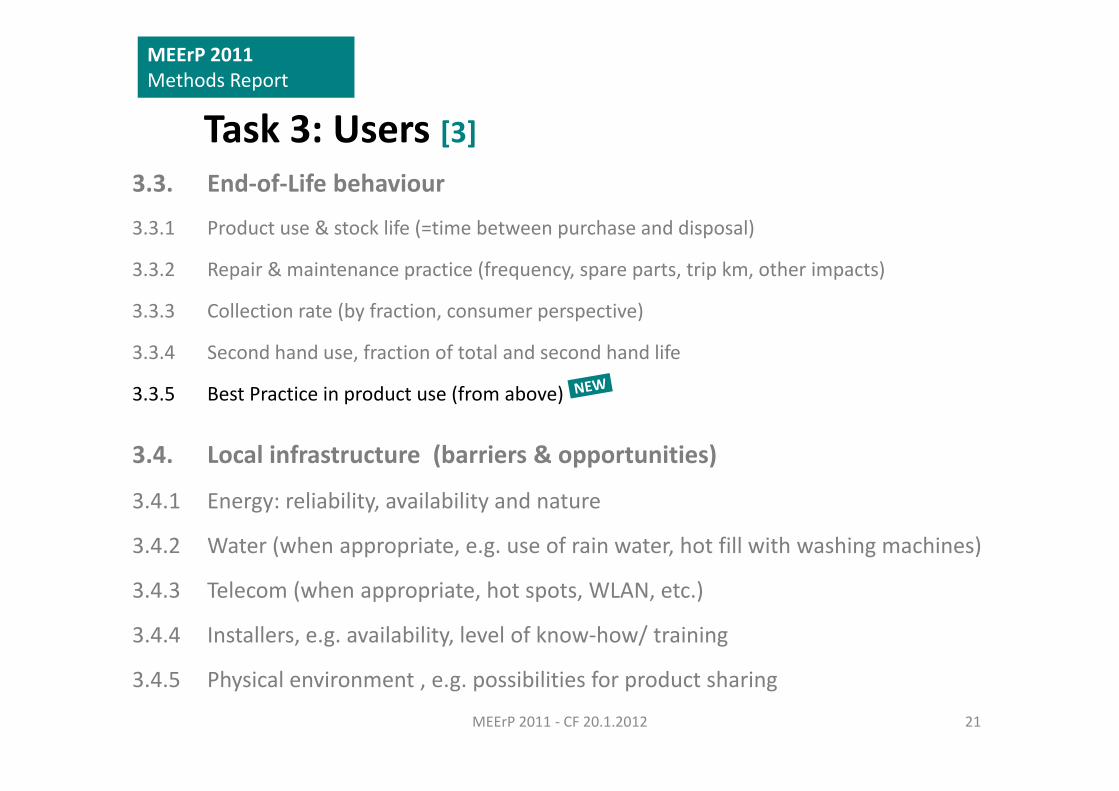
Task 3: Users [3]3.3. End‐of‐Life behaviour
3.3.1 Product use & stock life (=time between purchase and disposal)
3.3.2 Repair & maintenance practice (frequency, spare parts, trip km, other impacts)
3 3 3 C ll ti t (b f ti ti )3.3.3 Collection rate (by fraction, consumer perspective)
3.3.4 Second hand use, fraction of total and second hand life
3 3 5 Best Practice in product use (from above)3.3.5 Best Practice in product use (from above)
3.4. Local infrastructure (barriers & opportunities)
3.4.1 Energy: reliability, availability and nature
3.4.2 Water (when appropriate, e.g. use of rain water, hot fill with washing machines)
3.4.3 Telecom (when appropriate, hot spots, WLAN, etc.)
3.4.4 Installers, e.g. availability, level of know‐how/ training
3.4.5 Physical environment , e.g. possibilities for product sharing
21MEErP 2011 ‐ CF 20.1.2012
Task 3: Users [4]
MEErP 2011 Methods Report
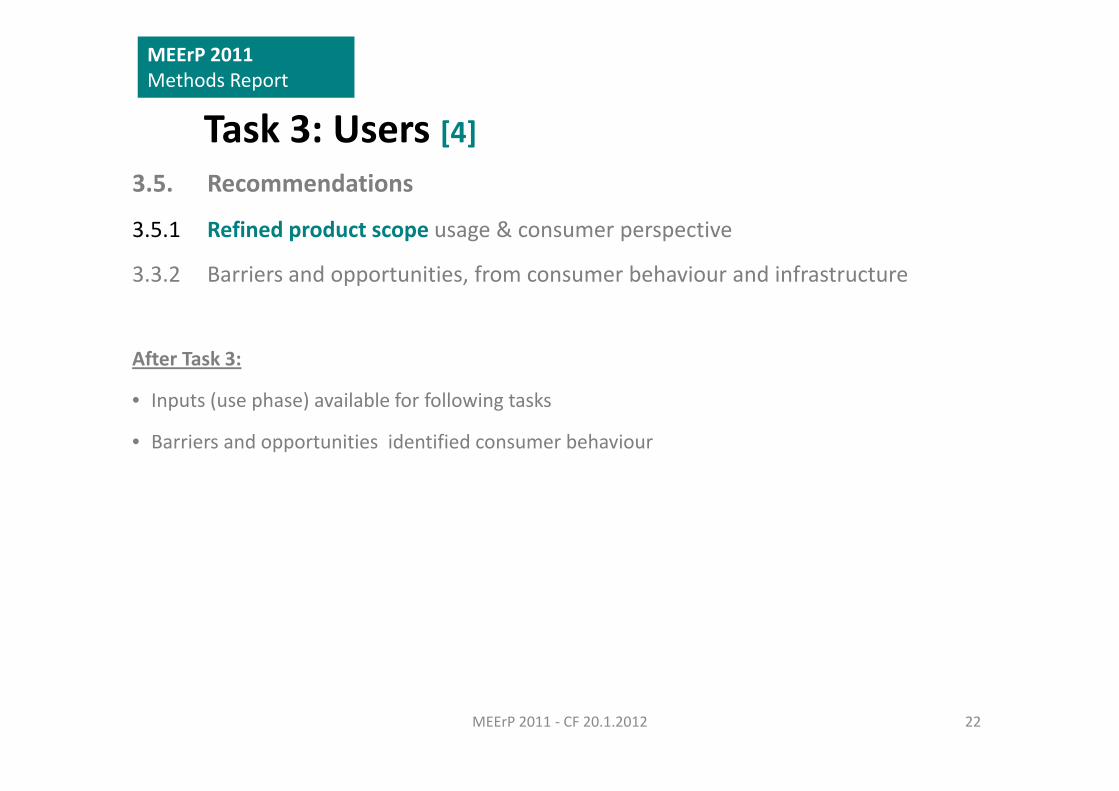
Task 3: Users [4]3.5. Recommendations
3.5.1 Refined product scope usage & consumer perspective
3.3.2 Barriers and opportunities, from consumer behaviour and infrastructure
After Task 3:
I t ( h ) il bl f f ll i t k• Inputs (use phase) available for following tasks
• Barriers and opportunities identified consumer behaviour
22MEErP 2011 ‐ CF 20.1.2012
Task 4: Technologies [1]
MEErP 2011 Methods Report
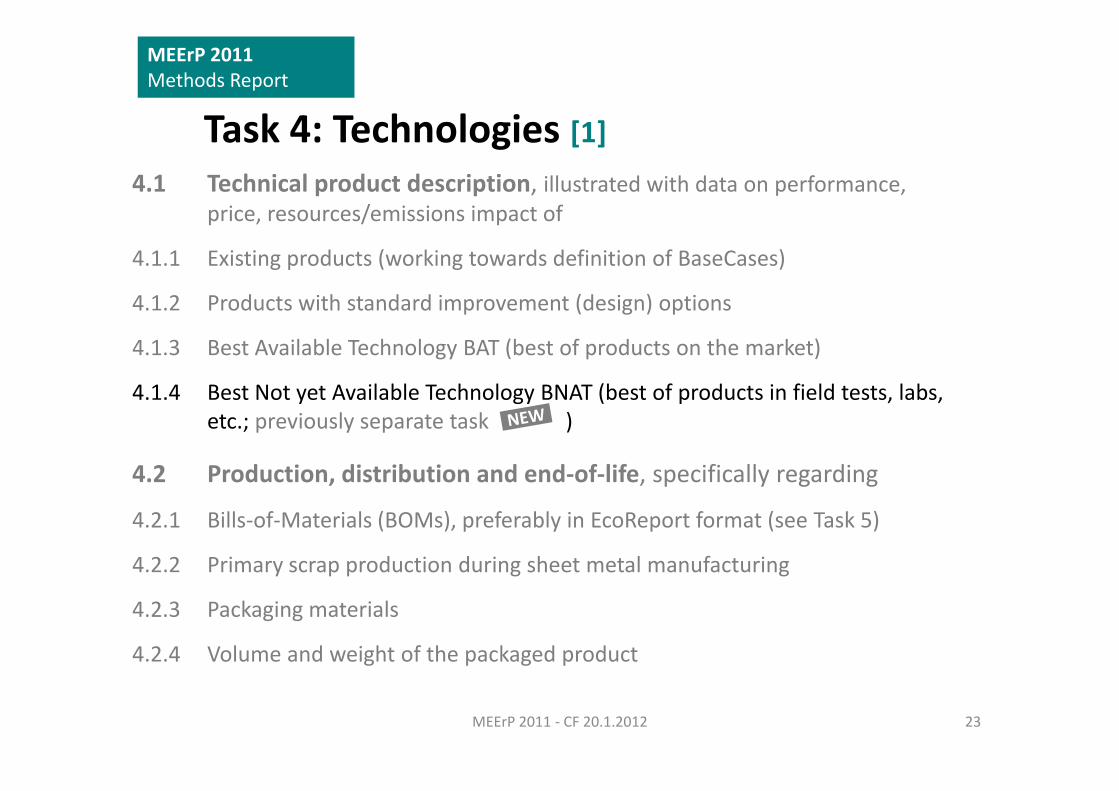
Task 4: Technologies [1]4.1 Technical product description, illustrated with data on performance,
price resources/emissions impact ofprice, resources/emissions impact of
4.1.1 Existing products (working towards definition of BaseCases)
4 1 2 Products with standard improvement (design) options4.1.2 Products with standard improvement (design) options
4.1.3 Best Available Technology BAT (best of products on the market)
4 1 4 Best Not yet Available Technology BNAT (best of products in field tests labs4.1.4 Best Not yet Available Technology BNAT (best of products in field tests, labs, etc.; previously separate task )
4.2 Production, distribution and end‐of‐life, specifically regarding , , p y g g
4.2.1 Bills‐of‐Materials (BOMs), preferably in EcoReport format (see Task 5)
4.2.2 Primary scrap production during sheet metal manufacturingy p p g g
4.2.3 Packaging materials
4.2.4 Volume and weight of the packaged productg p g p
23MEErP 2011 ‐ CF 20.1.2012
Task 4: Technologies [2]
MEErP 2011 Methods Report
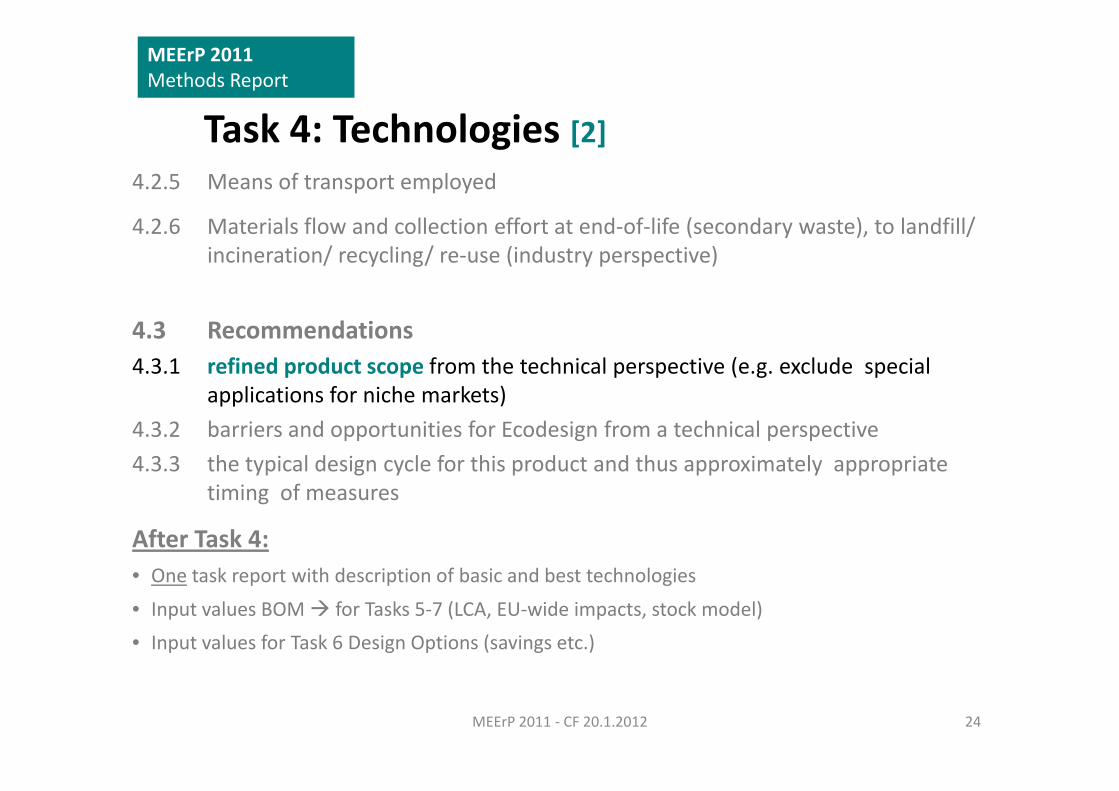
Task 4: Technologies [2]4.2.5 Means of transport employed
4.2.6 Materials flow and collection effort at end‐of‐life (secondary waste), to landfill/ incineration/ recycling/ re‐use (industry perspective)
4.3 Recommendations4.3.1 refined product scope from the technical perspective (e.g. exclude special
applications for niche markets)applications for niche markets)4.3.2 barriers and opportunities for Ecodesign from a technical perspective4.3.3 the typical design cycle for this product and thus approximately appropriate
i i ftiming of measures
After Task 4: • One task report with description of basic and best technologies• One task report with description of basic and best technologies
• Input values BOM for Tasks 5‐7 (LCA, EU‐wide impacts, stock model)
• Input values for Task 6 Design Options (savings etc.)
24MEErP 2011 ‐ CF 20.1.2012
MEErP 2011 Methods Report
Task 5: Environment & Economics
5.1 Product specific inputs, choose all relevant quantitative Base Case information from previous tasks and prepare for modelling
5.2 Base Case Environmental Impact Assessment, use EcoReport 2011 with outputs per environmental indicator and ‘cradle‐to‐grave’ stages of product life ( REACH, CRM still manual)life ( REACH, CRM still manual)
5.3 Base Case Life Cycle Costs for consumer, use new LCC equations, including escalation rateescalation rate.
5.4 EU Totals, Aggregate results 5.3 and 5.4 (per product) to EU totalsi d 20 0 20 0 d i lif5.4.1 over period 2010 to 2010+product service life
5.4.2 per year (most recent, e.g. 2010)
25MEErP 2011 ‐ CF 20.1.2012
LCIA indicators emissionsMEErP 2011 Methods Report
Impact Unit Relevant emissions and their characterization factorsGWP‐100 kg CO2 eq. CO2 CO CH4 N2O CF4 C2F6 SF6 R134a other
1 1,57 25 298 6500 9200 22800 1430 IPPC’07
AP g SO2 eq. SOx NOx N2O NH3 HF HCl H2S H2SO4 other1 0,7 1,78 1,88 1,6 0,88 1,88 0,65 CLRTAP
NMVOC kg NMVOC direct mass count for all Non‐Methane VOCPOP ng Teq eq dioxin and furan TCCD eq factors from Ind Emissions directive (recast no change 2005)POP ng Teq eq. dioxin and furan TCCD eq. factors from Ind. Emissions directive (recast, no change 2005)HMa mg Ni eq. Cd Hg As HMU Ni Cr III Cu Pb Zn MU
5 5 3,33 2 1 0,5 0,5 0,04 0,04 0,01PAH mg Ni eq. PAHs C6H6 CO
20 0,004 0,000002PM g PM10 eq. PM2,5 PM10 'PM'
2 1 1HMw mg Hg/20 eq Hg PAH Cd Pb NiHMw mg Hg/20 eq. Hg PAH Cd Pb Ni
20 20 11,1 0,14 0,05EP g PO4 eq. P P2O5 PO4 N NH4+ BOD S. solids DOC TOC COD
3,07 1,34 1 0,42 0,33 0,1 0,11 0,08 0,066 0,05
HMs kg RoHS, banned with exceptions
REACH Substances of Very High Concern SVHC, subject to permit (status 2011)
Hg; Cd; Pb; Cr VI; PBB; PBDE Musk xylene; MDA; HBCDD; DEHP; BPP; DBP
26MEErP 2011 ‐ CF 20.1.2012
Hg; Cd; Pb; Cr VI; PBB; PBDE Musk xylene; MDA; HBCDD; DEHP; BPP; DBPAll black values from treaties and legislation; Cr III/Cu/Zn from E‐PRTR 2006; HMU, MU, PM from LCA sources; green values= updated since 2005
LCIA indicators resources use 1MEErP 2011 Methods Report
Impacts Units Accounting
MATERIALS kg Stages: Production ‐ Distribution ‐ Use ‐ EoL recycling ‐ EoL disposal‐Totals Fractions: Bulkplastics‐ Tech. Plastics ‐ Ferro ‐ Non Ferro ‐ Electronics ‐Misc.p‐Production kg Primary scrap manufacturing: Direct credit to metal/plastic input‐Use phase kg Consumables use phase: input required, added to Totals (refrig. separate)‐EoL metals & kg
Fi d 5% l dfill 95% f ( t ) t l d (fi d %) > dit X % fglass Fixed: 5% landfill; 95% of (post consumer) waste recycled (fixed %) ‐‐> credit X % of new ex ante input. In line with current practice per half‐product
‐EoL plastics & PWB' k
Indicate: reuse‐recycling‐energy recovery‐haz. incineration fractionsl d f lt i b t t b h d t ditPWB's kg only defaults given, but to be changed as necessary ‐‐> ex post credits:
Re‐use Recycling Recovery Energy
75% of all impacts of 27 MJ + 50% of feedstock energy 75% of feedstock energy75% of all impacts of plastics used
27 MJ + 50% of feedstock energy& GWP of plastics used
75% of feedstock energy& GWP of plastics used
disassembly time PWB/displays/batteries ‐‐> recyclability of these fractions‐Refrigerants g& mercury g indicate: Refrigerant type (GWP), Refrigerants & Hg in products (to EoL),
in fugitive emissions (to Use phase) [report also gives TEWI sample]
27MEErP 2011 ‐ CF 20.1.2012
LCIA indicators resources use 2MEErP 2011 Methods Report
‐Recycling maximum
% cannot recycle more than is disposed ‐‐> recycmax= 1 / (1+r)Lwith L=product life in years, r=average annual growth rate over life (units, %)
New indicator ‘recycmax’ , sets cap on secondary recycling fraction to take into account stock effect (relevant for long‐living ErP, level playing field between plastics and metals))
recycled 3565
Stock effect (construction):Disposal= Sales 40‐50 years ago.
100
recycled 35 At continuous growth (e.g. 5%), even if all waste is recycled it is never enough to cover more than ca 35 % of New Sales input
St k t i l i
ca. 35 % of New Sales input.
Stock: material in usein buildings (>40 years)
2011 1961
28MEErP 2011 ‐ CF 20.1.2012
waste 136
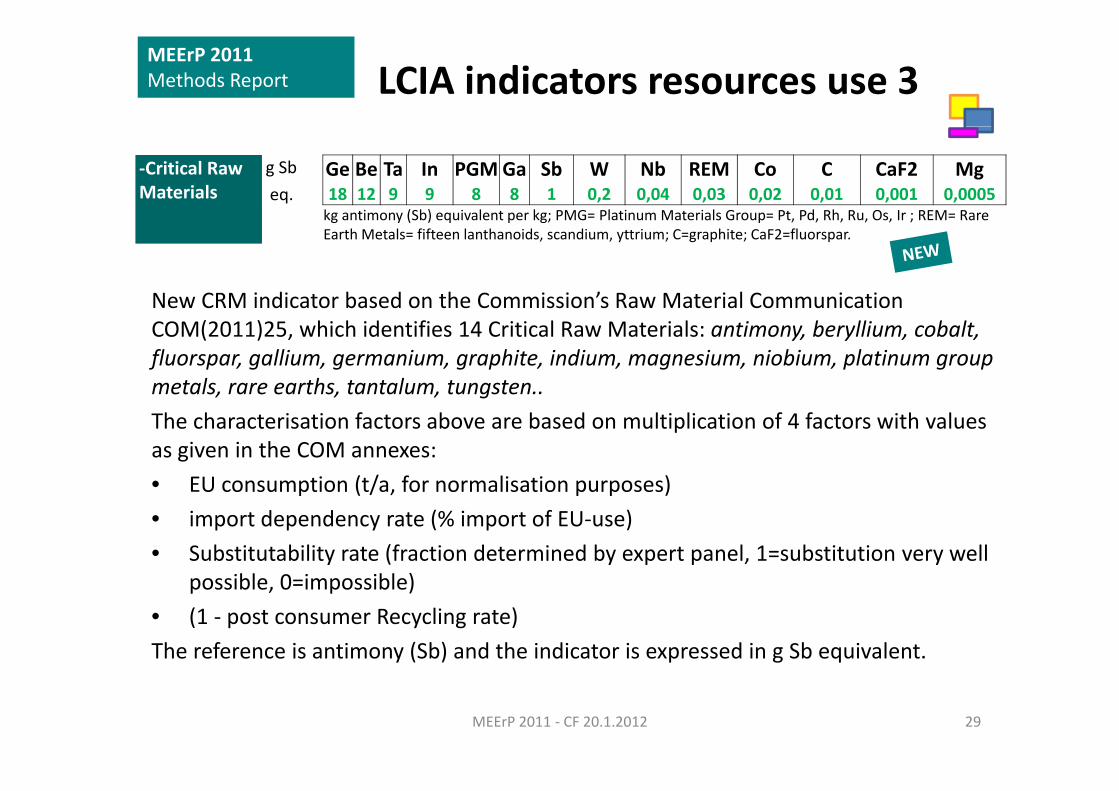
MEErP 2011 Methods Report LCIA indicators resources use 3
‐Critical Raw Materials
g Sb Ge Be Ta In PGM Ga Sb W Nb REM Co C CaF2 Mg eq. 18 12 9 9 8 8 1 0,2 0,04 0,03 0,02 0,01 0,001 0,0005
kg antimony (Sb) equivalent per kg; PMG= Platinum Materials Group= Pt Pd Rh Ru Os Ir ; REM= Rare
New CRM indicator based on the Commission’s Raw Material Communication
kg antimony (Sb) equivalent per kg; PMG= Platinum Materials Group= Pt, Pd, Rh, Ru, Os, Ir ; REM= Rare Earth Metals= fifteen lanthanoids, scandium, yttrium; C=graphite; CaF2=fluorspar.
New CRM indicator based on the Commission s Raw Material Communication COM(2011)25, which identifies 14 Critical Raw Materials: antimony, beryllium, cobalt, fluorspar, gallium, germanium, graphite, indium, magnesium, niobium, platinum group metals, rare earths, tantalum, tungsten.. , , , gThe characterisation factors above are based on multiplication of 4 factors with values as given in the COM annexes:• EU consumption (t/a for normalisation purposes)• EU consumption (t/a, for normalisation purposes)• import dependency rate (% import of EU‐use)• Substitutability rate (fraction determined by expert panel, 1=substitution very well
ibl 0 i ibl )possible, 0=impossible)• (1 ‐ post consumer Recycling rate) The reference is antimony (Sb) and the indicator is expressed in g Sb equivalent.
29MEErP 2011 ‐ CF 20.1.2012
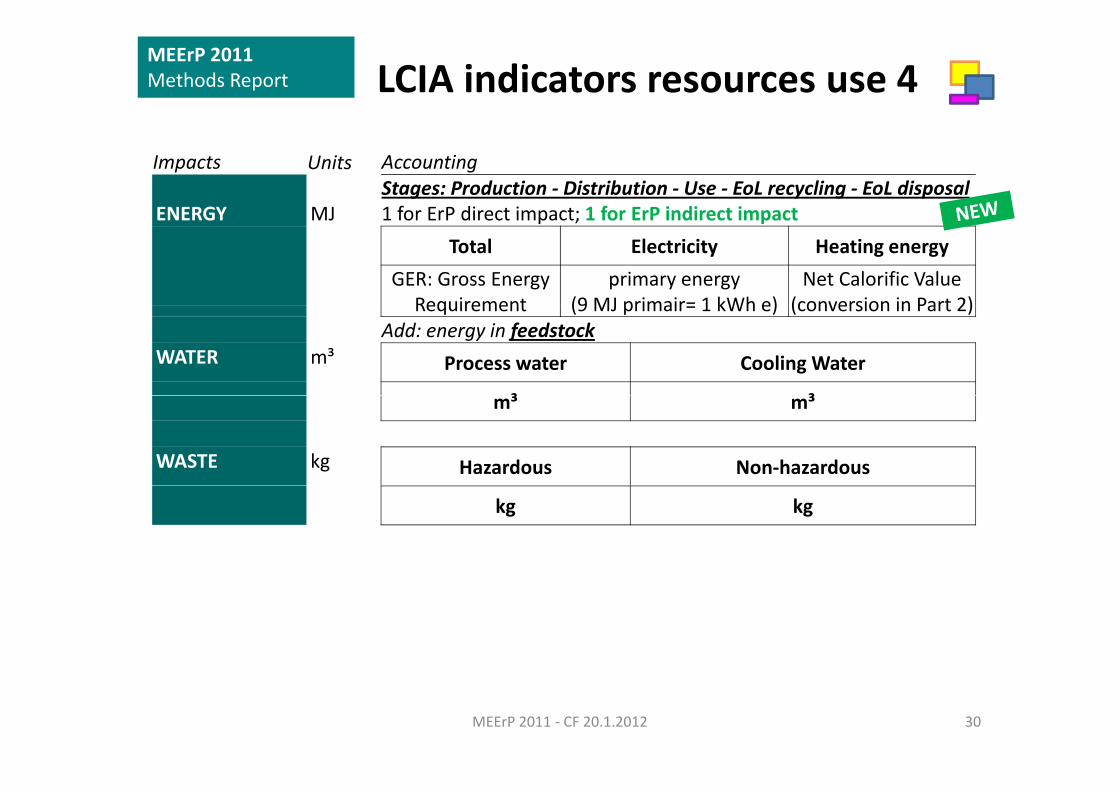
LCIA indicators resources use 4MEErP 2011 Methods Report
Impacts Units Accounting
ENERGY MJStages: Production ‐ Distribution ‐ Use ‐ EoL recycling ‐ EoL disposal1 for ErP direct impact; 1 for ErP indirect impactENERGY MJ 1 for ErP direct impact; 1 for ErP indirect impact
Total Electricity Heating energyGER: Gross Energy
Requirementprimary energy
(9 MJ primair= 1 kWh e)Net Calorific Value
(conversion in Part 2)Requirement (9 MJ primair= 1 kWh e) (conversion in Part 2)Add: energy in feedstock
WATER m³ Process water Cooling Water
³ ³m³ m³
WASTE kg Hazardous Non‐hazardous
kg kg
30MEErP 2011 ‐ CF 20.1.2012
MEErP 2011 Methods Report
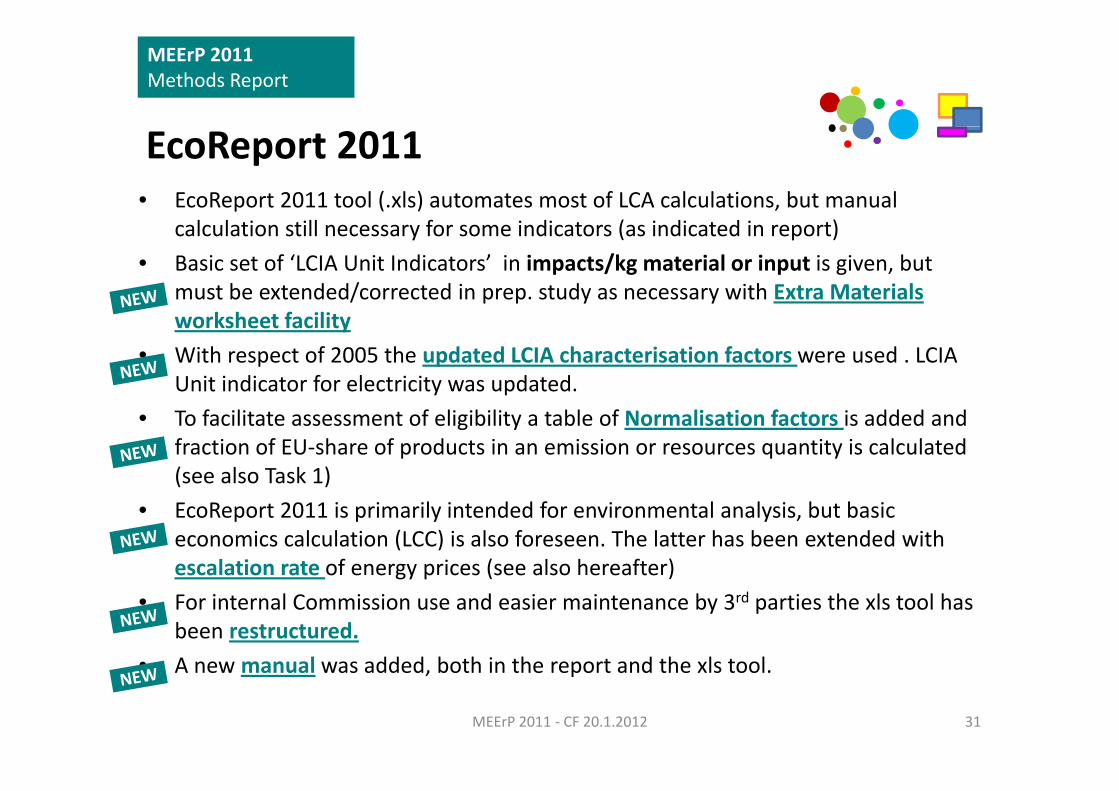
EcoReport 2011• EcoReport 2011 tool (.xls) automates most of LCA calculations, but manual
calculation still necessary for some indicators (as indicated in report) • Basic set of ‘LCIA Unit Indicators’ in impacts/kg material or input is given, but
must be extended/corrected in prep. study as necessary with Extra Materials worksheet facility
• With respect of 2005 the updated LCIA characterisation factors were used . LCIA Unit indicator for electricity was updated.
• To facilitate assessment of eligibility a table of Normalisation factors is added and fraction of EU‐share of products in an emission or resources quantity is calculated (see also Task 1) ( )
• EcoReport 2011 is primarily intended for environmental analysis, but basic economics calculation (LCC) is also foreseen. The latter has been extended with escalation rate of energy prices (see also hereafter) esca at o ate o e e gy p ces (see a so e ea te )
• For internal Commission use and easier maintenance by 3rd parties the xls tool has been restructured.
• A newmanual was added both in the report and the xls tool
31MEErP 2011 ‐ CF 20.1.2012
• A new manual was added, both in the report and the xls tool.
MEErP 2011 Methods Report
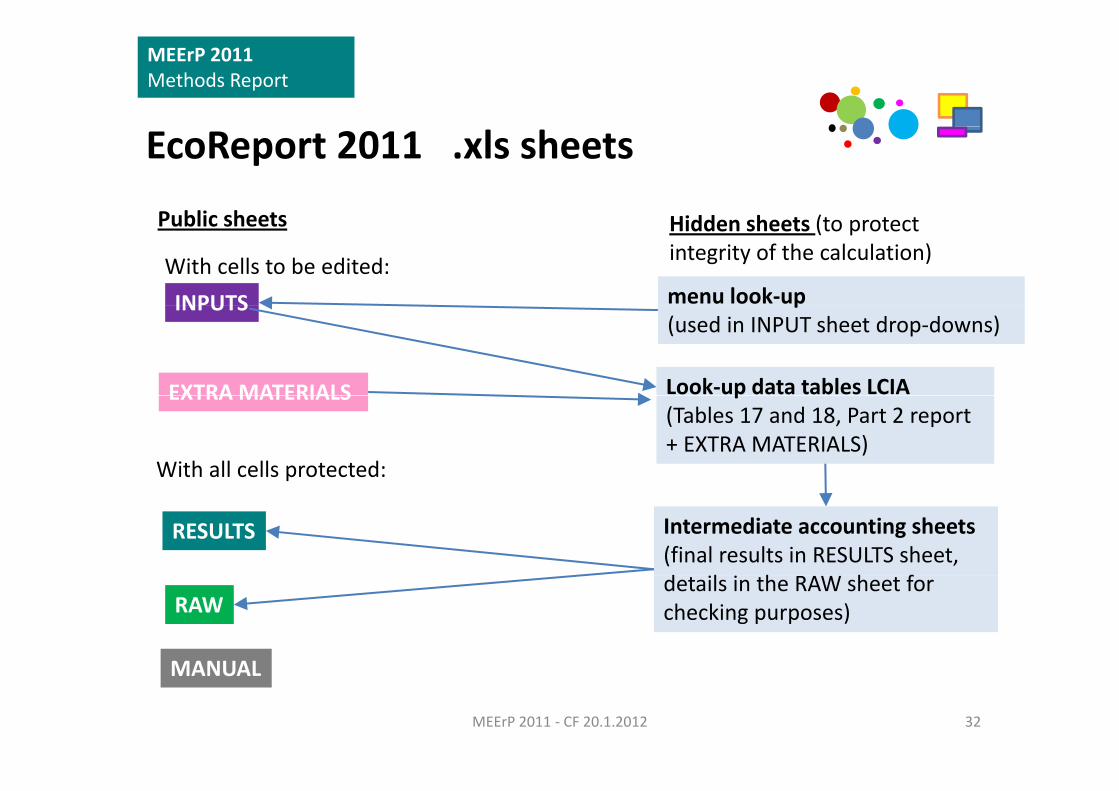
EcoReport 2011 .xls sheets
Hidd h (Public sheets
INPUTS menu look‐up
Hidden sheets (to protect integrity of the calculation)
Public sheets
With cells to be edited:INPUTS
EXTRA MATERIALS Look‐up data tables LCIA
p(used in INPUT sheet drop‐downs)
EXTRA MATERIALS p(Tables 17 and 18, Part 2 report + EXTRA MATERIALS)
With all cells protected:
RESULTS Intermediate accounting sheets(final results in RESULTS sheet, d l h h f
RAW
MANUAL
details in the RAW sheet for checking purposes)
32MEErP 2011 ‐ CF 20.1.2012
MANUAL
MEErP 2011 Methods Report
EcoReport 2011 sheetINPUTSRows 1‐338: Environmental Rows 339‐362: Economic
BILL OF MATERIALS (BOM)Input: Component (max.200), material, mass
MANUFACTURING
LIFE, SALES, STOCK Inputs in years and units
PRICES & TARIFFSMANUFACTURING(mostly from BOM). Input: sheet‐metal scrap %
DISTRIBUTION
PRICES & TARIFFSInputs in € per unit, kWh, m3, etc.
RATES: DISCOUNT, INFLATION, Input: Type of product, volume (in m3)
USE PHASE indirect impactInput: Energy auxiliaries repairs
ESCALATION etc. (Inputs in %)
USE PHASE direct impactInput: Energy, auxiliaries, repairs
Input: Energy, auxiliaries, repairs
USE PHASE TOTALS
DISPOSAL & RECYCLING
33MEErP 2011 ‐ CF 20.1.2012
Input: mass fractions disposed, recycled, re‐used
MEErP 2011 Methods Report
EcoReport 2011 sheetRESULTS
LIFE CYCLE IMPACT per unit: Values per material, d i / t i i i di t
Rows 1‐189: Environmental Rows 190‐240: Economic
BASE CASE Life Cycle Costs (LCC)P it lif d EU t t l/resources and air/water emission indicators
LIFE CYCLE IMPACT of New Models in ref. Year over their life: Type of values as above
Per unit over life and EU total/yr
BASECASE Societal LCCPer unit over life and EU total/yr
ENV. IMPACT of product in ref. Year (sold, installed, discarded): Type of values as above
y
SUMMARY of IMPACTS and share in EU totals Per unit indicator (from normalisation table)
34MEErP 2011 ‐ CF 20.1.2012
MEErP 2011 Methods Report
EcoReport 2011 sheetEXTRA MATERIALS
nr Name material Recycle %*Primairy Energy
Electr energy
feedstockwater Water
lwaste haz
wasteGWP AD VOC POP Hma PAH PM HMw EP
Use these fields to add extra materials to the eco‐report, these materials will be added to the list and can be selected on the input tab. Select category 8‐Extra, and the new materials will appear under material or process. The values are per kg material. The EoL scenario can only be regulated by one "recycle %" value for the whole group. Recycling and re‐use credits are assumed to be incorporated in the various impact indicators.
Energy (MJ)
energy (MJ)
proces cool non
unit % MJ MJ MJ L L kg kgkg CO2 eq.
g SO2 eq. g ng i‐Teq mg Ni eq. mg Ni eq. g mg Hg/20 g PO4
100101102103104104105106107108109110111112113114115116117118119119120
* one recling percentage for the whole group
35MEErP 2011 ‐ CF 20.1.2012
MEErP 2011 Methods Report
Task 5.3: Life Cycle Costs (consumer)
LCC = PP + PWF * OE + EoL, where • LCC is Life Cycle Costs to end‐users in €, • PP is the purchase price (including installation costs) in €, • OE is the annual operating expense in €OE is the annual operating expense in €• EoL: End‐of‐life costs (disposal cost, recycling charge) or benefit (resale) in €• PWF (Present Worth Factor) is
• N is the product life in years and • d is the discount rate in % • e is the inflation‐corrected annual growth rate of OE(a.k.a. ‘escalation rate’, in %)
36MEErP 2011 ‐ CF 20.1.2012
e is the inflation corrected annual growth rate of OE(a.k.a. escalation rate , in %)
MEErP 2011 Methods Report
Task 5.3: Life Cycle Costs (consumer)
When Operating Expense consists of several elements (energy, water, etc.), then calculate escalation rate from the weighted average
If d=e , as is currently the case, then simplified formula:
LCC = PP + N * OE + EoL, where
N i h d lif i• N is the product life in years
RULE: Currently both d and e are around 4% for energy products. If difference between the two is >1% then the complex formula shall be used.
37MEErP 2011 ‐ CF 20.1.2012
MEErP 2011 Methods Report
Task 5: Environment & Economics
After Task 5:• Synthesis of data retrieval from previous tasks 1‐4• Assessment current environmental and economic impact of the product• Reference case(s) for improvement (design & policy) options Tasks 6‐7
38MEErP 2011 ‐ CF 20.1.2012
MEErP 2011 Methods Report
Task 6: Design Options [1]
6.1 Identify Optionsfrom Task 4
6.2 Option impactsuse EcoReport 2011 per option for environmental options, compare outcomes and report only on impacts that change significantly
6.3 Costsassess purchase price increase per option (from market prices and/or from typical product cost model with material/labour/capital cost & margins).
39MEErP 2011 ‐ CF 20.1.2012
MEErP 2011 Methods Report
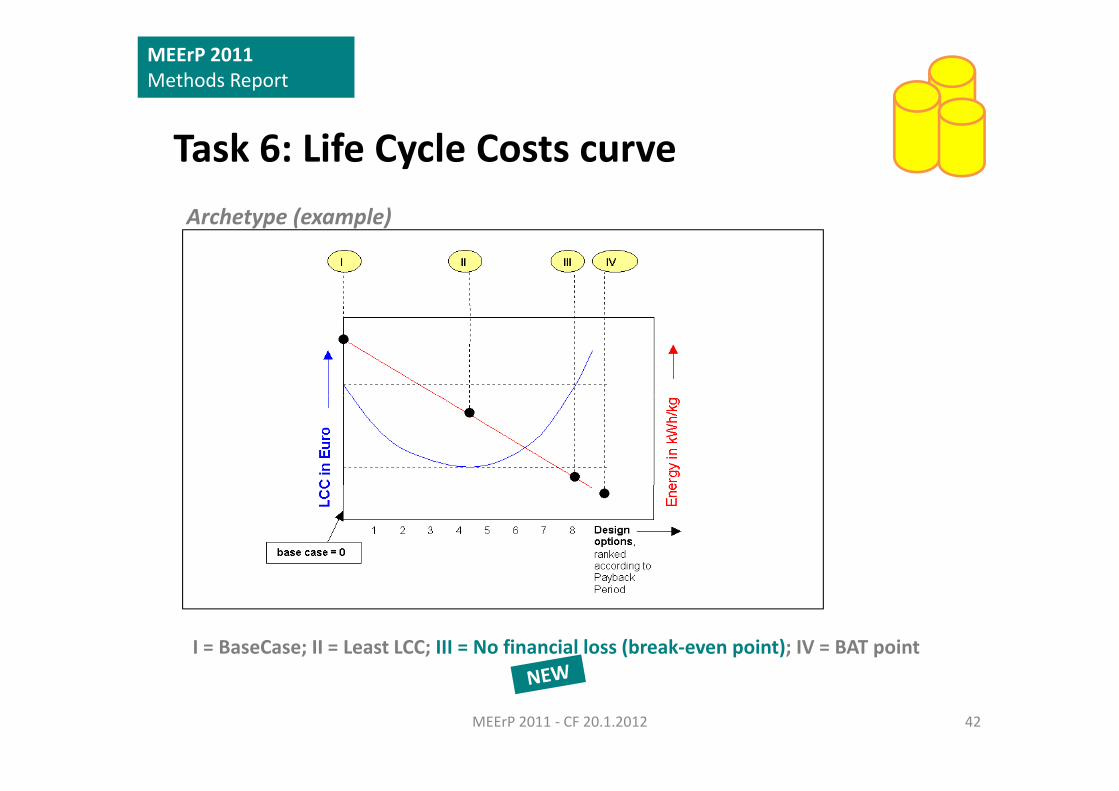
Task 6: Design Options [2]6.4 Analysis LLCC and BAT:
6.4.1 Rank options by LCC (options a,b,c, etc.)
6.4.2 Estimate possible (negative) side effects per option: rebound, functional, health, safety, competitiveness, etc..
6 4 3 Estimate cost‐benefit effect of accumulative options (a a+b a+c a+b+c etc )6.4.3 Estimate cost benefit effect of accumulative options (a, a+b, a+c, a+b+c, etc.)
6.4.4 Rank accumulative options by LCC‐improvement (‘payback’, EAC or chain method )
X‐axis: Opt 1=a | Opt 2=a+c | Opt 3= a+b+c | etc. (discard sub‐optimal design option combinations, e.g. a+b; usually 4 to 8 options are enough)1st Y axis LCC ; 2nd Y axis impact indicator (e g kWh/a) LCC and impact1st Y‐axis LCC ; 2nd Y‐axis impact indicator (e.g. kWh/a) LCC and impact curvesDetermine LLCC target levelDetermine BAT benchmark level
40MEErP 2011 ‐ CF 20.1.2012
MEErP 2011 Methods Report
Task 6: Design Options [3]
6.5 Long term potential (BNAT) & systems analysis
6.5.1 Discuss long‐term technical potential within existing product system. Showing g p g p y gthat after LLCC targets there is sufficient scope for product differentiation (relevant for industry competitiveness and consumer choice; also for ‘A+’ label classes)
6.5.2 Discuss long‐term technical potential of new (alternative) systems. Showing that after LLCC targets there is sufficient scope for product differentiation (relevant for industry competitiveness and consumer choice)industry competitiveness and consumer choice)
After Task 6:
• LLCC target levels ( specific Ecodesign limits)• LLCC target levels ( specific Ecodesign limits)
• BAT and BNAT benchmark levels ( ‘A’ , ‘A+’ etc. label class limits, if applicable)
• Scope for product differentiation after LLCC levels• Scope for product differentiation, after LLCC levels
41MEErP 2011 ‐ CF 20.1.2012
MEErP 2011 Methods Report
Task 6: Life Cycle Costs curveArchetype (example)Archetype (example)
I = BaseCase; II = Least LCC; III = No financial loss (break‐even point); IV = BAT point
42MEErP 2011 ‐ CF 20.1.2012
MEErP 2011 Methods Report
Task 7: Scenarios [1]
7.1 Policy analysis
7.1.1 Describe explicitly stakeholder participation (incl. main positions) p y p p ( p )
7.1.2 Describe market/legislative barriers/failures (and opportunities) for measures
7.1.3 Describe pro’s and cons of (combination of) Ecodesign and other measuresp ( ) g
7.1.4 Select policy measures for further analysis, with exact product definition (and exceptions), target levels, labelling class limits, other measures, test standards, possibilities for self regulation installation requirementspossibilities for self‐regulation, installation requirements
43MEErP 2011 ‐ CF 20.1.2012
MEErP 2011 Methods Report
Task 7: Scenarios [2]
7.2 Scenario analysis unit stock/sale & environmental
7.2.1 Set up stock‐model, 1990‐2030 (2050) with MEErP guidance p , ( ) gand calculate baseline scenario (‘BaU’, ‘Base Case’) for resources use/ emissions (in physical units)
7 2 2 Cal late scenario for options identified in 7 1 4 (e ‘Min’ ‘Lbl’ ‘Min+Lbl’ et )7.2.2 Calculate scenario for options identified in 7.1.4 (e.g. ‘Min’, ‘Lbl’, ‘Min+Lbl’, etc.)
7.3 Impact analysis (socio) economic
7.3.1 Introduce economic parameters (prices, rates, turnover/employee, margins & overhead, etc.). Determine simple (linear) price elasticity for indicator target levels, from known anchor points (BC, LLCC, BAT)
7.3.2 Run extended stock model scenarios 1990‐2030 (2050) for EU‐27 onrunning costs & consumer expenditure, industry /wholesale/retail revenues & jobs (2020 and 2030), SME share in jobs and revenuesjobs (2020 and 2030), SME share in jobs and revenues
44MEErP 2011 ‐ CF 20.1.2012
MEErP 2011 Methods Report
Task 7: Scenarios [3]
7.4 Sensitivity Analysis
Rerun scenarios at 50% higher/lower energy price and price elasticity g / gy p p y
Rerun scenarios at different target & timing levels (indicated by Commission)
Base Case Life Cycle Costs for society , use extended LCCBase Case Life Cycle Costs for society , use extended LCC equations with CO2 stock price, societal damage certain emissions, etc.
7.5 Summaryy
7.5.1 Summary policies chosen/investigated
7.5.2 Summary annual and accumulative scenario outcomes for Baseline, 2020 and y2030 (2050 for construction products)
7.5.3 Summary of possible negative impact on competitiveness, health, safety (+/‐table)table)
45MEErP 2011 ‐ CF 20.1.2012
MEErP 2011 Methods Report
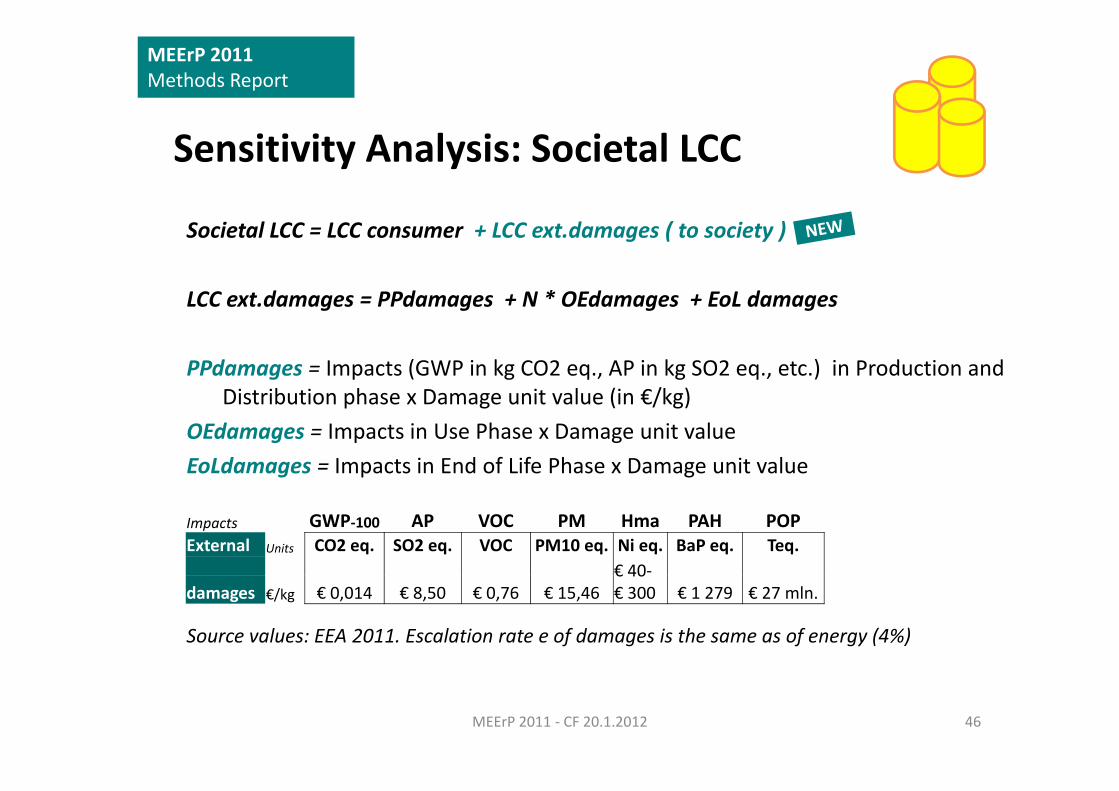
Sensitivity Analysis: Societal LCC
Societal LCC = LCC consumer + LCC ext.damages ( to society )
LCC ext.damages = PPdamages + N * OEdamages + EoL damagesLCC ext.damages PPdamages N OEdamages EoL damages
PPdamages = Impacts (GWP in kg CO2 eq., AP in kg SO2 eq., etc.) in Production and Distribution phase x Damage unit value (in €/kg)Distribution phase x Damage unit value (in €/kg)
OEdamages = Impacts in Use Phase x Damage unit valueEoLdamages = Impacts in End of Life Phase x Damage unit value
Impacts GWP‐100 AP VOC PM Hma PAH POPExternal Units CO2 eq. SO2 eq. VOC PM10 eq. Ni eq. BaP eq. Teq.
€ 40‐
Source values: EEA 2011. Escalation rate e of damages is the same as of energy (4%)
damages €/kg € 0,014 € 8,50 € 0,76 € 15,46 € 40€ 300 € 1 279 € 27 mln.
46MEErP 2011 ‐ CF 20.1.2012
MEErP 2011 Methods Report
Task 7: Scenarios [4]
After Task 7 & final report:
There should be
• Sufficient information for the Commission to draw up first Working Documents (draft legislation)
• Sufficient information for the Commission’s Impact Analysis, accompanying the legislation
BUTBUT
• MEErP 2011 is not an automatic law making procedure; the preparatory study is an analytical document at the responsibility of the contractor.study is an analytical document at the responsibility of the contractor. Political and legislative choices, at the responsibility of the Commission, are indispensable in the follow‐up.
47MEErP 2011 ‐ CF 20.1.2012
MEErP 2011 Policies & Data Report SELECTED SAMPLES
MEErP Part 2 Report:
Data Samplesata Samples
48MEErP 2011 ‐ CF 20.1.2012
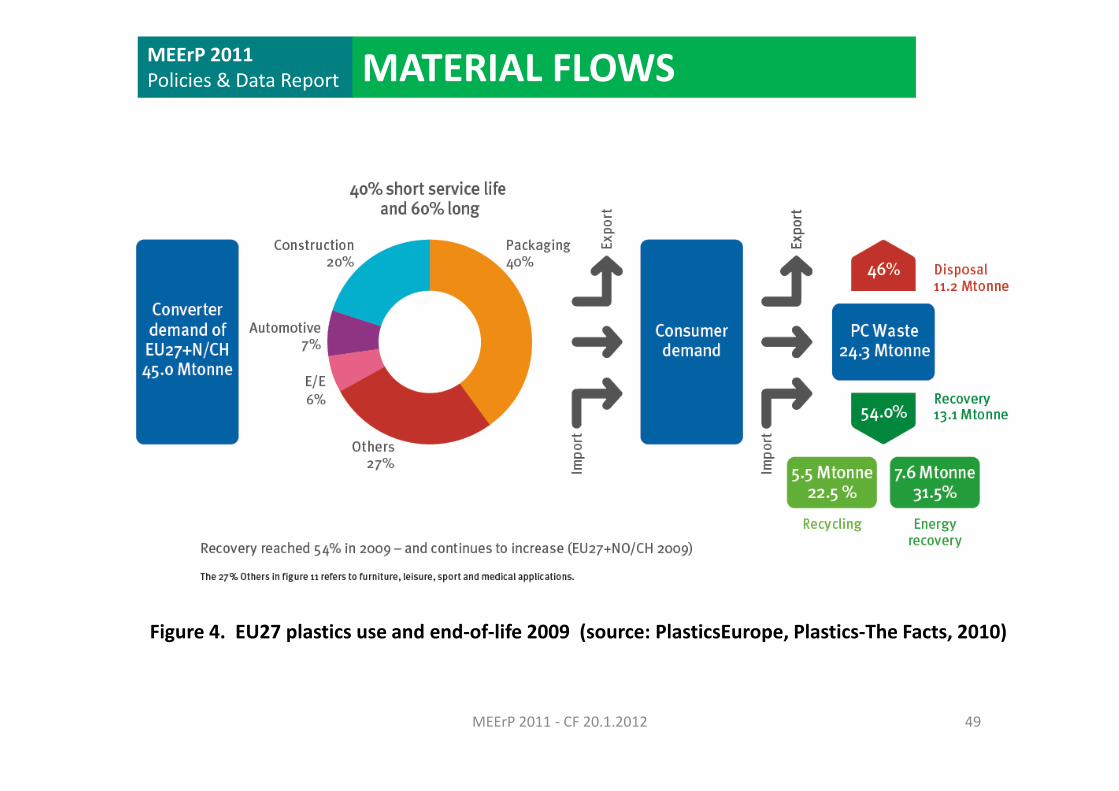
MEErP 2011 Policies & Data Report MATERIAL FLOWS
Figure 4. EU27 plastics use and end‐of‐life 2009 (source: PlasticsEurope, Plastics‐The Facts, 2010)
49MEErP 2011 ‐ CF 20.1.2012
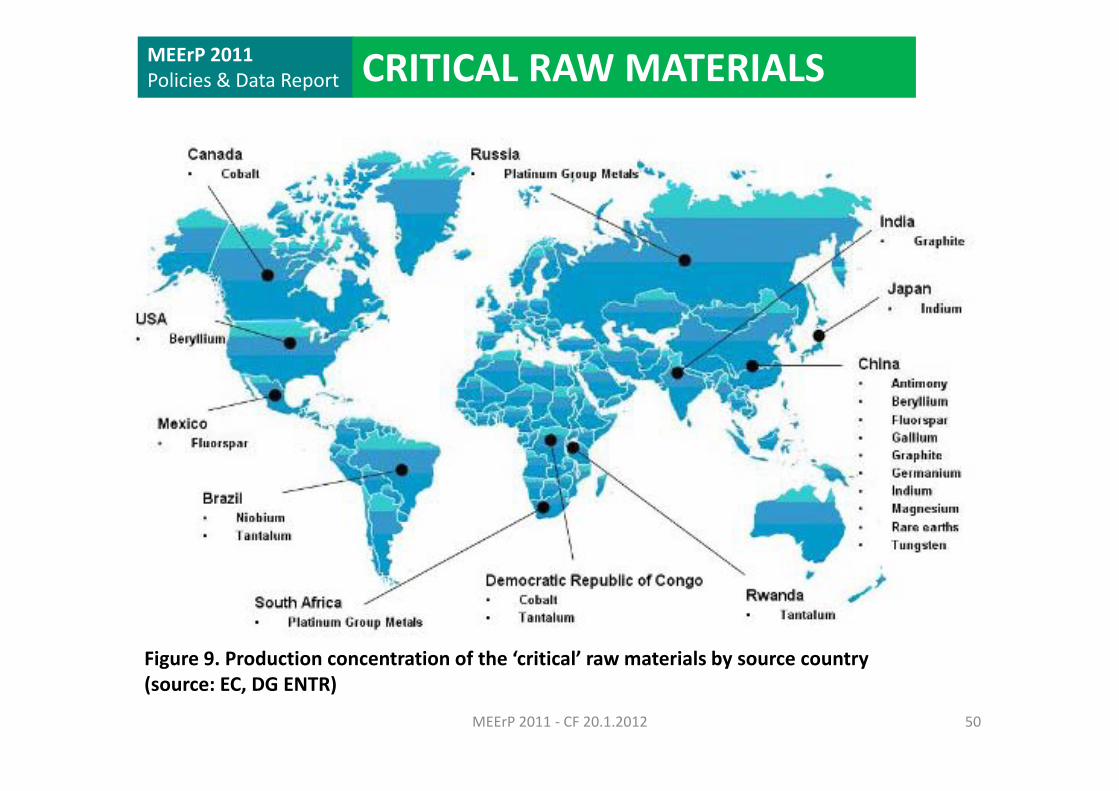
MEErP 2011 Policies & Data Report CRITICAL RAW MATERIALS
Figure 9. Production concentration of the ‘critical’ raw materials by source country
50MEErP 2011 ‐ CF 20.1.2012
Figure 9. Production concentration of the critical raw materials by source country (source: EC, DG ENTR)
Fig 10 (part)
MEErP 2011 Policies & Data Report ENERGY ACCOUNTING
Fig. 10 (part)
‐‐
Electricity239 Mtoe=2780 TWh
EU‐27 ELECTRICITY END‐USE,
51MEErP 2011 ‐ CF 20.1.2012
2007, in TWh
MEErP 2011 Policies & Data Report
Renewable Energy Flows
RENEWABLE ENERGY BALANCE
Hydro 1‐10 MW: 2,5Hydro >10 MW: 23,2
transformation & network losses
HYDRO 26,7
20,9
Renewable Energy FlowsEU‐27, 2007, in Mtoe, total production 140 Mtoe
WIND 9 Hydro <1 MW: 1
Wind: 9
POWERplants(73,5)
9
32,8ELECTRICITY 38,5
5
electricity grid: 38,2
solar PV: 0,3
Wood: 67,3
BIOMASS
5
wood: 51,9
Biofuel liq.: 8,8Biogas: 7,2Waste: 14,4
GEOTHERMAL 5,8
MASS 97,8 FUEL 62,8
derived heat: 14 4
biofuel liq.: 8,2
SOLAR 1,3Solar PV: 0,3Solar heat: 0,9
GEOTHERMAL 5,8Geothermal: 5,8
HEAT plants(18,3)
3,80,1 HEAT 15,2district heat: 14,3
solar heat: 0 9
derived heat: 14,4
transformation & network losses
solar heat: 0,94
[(c) VHK 2011]
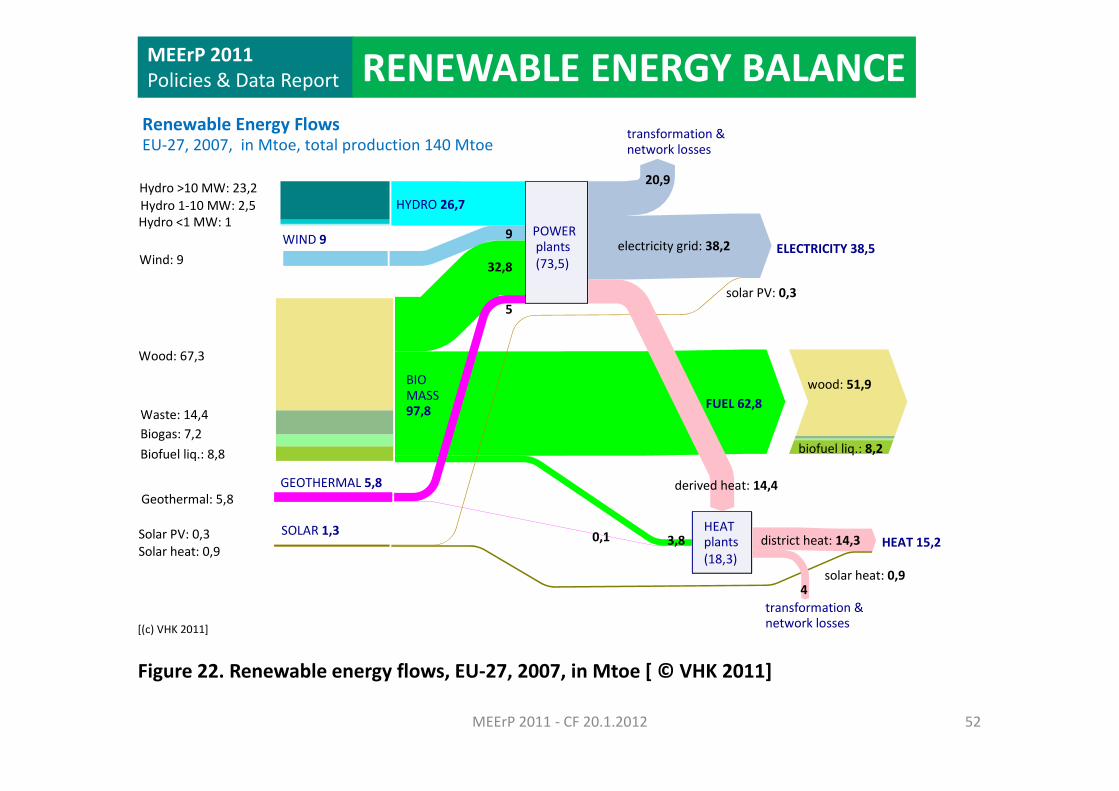
Fi 22 R bl fl EU 27 2007 i M [ © VHK 2011]
52MEErP 2011 ‐ CF 20.1.2012
Figure 22. Renewable energy flows, EU‐27, 2007, in Mtoe [ © VHK 2011]
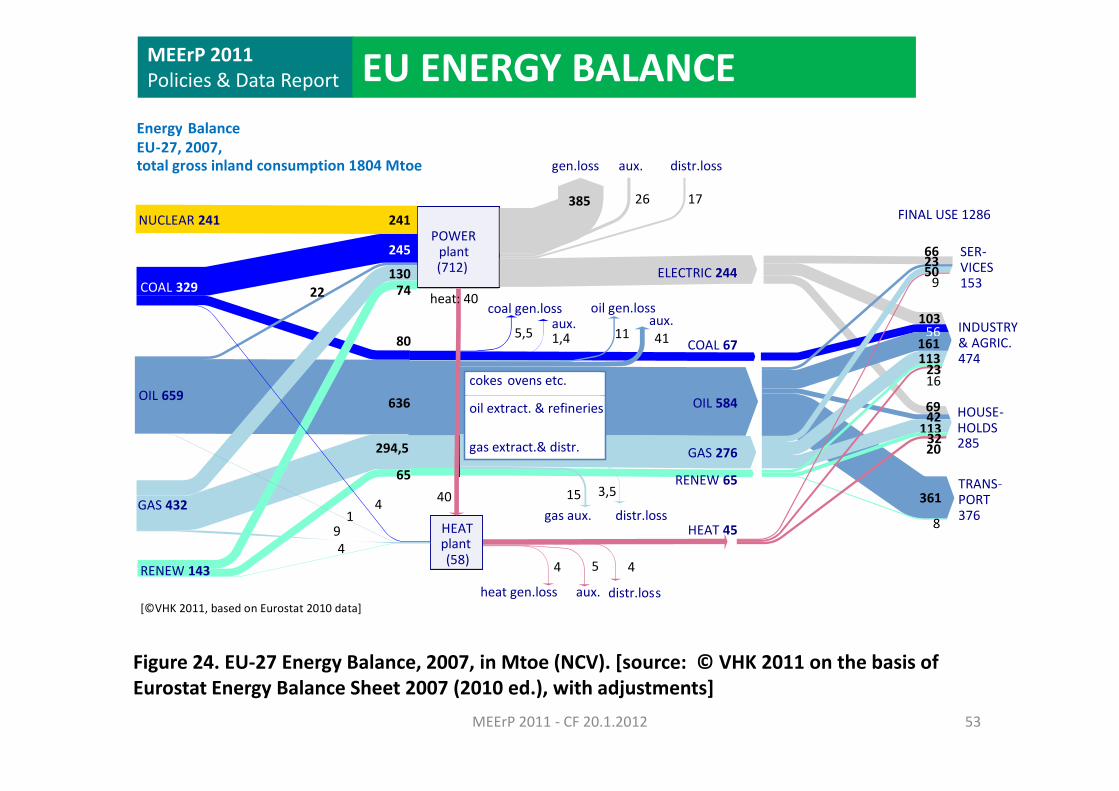
MEErP 2011 Policies & Data Report
Energy Balance
EU ENERGY BALANCE
241
gen.loss aux. distr.loss
385 26 17
Energy Balance EU‐27, 2007, total gross inland consumption 1804 Mtoe
NUCLEAR 241 FINAL USE 1286POWER plant(712)
241
245
22 13074
l l oil gen lossCOAL 329
NUCLEAR 241
ELECTRIC 244SER‐ VICES 153
66
9heat: 40
5023
FINAL USE 1286
80
coal gen.lossaux.
5,5 1,4 COAL 67
oil gen.lossaux.
11 41
OIL 659
INDUSTRY & AGRIC. 474
103
113161
16cokes ovens etc.
56
23
69
65 RENEW 65
OIL 659
GAS 276
OIL 584 HOUSE‐ HOLDS 285
TRANS‐
11320
oil extract. & refineries
gas extract.& distr.
4232
294,5
636
HEAT plant(58)
HEAT 4594
14
distr.lossgas aux. 15 3,5
4 5 4 RENEW 143
GAS 432TRANS PORT 376
361
8
40
distr.lossheat gen.loss aux.[©VHK 2011, based on Eurostat 2010 data]
RENEW 143
Figure 24 EU‐27 Energy Balance 2007 in Mtoe (NCV) [source: © VHK 2011 on the basis of
53MEErP 2011 ‐ CF 20.1.2012
Figure 24. EU 27 Energy Balance, 2007, in Mtoe (NCV). [source: © VHK 2011 on the basis ofEurostat Energy Balance Sheet 2007 (2010 ed.), with adjustments]
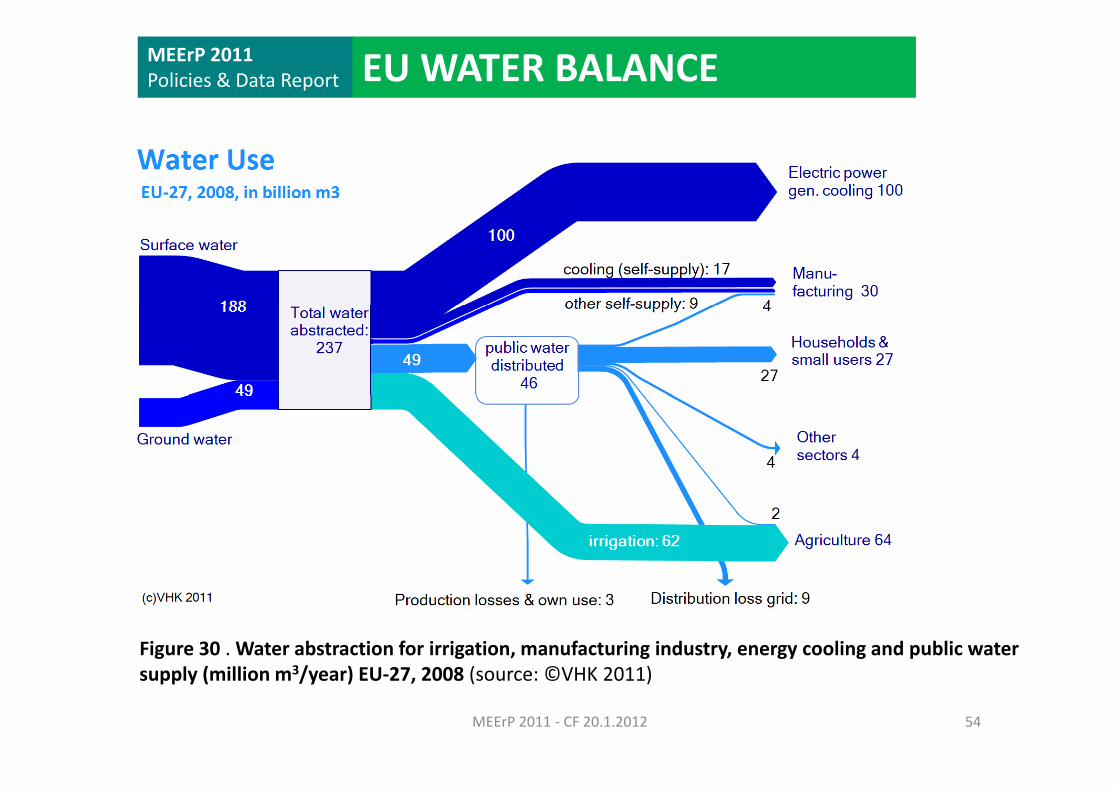
MEErP 2011 Policies & Data Report EU WATER BALANCE
Figure 30 . Water abstraction for irrigation, manufacturing industry, energy cooling and public water
54MEErP 2011 ‐ CF 20.1.2012
supply (million m3/year) EU‐27, 2008 (source: ©VHK 2011)
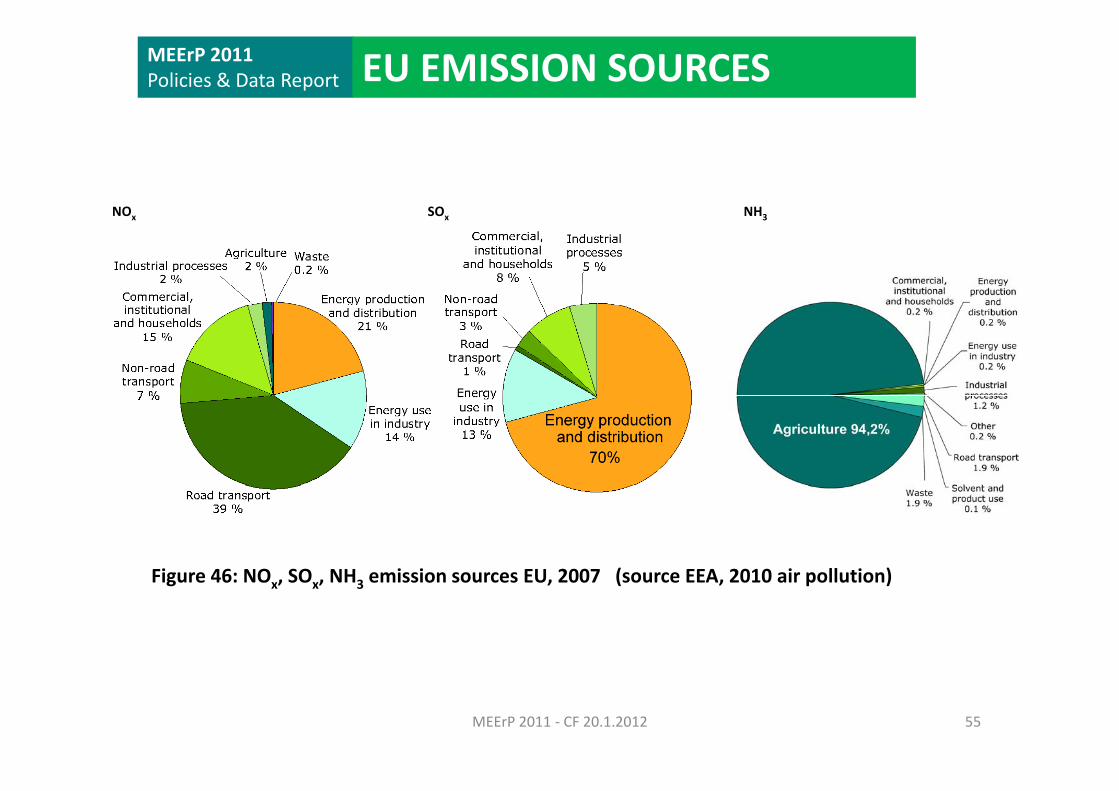
MEErP 2011 Policies & Data Report EU EMISSION SOURCES
SOx NH3NOx SOx 3Ox
Figure 46: NO SO NH emission sources EU 2007 (source EEA 2010 air pollution)Figure 46: NOx, SOx, NH3 emission sources EU, 2007 (source EEA, 2010 air pollution)
55MEErP 2011 ‐ CF 20.1.2012
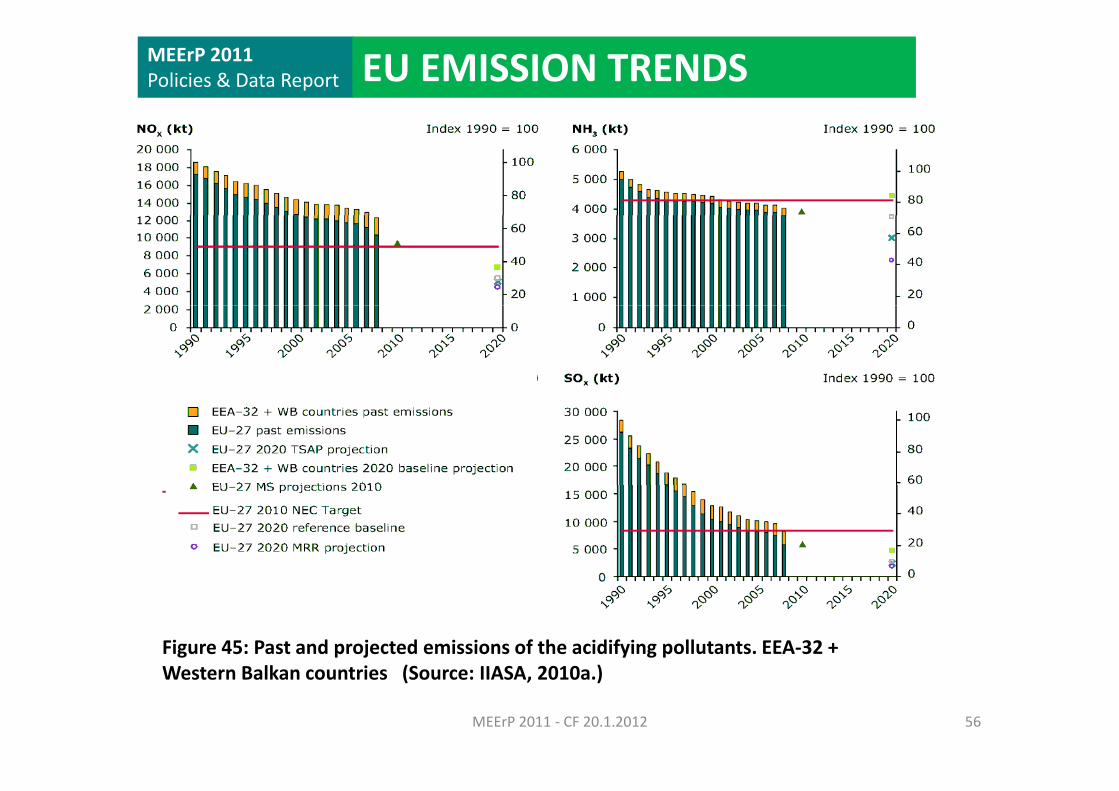
MEErP 2011 Policies & Data Report EU EMISSION TRENDS
Figure 45: Past and projected emissions of the acidifying pollutants. EEA‐32 + ( )
56MEErP 2011 ‐ CF 20.1.2012
Western Balkan countries (Source: IIASA, 2010a.)
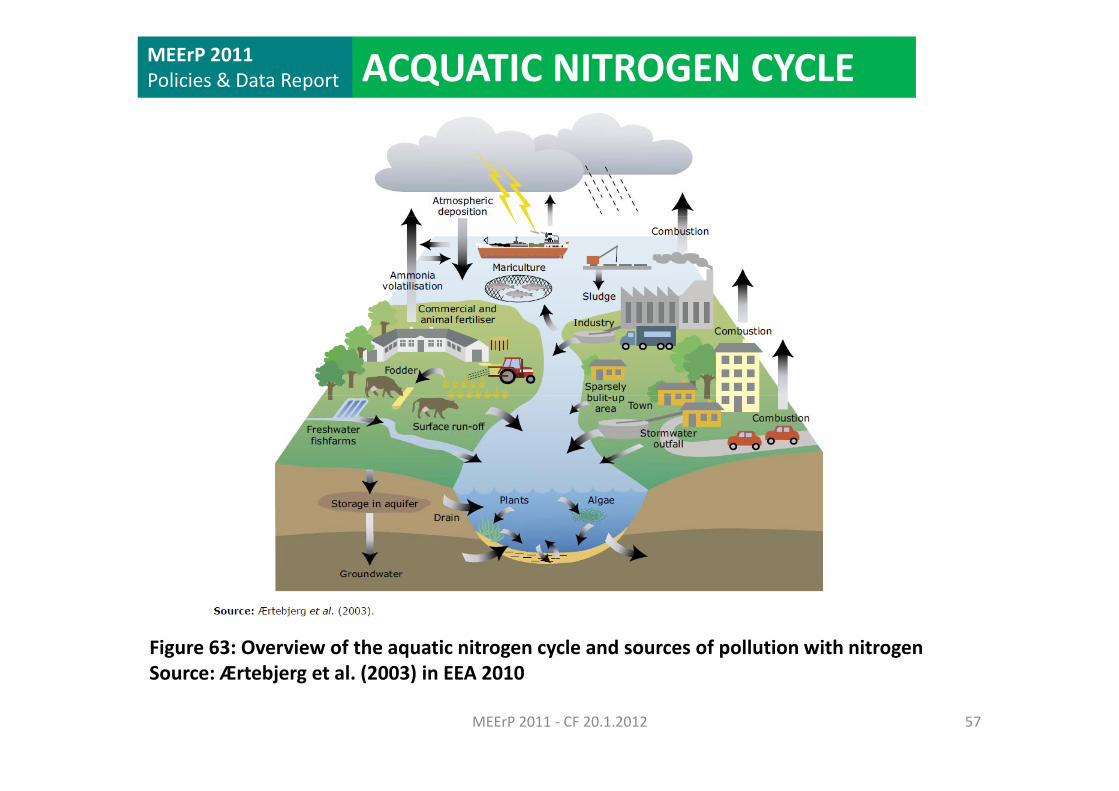
MEErP 2011 Policies & Data Report ACQUATIC NITROGEN CYCLE
Figure 63: Overview of the aquatic nitrogen cycle and sources of pollution with nitrogen ( )
57MEErP 2011 ‐ CF 20.1.2012
Source: Ærtebjerg et al. (2003) in EEA 2010
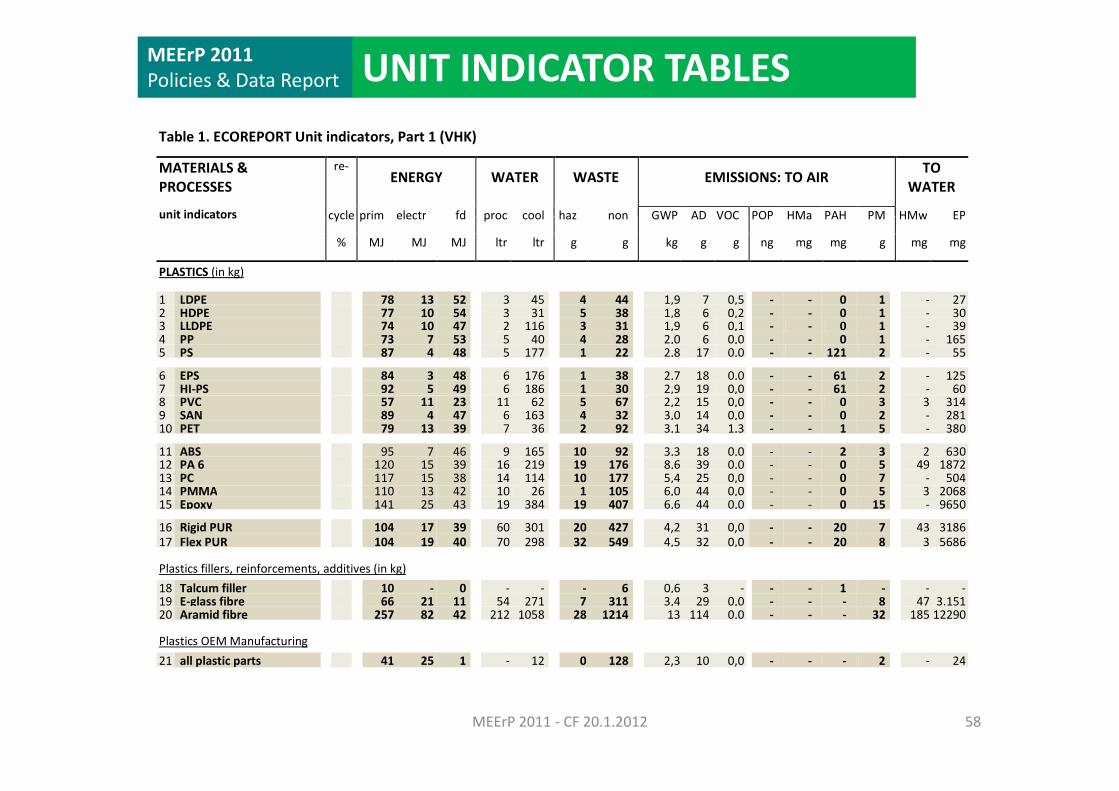
MEErP 2011 Policies & Data Report UNIT INDICATOR TABLESTable 1. ECOREPORT Unit indicators, Part 1 (VHK)
MATERIALS & PROCESSES
unit indicators
re‐ENERGY WATER WASTE EMISSIONS: TO AIR TO
WATER
cycle prim electr fd proc cool haz non GWP AD VOC POP HMa PAH PM HMw EPunit indicators cycle prim electr fd proc cool haz non GWP AD VOC POP HMa PAH PM HMw EP
% MJ MJ MJ ltr ltr g g kg g g ng mg mg g mg mg
PLASTICS (in kg)
1 LDPE 78 13 52 3 45 4 44 1,9 7 0,5 ‐ ‐ 0 1 ‐ 272 HDPE 77 10 54 3 31 5 38 1,8 6 0,2 ‐ ‐ 0 1 ‐ 303 LLDPE 74 10 47 2 116 3 31 1,9 6 0,1 ‐ ‐ 0 1 ‐ 394 PP 73 7 53 5 40 4 28 2,0 6 0,0 ‐ ‐ 0 1 ‐ 1655 PS 87 4 48 5 177 1 22 2,8 17 0,0 ‐ ‐ 121 2 ‐ 55
6 EPS 84 3 48 6 176 1 38 2,7 18 0,0 ‐ ‐ 61 2 ‐ 1257 HI‐PS 92 5 49 6 186 1 30 2,9 19 0,0 ‐ ‐ 61 2 ‐ 608 PVC 57 11 23 11 62 5 67 2,2 15 0,0 ‐ ‐ 0 3 3 3149 SAN 89 4 47 6 163 4 32 3,0 14 0,0 ‐ ‐ 0 2 ‐ 28110 PET 79 13 39 7 36 2 92 3,1 34 1,3 ‐ ‐ 1 5 ‐ 380
11 ABS 95 7 46 9 165 10 92 3,3 18 0,0 ‐ ‐ 2 3 2 63012 PA 6 120 15 39 16 219 19 176 8,6 39 0,0 ‐ ‐ 0 5 49 187213 PC 117 15 38 14 114 10 177 5,4 25 0,0 ‐ ‐ 0 7 ‐ 50414 PMMA 110 13 42 10 26 1 105 6,0 44 0,0 ‐ ‐ 0 5 3 206815 Epoxy 141 25 43 19 384 19 407 6,6 44 0,0 ‐ ‐ 0 15 ‐ 9650
16 Rigid PUR 104 17 39 60 301 20 427 4,2 31 0,0 ‐ ‐ 20 7 43 318617 Flex PUR 104 19 40 70 298 32 549 4,5 32 0,0 ‐ ‐ 20 8 3 5686
Plastics fillers, reinforcements, additives (in kg)18 Talcum filler 10 ‐ 0 ‐ ‐ ‐ 6 0,6 3 ‐ ‐ ‐ 1 ‐ ‐ ‐19 E‐glass fibre 66 21 11 54 271 7 311 3,4 29 0,0 ‐ ‐ ‐ 8 47 3.15120 Aramid fibre 257 82 42 212 1058 28 1214 13 114 0,0 ‐ ‐ ‐ 32 185 12290
Plastics OEM Manufacturing 21 all plastic parts 41 25 1 ‐ 12 0 128 2,3 10 0,0 ‐ ‐ ‐ 2 ‐ 24
58MEErP 2011 ‐ CF 20.1.2012
p p , ,
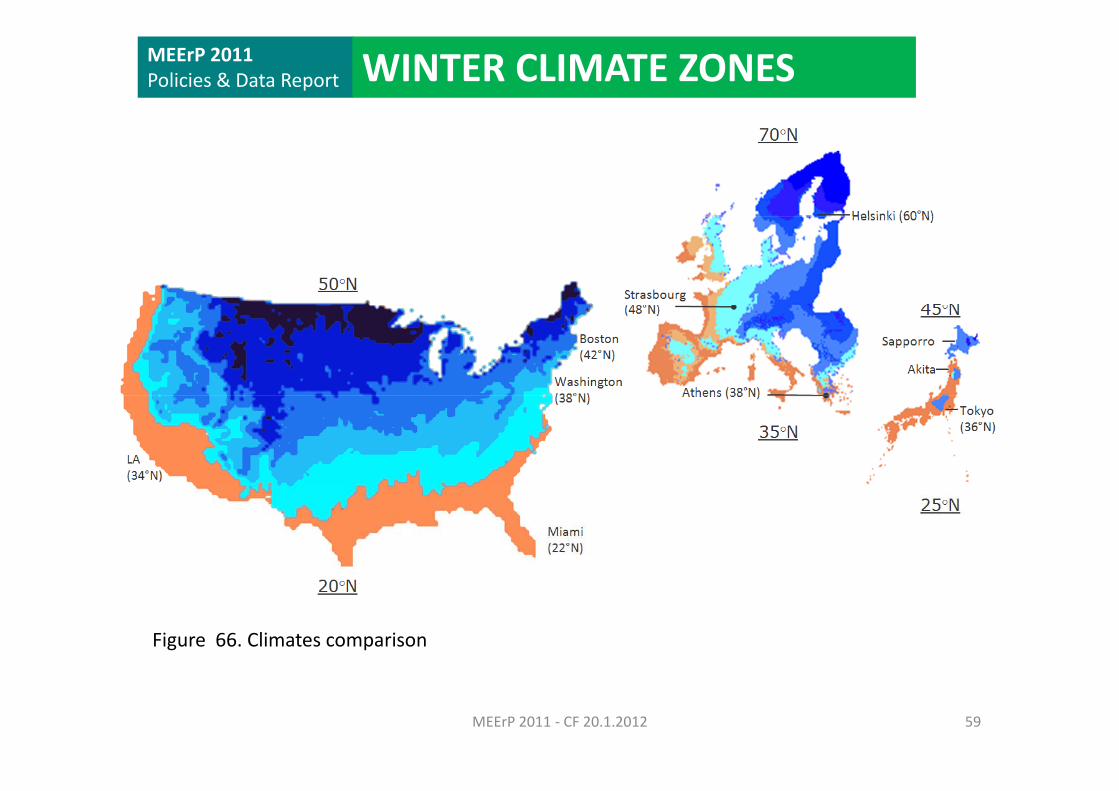
MEErP 2011 Policies & Data Report WINTER CLIMATE ZONES
Figure 66. Climates comparison
59MEErP 2011 ‐ CF 20.1.2012
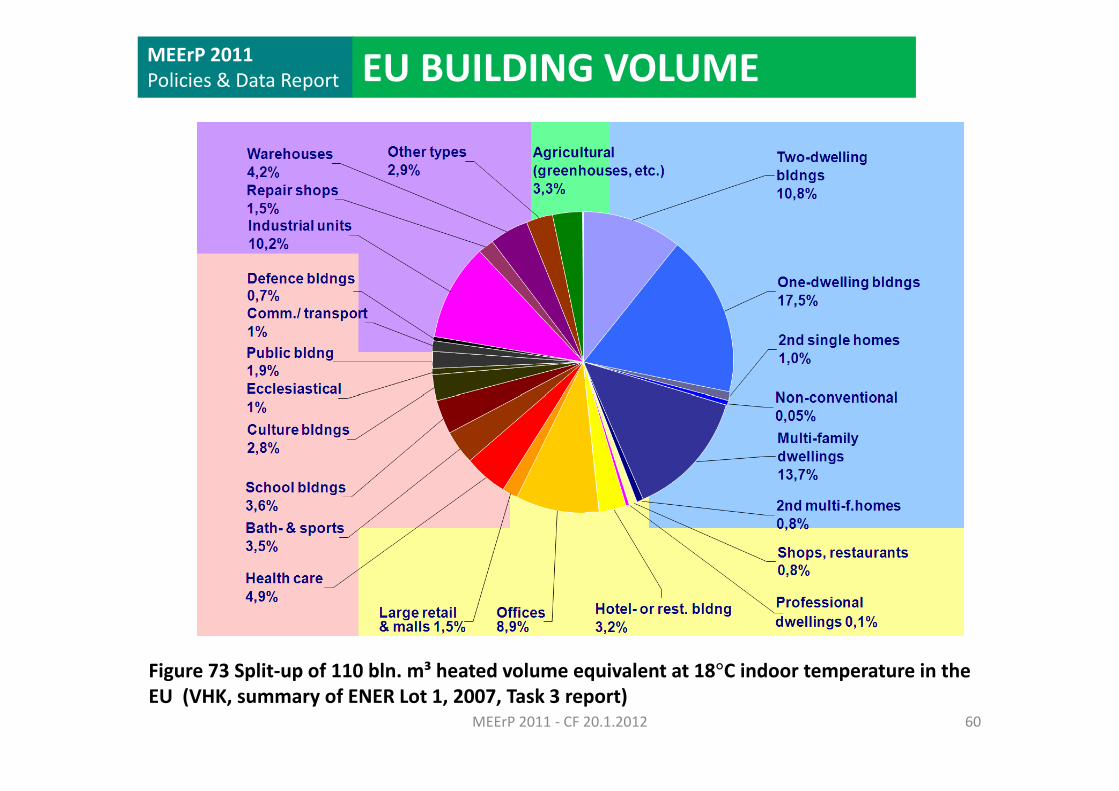
MEErP 2011 Policies & Data Report EU BUILDING VOLUME
Fi 73 S lit f 110 bl ³ h t d l i l t t 18°C i d t t i th
60MEErP 2011 ‐ CF 20.1.2012
Figure 73 Split‐up of 110 bln. m³ heated volume equivalent at 18°C indoor temperature in the EU (VHK, summary of ENER Lot 1, 2007, Task 3 report)
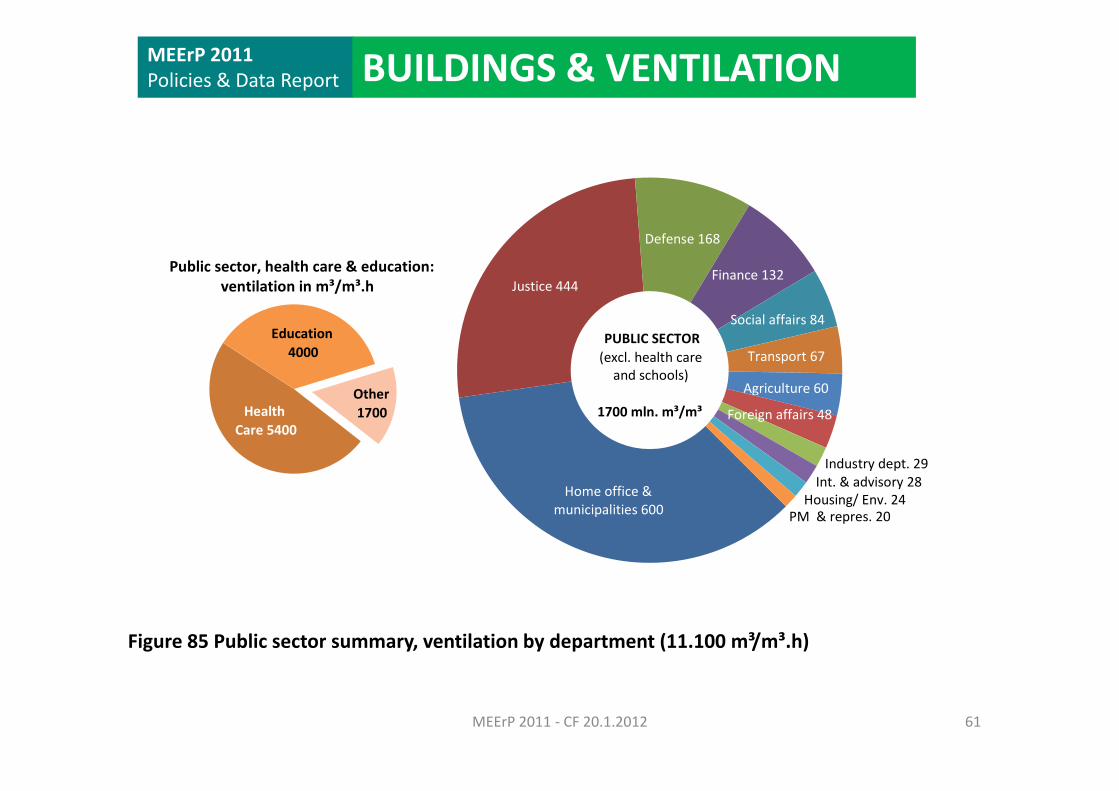
MEErP 2011 Policies & Data Report BUILDINGS & VENTILATION
Justice 444
Defense 168
Finance 132Public sector, health care & education: ventilation in m³/m³.h
Social affairs 84
Transport 67
Agriculture 60
PUBLIC SECTOR(excl. health care and schools)
Education 4000
OtherForeign affairs 48
Industry dept. 29Int. & advisory 28
1700 mln. m³/m³Health Care 5400
Other1700
Home office & municipalities 600
Int. & advisory 28Housing/ Env. 24
PM & repres. 20
Figure 85 Public sector summary, ventilation by department (11.100 m³/m³.h)
61MEErP 2011 ‐ CF 20.1.2012
MEErP 2011 Policies & Data Report
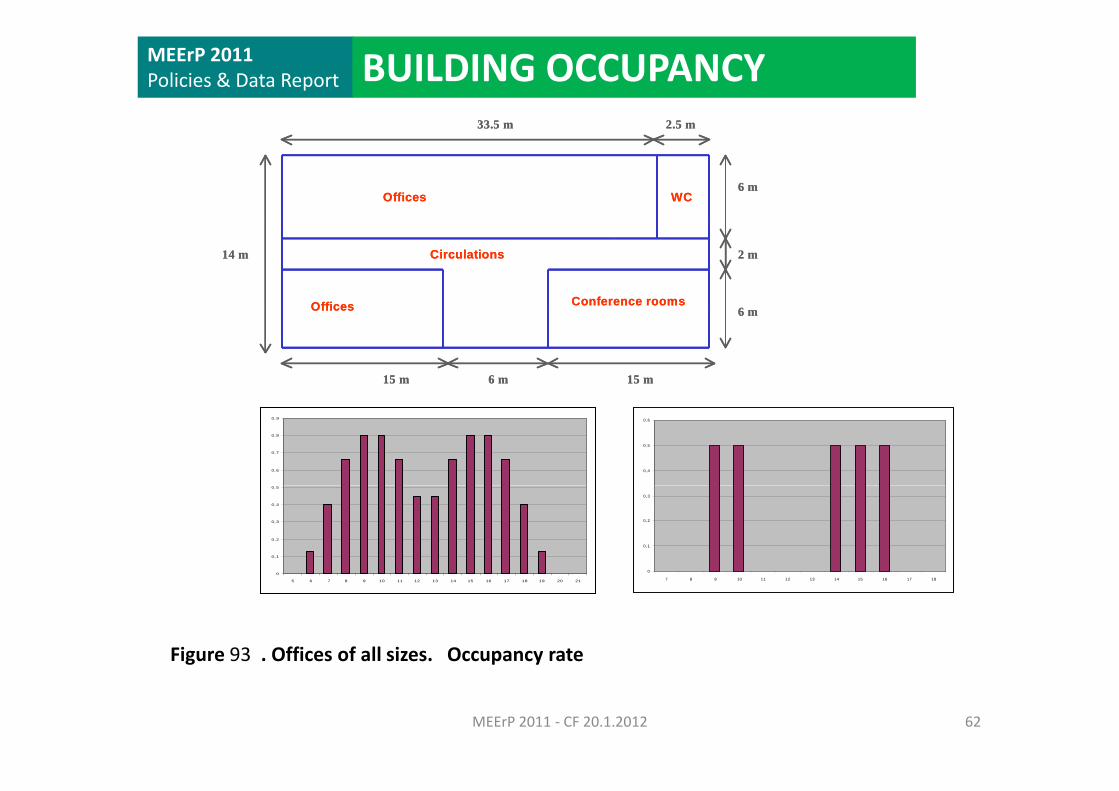
33 5 m 2 5 m33 5 m 2 5 m
BUILDING OCCUPANCY
Offices WC
33.5 m
6 m
2.5 m
Offices WC
33.5 m
6 m
2.5 m
Offices Conference rooms
Circulations14 m 2 m
Offices Conference rooms
Circulations14 m 2 m
Offices
15 m
6 m
6 m 15 m
Offices
15 m
6 m
6 m 15 m
0,6
0,7
0,8
0,9
0,4
0,5
0,6
0
0,1
0,2
0,3
0,4
0,5
0
0,1
0,2
0,3
5 6 7 8 9 10 11 12 13 14 15 16 17 18 19 20 21 7 8 9 10 11 12 13 14 15 16 17 18
Figure 93 . Offices of all sizes. Occupancy rate
62MEErP 2011 ‐ CF 20.1.2012
MEErP 2011
Thank youy
63MEErP 2011 ‐ CF 20.1.2012
![Preparatory review study - Annex Hecodesign-fridges.eu/sites/ecodesign-fridges.eu... · Preparatory /review study - Annex H prepared by Van Holsteijn en Kemna [VHK] 16.3.2015 Commission](https://img.pdfslide.us/doc/110x75/5e9df0eeefc6076f4a5e338f/preparatory-review-study-annex-hecodesign-preparatory-review-study-annex-h.jpg)


![PUBLICATIONS › uploads › sites › 290 › ... · 2020-03-27 · Kemna et al., 2005; Tong et al., 2006a, 2006b; Leroy et al., 2008]. The interfacial surface area per unit pore](https://img.pdfslide.us/doc/110x75/5f0c6d777e708231d4355941/publications-a-uploads-a-sites-a-290-a-2020-03-27-kemna-et-al.jpg)

![Reusing Personal Computer Devices – Good or Bad for the ...web.mit.edu/ebm/www/Publications/ISSST-paper-SahilSahni.pdf · Study for Eco-design of Energy-using Products (MEEuP) [5]](https://img.pdfslide.us/doc/110x75/5f7c9d524f63a752e74ba768/reusing-personal-computer-devices-a-good-or-bad-for-the-webmiteduebmwwwpublicationsissst-paper-.jpg)


![ISSN 1751-8660 Assessing the environmental impact of induction … · 2016-06-30 · spreadsheet, the environmental impact ratios outlined in the document MEEUP 2005 are applied [12]](https://img.pdfslide.us/doc/110x75/5f89a82d5d04b715f270ef8e/issn-1751-8660-assessing-the-environmental-impact-of-induction-2016-06-30-spreadsheet.jpg)
![The Impact of Subungual Osteochondroma Deformans on ... · phyton rubrum, causes most of the superficial fungal infections[4]. Kemna et al. found that dermatophytes had caused 94.7%](https://img.pdfslide.us/doc/110x75/5f449bf610b3724522676a00/the-impact-of-subungual-osteochondroma-deformans-on-phyton-rubrum-causes-most.jpg)