Embed Size (px)
Citation preview
1
Green Lodging Performance Measures Study
November 11, 2008
Daniel E. Meeroff, Ph.D.P.D. Scarlatos, Ph.D.
Department of Civil Engineering
Laboratories for Engineered Environmental Solutions
OverviewOverview
• Making the case• Methodology• Results from the
R l i h H t l
D.E. Meeroff, Ph.D. ©2008
Raleigh Hotel• Lessons learned• Wish lists• Question and
answersThe Raleigh Hotel, Miami Beach, FL
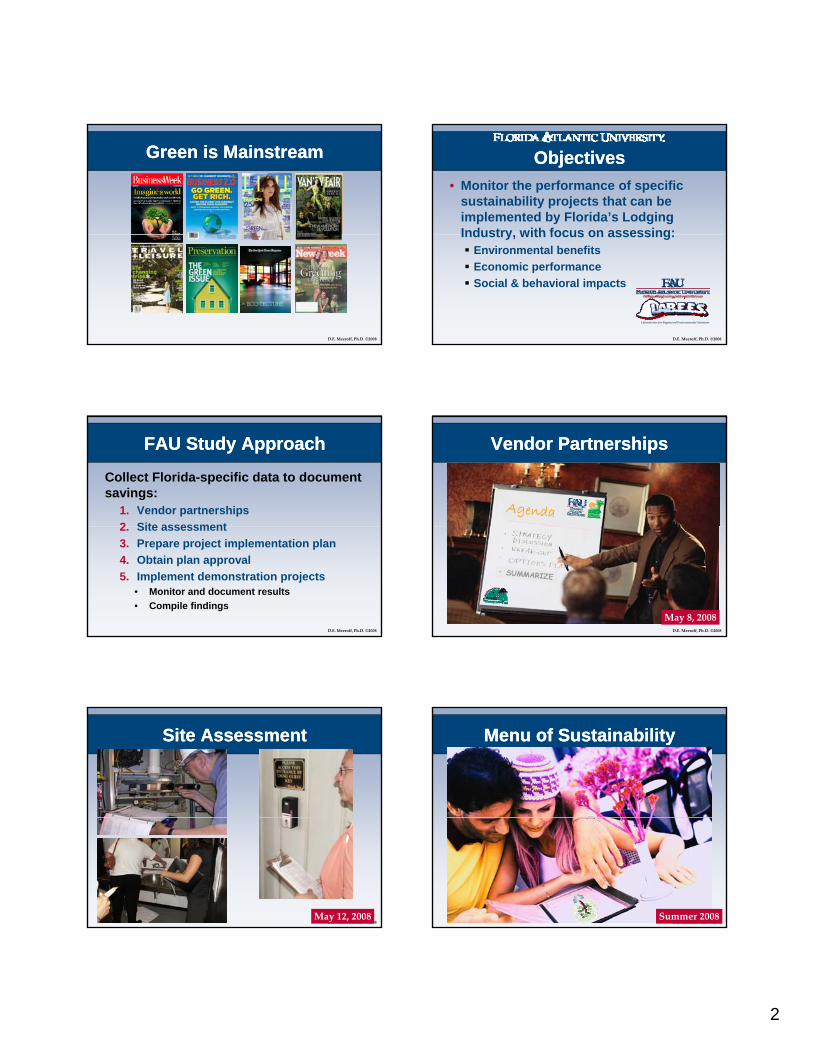
Florida Green Lodging ProgramFlorida Green Lodging ProgramWater
ConservationWaste
Reduction
D.E. Meeroff, Ph.D. ©2008www.FloridaGreenLodging.org
Clean AirPractices
EnergyEfficiency
Communication
Why the Lodging Industry?Why the Lodging Industry?• Buildings account for 40% of all
carbon emissions• Hotels are among the most
wasteful buildings in the commercial sector
Hotels generate as much waste in
D.E. Meeroff, Ph.D. ©2008
Hotels generate as much waste in one week as 100 families generate in a year
• Hotels stand to gain the most from “going green”
Increased revenues (ADR, RevPar)Decreased expensesImpact economic bottom line in TWO ways
Industry Demand Industry Demand • “Green” is a consideration for travelers when
choosing accommodations:75% of buyers have taken environmental considerations into account (IMEX 3rd Annual Survey Results 2007)
D.E. Meeroff, Ph.D. ©2008
70% of US travelers would pay a premium to stay at an environmentally responsible hotel (International Ecotourism Society)
60% of travelers prefer to stay in green hotels (Hotel Association of Canada)
33% of travel managers consider canceling the contracts of suppliers with poor environmental records (Association of Corporate Travel Executives)
43 million Americans are “ecologically concerned” (US Travel Data Center)
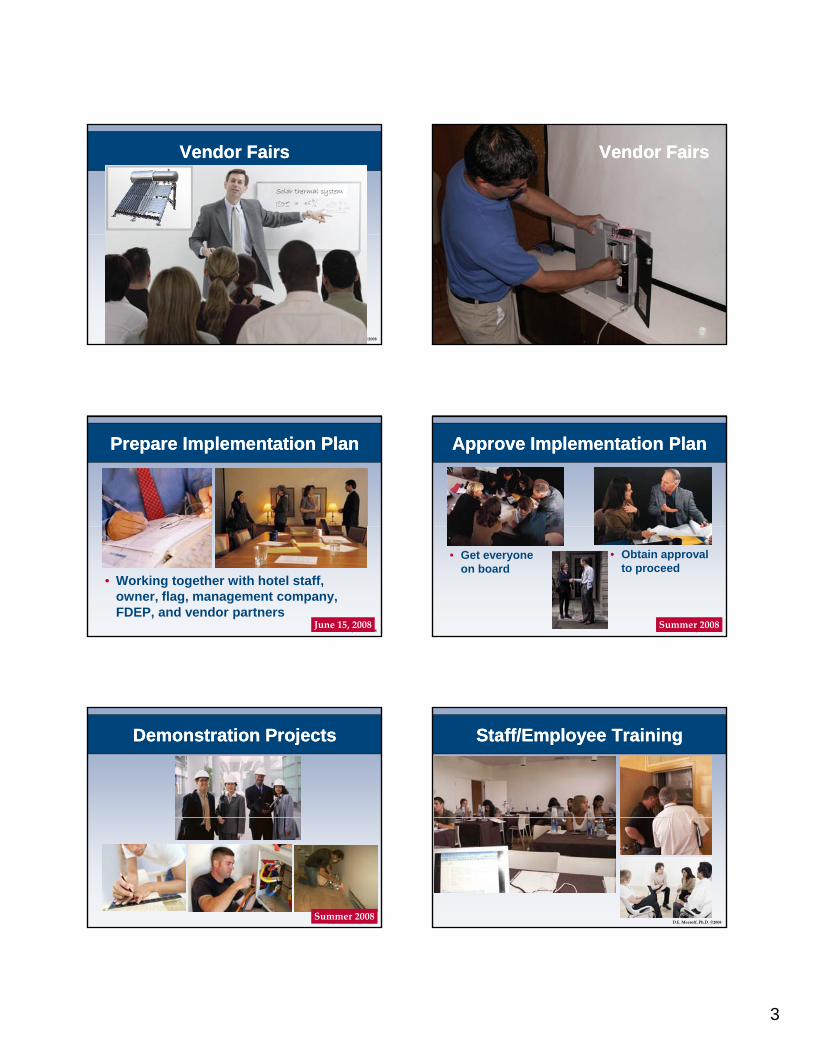
More customers8%
Other3%
It’s Not Just About Cost AnymoreIt’s Not Just About Cost Anymore• Of those
surveyed:90% saw reductions in both water and electricity bills67% saw
D.E. Meeroff, Ph.D. ©2008
Cost savings27%
Greater awareness
22%
"Green" appeal22%
Increased media exposure
18%
Source: Green Globe Trotter 2(2), Feb. 2005
recognizable staff motivation40% received international exposure93% stated they have a more effective management system in place
2
Green is MainstreamGreen is Mainstream
D.E. Meeroff, Ph.D. ©2008
ObjectivesObjectives• Monitor the performance of specific
sustainability projects that can be implemented by Florida’s Lodging Industry with focus on assessing:
D.E. Meeroff, Ph.D. ©2008
Industry, with focus on assessing:Environmental benefitsEconomic performance Social & behavioral impacts
Laboratories for Engineered Environmental Solutions
FAU Study ApproachFAU Study Approach
Collect Florida-specific data to documentsavings:
1. Vendor partnerships2 Site assessment
D.E. Meeroff, Ph.D. ©2008
2. Site assessment3. Prepare project implementation plan4. Obtain plan approval5. Implement demonstration projects
• Monitor and document results• Compile findings
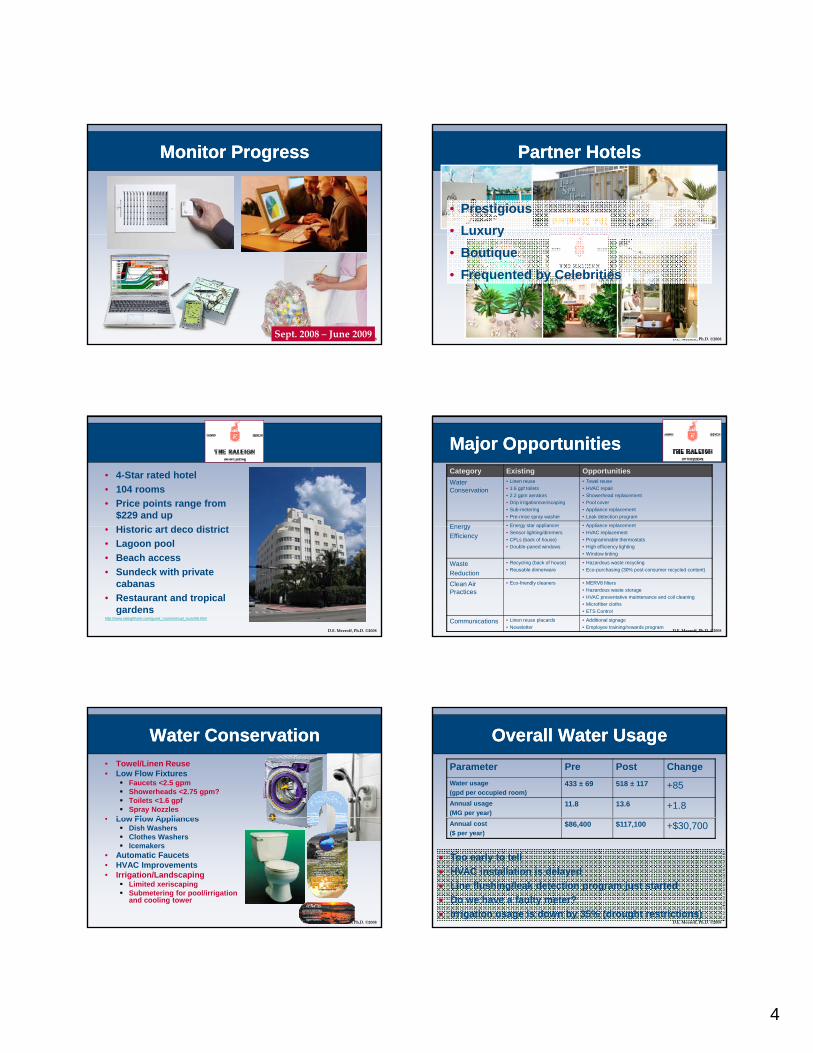
Vendor PartnershipsVendor Partnerships
D.E. Meeroff, Ph.D. ©2008
May 8, 2008
Site AssessmentSite Assessment
D.E. Meeroff, Ph.D. ©2008May 12, 2008
Menu of SustainabilityMenu of Sustainability
D.E. Meeroff, Ph.D. ©2008Summer 2008
3
Vendor FairsVendor Fairs
Solar thermal system
D.E. Meeroff, Ph.D. ©2008
Vendor FairsVendor Fairs
D.E. Meeroff, Ph.D. ©2008
Prepare Implementation PlanPrepare Implementation Plan
D.E. Meeroff, Ph.D. ©2008
• Working together with hotel staff, owner, flag, management company, FDEP, and vendor partners
June 15, 2008
Approve Implementation PlanApprove Implementation Plan
D.E. Meeroff, Ph.D. ©2008
• Get everyone on board
• Obtain approval to proceed
Summer 2008
Demonstration ProjectsDemonstration Projects
D.E. Meeroff, Ph.D. ©2008Summer 2008
Staff/Employee TrainingStaff/Employee Training
D.E. Meeroff, Ph.D. ©2008
4
Monitor ProgressMonitor Progress
D.E. Meeroff, Ph.D. ©2008Sept. 2008 – June 2009
Partner HotelsPartner Hotels
• Prestigious• Luxury
D.E. Meeroff, Ph.D. ©2008
Luxury• Boutique• Frequented by Celebrities
• 4-Star rated hotel• 104 rooms• Price points range from
$229 and upHi t i t d di t i t
D.E. Meeroff, Ph.D. ©2008
• Historic art deco district• Lagoon pool• Beach access• Sundeck with private
cabanas• Restaurant and tropical
gardenshttp://www.raleighhotel.com/guest_rooms/virtual_tours/06.html
Major OpportunitiesMajor OpportunitiesCategory Existing OpportunitiesWater Conservation
• Linen reuse• 1.6 gpf toilets• 2.2 gpm aerators• Drip irrigation/xeriscaping• Sub-metering• Pre-rinse spray washer
• Towel reuse• HVAC repair• Showerhead replacement• Pool cover• Appliance replacement• Leak detection program
Energy • Energy star appliances • Appliance replacement
D.E. Meeroff, Ph.D. ©2008
Energy Efficiency
Energy star appliances• Sensor lighting/dimmers• CFLs (back of house)• Double-paned windows
Appliance replacement• HVAC replacement• Programmable thermostats• High efficiency lighting• Window tinting
Waste Reduction
• Recycling (back of house)• Reusable dinnerware
• Hazardous waste recycling• Eco-purchasing (30% post-consumer recycled content)
Clean Air Practices
• Eco-friendly cleaners • MERV8 filters• Hazardous waste storage• HVAC preventative maintenance and coil cleaning• Microfiber cloths• ETS Control
Communications • Linen reuse placards• Newsletter
• Additional signage• Employee training/rewards program
Water ConservationWater Conservation• Towel/Linen Reuse• Low Flow Fixtures
Faucets <2.5 gpmShowerheads <2.75 gpm?Toilets <1.6 gpfSpray Nozzles
• Low Flow Appliances
D.E. Meeroff, Ph.D. ©2008
• Low Flow AppliancesDish WashersClothes WashersIcemakers
• Automatic Faucets• HVAC Improvements• Irrigation/Landscaping
Limited xeriscapingSubmetering for pool/irrigation and cooling tower
Overall Water UsageOverall Water UsageParameter Pre Post ChangeWater usage (gpd per occupied room)
433 ± 69 518 ± 117 +85
Annual usage (MG per year)
11.8 13.6 +1.8
D.E. Meeroff, Ph.D. ©2008
• Too early to tell• HVAC installation is delayed• Line flushing/leak detection program just started• Do we have a faulty meter?• Irrigation usage is down by 35% (drought restrictions)
Annual cost ($ per year)
$86,400 $117,100 +$30,700
5
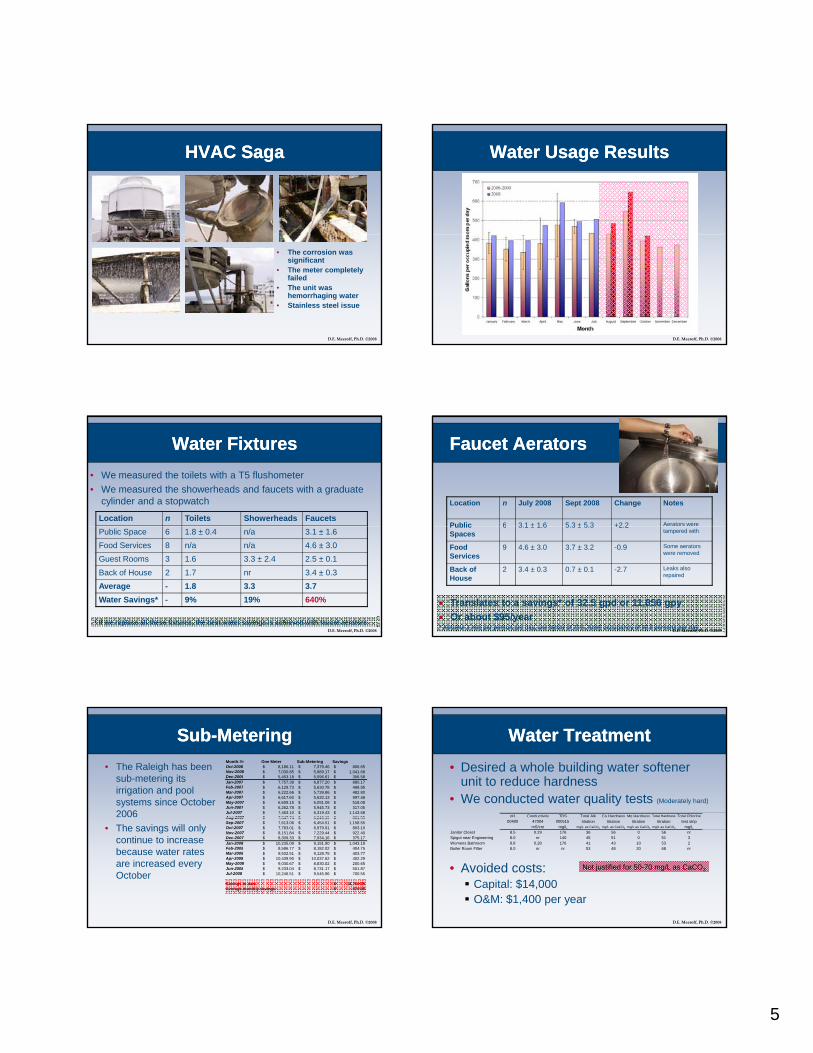
HVAC SagaHVAC Saga
D.E. Meeroff, Ph.D. ©2008
• The corrosion was significant
• The meter completely failed
• The unit was hemorrhaging water
• Stainless steel issue
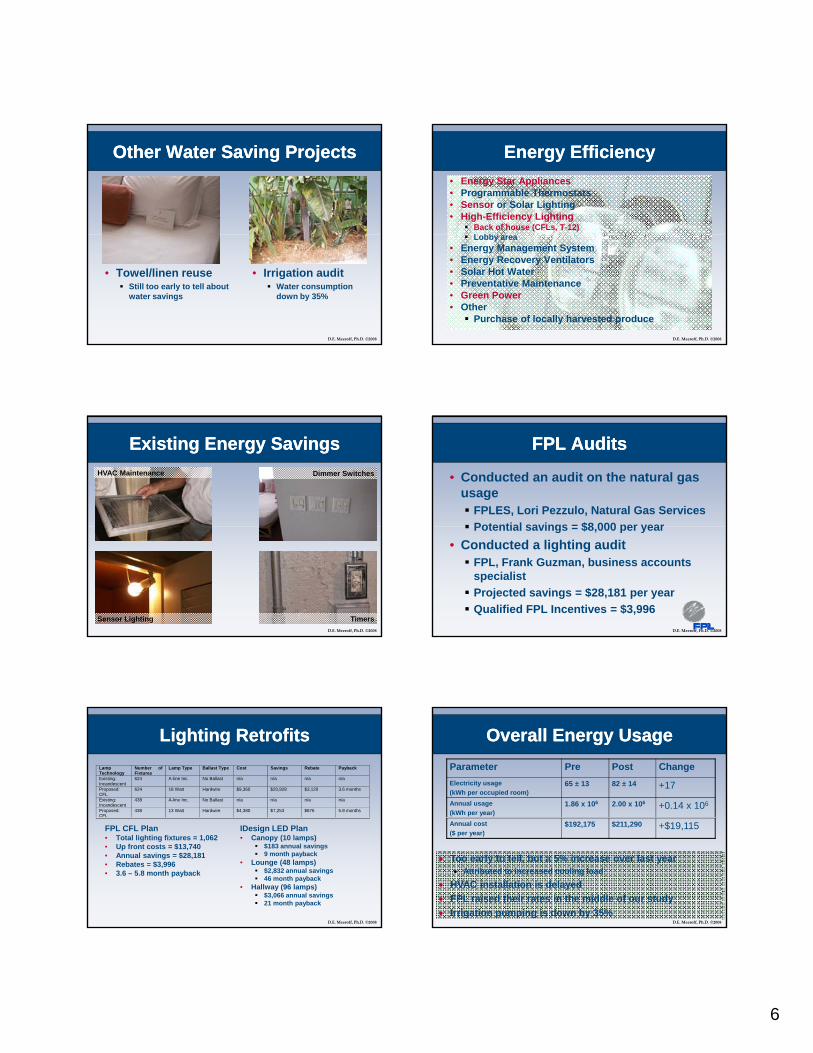
Water Usage ResultsWater Usage Results
D.E. Meeroff, Ph.D. ©2008
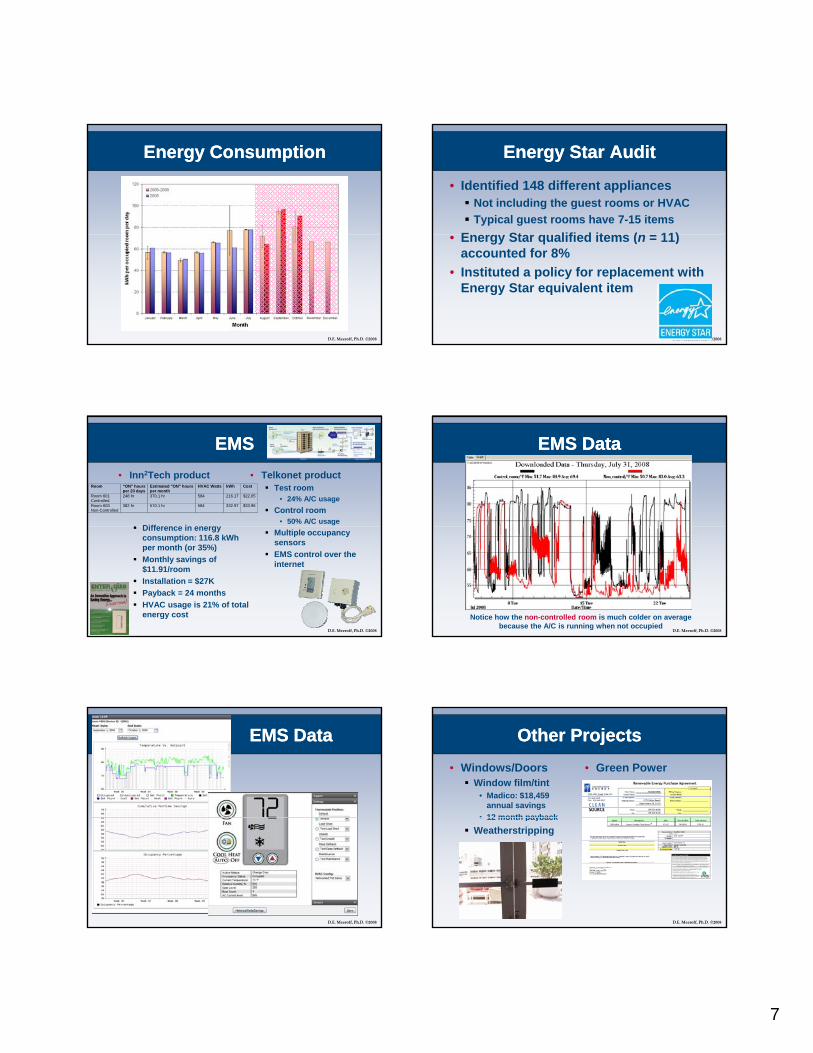
Water FixturesWater Fixtures• We measured the toilets with a T5 flushometer• We measured the showerheads and faucets with a graduate
cylinder and a stopwatch
Location n Toilets Showerheads Faucets
D.E. Meeroff, Ph.D. ©2008
Public Space 6 1.8 ± 0.4 n/a 3.1 ± 1.6Food Services 8 n/a n/a 4.6 ± 3.0Guest Rooms 3 1.6 3.3 ± 2.4 2.5 ± 0.1Back of House 2 1.7 nr 3.4 ± 0.3Average - 1.8 3.3 3.7Water Savings* - 9% 19% 640%
* If we replace all these fixtures, the best water savings is achieved with faucet aerators
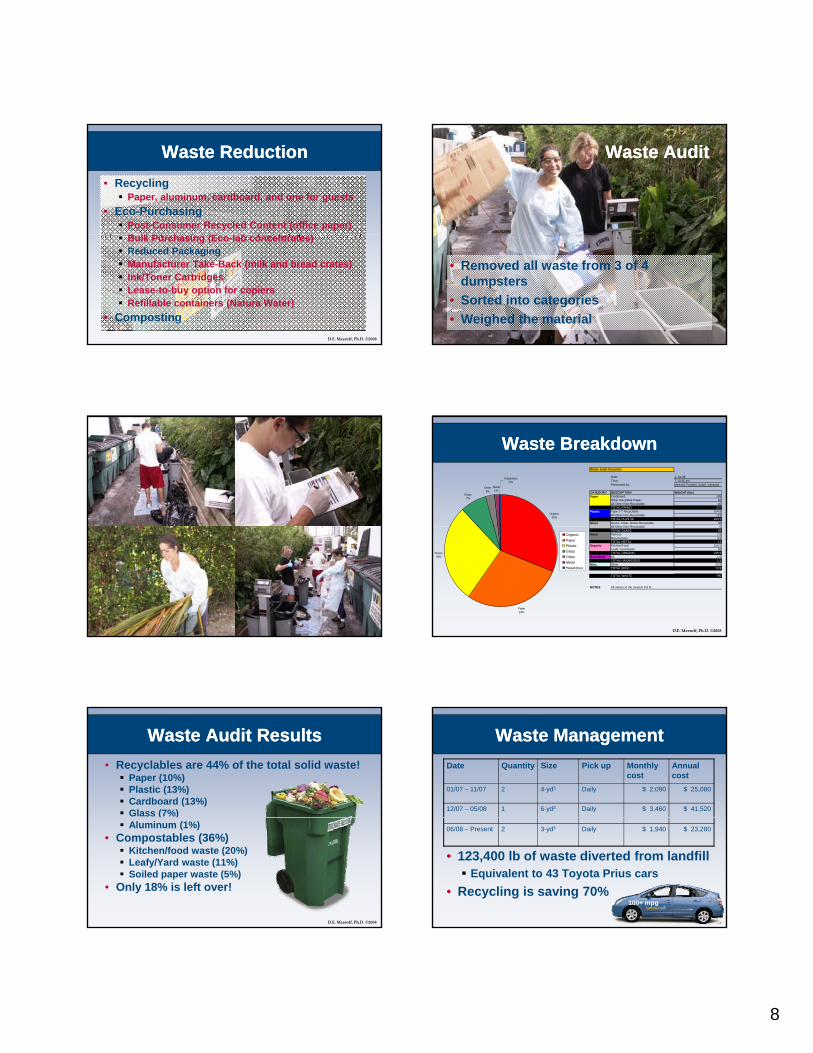
Faucet AeratorsFaucet Aerators
Location n July 2008 Sept 2008 Change Notes
Public 6 3 1 ± 1 6 5 3 ± 5 3 +2 2 Aerators were
D.E. Meeroff, Ph.D. ©2008
Public Spaces
6 3.1 ± 1.6 5.3 ± 5.3 +2.2tampered with
Food Services
9 4.6 ± 3.0 3.7 ± 3.2 -0.9 Some aerators were removed
Back of House
2 3.4 ± 0.3 0.7 ± 0.1 -2.7 Leaks also repaired
• Translates to a savings* of 32.5 gpd or 11,856 gpy• Or about $95/year* Assume 1 min per person per day, use factor of 25%, hotel occupancy of 92.8 persons per day
SubSub--MeteringMetering• The Raleigh has been
sub-metering its irrigation and pool systems since October 2006
Month-Yr One Meter Sub-Metering SavingsOct-2006 8,186.11$ 7,379.46$ 806.65$ Nov-2006 7,030.85$ 5,989.17$ 1,041.68$ Dec-2006 5,453.18$ 5,096.61$ 356.58$ Jan-2007 7,757.38$ 6,877.20$ 880.17$ Feb-2007 6,129.73$ 5,630.78$ 498.95$ Mar-2007 6,222.66$ 5,739.86$ 482.80$ Apr-2007 6,617.60$ 5,620.13$ 997.48$ May-2007 6,609.15$ 6,091.08$ 518.08$ Jun-2007 6,262.78$ 5,945.73$ 317.05$ Jul-2007 7,463.10$ 6,319.43$ 1,143.68$ Aug-2007 7 047 74$ 6 246 19$ 801 55$
D.E. Meeroff, Ph.D. ©2008
• The savings will only continue to increase because water rates are increased every October
Aug-2007 7,047.74$ 6,246.19$ 801.55$ Sep-2007 7,613.06$ 6,454.51$ 1,158.55$ Oct-2007 7,783.01$ 6,979.91$ 803.10$ Nov-2007 8,151.84$ 7,229.44$ 922.40$ Dec-2007 8,309.33$ 7,934.16$ 375.17$ Jan-2008 10,235.09$ 9,191.90$ 1,043.19$ Feb-2008 8,586.77$ 8,182.02$ 404.75$ Mar-2008 9,532.51$ 9,128.75$ 403.77$ Apr-2008 10,439.90$ 10,037.62$ 402.29$ May-2008 9,030.67$ 8,830.02$ 200.65$ Jun-2008 9,233.04$ 8,731.17$ 501.87$ Jul-2008 10,246.51$ 9,545.96$ 700.55$
Savings to date 14,760.95$ Average monthly savings 670.95$
Water TreatmentWater Treatment• Desired a whole building water softener
unit to reduce hardness• We conducted water quality tests (Moderately hard)
pH Conductivity TDS Total Alk Ca Hardness Mg Hardness Total Hardness Total Chlorine
D.E. Meeroff, Ph.D. ©2008
• Avoided costs: Capital: $14,000 O&M: $1,400 per year
p y g00400 47004 000515 titration titration titration titration test strip
mS/cm mg/L mg/L as CaCO3 mg/L as CaCO3 mg/L as CaCO3 mg/L as CaCO3 mg/LJanitor Closet 8.5 0.29 176 36 56 0 56 nrSpigot near Engineering 8.0 nr 140 45 51 0 51 3Womens Bathroom 8.8 0.28 176 41 43 10 53 2Boiler Room Filter 8.0 nr nr 53 48 20 68 nr
Not justified for 50-70 mg/L as CaCO3
6
Other Water Saving ProjectsOther Water Saving Projects
D.E. Meeroff, Ph.D. ©2008
• Towel/linen reuseStill too early to tell about water savings
• Irrigation auditWater consumption down by 35%
Energy EfficiencyEnergy Efficiency• Energy Star Appliances• Programmable Thermostats• Sensor or Solar Lighting• High-Efficiency Lighting
Back of house (CFLs, T-12)L bb
D.E. Meeroff, Ph.D. ©2008
Lobby area• Energy Management System• Energy Recovery Ventilators• Solar Hot Water• Preventative Maintenance • Green Power• Other
Purchase of locally harvested produce
Existing Energy SavingsExisting Energy SavingsHVAC Maintenance Dimmer Switches
D.E. Meeroff, Ph.D. ©2008
Sensor Lighting Timers
FPL AuditsFPL Audits
• Conducted an audit on the natural gas usage
FPLES, Lori Pezzulo, Natural Gas ServicesPotential savings = $8 000 per year
D.E. Meeroff, Ph.D. ©2008
Potential savings = $8,000 per year• Conducted a lighting audit
FPL, Frank Guzman, business accounts specialistProjected savings = $28,181 per yearQualified FPL Incentives = $3,996
Lighting RetrofitsLighting RetrofitsLamp Technology
Number of Fixtures
Lamp Type Ballast Type Cost Savings Rebate Payback
Existing: Incandescent
624 A-line Inc. No Ballast n/a n/a n/a n/a
Proposed: CFL
624 18 Watt Hardwire $9,360 $20,928 $3,120 3.6 months
Existing: Incandescent
438 A-line Inc. No Ballast n/a n/a n/a n/a
Proposed: CFL
438 13 Watt Hardwire $4,380 $7,253 $876 5.8 months
D.E. Meeroff, Ph.D. ©2008
FPL CFL Plan• Total lighting fixtures = 1,062• Up front costs = $13,740• Annual savings = $28,181• Rebates = $3,996• 3.6 – 5.8 month payback
IDesign LED Plan• Canopy (10 lamps)
$183 annual savings9 month payback
• Lounge (48 lamps)$2,832 annual savings46 month payback
• Hallway (96 lamps)$3,066 annual savings21 month payback
Overall Energy UsageOverall Energy UsageParameter Pre Post ChangeElectricity usage (kWh per occupied room)
65 ± 13 82 ± 14 +17
Annual usage (kWh per year)
1.86 x 10⁶ 2.00 x 10⁶ +0.14 x 10⁶
D.E. Meeroff, Ph.D. ©2008
• Too early to tell, but a 5% increase over last year• Attributed to increased cooling load
• HVAC installation is delayed• FPL raised their rates in the middle of our study• Irrigation pumping is down by 35%
Annual cost ($ per year)
$192,175 $211,290 +$19,115
7
Energy ConsumptionEnergy Consumption
D.E. Meeroff, Ph.D. ©2008
Energy Star AuditEnergy Star Audit
• Identified 148 different appliancesNot including the guest rooms or HVACTypical guest rooms have 7-15 items
E St lifi d it ( 11)
D.E. Meeroff, Ph.D. ©2008
• Energy Star qualified items (n = 11) accounted for 8%
• Instituted a policy for replacement with Energy Star equivalent item
EMSEMS• Inn2Tech product
Diff i
• Telkonet productTest room
• 24% A/C usageControl room
• 50% A/C usage
Room “ON” hours per 20 days
Estimated “ON” hours per month
HVAC Watts kWh Cost
Room 601 Controlled
248 hr 370.1 hr 584 216.17 $22.05
Room 603 Non-Controlled
382 hr 570.1 hr 584 332.97 $33.96
D.E. Meeroff, Ph.D. ©2008
Difference in energy consumption: 116.8 kWh per month (or 35%)Monthly savings of $11.91/roomInstallation = $27K Payback = 24 monthsHVAC usage is 21% of total energy cost
Multiple occupancy sensorsEMS control over the internet
EMS DataEMS Data
D.E. Meeroff, Ph.D. ©2008
Notice how the non-controlled room is much colder on average because the A/C is running when not occupied
EMS DataEMS Data
D.E. Meeroff, Ph.D. ©2008
Other ProjectsOther Projects• Windows/Doors
Window film/tint• Madico: $18,459
annual savings • 12 month payback
• Green Power
D.E. Meeroff, Ph.D. ©2008
• 12 month payback Weatherstripping
8
Waste ReductionWaste Reduction• Recycling
Paper, aluminum, cardboard, and one for guests• Eco-Purchasing
Post-Consumer Recycled Content (office paper)B lk P h i (E l b t t )
D.E. Meeroff, Ph.D. ©2008
Bulk Purchasing (Eco-lab concentrates)Reduced PackagingManufacturer Take-Back (milk and bread crates)Ink/Toner CartridgesLease-to-buy option for copiersRefillable containers (Natura Water)
• Composting
Waste AuditWaste Audit
D.E. Meeroff, Ph.D. ©2008
• Removed all waste from 3 of 4 dumpsters
• Sorted into categories• Weighed the material
D.E. Meeroff, Ph.D. ©2008
Waste Audit Checklist
Date: 1-Jul-08Time: 7-10:45 amPerformed by: Meeroff, Frankel, Sobel, Vanessa
CATEGORY DESCRIPTION WEIGHT (lbs)Paper Cardboard 105
Other Recylable Paper 82All Other Non-Recyclable 40TOTAL PAPER 227
Plastic Type 1-7 Recyclable 104.5All Other Non-Recyclable 119TOTAL PLASTIC 223.5
Glass Green, Clear, Brown Recyclable 58All Other Non Recyclable 0
Organic32%
Glass7%
Other3%
Metal1%
Hazardous0%
Waste BreakdownWaste Breakdown
D.E. Meeroff, Ph.D. ©2008
All Other Non-Recyclable 0TOTAL GLASS 58
Metal Ferrous 7.5Non-Ferrous 3.5TOTAL METAL 11
Organic Kitchen/Food 156.5Leafy Yard Waste 89TOTAL ORGANIC 245.5
Hazardous All 1.5TOTAL HAZARDOUS 1.5
Misc. Other 23.5TOTAL MISC 23.5
TOTAL WASTE 790
NOTES All values to the nearest 0.5 lb.
Paper29%
Plastic28%
OrganicPaperPlasticGlassOtherMetalHazardous
Waste Audit ResultsWaste Audit Results• Recyclables are 44% of the total solid waste!
Paper (10%)Plastic (13%)Cardboard (13%)Glass (7%)
D.E. Meeroff, Ph.D. ©2008
( )Aluminum (1%)
• Compostables (36%)Kitchen/food waste (20%)Leafy/Yard waste (11%) Soiled paper waste (5%)
• Only 18% is left over!
Waste ManagementWaste ManagementDate Quantity Size Pick up Monthly
costAnnual cost
01/07 – 11/07 2 4-yd3 Daily $ 2,090 $ 25,080
12/07 – 05/08 1 6-yd3 Daily $ 3,460 $ 41,520
D.E. Meeroff, Ph.D. ©2008
• 123,400 lb of waste diverted from landfillEquivalent to 43 Toyota Prius cars
• Recycling is saving 70%
06/08 – Present 2 3-yd3 Daily $ 1,940 $ 23,280
100+ mpg
9
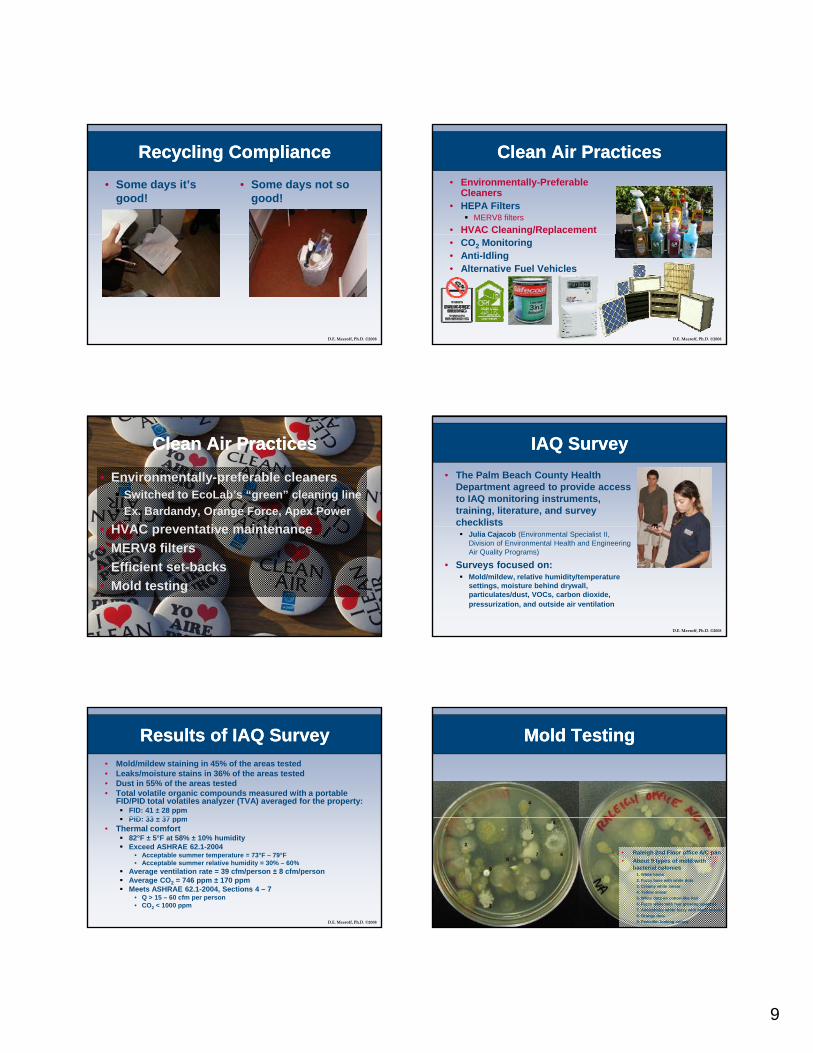
Recycling ComplianceRecycling Compliance• Some days it’s
good!• Some days not so
good!
D.E. Meeroff, Ph.D. ©2008
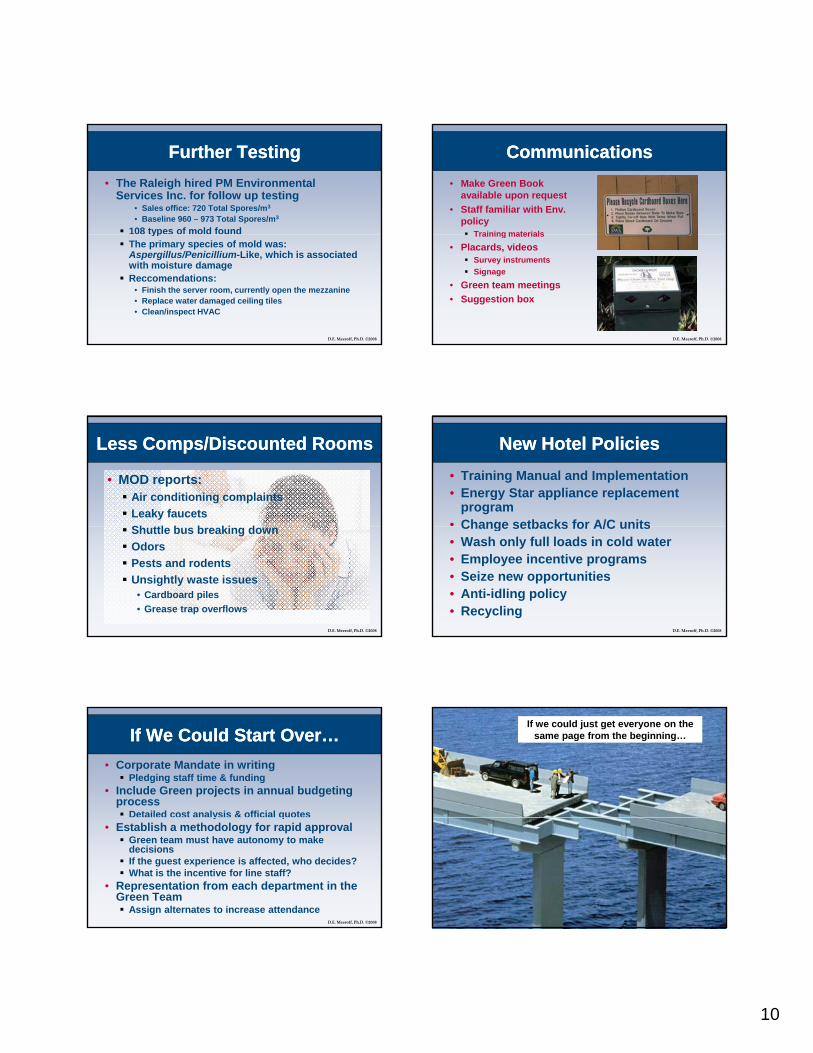
Clean Air PracticesClean Air Practices• Environmentally-Preferable
Cleaners• HEPA Filters
MERV8 filters• HVAC Cleaning/Replacement
D.E. Meeroff, Ph.D. ©2008
g p• CO2 Monitoring• Anti-Idling• Alternative Fuel Vehicles
Clean Air PracticesClean Air Practices
• Environmentally-preferable cleanersSwitched to EcoLab’s “green” cleaning line Ex. Bardandy, Orange Force, Apex Power
HVAC t ti i t
D.E. Meeroff, Ph.D. ©2008
• HVAC preventative maintenance• MERV8 filters• Efficient set-backs• Mold testing
IAQ SurveyIAQ Survey• The Palm Beach County Health
Department agreed to provide access to IAQ monitoring instruments, training, literature, and survey checklists
D.E. Meeroff, Ph.D. ©2008
Julia Cajacob (Environmental Specialist II, Division of Environmental Health and Engineering Air Quality Programs)
• Surveys focused on:Mold/mildew, relative humidity/temperature settings, moisture behind drywall, particulates/dust, VOCs, carbon dioxide, pressurization, and outside air ventilation
Results of IAQ SurveyResults of IAQ Survey• Mold/mildew staining in 45% of the areas tested• Leaks/moisture stains in 36% of the areas tested• Dust in 55% of the areas tested• Total volatile organic compounds measured with a portable
FID/PID total volatiles analyzer (TVA) averaged for the property:FID: 41 ± 28 ppmPID 33 ± 37 ppm
D.E. Meeroff, Ph.D. ©2008
PID: 33 ± 37 ppm• Thermal comfort
82°F ± 5°F at 58% ± 10% humidityExceed ASHRAE 62.1-2004
• Acceptable summer temperature = 73°F – 79°F • Acceptable summer relative humidity = 30% – 60%
Average ventilation rate = 39 cfm/person ± 8 cfm/personAverage CO2 = 746 ppm ± 170 ppmMeets ASHRAE 62.1-2004, Sections 4 – 7
• Q > 15 – 60 cfm per person• CO2 < 1000 ppm
4
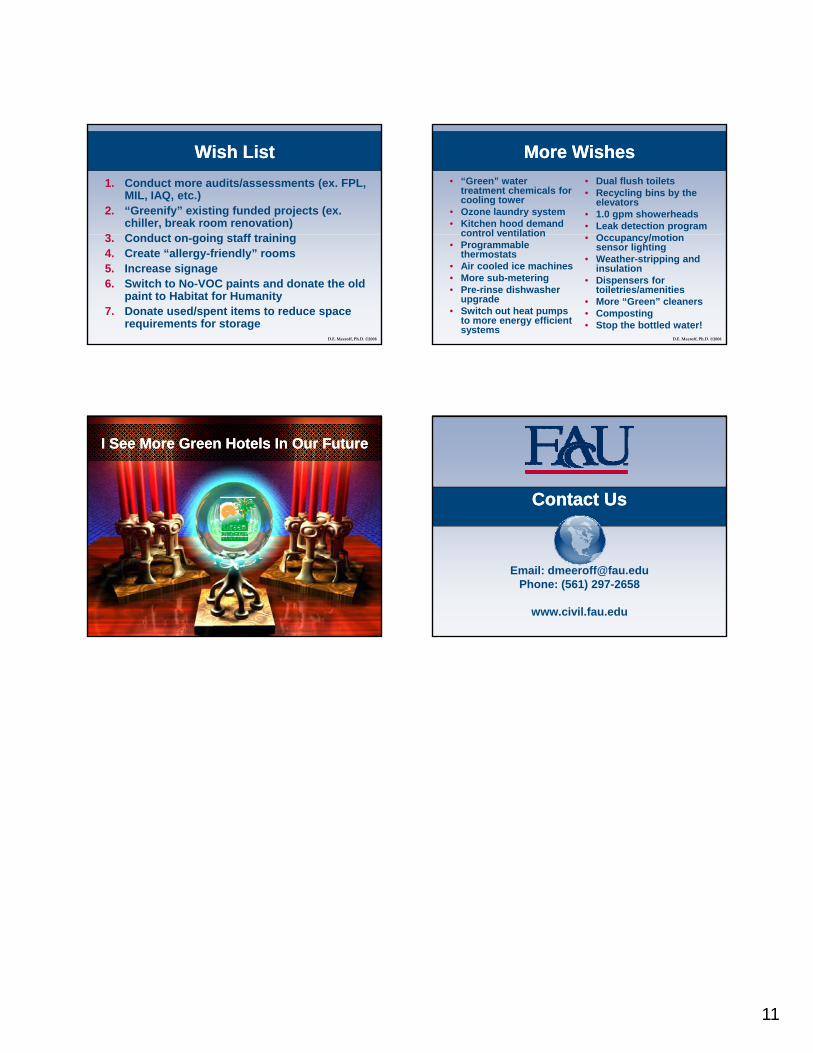
Mold TestingMold Testing
D.E. Meeroff, Ph.D. ©2008
• Raleigh 2nd Floor office A/C pan• About 9 types of mold with
bacterial colonies1. White blobs2. Fuzzy base with white dots3. Creamy white smear4. Yellow smear5. White dots on cotton-like hair6. Fuzzy white with hair growing upwards7. Amorphous white fuzzy with black streaks8. Orange dots9. Penicillin looking colony
1
2
3
5
678
9
10
Further TestingFurther Testing• The Raleigh hired PM Environmental
Services Inc. for follow up testing• Sales office: 720 Total Spores/m3
• Baseline 960 – 973 Total Spores/m3
108 types of mold found
D.E. Meeroff, Ph.D. ©2008
ypThe primary species of mold was: Aspergillus/Penicillium-Like, which is associated with moisture damageReccomendations:
• Finish the server room, currently open the mezzanine• Replace water damaged ceiling tiles• Clean/inspect HVAC
CommunicationsCommunications• Make Green Book
available upon request• Staff familiar with Env.
policyTraining materials
D.E. Meeroff, Ph.D. ©2008
Training materials• Placards, videos
Survey instrumentsSignage
• Green team meetings• Suggestion box
Less Comps/Discounted RoomsLess Comps/Discounted Rooms
• MOD reports:Air conditioning complaintsLeaky faucetsSh ttl b b ki d
D.E. Meeroff, Ph.D. ©2008
Shuttle bus breaking downOdorsPests and rodentsUnsightly waste issues
• Cardboard piles• Grease trap overflows
New Hotel PoliciesNew Hotel Policies• Training Manual and Implementation• Energy Star appliance replacement
program• Change setbacks for A/C units
D.E. Meeroff, Ph.D. ©2008
Change setbacks for A/C units• Wash only full loads in cold water• Employee incentive programs• Seize new opportunities• Anti-idling policy• Recycling
If We Could Start Over…If We Could Start Over…• Corporate Mandate in writing
Pledging staff time & funding• Include Green projects in annual budgeting
processDetailed cost analysis & official quotes
D.E. Meeroff, Ph.D. ©2008
y q• Establish a methodology for rapid approval
Green team must have autonomy to make decisionsIf the guest experience is affected, who decides?What is the incentive for line staff?
• Representation from each department in the Green Team
Assign alternates to increase attendance
If we could just get everyone on the same page from the beginning…
D.E. Meeroff, Ph.D. ©2008
11
Wish ListWish List1. Conduct more audits/assessments (ex. FPL,
MIL, IAQ, etc.)2. “Greenify” existing funded projects (ex.
chiller, break room renovation)3 C d t i t ff t i i
D.E. Meeroff, Ph.D. ©2008
3. Conduct on-going staff training4. Create “allergy-friendly” rooms5. Increase signage6. Switch to No-VOC paints and donate the old
paint to Habitat for Humanity7. Donate used/spent items to reduce space
requirements for storage
More WishesMore Wishes• “Green” water
treatment chemicals for cooling tower
• Ozone laundry system• Kitchen hood demand
control ventilation
• Dual flush toilets• Recycling bins by the
elevators• 1.0 gpm showerheads• Leak detection program
O / ti
D.E. Meeroff, Ph.D. ©2008
control ventilation• Programmable
thermostats• Air cooled ice machines• More sub-metering• Pre-rinse dishwasher
upgrade• Switch out heat pumps
to more energy efficient systems
• Occupancy/motion sensor lighting
• Weather-stripping and insulation
• Dispensers for toiletries/amenities
• More “Green” cleaners• Composting• Stop the bottled water!
I See More Green Hotels In Our FutureI See More Green Hotels In Our Future
D.E. Meeroff, Ph.D. ©2008
Contact UsContact Us
Email: [email protected]: (561) 297-2658
www.civil.fau.edu

![DANIEL E. MEEROFF, Ph.D. - Florida Atlantic University 2015_Meeroff.pdf · [21] Alex Duko, Ivan Gerasimovich, Aline Moraes, Roland Rodriguez “Dynamic Vision Engineering: New Boca](https://img.pdfslide.us/doc/110x75/5c3a25dc93f3c327601dc445/daniel-e-meeroff-phd-florida-atlantic-2015meeroffpdf-21-alex-duko.jpg)