Embed Size (px)
Citation preview
1
Medtronic Inc.
Smart Cody [email protected]
Porter Matt [email protected]
Watts Denton [email protected]
Serre Sophie [email protected]
2
Contents Executive Summary............................................................................................................................5
Business & Industry Analysis...........................................................................................................11
Company Overview ......................................................................................................................11
Industry Overview ........................................................................................................................12
The Five Forces Model .....................................................................................................................14
Rivalry Among Existing Firms ......................................................................................................14
Conclusion .................................................................................................................................18
Threat of new entrants ................................................................................................................19
Threat of new/substitute products ..............................................................................................23
Power of Buyers and Suppliers ....................................................................................................25
Value Chain Analysis ........................................................................................................................31
Medtronic Corporate Strategy Analysis ...........................................................................................34
Accounting Analysis .........................................................................................................................48
Key Accounting Policies ............................................................................................................49
Accounting Flexibility ................................................................................................................52
Actual Accounting Strategy ......................................................................................................54
Qualitative Quality of Disclosure ..............................................................................................56
Quantitative Quality of Disclosure ...........................................................................................57
Potential “Red Flags” ................................................................................................................72
Adjusting accounting distortions..............................................................................................74
Financial Analysis, Forecasting Financials and Cost of Capital Estimation ....................................86
Financial Analysis......................................................................................................................86
3
Liquidity Ratio Analysis.............................................................................................................87
Profitability Ratio Analysis ........................................................................................................98
Capital Structure Analysis.......................................................................................................107
Internal Growth Rate and Sustainable Growth Rate Analysis ..............................................113
Financial Statement Forecasting ............................................................................................116
Cost of Capital Estimation ......................................................................................................124
Analysis of Valuation ......................................................................................................................127
Method of Comparables .........................................................................................................127
Intrinsic Valuations .................................................................................................................132
Analysts’ Recommendation ....................................................................................................140
Appendix.........................................................................................................................................141
Sales Manipulation Diagnostic Ratios ....................................................................................141
Core Expense Manipulation Diagnostic Ratios ......................................................................142
Effect of R&D on Net income Table.......................................................................................142
Income Statements – Actual and Forecast............................................................................145
Balance Sheets – Actual and Forecast...................................................................................146
Statement of Cash Flows – Actual and Forecast...................................................................147
Common size Statements.......................................................................................................148
Balance Sheet after Adjustments...........................................................................................151
Income Statement after Adjustments ...................................................................................152
Regression Summaries ...........................................................................................................153
Beta Summary Table ..............................................................................................................157
Weighted Average Cost of Debt Table ..................................................................................158
Weighted Cost of Capital Table..............................................................................................159
Medtronic Ratios .....................................................................................................................160
4
Liquidity Analysis Tables.........................................................................................................161
Profitability Analysis Tables ....................................................................................................163
Capital Structure Analysis Tables...........................................................................................165
IGR & SGR Table ....................................................................................................................166
Credit Risk ...............................................................................................................................166
Free Cash Flow Models...........................................................................................................167
Residual Income Models.........................................................................................................168
Long Run ROE Residual Income Models ...............................................................................169
Abnormal Earnings Growth Models........................................................................................170
Discounted Dividend Model....................................................................................................171
Method of Comparables .........................................................................................................172
References ......................................................................................................................................174
5
Executive Summary
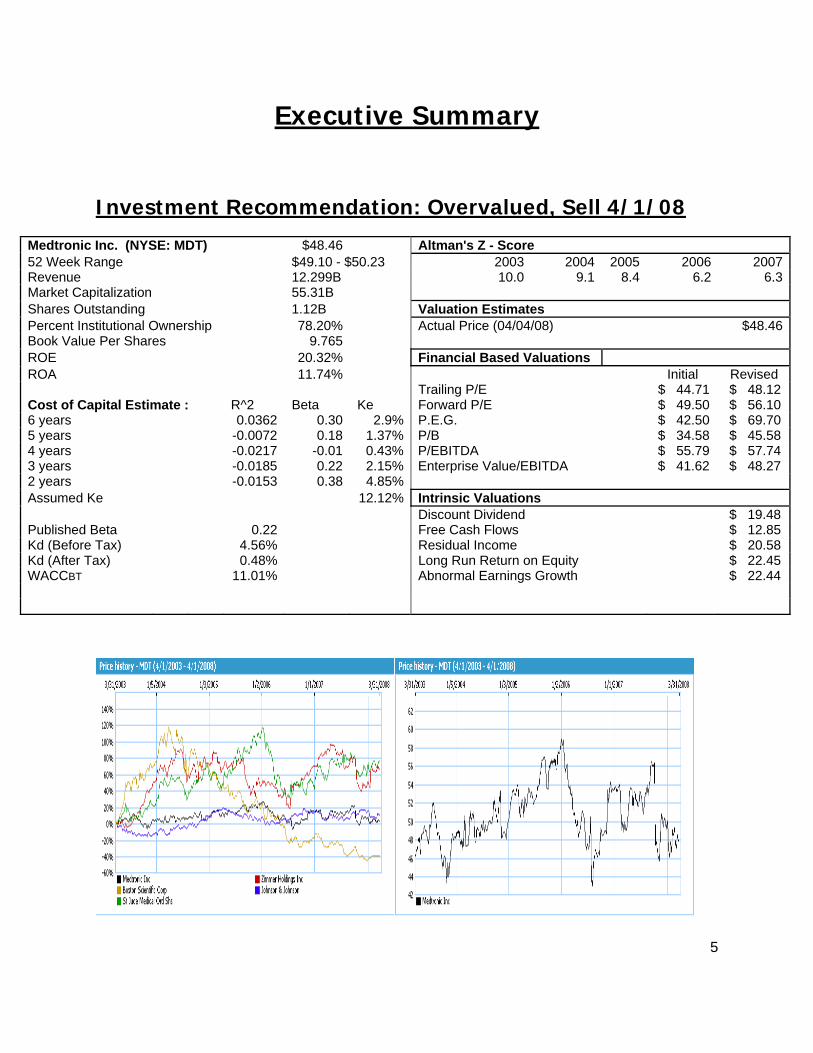
Investment Recommendation: Overvalued, Sell 4/1/08
Medtronic Inc. (NYSE: MDT) $48.46 Altman's Z - Score 52 Week Range $49.10 - $50.23 2003 2004 2005 2006 2007Revenue 12.299B 10.0 9.1 8.4 6.2 6.3Market Capitalization 55.31B Shares Outstanding 1.12B Valuation Estimates Percent Institutional Ownership 78.20% Actual Price (04/04/08) $48.46 Book Value Per Shares 9.765 ROE 20.32% Financial Based Valuations ROA 11.74% Initial Revised Trailing P/E $ 44.71 $ 48.12 Cost of Capital Estimate : R^2 Beta Ke Forward P/E $ 49.50 $ 56.10 6 years 0.0362 0.30 2.9% P.E.G. $ 42.50 $ 69.70 5 years -0.0072 0.18 1.37% P/B $ 34.58 $ 45.58 4 years -0.0217 -0.01 0.43% P/EBITDA $ 55.79 $ 57.74 3 years -0.0185 0.22 2.15% Enterprise Value/EBITDA $ 41.62 $ 48.27 2 years -0.0153 0.38 4.85% Assumed Ke 12.12% Intrinsic Valuations Discount Dividend $ 19.48 Published Beta 0.22 Free Cash Flows $ 12.85 Kd (Before Tax) 4.56% Residual Income $ 20.58 Kd (After Tax) 0.48% Long Run Return on Equity $ 22.45 WACCBT 11.01% Abnormal Earnings Growth $ 22.44
6
Industry Analysis
Medtronic was founded in 1949 by Earl Bakken and Palmer Hermundslie. It was
incorporated in 1957 in Minneapolis Minnesota. They provide medical devices and
instruments to more than 120 countries worldwide.
Medtronic is in the medical device industry, with Cardiac Rhythm Disease
Management (CRDM) make up approximately 40% of their net sales. With CRDM, they
also have an additional 7 areas they specialize in: Spinal & Navigation, Vascular,
Neurological, Diabetes, Cardiac Surgery, Ear, Nose, and Throat, and Physio-Control.
Medtronic’s primary competitors in this highly competitive industry are Boston
Scientific Corp, Johnson & Johnson, St. Jude Medical Inc, and Zimmer Holdings Inc.
The medical device industry is highly competitive with regards to technological
development. This industry is currently growing at 8-10% annually with approximately
6000 manufacturers who employ around 300,000 people (10-K). The industry is heavily
regulated by the government and firms are constantly using their time and money to
approve new products and then test those trial products. This industry has a high
degree of rivalry among existing firms, a low threat of new entrants, and a high threat
of substitute products.
The industry has moderate power over suppliers. The suppliers need the industry
just as much as the industry needs its suppliers. It also has relatively low bargaining
power over buyers. Buyers do have the choice, in some instances, to not use the
industry’s products.
Some of the key success factors of the industry is accounting of research and
development, diversification of the products segmentation, and superior product
quality. If companies in the industry can compete well on these three factors, then they
will significantly improve their profitability in the industry.
7
Accounting Analysis
The main purpose of financial reports is to credibly communicate economic
consequences of business activities. Since a lot of this data is reliant upon “people
made” numbers then there will most likely be discrepancies in the financial reports.
Corporations provide these financial statements to the public so investors will have
some evidence by which to make the best decision on whether or not to invest in a
company, and to what extent. However, many companies will only disclose what is
required by the SEC, which may not be enough to help investors make the best
decision. When valuing a company, it is important to be aware of these manipulations
and shortcomings in amount of discloser.
Medtronic is strong in some areas of disclosure, but weak in others. They seem
to have abnormal ways of recording both goodwill and IPR&D (in progress research &
development). There is no real pattern in the way it is recorded. It is up to the
managers to decide, year by year, on how it is to be recorded. However, Medtronic is
strong in disclosing warranty information. This is important industry wide because of
high expectations in detailed explanations of warranty information. Also, Medtronic has
a high quality of disclosure when discussing the affect of foreign currency to the
company. Medtronic does business all around the world, which means currency has a
large impact on business, for better or worse.
Medtronic compensates for any lack of information given by an extensive
management discussion. A few concerns about Medtronic’s financials that raise red
flags are the classification of operating leases and other long term contracted
obligations that do not seem appropriate.
8
Financial Analysis, Forecasts, and Cost of Capital Estimations
An analysis of Medtronic’s financial statements is needed to determine
how they stack up to their competitors and the industry. We look at several ratios to
determine liquidity, profitability, and the capital structure of Medtronic, and these ratios
are then used to forecast the financial statements.
Medtronic does quite well in the liquidity analysis compared with the
industry, which implies they can easily meet their short-term obligations. They also
perform quite well in the profitability analysis, exceeding the industry in operating
income and net profit margins. Medtronic seems to be pretty solid in the capital
structure analysis. They only have .44 cents of debt per dollar which, compared to the
industry, is significantly lower. However, their debt service margin is low indicating they
may have a problem in providing cash from cash flow from operations to pay its current
installment of long term debt.
The 10 year forecast for Medtronic shows that they will outperform the industry
with a 12.16% growth rate compared to the assumed industry average of 11.33%. The
industry average was weighted because larger companies like Johnson & Johnson had a
smaller growth rate compared to smaller firms like St. Jude with a larger growth rate.
Other notable assumptions in our forecast include profit margin declining by
approximately 7% by 2015, and return on equity declining by about 8%.
The beta of Medtronic we calculated to be .3022 which had the most explanatory
power with our regression models. Our cost of equity is 12.12% which was calculated
using the 2 year risk free rate, an assumed interest rate which was 80% of debt, and
our previous calculation of beta. Using the weighted average approach, we concluded
that the cost of debt was 4.59%. Our WACC before tax was roughly 11% and our after
tax WACC was 8.8%.
9
Valuations
The last step after an industry analysis, accounting analysis, and financial
analysis is valuing the company. We want to evaluate the company by using different
valuation methods.
First, we value the company by a method of comparables before and after
adjustments. We take eight different ratios and by comparing them with the industry,
are able to value the company. These ratios include the forward and trailing P/E ratio,
P/B, P.E.G, EV/E.B.I.T.D.A, P/FCF, P/E.B.I.T.D.A, and D/P. Several ratios, such as the
P/B and D/P gave us overestimated value for Medtronic which leads us to think that
investors will likely shy away from investing in an overvalued company. Ratios,
however, rely strictly on industry averages and thus may or may not be a relevant
method for valuing every company.
Next, we estimated Medtronic’s market value of equity using different models
based on theory.
The first model that we used was the dividend discount model. We discounted
back the dividends forecasted from 2008 to 2017 and added in a perpetuity discounted
from 2017 to infinity and arrived at an estimated share price today. The price we
derived from the model using a 10% growth rate and a 12.12% cost of equity gave us
an estimated share price of $19.48. The dividend discount model though has relatively
low explanatory power and thus should not be the primary valuation method.
The FCF model incorporates the difference between CFFO and CFFI. Using the
WACC, we discount this model back to arrive at a new valuation. The residual income
model helped us to determine how much Medtronic’s future residual income influences
its current share price. The RI model overvalues Medtronic by about $17 a share which
is consistent with other valuations.
10
The long run residual income perpetuity model is another method of valuing the
company. At the current estimated cost of equity of 12.12% and an average Return on
Equity of 25% it clearly shows that Medtronic is overvalued. There are instances that
Medtronic is undervalued on the sensitivity analysis but only at extreme, unlikely
instances. With a projected growth rate of 6%, we estimate Medtronic’s share value to
be $33.79, which compared with the current price of $48.46 is highly overvalued.
The final valuation method, the AEG model, compared what we earned to what
we should’ve earned. According to this model which is the second most reliable behind
the RI model, Medtronic is overvalued by approximately $26 dollars.
11
Business & Industry Analysis
Company Overview
Medtronic was founded in 1949 by Earl Bakken and Palmer Hermundslie. It was
incorporated in 1957 in Minneapolis Minnesota. Their main objective is providing
medical technology and instruments to physicians and patients around the world. They
have been able to expand their business from a small repair company, which serviced
medical equipment in hospitals, to being able to serve physicians and patients in more
than 120 countries worldwide.
They were the first to create a wearable cardiac pacemaker in 1957. From then
on they have focused on cardiac rhythm technology and other areas of Cardiac Rhythm
Disease Management. Along with CRDM, they also have an additional 7 areas they
specialize in: Spinal & Navigation, Vascular, Neurological, Diabetes, Cardiac Surgery,
Ear, Nose, and Throat, and Physio-Control. Their mission statement, written more than
40 years ago, explains their broad organizational goal, “To contribute to human welfare
by application of biomedical engineering in the research, design, manufacture and sale
of products that alleviate pain, restore health, and extend life’” (Medtronic 10-k).
Medtronic currently has a market cap of 54.10 billion dollars. Over the last five
years they have been able to nearly double their net sales from $6.4 billion in 2002 to
$12.3 billion in 2007. Their most emphasized sector, CRDM, contributes to 40% of their
net sales. Medtronic’s primary competitors are Boston Scientific Corp, Johnson &
Johnson, St. Jude Medical Inc, and Zimmer Holdings Inc. This will transition our focus
to the medical technology and equipment industry as a whole.
12
Industry Overview
Medtronic is a part of the Medical Appliances & Equipment industry. With
increasing technological advances, the medical device industry is highly competitive
with regards to technological development. High tech industries are very competitive in
nature. A stagnant organization will quickly lose market share if its products become
obsolete. The medical device industry is currently growing at 8-10% annually with
approximately 6000 manufacturers who employ around 300,000 people (10-K). The
industry is heavily regulated by the government and firms are constantly using their
time and money to approve new products and then test those trial products.
According to the International Trade Administration (ITA) “Issues related to
reimbursement rates for medical devices are a primary concerns for U.S. medical device
companies, as an adequate reimbursement rate usually determines whether a product
will be viable in a given market.” Demand for products must be quite high. Unlike other
industries where the price of a product must cover simple production costs and
overhead, high tech sectors must earn revenue margins high enough to cover the cost
of research and development. This is not simply the R & D used to develop the product
being sold. Expenses related to continuing development and testing of potential
products must be covered. The fact that technological feasibility does not always
translate into commercial viability increases the volatility of the market. This translates
into high market risk for equity investors which must be mitigated by high risk
premiums.
A demographic factor affecting this industry is the rising population of senior
citizens. The census bureau, who periodically publishes statistics showing the U.S.
population by their respective age bracket, estimates that the percentage of people 65
and older will increase from 12.4% in 2000 to 20.7% by 2050. There were
approximately 35 million Americans in 2000 that were over the age of 65. They
estimate that by 2020 that number will rise to 54 million people and to 86 million by
13
2050. (www.ita.doc.gov) Also, people are living longer today than they did 30 or 40
years ago. This will cause changes in the medical device industry. Companies will have
to stay ahead of the game, technologically speaking, or they will be left behind by other
more innovative companies.
Not only does this industry have to contend with government regulations and
technological advances, the success of their products rely on their relationship with
physicians. Physicians will continue to use what works. Corporate image is a key to
developing trust with buyers. The problem is if one company has made a technological
breakthrough, but has a negative image with consumers, they will have trouble selling
that product simply because physicians don’t trust them and are hesitant to switch.
14
The Five Forces Model
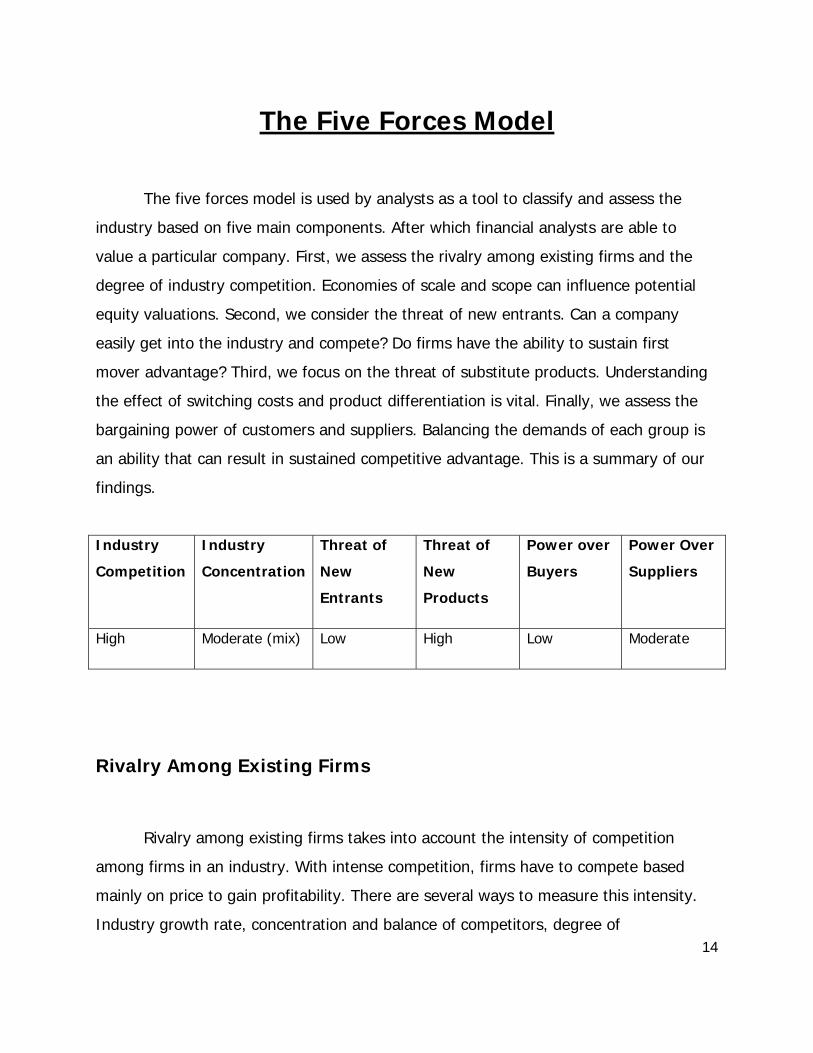
The five forces model is used by analysts as a tool to classify and assess the
industry based on five main components. After which financial analysts are able to
value a particular company. First, we assess the rivalry among existing firms and the
degree of industry competition. Economies of scale and scope can influence potential
equity valuations. Second, we consider the threat of new entrants. Can a company
easily get into the industry and compete? Do firms have the ability to sustain first
mover advantage? Third, we focus on the threat of substitute products. Understanding
the effect of switching costs and product differentiation is vital. Finally, we assess the
bargaining power of customers and suppliers. Balancing the demands of each group is
an ability that can result in sustained competitive advantage. This is a summary of our
findings.
Industry
Competition
Industry
Concentration
Threat of
New
Entrants
Threat of
New
Products
Power over
Buyers
Power Over
Suppliers
High Moderate (mix) Low High Low Moderate
Rivalry Among Existing Firms
Rivalry among existing firms takes into account the intensity of competition
among firms in an industry. With intense competition, firms have to compete based
mainly on price to gain profitability. There are several ways to measure this intensity.
Industry growth rate, concentration and balance of competitors, degree of
15
differentiation and switching costs, economies of scale, and the excess capacity and exit
barriers all play a major factor in determining the level of competition.
Industry Growth Rate
Industry growth rate is one determinant of rivalry in an industry. If an industry is
expanding rapidly, then firms do not need to compete with one another on price, in
most cases. However, if there is hardly any growth, then firms will have to compete
solely on price. From some perspectives, the industry is growing. This is due to the
continued advancement of technology in the field. With that in mind, if firms cannot
continue to use this technology to their advantage, creating products that bring in
sufficient revenue streams, then they will fail to compete.
The Wall Street Journal has touched on that subject. Boston Scientific recently
announced that they foresee revenue at 8.2 billion for 2008, which would put them at
around a 3-5% growth rate. WSJ said “Company officials, speaking on a conference call
following the release of fourth quarter results late Monday, also set sales targets for the
company’s top heart devices in the first quarter. The outlook includes an expectation
that Boston Scientific won’t give up much ground in the U.S. drug coated stent market
this quarter to new arrival Medtronic Inc… The arrival of Medtronic’s endeavor device
injects fresh competition into what had been a two-company market with Boston
Scientific and Johnson & Johnson.” The industry is growing, but firms are still required
to compete on price to gain market share. The effect of market concentration will be
assessed here after.
16
Concentration and Balance of Competitors
Typically the more firms you have in an industry the higher the degree of
competition. There are over 6000 manufactures of medical devices. However, the
medical device industry’s market share is completely unbalanced. Medtronic competes
with a huge number of individual companies, but there are only a few which compete
directly against its major product lines. Nevertheless, since the medical device industry
is growing so fast technologically, firms must continue to offer new and improved
products or they will not last. “In the current environment of managed care,
consolidation among healthcare providers, increased competition, and declining
reimbursement rates, we have been increasingly required to compete on the basis of
price. In order to compete effectively, we must continue to create, invest in, or acquire
advanced technology, incorporate this technology into our proprietary products…”
(Medtronic’s 10-K)
The medical device industry must also contend with alternative medical
therapies. Medtronic’s 10-K addresses this directly, “We face competition from providers
of alternative medical therapies such as pharmaceutical companies.” (Medtronic’s 10-K)
I would describe the concentration as mixed. Only a few major companies compete
directly against Medtronic’s major product lines, emphasizing technological growth.
While competition from a large number of alternative products has increased the need
to keep prices low. This all adds up to a moderate level of concentration.
Degree of Differentiation and Switching Costs
Differentiation would allow companies in an industry to set their product higher
than others in that industry, with respect to price. If this were possible, then relative
switching costs would be high from a customer’s perspective. Switching costs for a firm
17
deal with the feasibility of alternative asset use. This is a complicated question for the
medical supply and technology industry. Firms in the industry are heavily invested in
patents and R & D. For most of these companies, intangible assets make up a
considerable portion of their balance sheet. In some industries, the major factor
influencing switching costs is whether or not the firm can still utilize its capital
expenditures (manufacturing equipment, production lines, and factories). If it can, then
switching costs are low. In the medical equipment industry, the critical factor is whether
their patents and research can be used for alternative purposes. For this reason, we
feel that switching costs for a firm wanting to completely change its production lines
would be very high since patents and research tend to be relatively specific. This raises
the degree of competition industry wide.
18
Excess Capacity
Excess capacity is when supply exceeds demand in an industry and firms must
cut their prices to fill this capacity. In the medical device industry, there is an ever
increasing demand for medical devices because of the increasing population of senior
citizens. So, excess capacity is not a problem in the medical device industry.
Exit Barriers
Exit barriers are the cost to a particular firm when they feel they must leave an
industry. Since the medical device industry is so heavily regulated by the government,
to leave this industry would be costly. The reasons are similar to those causing high
switching costs. Since the industry relies so much on advancing technology and
investing in R & D, the exit barriers are high for the medical device industry.
Conclusion
The rivalry among existing firms in the medical device industry is intense.
Established firms must continue to develop technology and keep costs low. Firms must
also compete with alternative pharmaceutical companies that are not necessarily in the
industry. Another factor is that exit barriers are high which increases the level of
competition. So as the industry continues to expand, we can see that the level of
competition will as well. This is a highly competitive industry.
19
Threat of new entrants
The threat of new entrants in the medical appliance & equipment industry is
dependent upon a few main factors: legal barriers, economies of scale, first mover
advantage, and, to some extent, a form of brand image.
Legal barriers
In the medical industry there is high degree of government regulation. The
medical appliance & equipment sector is no different. There has been increasing
control over the years, which in some ways limits the threat of new entrants. To
commercially distribute a new medical device in the U.S. is to do so through only one of
two ways: 1) 510(K) process says that the new product is “substantially equivalent” to
an already existing device. In this way it might be helpful to new entrants, citing the
“copy-cat” approach. 2) PMA requires a firm to independently show that a new device
is both safe and effective. In this process, it is much harder for a new firm to emerge
due to differentiation, as it requires much more time, money, and research.
In this industry, there is also intense patent litigation and product liability claims.
These combined make it difficult for an emerging firm to compete. Either the idea has
already been taken, in which case you must pay royalties, or one major lawsuit can
wipe out a small companies hopes.
20
Economies of scale
Hospitals, Doctors, and to some extent patients like to stay with what works.
This self-evident fact is a major disadvantage to new entries into the industry. When a
firm is large enough that it covers so many different areas in the industry (such as
Johnston & Johnston, Medtronic, and St. Jude) it is difficult for a firm to get a foot in
the door. With large firms investing so much into research and development, the
possibility of a new entrant keeping up with future developments as well as day-to-day
operations is remote.
Along with government regulations, even the large firms are forced more and
more to compete based on price. Smaller, less experienced, and less known entrants
will have a very difficult time competing in this fashion. A small firm could theoretically
enter the market with a cheaply made product and at once have a lawsuit, or not even
get pass FDA clinical trials. This also poses a hurdle for new entrants.
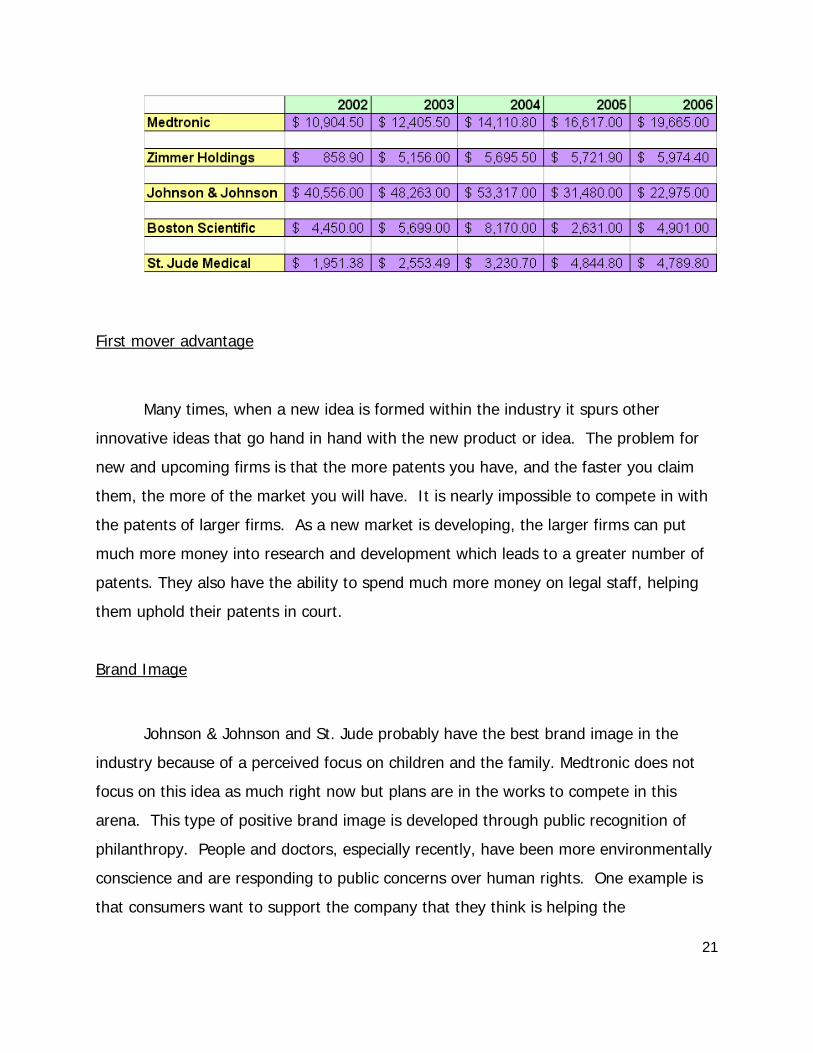
The chart below shows the five major medical device firms in this industry and
their assets for the last 5 years represented in millions of dollars. A lot of times the size
of a firm will determine how much power they have in particular industry. However,
even though there are several large manufacturers in the medical device industry, there
are also several small manufacturers who offer a limited selection of products. We do
feel that the potential for economies of scale does exist because large firms, heavily
invested in R & D, can spread their costs out by selling more products. (Chart on next
page.)
21
First mover advantage
Many times, when a new idea is formed within the industry it spurs other
innovative ideas that go hand in hand with the new product or idea. The problem for
new and upcoming firms is that the more patents you have, and the faster you claim
them, the more of the market you will have. It is nearly impossible to compete in with
the patents of larger firms. As a new market is developing, the larger firms can put
much more money into research and development which leads to a greater number of
patents. They also have the ability to spend much more money on legal staff, helping
them uphold their patents in court.
Brand Image
Johnson & Johnson and St. Jude probably have the best brand image in the
industry because of a perceived focus on children and the family. Medtronic does not
focus on this idea as much right now but plans are in the works to compete in this
arena. This type of positive brand image is developed through public recognition of
philanthropy. People and doctors, especially recently, have been more environmentally
conscience and are responding to public concerns over human rights. One example is
that consumers want to support the company that they think is helping the

22
underprivileged children or the undervalued individuals of society. In some way, this
makes consumers and investors feel like they are helping vicariously.
In cases where there is not much difference in the products, positive brand
image does have an effect. New Firms entering an industry do not have the funds to
perform massive altruistic acts. To begin developing a positive brand image they must
increase public philanthropy. The problem is that at first they must gain equity financing
to do this (it might be difficult to take out a loan with the intent to give it all to charity).
As stated before, investors want to invest with companies that have a history of
philanthropy. So the company can’t get equity financing without contributing to the
public good, and they can’t contribute to the public good without equity financing. This
is a large barrier to entry in some situations.
Conclusion
It would be difficult for a company to enter the market in the short run.
However, given time to create innovative patents, follow government standards, and
manage effectively, there is some risk of new entrants into the market. Still we feel this
risk is low.
23
Threat of new/substitute products
The medical appliance & equipment industry could have one of the greatest
threats of new products out of all industries. This threat of new products is because of
the extensive technicality of the equipment (to allow many different forms of new
science to enter the market) and the sheer possibilities of new products taking over a
function previously had by another product (substitution).
Technicality of Equipment
Few realize the extreme complexity of medical equipment. To compete in this
industry a company must not only make equipment that will pass FDA codes and
provide efficient treatment, but also do it cost effectively. One example of this is
reported in Wall Street Journal. The FDA on February 1, 2008 approved Medtronic to
sell its Endeavor drug coated stent. “Coronary stents are tiny metal devices used to
prop open heart arteries, and coated stents such as Endeavor use medication to combat
re-narrowing, which can be an issue with older bare-metal devices. About one million
Americans get stents in angioplasty procedures each year”. 1 So, even though stents
are not a new device, the coated stents are an emerging product in the market
(pending inspections with positive results for 5 years).
1 http://online.wsj.com/article/SB120189207528835921.html
24
The high technicality of products is not a true threat to the industry. In a way, it
is the backbone of the industry. The goal of every firm is to keep bringing out new
products. Individual firms develop technology so fast that they routinely make their own
products obsolete. New products become a threat when the industry slows down on
technological development. Still, in general, the threat of new products is high.
Range of Possibilities
There are several ways to treat most diseases or ailments. Few make it
and even fewer can sustain their place in the market. Still this means new products
every year by both large and small companies. Take for instance the disease of
depression. About 4 million people in the United States suffer from severe depression.
Some have tried many different cures that have failed. However, St. Jude, a direct
competitor or Medtronic, has started and been approved, as of February 7, 2008, to
begin testing a stimulus pacemaker type product for this very broad potential market.
This new device will of course be patented and secured for St. Jude’s continued
research and development. One side-note is that in the broad studies leading up to this
discovery, Medtronic’s deep brain stimulation technology was used.2 However, there
will be no shortage of competition from the other major medical appliance companies to
find an alternative, which in turns leads to new products.
2 http://online.wsj.com/article/BT-CO-20080207-707404.html?mod=wsjcrmain
25
Conclusion
The threat of new products is very real in this industry. It is actually one of the
few things the industry can be sure of. Firms will continue creating new products, and
the industry must react appropriately.
Power of Buyers and Suppliers
The strategic relationship between suppliers and buyers in the medical
equipment and appliance industry has become increasingly complex. As the industry
has boomed to a 163 billion dollar sector of healthcare market cap, the competition in
areas such as price, technological progress, and consumer safety has followed suit.
Power of Suppliers
Supplier power over an industry is relative to the degree that firms can bargain
with suppliers. Price sensitivity is also important. In the medical equipment and supply
sector, suppliers have very differentiated products. This creates a rather strange
equilibrium. Suppliers must sell their products to the medical supply industry, since they
have little or no use for other industries. The medical supply industry has a limited
number of suppliers that make the products it needs so they must remain price
sensitive to the demands of suppliers. Basically, the supplier relation in the medical
equipment industry is a product of a mutualistic dependency. The suppliers need the
industry and the industry has no alternative to its suppliers.
Medtronic is a company with only a few major suppliers, Abbott Labs being the
26
largest. This puts the company in a unique situation where maintaining market share,
keeping good supplier relations, and a good cash flow are pivotal. All of these factors
contribute to the industry’s, and thus Medtronic’s, power over suppliers. We will first
look at the power of suppliers from a broad industry wide perspective.
Analysis of the Supplier Relationship (Industry perspective)
1. Power over suppliers is derived from a suppliers need to do business with the
industry. Industries with large markets give suppliers the most business. This
kind of industry dominance allows firms to negotiate prices in order to keep costs
down. In a price sensitive industry, lower costs allow a firm to stay competitive
without sacrificing profit margin.
2. Good supply chain relations are also a critical factor. A supplier must trust the
industry to pay promptly and continue to give the supplier business. If conflict
arises between the supplier and the industry, the supplier could choose to focus
its production on other orders or, if arguments persisted, abandon the
relationship with the industry entirely. If the latter option is viable, the cost of
changing production must be lower than the perceived benefit suppliers will
receive from abandoning the industry.
3. Maintaining a strong financial outlook is one of the most important factors
affecting the firm/supplier relationship. If an industry loses the ability to generate
revenue it must generate funds, either through debt or equity financing, to
continue to pay suppliers. If the sales stagnation continues, individual firms
might lose the ability to pay its increasing liabilities which will affect its credit
rating and its ability to purchase supplies on account. When this happens the
power of the supplier has increased dramatically and the industry loses its ability
to negotiate over price. Keeping a strong A/R turnover, manageable current
27
liabilities, and a low write off percentage in doubtful accounts is very important.
Conclusion
The industry has moderate power over suppliers. The suppliers need the industry
just as much as the industry needs its suppliers. An equilibrium is in place that does not
allow one side to make unrealistic demands of the other. But, both sides have some
bargaining power.
Power of Buyers
The medical supply industry provides medical equipment to a diverse group of
consumers. For Medtronic, not 1 customer accounts for more than 10% of its total
revenue. The industries primary customers are hospitals, clinics, third party healthcare
providers/insurance, and governmental healthcare programs including Medicare.
As healthcare has become a more consumer conscious industry, due to the
increase in pharmaceutical advertising and the general effects of the shaky health care
sector, the industry must understand how to maintain a strategic hold on buyers. This
includes understanding the disconnect between the desires of the customers that
purchase their products (physicians), concentrating on aspects like price and
distribution, and the customers that use their products (patients), whose primary
concern is safety and effectiveness. Even though the check might come from the
insurance company, the industry must understand that continued demand comes from
the people who use and work with their products. Power over buyers is derived from
28
the buyer’s need for an industry’s products. If a client needs and wants the product of a
firm, the ability to set prices increases. As before, an analysis of the industry wide buyer
relation will be discussed.
Analysis of the Buyer Relationship (Industry perspective)
To keep demand high and maintain power over buyers, the industry sector must
spread out into new fields. Emerging healthcare industries have low barriers to entry
and are a cost effective way to recruit new buyers in new sectors. This also helps
diversify their holdings by allocating a portion of its assets into less risky, and therefore
less legally liable, sectors. Malpractice suits are increasing, and focusing on high risk
patients in need of cardiac and vascular treatment, as it currently does, could endanger
the industries long term solvency. Diversity in product lines helps maintain power over
buyers.
Increasing focus on already developed products is important for success in both
the buyer and supplier markets. Large product lines such as CRDM, vascular
technology, and spinal navigation account for the bulk of the medical equipment and
supply industry’s revenue. They already have a strong hold in this area and customers
have come to rely on their products. Many of these products, such as internal cardiac
defibrillators, have no pharmaceutical substitute. This is a major strength for the
industry. The industry must continue to be a dominant in these areas to have power
over customers. In general, there are still alternatives to most products. The success of
some product lines has, as of yet, not offset the power buyers have to use alternatives.
The industry must also recruit new buyers in global markets. Nearly every
industry is feeling the effects of globalization. The healthcare equipment sector is no
different. Gaining access to companies and patients in emerging economies as well as
untapped industrialized nations is critical. It would be a huge mistake not to take
29
advantage of these new markets. Expanding geographic scope could give firms a first
mover advantage, allowing them to make loyal customers, set industry standards, and
control lines of distribution. This results in immense power over buyers.
Continuing research and development is also a key success factor. Buyers want
the latest technology, especially in the competitive healthcare industry. The medical
equipment industry cannot afford to lose customers because of a lack of innovation.
Other areas of the healthcare market like pharmaceuticals and homeopathic remedies
can pull away consumers. Technological progress must be coupled with a strong legal
presence. The ability to manage intellectual property and uphold patents, both
internally created and externally acquired, is just as critical as the ability to invent new
products. New technologies are often very expensive. Patients still have the option of
using more cost effective traditional solutions. The industry has not capitalized on their
potential power, as of yet.
The industry should also focus on its ability to effectively deal with purchase
orders. Buyers want an industry that is efficient. They must be able to process orders
quickly and accurately. Aspects such as shipping and distribution are also a factor.
Customers will take their business elsewhere if they do not trust the industry wide
infrastructure and its ability to get them the products they want when they want them.
Communication between management and order takers must be effective or firms run
the risk of losing valuable members of its clientele. This is definitely a hindrance to the
medical equipment and supply industry. Products are often customized and surgery is
necessary. This takes time. If patients want treatment immediately they have the
option of trying pharmaceuticals before opting for a medical appliance.
Possibly the most important aspect of developing customer power is safety.
When people rely on your products in a life threatening situation, nearly perfect product
quality is essential. This relates to nearly every area of the medical equipment and
30
supply industry. Without safe products, because of lacking quality control or poor
quality standards, consumers retaliate. Industry image is tarnished, customers leave,
and you open yourself up to legal consequences. When an industry is forced to defend
its image in the media spotlight it loses nearly all power over the consumer. The recent
fallout in the toy industry, from unsafe manufacturing processes involving lead, is a
great example of how an entire industry can be damaged by consumer safety concerns.
When this happens, the industry is left begging customers to continue using its
products. Some safety concerns have been raised (as explained later). This is a
particular area in which bargaining power has been reduced.
Conclusion
Because of the nature of the industry, firms have relatively low bargaining power
over buyers. Buyers have options and can choose, in some instances, not to use the
industry’s products. Of course there are some patients that have no other options
(there is not a pill that can replicate a valve replacement), but for the vast majority,
substitution is possible. This increases competition over price sensitive consumers that
still have options. The power over buyers is relatively low.
31
Value Chain Analysis
Competitive Strategy Analysis
The medical appliances and equipment industry has a high degree of rivalry
among existing firms, a low threat of new entrants, and a high threat of substitute
products. Because of the high threat of substitutes, there is low bargaining power over
customers. The mutualistic dependency between the industry and its suppliers results in
moderate bargaining power for both sides. The industry is characterized by a moderate
mix of industry concentration (with direct competitors being highly concentrated while
indirect competitors, focusing on substitute products, have low concentration). The
medical appliances and equipment industry is a competitive market that relies on
innovation, specialization (in some forms), diversification (in other forms), and high
quality standards. In order to remain profitable, the firm takes into great consideration
all investments in research & development, the diversification of product segments,
quality standards, and the complexity of the firm and its corporate social responsibility.
Research & Development
The medical device industry funnels a tremendous amount of money into
research and development to fund innovation, which will have a significant impact on
medical equipment and supply markets. The medical appliances and equipment industry
is subject to rapid technological advancements. So by investing in R&D, companies can
become more competitive in the market. Constant improvement of products and
introduction of new products is necessary to maintain market leadership. It gives a
32
comparative advantage. Research and Development can also help to meet new or
unsatisfied patient needs and can reduce long term care costs and the length of
hospital stays by improving existing technologies.
Diversification in Product Segments
Diversification decreases the degree of dependence on one specific segment and
increases the number of patients reached. In other words, a company with diversified
segments will rely less on one of them, leading to greater flexibility. Flexibility within the
firm is all the more necessary in the medical market because of increasing technological
advances and new regulations. Flexibility allows the company to jump on new
opportunities of a different nature. The more segments a company develops, the more
opportunities it creates, and the company can easily switch its orientation to specialize
in a more promising field of research. This has the effect of mitigation the high industry
switching costs, since the company already has its ‘foot in the door’.
Increasing product varieties also enhances the brand position and allows a broad
market presence to be forged and growth to be allocated among a more diversified mix
of products. Consequently, brand name is more present and better known by
professionals, and the level of patient trust increases.
Quality Standards and Brand Image
High quality standards provide another comparative advantage against
competitors. A high quality product helps consumers recognize the product's brand and
to prefer it over alternatives. The brand image becomes a choice criterion. Professionals
and patients demand higher quality for products using brand new technologies.
33
Consumers are becoming increasingly aware that FDA approval does not
necessarily implicate safety. From a company’s perspective, it is impractical to launch
an imperfect product (even if it meets regulations and is already authorized). Brand
image can be affected by quality standards and health concerns (like reports of life
threatening chemical substances). Any of which can lead to a sales decrease.
Comparative advantages, like brand image, are seriously at stake in the medical
industry because life relies on their products. A few disappointments can kill a brand
name, resulting in public perception as an inferior good.
Social Complexity and Corporate Social Responsibility
Another strategy giving a comparative advantage is the development of a socially
responsible firm. Corporate Social Responsibility is the continuing commitment by a
business to behave ethically and contribute to economic development while accounting
for the total impact of their operations on the social and natural environment. It is
difficult to reproduce and therefore it represents a unique advantage, even though it
has substitutes like another strong complex social system in a different firm.
In the medical industry, the care for the environment is as important as the
respect for human beings. A social network is all the more significant because patients
want to know their doctors and doctors want to know the products and technologies
they use. Knowledge and reliability, respect and trust, bring out close relationships
between people in the world of medicine. A socially responsible firm may find it easier
to obtain equity financing from philanthropic investors.
34
Medtronic Corporate Strategy Analysis
To understand how a firm operates, certain key policies and strategies must be
recognized and evaluated. Medtronic’s policies and performance in areas such as
research and development, diversification, financial structure (growth, market cap,
expenses, etc.), product quality, customer/supplier satisfaction, and social responsibility
will all be addressed.
Research & Development/ Intellectual Property
In the medical appliance and equipment industry, research and development
funds are vital for continued growth. Medtronic, Zimmer Holdings Inc., Saint Jude
Medical, Edwards Lifesciences Corp., Boston Scientific Corp and their other more or less
direct competitors know that. All of them invest a substantial percentage of their total
revenue in the research and development. Compared to its direct competitors,
Medtronic barely invests 10% of its total revenue for 2007. For being the biggest
company in this segment, that can be confusing. However when we look at the amount
invested in R&D ($1,239,000), we realize that they can afford ten times more than its
competitors. It provides Medtronic with a great advantage, but we should not forget
that Boston Scientific Corp is developing a similar advantage.
Nevertheless, the venture budget (20% of the R&D budget) allows Medtronic to
cooperate with the world's leading physicians and scientists, which most of its
competitors cannot afford. Medtronic also allocates a portion of the R&D budget to an
35
international knowledge exchange forum, the Bakken Society. It encourages creativity,
dialog and innovation by promoting the exchange of research data and technical
information across the industry. The process is not used to this extent by its
competitors in the medical device industry. This gives Medtronic a comparative
advantage.
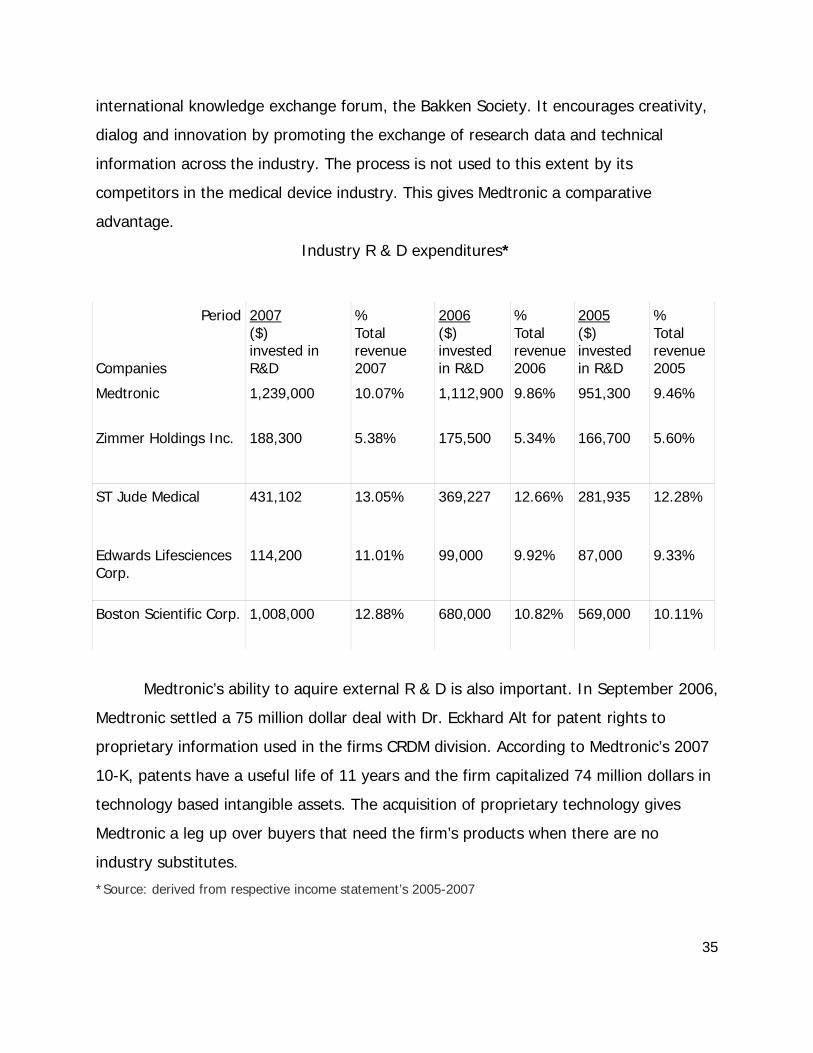
Industry R & D expenditures*
Medtronic’s ability to aquire external R & D is also important. In September 2006,
Medtronic settled a 75 million dollar deal with Dr. Eckhard Alt for patent rights to
proprietary information used in the firms CRDM division. According to Medtronic’s 2007
10-K, patents have a useful life of 11 years and the firm capitalized 74 million dollars in
technology based intangible assets. The acquisition of proprietary technology gives
Medtronic a leg up over buyers that need the firm’s products when there are no
industry substitutes.
*Source: derived from respective income statement’s 2005-2007
Period Companies
2007 ($) invested in R&D
% Total revenue 2007
2006 ($) invested in R&D
% Total revenue 2006
2005 ($) invested in R&D
% Total revenue 2005
Medtronic 1,239,000 10.07% 1,112,900 9.86% 951,300 9.46%
Zimmer Holdings Inc. 188,300
5.38% 175,500
5.34% 166,700
5.60%
ST Jude Medical 431,102
13.05% 369,227
12.66% 281,935
12.28%
Edwards Lifesciences Corp.
114,200
11.01% 99,000
9.92% 87,000
9.33%
Boston Scientific Corp. 1,008,000 12.88% 680,000 10.82% 569,000 10.11%
36
Acquiring patents is only beneficial if a firm can uphold these patents in court.
In October 1997, Cordis, a subsidiary of Johnson & Johnson, filed a suit against
Medtronic alleging that the company infringed on certain intellectual property rights by
producing certain vascular modular stents. The two companies have been fighting it out
as Medtronic has continued to appeal lower court’s decisions. It now seems that the
legal battle may be coming to a halt. In ‘Court Affirms Patent Ruling Favoring Johnson
& Johnson’ The Wall Street Journal states, “A U.S. appeals court affirmed earlier
judgments from a long running case that said Medtronic Inc. and Boston Scientific Corp.
infringed patents for heart stents held by Johnson & Johnson’s Cordis unit… The verdict
against Medtronic was for 271 million. (January 8, 2008)”. Medtronic is still trying to
appeal and has not listed the contingency on its books.
If Medtronic cannot defend the technology it uses in court, the firm will not be
able to capitalize on its intangibles. Falling behind technologically in a rapidly developing
industry will cause Medtronic to lose price sensitive customers to competitors with more
cost effective products.
Diversification in Products and Markets
Before mentioning diversification, it is relevant to discuss Medtronic’s success in
its primary product lines and markets. Continued growth in already dominant product
lines is important. Medtronic’s CRDM division is by far its largest and most profitable
branch. The firm has done a good job increasing sales in CRDM and its other product
lines as of late. From 2002 to 2007, Medtronic has seen its net sales nearly double from
6.411 billion to 12.299 billion. Sales in its vascular division have grown by 28% last
year, but growth in other product lines has lagged.
37
Medtronic has seen a small drop in revenue from implanted cardiac defibrillators
and medicated stents. Some analysts suggest this could be because of changing market
conditions. Wall Street Journal blogger Shirley Wang writes, “Concerns in recent years
about drug-coated stents causing blood clots in rare cases have led to a drastic decline
in use of the devices and contributed to layoffs at Boston Scientific and Johnson &
Johnson… Use of drug-eluting stents hit a trough of 62% in September 2007 and
stayed around there for the rest of 2007, perhaps signaling that there won’t be a
further decline. Drug-coated stents were used in 88% of procedures as recently as mid-
2006. (February 4, 2008)”.
If doctors and patients are becoming resistant to the use of medicated stents,
contributing to a loss in demand and power over buyers, Medtronic could end up in the
same situation as its competitors. Luckily the FDA has just approved a new Medtronic
stent, the first since 2004, which could signal a coming rise in product usage in the
healthcare industry. Medtronic needs to remain dominant in these developed product
lines to keep the upper hand in price negotiations with customers.
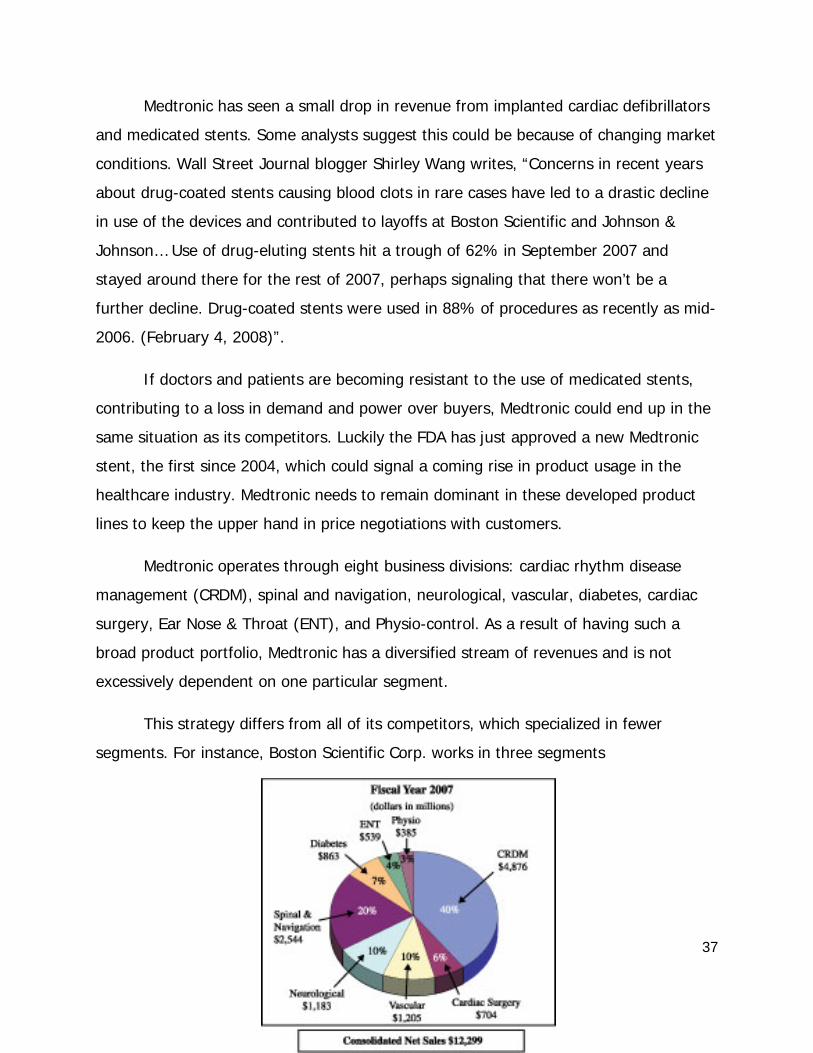
Medtronic operates through eight business divisions: cardiac rhythm disease
management (CRDM), spinal and navigation, neurological, vascular, diabetes, cardiac
surgery, Ear Nose & Throat (ENT), and Physio-control. As a result of having such a
broad product portfolio, Medtronic has a diversified stream of revenues and is not
excessively dependent on one particular segment.
This strategy differs from all of its competitors, which specialized in fewer
segments. For instance, Boston Scientific Corp. works in three segments
38
(Cardiovascular, Endosurgery and Neuromodulation), and Zimmer Holdings Inc offers
devices in five divisions (orthopaedic implants, dental implants, spinal implants, trauma
products, and related orthopaedic surgical products) If we want to find a competitor as
diversified as Medtronic in the medical device industry, we have to look at Johnson &
Johnson. Medical devices represent one of the three segments where it specializes,
whereas it is the whole activity of Medtronic. Like Johnson & Johnson, Medtronic with
its broad product portfolio not only enhances its reach and its market share, but also
generates a diverse revenue stream. This limits Medtronic’s exposure to the risks
associated with a particular segment.
For the fiscal year 2007, the cardiac rhythm disease management contributed
39.6%, spinal and navigation (20.7%), vascular (9.8%), neurological (9.6%), diabetes
(7%), cardiac surgery (5.7%), ENT (4.4%) and physiocontrol (3.1%) of total revenues
to the company. (See above chart)
Even though Medtronic is relatively diversified, with respect to product lines, it
continues to attempt to reach customers with different needs. Medtronic has a history
of expanding the scope of its product lines. Some new technologies have been pursued
with the help of suppliers; reinforcing the notion that power over suppliers turns into
power over buyers. In 2005, Medtronic collaborated with Zimmer Holdings, a large
supplier, to expand its product line. A 05 Zimmer press release elaborates; “…The first
electromagnetic Computer-Assisted Solutions knee replacement procedure was
successfully performed on February 14, 2005, at The Methodist Hospital in Houston,
Texas… Zimmer and Medtronic Navigation, who have an exclusive partnership for MIS
surgical navigation solutions, developed the proprietary system, which involves
computer-assisted equipment, software and Zimmer instruments. (Warsaw, IN)”.
Medtronic has also branched out more recently, but it has been followed by
industry competition. “Within a few years, Americans may have a new tool to fight back
against obesity; electricity. Not from the power grid, but from implanted pacemaker-like
39
devices that influence a key nerve linked to food-related functions, including feelings of
hunger and fullness… Some medical-technology companies have been chasing the
implanted electrical-device angle to help fill the void. The companies include Medtronic
Inc., St. Jude Medical Inc., and health-care giant Johnson & Johnson. (Jon Kamp:
January 30, 2008, WSJ)” This could prove to be a step in the right direction for
Medtronic, but the firm will have to act fast to capitalize before the competition. Doing
so would open up a new market in the U.S. where currently around one third of
Americans over 30 are considered obese; increasing its customer base and power over
buyers.
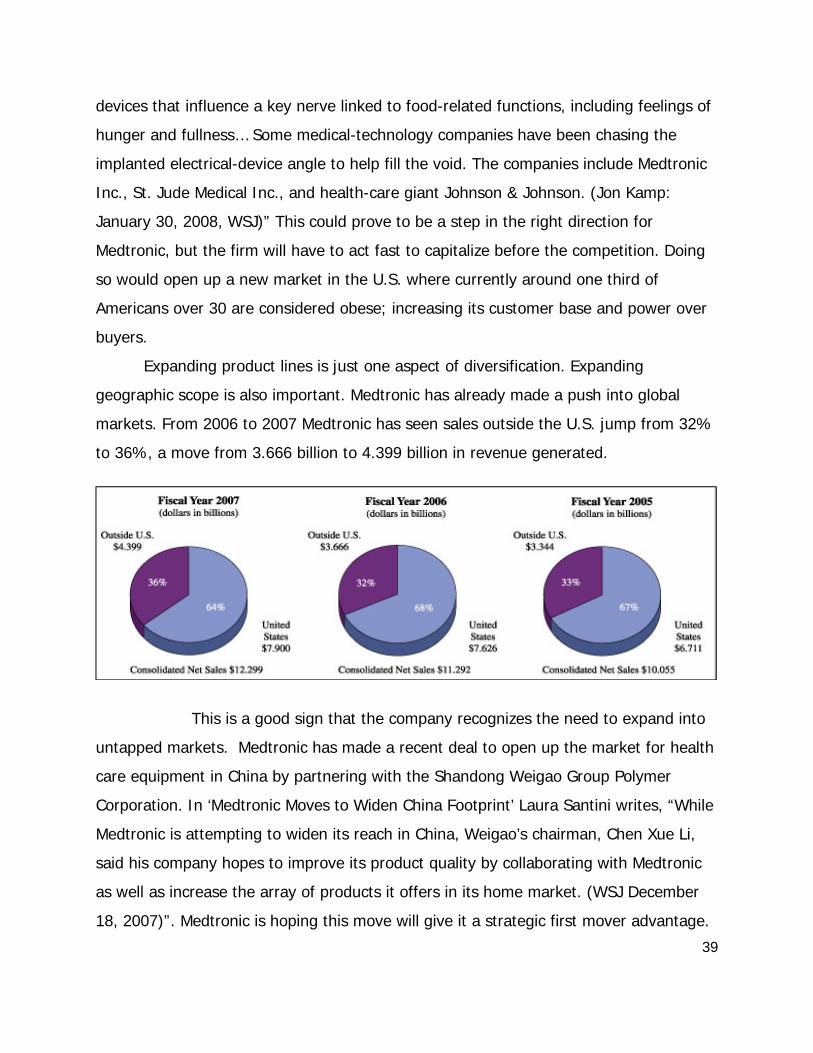
Expanding product lines is just one aspect of diversification. Expanding
geographic scope is also important. Medtronic has already made a push into global
markets. From 2006 to 2007 Medtronic has seen sales outside the U.S. jump from 32%
to 36%, a move from 3.666 billion to 4.399 billion in revenue generated.
This is a good sign that the company recognizes the need to expand into
untapped markets. Medtronic has made a recent deal to open up the market for health
care equipment in China by partnering with the Shandong Weigao Group Polymer
Corporation. In ‘Medtronic Moves to Widen China Footprint’ Laura Santini writes, “While
Medtronic is attempting to widen its reach in China, Weigao’s chairman, Chen Xue Li,
said his company hopes to improve its product quality by collaborating with Medtronic
as well as increase the array of products it offers in its home market. (WSJ December
18, 2007)”. Medtronic is hoping this move will give it a strategic first mover advantage.
40
In the same article, Medtronic CEO William Hawkins states, “Strategically
for us, China is where we wanted to expand our footprint.” China has huge potential
for developing a large customer base. This could cause increased bargaining power
over domestic clients as U.S. companies are forced to negotiate for access to Medtronic
products.
Financial Outlook
Medtronic is the leader in market capitalization in the medical equipment and
supplies industry. Although it has 8 divisions, it dominates the market for Cardiac
Rhythm Disease Management. CRDM accounts for 40% of Medtronic’s total revenue. In
this 9 billion dollar a year sector, Medtronic’s CRDM division accounts for 4.876 billion.
That is a 54% market share. Overall, Medtronic, within the scope of market share, is
doing a good job at maintaining leverage over suppliers that must continue their
business with the industry leader.
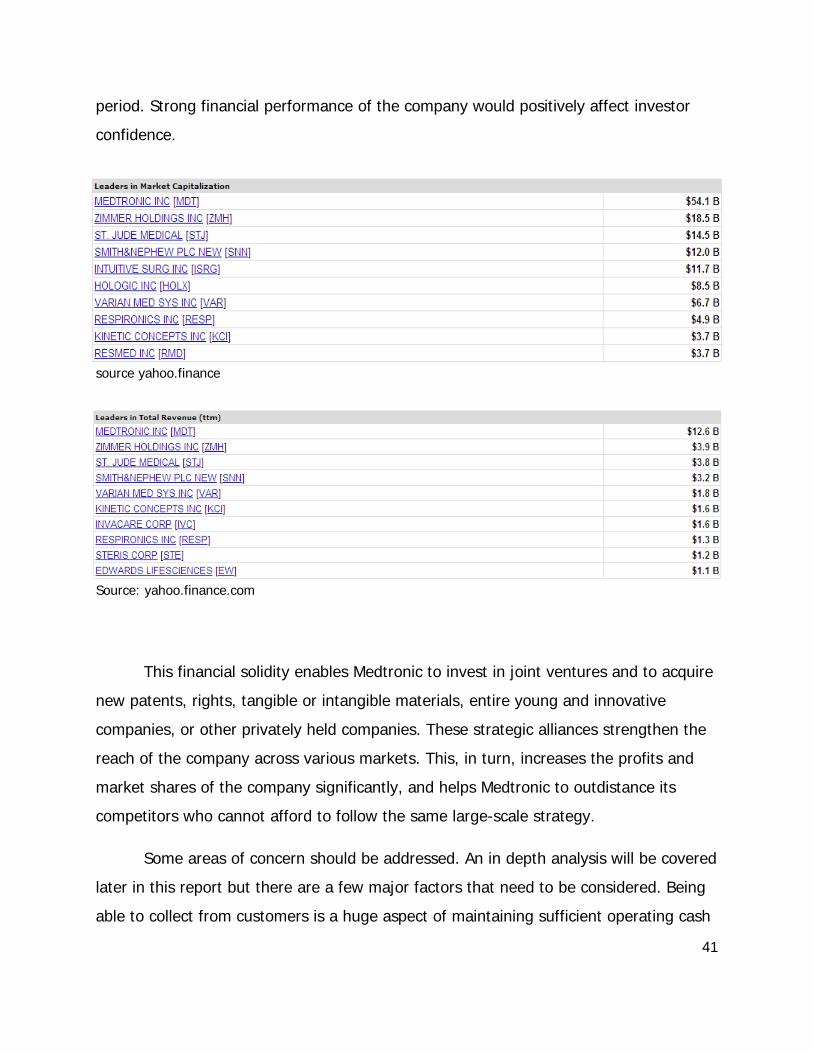
As stated before, Medtronic has the leading market capitalization in its category.
This reveals its strong financial performance recorded over the last few years. Revenues
doubled from 2002 to 2007 from $6,410.8 million to $12,299 million. Further,
Medtronic’s five-year average rate of return on investment was 17.6% as compared to
the industry average of 12.7%. The five-year average rate of return on assets of the
company was recorded at 13.7%, whereas the industry recorded a return of 9.1%.
Moreover, the company’s five-year return on equity was recorded at 23.5% which was
very impressive against the industry average of 18.1%. The five-year average operating
profit margin and net profit margin of Medtronic during the period 2003-2007 was
reported at 28.5% and 21.3% respectively. These ratios are significantly high when
compared to the industry average of 16.5% and 10.9% respectively for the same time
41
period. Strong financial performance of the company would positively affect investor
confidence.
source yahoo.finance
Source: yahoo.finance.com
This financial solidity enables Medtronic to invest in joint ventures and to acquire
new patents, rights, tangible or intangible materials, entire young and innovative
companies, or other privately held companies. These strategic alliances strengthen the
reach of the company across various markets. This, in turn, increases the profits and
market shares of the company significantly, and helps Medtronic to outdistance its
competitors who cannot afford to follow the same large-scale strategy.
Some areas of concern should be addressed. An in depth analysis will be covered
later in this report but there are a few major factors that need to be considered. Being
able to collect from customers is a huge aspect of maintaining sufficient operating cash
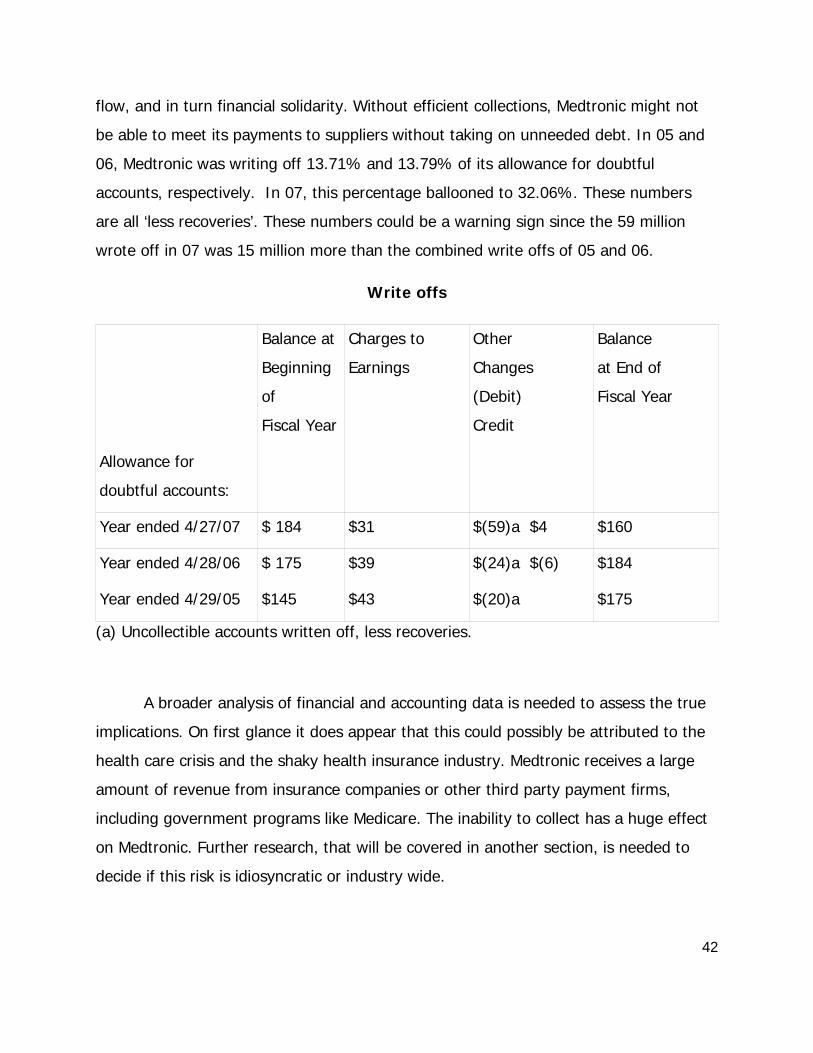
42
flow, and in turn financial solidarity. Without efficient collections, Medtronic might not
be able to meet its payments to suppliers without taking on unneeded debt. In 05 and
06, Medtronic was writing off 13.71% and 13.79% of its allowance for doubtful
accounts, respectively. In 07, this percentage ballooned to 32.06%. These numbers
are all ‘less recoveries’. These numbers could be a warning sign since the 59 million
wrote off in 07 was 15 million more than the combined write offs of 05 and 06.
Write offs
Balance at
Beginning
of
Fiscal Year
Charges to
Earnings
Other
Changes
(Debit)
Credit
Balance
at End of
Fiscal Year
Allowance for
doubtful accounts:
Year ended 4/27/07 $ 184 $31 $(59)a $4 $160
Year ended 4/28/06 $ 175 $39 $(24)a $(6) $184
Year ended 4/29/05 $145 $43 $(20)a $175
(a) Uncollectible accounts written off, less recoveries.
A broader analysis of financial and accounting data is needed to assess the true
implications. On first glance it does appear that this could possibly be attributed to the
health care crisis and the shaky health insurance industry. Medtronic receives a large
amount of revenue from insurance companies or other third party payment firms,
including government programs like Medicare. The inability to collect has a huge effect
on Medtronic. Further research, that will be covered in another section, is needed to
decide if this risk is idiosyncratic or industry wide.
43
Product Quality and Safety
Medtronic's emphasis on product quality is manifested with ongoing efforts in
world-class manufacturing processes, meticulous product testing, and statistical quality
controls. In 1990, Medtronic began its Customer-Focused Quality (CFQ) process, in
which they incorporated all Medtronic quality strategies, programs, and procedures, and
expanded them throughout all levels of the organization worldwide. CFQ underscores a
total commitment on the part of all Medtronic employees to focus on customers’ needs
and wants by providing them with unsurpassed quality in Medtronic’s products,
services, and relationships.
Examples of Medtronic's ongoing quality efforts include having sales
representatives available 24 hours a day to ensure that customers have the appropriate
products and support when needed, testing Medtronic mechanical heart valves over a
span of more than one billion cycles--67% more than required by the United States
Food and Drug Administration’s guidelines, publishing a detailed product performance
report--unique in the medical industry--that provides performance data on Medtronic's
pacemakers and leads, and conducting customer satisfaction surveys for the collection
and assessment of perceptions and imperatives.
Even though the policies are in place to ensure high quality products, it has not
always translated into an enhanced public perception. The most important aspect of
developing power over buyers is quality. Medtronic must make safe products or they
lose the ability to negotiate over relatively trivial matters such as price. This might be
viewed as a shortcoming.
Medtronic is in the process of defending itself against a huge class action suit.
Certain implanted cardiac defibrillators have been recalled after reports of malfunctions
44
resulting in serious injury, and even death. There are currently over 1100 individual
cases making up the U.S. class action suit (this is along with 5 smaller Canadian class
action suits). The trial date is set for July 1, 2008. The ordeal has become very public
and patients are becoming increasingly aware of the situation. Implanted cardiac
defibrillators are an important product in Medtronic’s CRDM division. A huge loss in
demand for this strategic product could put Medtronic in serious financial trouble.
Medtronic is currently funding clinical tests attempting to demonstrate the
superior safety of their ICD’s compared to those of Johnson & Johnson. With the
massive publicity the case has received it is doubtful that the results of the research will
have much effect. With the general instability in the current healthcare industry, this is
not a good time to lose buyers in a key product line. If Medtronic cannot find a way to
revive its tarnished image, serious financial consequences could follow. The impact will
be much larger than the settlements awarded to the plaintiffs. This could result in a
total loss of power to negotiate over price with buyers that are scared, literally for their
lives, to use Medtronic ICD’s.
Customer Relations
Medtronic makes most of its sales through direct customer representatives.
Buyers want their orders to be taken and delivered efficiently. The company has been
consulted by Oracle in hopes of improving sales team effectiveness. The Oracle website
summarizes its role; “Challenges: Maintain a competitive advantage-
physician/customer loyalty- as the company grows, Optimize sales force performance
and customer service by providing the sales team with accurate customer data, Provide
reporting functionality not present in the company’s current business objects system.
Solutions: Worked with BI Consulting group to implement Oracle Business Intelligence
Enterprise Edition creating a business analytics system which measures and monitors
key sales metrics, Improved insight into key data such as devices sold per region-
45
physician loyalty- pending purchase orders- etc., Realized over 45,000 productivity
hours saved annually among the company’s user group.”
Keeping customers happy with the service they receive is critical. Medtronic has
acknowledged this and has made steps to improve its sales force/ customer relations.
This all translates into increased buyer return rates and bargaining power. Customer
service can be seen as a competitive advantage. Research and technology can be
duplicated some times, but the relationship between sales team members and
customers is hard to replicate. This can translate into a sustained advantage.
Supplier Relations
Medtronic’s record on supply chain relations has not been as sterling.
Information on arguments with suppliers is limited. This makes it hard to make an
accurate generalization from what could be an isolated incident. Major conflicts that
have reached the point of litigation should be mentioned.
On December 24, 1997 a subsidiary of Abbott Labs, a major supplier to
Medtronic, filed a suit regarding intellectual property infringement (10-K). The
company, ACS, claimed that Medtronic used patented information in the creation of
vascular stints. The courts ruled in favor of ACS. This decision has been upheld through
appellate courts but, as of 2008, Medtronic has continued to appeal and has not listed
any contingencies on its books. Medtronic continues doing business with Abbott labs
but this could be a sign that the market giant might be seen as a necessary evil to
some. If suppliers are not happy with their treatment by Medtronic they could remove
certain privileges such as credit lines and discounts. This increasing the cost of doing
business, resulting in lower margins.
46
Social Complexity and Corporate Social Responsibility
Since Medtronic was named to FORTUNE magazine's annual list of "America's
Most Admired Companies" during seven consecutive years from 1998 to 2004, it means
that the company managed to produce an effect on the public and to transmit a vision
of its way of doing business. It has a Code of Conduct exposing humanist and
environmental friendly goals. For example, Medtronic implements programs reducing
greenhouse gas emission and consumption of water; Medtronic used approximately
29,000 gallons of water per million dollars of revenue in fiscal year 2006. Comparing
fiscal year 2006 to fiscal year 2005, Medtronic’s rate of water consumption decreased
over 10 percent, resulting in an actual decrease of 1.5 million gallons of water use.
Moreover, Medtronic takes care of their customer education. They don’t just
create high quality products, they want their employees, doctors, and patients to
understand Medtronic's new technologies. To do so, an essential element of its service
is the customer education program, which includes product training sessions, the
sponsorship of major medical and scientific seminars and symposia throughout the
world, and professionally accredited workshops. "On April 27, 2007, we employed
approximately 38,000 employees. Our employees are vital to our success. We believe
we have been successful in attracting and retaining qualified personnel in a highly
competitive labor market due to our competitive compensation and benefits, and our
rewarding work environment. We believe our employee relations are excellent." That's
what is said in Medtronic's 10-K 2007, and it appears to be accurate. Reports show that
they care a lot about their employees' condition and develop services to recognize the
personal worth of employees by providing an employment framework that allows for
personal satisfaction in work accomplished as well as financial security, advancement
opportunities, and means to share in the company's success.
47
Conclusion
Medtronic seems to be doing an adequate, not stellar, job in fulfilling its
objectives. Continued improvement in maintaining sustainable competitive advantage is
necessary. Accounting and financial analysis will be performed to evaluate Medtronic’s
holistic performance, with the eventual goal of reaching an accurate equity valuation.
48
Accounting Analysis
Accounting analysis is a tool used by analysts to evaluate the financial
statements of a firm. Corporations provide these financial statements to the public so
investors will have something to go by when deciding whether to invest in that
company or not. Moreover the main purpose of financial reports is to credibly
communicate economic consequences of business activities. Since a lot of this data is
reliant upon “people made” numbers then there will most likely be discrepancies in the
financial reports. Indeed choices may contain material errors and biases, we will need
to undo as we will use these numbers for the firm’s valuation. So we need to
understand where these numbers come from to decide how reliable they are and how
much value we can put on them.
With that in mind, the accounting analysis consists of 6 steps that are used to
correct those discrepancies and show the true nature of the financial statements. The
first step is to identify principal accounting policies, and what policies a firm uses to
measure its key success factors. The second step focuses on assessing the accounting
flexibility of a firm. Is the firm able to hide their true performance? If so, that brings us
to the third step: evaluating the accounting strategy of a firm. If they have accounting
flexibility, do they “use it to communicate their firm’s economic situation or to hide true
performance?” (Palepu & Healy) Step 4 is evaluating the quality of disclosure and how
well managers disclose information. The next step is identifying potential red flags and
whether there are unusual transactions that account for a boost in profits. The final
step is undoing accounting distortions. If the firm’s numbers are misleading, then the
analyst will use this step to correct those to the best of their ability.
49
Key Accounting Policies
Identifying the key accounting policies is the first step of the accounting analysis.
These are closely linked to the key success factors as discussed in the Firm Competitive
Advantage Analysis. By understanding a firms key success factors, we will be better
able to understand the policies the firm uses to measure these key success factors. A
firm has the ability to disclose or not disclose vital information relating to the firm in
order to gain a competitive advantage in the industry. That is why it is important to
understand what policies are currently in use and whether they should be altered in any
way to show the true performance of a firm.
According to the competitive advantage analysis discussion, the key success
factors of the business activities are research and development, diversification in the
products segmentation, and superior product quality. The key accounting policies of
Medtronic that would affect these key success factors is the accounting of research and
development, accounting of goodwill, and the accounting of warranty expenses.
Research and Development
Generally Accepted Accounting Principles state that all research and development
must be expensed when incurred. This is exactly what Medtronic is doing. In
Medtronic’s 10-K it specifically says that R&D is expensed when incurred. However,
there is something called IPR&D which stands for In Process Research & Development
charges. When Medtronic acquires a company, the policy uses to account for this is
IPR&D. Based on their 10-K, “all value were determined by estimating the revenues and
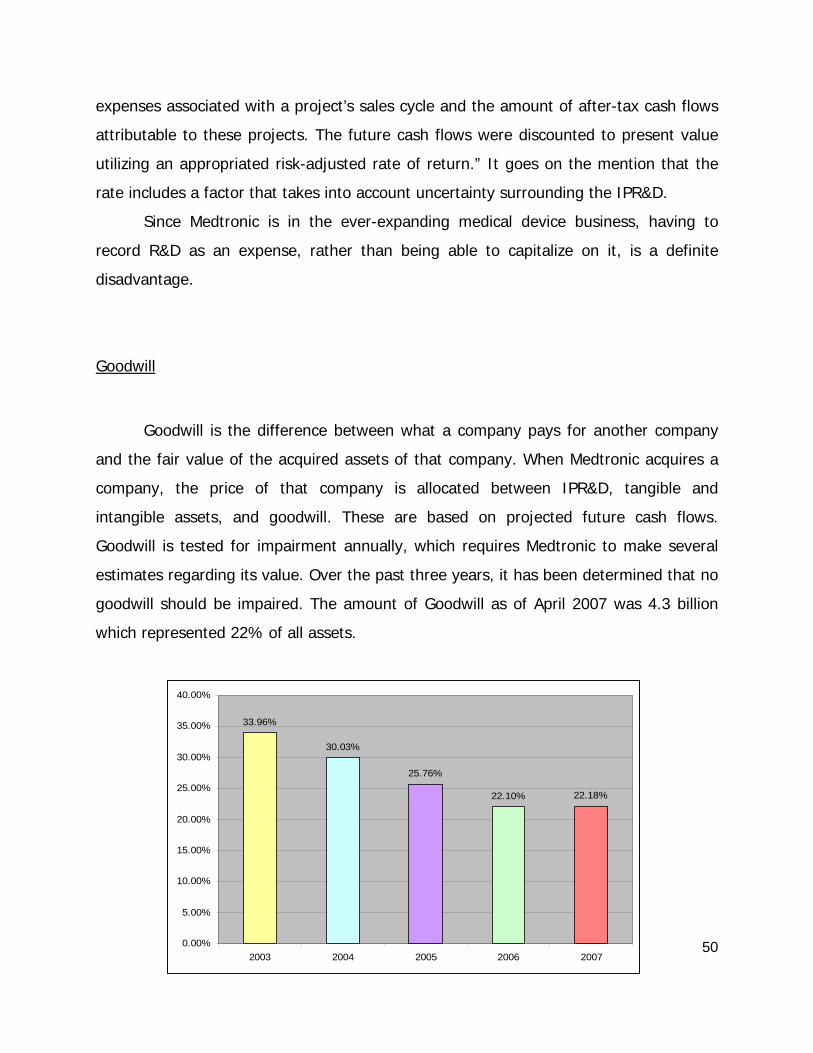
50
expenses associated with a project’s sales cycle and the amount of after-tax cash flows
attributable to these projects. The future cash flows were discounted to present value
utilizing an appropriated risk-adjusted rate of return.” It goes on the mention that the
rate includes a factor that takes into account uncertainty surrounding the IPR&D.
Since Medtronic is in the ever-expanding medical device business, having to
record R&D as an expense, rather than being able to capitalize on it, is a definite
disadvantage.
Goodwill
Goodwill is the difference between what a company pays for another company
and the fair value of the acquired assets of that company. When Medtronic acquires a
company, the price of that company is allocated between IPR&D, tangible and
intangible assets, and goodwill. These are based on projected future cash flows.
Goodwill is tested for impairment annually, which requires Medtronic to make several
estimates regarding its value. Over the past three years, it has been determined that no
goodwill should be impaired. The amount of Goodwill as of April 2007 was 4.3 billion
which represented 22% of all assets.
33.96%
30.03%
25.76%
22.10% 22.18%
0.00%
5.00%
10.00%
15.00%
20.00%
25.00%
30.00%
35.00%
40.00%
2003 2004 2005 2006 2007
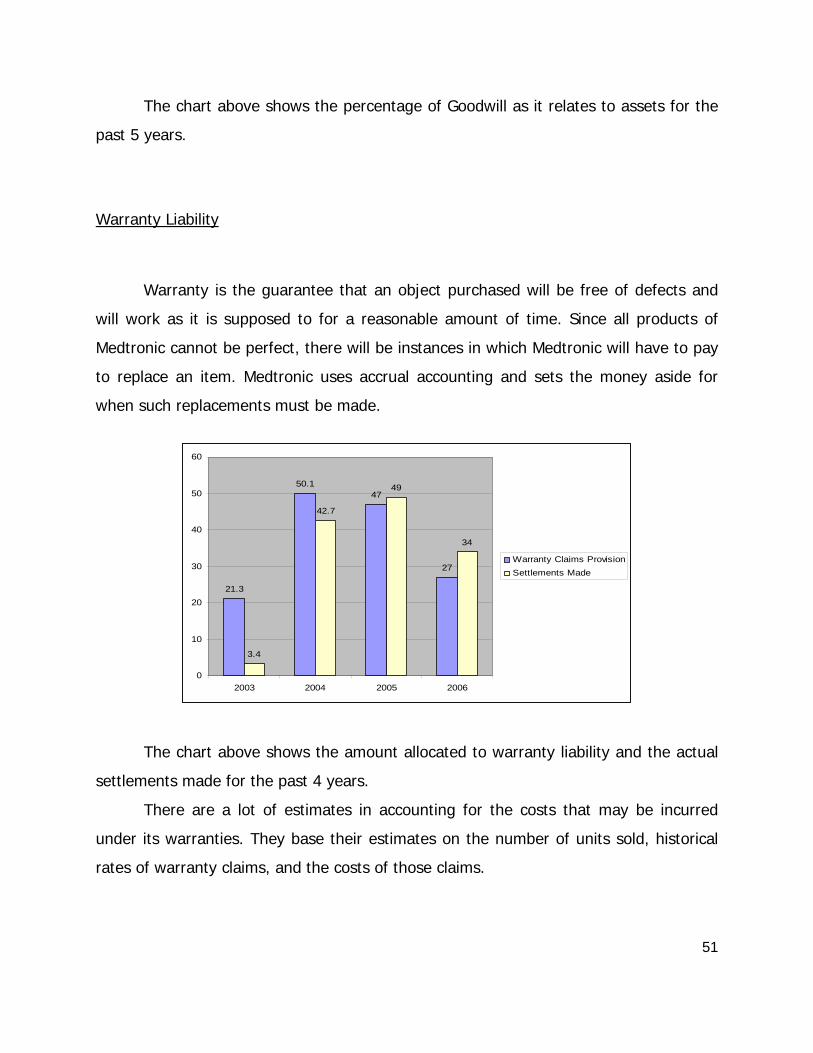
51
The chart above shows the percentage of Goodwill as it relates to assets for the
past 5 years.
Warranty Liability
Warranty is the guarantee that an object purchased will be free of defects and
will work as it is supposed to for a reasonable amount of time. Since all products of
Medtronic cannot be perfect, there will be instances in which Medtronic will have to pay
to replace an item. Medtronic uses accrual accounting and sets the money aside for
when such replacements must be made.
The chart above shows the amount allocated to warranty liability and the actual
settlements made for the past 4 years.
There are a lot of estimates in accounting for the costs that may be incurred
under its warranties. They base their estimates on the number of units sold, historical
rates of warranty claims, and the costs of those claims.
21.3
50.147
27
3.4
42.7
49
34
0
10
20
30
40
50
60
2003 2004 2005 2006
Warranty Claims ProvisionSettlements Made
52
Accounting Flexibility
Accounting flexibility is the amount of freedom managers have in reporting
numbers that portray the value of a firm. GAAP is the law managers have to go by in
reporting numbers. Sometimes GAAP is very restrictive as in the case with R&D. R&D
must be expensed when incurred and they allow for no flexibility in this matter. On the
other hand, GAAP allows for flexibility in other areas such as estimating warranty
liabilities.
When managers have this flexibility, it gives them the control of managing the
firms reported numbers. This step looks carefully at the firm and analyzes whether
Medtronic has this flexibility.
R&D Flexibility
GAAP sets a high degree of constraint in reporting R&D. They mandate that
research and development should be expensed when incurred. Since R&D is a main key
success factor with Medtronic, this is quite unfortunate that it cannot be capitalized as
an asset. The medical device industry is constantly expanding technologically and the
lack of recording R&D as an asset hinders companies like Medtronic in growing faster.
53
Goodwill Flexibility
Whereas R&D has little flexibility, it’s almost the exact opposite for goodwill.
Goodwill allows managers great flexibility in reporting those numbers. The Statement of
Financial Accounting Standards (SFAS) No. 142 states that Goodwill is not to be
amortized. Rather, Goodwill is tested for impairment annually. “When the carrying
amount of the reporting unit’s net assets exceeds the estimated fair value of the
reporting unit,” then an impairment loss is recognized. (Medtronic’s 10-k) Per
Medtronic’s 10-k, they have reevaluated their Goodwill and have determined that none
should be impaired. This has been the case for the past 3 years. As was mentioned
before, Goodwill has accounted for over 20% of their assets for the past 5 years.
This proves that the point that managers have the ability to recognize
impairment only when they see fit. Thus, managers have extreme flexibility and control
in recognizing goodwill.
Warranty Flexibility
Warranty costs are estimated at the time a product is sold and then records a
liability for those estimated costs. Medtronic periodically assesses “the adequacy of its
recorded warranty liabilities and adjusts the amounts as necessary.” (Medtronic 10-k)
Obviously, this allows for great flexibility in allowing Medtronic to manage the numbers
reported for warranty liabilities. Underestimating these costs would allow Medtronic to
overstate net Income and overstate assets.
54
Actual Accounting Strategy
There are different strategies when reporting the financials. A firm can be either
a high or low disclosure company, or somewhere in-between. Many times, if a
company is doing very well and above expectations in reality, they theoretically would
have no problem being a very high disclosure company. As well, a firm not performing
to expectations might be more inclined to “hide” their actual standing as a company by
having lower disclosure. However, this is not always the case. Companies, even when
doing well, may disclose less than ample because of legal reasons. GAAP standards
allow for this luxury, despite the rising of standards. However, lower levels of
disclosure (barely covering what is required by GAAP) can be very misleading for any
readers of financial statements.
Medtronic Inc. has a high level of disclosure in its financial reports. On
everything discussed, there are detailed explanations as well line-by-line charts and
notes. One thing Medtronic does not report is its contingent litigation liabilities. In
other words, it seems that Medtronic will not recognize its lawsuits until they are forced
by law to pay them, even when they are estimable. Usually, this would seem to lower
the disclosure, but in Medtronic’s case they provide all of the information in detail in the
management discussions and notes. This tactic allows Medtronic to keep the books
stable during the appeals process while at the same time disclosing very much to the
readers of the documents and not keeping investors in the dark. By providing all the
information needed, the adjustments will be made in the “Undoing Accounting
Distortions” section.
Medtronic managers use a very aggressive strategy when reporting its
financials. For example, on section 6 titled “Goodwill and Other Intangible Assets” it is
said that the company had no impairment whatsoever on its goodwill for the fiscal years
of 2005-2007. This seems unusually aggressive, if not misleading. In contrast, Boston
Scientific amortizes certain intangibles different ways, such as patents and license
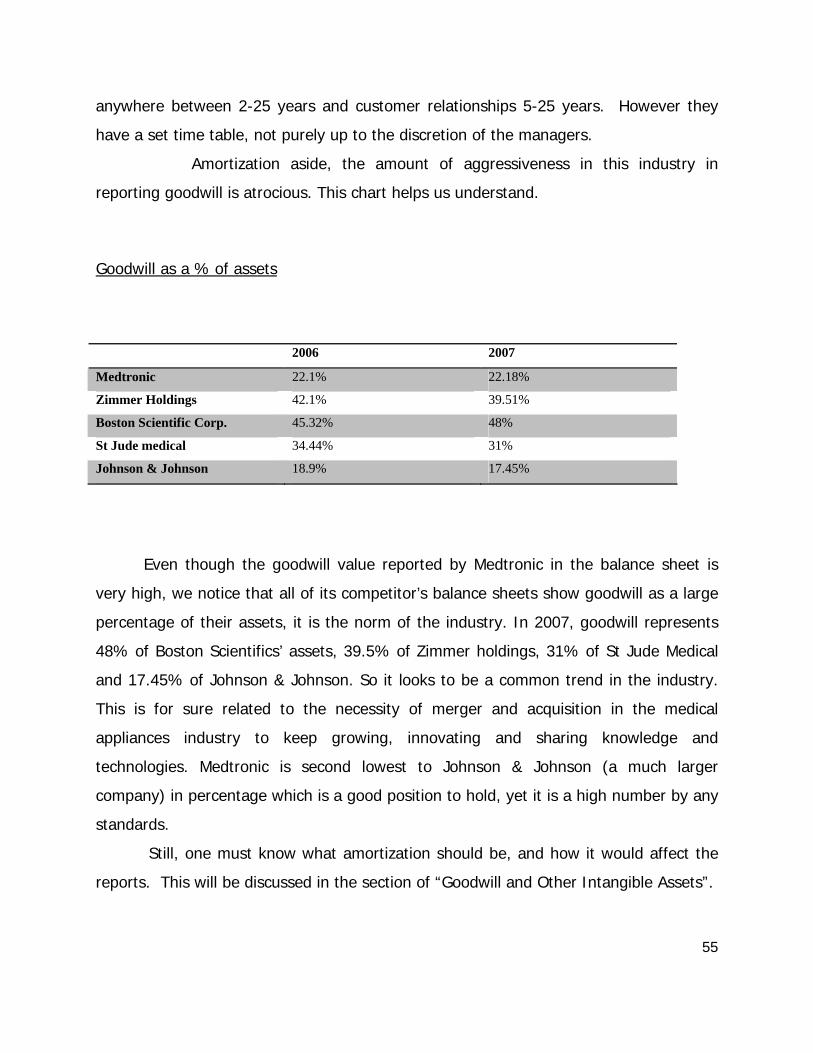
55
anywhere between 2-25 years and customer relationships 5-25 years. However they
have a set time table, not purely up to the discretion of the managers.
Amortization aside, the amount of aggressiveness in this industry in
reporting goodwill is atrocious. This chart helps us understand.
Goodwill as a % of assets
2006 2007
Medtronic 22.1% 22.18%
Zimmer Holdings 42.1% 39.51%
Boston Scientific Corp. 45.32% 48%
St Jude medical 34.44% 31%
Johnson & Johnson 18.9% 17.45%
Even though the goodwill value reported by Medtronic in the balance sheet is
very high, we notice that all of its competitor’s balance sheets show goodwill as a large
percentage of their assets, it is the norm of the industry. In 2007, goodwill represents
48% of Boston Scientifics’ assets, 39.5% of Zimmer holdings, 31% of St Jude Medical
and 17.45% of Johnson & Johnson. So it looks to be a common trend in the industry.
This is for sure related to the necessity of merger and acquisition in the medical
appliances industry to keep growing, innovating and sharing knowledge and
technologies. Medtronic is second lowest to Johnson & Johnson (a much larger
company) in percentage which is a good position to hold, yet it is a high number by any
standards.
Still, one must know what amortization should be, and how it would affect the
reports. This will be discussed in the section of “Goodwill and Other Intangible Assets”.
56
Qualitative Quality of Disclosure
When looking at a company’s financial data, there is a lot to consider in
the area of quality with the information that you are receiving. If an investor is
confident that a company has integrity in the quality of disclosure, it helps that investor
have confidence in the numbers. However, if there are major areas that are somewhat
shady or misleading, an investor cannot help but question all the numbers. For this
reason, it behooves any company to have a well rounded, high quality of disclosure.
Some companies in this industry, such as Boston Scientific, have much more
goodwill than Medtronic. However, this is due to large mergers within Boston Scientific,
which were considerably more than Medtronic. One thing that keeps Medtronic’s
goodwill and other intangibles is that they see no need to amortize them. This seems
to be a problem, making one question the quality of the information given. When one
looks at research and development, as another example, it is somewhat unclear how
and when the IPR&D (in progress research and development) is recorded. It seems
that it is up to the discretion of the managers if it is recorded as finished R&D or if it
recorded as goodwill. It seems to be up to different circumstances, like what the
research is and if it is successful or not. These two, goodwill and IPR&D are
questionable, but they are consistent with the industry.
There are many more items, however, that have a very high quality of
disclosure. Part of this reason is medical companies, such as those in this industry, are
held to a higher standard of preciseness because of the horrendous consequences of
bad decisions. Warranties, for example, must be spelled out clearly because of the
seriousness of the product functions. Also, with the extreme legal oversight of this
industry, there are more incentives to be accurate and not misleading. Another thing
Medtronic does at least par with, if not better than the industry, is figuring how much
positive or negative impact foreign currency has on the final earnings. Since Medtronic
does quite a bit of business outside the U.S., foreign currency has a major impact, for
57
better or worse, on all the financial reports. Overall, Medtronic should be said to have a
somewhat high level of quality disclosure, with some areas of needed improvement,
ones of which are industry wide problems.
Quantitative Quality of Disclosure
A quantitative analysis of disclosure measures the same idea as qualitative
disclosure discussed above, but in a different way. In quantitative, we actually look at
the numbers. The GAAP standards are flexible enough to allow some discrepancies on
how to report such items. This in itself is not a bad thing. It allows companies’
managers to make the best decisions for shareholder wealth, while at the same time
being truthful. However, some numbers may be skewed. Knowing this, we must identify
which numbers are biased and possibly misleading from the ones that are reliable. By
analyzing these diagnostics we can determine, with more confidence, the state of the
firm. Once we understand where the “red flags” are for the company, then it is only a
matter of undoing these distortions to see the firm more for what it is worth, above and
beyond the scope of GAAP standards.
First, we will perform a revenues manipulation diagnostic and then an
expenses manipulation diagnostic in relation to the medical appliances and equipment
industry. Ratios we will compute should reveal inconsistencies in the accounting
policies, if any. Then we will deduct motives for such distortion that might lead
investors to a misleading valuation of the firm. In the quantitative analysis, we will also
compare the financial elements of Medtronic and its main competitors: Boston Scientific
Corp., Johnson & Johnson, St Jude Medical Inc. and Zimmer Holdings
Next, we will look at the core expense manipulation diagnostics. These, in
contrast to sales (revenue) diagnostics which might distort income of a company, the
expense diagnostics will determine if a company is trying to unjustifiably distort their
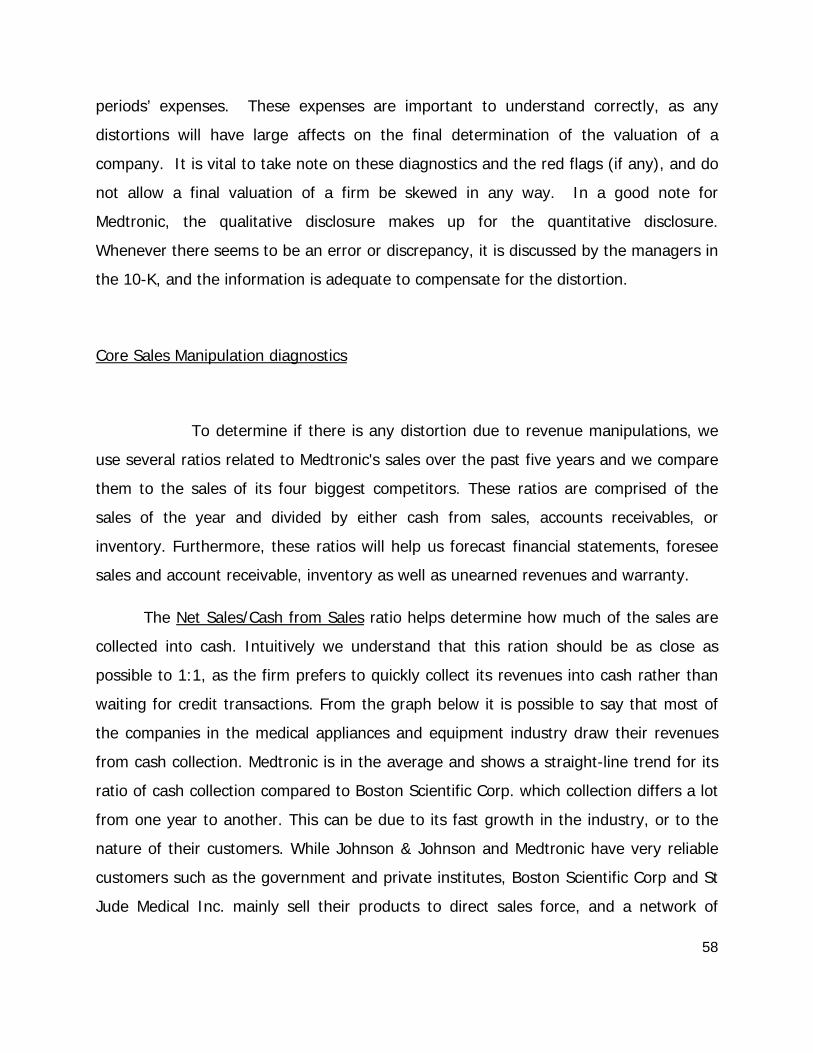
58
periods’ expenses. These expenses are important to understand correctly, as any
distortions will have large affects on the final determination of the valuation of a
company. It is vital to take note on these diagnostics and the red flags (if any), and do
not allow a final valuation of a firm be skewed in any way. In a good note for
Medtronic, the qualitative disclosure makes up for the quantitative disclosure.
Whenever there seems to be an error or discrepancy, it is discussed by the managers in
the 10-K, and the information is adequate to compensate for the distortion.
Core Sales Manipulation diagnostics
To determine if there is any distortion due to revenue manipulations, we
use several ratios related to Medtronic's sales over the past five years and we compare
them to the sales of its four biggest competitors. These ratios are comprised of the
sales of the year and divided by either cash from sales, accounts receivables, or
inventory. Furthermore, these ratios will help us forecast financial statements, foresee
sales and account receivable, inventory as well as unearned revenues and warranty.
The Net Sales/Cash from Sales ratio helps determine how much of the sales are
collected into cash. Intuitively we understand that this ration should be as close as
possible to 1:1, as the firm prefers to quickly collect its revenues into cash rather than
waiting for credit transactions. From the graph below it is possible to say that most of
the companies in the medical appliances and equipment industry draw their revenues
from cash collection. Medtronic is in the average and shows a straight-line trend for its
ratio of cash collection compared to Boston Scientific Corp. which collection differs a lot
from one year to another. This can be due to its fast growth in the industry, or to the
nature of their customers. While Johnson & Johnson and Medtronic have very reliable
customers such as the government and private institutes, Boston Scientific Corp and St
Jude Medical Inc. mainly sell their products to direct sales force, and a network of
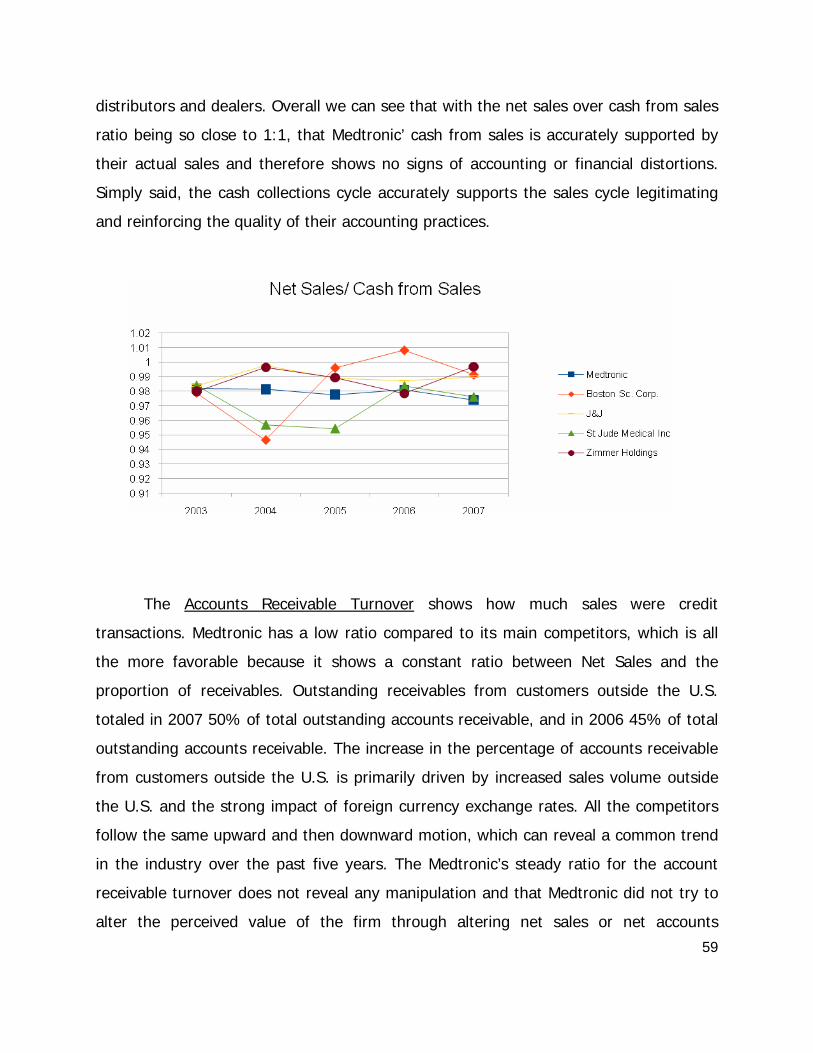
59
distributors and dealers. Overall we can see that with the net sales over cash from sales
ratio being so close to 1:1, that Medtronic’ cash from sales is accurately supported by
their actual sales and therefore shows no signs of accounting or financial distortions.
Simply said, the cash collections cycle accurately supports the sales cycle legitimating
and reinforcing the quality of their accounting practices.
The Accounts Receivable Turnover shows how much sales were credit
transactions. Medtronic has a low ratio compared to its main competitors, which is all
the more favorable because it shows a constant ratio between Net Sales and the
proportion of receivables. Outstanding receivables from customers outside the U.S.
totaled in 2007 50% of total outstanding accounts receivable, and in 2006 45% of total
outstanding accounts receivable. The increase in the percentage of accounts receivable
from customers outside the U.S. is primarily driven by increased sales volume outside
the U.S. and the strong impact of foreign currency exchange rates. All the competitors
follow the same upward and then downward motion, which can reveal a common trend
in the industry over the past five years. The Medtronic’s steady ratio for the account
receivable turnover does not reveal any manipulation and that Medtronic did not try to
alter the perceived value of the firm through altering net sales or net accounts
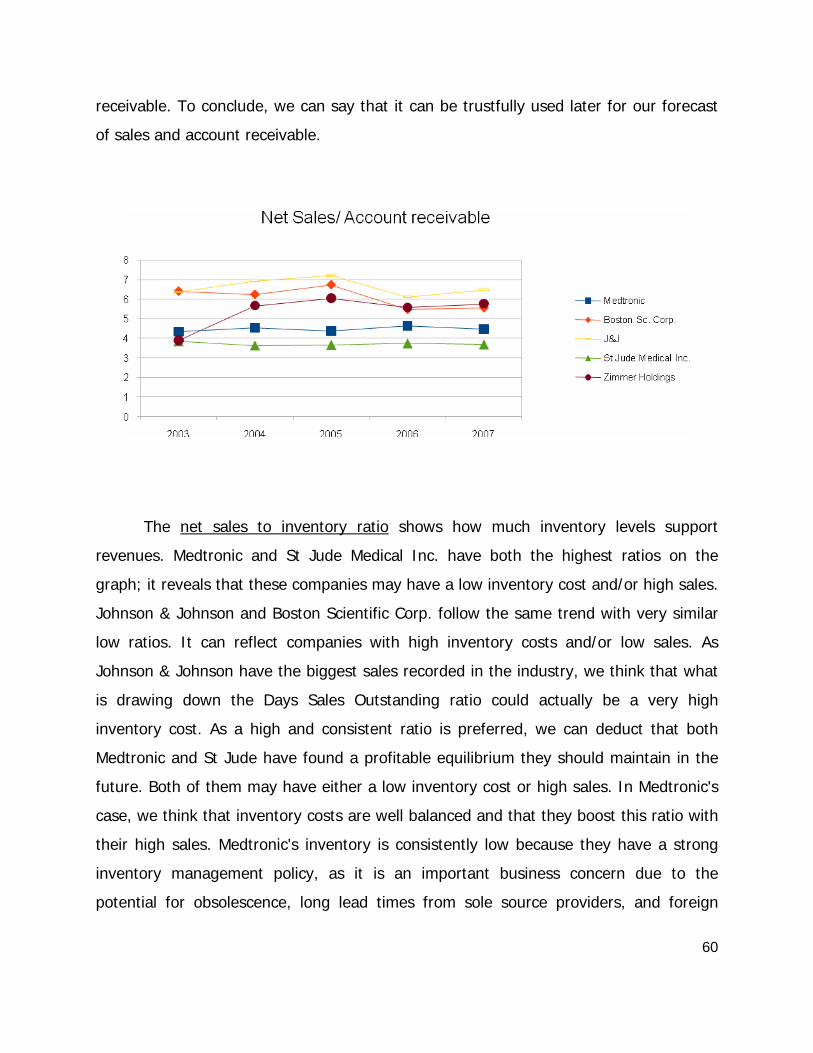
60
receivable. To conclude, we can say that it can be trustfully used later for our forecast
of sales and account receivable.
The net sales to inventory ratio shows how much inventory levels support
revenues. Medtronic and St Jude Medical Inc. have both the highest ratios on the
graph; it reveals that these companies may have a low inventory cost and/or high sales.
Johnson & Johnson and Boston Scientific Corp. follow the same trend with very similar
low ratios. It can reflect companies with high inventory costs and/or low sales. As
Johnson & Johnson have the biggest sales recorded in the industry, we think that what
is drawing down the Days Sales Outstanding ratio could actually be a very high
inventory cost. As a high and consistent ratio is preferred, we can deduct that both
Medtronic and St Jude have found a profitable equilibrium they should maintain in the
future. Both of them may have either a low inventory cost or high sales. In Medtronic's
case, we think that inventory costs are well balanced and that they boost this ratio with
their high sales. Medtronic's inventory is consistently low because they have a strong
inventory management policy, as it is an important business concern due to the
potential for obsolescence, long lead times from sole source providers, and foreign
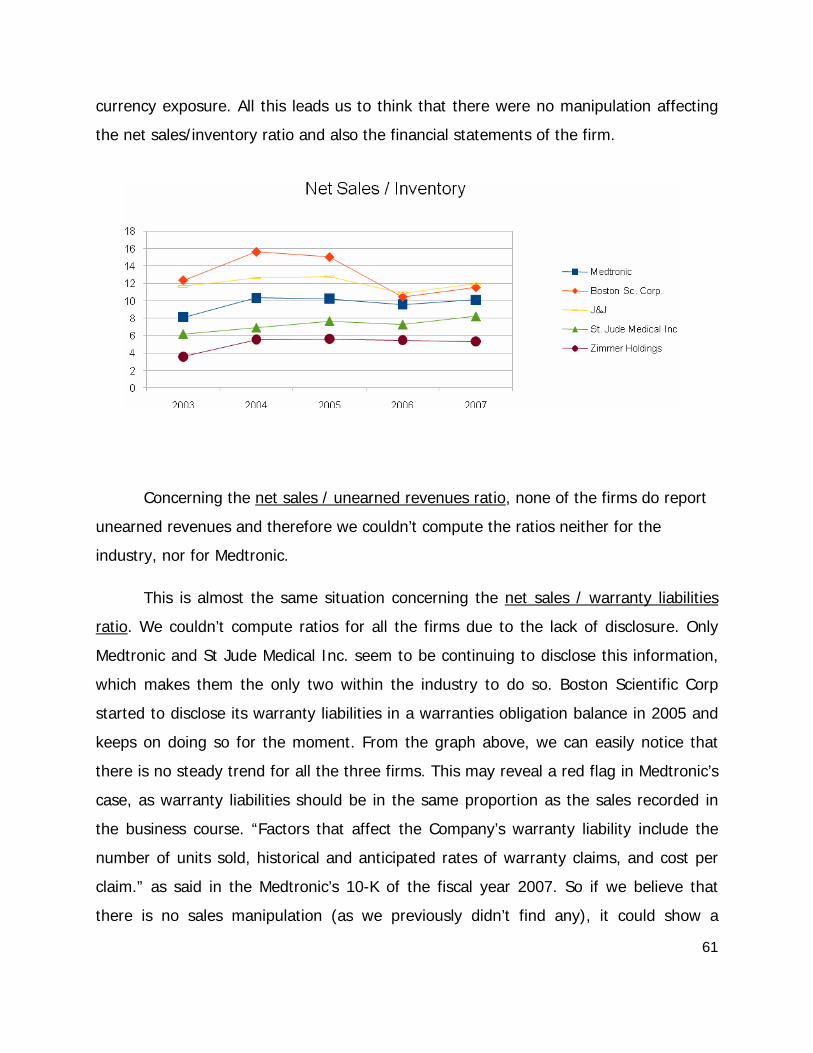
61
currency exposure. All this leads us to think that there were no manipulation affecting
the net sales/inventory ratio and also the financial statements of the firm.
Concerning the net sales / unearned revenues ratio, none of the firms do report
unearned revenues and therefore we couldn’t compute the ratios neither for the
industry, nor for Medtronic.
This is almost the same situation concerning the net sales / warranty liabilities
ratio. We couldn’t compute ratios for all the firms due to the lack of disclosure. Only
Medtronic and St Jude Medical Inc. seem to be continuing to disclose this information,
which makes them the only two within the industry to do so. Boston Scientific Corp
started to disclose its warranty liabilities in a warranties obligation balance in 2005 and
keeps on doing so for the moment. From the graph above, we can easily notice that
there is no steady trend for all the three firms. This may reveal a red flag in Medtronic’s
case, as warranty liabilities should be in the same proportion as the sales recorded in
the business course. “Factors that affect the Company’s warranty liability include the
number of units sold, historical and anticipated rates of warranty claims, and cost per
claim.” as said in the Medtronic’s 10-K of the fiscal year 2007. So if we believe that
there is no sales manipulation (as we previously didn’t find any), it could show a
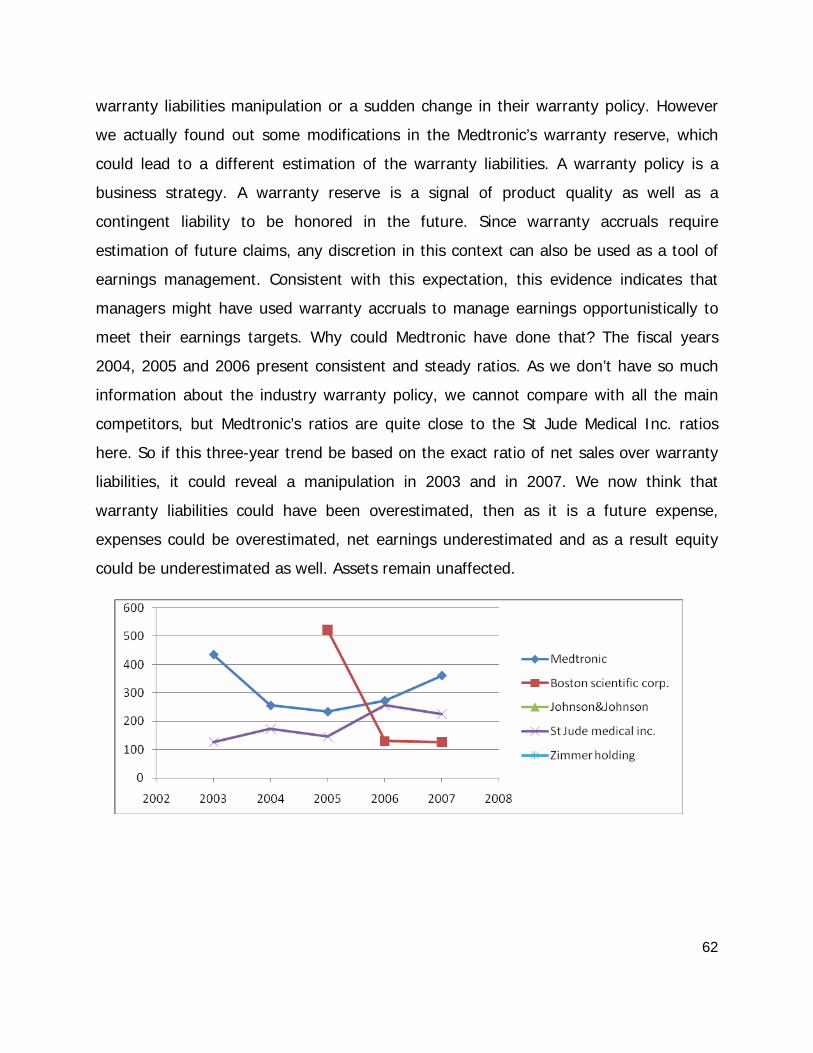
62
warranty liabilities manipulation or a sudden change in their warranty policy. However
we actually found out some modifications in the Medtronic’s warranty reserve, which
could lead to a different estimation of the warranty liabilities. A warranty policy is a
business strategy. A warranty reserve is a signal of product quality as well as a
contingent liability to be honored in the future. Since warranty accruals require
estimation of future claims, any discretion in this context can also be used as a tool of
earnings management. Consistent with this expectation, this evidence indicates that
managers might have used warranty accruals to manage earnings opportunistically to
meet their earnings targets. Why could Medtronic have done that? The fiscal years
2004, 2005 and 2006 present consistent and steady ratios. As we don’t have so much
information about the industry warranty policy, we cannot compare with all the main
competitors, but Medtronic’s ratios are quite close to the St Jude Medical Inc. ratios
here. So if this three-year trend be based on the exact ratio of net sales over warranty
liabilities, it could reveal a manipulation in 2003 and in 2007. We now think that
warranty liabilities could have been overestimated, then as it is a future expense,
expenses could be overestimated, net earnings underestimated and as a result equity
could be underestimated as well. Assets remain unaffected.
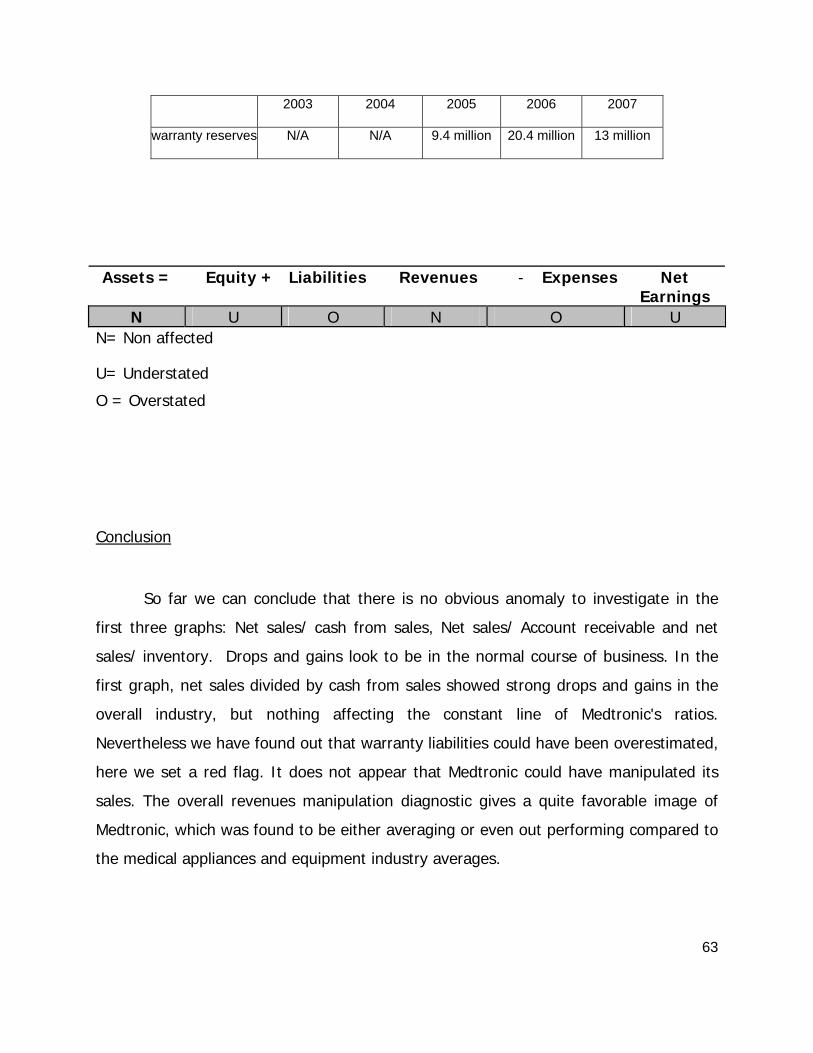
63
2003 2004 2005 2006 2007
warranty reserves N/A N/A 9.4 million 20.4 million 13 million
Assets = Equity + Liabilities Revenues - Expenses Net Earnings
N U O N O U N= Non affected
U= Understated
O = Overstated
Conclusion
So far we can conclude that there is no obvious anomaly to investigate in the
first three graphs: Net sales/ cash from sales, Net sales/ Account receivable and net
sales/ inventory. Drops and gains look to be in the normal course of business. In the
first graph, net sales divided by cash from sales showed strong drops and gains in the
overall industry, but nothing affecting the constant line of Medtronic's ratios.
Nevertheless we have found out that warranty liabilities could have been overestimated,
here we set a red flag. It does not appear that Medtronic could have manipulated its
sales. The overall revenues manipulation diagnostic gives a quite favorable image of
Medtronic, which was found to be either averaging or even out performing compared to
the medical appliances and equipment industry averages.
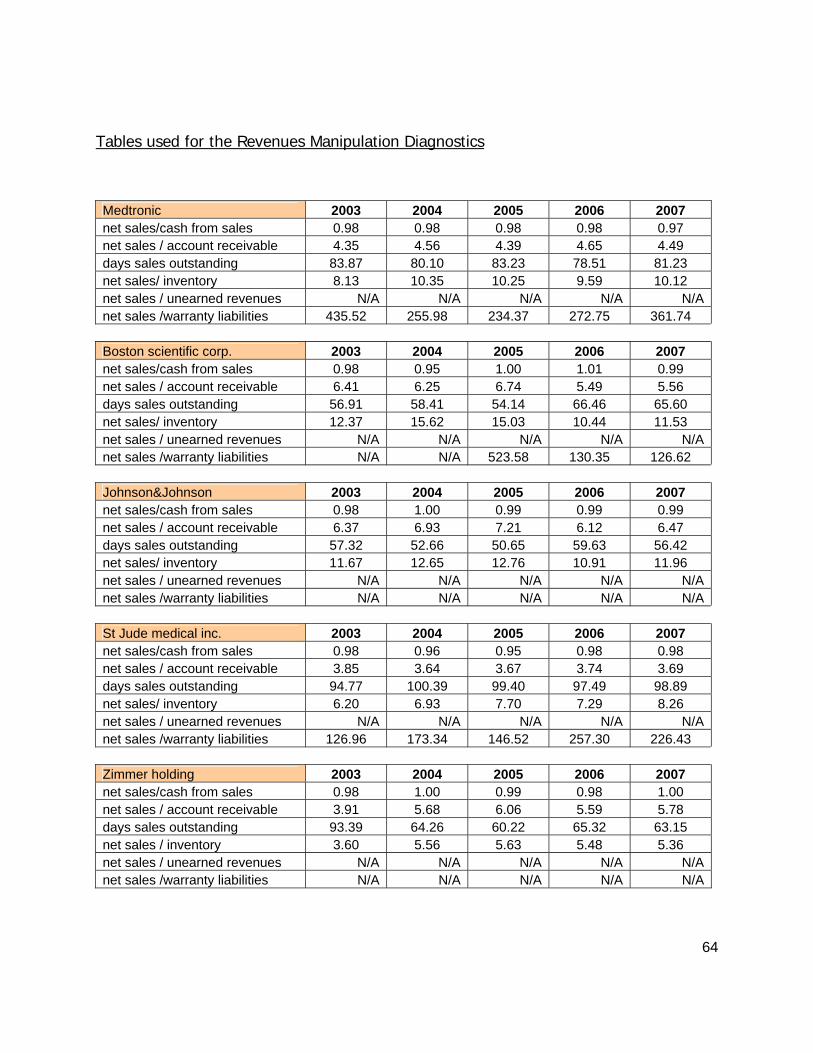
64
Tables used for the Revenues Manipulation Diagnostics
Medtronic 2003 2004 2005 2006 2007 net sales/cash from sales 0.98 0.98 0.98 0.98 0.97 net sales / account receivable 4.35 4.56 4.39 4.65 4.49 days sales outstanding 83.87 80.10 83.23 78.51 81.23 net sales/ inventory 8.13 10.35 10.25 9.59 10.12 net sales / unearned revenues N/A N/A N/A N/A N/Anet sales /warranty liabilities 435.52 255.98 234.37 272.75 361.74 Boston scientific corp. 2003 2004 2005 2006 2007 net sales/cash from sales 0.98 0.95 1.00 1.01 0.99 net sales / account receivable 6.41 6.25 6.74 5.49 5.56 days sales outstanding 56.91 58.41 54.14 66.46 65.60 net sales/ inventory 12.37 15.62 15.03 10.44 11.53 net sales / unearned revenues N/A N/A N/A N/A N/Anet sales /warranty liabilities N/A N/A 523.58 130.35 126.62 Johnson&Johnson 2003 2004 2005 2006 2007 net sales/cash from sales 0.98 1.00 0.99 0.99 0.99 net sales / account receivable 6.37 6.93 7.21 6.12 6.47 days sales outstanding 57.32 52.66 50.65 59.63 56.42 net sales/ inventory 11.67 12.65 12.76 10.91 11.96 net sales / unearned revenues N/A N/A N/A N/A N/Anet sales /warranty liabilities N/A N/A N/A N/A N/A St Jude medical inc. 2003 2004 2005 2006 2007 net sales/cash from sales 0.98 0.96 0.95 0.98 0.98 net sales / account receivable 3.85 3.64 3.67 3.74 3.69 days sales outstanding 94.77 100.39 99.40 97.49 98.89 net sales/ inventory 6.20 6.93 7.70 7.29 8.26 net sales / unearned revenues N/A N/A N/A N/A N/Anet sales /warranty liabilities 126.96 173.34 146.52 257.30 226.43 Zimmer holding 2003 2004 2005 2006 2007 net sales/cash from sales 0.98 1.00 0.99 0.98 1.00 net sales / account receivable 3.91 5.68 6.06 5.59 5.78 days sales outstanding 93.39 64.26 60.22 65.32 63.15 net sales / inventory 3.60 5.56 5.63 5.48 5.36 net sales / unearned revenues N/A N/A N/A N/A N/Anet sales /warranty liabilities N/A N/A N/A N/A N/A
65
Expenses Manipulation diagnostics
To determine if there is any distortion due to expenses manipulations, we
use several ratios related to Medtronic's assets and cash flows over the past five years
and we compare them to the same data provided by its four main competitors in their
respective 10Ks.
The asset turnover ratio is calculated by dividing net sales by total assets.
Medtronic has kept a good even average with a short slowing trend over the past five
years due to a slowing sales growth (from 20% in 2003 to 9% in 2007). However in
2007 Medtronic returned to its regular level of asset turnover. This ratio really brings
into question whether or not Medtronic is appropriately writing off or depreciating its
assets. We know from the 10-k that Medtronic has goodwill that almost equates one
quarter of its total assets. We are certain that if Medtronic writes off all its goodwill
reported in the balance sheet, the asset turnover ratio will suddenly rise, as the assets
are overestimated to date. Nevertheless, Medtronic shows a fairly stable flatter line. It
indicates that there is neither accounting distortion, nor other manipulation in the
accounting policies implementation.
Moreover, Medtronic is actually the only firm in the industry with a very stable
asset turnover and a good average ratio when we want to compare it with the big drop
of Boston Scientific Corp or the rise shown by the curve of Zimmer Holdings for
example. This ratio reports that Medtronic produces with each dollar of asset a revenue
productivity of $0.63. However, we know that the asset productivity is affected and
underestimated by its goodwill weight.
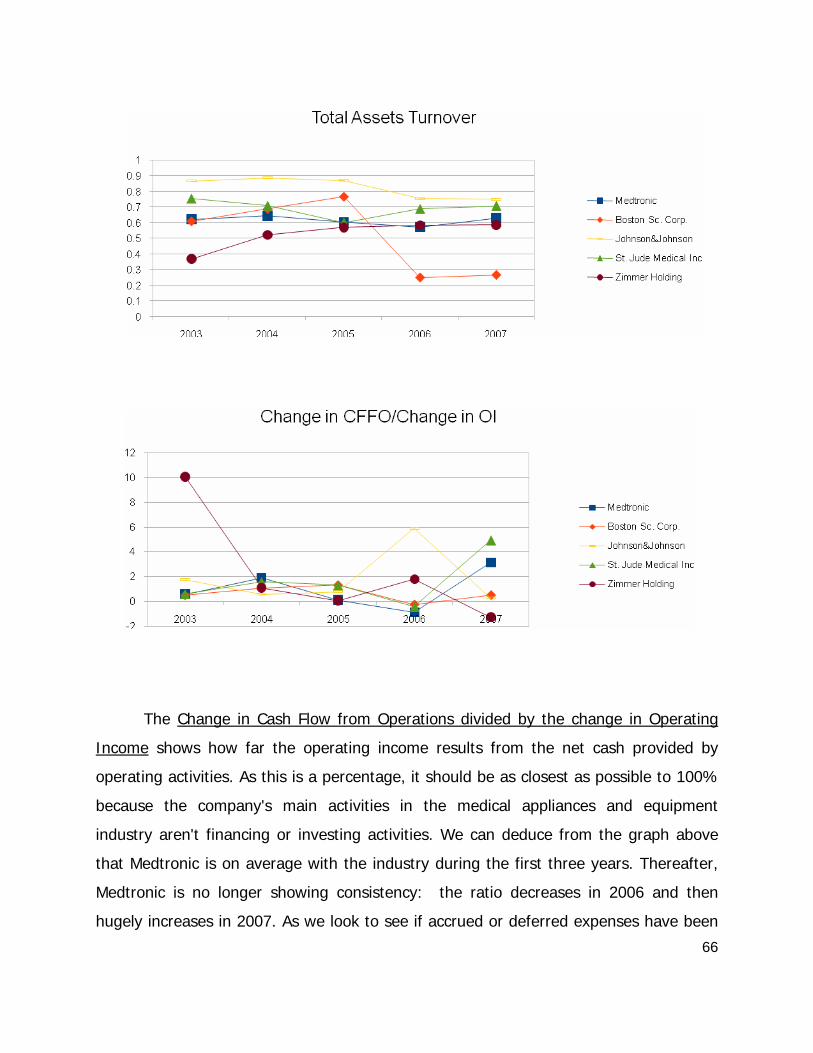
66
The Change in Cash Flow from Operations divided by the change in Operating
Income shows how far the operating income results from the net cash provided by
operating activities. As this is a percentage, it should be as closest as possible to 100%
because the company's main activities in the medical appliances and equipment
industry aren't financing or investing activities. We can deduce from the graph above
that Medtronic is on average with the industry during the first three years. Thereafter,
Medtronic is no longer showing consistency: the ratio decreases in 2006 and then
hugely increases in 2007. As we look to see if accrued or deferred expenses have been
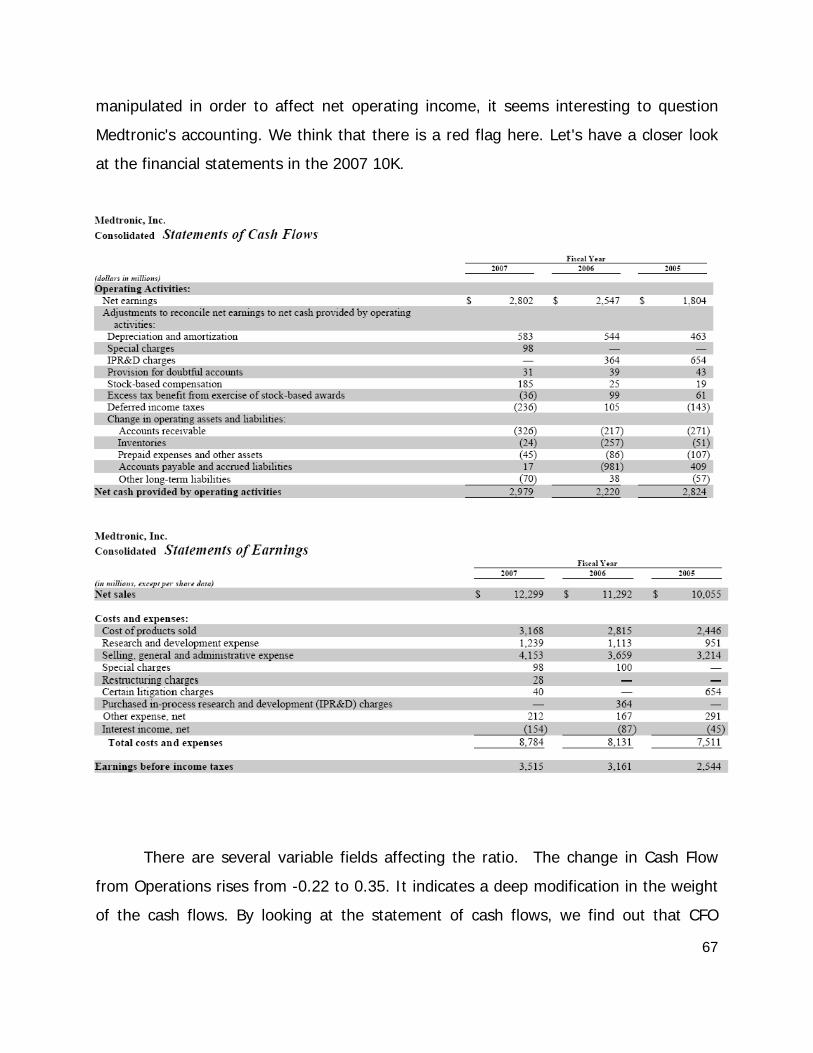
67
manipulated in order to affect net operating income, it seems interesting to question
Medtronic's accounting. We think that there is a red flag here. Let's have a closer look
at the financial statements in the 2007 10K.
There are several variable fields affecting the ratio. The change in Cash Flow
from Operations rises from -0.22 to 0.35. It indicates a deep modification in the weight
of the cash flows. By looking at the statement of cash flows, we find out that CFO
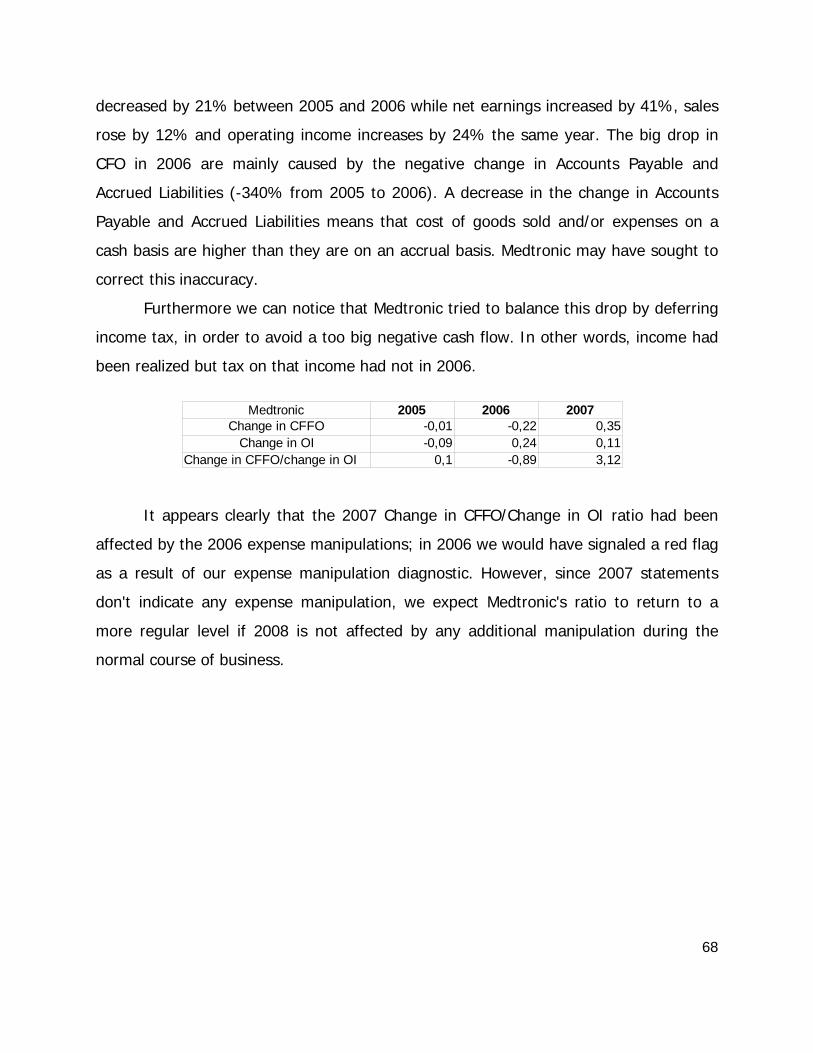
68
decreased by 21% between 2005 and 2006 while net earnings increased by 41%, sales
rose by 12% and operating income increases by 24% the same year. The big drop in
CFO in 2006 are mainly caused by the negative change in Accounts Payable and
Accrued Liabilities (-340% from 2005 to 2006). A decrease in the change in Accounts
Payable and Accrued Liabilities means that cost of goods sold and/or expenses on a
cash basis are higher than they are on an accrual basis. Medtronic may have sought to
correct this inaccuracy.
Furthermore we can notice that Medtronic tried to balance this drop by deferring
income tax, in order to avoid a too big negative cash flow. In other words, income had
been realized but tax on that income had not in 2006.
It appears clearly that the 2007 Change in CFFO/Change in OI ratio had been
affected by the 2006 expense manipulations; in 2006 we would have signaled a red flag
as a result of our expense manipulation diagnostic. However, since 2007 statements
don't indicate any expense manipulation, we expect Medtronic's ratio to return to a
more regular level if 2008 is not affected by any additional manipulation during the
normal course of business.
Medtronic 2005 2006 2007Change in CFFO -0,01 -0,22 0,35
Change in OI -0,09 0,24 0,11Change in CFFO/change in OI 0,1 -0,89 3,12
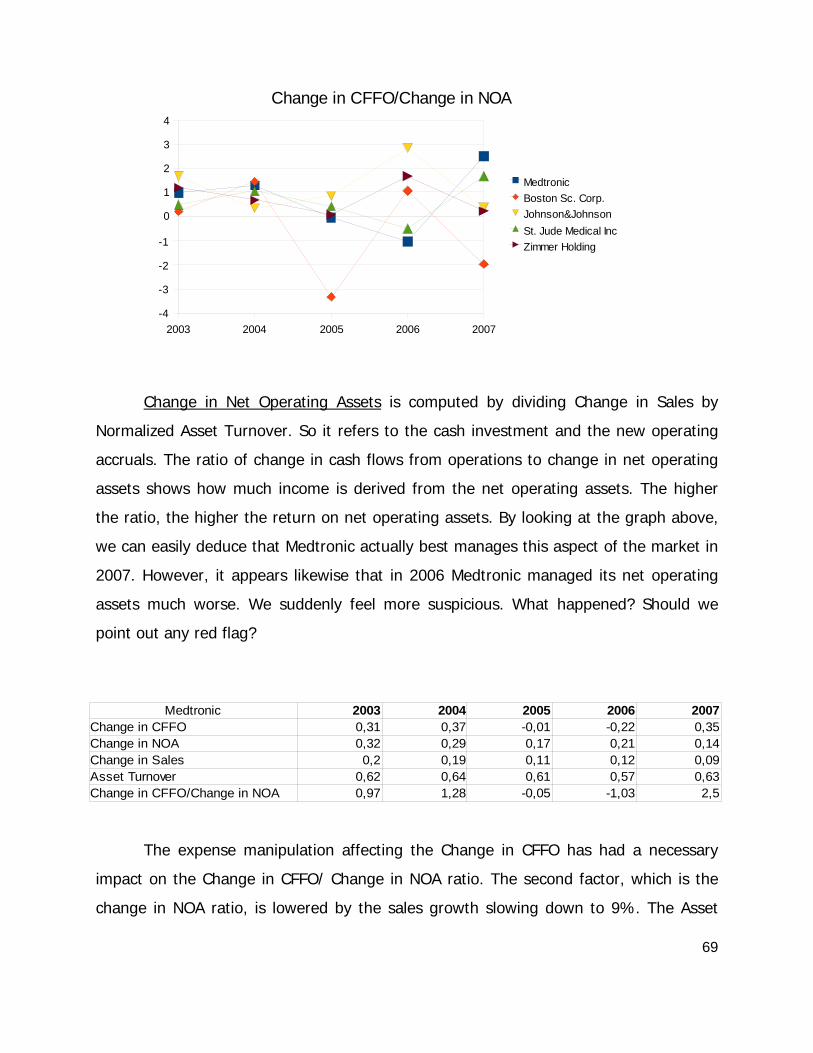
69
Change in Net Operating Assets is computed by dividing Change in Sales by
Normalized Asset Turnover. So it refers to the cash investment and the new operating
accruals. The ratio of change in cash flows from operations to change in net operating
assets shows how much income is derived from the net operating assets. The higher
the ratio, the higher the return on net operating assets. By looking at the graph above,
we can easily deduce that Medtronic actually best manages this aspect of the market in
2007. However, it appears likewise that in 2006 Medtronic managed its net operating
assets much worse. We suddenly feel more suspicious. What happened? Should we
point out any red flag?
The expense manipulation affecting the Change in CFFO has had a necessary
impact on the Change in CFFO/ Change in NOA ratio. The second factor, which is the
change in NOA ratio, is lowered by the sales growth slowing down to 9%. The Asset
2003 2004 2005 2006 2007-4
-3
-2
-1
0
1
2
3
4
Change in CFFO/Change in NOA
MedtronicBoston Sc. Corp.Johnson&JohnsonSt. Jude Medical IncZimmer Holding
Medtronic 2003 2004 2005 2006 2007Change in CFFO 0,31 0,37 -0,01 -0,22 0,35Change in NOA 0,32 0,29 0,17 0,21 0,14Change in Sales 0,2 0,19 0,11 0,12 0,09Asset Turnover 0,62 0,64 0,61 0,57 0,63Change in CFFO/Change in NOA 0,97 1,28 -0,05 -1,03 2,5
70
Turnover remaining quite constant over the past five years has had very few impacts on
the latter. As a result, we don't have any doubt about the irregular trend of the Change
in CFFO/change in NOA ratio since we can explain it by the impact of the 2006 CFFO
manipulation and by the decrease in the sales growth rate. Therefore we don't see any
additional expenses manipulation.
Conclusion
So far we can conclude that there is no obvious anomaly to investigate in these
graphs. Here ups and downs look to be in the normal course of business. It does not
appear that Medtronic could have manipulated its expenses. The overall expenses
manipulation diagnostic gives a very favorable image of Medtronic.
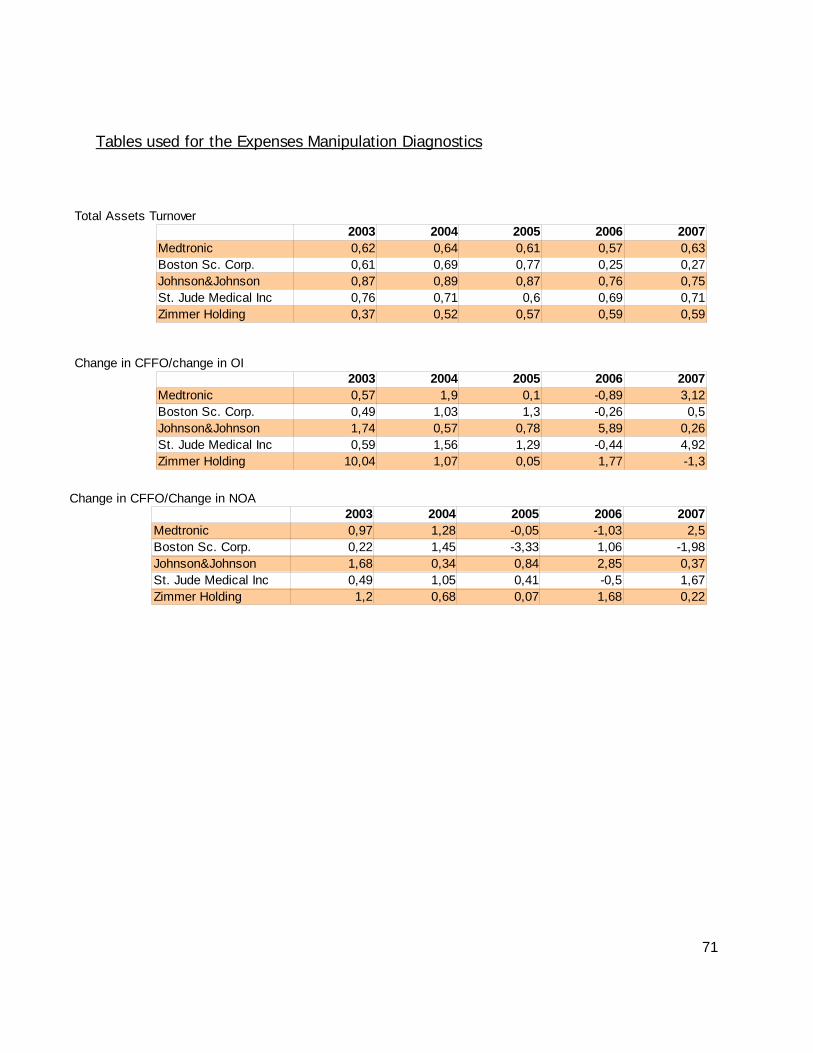
71
Tables used for the Expenses Manipulation Diagnostics
Total Assets Turnover 2003 2004 2005 2006 2007
Medtronic 0,62 0,64 0,61 0,57 0,63Boston Sc. Corp. 0,61 0,69 0,77 0,25 0,27Johnson&Johnson 0,87 0,89 0,87 0,76 0,75St. Jude Medical Inc 0,76 0,71 0,6 0,69 0,71Zimmer Holding 0,37 0,52 0,57 0,59 0,59
Change in CFFO/change in OI2003 2004 2005 2006 2007
Medtronic 0,57 1,9 0,1 -0,89 3,12Boston Sc. Corp. 0,49 1,03 1,3 -0,26 0,5Johnson&Johnson 1,74 0,57 0,78 5,89 0,26St. Jude Medical Inc 0,59 1,56 1,29 -0,44 4,92Zimmer Holding 10,04 1,07 0,05 1,77 -1,3
Change in CFFO/Change in NOA2003 2004 2005 2006 2007
Medtronic 0,97 1,28 -0,05 -1,03 2,5Boston Sc. Corp. 0,22 1,45 -3,33 1,06 -1,98Johnson&Johnson 1,68 0,34 0,84 2,85 0,37St. Jude Medical Inc 0,49 1,05 0,41 -0,5 1,67Zimmer Holding 1,2 0,68 0,07 1,68 0,22
72
Potential “Red Flags”
Here we consider any manipulation of information that could create accounting
distortion. Indeed, questionable accounting should be emphasized when there are red
flags. We have already carried out the revenues and expense manipulation diagnostics.
We did not find any revenues manipulation, but we have identified a distortion in the
2006 Statements of Cash Flows. The impacts of this distortion are still misleading
investors and analysts in their backward-looking opinion about Medtronic. However, the
2007 statement of Cash Flows does not show any distortion. So now let's examine more
closely other parts of the 10-K that have not been already discussed and that could
provide misleading information about Medtronic's financial statements.
Foreign exchange derivative contracts
Due to the strong exposure to foreign currency fluctuations in the global market
Medtronic deals with, the company tries to minimize earnings and cash flow volatility by
buying foreign exchange derivative contracts. They own $5.372 million of foreign
currency contracts outstanding to date; the fair value of these contracts at April 27,
2007 was 125 million less than the original contract value. But none of them is actually
reported in any statement, it is only reflected as a contractual obligations related to off-
balance sheet arrangement. The reason provided to explain this inaccuracy relies upon
the fact that these obligations would be offset by losses/gains on the related assets,
liabilities and transactions being hedged. Nevertheless, to be more accurate, we need to
make the adjustments into the balance sheet as long term liabilities now.
73
Operating Leases
Furthermore, Medtronic has some capital leases which equate to approximately
$89 million at present value, according to information disclosed in their 2007 10-K. But
they do not recognize operating leases of $193 million on their balance sheet as they
should do. As operating leases reflect future contractual obligations, their payment
cannot be avoided or canceled, so it must be a part of the liabilities, as well as a part of
their asset. Some of their operating leases require future payments such as real estate
taxes, insurance, maintenance and other operating expenses associated with the leased
premised that are not included in the $193 million. This is not an important red flag as
the value is not is not significant compared to the overall value of the firm, but it must
be mentioned.
Other contractual obligations
Moreover, Medtronic reports inventory purchase commitments of $621 million in
an off-balance sheet arrangement. They need to be adjusted as a part of the long term
liabilities for the balance sheet to be more accurate and also to reflect the Medtronic's
true financial position. In addition, the company doesn't reflect on the balance sheet
other obligations like commitments to replace their existing legacy enterprise resource
systems and to construct their new Cardiac Rhythm Disease Management (CRDM)
campus. Putting it all together, it equals $383 million.
74
Warranty liabilities
As we don’t have so much information about warranty liabilities and warranty
reserves, it is hard to explain why Medtronic decreased its warranty liabilities when
sales are steadily growing. But we think that a red flag should be set here. Warranty
liabilities could have been overestimated, and then as it is a future expense, expenses
could be overestimated, net earnings underestimated and as a result equity could be
underestimated as well, this is without any impact on assets.
Adjusting accounting distortions
Accounting distortions can appear in many different forms. Distortions are most
likely to arise in areas that have a significant impact on liquidity, profitability, or capital
structure. Medtronic’s industry has specific characteristics that help the analyst focus in
on areas of importance. The healthcare equipment industry has a unique competitive
structure similar to the computer technology industry. In both industries, heavy
investment in research and development is essential. But, unlike defense and
aeronautics, R & D is not pursued in hopes of creating drastic product differentiation.
Instead companies must develop new technology to meet industry standards.
Competition for price sensitive consumers is the focus, but continuing advances in
technology are necessary. This highlights the importance of intangible assets.
Medtronic‘s combined intangibles account for nearly 30% of total assets, 29.52% to be
exact. Medtronic follows GAAP standards by expensing all internal R & D expenditures.
The capitalization of such expenditures could have a drastic effect on net income and,
in turn, the accurate valuation of the firm.
75
R&D Capitalization
There are a few important steps to accurately assessing the effect of R & D
capitalization. First a rate of intangible depreciation should be derived to predict
depreciation expense. We will estimate this rate by averaging the rate of depreciation
used on amortizable intangibles over the last few years. The next step is finding a rate
that accurately predicts changes in R & D expenditures for prior and future periods. We
will do this by averaging changes in internal R & D expense over the last 5 years. We
will make sure this rate is consistent with actual expenditures incurred in historical
periods by measuring the difference in reported numbers and numbers predicted by our
expenditure growth model. We will then use both of these rates to correct accounting
distortions, specifically noting their effects on net income and cost growth.
Medtronic depreciates all of its intangibles on a straight line basis over the
duration of their useful life. The firm estimates useful life, according to their 10-k,
anywhere between 3 and 20 years. Since there is no logical way to assign a useful life
to the future gains of R & D expenditures, we feel that using the average rate of
depreciation on intangibles over the last few years, using that rate to determine initial
depreciation for prior expenses and subtracting that value on a straight line basis, will
give a more accurate figure. The carrying value of total amortizable intangibles at the
beginning of ‘06 and ‘07 is 1767 and 1615, respectively. This gives an average
intangible balance of 1691, prior to amortization. Amortization expense for ‘06 was 175
and expense for ’07 was 182, giving and average expense of 178.5.
Computing amortization expense as a percentage of intangible carrying value
gives an average rate of 10.55%. We can use this rate to estimate depreciation
expense on capitalized R & D. This rate implies that R & D should amortize in full
between the 9th and 10th year after capitalization. The theoretical basis for an
amortization rate (accountants use the rate to match the expense with the periods in
which additional revenue is earned from the asset) should be able to explain the
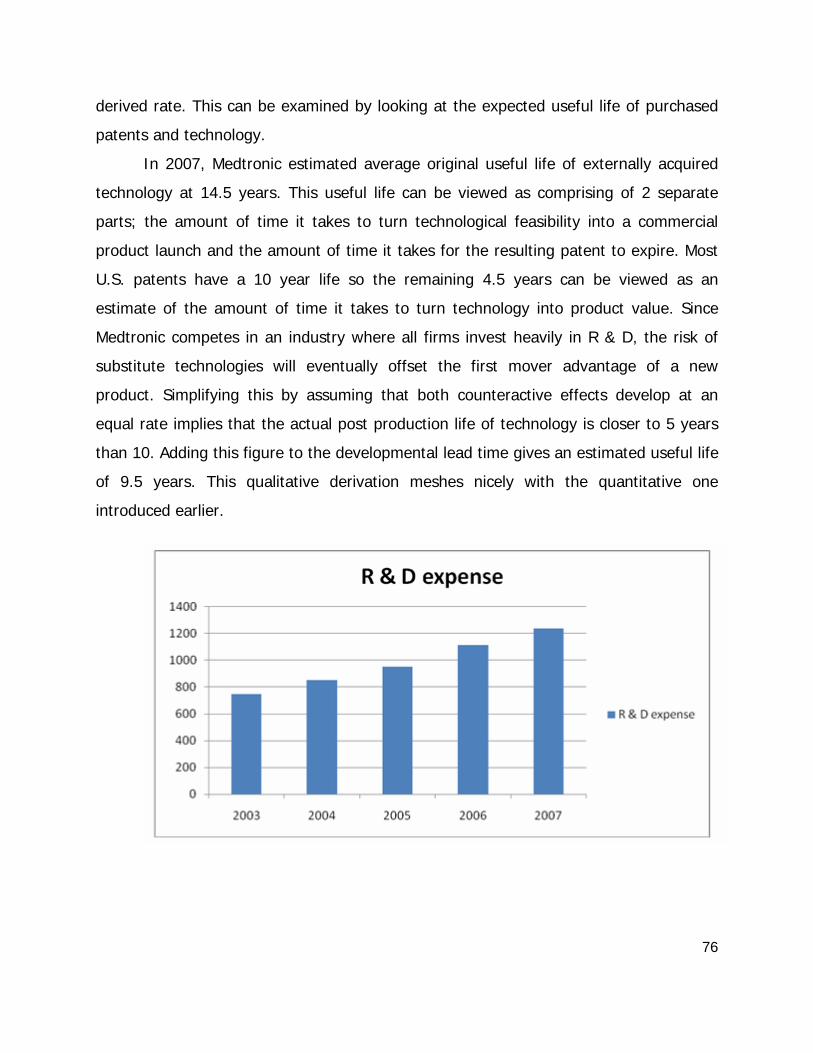
76
derived rate. This can be examined by looking at the expected useful life of purchased
patents and technology.
In 2007, Medtronic estimated average original useful life of externally acquired
technology at 14.5 years. This useful life can be viewed as comprising of 2 separate
parts; the amount of time it takes to turn technological feasibility into a commercial
product launch and the amount of time it takes for the resulting patent to expire. Most
U.S. patents have a 10 year life so the remaining 4.5 years can be viewed as an
estimate of the amount of time it takes to turn technology into product value. Since
Medtronic competes in an industry where all firms invest heavily in R & D, the risk of
substitute technologies will eventually offset the first mover advantage of a new
product. Simplifying this by assuming that both counteractive effects develop at an
equal rate implies that the actual post production life of technology is closer to 5 years
than 10. Adding this figure to the developmental lead time gives an estimated useful life
of 9.5 years. This qualitative derivation meshes nicely with the quantitative one
introduced earlier.
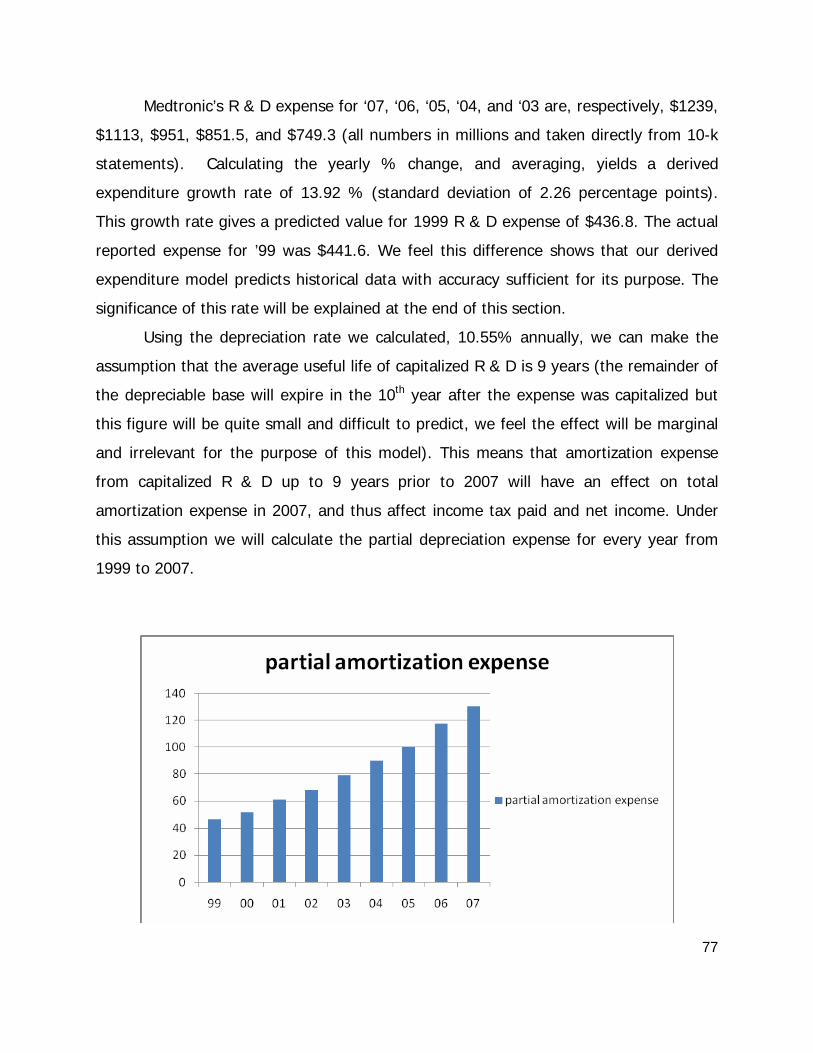
77
Medtronic’s R & D expense for ‘07, ‘06, ‘05, ‘04, and ‘03 are, respectively, $1239,
$1113, $951, $851.5, and $749.3 (all numbers in millions and taken directly from 10-k
statements). Calculating the yearly % change, and averaging, yields a derived
expenditure growth rate of 13.92 % (standard deviation of 2.26 percentage points).
This growth rate gives a predicted value for 1999 R & D expense of $436.8. The actual
reported expense for ’99 was $441.6. We feel this difference shows that our derived
expenditure model predicts historical data with accuracy sufficient for its purpose. The
significance of this rate will be explained at the end of this section.
Using the depreciation rate we calculated, 10.55% annually, we can make the
assumption that the average useful life of capitalized R & D is 9 years (the remainder of
the depreciable base will expire in the 10th year after the expense was capitalized but
this figure will be quite small and difficult to predict, we feel the effect will be marginal
and irrelevant for the purpose of this model). This means that amortization expense
from capitalized R & D up to 9 years prior to 2007 will have an effect on total
amortization expense in 2007, and thus affect income tax paid and net income. Under
this assumption we will calculate the partial depreciation expense for every year from
1999 to 2007.
78
Calculating amortization expense for years ’99-’07, multiplying R & D expense by
10.55%, gives values of $46.6, $51.5, $60.9, $68.2, $79.1, $89.8, $100.3, $117.4, and
$130.7 (respectively, using historical numbers with results rounded to the nearest
tenth). The sum of these values gives the estimated amount of total amortization
expense incurred in 2007. This value is $744.5.
In 2007, R & D expense was listed at $1239. If this amount was in fact
capitalized as an amortizable intangible, then expenses were overstated by $494.5
million ($1239-$744.5=$494.5). Subtracting the overstatement from total cost yields a
restated total cost of $8289.5 (Total reported cost, $8784, minus overstated cost,
$494.5, equals restated cost, $8289.5). After deriving Total Cost and EBIT, we
calculated the applicable tax rates for each year. This resulted in an after tax
adjustment to NI of $394.16. The calculations were performed for the years 2002 to
2007 (see appendix). Our results showed that as the tax rate stabilized, the effect of
capitalizing R&D was an approximate 14% increase in NI.
This is where the importance of calculating the average growth rate of R & D
expenditures becomes apparent. As calculated previously, Medtronic’s R & D expense
grew at a rate of about 14 %( 13.92% to be exact). This 14% change is the driver
behind the proportionate increase in net income compared to reported net income via
10-k. Based on this information, we can conclude that as long as net sales increase at a
stable rate consistent with historical growth and expenses not associated with R & D
increase at a proportional rate (a rate consistent with historical cost growth), assuming
the tax rate remains around 20%, the net effect of capitalizing R & D expense will be
an approximate 14% increase in net income(as compared to net income when R & D is
expensed). This principle has wider applications. The effect of capitalizing and
amortizing an expense, all else equal (or more specifically, all else proportional) does
not depend on the rate of depreciation or useful life of the asset, assuming a straight
line amortization model, but on the constant growth rate of the capitalized expense.
79
This fact will make forecasting future financial statements much more efficient if we
want to see the effect a specific change in accounting policy would produce.
To create an adjusted income statement, we replaced R&D expense with R&D
amortization. We then calculated the appropriate changes to total expenditures, income
tax, etc. To create an adjusted balance sheet, we added a line item for net capitalized
R&D. We then created a deferred tax liability by multiplying accumulated capitalized
R&D by the tax rate. The remainder of the balance needed to equate Assets with
Liabilities + Equity was added to stockholders equity. The ratios of earnings per were
adjusted accordingly.
Legal Contingencies
Another common distortion in accounting involves the assessment of legal
contingencies. Currently, Medtronic is in the midst of a FDA recall of Internal Cardiac
Defibrillators equipped with Fidelis brand lead wires. These wires have been linked to
painful and potentially life threatening shocks. According to Gordon Gibb, a writer for
‘Lawyersandsettlements.com’, these faulty leads have led to 5 reported deaths. The
impact of this lawsuit was known in 2006 when class action suits were filed against
Medtronic. These suits resulted in the recall but Medtronic, in compliance with GAAP
standards that don’t require listing a contingency until the loss can be accurately
estimated, did not list any contingency on its books. To properly asses the value of the
firm, a portion of the expense should be realized in 2007. To do this the analyst should
attempt to estimate the amount of liability and determine how much of this liability
should be expensed in 2007.
According to FDA press release, the faulty leads could affect as many as 235,000
patients. According to Medtronic, the firm has estimated that 5000 of these leads will
fail within 30 months. Medtronic has agreed to replace the unit, at an average cost of
20,000, and pay for 800 in related medical expense. In 2005 a similar product recall
affecting up to 87,000 patients resulted in certain litigation expense of $654 million.
80
Even though these numbers could be the used as the basis of a liability estimate, we
don’t think that either would give an accurate result because of the uncertainty and
volatility of the new case (new claimants are emerging and the effect is unclear).
Luckily, as analysts, we are able to have some hindsight into the estimate. Medtronic
reported a 40 million dollar legal contingency expense in 2007 but none of the figure
dealt with liabilities associated with the recall (the expense was the result of a law suit
regarding fraudulent practices in the sales and marketing departments).
Looking into quarterly reports for 2008 showed that Medtronic did not list any
new legal contingencies until its most recent 3rd quarter filling. This delayed reporting
could signal problems in itself but even more troubling is that the firm valued the
contingency at $366 million. With our ability to give an accurate estimate to the
expense, we can retroactively use this value to better allocate the expense to the period
it was incurred. To mitigate the loss associated with such a large expense we will
allocate half of the value to 2007 and the rest will be taken in 2008. 2008 has been a
rough year for the healthcare sector and the redistribution of the loss could be seen as
a way to compensate for the ‘Big Bath’ style write down that might appear on
Medtronic’s pending 2008 10-k. Companies involved in continuing legal proceedings
often use this technique, writing off portions of expected debt before the expense is
incurred, when faced with a substantial loss. Microsoft settled a long running legal
battle with the European Union in September for a record breaking $613 million, but
since Microsoft had been expensing portions of the liability for years the effect on their
2008 financials will not be substantial. Adding an additional $183 million in litigation
expense to 2007 (366 divided by 2) brings total certain litigation charges to $223 million
($183+ $40 million in reported expense). This results in a 2.5% increase in total
expenses bringing EBIT to $3292. Using the tax rate calculated in the previous R & D
capitalization, 20.28% brings net income to $2624.4 (3292*1-.2028). This 6.3% decline
in net income is significant and will help even out fluctuations in total cost reported in
2008. To show that this correction reports a more accurate net income, the effect of
the 2005 litigation expense reported above should be examined. In 2005, when $654
81
million in litigation expense was incurred, net income was $1804. In 2006, when no
contingent legal charges where listed, net income was $2547. This is an astounding
41.2% increase in net income. Simply looking at these numbers would give an investor
the impression that Medtronic had a stellar year. But, noting that net sales increased
by only 12.3% from ‘05 to ‘06 might tip off analysts to the true nature of the perceived
increase in net income. In fact, from ‘06 to ‘07 net sales increased by 9% while net
income increased by only 10%. This illustrates how the misappropriation of cost can
result in an inaccurate assessment of performance and growth in proceeding periods.
Amortization of Intangibles
The amortization of acquired intangibles is another area that can result in
accounting distortions. Since GAAP standards do not allow for internally created R & D
to be capitalized, it is common for firms involved in heavy investment to capitalize large
portions of intangibles when they can legally do so. This has many implications for firms
involved in acquisitions (one of the instances in which R & D can be capitalized).
Companies should make sure that the value of externally acquired intangibles (including
R & D, good will, etc.) is measured accurately. When there is doubt regarding the true
value, a conservative estimate should be used that links the value of the intangible to
future expected gains in revenue. This expected future gain can be ambiguous and
hard to pin point. Medtronic states, in its’ unaudited manager’s discussion for 2007, that
capitalized externally acquired R & D is expected to reach technological feasibility but
this does not insure commercial viability. It might be arbitrary for an analyst to make
judgments regarding the future value of intangibles. Still, looking into what percentage
of the acquisition price is allocated to intangibles could provide insight into the true
value of a firms acquired assets.
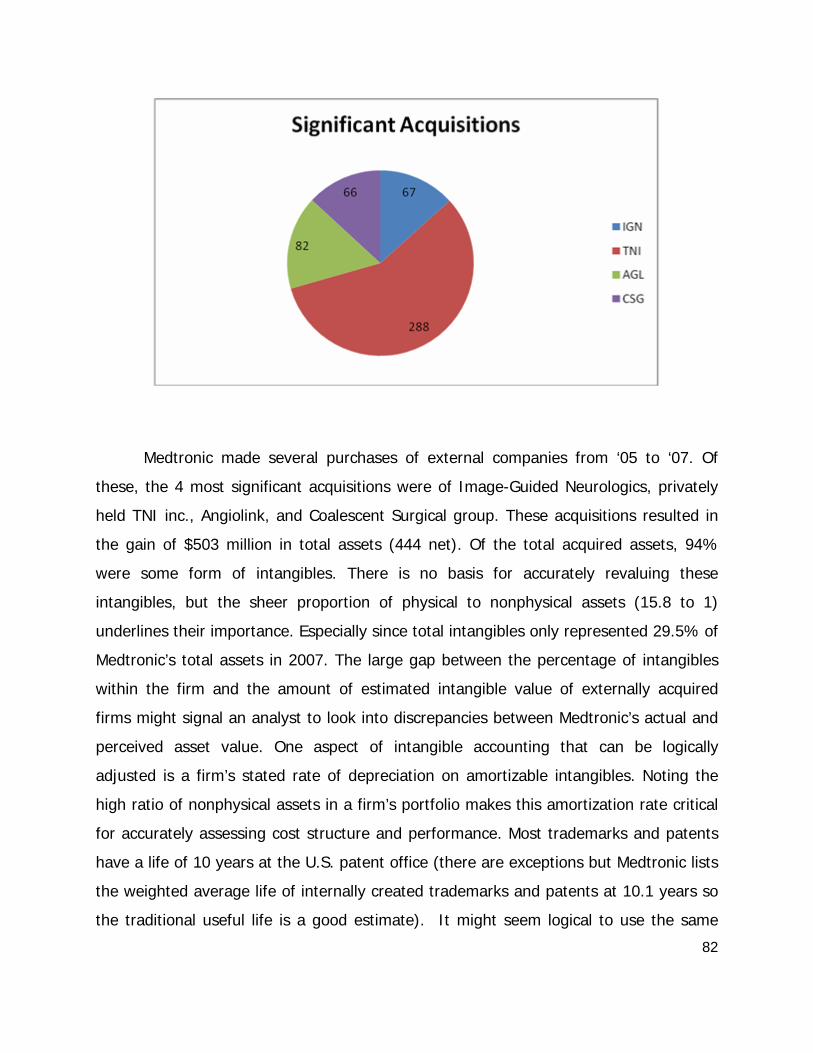
82
Medtronic made several purchases of external companies from ‘05 to ‘07. Of
these, the 4 most significant acquisitions were of Image-Guided Neurologics, privately
held TNI inc., Angiolink, and Coalescent Surgical group. These acquisitions resulted in
the gain of $503 million in total assets (444 net). Of the total acquired assets, 94%
were some form of intangibles. There is no basis for accurately revaluing these
intangibles, but the sheer proportion of physical to nonphysical assets (15.8 to 1)
underlines their importance. Especially since total intangibles only represented 29.5% of
Medtronic’s total assets in 2007. The large gap between the percentage of intangibles
within the firm and the amount of estimated intangible value of externally acquired
firms might signal an analyst to look into discrepancies between Medtronic’s actual and
perceived asset value. One aspect of intangible accounting that can be logically
adjusted is a firm’s stated rate of depreciation on amortizable intangibles. Noting the
high ratio of nonphysical assets in a firm’s portfolio makes this amortization rate critical
for accurately assessing cost structure and performance. Most trademarks and patents
have a life of 10 years at the U.S. patent office (there are exceptions but Medtronic lists
the weighted average life of internally created trademarks and patents at 10.1 years so
the traditional useful life is a good estimate). It might seem logical to use the same
83
depreciation rate for externally acquired intangibles as I did for internally created R &
D, but this would be a mistake. External patents and technology have a useful life that
is a combination of the life of the patent and the life of the research needed to develop
the patent (the two will most likely have some overlap). The life of capitalized R & D
should be shorter than that of acquired intangibles.
Instead, we will use the average life of purchased patents and technology for the
industry (specifically Medtronic’s major competitors; Johnson and Johnson, St. Jude
Medical, and Boston Scientific). To Medtronic’s credit, the only of the 3 major industry
competitors to list weighted average original life on its’ 10-k was Johnson and Johnson.
The reported original life of purchased technology and patents was 16 years. Deriving
the value for the other 2 firms took some calculation. Since both companies amortized
on a straight line basis we needed to calculate the amount of amortization associated
with newly acquired patents and technology; we did this by dividing the difference
between gross amortizable intangibles (less acquired goodwill) for ‘06 and ‘07 by the
difference in accumulated amortization associated with acquired patents and
technology.
For Boston Scientific this resulted in a 15.8 year average life; gross balance ‘07
($9809) - gross balance ‘06 (2110) =7699, accumulated amortization ‘07 (1157) –
accumulated amortization ‘06 (669) =488, 7699/488=15.8 years. This process was
repeated for St. Jude Medical yielding an average life of 14.9 years. All three of these
figures resulted in an industry average weighted average life of purchased patents and
technology of 15.6 years. This rate is very close to Medtronic’s reported useful life of
14.5 in 2007. The number could even be seen as slightly conservative based on
industry standards.
In conclusion, although Medtronic does seem to capitalize a large percentage of
acquired intangibles (in comparison to total assets acquired), their actions are
consistent with industry standards and there is no evidence that they have manipulated
the weighted average life of purchase patents and technology to maximize net income
or minimize total cost.
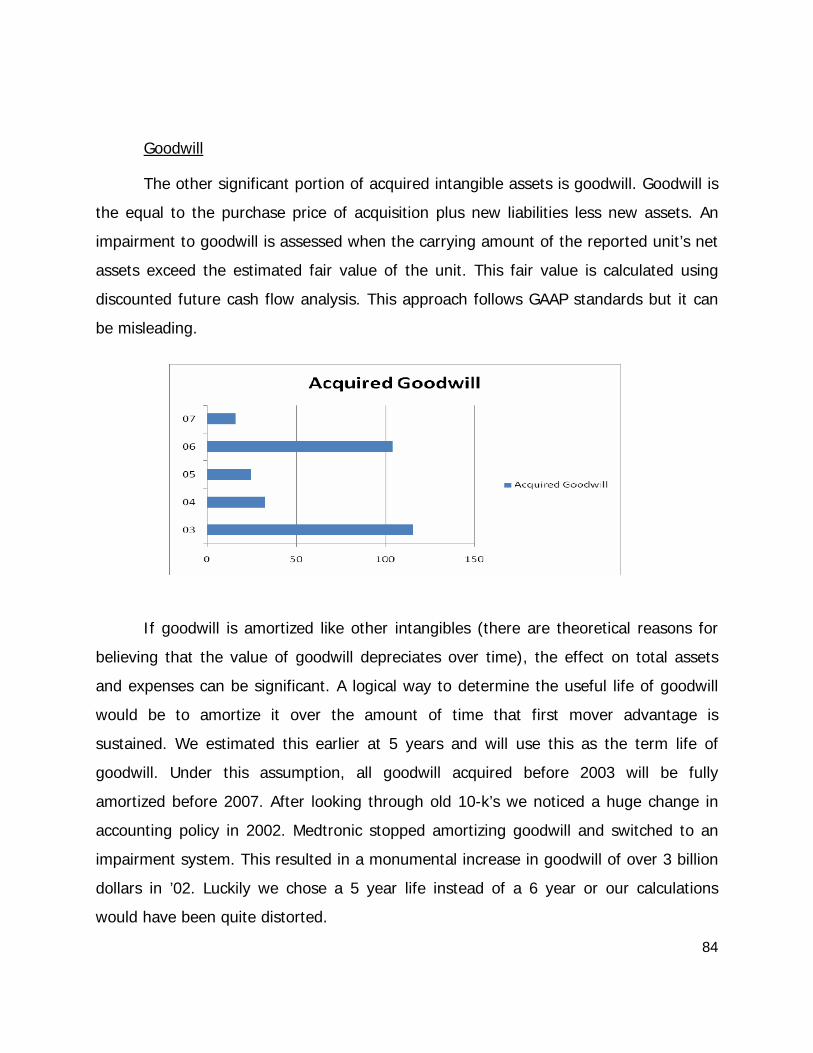
84
Goodwill
The other significant portion of acquired intangible assets is goodwill. Goodwill is
the equal to the purchase price of acquisition plus new liabilities less new assets. An
impairment to goodwill is assessed when the carrying amount of the reported unit’s net
assets exceed the estimated fair value of the unit. This fair value is calculated using
discounted future cash flow analysis. This approach follows GAAP standards but it can
be misleading.
If goodwill is amortized like other intangibles (there are theoretical reasons for
believing that the value of goodwill depreciates over time), the effect on total assets
and expenses can be significant. A logical way to determine the useful life of goodwill
would be to amortize it over the amount of time that first mover advantage is
sustained. We estimated this earlier at 5 years and will use this as the term life of
goodwill. Under this assumption, all goodwill acquired before 2003 will be fully
amortized before 2007. After looking through old 10-k’s we noticed a huge change in
accounting policy in 2002. Medtronic stopped amortizing goodwill and switched to an
impairment system. This resulted in a monumental increase in goodwill of over 3 billion
dollars in ’02. Luckily we chose a 5 year life instead of a 6 year or our calculations
would have been quite distorted.
85
To get amortization expense we will find the increase in goodwill as a result of
acquisition for years ’03 to ’07.
Each of these will contribute 20% of their value to total amortization expense.
This results in $58.6 million in goodwill amortization for 2007. Subtracting this from the
carrying value of goodwill equals and ending goodwill balance of $91.7 for ’07. The
reported balance, via 10-k, of goodwill was $4327, which results in a net change after
adjustment of $4254.3. This change is huge but a more realistic value might be
calculated by subtracting the $3036.3 million in goodwill acquired in 2002. This number
is the result of accounting changes and not physical acquisitions. This adjustment shifts
the net change to a more reasonable $1199. Goodwill has not been impaired since ’02
so the additional $58.6 in expenditures results in a total cost of $8842. This change in
total cost gives an EBIT of $3456.4 and a net income of $2755.4. This represents a
1.7% decrease in net income. Although the change is not very significant for net
income, the effect on the balance sheet is profound.
86
Financial Analysis, Forecasting Financials and Cost of Capital Estimation
Financial Analysis
In order to estimate and forecast the future financial value of Medtronic, we
need to compute and analyze several ratios. These ratios are classified into 3 different
categories and meet various needs. Liquidity ratios help determine the firm's ability to
pay off its short term obligations. It is commonly understood that a company with high
liquidity ratios has a wide margin of safety to cover its short-term obligations.
Profitability ratios are helpful to determine how profitable the firm's activities are. We
seek to know if the firm is efficiently using its assets and equity and we also use these
ratios analysis to compare the firm's productivity with the industry overall performance.
The other section, which deals with capital structure ratios, allows us to find out how
the firm is financing its activities. It can also reveal difficulties related to debt pressure,
interest load or cash needs.
We have computed seventeen ratios for these three sections, plus two ratios
related to the growth capacities, the internal growth rate and the sustainable growth
rate. We have also used the Z-Score to gauge bankruptcy risk. All these ratios will help
us forecasting the future of Medtronic and its possible position among the medical
appliances industry. The more accurate the ratios are, the more helpful they will be for
our forecasting.
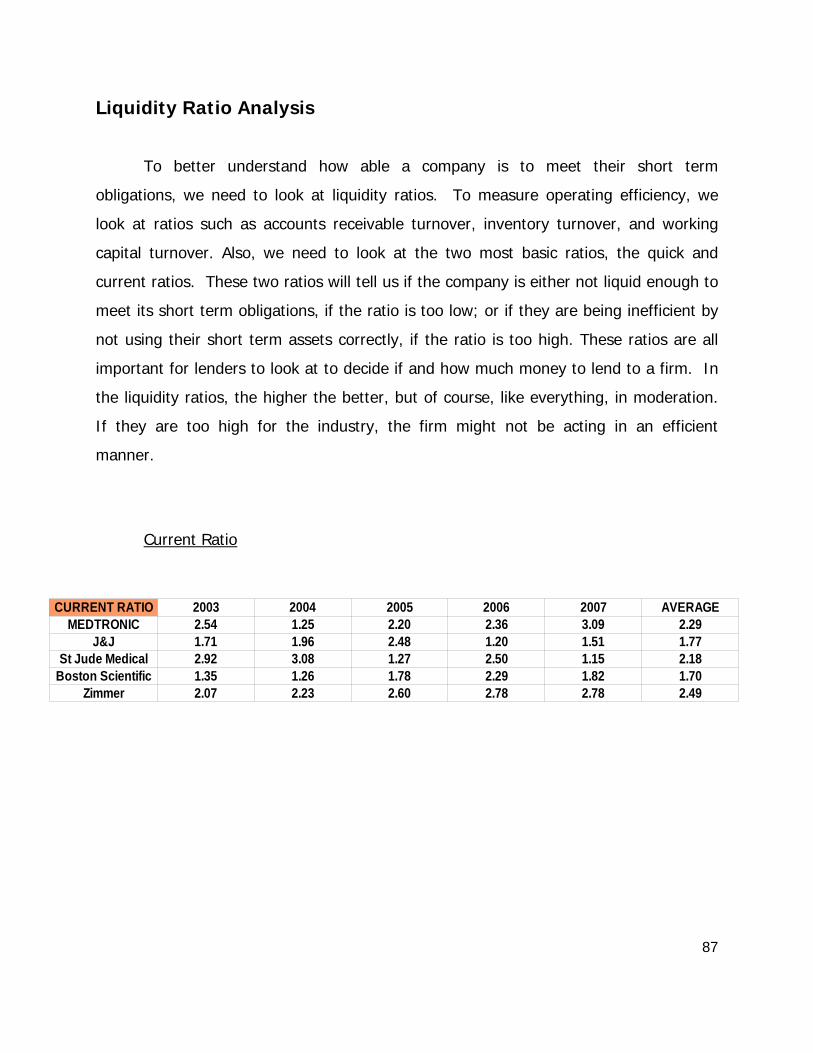
87
Liquidity Ratio Analysis
To better understand how able a company is to meet their short term
obligations, we need to look at liquidity ratios. To measure operating efficiency, we
look at ratios such as accounts receivable turnover, inventory turnover, and working
capital turnover. Also, we need to look at the two most basic ratios, the quick and
current ratios. These two ratios will tell us if the company is either not liquid enough to
meet its short term obligations, if the ratio is too low; or if they are being inefficient by
not using their short term assets correctly, if the ratio is too high. These ratios are all
important for lenders to look at to decide if and how much money to lend to a firm. In
the liquidity ratios, the higher the better, but of course, like everything, in moderation.
If they are too high for the industry, the firm might not be acting in an efficient
manner.
Current Ratio
CURRENT RATIO 2003 2004 2005 2006 2007 AVERAGEMEDTRONIC 2.54 1.25 2.20 2.36 3.09 2.29
J&J 1.71 1.96 2.48 1.20 1.51 1.77St Jude Medical 2.92 3.08 1.27 2.50 1.15 2.18
Boston Scientific 1.35 1.26 1.78 2.29 1.82 1.70Zimmer 2.07 2.23 2.60 2.78 2.78 2.49
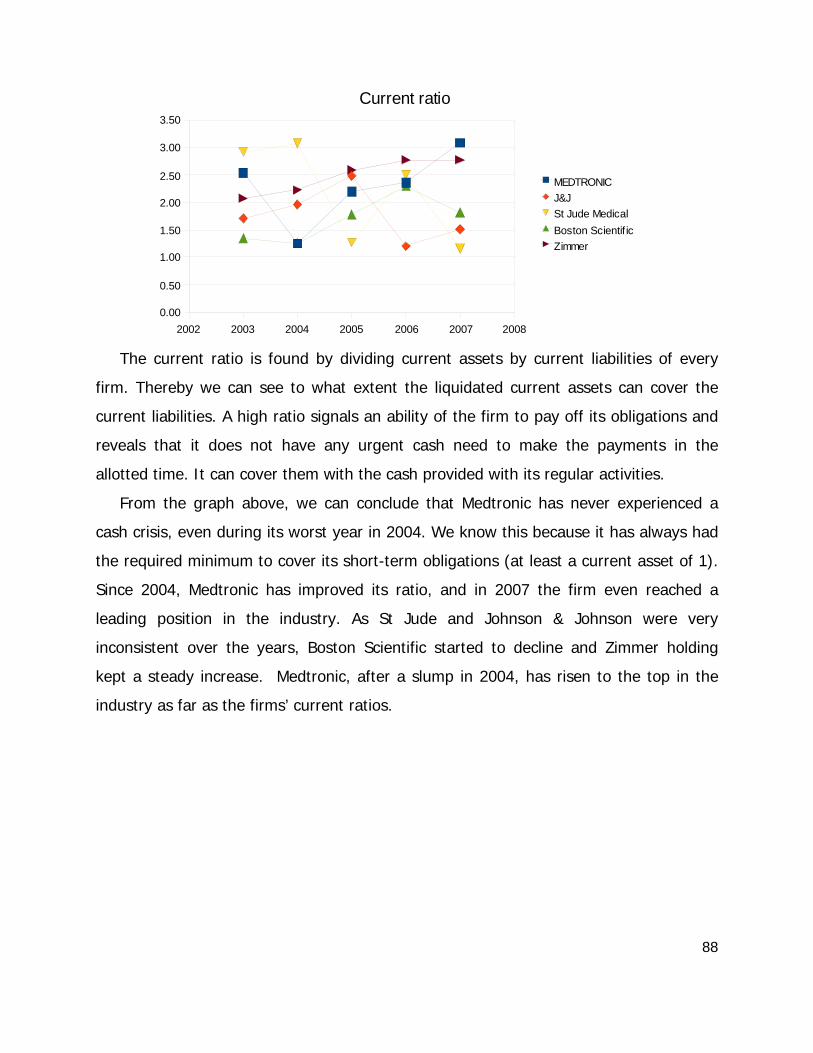
88
The current ratio is found by dividing current assets by current liabilities of every
firm. Thereby we can see to what extent the liquidated current assets can cover the
current liabilities. A high ratio signals an ability of the firm to pay off its obligations and
reveals that it does not have any urgent cash need to make the payments in the
allotted time. It can cover them with the cash provided with its regular activities.
From the graph above, we can conclude that Medtronic has never experienced a
cash crisis, even during its worst year in 2004. We know this because it has always had
the required minimum to cover its short-term obligations (at least a current asset of 1).
Since 2004, Medtronic has improved its ratio, and in 2007 the firm even reached a
leading position in the industry. As St Jude and Johnson & Johnson were very
inconsistent over the years, Boston Scientific started to decline and Zimmer holding
kept a steady increase. Medtronic, after a slump in 2004, has risen to the top in the
industry as far as the firms’ current ratios.
2002 2003 2004 2005 2006 2007 20080.00
0.50
1.00
1.50
2.00
2.50
3.00
3.50
Current ratio
MEDTRONICJ&JSt Jude MedicalBoston Scientif icZimmer
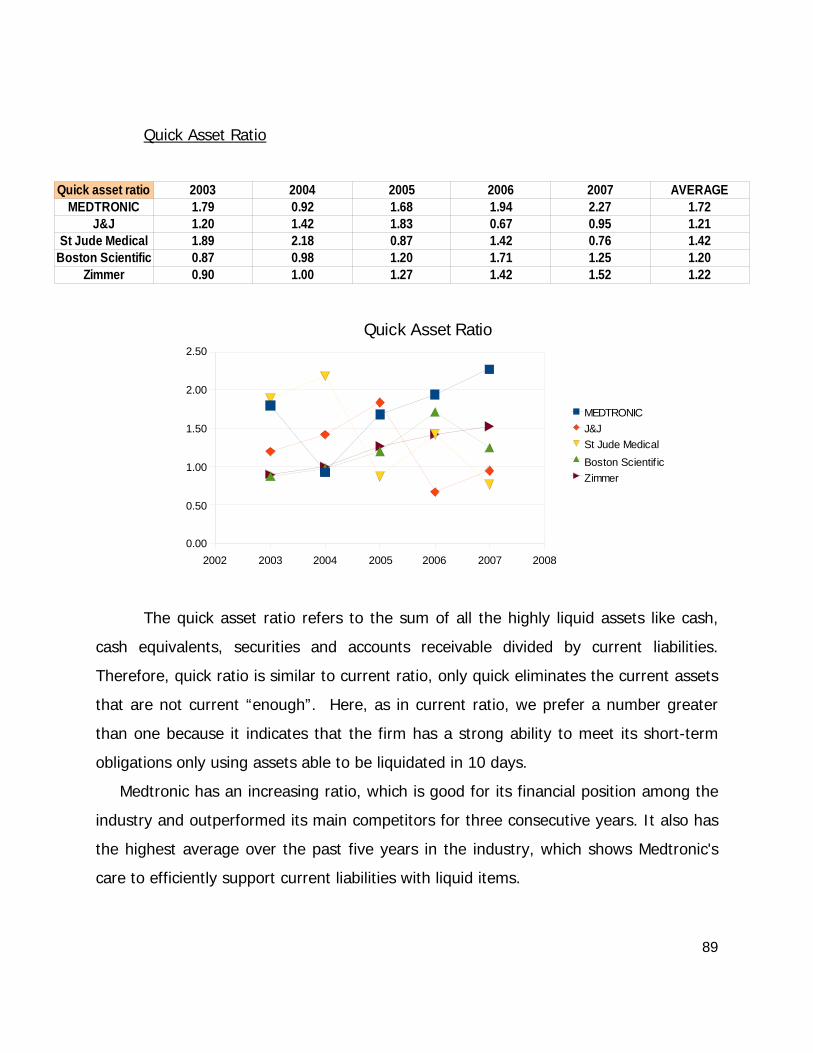
89
Quick Asset Ratio
The quick asset ratio refers to the sum of all the highly liquid assets like cash,
cash equivalents, securities and accounts receivable divided by current liabilities.
Therefore, quick ratio is similar to current ratio, only quick eliminates the current assets
that are not current “enough”. Here, as in current ratio, we prefer a number greater
than one because it indicates that the firm has a strong ability to meet its short-term
obligations only using assets able to be liquidated in 10 days.
Medtronic has an increasing ratio, which is good for its financial position among the
industry and outperformed its main competitors for three consecutive years. It also has
the highest average over the past five years in the industry, which shows Medtronic's
care to efficiently support current liabilities with liquid items.
Quick asset ratio 2003 2004 2005 2006 2007 AVERAGEMEDTRONIC 1.79 0.92 1.68 1.94 2.27 1.72
J&J 1.20 1.42 1.83 0.67 0.95 1.21St Jude Medical 1.89 2.18 0.87 1.42 0.76 1.42
Boston Scientific 0.87 0.98 1.20 1.71 1.25 1.20Zimmer 0.90 1.00 1.27 1.42 1.52 1.22
2002 2003 2004 2005 2006 2007 20080.00
0.50
1.00
1.50
2.00
2.50
Quick Asset Ratio
MEDTRONICJ&JSt Jude MedicalBoston Scientif icZimmer
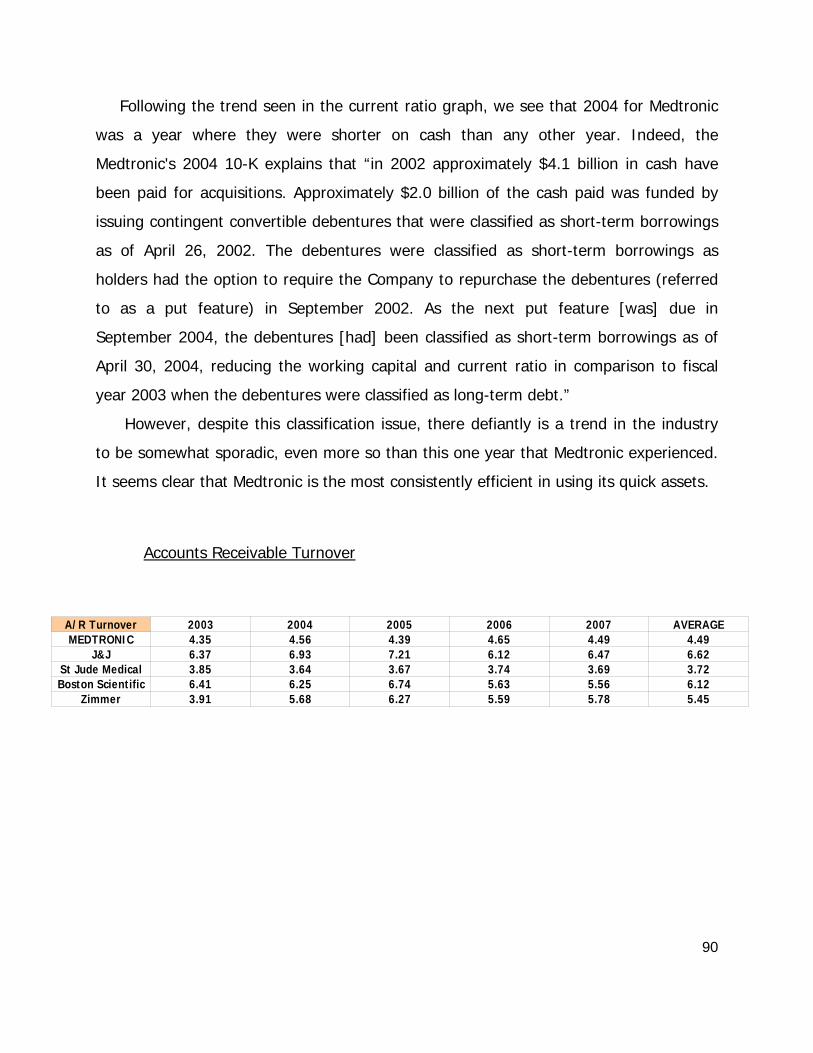
90
Following the trend seen in the current ratio graph, we see that 2004 for Medtronic
was a year where they were shorter on cash than any other year. Indeed, the
Medtronic's 2004 10-K explains that “in 2002 approximately $4.1 billion in cash have
been paid for acquisitions. Approximately $2.0 billion of the cash paid was funded by
issuing contingent convertible debentures that were classified as short-term borrowings
as of April 26, 2002. The debentures were classified as short-term borrowings as
holders had the option to require the Company to repurchase the debentures (referred
to as a put feature) in September 2002. As the next put feature [was] due in
September 2004, the debentures [had] been classified as short-term borrowings as of
April 30, 2004, reducing the working capital and current ratio in comparison to fiscal
year 2003 when the debentures were classified as long-term debt.”
However, despite this classification issue, there defiantly is a trend in the industry
to be somewhat sporadic, even more so than this one year that Medtronic experienced.
It seems clear that Medtronic is the most consistently efficient in using its quick assets.
Accounts Receivable Turnover
A/R Turnover 2003 2004 2005 2006 2007 AVERAGEMEDTRONIC 4.35 4.56 4.39 4.65 4.49 4.49
J&J 6.37 6.93 7.21 6.12 6.47 6.62St Jude Medical 3.85 3.64 3.67 3.74 3.69 3.72Boston Scientific 6.41 6.25 6.74 5.63 5.56 6.12
Zimmer 3.91 5.68 6.27 5.59 5.78 5.45
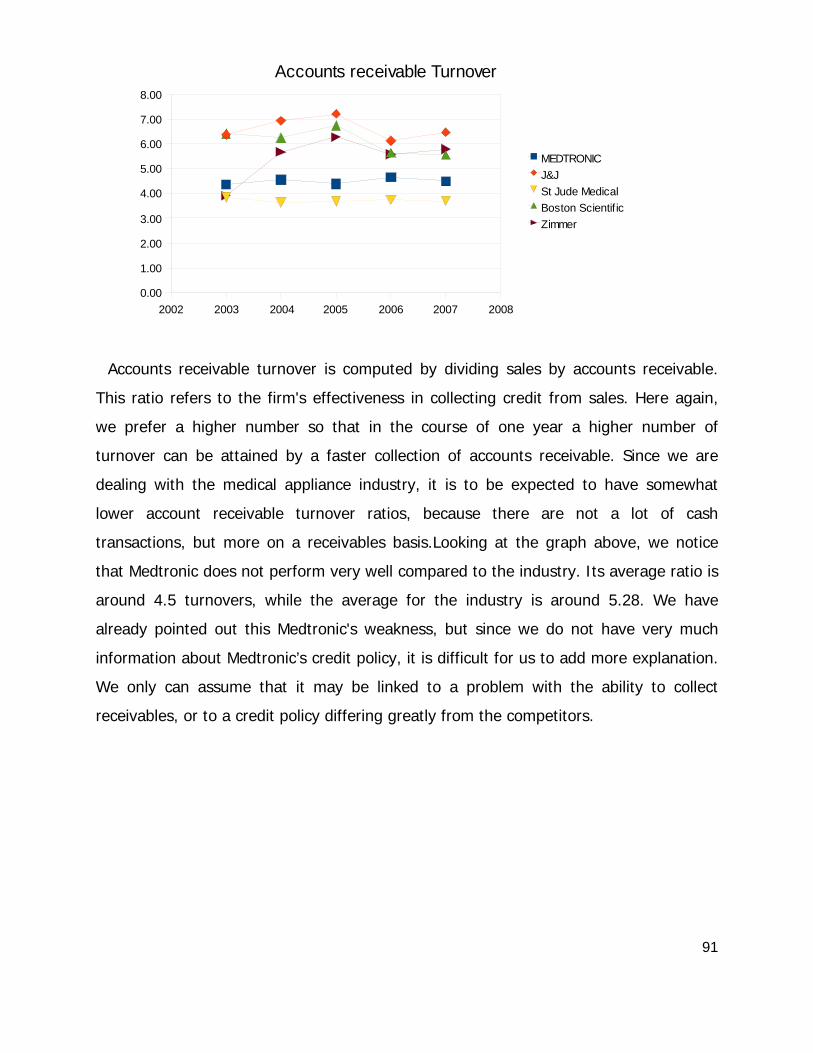
91
Accounts receivable turnover is computed by dividing sales by accounts receivable.
This ratio refers to the firm's effectiveness in collecting credit from sales. Here again,
we prefer a higher number so that in the course of one year a higher number of
turnover can be attained by a faster collection of accounts receivable. Since we are
dealing with the medical appliance industry, it is to be expected to have somewhat
lower account receivable turnover ratios, because there are not a lot of cash
transactions, but more on a receivables basis.Looking at the graph above, we notice
that Medtronic does not perform very well compared to the industry. Its average ratio is
around 4.5 turnovers, while the average for the industry is around 5.28. We have
already pointed out this Medtronic's weakness, but since we do not have very much
information about Medtronic’s credit policy, it is difficult for us to add more explanation.
We only can assume that it may be linked to a problem with the ability to collect
receivables, or to a credit policy differing greatly from the competitors.
2002 2003 2004 2005 2006 2007 20080.00
1.00
2.00
3.00
4.00
5.00
6.00
7.00
8.00
Accounts receivable Turnover
MEDTRONICJ&JSt Jude MedicalBoston Scientif icZimmer
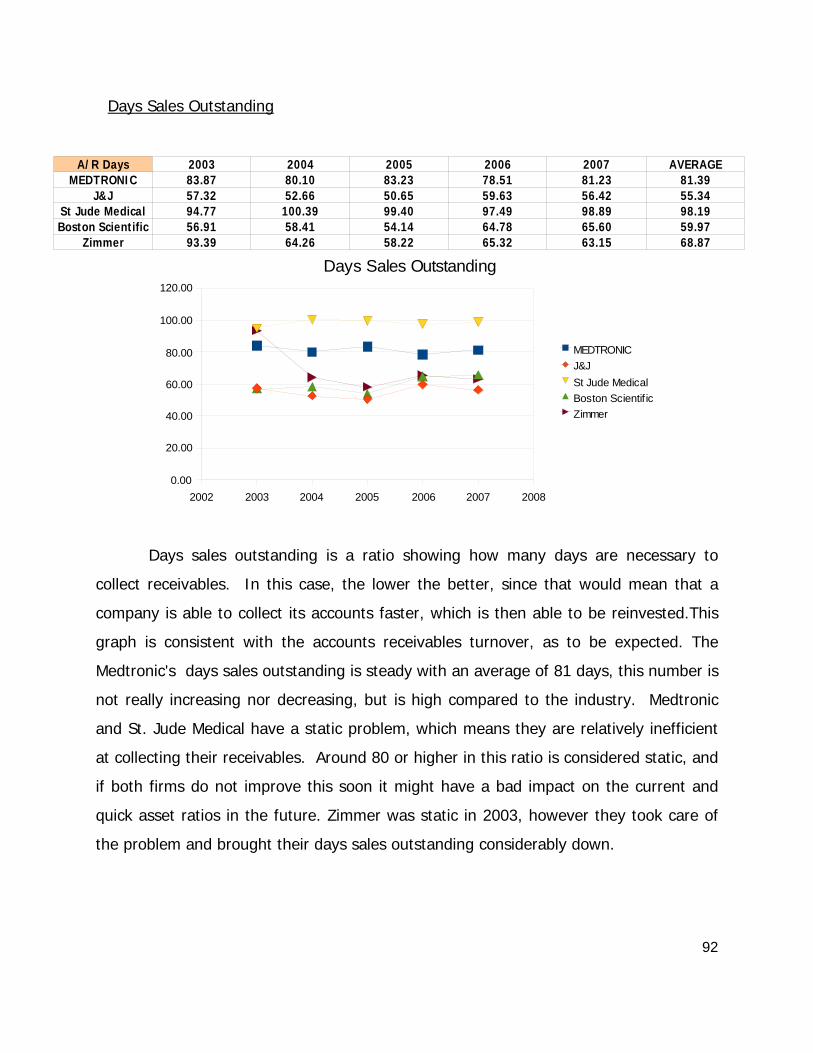
92
Days Sales Outstanding
Days sales outstanding is a ratio showing how many days are necessary to
collect receivables. In this case, the lower the better, since that would mean that a
company is able to collect its accounts faster, which is then able to be reinvested.This
graph is consistent with the accounts receivables turnover, as to be expected. The
Medtronic's days sales outstanding is steady with an average of 81 days, this number is
not really increasing nor decreasing, but is high compared to the industry. Medtronic
and St. Jude Medical have a static problem, which means they are relatively inefficient
at collecting their receivables. Around 80 or higher in this ratio is considered static, and
if both firms do not improve this soon it might have a bad impact on the current and
quick asset ratios in the future. Zimmer was static in 2003, however they took care of
the problem and brought their days sales outstanding considerably down.
A/R Days 2003 2004 2005 2006 2007 AVERAGEMEDTRONIC 83.87 80.10 83.23 78.51 81.23 81.39
J&J 57.32 52.66 50.65 59.63 56.42 55.34St Jude Medical 94.77 100.39 99.40 97.49 98.89 98.19Boston Scientific 56.91 58.41 54.14 64.78 65.60 59.97
Zimmer 93.39 64.26 58.22 65.32 63.15 68.87
2002 2003 2004 2005 2006 2007 20080.00
20.00
40.00
60.00
80.00
100.00
120.00
Days Sales Outstanding
MEDTRONICJ&JSt Jude MedicalBoston Scientif icZimmer
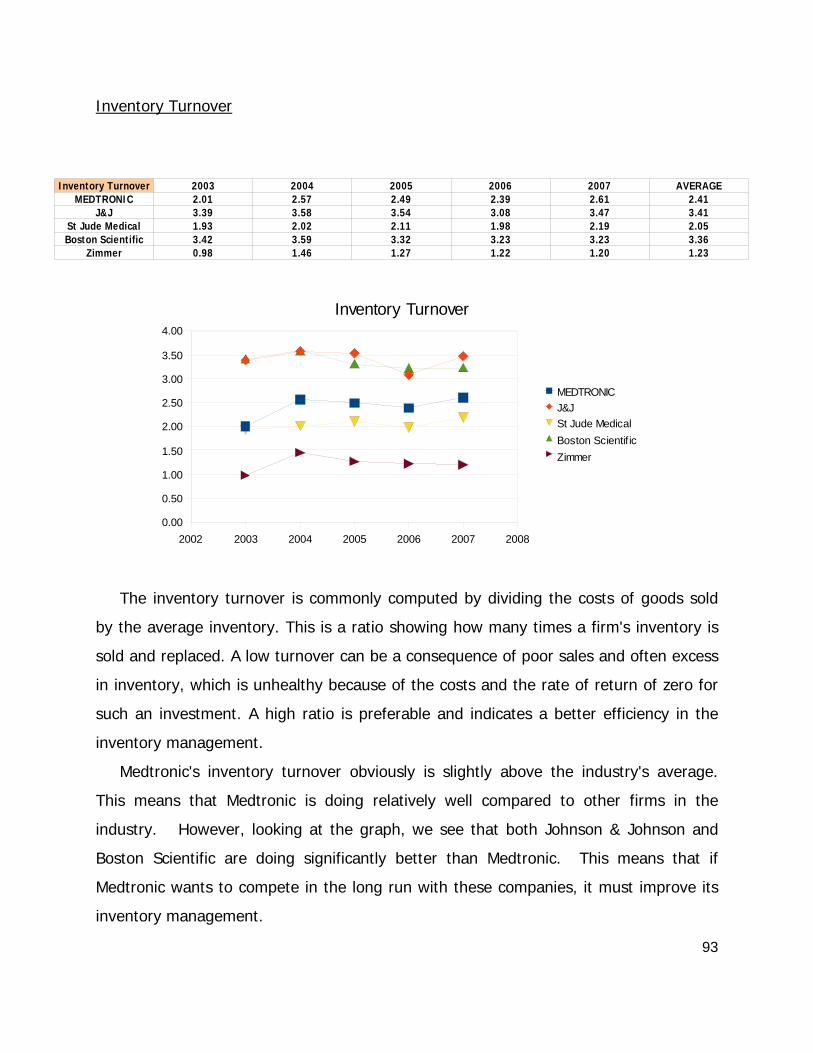
93
Inventory Turnover
The inventory turnover is commonly computed by dividing the costs of goods sold
by the average inventory. This is a ratio showing how many times a firm's inventory is
sold and replaced. A low turnover can be a consequence of poor sales and often excess
in inventory, which is unhealthy because of the costs and the rate of return of zero for
such an investment. A high ratio is preferable and indicates a better efficiency in the
inventory management.
Medtronic's inventory turnover obviously is slightly above the industry's average.
This means that Medtronic is doing relatively well compared to other firms in the
industry. However, looking at the graph, we see that both Johnson & Johnson and
Boston Scientific are doing significantly better than Medtronic. This means that if
Medtronic wants to compete in the long run with these companies, it must improve its
inventory management.
2002 2003 2004 2005 2006 2007 20080.00
0.50
1.00
1.50
2.00
2.50
3.00
3.50
4.00
Inventory Turnover
MEDTRONICJ&JSt Jude MedicalBoston Scientif icZimmer
Inventory Turnover 2003 2004 2005 2006 2007 AVERAGEMEDTRONIC 2.01 2.57 2.49 2.39 2.61 2.41
J&J 3.39 3.58 3.54 3.08 3.47 3.41St Jude Medical 1.93 2.02 2.11 1.98 2.19 2.05Boston Scientific 3.42 3.59 3.32 3.23 3.23 3.36
Zimmer 0.98 1.46 1.27 1.22 1.20 1.23
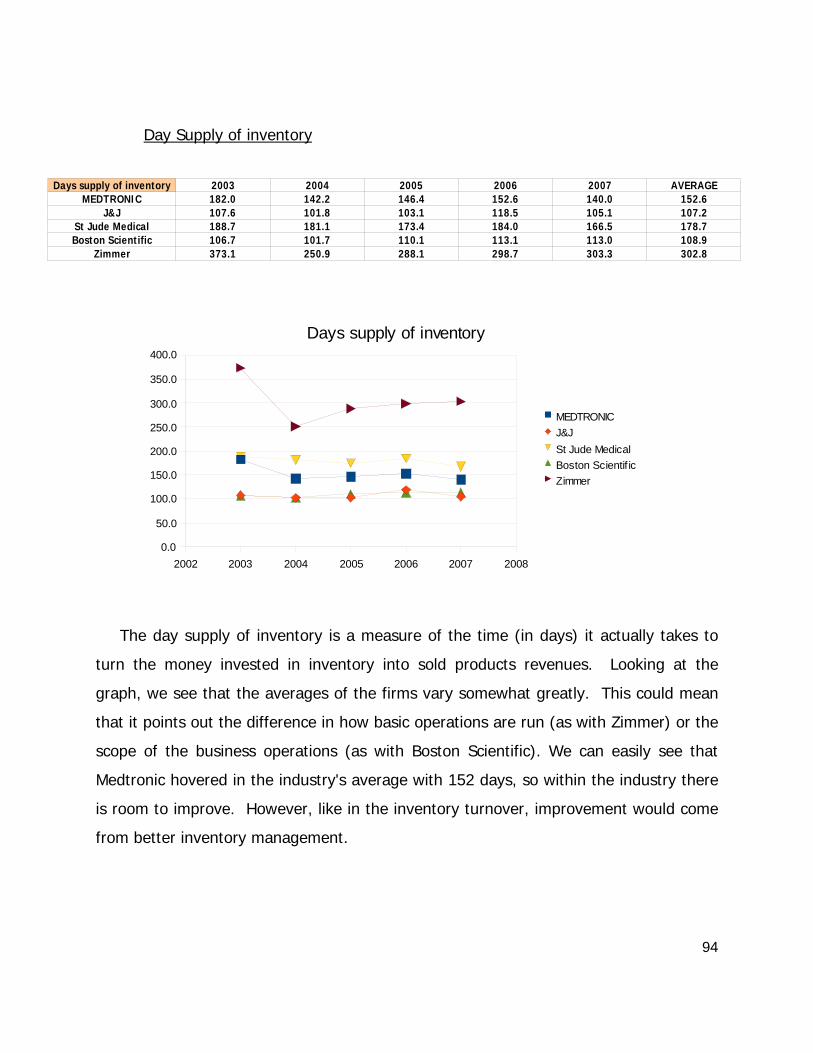
94
Day Supply of inventory
The day supply of inventory is a measure of the time (in days) it actually takes to
turn the money invested in inventory into sold products revenues. Looking at the
graph, we see that the averages of the firms vary somewhat greatly. This could mean
that it points out the difference in how basic operations are run (as with Zimmer) or the
scope of the business operations (as with Boston Scientific). We can easily see that
Medtronic hovered in the industry's average with 152 days, so within the industry there
is room to improve. However, like in the inventory turnover, improvement would come
from better inventory management.
Days supply of inventory 2003 2004 2005 2006 2007 AVERAGEMEDTRONIC 182.0 142.2 146.4 152.6 140.0 152.6
J&J 107.6 101.8 103.1 118.5 105.1 107.2St Jude Medical 188.7 181.1 173.4 184.0 166.5 178.7Boston Scientific 106.7 101.7 110.1 113.1 113.0 108.9
Zimmer 373.1 250.9 288.1 298.7 303.3 302.8
2002 2003 2004 2005 2006 2007 20080.0
50.0
100.0
150.0
200.0
250.0
300.0
350.0
400.0
Days supply of inventory
MEDTRONICJ&JSt Jude MedicalBoston Scientif icZimmer
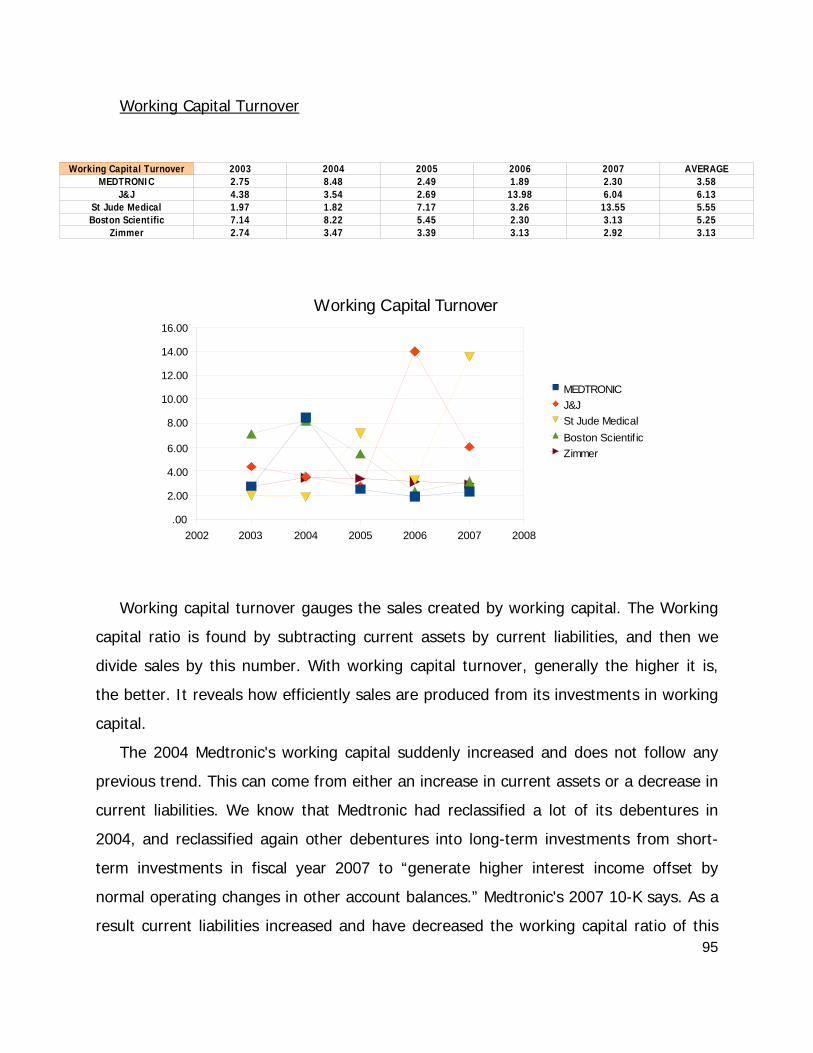
95
Working Capital Turnover
Working capital turnover gauges the sales created by working capital. The Working
capital ratio is found by subtracting current assets by current liabilities, and then we
divide sales by this number. With working capital turnover, generally the higher it is,
the better. It reveals how efficiently sales are produced from its investments in working
capital.
The 2004 Medtronic's working capital suddenly increased and does not follow any
previous trend. This can come from either an increase in current assets or a decrease in
current liabilities. We know that Medtronic had reclassified a lot of its debentures in
2004, and reclassified again other debentures into long-term investments from short-
term investments in fiscal year 2007 to “generate higher interest income offset by
normal operating changes in other account balances.” Medtronic's 2007 10-K says. As a
result current liabilities increased and have decreased the working capital ratio of this
Working Capital Turnover 2003 2004 2005 2006 2007 AVERAGEMEDTRONIC 2.75 8.48 2.49 1.89 2.30 3.58
J&J 4.38 3.54 2.69 13.98 6.04 6.13St Jude Medical 1.97 1.82 7.17 3.26 13.55 5.55Boston Scientific 7.14 8.22 5.45 2.30 3.13 5.25
Zimmer 2.74 3.47 3.39 3.13 2.92 3.13
2002 2003 2004 2005 2006 2007 2008.00
2.00
4.00
6.00
8.00
10.00
12.00
14.00
16.00
Working Capital Turnover
MEDTRONICJ&JSt Jude MedicalBoston Scientif icZimmer
96
fiscal year, giving a non-consistent high ratio. The decrease in our working capital
relates to our movement of cash. The following years show a turnover relatively
constant for Medtronic. Also, Medtronic's ratio follows a quite steady trend, which is
more or less similar to the Zimmer's trend and to Boston Scientifics’ trend over the last
two years. This allows us to think that we can determine a kind of industry's common
trend for companies having similar market capitalizations. Indeed Johnson & Johnson
and St Jude Medical Inc. respectively have bigger and smaller market capitalizations
and activities compared to the overall industry.
We can also see a relationship between the graphs: current ratio, quick asset ratio
and working capital turnover. While current ratio and quick asset ratio indicated a drop
in 2004 and then displayed a raising trend for the following years, working capital
turnover reflects exactly the opposite. Over the past two years, Medtronic's current
assets has went down by 23% because of a drop in cash, securities and other short-
term investments, which reflects the reclassification into long-term investments
explained above. Its current liabilities have dropped by 80% as a result of a drop in
short-term borrowings. We can attribute most of this drop to the reclassification of New
Debentures and some of the Old Debentures from short-term borrowings to long-term
debt as a result of the September 2006 put option expiring.
Medtronic is relatively underperforming the industry mainly because of these
reclassifications. 2004 was profitable for Medtronic to show a high ratio, but the 2007
reclassification has had a bad impact and does not help Medtronic look interesting to
amateur investors.
97
Conclusion
Medtronic’s current ratio was 2.29 for a five year average, which is above the
industry average, and so was its quick asset ratio. Medtronic’s account receivable
turnover did not meet up to the industry average, but to be fair a lot of this could be
chalked up to the vagueness of the information given by Medtronic, as well as other
firms in the industry. This same aspect will affect the day’s sales outstanding; however
it is clear that there needs to be improvement on Medtronic’s part since they are
currently static. Inventory turnover for Medtronic is slightly higher than the industry,
which gives us confidence in its liquidity, however taking Johnson & Johnson and
Boston Scientific as examples, there is room for improvement on this also. However,
knowing its weaknesses, Medtronic still does better overall than the industry in a
liquidity analysis, which builds investors confidence that it can meet its short term
obligations within the medical appliance industry.
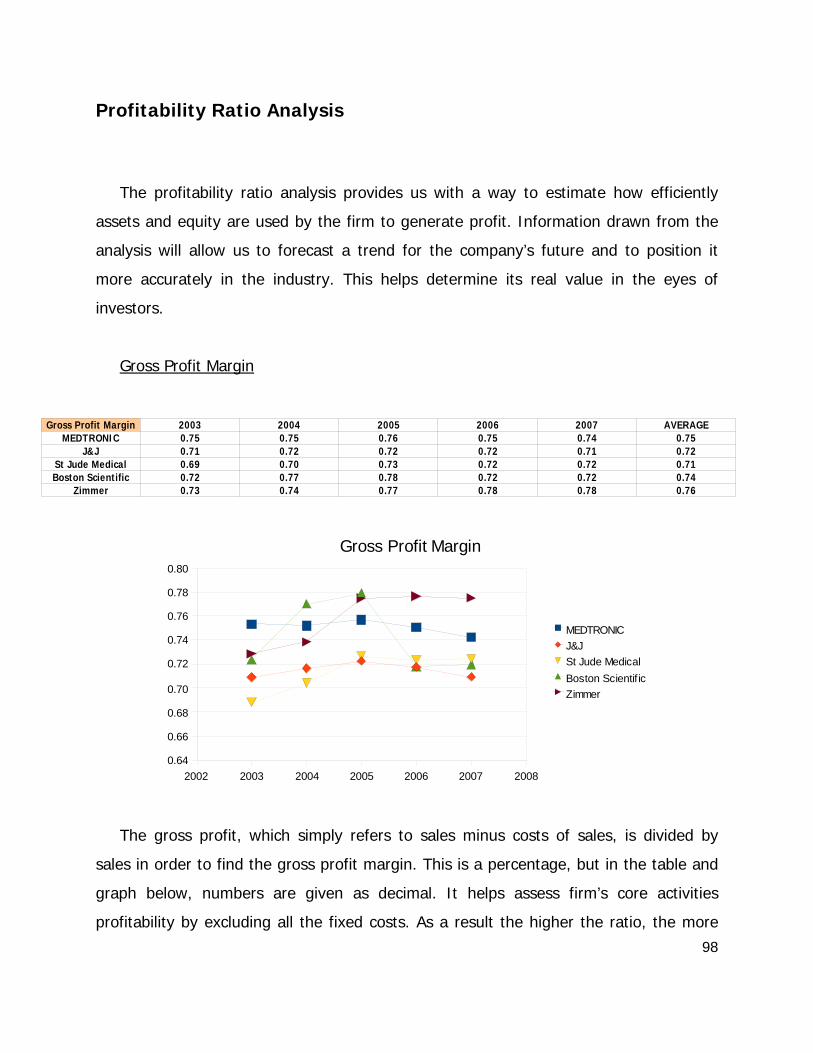
98
Profitability Ratio Analysis
The profitability ratio analysis provides us with a way to estimate how efficiently
assets and equity are used by the firm to generate profit. Information drawn from the
analysis will allow us to forecast a trend for the company’s future and to position it
more accurately in the industry. This helps determine its real value in the eyes of
investors.
Gross Profit Margin
The gross profit, which simply refers to sales minus costs of sales, is divided by
sales in order to find the gross profit margin. This is a percentage, but in the table and
graph below, numbers are given as decimal. It helps assess firm’s core activities
profitability by excluding all the fixed costs. As a result the higher the ratio, the more
2002 2003 2004 2005 2006 2007 20080.64
0.66
0.68
0.70
0.72
0.74
0.76
0.78
0.80
Gross Profit Margin
MEDTRONICJ&JSt Jude MedicalBoston Scientif icZimmer
Gross Profit Margin 2003 2004 2005 2006 2007 AVERAGEMEDTRONIC 0.75 0.75 0.76 0.75 0.74 0.75
J&J 0.71 0.72 0.72 0.72 0.71 0.72St Jude Medical 0.69 0.70 0.73 0.72 0.72 0.71Boston Scientific 0.72 0.77 0.78 0.72 0.72 0.74
Zimmer 0.73 0.74 0.77 0.78 0.78 0.76
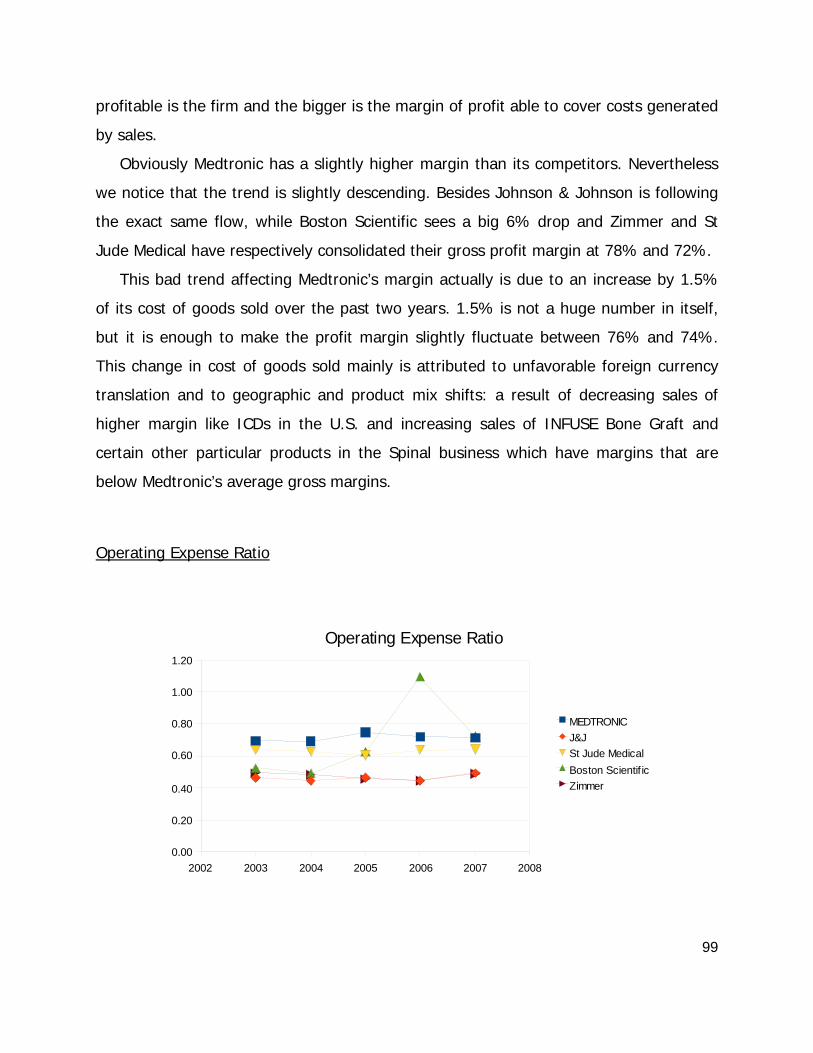
99
profitable is the firm and the bigger is the margin of profit able to cover costs generated
by sales.
Obviously Medtronic has a slightly higher margin than its competitors. Nevertheless
we notice that the trend is slightly descending. Besides Johnson & Johnson is following
the exact same flow, while Boston Scientific sees a big 6% drop and Zimmer and St
Jude Medical have respectively consolidated their gross profit margin at 78% and 72%.
This bad trend affecting Medtronic’s margin actually is due to an increase by 1.5%
of its cost of goods sold over the past two years. 1.5% is not a huge number in itself,
but it is enough to make the profit margin slightly fluctuate between 76% and 74%.
This change in cost of goods sold mainly is attributed to unfavorable foreign currency
translation and to geographic and product mix shifts: a result of decreasing sales of
higher margin like ICDs in the U.S. and increasing sales of INFUSE Bone Graft and
certain other particular products in the Spinal business which have margins that are
below Medtronic’s average gross margins.
Operating Expense Ratio
2002 2003 2004 2005 2006 2007 20080.00
0.20
0.40
0.60
0.80
1.00
1.20
Operating Expense Ratio
MEDTRONICJ&JSt Jude MedicalBoston Scientif icZimmer
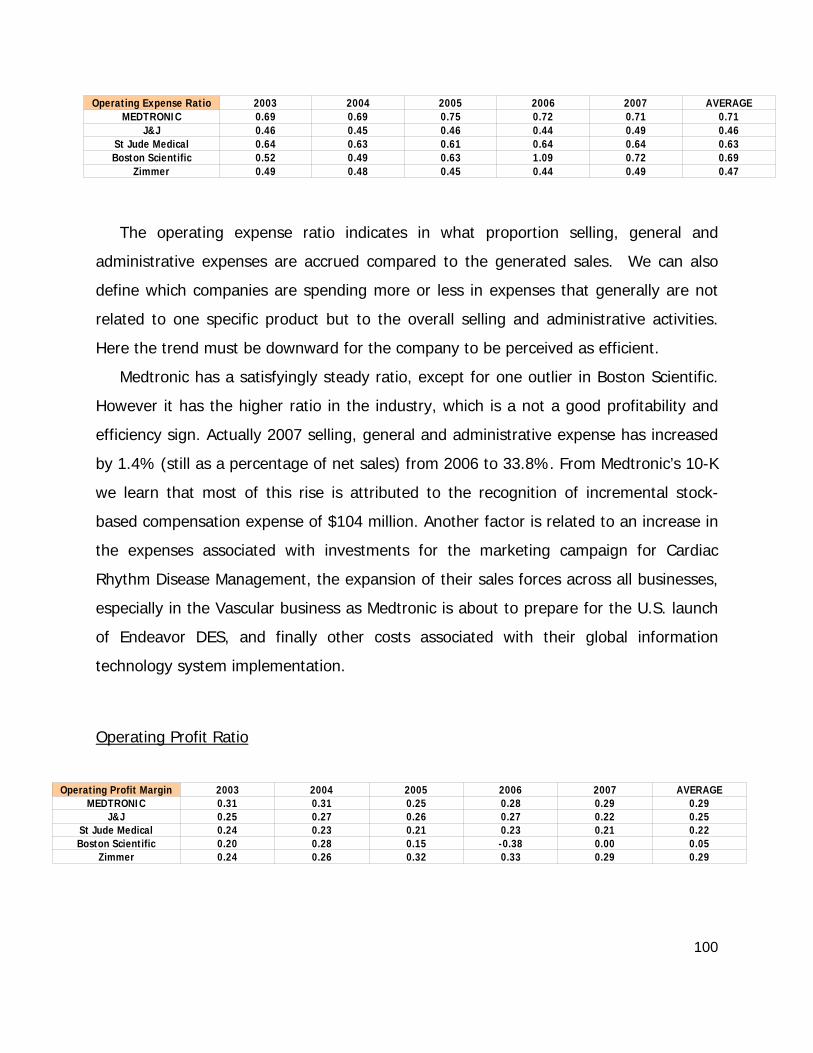
100
The operating expense ratio indicates in what proportion selling, general and
administrative expenses are accrued compared to the generated sales. We can also
define which companies are spending more or less in expenses that generally are not
related to one specific product but to the overall selling and administrative activities.
Here the trend must be downward for the company to be perceived as efficient.
Medtronic has a satisfyingly steady ratio, except for one outlier in Boston Scientific.
However it has the higher ratio in the industry, which is a not a good profitability and
efficiency sign. Actually 2007 selling, general and administrative expense has increased
by 1.4% (still as a percentage of net sales) from 2006 to 33.8%. From Medtronic’s 10-K
we learn that most of this rise is attributed to the recognition of incremental stock-
based compensation expense of $104 million. Another factor is related to an increase in
the expenses associated with investments for the marketing campaign for Cardiac
Rhythm Disease Management, the expansion of their sales forces across all businesses,
especially in the Vascular business as Medtronic is about to prepare for the U.S. launch
of Endeavor DES, and finally other costs associated with their global information
technology system implementation.
Operating Profit Ratio
Operating Expense Ratio 2003 2004 2005 2006 2007 AVERAGEMEDTRONIC 0.69 0.69 0.75 0.72 0.71 0.71
J&J 0.46 0.45 0.46 0.44 0.49 0.46St Jude Medical 0.64 0.63 0.61 0.64 0.64 0.63Boston Scientific 0.52 0.49 0.63 1.09 0.72 0.69
Zimmer 0.49 0.48 0.45 0.44 0.49 0.47
Operating Profit Margin 2003 2004 2005 2006 2007 AVERAGEMEDTRONIC 0.31 0.31 0.25 0.28 0.29 0.29
J&J 0.25 0.27 0.26 0.27 0.22 0.25St Jude Medical 0.24 0.23 0.21 0.23 0.21 0.22Boston Scientific 0.20 0.28 0.15 -0.38 0.00 0.05
Zimmer 0.24 0.26 0.32 0.33 0.29 0.29
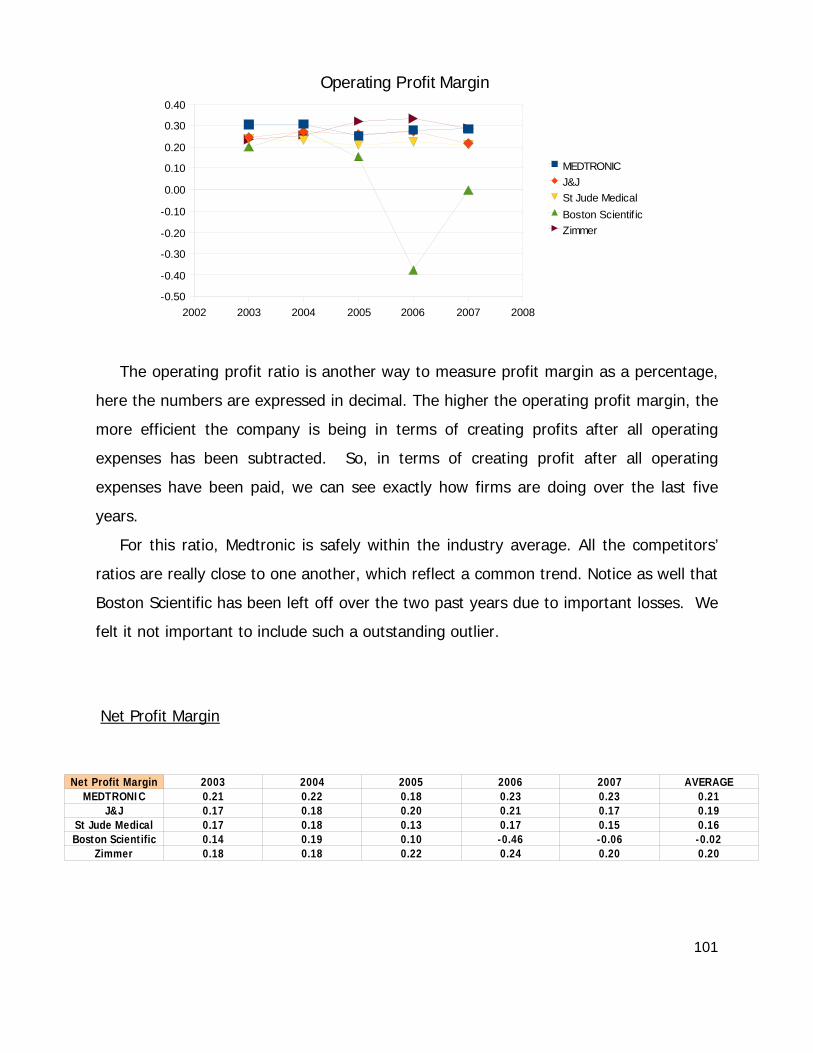
101
The operating profit ratio is another way to measure profit margin as a percentage,
here the numbers are expressed in decimal. The higher the operating profit margin, the
more efficient the company is being in terms of creating profits after all operating
expenses has been subtracted. So, in terms of creating profit after all operating
expenses have been paid, we can see exactly how firms are doing over the last five
years.
For this ratio, Medtronic is safely within the industry average. All the competitors’
ratios are really close to one another, which reflect a common trend. Notice as well that
Boston Scientific has been left off over the two past years due to important losses. We
felt it not important to include such a outstanding outlier.
Net Profit Margin
2002 2003 2004 2005 2006 2007 2008-0.50
-0.40
-0.30
-0.20
-0.10
0.00
0.10
0.20
0.30
0.40
Operating Profit Margin
MEDTRONICJ&JSt Jude MedicalBoston Scientif icZimmer
Net Profit Margin 2003 2004 2005 2006 2007 AVERAGEMEDTRONIC 0.21 0.22 0.18 0.23 0.23 0.21
J&J 0.17 0.18 0.20 0.21 0.17 0.19St Jude Medical 0.17 0.18 0.13 0.17 0.15 0.16Boston Scientific 0.14 0.19 0.10 -0.46 -0.06 -0.02
Zimmer 0.18 0.18 0.22 0.24 0.20 0.20
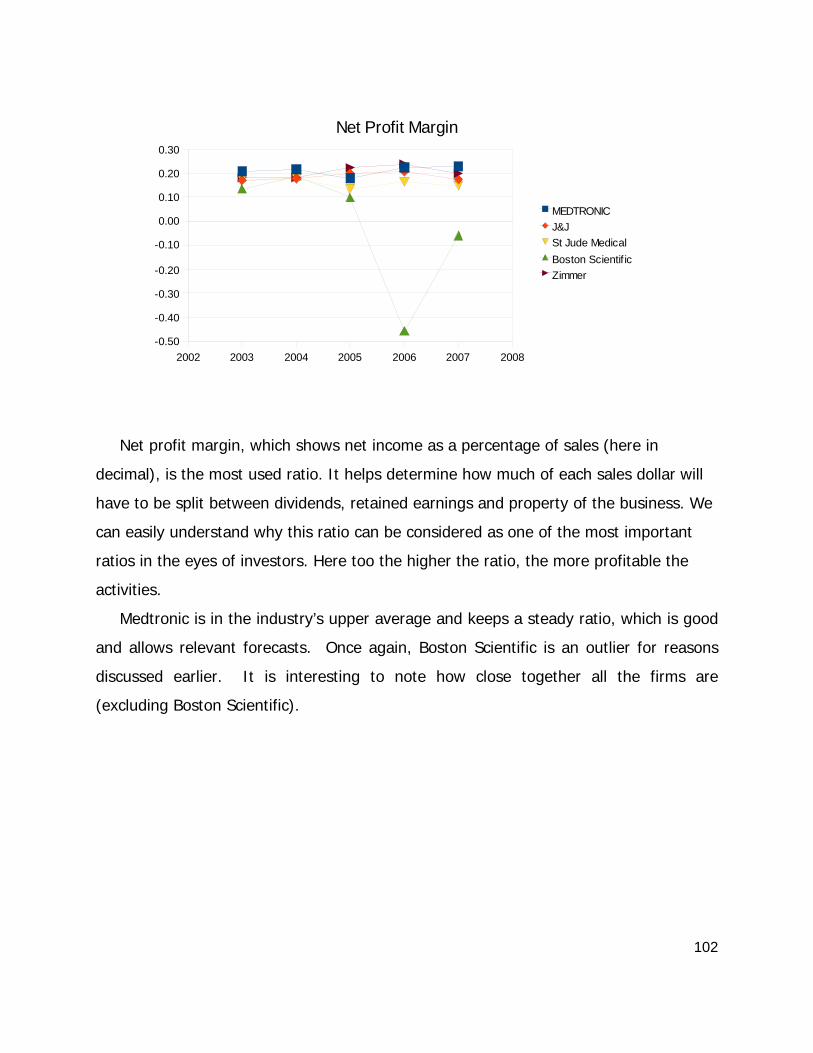
102
Net profit margin, which shows net income as a percentage of sales (here in
decimal), is the most used ratio. It helps determine how much of each sales dollar will
have to be split between dividends, retained earnings and property of the business. We
can easily understand why this ratio can be considered as one of the most important
ratios in the eyes of investors. Here too the higher the ratio, the more profitable the
activities.
Medtronic is in the industry’s upper average and keeps a steady ratio, which is good
and allows relevant forecasts. Once again, Boston Scientific is an outlier for reasons
discussed earlier. It is interesting to note how close together all the firms are
(excluding Boston Scientific).
2002 2003 2004 2005 2006 2007 2008-0.50
-0.40
-0.30
-0.20
-0.10
0.00
0.10
0.20
0.30
Net Profit Margin
MEDTRONICJ&JSt Jude MedicalBoston Scientif icZimmer
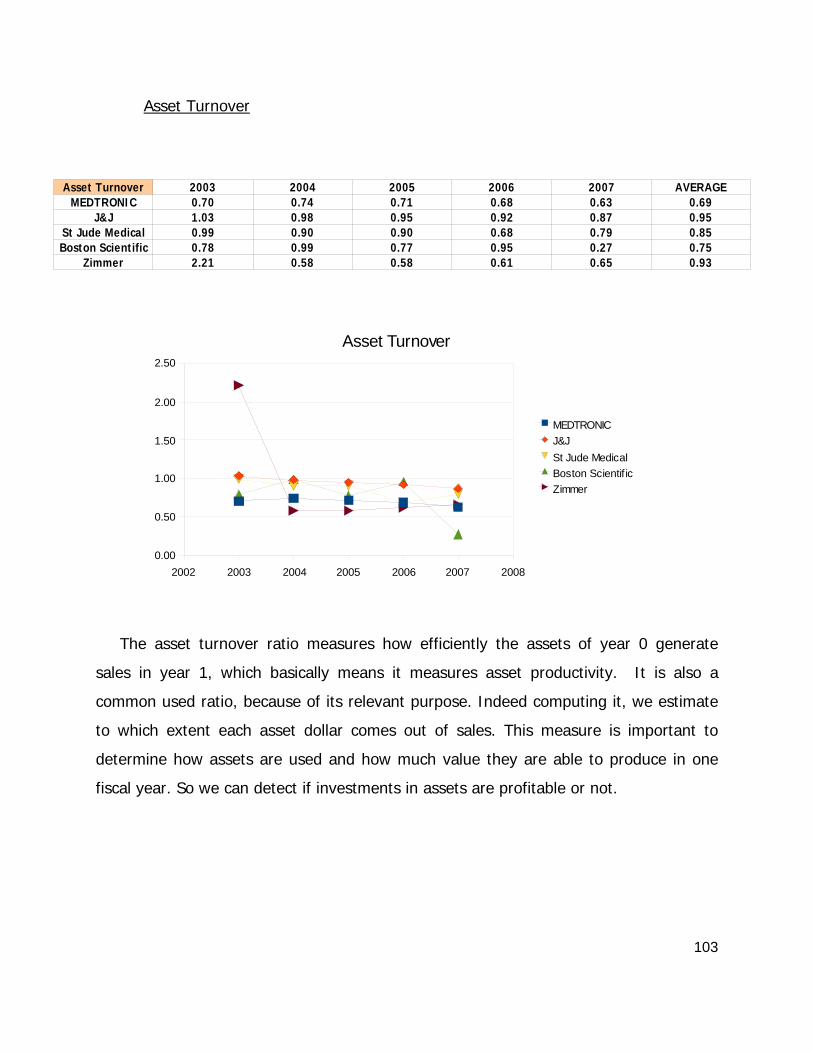
103
2002 2003 2004 2005 2006 2007 20080.00
0.50
1.00
1.50
2.00
2.50
Asset Turnover
MEDTRONICJ&JSt Jude MedicalBoston Scientif icZimmer
Asset Turnover
The asset turnover ratio measures how efficiently the assets of year 0 generate
sales in year 1, which basically means it measures asset productivity. It is also a
common used ratio, because of its relevant purpose. Indeed computing it, we estimate
to which extent each asset dollar comes out of sales. This measure is important to
determine how assets are used and how much value they are able to produce in one
fiscal year. So we can detect if investments in assets are profitable or not.
Asset Turnover 2003 2004 2005 2006 2007 AVERAGEMEDTRONIC 0.70 0.74 0.71 0.68 0.63 0.69
J&J 1.03 0.98 0.95 0.92 0.87 0.95St Jude Medical 0.99 0.90 0.90 0.68 0.79 0.85Boston Scientific 0.78 0.99 0.77 0.95 0.27 0.75
Zimmer 2.21 0.58 0.58 0.61 0.65 0.93
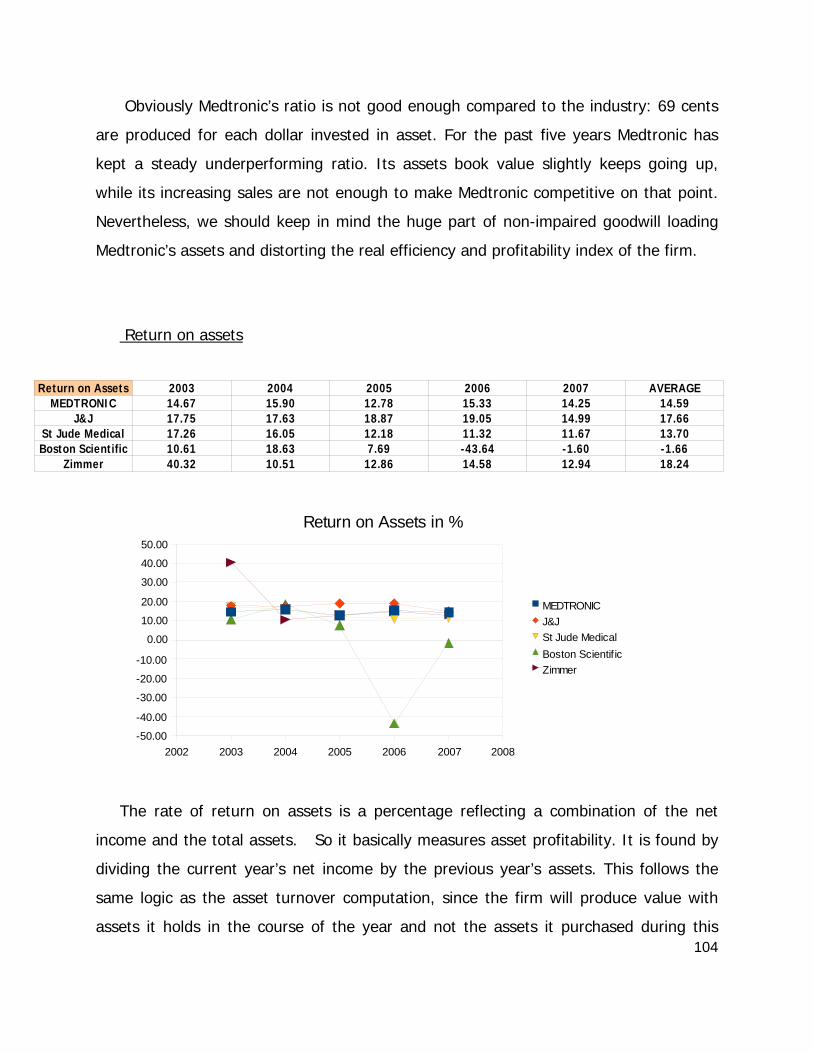
104
Obviously Medtronic’s ratio is not good enough compared to the industry: 69 cents
are produced for each dollar invested in asset. For the past five years Medtronic has
kept a steady underperforming ratio. Its assets book value slightly keeps going up,
while its increasing sales are not enough to make Medtronic competitive on that point.
Nevertheless, we should keep in mind the huge part of non-impaired goodwill loading
Medtronic’s assets and distorting the real efficiency and profitability index of the firm.
Return on assets
The rate of return on assets is a percentage reflecting a combination of the net
income and the total assets. So it basically measures asset profitability. It is found by
dividing the current year’s net income by the previous year’s assets. This follows the
same logic as the asset turnover computation, since the firm will produce value with
assets it holds in the course of the year and not the assets it purchased during this
Return on Assets 2003 2004 2005 2006 2007 AVERAGEMEDTRONIC 14.67 15.90 12.78 15.33 14.25 14.59
J&J 17.75 17.63 18.87 19.05 14.99 17.66St Jude Medical 17.26 16.05 12.18 11.32 11.67 13.70Boston Scientific 10.61 18.63 7.69 -43.64 -1.60 -1.66
Zimmer 40.32 10.51 12.86 14.58 12.94 18.24
2002 2003 2004 2005 2006 2007 2008-50.00
-40.00
-30.00
-20.00
-10.00
0.00
10.00
20.00
30.00
40.00
50.00
Return on Assets in %
MEDTRONICJ&JSt Jude MedicalBoston Scientif icZimmer
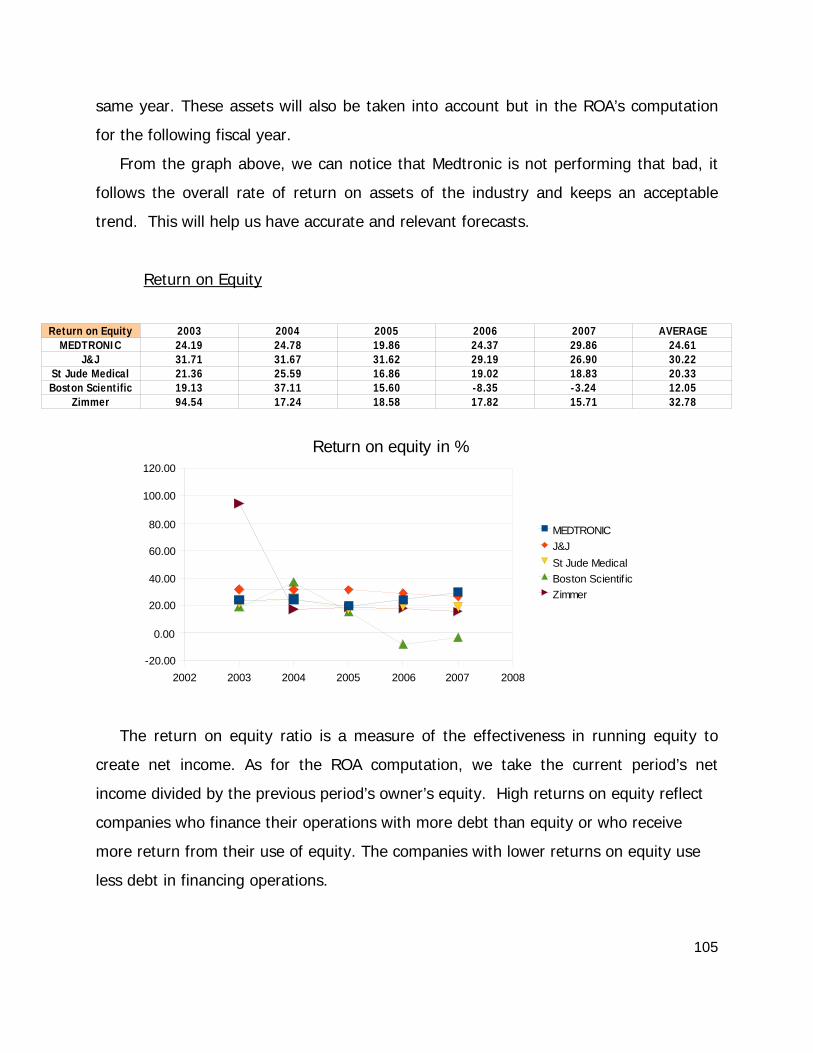
105
same year. These assets will also be taken into account but in the ROA’s computation
for the following fiscal year.
From the graph above, we can notice that Medtronic is not performing that bad, it
follows the overall rate of return on assets of the industry and keeps an acceptable
trend. This will help us have accurate and relevant forecasts.
Return on Equity
The return on equity ratio is a measure of the effectiveness in running equity to
create net income. As for the ROA computation, we take the current period’s net
income divided by the previous period’s owner’s equity. High returns on equity reflect
companies who finance their operations with more debt than equity or who receive
more return from their use of equity. The companies with lower returns on equity use
less debt in financing operations.
Return on Equity 2003 2004 2005 2006 2007 AVERAGEMEDTRONIC 24.19 24.78 19.86 24.37 29.86 24.61
J&J 31.71 31.67 31.62 29.19 26.90 30.22St Jude Medical 21.36 25.59 16.86 19.02 18.83 20.33Boston Scientific 19.13 37.11 15.60 -8.35 -3.24 12.05
Zimmer 94.54 17.24 18.58 17.82 15.71 32.78
2002 2003 2004 2005 2006 2007 2008-20.00
0.00
20.00
40.00
60.00
80.00
100.00
120.00
Return on equity in %
MEDTRONICJ&JSt Jude MedicalBoston Scientif icZimmer
106
We see that Medtronic has improved its ratio over the past two years in order to
lead the industry in 2007. As the ratio has not been so good over the three previous
years, we still cannot decide if Medtronic is beginning a new leading trend in the
industry or if it only is a consequent of the course of business for the year 2007. The
2007 Medtronic’s financial statements indicate growing sales and steady owner’s equity.
If sales keep going like that and if owner’s equity don’t increase that much, keeping the
same trend there too, it is feasible to obtain an even better ratio in the future.
Conclusion
Medtronic seems to be doing alright overall for profit margins. They exceeded
the industry average in net profit margins, and is on the high end of the average for
operating income. There were steady with the industry for operating profit, and return
on assets, and on par with the industry for return on equity but increasing. The only
troubling aspect is in the management of assets in the asset turnover ratio. However,
overall Medtronic seems to be strong in profitability and, if it can improve its stated
weakness, will be able to be profitable in the future.
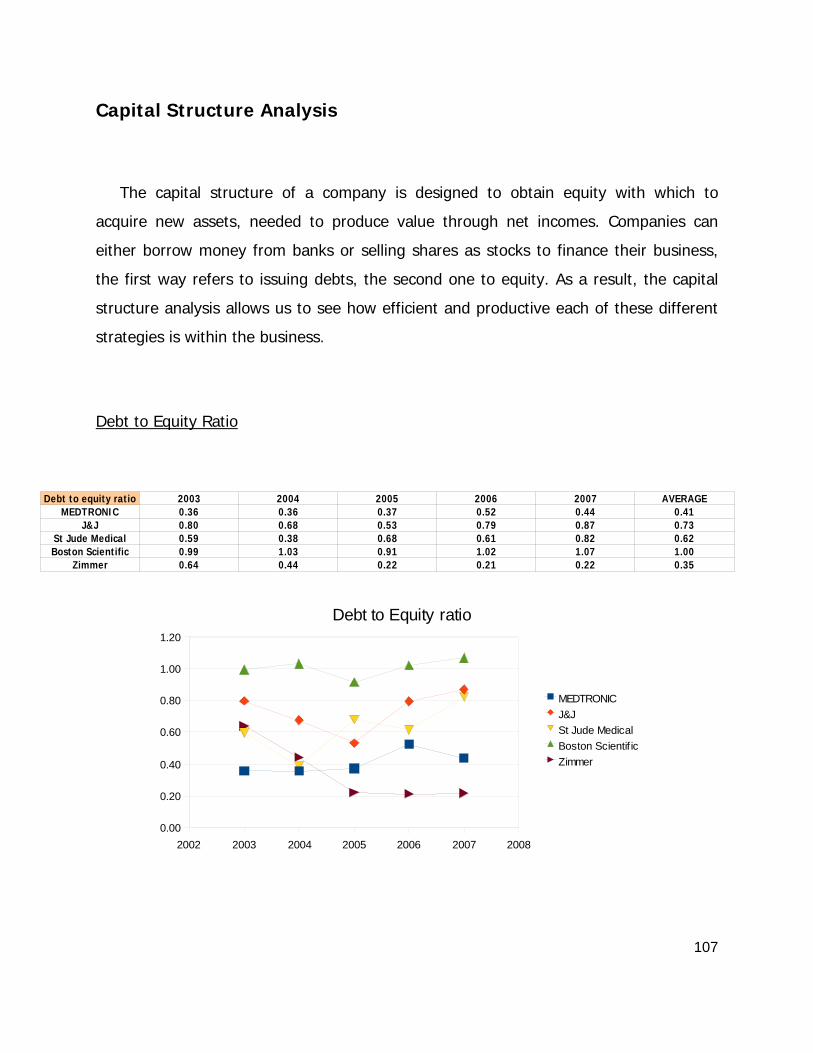
107
Capital Structure Analysis
The capital structure of a company is designed to obtain equity with which to
acquire new assets, needed to produce value through net incomes. Companies can
either borrow money from banks or selling shares as stocks to finance their business,
the first way refers to issuing debts, the second one to equity. As a result, the capital
structure analysis allows us to see how efficient and productive each of these different
strategies is within the business.
Debt to Equity Ratio
2002 2003 2004 2005 2006 2007 20080.00
0.20
0.40
0.60
0.80
1.00
1.20
Debt to Equity ratio
MEDTRONICJ&JSt Jude MedicalBoston Scientif icZimmer
Debt to equity ratio 2003 2004 2005 2006 2007 AVERAGEMEDTRONIC 0.36 0.36 0.37 0.52 0.44 0.41
J&J 0.80 0.68 0.53 0.79 0.87 0.73St Jude Medical 0.59 0.38 0.68 0.61 0.82 0.62Boston Scientific 0.99 1.03 0.91 1.02 1.07 1.00
Zimmer 0.64 0.44 0.22 0.21 0.22 0.35
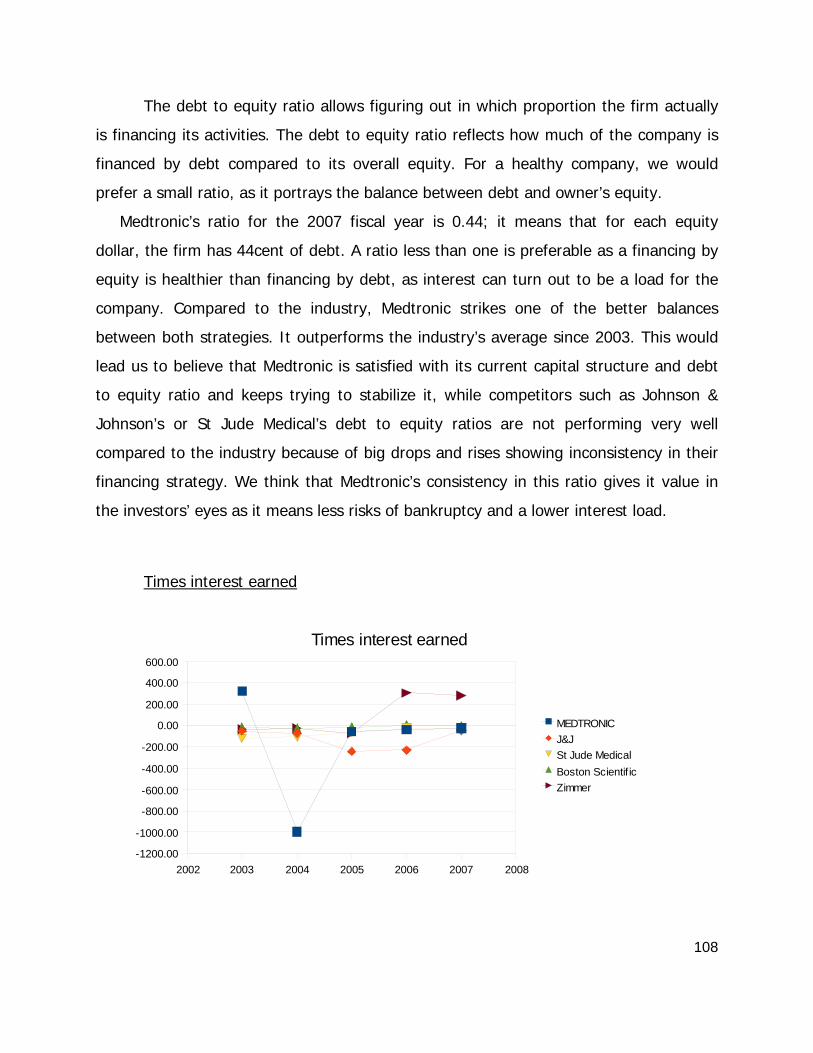
108
The debt to equity ratio allows figuring out in which proportion the firm actually
is financing its activities. The debt to equity ratio reflects how much of the company is
financed by debt compared to its overall equity. For a healthy company, we would
prefer a small ratio, as it portrays the balance between debt and owner’s equity.
Medtronic’s ratio for the 2007 fiscal year is 0.44; it means that for each equity
dollar, the firm has 44cent of debt. A ratio less than one is preferable as a financing by
equity is healthier than financing by debt, as interest can turn out to be a load for the
company. Compared to the industry, Medtronic strikes one of the better balances
between both strategies. It outperforms the industry’s average since 2003. This would
lead us to believe that Medtronic is satisfied with its current capital structure and debt
to equity ratio and keeps trying to stabilize it, while competitors such as Johnson &
Johnson’s or St Jude Medical’s debt to equity ratios are not performing very well
compared to the industry because of big drops and rises showing inconsistency in their
financing strategy. We think that Medtronic’s consistency in this ratio gives it value in
the investors’ eyes as it means less risks of bankruptcy and a lower interest load.
Times interest earned
2002 2003 2004 2005 2006 2007 2008-1200.00
-1000.00
-800.00
-600.00
-400.00
-200.00
0.00
200.00
400.00
600.00
Times interest earned
MEDTRONICJ&JSt Jude MedicalBoston Scientif icZimmer
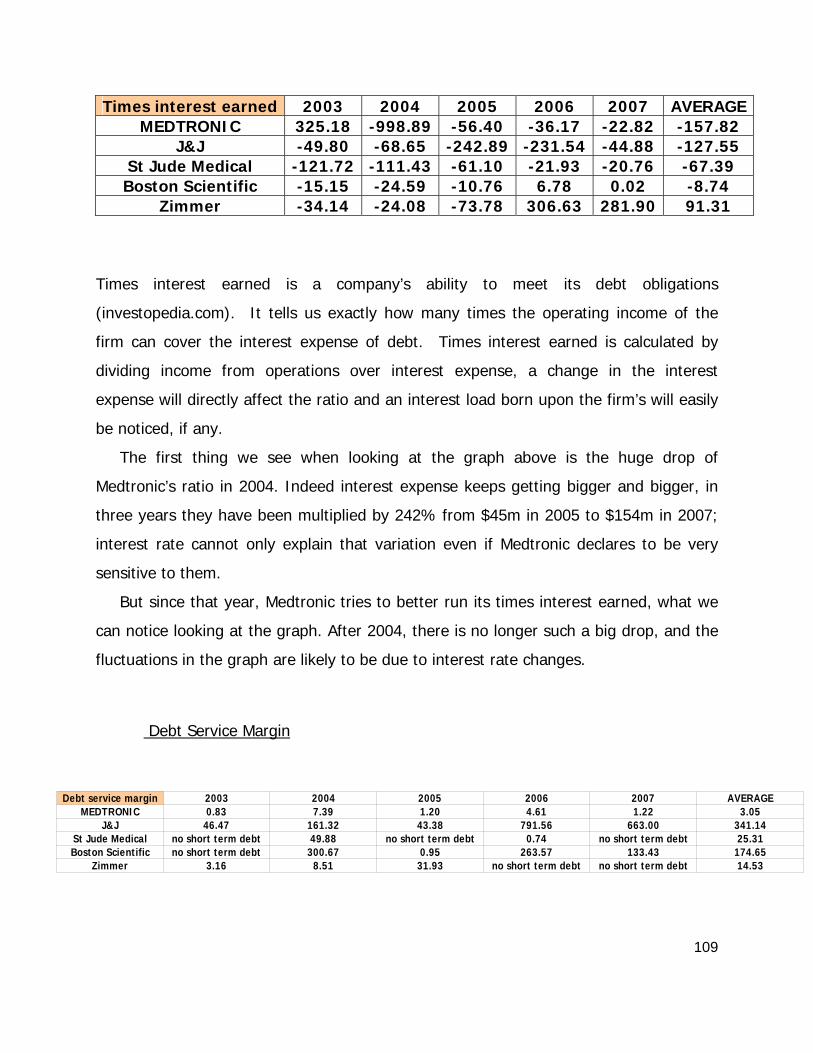
109
Times interest earned 2003 2004 2005 2006 2007 AVERAGEMEDTRONIC 325.18 -998.89 -56.40 -36.17 -22.82 -157.82
J&J -49.80 -68.65 -242.89 -231.54 -44.88 -127.55 St Jude Medical -121.72 -111.43 -61.10 -21.93 -20.76 -67.39 Boston Scientific -15.15 -24.59 -10.76 6.78 0.02 -8.74
Zimmer -34.14 -24.08 -73.78 306.63 281.90 91.31
Times interest earned is a company’s ability to meet its debt obligations
(investopedia.com). It tells us exactly how many times the operating income of the
firm can cover the interest expense of debt. Times interest earned is calculated by
dividing income from operations over interest expense, a change in the interest
expense will directly affect the ratio and an interest load born upon the firm’s will easily
be noticed, if any.
The first thing we see when looking at the graph above is the huge drop of
Medtronic’s ratio in 2004. Indeed interest expense keeps getting bigger and bigger, in
three years they have been multiplied by 242% from $45m in 2005 to $154m in 2007;
interest rate cannot only explain that variation even if Medtronic declares to be very
sensitive to them.
But since that year, Medtronic tries to better run its times interest earned, what we
can notice looking at the graph. After 2004, there is no longer such a big drop, and the
fluctuations in the graph are likely to be due to interest rate changes.
Debt Service Margin
Debt service margin 2003 2004 2005 2006 2007 AVERAGEMEDTRONIC 0.83 7.39 1.20 4.61 1.22 3.05
J&J 46.47 161.32 43.38 791.56 663.00 341.14St Jude Medical no short term debt 49.88 no short term debt 0.74 no short term debt 25.31Boston Scientific no short term debt 300.67 0.95 263.57 133.43 174.65
Zimmer 3.16 8.51 31.93 no short term debt no short term debt 14.53
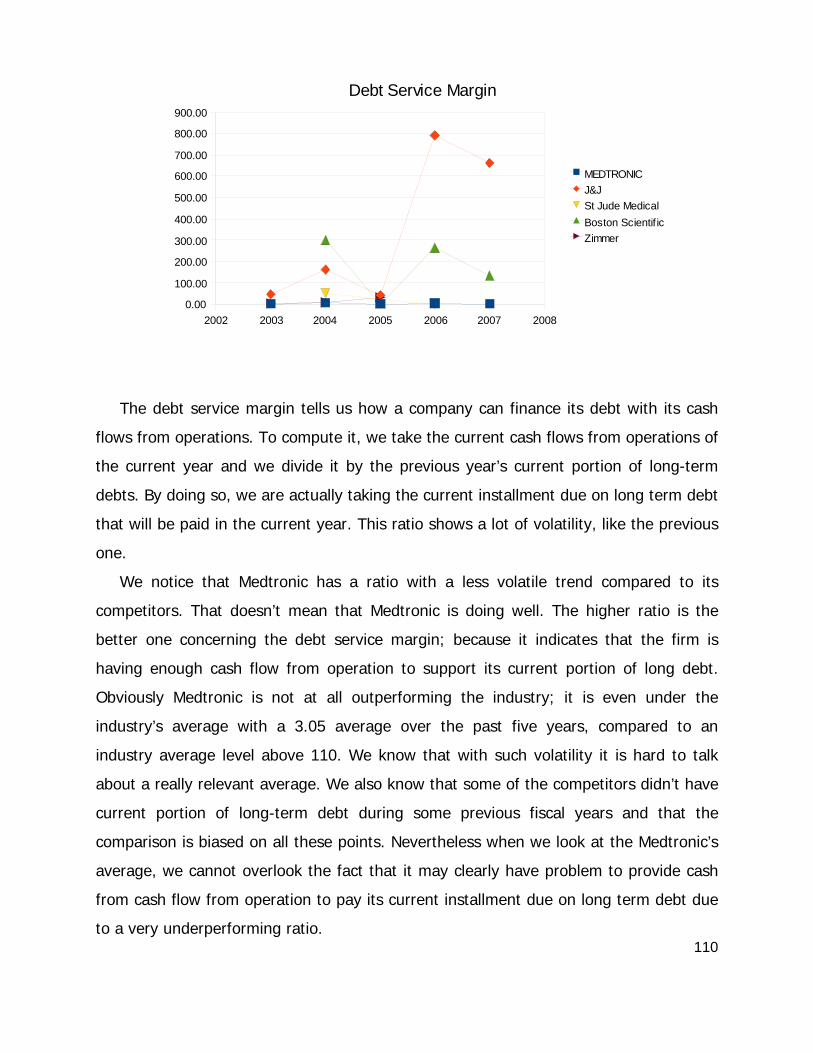
110
The debt service margin tells us how a company can finance its debt with its cash
flows from operations. To compute it, we take the current cash flows from operations of
the current year and we divide it by the previous year’s current portion of long-term
debts. By doing so, we are actually taking the current installment due on long term debt
that will be paid in the current year. This ratio shows a lot of volatility, like the previous
one.
We notice that Medtronic has a ratio with a less volatile trend compared to its
competitors. That doesn’t mean that Medtronic is doing well. The higher ratio is the
better one concerning the debt service margin; because it indicates that the firm is
having enough cash flow from operation to support its current portion of long debt.
Obviously Medtronic is not at all outperforming the industry; it is even under the
industry’s average with a 3.05 average over the past five years, compared to an
industry average level above 110. We know that with such volatility it is hard to talk
about a really relevant average. We also know that some of the competitors didn’t have
current portion of long-term debt during some previous fiscal years and that the
comparison is biased on all these points. Nevertheless when we look at the Medtronic’s
average, we cannot overlook the fact that it may clearly have problem to provide cash
from cash flow from operation to pay its current installment due on long term debt due
to a very underperforming ratio.
2002 2003 2004 2005 2006 2007 20080.00
100.00
200.00
300.00
400.00
500.00
600.00
700.00
800.00
900.00
Debt Service Margin
MEDTRONICJ&JSt Jude MedicalBoston Scientif icZimmer
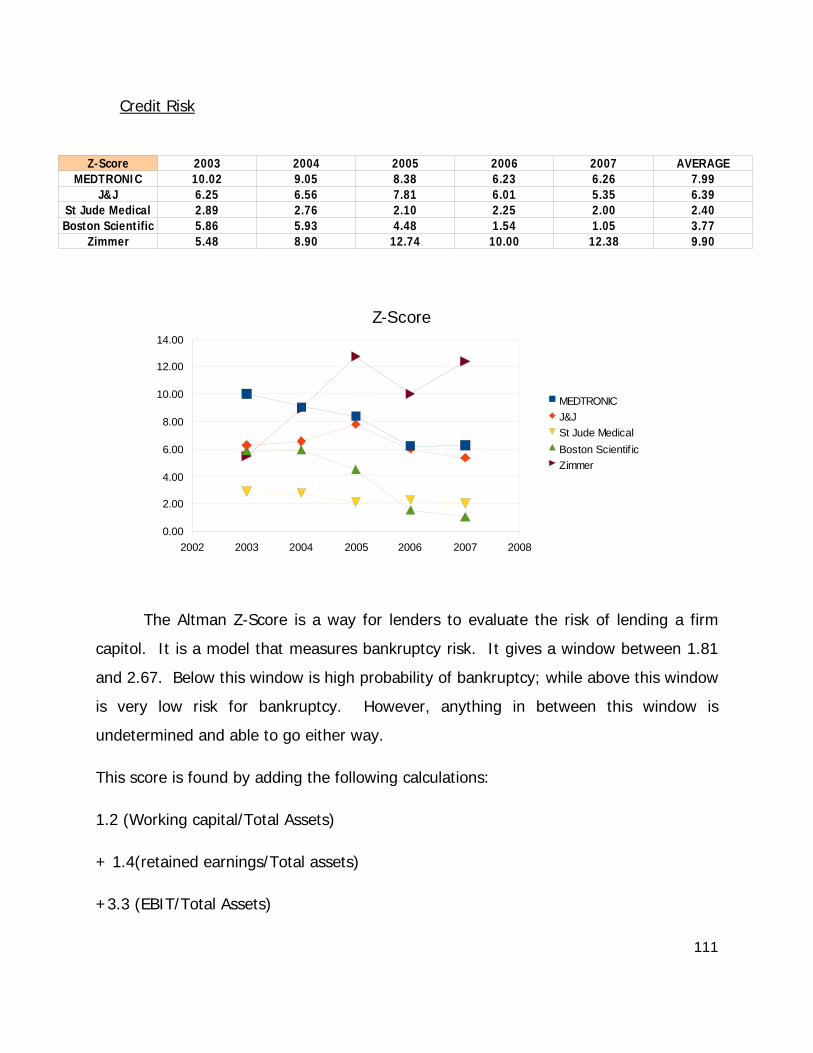
111
Credit Risk
The Altman Z-Score is a way for lenders to evaluate the risk of lending a firm
capitol. It is a model that measures bankruptcy risk. It gives a window between 1.81
and 2.67. Below this window is high probability of bankruptcy; while above this window
is very low risk for bankruptcy. However, anything in between this window is
undetermined and able to go either way.
This score is found by adding the following calculations:
1.2 (Working capital/Total Assets)
+ 1.4(retained earnings/Total assets)
+3.3 (EBIT/Total Assets)
Z-Score 2003 2004 2005 2006 2007 AVERAGEMEDTRONIC 10.02 9.05 8.38 6.23 6.26 7.99
J&J 6.25 6.56 7.81 6.01 5.35 6.39St Jude Medical 2.89 2.76 2.10 2.25 2.00 2.40Boston Scientific 5.86 5.93 4.48 1.54 1.05 3.77
Zimmer 5.48 8.90 12.74 10.00 12.38 9.90
2002 2003 2004 2005 2006 2007 20080.00
2.00
4.00
6.00
8.00
10.00
12.00
14.00
Z-Score
MEDTRONICJ&JSt Jude MedicalBoston Scientif icZimmer
112
+ 0.6(Market capitalization/Book value of liabilities)
+1(Sales/ Total assets)
The average Medtronic Z-score is equal to 7.99, which is two points above the
overall industry average. With a score so high, Medtronic shows it’s competency and
ability to avoid insolvency risk. It has the second best z-score among the industry,
which shows a strong Z-Score throughout the industry. However, they are having a
downward slope, but they are trying to stabilize the trend in the industry is that all the
Z-scores are going down (less the outlier Zimmer) but even with this decline, the Z-
scores for the industry, and Medtronic, are very strong.
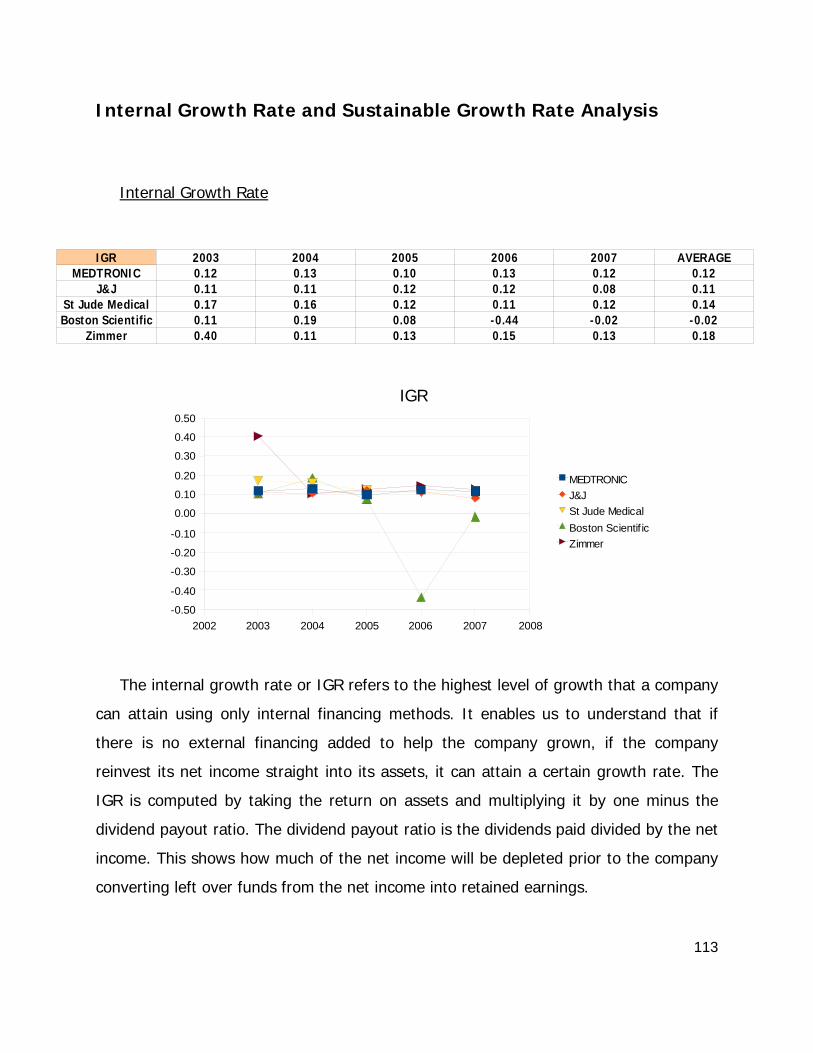
113
Internal Growth Rate and Sustainable Growth Rate Analysis
Internal Growth Rate
The internal growth rate or IGR refers to the highest level of growth that a company
can attain using only internal financing methods. It enables us to understand that if
there is no external financing added to help the company grown, if the company
reinvest its net income straight into its assets, it can attain a certain growth rate. The
IGR is computed by taking the return on assets and multiplying it by one minus the
dividend payout ratio. The dividend payout ratio is the dividends paid divided by the net
income. This shows how much of the net income will be depleted prior to the company
converting left over funds from the net income into retained earnings.
IGR 2003 2004 2005 2006 2007 AVERAGEMEDTRONIC 0.12 0.13 0.10 0.13 0.12 0.12
J&J 0.11 0.11 0.12 0.12 0.08 0.11St Jude Medical 0.17 0.16 0.12 0.11 0.12 0.14Boston Scientific 0.11 0.19 0.08 -0.44 -0.02 -0.02
Zimmer 0.40 0.11 0.13 0.15 0.13 0.18
2002 2003 2004 2005 2006 2007 2008-0.50
-0.40
-0.30
-0.20
-0.10
0.00
0.10
0.20
0.30
0.40
0.50
IGR
MEDTRONICJ&JSt Jude MedicalBoston Scientif icZimmer
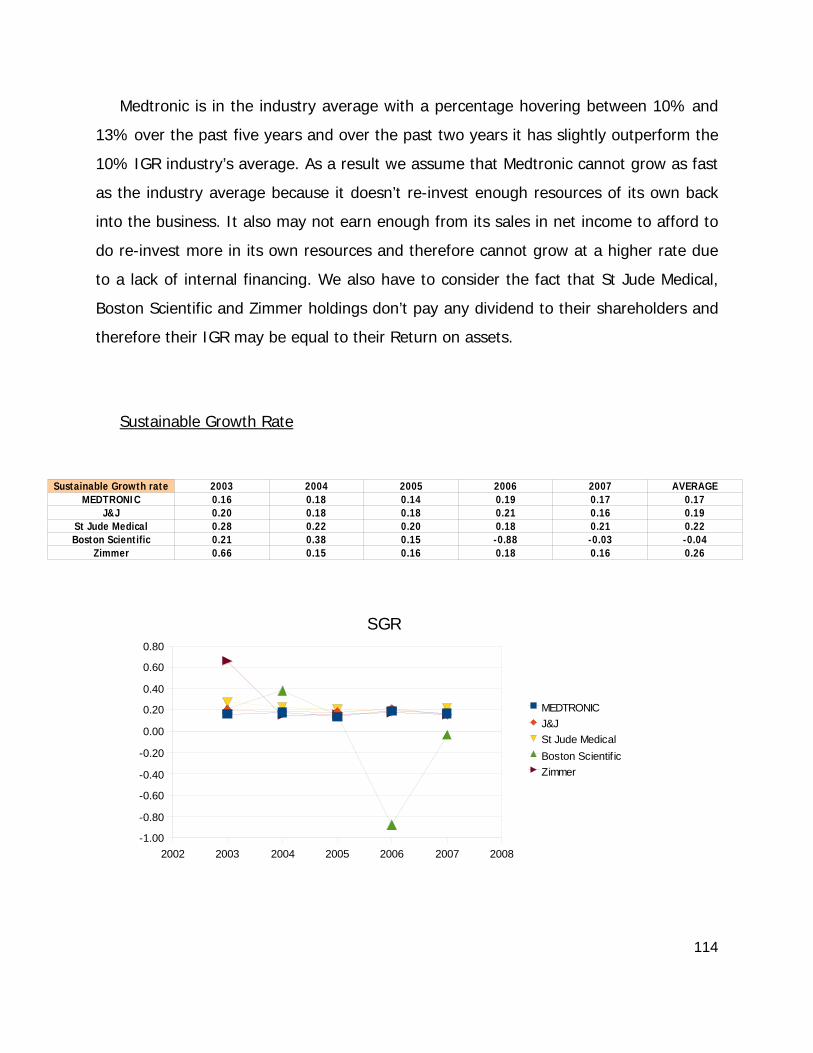
114
Medtronic is in the industry average with a percentage hovering between 10% and
13% over the past five years and over the past two years it has slightly outperform the
10% IGR industry’s average. As a result we assume that Medtronic cannot grow as fast
as the industry average because it doesn’t re-invest enough resources of its own back
into the business. It also may not earn enough from its sales in net income to afford to
do re-invest more in its own resources and therefore cannot grow at a higher rate due
to a lack of internal financing. We also have to consider the fact that St Jude Medical,
Boston Scientific and Zimmer holdings don’t pay any dividend to their shareholders and
therefore their IGR may be equal to their Return on assets.
Sustainable Growth Rate
Sustainable Growth rate 2003 2004 2005 2006 2007 AVERAGEMEDTRONIC 0.16 0.18 0.14 0.19 0.17 0.17
J&J 0.20 0.18 0.18 0.21 0.16 0.19St Jude Medical 0.28 0.22 0.20 0.18 0.21 0.22Boston Scientific 0.21 0.38 0.15 -0.88 -0.03 -0.04
Zimmer 0.66 0.15 0.16 0.18 0.16 0.26
2002 2003 2004 2005 2006 2007 2008-1.00
-0.80
-0.60
-0.40
-0.20
0.00
0.20
0.40
0.60
0.80
SGR
MEDTRONICJ&JSt Jude MedicalBoston Scientif icZimmer
115
The sustainable growth rate, or SGR, offers another way to determine a growth
rate, it is said to be more relevant as it takes into account the capital structure ratio,
which is overlooked by the previous method. The sustainable growth rate is found by
taking the IGR and by multiplying it by one plus the Debt to Equity ratio. This allows us
to find a more accurate and more plausible growth rate to forecast the company’s
future by holding the same debt leverage. It points out the fact the company is not only
using internal funding but also adding new borrowing or issuing new shares.
Medtronic shows a quite steady SGR compared to the overall industry and it is
even outperforming a bit with its average sustainable growth rate of 17%. This means
that Medtronic, which can support a 12% growth rate by itself keeping the same debt
to equity balance, can support an additional 17% growth by borrowing from outside
sources. This is in line with the industry average (or just a little below), less the outlier
Boston Scientific.
116
Financial Statement Forecasting
Forecasting financial statements is a critical step in assessing the value of a firm.
Certain assumptions about industry standards, idiosyncratic risk, and macroeconomic
conditions must form the basis of our forecast. As uncertainty about the future of
medical care in America builds, it is becoming apparent that the coming presidential
election will bring at least moderate change to the medical industry. Whether the
change is drastic, such as a move to regulated single payer healthcare, or less extreme,
mandated insurance requirements and political price setting, the effect of such policies
will change the forecast outlook for Medtronic.
We feel that the coming regulation will not have a drastic effect on sales growth
since even if prices are regulated Medtronic will not face a decrease in demand (people
will still need their products). We do feel that increased oversight might cause some
loss of concentration within the industry. Spreading out demand between more firms
has the potential to cause a small drop in sales. This may be along the line of a 1%
slowdown on sales growth.
The main consequence will be a reduction in profit margin and return, especially
return on equity. We will not assume that a true price setting regulation will come into
effect. The increased costs will most likely come in the form of increased inspections
and safety procedures which will not be compensated for by the government. In other
words, the costs will affect margins after gross profit. This assumed reduction in net
profit margin would be seen industry wide. This will be a critical factor in our forecast.
117
Forecast Drivers
Certain ratios act as principle drivers of income and these ratios will be the basis
of our forecast. Since forecasting should start with the income statement and move to
the balance sheet and cash flow statement, measures of sales growth and profit margin
can be seen as the backbone of forecasting. Sales growth, along with rates of return
(ROE, ROA, Net Profit margin), are mean reverting. That means that firms experiencing
above industry average returns will eventually see declining growth until they reach
industry equilibrium.
Here we have to make assumptions regarding industry growth rates and returns.
We believe that the average rate of sales growth for Medtronic’s main competitors
should be the basis for assessing industry standard growth. A simple way of computing
this would be to calculate a basic average of each firm’s sales growth over the last 5
years and average these rates to derive an industry norm. This method would likely
result in an over estimate of equilibrium growth. Since small firms often experience
growth in sales at a disproportionate rate compared to larger firms, weighting each firm
equally will potentially skew results. To remedy this potential problem, we will instead
use a weighted average to compute sales growth.
We have isolated 5 firms, including Medtronic, as key components of the health
care supply sector. These firms were selected through various criteria including direct
competition with Medtronic, individual market cap within the sector, and overall
similarity with Medtronic (correlations between growth, capital structure, and product
lines). Through this industry analysis we concluded that Johnson & Johnson, St. Jude
Medical, Boston Scientific, and Zimmer Inc. are the major components of the industry.
Averaging these firms growth rates over the last 5 years gave us individual average
growth rates ranging from 9.14% to 21%. This finding validates our use of a weighted
average. Large firms like Johnson & Johnson (net sales of 61 billion) had a growth rate
9.14% while smaller firms like St Jude (less than 4 billion in net sales) had a growth
rate of 17.7%. Medtronic falls in the middle with 12.16% average sales growth and
118
7.665 billion in net sales. We used net sales as the basis of our average weight (firm’s
net sales over total sector net sales acts as the weight factor for each firm). After
calculation, the industry standard, or equilibrium, sales growth rate was found to be
11.33%. If we did not weight the individual averages the equilibrium rate was much
higher. Since Medtronic grew their sales on average of 12.16%, the correct weighted
average shows that our firm actually has higher growth than industry equilibrium. If we
had used the other simple average method it would appear that Medtronic was actually
underperforming industry standards and our forecast assumption would be for sales
growth to increase as it reverted towards the mean. This raw forecast error would
drastically alter our eventual valuation of the firm.
Based on our findings, we will assume that Medtronic will be able to maintain
competitive advantage in the short run (till 2010) and sales should continue to grow at
12.16%. After that time Sales growth will slowly decline towards the industry
equilibrium of 11.33, reaching that rate by 2015. After that, we will assume that rate
will be maintained at equilibrium for the duration of the forecast (including terminal
assessment).
Theoretical Predictions
A good model should be grounded in theory. If a theoretical benchmark can be
estimated, harsh deviation from the results of the manual forecast can signify flaws in
either forecast assumption or method. We have attempted to estimate such a
benchmark by analyzing some of the other forecast drivers. The other forecast drivers
are rates of return. Like sales growth, rates of return are expected to be mean
reverting. Return on sales, or net profit margin, is one of the most important rates.
Sustainable growth rate is driven by net profit margin, asset turnover, earnings
retention rate, and financial leverage. Assuming that capital structure and dividend
policy will not change dramatically, profit margin is pivotal for accurate forecasting
119
assumptions. But, there is a problem with directly calculating industry norms by
averaging profit margins.
The main measure of total asset productivity is ROA. Firms drive ROA by trading
off between margin and turnover. A firm with high asset turnover will likely have low
profit margins (walmart). Firms with high margins will have low turnover (zales).
Averaging profit margins will have the effect of setting an industry standard that does
not reflect individual firm’s strategies for developing ROA.
Our solution to this problem is to standardize profit margins relative to the
capital structure of Medtronic. We will then use the average ROE of the industry to
estimate Medtronic’s equilibrium profit margin. ROE should converge towards the
industry average since firms with higher ROE’s will expand their investment base until
their returns stabilize. Since ROE=ROA*Leverage, we will be using the industry average
ROE and Medtronic’s 06’ Leverage ratio to standardize returns (The lag in leverage is
needed to calculate return). This gives ROEm/Levaragej=Profit margin*asset turnover.
Plugging in each firm into the asset turnover variable gives,
(ROEm/Leveragej)/ATx=Profit margin.
In theory, the net effect of standardizing profit margins is to view each firms
asset turnover in equilibrium (industry equilibrium ROE), if they maintained the same
capital structure as Medtronic (Leverage= 1+D/E). Averaging this for all firms should
give and equilibrium profit margin for Medtronic. This is not an industry wide
equilibrium rate (implying that all firms will eventually reach this profit margin), it is a
specific firm’s, in this case Medtronic’s, equilibrium rate. Industry average ROE times
Medtronic’s O6 Leverage gives a value of .08395. After going through the proper
calculations for each firm and averaging, we reached a long term equilibrium return on
sales of 15.523%.
120
Income statement
It is useful to calculate a benchmark long run return, but basing a forecast on a
net profit margin can lead to error. Approaching a forecast in this manner is equivalent
to working backwards. It will inevitably lead to flaws when we attempt to derive a
balance sheet from our calculations because of the inherent circularity of working from
the bottom up. But, if we can work our way to a sound theoretical conclusion that
conforms to our prior predictions, we can further justify the soundness of our forecast.
Based on the sales forecast explained above and our assumptions about the
future of Medtronic and the health care industry, we have chosen to use the gross
profit margin of 07’ for the duration of the forecast. We do not expect this margin to
change considerably from the 07’ level of 74.24%. This coincides with historical data
showing that the most distant margin from 07’ within the last 5 years was the 05’ rate
of 75.67%. A consistent gross profit margin of 74.24% is used with our sales forecast
to determine COGS.
Beside COGS, one of the most important expenses for Medtronic in particular is
R&D expense. As detailed in our accounting analysis, R&D expenditures have grown at
an average rate of 14% per year. We don’t see this slowing. If Medtronic began to back
off on R&D it would fall behind the industry in just a few years. We feel that the
management of Medtronic is fully aware of the highly competitive industry it is in and
would avoid a reduction in R&D expense even if it meant cutting into its net margin. We
will assume a 14% growth rate for the duration of the forecast.
Total expenditures, which include R&D and COGS, are what separate revenue
from EBIT. Forecasting individual constituent expenses would be tedious and provide
little insight. Under the assumption that COGS and R&D expense are moving at fixed
rates, the only variable assumption that needs to be accounted for is effect that our
revenue growth model has on gross profit. Total expenditures could be viewed as a
function of revenue growth and some constant. One thing we do know is that when
sales growth becomes constant at 11.33% in 2015, total expenditure growth should
121
also move at 11.33% (since all variables are locked). This is where we have to make
some assumptions. The average growth of total expenditures from 04 to 07 was 13.5%
annually. This is very close to our 14% R&D expense growth rate. After calculating net
income for a few rates between that range (multiplying EBIT by 1- the prevailing tax
rate), we found that an initial total expense growth rate of 13.9% (within our range)
that slowly declined at a constant rate of 11.33% in 2015 (equilibrium sales growth)
yielded a forecasted series of net incomes that moved exactly as predicted by our
theoretical standardized profit margin model. Our predictions for equilibrium profit
margin where surprisingly accurate (given we have the liberty to move within the half
percentile range of 14 to 13.5%). As predicted, as sales growth reached its 11.33%
equilibrium in 2015, net profit margin rested at 15.523%. The transition between real
and forecasted numbers was smooth in every line item on the income statement.
Balance Sheet
After deriving net income, we used a constant 18 % dividend as a percentage of
net income ratio to calculate dividends paid. This rate is consistent with reported data
from the last few years. We then calculated total equity as TEt-1+(Nit-DIVt)=TEt.
Because of changes in accumulated comprehensive loss/income, there was a 52
thousand dollar difference between reported TE and RE in 2007. This difference makes
up less than 2/5 of a percentile of TE. To simplify our forecast and maintain internal
consistency during valuation, we placed RE=TE for the duration of the forecast.
An important consideration when forecasting the balance sheet is to make sure
that asset growth is supported by sales. Ratios like asset turnover are relatively stable
and provide a way of determining the amount of assets needed to obtain the desired
amount of sales in the following year. Medtronic’s asset turnover is stable at around .7.
All forecasted numbers requiring a lag, like asset turnover, should be consistent as they
transition from reported to forecasted numbers. Asset turnover in 08 (using forecasted
122
revenue and 10-k reported total assets) was .706. We used the .7 S/TA ratio to forecast
total assets. Total liabilities are simply the difference between TA and TE.
To predict our level of receivables for a given year, we used the average A/R
turnover rate of 4.5. This is the best way to measure receivables since it matches our
sales growth changes with their equivalent quantity of receivables.
To calculate PP&E we used the average percentage of total assets from 02 to 07,
11.6%. We don’t believe that a foreseeable change in capital structure will affect this
rate. It was used for the duration of the forecast.
Cash Flow
Cash flow from operations was derived from the CFFO/Revenue rate, previously
determined to be 24%. The adjustment to forecast free cash flows (cash used in
investing activities) was calculated as the annual change in PP&E.
Common size financials
The balance sheet was standardized as a percentage of total assets. The income
statement and statement of cash flows were standardized as a percentage of revenue
and net earnings, respectively.
Restatements after adjustment
In previous sections we outlined several accounting adjustments used to
compensate for possible distortions. Impairment of goodwill, amortization of
intangibles, assessment of legal contingencies, and capitalization of R&D expense were
all areas covered in that section. Out of these, the adjustment with the largest effect on
earnings that could be continually projected and had the least amount of subjectivity
123
was capitalization of R&D. Instead of going through the tedious process of assessing
the effect of such an adjustment on a comprehensive basis, we feel that showing the
net effect on earnings is the most applicable and relevant for our purposes here. We
have added a line item after net income that shows the effect of R&D on earnings. As
detailed in the previous accounting analysis section, the net effect of our adjustment
will be a 14% increase in net income (since we assume a constant growth rate for R&D
expenditures).
Conclusion
An in depth analysis of this forecast will have to wait until we have implemented
the various valuation models. Some things of importance should be noted. Two
important ratios that we did not directly forecast were ROA and ROE. We don’t feel it is
wise to base a forecast primarily on those measures for the same reason it is not good
to forecast from return on sales. But, once the forecast is done we can look at what
these rates imply. ROA from 03 to 07 was at 14.5% on average. Our forecast implies a
drop in ROA to 11% by 2015. This is a 3.5% drop from the average and a 1.8% drop
from the reported low in 05 of 12.8%. ROE ranged from 20% to 30% over the course
of 03 to 07. Our forecast shows Medtronic’s ROE decreasing quickly at first, and then
slowing down and stabilizing at around 14.32%. This is interesting since our upper
bound cost of equity was found to be 14.42% (though we have reason to believe the
more accurate measure is 12.11%). This could be coincidence or it could be
equilibrium. We hope to be able to answer that question soon.
124
Cost of Capital Estimation
Cost of Equity & Regression Analysis
The cost of equity of a company is possibly the most important analysts’ number
for the firm. It measures the risk, and therefore the potential reward for investors. To
find cost of equity, we assume CAPM. Doing so makes a lot of assumptions; however it
is a well tested way of comparing firms, if done correctly.
In this formula, we use the beta (the risk of the individual firm), the market risk
premium, and the risk free rate. In this analysis, we assumed the 2 year risk free rate,
and also assumed an interest rate on 80% of short term debt. If this is incorrect, the
difference would be somewhat significant; however, we feel it is an educated guess,
educated enough to confidently estimate the following analysis’ on.
We performed a different regression for the treasury yield along different time
periods of 24, 36, 48, 60, and 72 months in order to test beta variance with 72
observations. As expected, the longer term regression yielded the highest beta with
the highest Adjusted R2, or level of explanatory power of the beta. When choosing
which beta to use, the only logical one was to use the only yield that had a positive
explanatory power at all. This gives us a beta of .3022. This is at least close to the
published beta of Medtronic, which is .22. This can give us some level of confidence.
What is extremely troubling however is that this beta, even given with the best
explanatory power is not very good. Adjusted R squared is at its highest at 3.62 %.
This takes away all the confidence we gain by being close to the published beta. What
it really means is that there is no good way to find beta, at least though CAPM for
Medtronic.
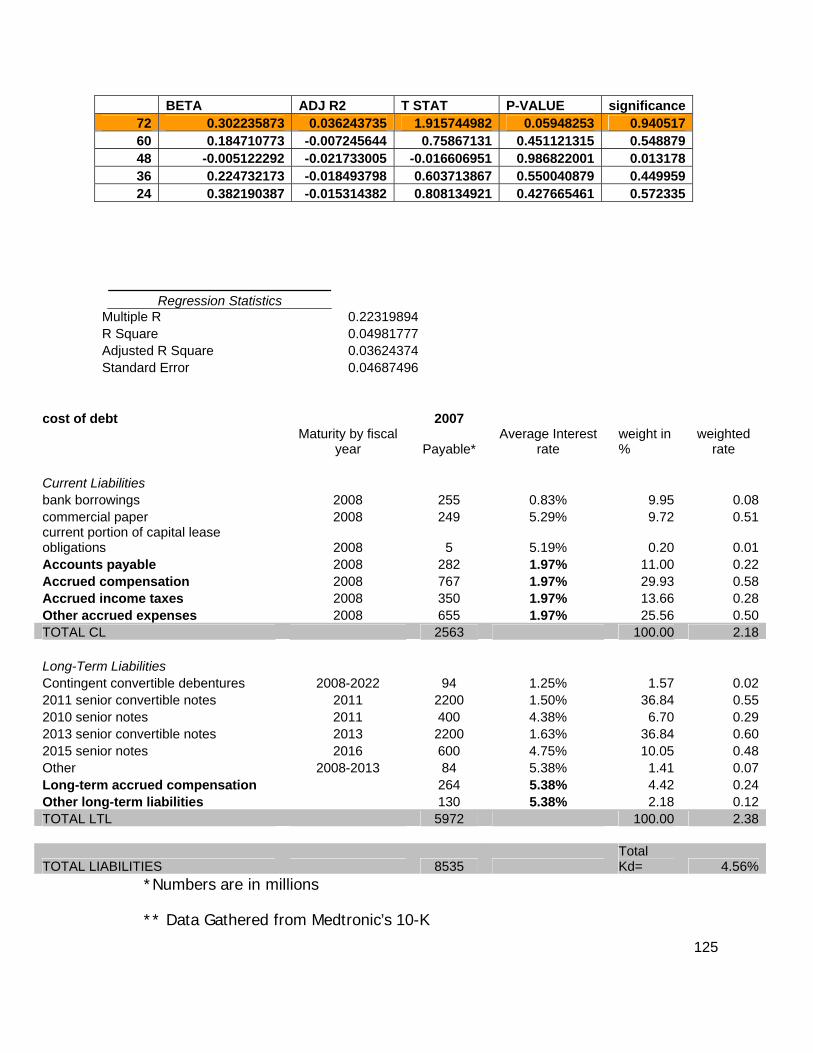
125
BETA ADJ R2 T STAT P-VALUE significance72 0.302235873 0.036243735 1.915744982 0.05948253 0.94051760 0.184710773 -0.007245644 0.75867131 0.451121315 0.54887948 -0.005122292 -0.021733005 -0.016606951 0.986822001 0.01317836 0.224732173 -0.018493798 0.603713867 0.550040879 0.44995924 0.382190387 -0.015314382 0.808134921 0.427665461 0.572335
Regression Statistics Multiple R
0.22319894R Square 0.04981777Adjusted R Square 0.03624374Standard Error 0.04687496
cost of debt 2007
Maturity by fiscal
year Payable* Average Interest
rate weight in %
weighted rate
Current Liabilities bank borrowings 2008 255 0.83% 9.95 0.08commercial paper 2008 249 5.29% 9.72 0.51current portion of capital lease obligations 2008 5 5.19% 0.20 0.01Accounts payable 2008 282 1.97% 11.00 0.22Accrued compensation 2008 767 1.97% 29.93 0.58Accrued income taxes 2008 350 1.97% 13.66 0.28Other accrued expenses 2008 655 1.97% 25.56 0.50TOTAL CL 2563 100.00 2.18 Long-Term Liabilities Contingent convertible debentures 2008-2022 94 1.25% 1.57 0.022011 senior convertible notes 2011 2200 1.50% 36.84 0.552010 senior notes 2011 400 4.38% 6.70 0.292013 senior convertible notes 2013 2200 1.63% 36.84 0.602015 senior notes 2016 600 4.75% 10.05 0.48Other 2008-2013 84 5.38% 1.41 0.07Long-term accrued compensation 264 5.38% 4.42 0.24Other long-term liabilities 130 5.38% 2.18 0.12TOTAL LTL 5972 100.00 2.38
TOTAL LIABILITIES 8535 Total Kd= 4.56%
*Numbers are in millions
** Data Gathered from Medtronic’s 10-K

126
The cost of debt for a company is the price they pay for money, or in other
words, the interest rate they pay to borrow money as it pertains to their risk. Medtronic
had a wide variety of interest rate difference as well as a few time period differences,
ranging from .83% to 5.38% and from 2008-2022, respectively. The total debt owed by
Medtronic was just over 8.5 billion. After the weighted average approach, we
concluded the cost of debt for Medtronic to be 4.559%.
Weighted Average Cost of Capital
The weighted average cost of capital formula measures both the cost of equity
and the cost of debt, and while putting them into perspective relative to the overall
financial assets. The two different types of WACC is before tax and after tax
calculations. We found before tax to be roughly 11% and after tax to be roughly 8.8%.
In many ways companies are encouraged to finance through debt. It is debatable
which one gives a more accurate statement of the firm and its position in the market.
However, even though taxes do not reflect business dealings, it is important to note
that companies pay close attention to what tax breaks they are going to be getting,
which does affect the company decisions.
WACC Before Tax (MVE/MVA)*ke+(MVL/MVA)*Kd 11.01%
WACC After Tax (MVE/MVA)*ke+(MVL/MVA)*Kd(1-tax rate) 10.89%
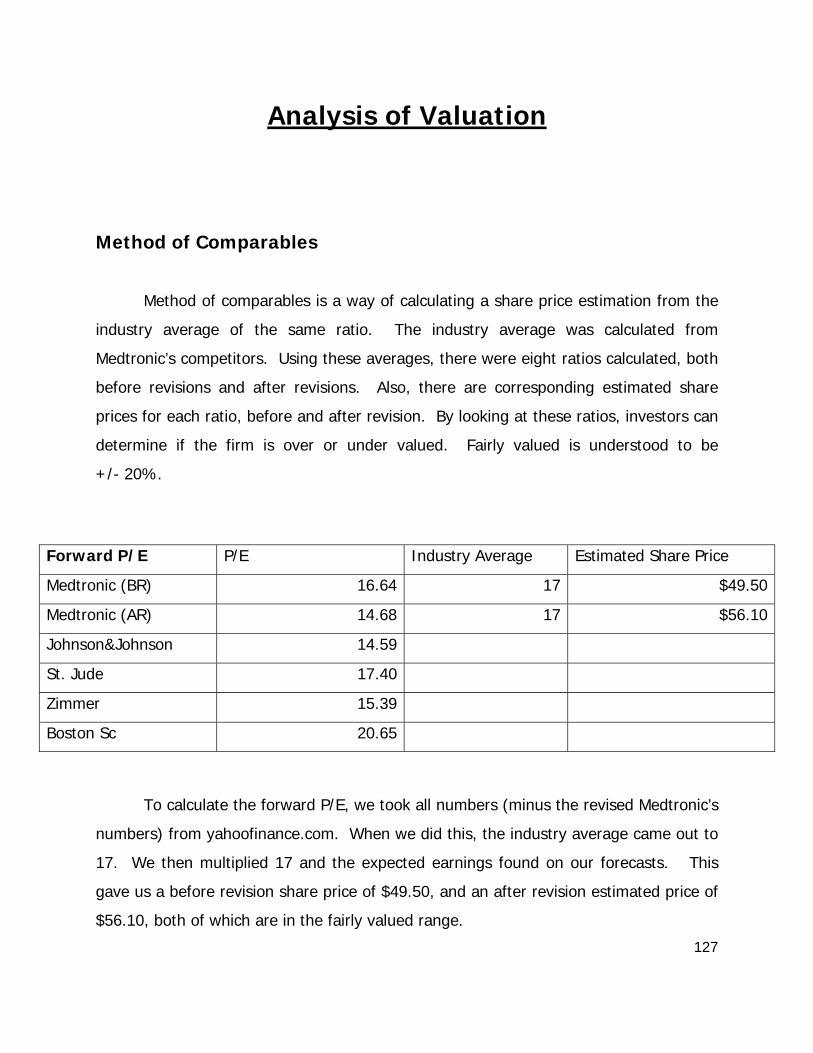
127
Analysis of Valuation
Method of Comparables
Method of comparables is a way of calculating a share price estimation from the
industry average of the same ratio. The industry average was calculated from
Medtronic’s competitors. Using these averages, there were eight ratios calculated, both
before revisions and after revisions. Also, there are corresponding estimated share
prices for each ratio, before and after revision. By looking at these ratios, investors can
determine if the firm is over or under valued. Fairly valued is understood to be
+/- 20%.
To calculate the forward P/E, we took all numbers (minus the revised Medtronic’s
numbers) from yahoofinance.com. When we did this, the industry average came out to
17. We then multiplied 17 and the expected earnings found on our forecasts. This
gave us a before revision share price of $49.50, and an after revision estimated price of
$56.10, both of which are in the fairly valued range.
Forward P/E P/E Industry Average Estimated Share Price
Medtronic (BR) 16.64 17 $49.50
Medtronic (AR) 14.68 17 $56.10
Johnson&Johnson 14.59
St. Jude 17.40
Zimmer 15.39
Boston Sc 20.65
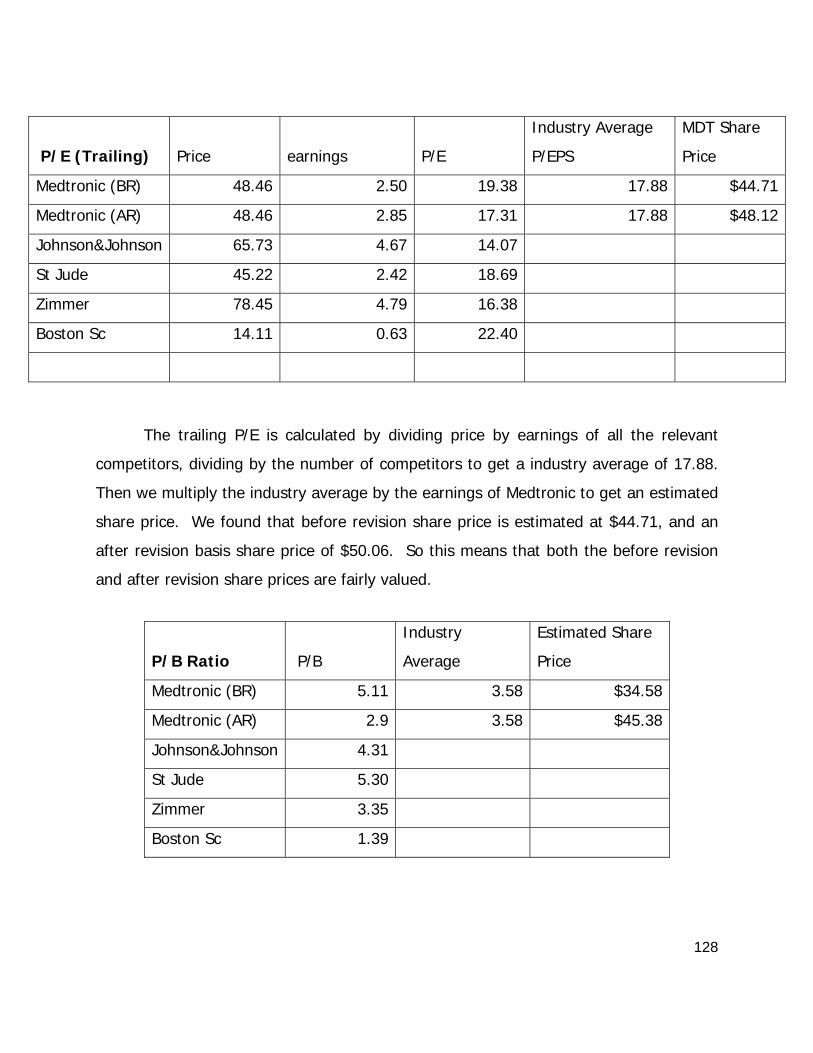
128
The trailing P/E is calculated by dividing price by earnings of all the relevant
competitors, dividing by the number of competitors to get a industry average of 17.88.
Then we multiply the industry average by the earnings of Medtronic to get an estimated
share price. We found that before revision share price is estimated at $44.71, and an
after revision basis share price of $50.06. So this means that both the before revision
and after revision share prices are fairly valued.
P/E (Trailing) Price earnings P/E
Industry Average
P/EPS
MDT Share
Price
Medtronic (BR) 48.46 2.50 19.38 17.88 $44.71
Medtronic (AR) 48.46 2.85 17.31 17.88 $48.12
Johnson&Johnson 65.73 4.67 14.07
St Jude 45.22 2.42 18.69
Zimmer 78.45 4.79 16.38
Boston Sc 14.11 0.63 22.40
P/B Ratio P/B
Industry
Average
Estimated Share
Price
Medtronic (BR) 5.11 3.58 $34.58
Medtronic (AR) 2.9 3.58 $45.38
Johnson&Johnson 4.31
St Jude 5.30
Zimmer 3.35
Boston Sc 1.39
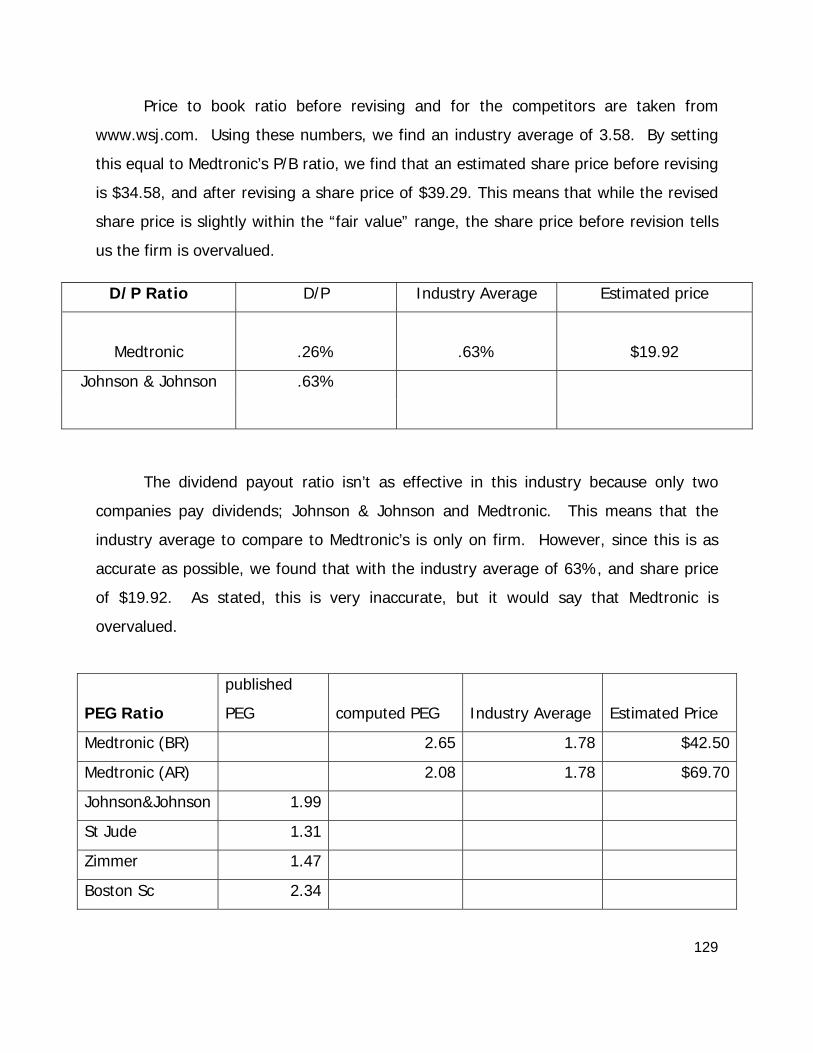
129
Price to book ratio before revising and for the competitors are taken from
www.wsj.com. Using these numbers, we find an industry average of 3.58. By setting
this equal to Medtronic’s P/B ratio, we find that an estimated share price before revising
is $34.58, and after revising a share price of $39.29. This means that while the revised
share price is slightly within the “fair value” range, the share price before revision tells
us the firm is overvalued.
D/P Ratio D/P Industry Average Estimated price
Medtronic .26% .63% $19.92
Johnson & Johnson .63%
The dividend payout ratio isn’t as effective in this industry because only two
companies pay dividends; Johnson & Johnson and Medtronic. This means that the
industry average to compare to Medtronic’s is only on firm. However, since this is as
accurate as possible, we found that with the industry average of 63%, and share price
of $19.92. As stated, this is very inaccurate, but it would say that Medtronic is
overvalued.
PEG Ratio
published
PEG computed PEG Industry Average Estimated Price
Medtronic (BR) 2.65 1.78 $42.50
Medtronic (AR) 2.08 1.78 $69.70
Johnson&Johnson 1.99
St Jude 1.31
Zimmer 1.47
Boston Sc 2.34
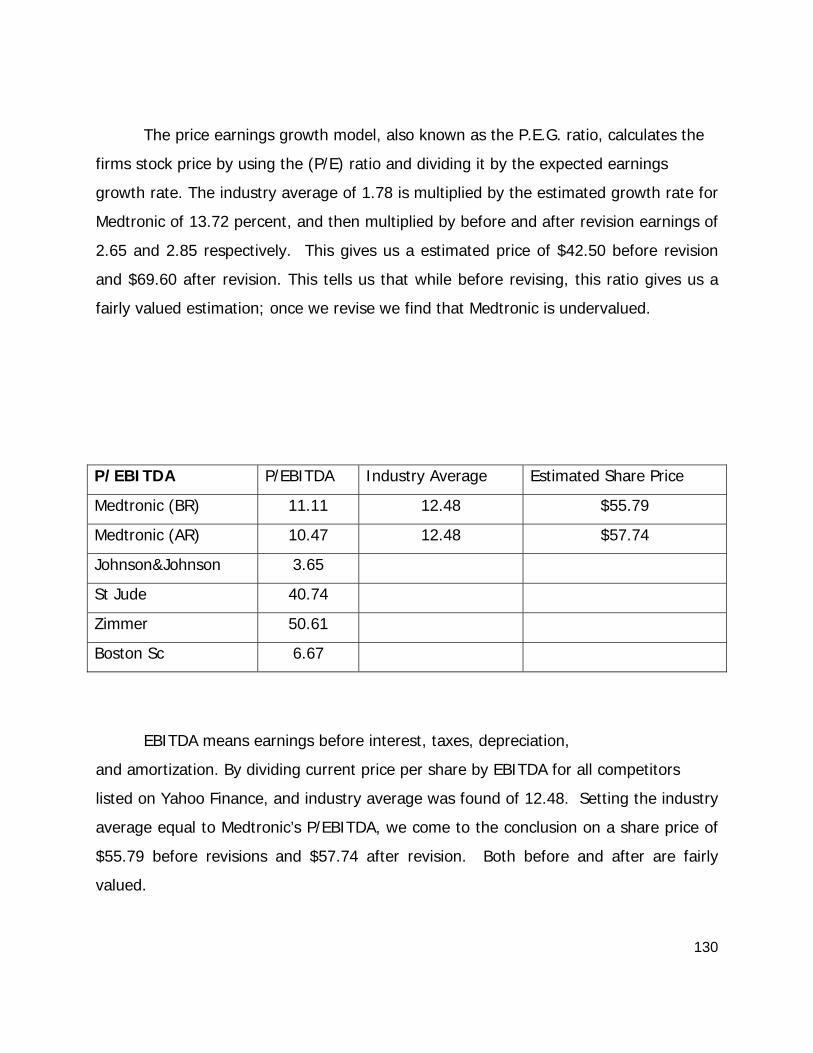
130
The price earnings growth model, also known as the P.E.G. ratio, calculates the
firms stock price by using the (P/E) ratio and dividing it by the expected earnings
growth rate. The industry average of 1.78 is multiplied by the estimated growth rate for
Medtronic of 13.72 percent, and then multiplied by before and after revision earnings of
2.65 and 2.85 respectively. This gives us a estimated price of $42.50 before revision
and $69.60 after revision. This tells us that while before revising, this ratio gives us a
fairly valued estimation; once we revise we find that Medtronic is undervalued.
EBITDA means earnings before interest, taxes, depreciation,
and amortization. By dividing current price per share by EBITDA for all competitors
listed on Yahoo Finance, and industry average was found of 12.48. Setting the industry
average equal to Medtronic’s P/EBITDA, we come to the conclusion on a share price of
$55.79 before revisions and $57.74 after revision. Both before and after are fairly
valued.
P/EBITDA P/EBITDA Industry Average Estimated Share Price
Medtronic (BR) 11.11 12.48 $55.79
Medtronic (AR) 10.47 12.48 $57.74
Johnson&Johnson 3.65
St Jude 40.74
Zimmer 50.61
Boston Sc 6.67
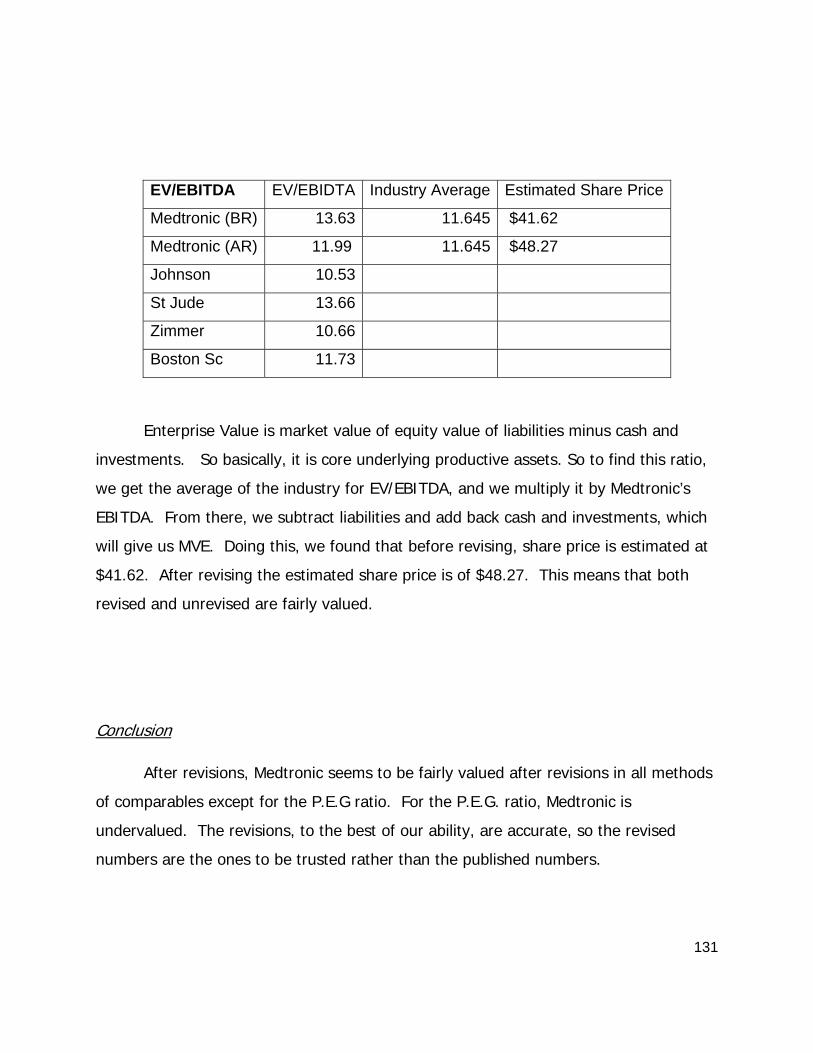
131
EV/EBITDA EV/EBIDTA Industry Average Estimated Share Price
Medtronic (BR) 13.63 11.645 $41.62
Medtronic (AR) 11.99 11.645 $48.27
Johnson 10.53
St Jude 13.66
Zimmer 10.66
Boston Sc 11.73
Enterprise Value is market value of equity value of liabilities minus cash and
investments. So basically, it is core underlying productive assets. So to find this ratio,
we get the average of the industry for EV/EBITDA, and we multiply it by Medtronic’s
EBITDA. From there, we subtract liabilities and add back cash and investments, which
will give us MVE. Doing this, we found that before revising, share price is estimated at
$41.62. After revising the estimated share price is of $48.27. This means that both
revised and unrevised are fairly valued.
Conclusion
After revisions, Medtronic seems to be fairly valued after revisions in all methods
of comparables except for the P.E.G ratio. For the P.E.G. ratio, Medtronic is
undervalued. The revisions, to the best of our ability, are accurate, so the revised
numbers are the ones to be trusted rather than the published numbers.
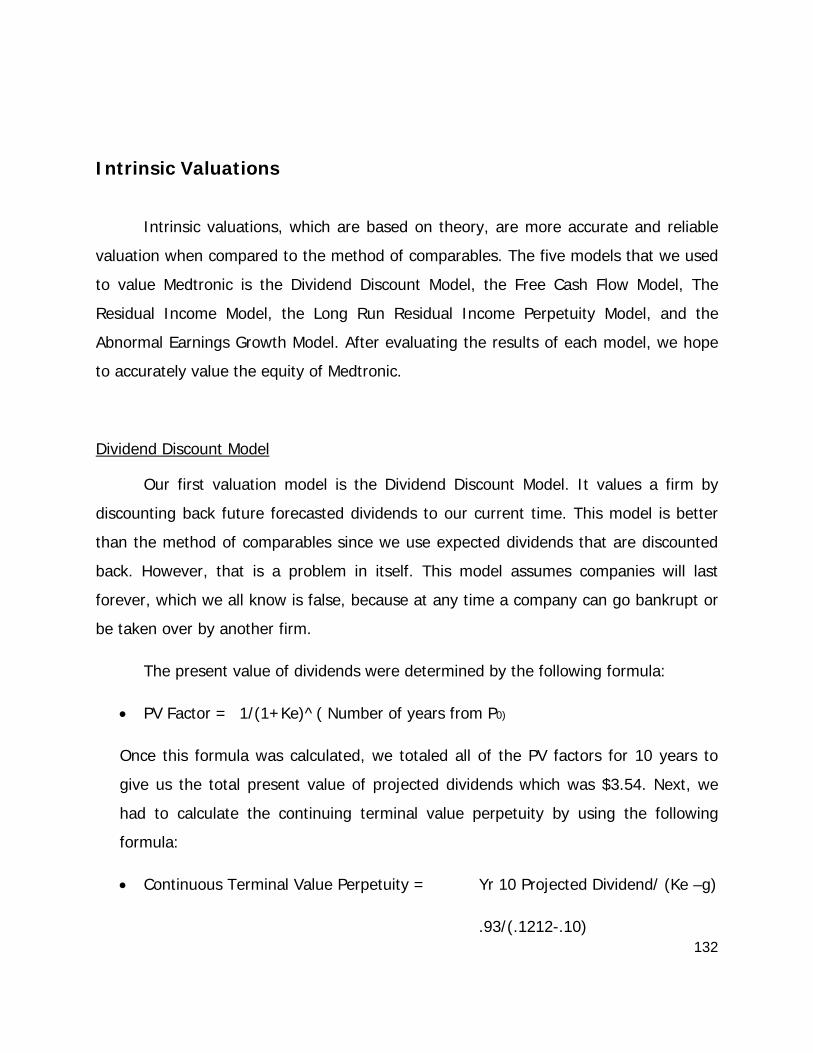
132
Intrinsic Valuations
Intrinsic valuations, which are based on theory, are more accurate and reliable
valuation when compared to the method of comparables. The five models that we used
to value Medtronic is the Dividend Discount Model, the Free Cash Flow Model, The
Residual Income Model, the Long Run Residual Income Perpetuity Model, and the
Abnormal Earnings Growth Model. After evaluating the results of each model, we hope
to accurately value the equity of Medtronic.
Dividend Discount Model
Our first valuation model is the Dividend Discount Model. It values a firm by
discounting back future forecasted dividends to our current time. This model is better
than the method of comparables since we use expected dividends that are discounted
back. However, that is a problem in itself. This model assumes companies will last
forever, which we all know is false, because at any time a company can go bankrupt or
be taken over by another firm.
The present value of dividends were determined by the following formula:
• PV Factor = 1/(1+Ke)^( Number of years from P0)
Once this formula was calculated, we totaled all of the PV factors for 10 years to
give us the total present value of projected dividends which was $3.54. Next, we
had to calculate the continuing terminal value perpetuity by using the following
formula:
• Continuous Terminal Value Perpetuity = Yr 10 Projected Dividend/ (Ke –g)
.93/(.1212-.10)
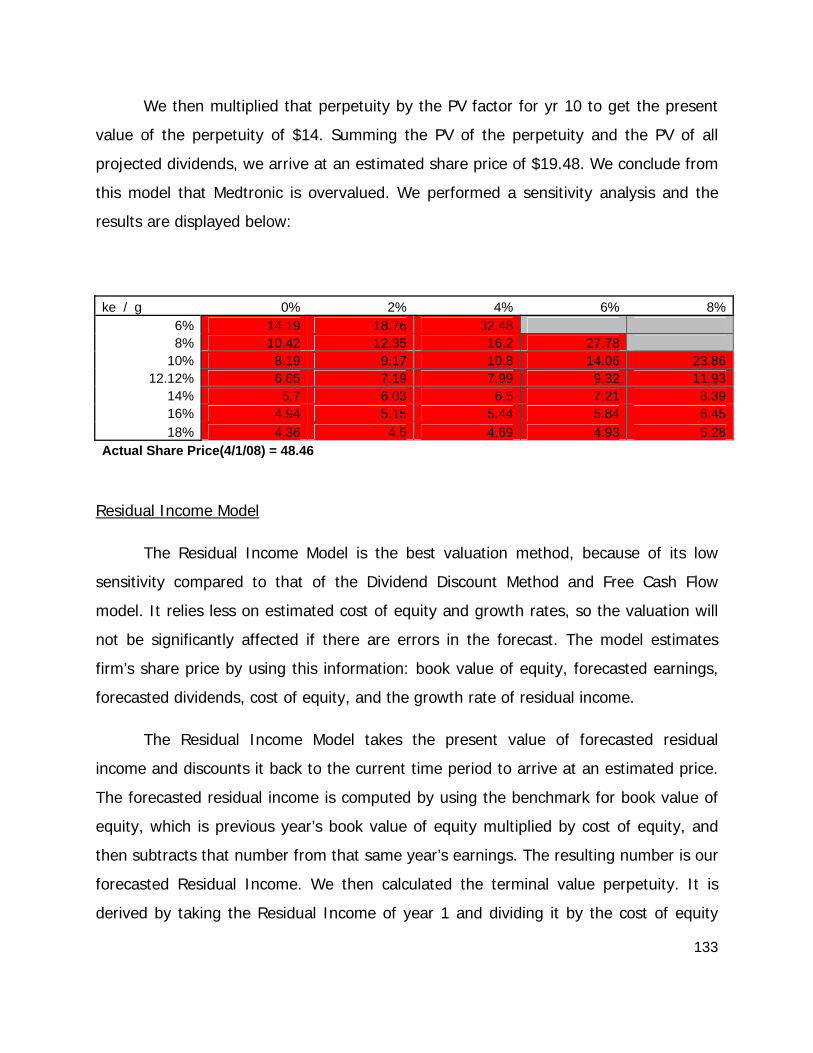
133
We then multiplied that perpetuity by the PV factor for yr 10 to get the present
value of the perpetuity of $14. Summing the PV of the perpetuity and the PV of all
projected dividends, we arrive at an estimated share price of $19.48. We conclude from
this model that Medtronic is overvalued. We performed a sensitivity analysis and the
results are displayed below:
ke / g 0% 2% 4% 6% 8%6% 14.19 18.76 32.48 8% 10.42 12.35 16.2 27.78
10% 8.19 9.17 10.8 14.06 23.8612.12% 6.65 7.19 7.99 9.32 11.93
14% 5.7 6.03 6.5 7.21 8.3916% 4.94 5.15 5.44 5.84 6.4518% 4.36 4.5 4.69 4.93 5.28
Actual Share Price(4/1/08) = 48.46
Residual Income Model
The Residual Income Model is the best valuation method, because of its low
sensitivity compared to that of the Dividend Discount Method and Free Cash Flow
model. It relies less on estimated cost of equity and growth rates, so the valuation will
not be significantly affected if there are errors in the forecast. The model estimates
firm’s share price by using this information: book value of equity, forecasted earnings,
forecasted dividends, cost of equity, and the growth rate of residual income.
The Residual Income Model takes the present value of forecasted residual
income and discounts it back to the current time period to arrive at an estimated price.
The forecasted residual income is computed by using the benchmark for book value of
equity, which is previous year’s book value of equity multiplied by cost of equity, and
then subtracts that number from that same year’s earnings. The resulting number is our
forecasted Residual Income. We then calculated the terminal value perpetuity. It is
derived by taking the Residual Income of year 1 and dividing it by the cost of equity
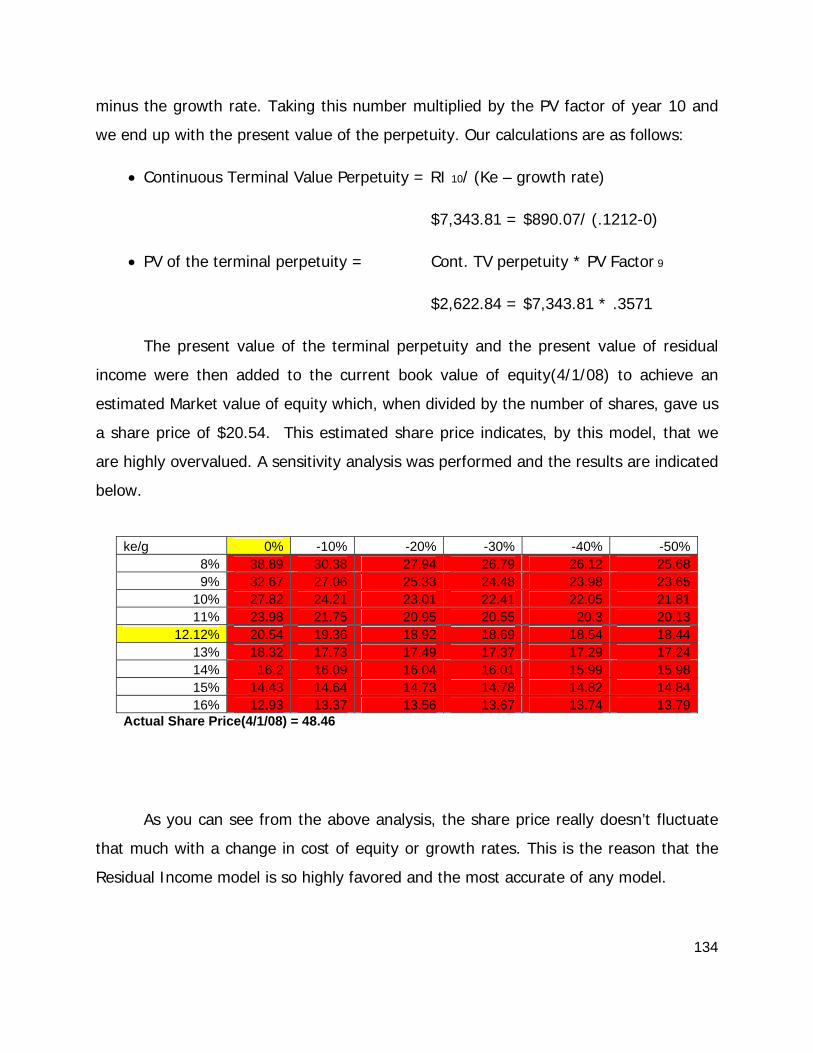
134
minus the growth rate. Taking this number multiplied by the PV factor of year 10 and
we end up with the present value of the perpetuity. Our calculations are as follows:
• Continuous Terminal Value Perpetuity = RI 10/ (Ke – growth rate)
$7,343.81 = $890.07/ (.1212-0)
• PV of the terminal perpetuity = Cont. TV perpetuity * PV Factor 9
$2,622.84 = $7,343.81 * .3571
The present value of the terminal perpetuity and the present value of residual
income were then added to the current book value of equity(4/1/08) to achieve an
estimated Market value of equity which, when divided by the number of shares, gave us
a share price of $20.54. This estimated share price indicates, by this model, that we
are highly overvalued. A sensitivity analysis was performed and the results are indicated
below.
As you can see from the above analysis, the share price really doesn’t fluctuate
that much with a change in cost of equity or growth rates. This is the reason that the
Residual Income model is so highly favored and the most accurate of any model.
ke/g 0% -10% -20% -30% -40% -50%8% 38.89 30.38 27.94 26.79 26.12 25.689% 32.67 27.06 25.33 24.48 23.98 23.65
10% 27.82 24.21 23.01 22.41 22.05 21.8111% 23.98 21.75 20.95 20.55 20.3 20.13
12.12% 20.54 19.36 18.92 18.69 18.54 18.4413% 18.32 17.73 17.49 17.37 17.29 17.2414% 16.2 16.09 16.04 16.01 15.99 15.9815% 14.43 14.64 14.73 14.78 14.82 14.8416% 12.93 13.37 13.56 13.67 13.74 13.79
Actual Share Price(4/1/08) = 48.46
135
Long Run Residual Income Model
The long run residual income model is a quick an easy way to evaluate a firm and get a
general valuation idea without spending too much time. This model uses four different
variables in calculating estimated market value of firm: average return on equity for the
past 5 years, long run equity growth rates, book value of equity, and a firm’s cost of
equity.
This model is computed by using the following formula:
• Market Value of Equity = Book Value of Equity *(1+(ROE-Ke)/(Ke-g))
• 22,642.33 = $10,977 *(1+(.25-.1212)/(.1212-0))
Estimated market value of equity is roughly 22.6 billion dollars. Taking this number and
dividing by the approximately 1.1 billion shares we estimate Medtronic’s share price to
be $22.45. As you can see this is considerably lower than the current observed share
price of $48.46 indicating Medtronic is overvalued.
Sensitivity analysis comparing the effects of different values of ROE, growth rate,
and Ke are covered below.
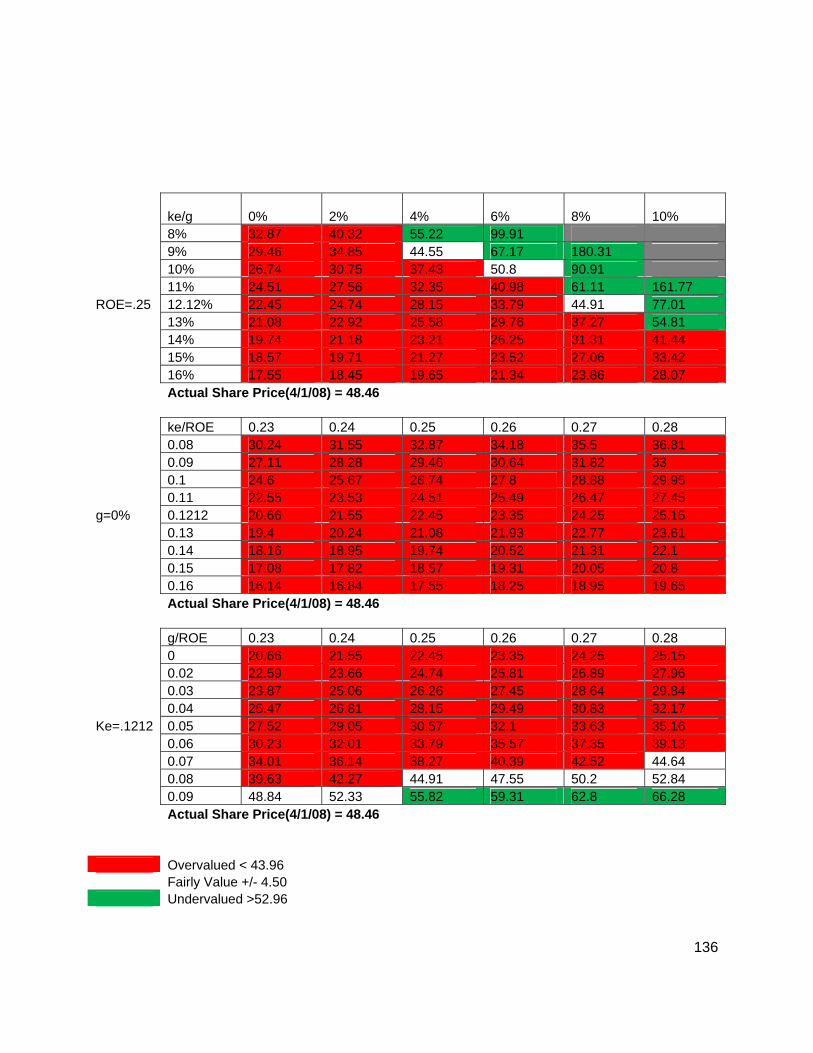
136
ke/g 0% 2% 4% 6% 8% 10% 8% 32.87 40.32 55.22 99.91 9% 29.46 34.85 44.55 67.17 180.31 10% 26.74 30.75 37.43 50.8 90.91 11% 24.51 27.56 32.35 40.98 61.11 161.77 ROE=.25 12.12% 22.45 24.74 28.15 33.79 44.91 77.01 13% 21.08 22.92 25.58 29.76 37.27 54.81 14% 19.74 21.18 23.21 26.25 31.31 41.44 15% 18.57 19.71 21.27 23.52 27.06 33.42 16% 17.55 18.45 19.65 21.34 23.86 28.07 Actual Share Price(4/1/08) = 48.46 ke/ROE 0.23 0.24 0.25 0.26 0.27 0.28 0.08 30.24 31.55 32.87 34.18 35.5 36.81 0.09 27.11 28.28 29.46 30.64 31.82 33 0.1 24.6 25.67 26.74 27.8 28.88 29.95 0.11 22.55 23.53 24.51 25.49 26.47 27.45 g=0% 0.1212 20.66 21.55 22.45 23.35 24.25 25.15 0.13 19.4 20.24 21.08 21.93 22.77 23.61 0.14 18.16 18.95 19.74 20.52 21.31 22.1 0.15 17.08 17.82 18.57 19.31 20.05 20.8 0.16 16.14 16.84 17.55 18.25 18.95 19.65 Actual Share Price(4/1/08) = 48.46 g/ROE 0.23 0.24 0.25 0.26 0.27 0.28 0 20.66 21.55 22.45 23.35 24.25 25.15 0.02 22.59 23.66 24.74 25.81 26.89 27.96 0.03 23.87 25.06 26.26 27.45 28.64 29.84 0.04 25.47 26.81 28.15 29.49 30.83 32.17 Ke=.1212 0.05 27.52 29.05 30.57 32.1 33.63 35.16 0.06 30.23 32.01 33.79 35.57 37.35 39.13 0.07 34.01 36.14 38.27 40.39 42.52 44.64 0.08 39.63 42.27 44.91 47.55 50.2 52.84 0.09 48.84 52.33 55.82 59.31 62.8 66.28 Actual Share Price(4/1/08) = 48.46 Overvalued < 43.96 Fairly Value +/- 4.50 Undervalued >52.96
137
The Abnormal Earnings Growth Model (AEG)
The AEG model’s goal is to make an intrinsic assessment of the market value of
equity by comparing the total wealth effect to shareholders with a benchmark return.
The total wealth effect is not simply the earnings in the year being referenced, the
model assume that a portion of the previous year’s dividends will be reinvested in the
company. Earnings on reinvested dividends (DRIP) is equal to the previous year’s
dividends times the cost of equity. Drip plus NI gives us cumulative dividend earnings.
The benchmark earnings is equal to NIt-1 times 1 plus cost of equity.
One of the benefits of AEG is the lack of sensitivity to growth assumptions.
Generally speaking, it has one of the highest R squared values, second only to the
Residual Income model. These two features make it a relatively successful model. In
reality, stocks often go up and down because of differences between expectations and
actual returns. A company expected to grow at 15% that returns growth of 10% will
see a decrease in market value, while a company expecting a 5% increase and
returning at 10% will see a rise in stock prices. This relationship between benchmark
and real return underlines the theoretical and practical soundness of the AEG model.
As was expected, AEG was one of our best performing models (very close to
estimates of the residual income models). Using our assumptions, a 12.12% cost of
equity and a -7% perpetuity growth rate, we came out with an intrinsic time consistent
share price of $22.44. While this was less than half of the reported price of $48.46, its
estimate was consistent with our other findings (in other higher performing models).
Through sensitivity analysis we discovered that the perpetuity growth rate had little
effect on our model. At our estimated cost of equity, changing the growth rate from 0%
to -40% only changed our share price by $17.5. Changes in cost of equity had a more
significant role. Taking growth out of the equation, if Medtronic could decrease their
cost of equity to 9% they would be able to raise their intrinsic share price to nearly $45.
This decrease in cost of equity increases the spread between cumulative dividend
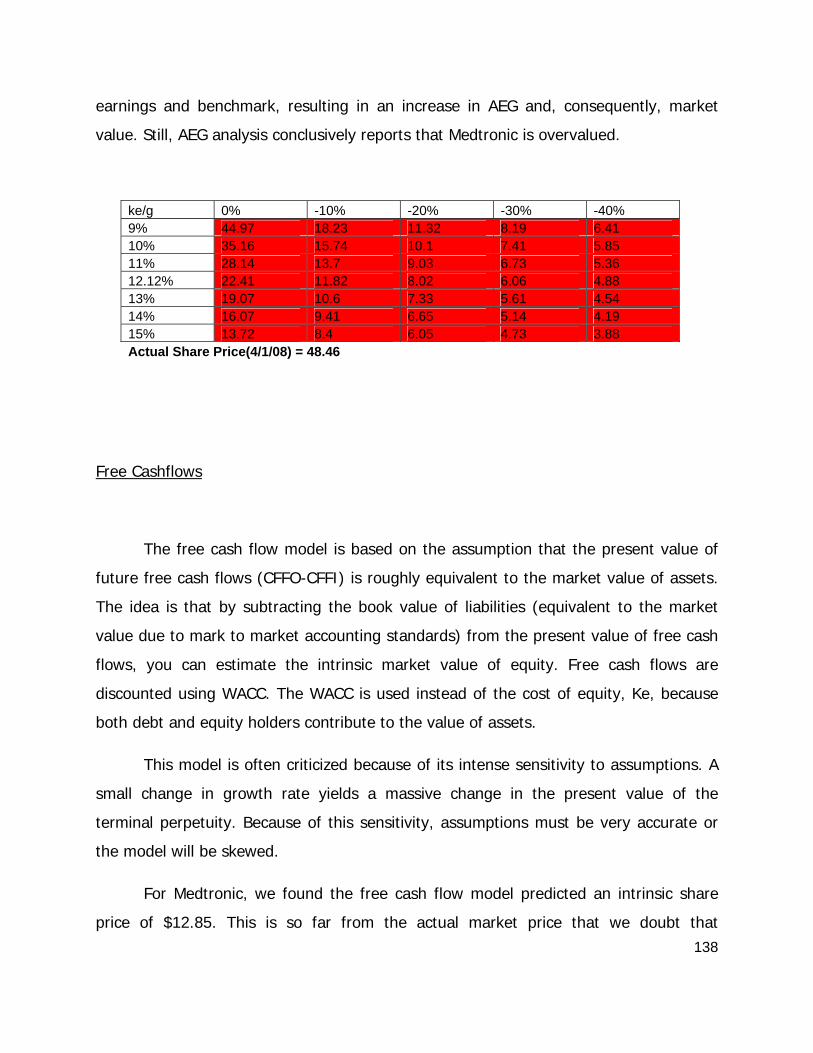
138
earnings and benchmark, resulting in an increase in AEG and, consequently, market
value. Still, AEG analysis conclusively reports that Medtronic is overvalued.
ke/g 0% -10% -20% -30% -40% 9% 44.97 18.23 11.32 8.19 6.41 10% 35.16 15.74 10.1 7.41 5.85 11% 28.14 13.7 9.03 6.73 5.36 12.12% 22.41 11.82 8.02 6.06 4.88 13% 19.07 10.6 7.33 5.61 4.54 14% 16.07 9.41 6.65 5.14 4.19 15% 13.72 8.4 6.05 4.73 3.88 Actual Share Price(4/1/08) = 48.46
Free Cashflows
The free cash flow model is based on the assumption that the present value of
future free cash flows (CFFO-CFFI) is roughly equivalent to the market value of assets.
The idea is that by subtracting the book value of liabilities (equivalent to the market
value due to mark to market accounting standards) from the present value of free cash
flows, you can estimate the intrinsic market value of equity. Free cash flows are
discounted using WACC. The WACC is used instead of the cost of equity, Ke, because
both debt and equity holders contribute to the value of assets.
This model is often criticized because of its intense sensitivity to assumptions. A
small change in growth rate yields a massive change in the present value of the
terminal perpetuity. Because of this sensitivity, assumptions must be very accurate or
the model will be skewed.
For Medtronic, we found the free cash flow model predicted an intrinsic share
price of $12.85. This is so far from the actual market price that we doubt that
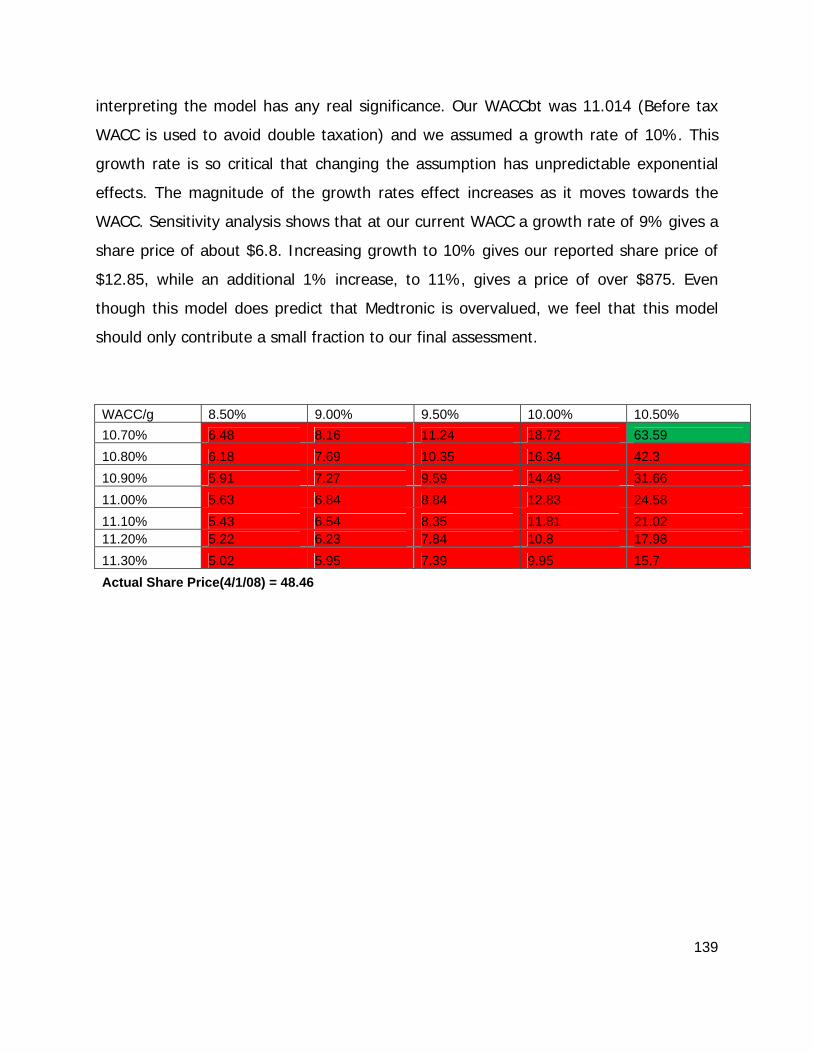
139
interpreting the model has any real significance. Our WACCbt was 11.014 (Before tax
WACC is used to avoid double taxation) and we assumed a growth rate of 10%. This
growth rate is so critical that changing the assumption has unpredictable exponential
effects. The magnitude of the growth rates effect increases as it moves towards the
WACC. Sensitivity analysis shows that at our current WACC a growth rate of 9% gives a
share price of about $6.8. Increasing growth to 10% gives our reported share price of
$12.85, while an additional 1% increase, to 11%, gives a price of over $875. Even
though this model does predict that Medtronic is overvalued, we feel that this model
should only contribute a small fraction to our final assessment.
WACC/g 8.50% 9.00% 9.50% 10.00% 10.50% 10.70% 6.48 8.16 11.24 18.72 63.59 10.80% 6.18 7.69 10.35 16.34 42.3 10.90% 5.91 7.27 9.59 14.49 31.66 11.00% 5.63 6.84 8.84 12.83 24.58 11.10% 5.43 6.54 8.35 11.81 21.02 11.20% 5.22 6.23 7.84 10.8 17.98 11.30% 5.02 5.95 7.39 9.95 15.7 Actual Share Price(4/1/08) = 48.46
140
Analysts’ Recommendation
After comparing results from a wide range of sources including multiple based
valuations and intrinsic model valuations, the initial conclusion was somewhat mixed.
Multiple based valuation, overall, rated Medtronic as a fairly valued company. The
results from intrinsic valuation models were quite different. Even our best performing
models (the RI models and AEG) found Medtronic as overvalued. One consequence of
multiples based valuation is the risk of evaluating your firm against and
over/undervalued industry. Because of this fact, we feel that the intrinsic models better
represent the value of the firm. We still will give some weight to the results of our
multiples based models in our final valuation. We believe that Medtronic is Slightly
Overvalued.
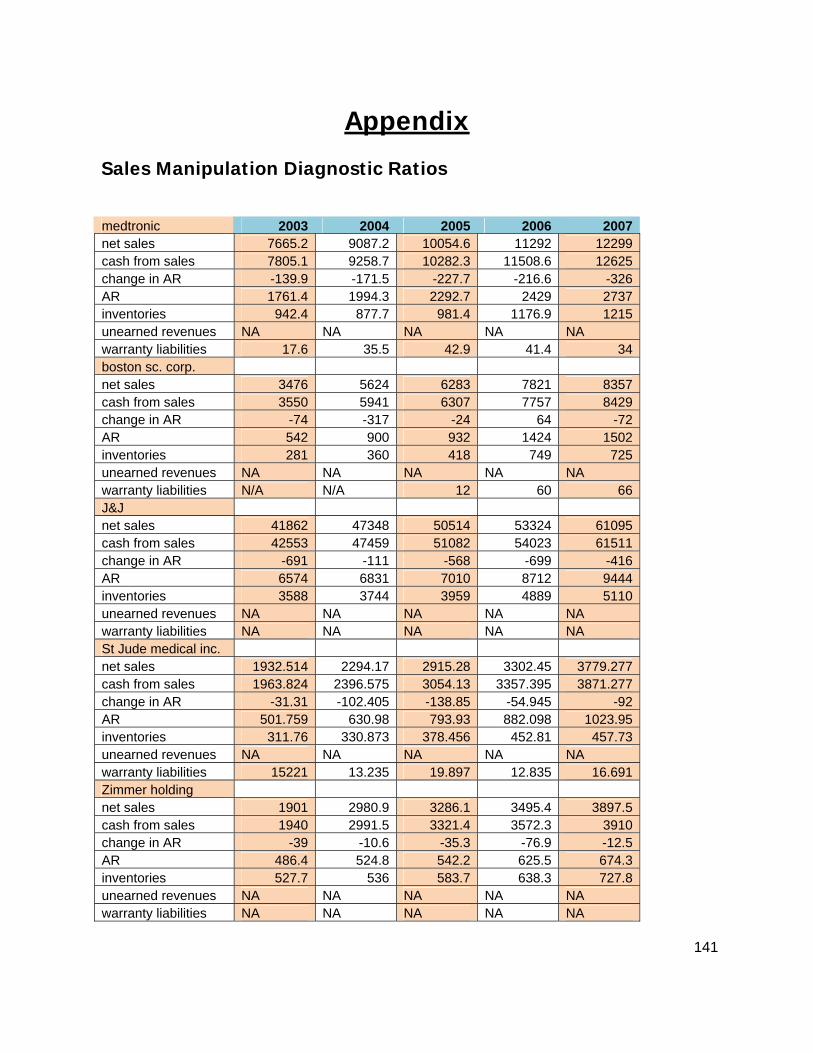
141
Appendix
Sales Manipulation Diagnostic Ratios
medtronic 2003 2004 2005 2006 2007 net sales 7665.2 9087.2 10054.6 11292 12299 cash from sales 7805.1 9258.7 10282.3 11508.6 12625 change in AR -139.9 -171.5 -227.7 -216.6 -326 AR 1761.4 1994.3 2292.7 2429 2737 inventories 942.4 877.7 981.4 1176.9 1215 unearned revenues NA NA NA NA NA warranty liabilities 17.6 35.5 42.9 41.4 34 boston sc. corp. net sales 3476 5624 6283 7821 8357 cash from sales 3550 5941 6307 7757 8429 change in AR -74 -317 -24 64 -72 AR 542 900 932 1424 1502 inventories 281 360 418 749 725 unearned revenues NA NA NA NA NA warranty liabilities N/A N/A 12 60 66 J&J net sales 41862 47348 50514 53324 61095 cash from sales 42553 47459 51082 54023 61511 change in AR -691 -111 -568 -699 -416 AR 6574 6831 7010 8712 9444 inventories 3588 3744 3959 4889 5110 unearned revenues NA NA NA NA NA warranty liabilities NA NA NA NA NA St Jude medical inc. net sales 1932.514 2294.17 2915.28 3302.45 3779.277 cash from sales 1963.824 2396.575 3054.13 3357.395 3871.277 change in AR -31.31 -102.405 -138.85 -54.945 -92 AR 501.759 630.98 793.93 882.098 1023.95 inventories 311.76 330.873 378.456 452.81 457.73 unearned revenues NA NA NA NA NA warranty liabilities 15221 13.235 19.897 12.835 16.691 Zimmer holding net sales 1901 2980.9 3286.1 3495.4 3897.5 cash from sales 1940 2991.5 3321.4 3572.3 3910 change in AR -39 -10.6 -35.3 -76.9 -12.5 AR 486.4 524.8 542.2 625.5 674.3 inventories 527.7 536 583.7 638.3 727.8 unearned revenues NA NA NA NA NA warranty liabilities NA NA NA NA NA
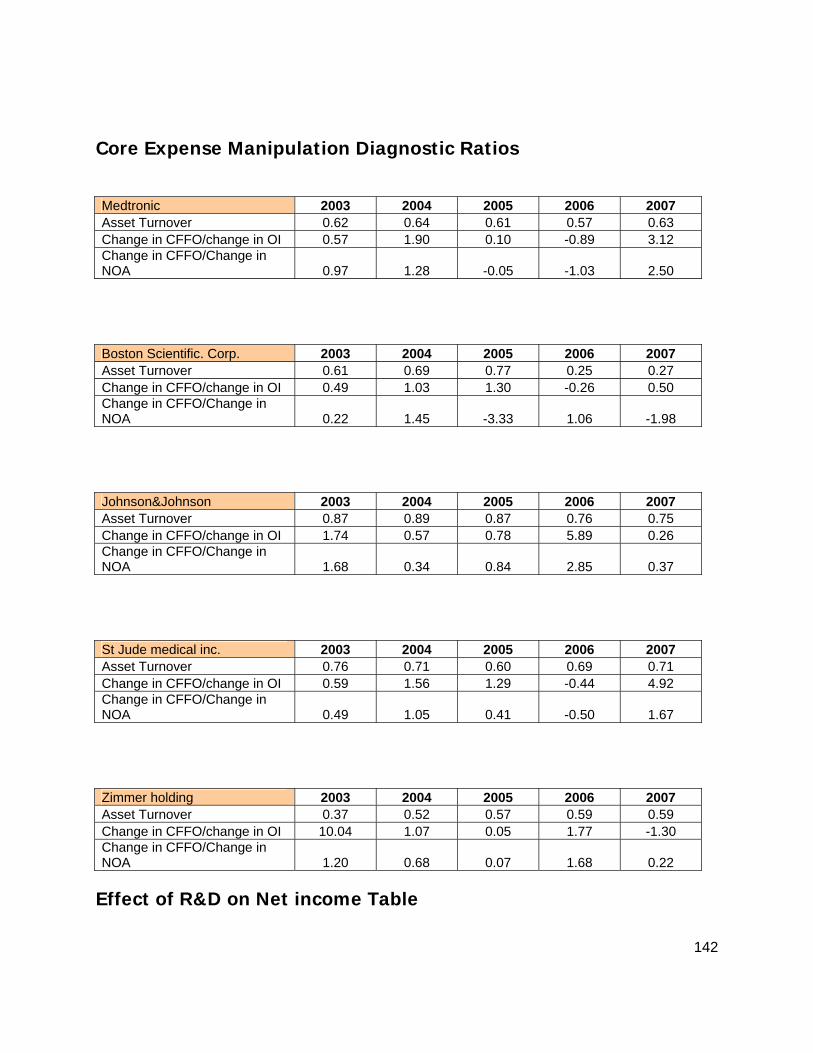
142
Core Expense Manipulation Diagnostic Ratios
Medtronic 2003 2004 2005 2006 2007 Asset Turnover 0.62 0.64 0.61 0.57 0.63 Change in CFFO/change in OI 0.57 1.90 0.10 -0.89 3.12 Change in CFFO/Change in NOA 0.97 1.28 -0.05 -1.03 2.50 Boston Scientific. Corp. 2003 2004 2005 2006 2007 Asset Turnover 0.61 0.69 0.77 0.25 0.27 Change in CFFO/change in OI 0.49 1.03 1.30 -0.26 0.50 Change in CFFO/Change in NOA 0.22 1.45 -3.33 1.06 -1.98 Johnson&Johnson 2003 2004 2005 2006 2007 Asset Turnover 0.87 0.89 0.87 0.76 0.75 Change in CFFO/change in OI 1.74 0.57 0.78 5.89 0.26 Change in CFFO/Change in NOA 1.68 0.34 0.84 2.85 0.37 St Jude medical inc. 2003 2004 2005 2006 2007 Asset Turnover 0.76 0.71 0.60 0.69 0.71 Change in CFFO/change in OI 0.59 1.56 1.29 -0.44 4.92 Change in CFFO/Change in NOA 0.49 1.05 0.41 -0.50 1.67 Zimmer holding 2003 2004 2005 2006 2007 Asset Turnover 0.37 0.52 0.57 0.59 0.59 Change in CFFO/change in OI 10.04 1.07 0.05 1.77 -1.30 Change in CFFO/Change in NOA 1.20 0.68 0.07 1.68 0.22
Effect of R&D on Net income Table
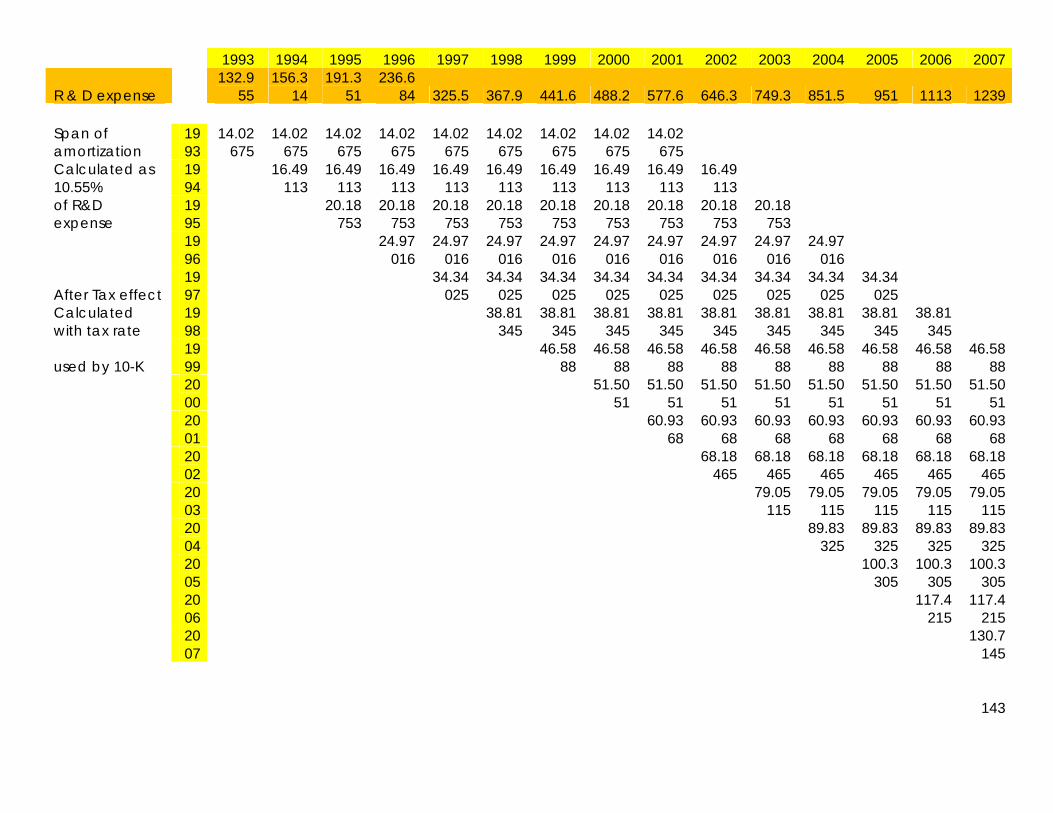
143
1993 1994 1995 1996 1997 1998 1999 2000 2001 2002 2003 2004 2005 2006 2007
R & D expense 132.9
55 156.3
14 191.3
51 236.6
84 325.5 367.9 441.6 488.2 577.6 646.3 749.3 851.5 951 1113 1239 Span of amortization
1993
14.02675
14.02675
14.02675
14.02675
14.02675
14.02675
14.02675
14.02675
14.02675
Calculated as 10.55%
1994
16.49113
16.49113
16.49113
16.49113
16.49113
16.49113
16.49113
16.49113
16.49113
of R&D expense
1995
20.18753
20.18753
20.18753
20.18753
20.18753
20.18753
20.18753
20.18753
20.18753
1996
24.97016
24.97016
24.97016
24.97016
24.97016
24.97016
24.97016
24.97016
24.97016
After Tax effect 1997
34.34025
34.34025
34.34025
34.34025
34.34025
34.34025
34.34025
34.34025
34.34025
Calculated with tax rate
1998
38.81345
38.81345
38.81345
38.81345
38.81345
38.81345
38.81345
38.81345
38.81345
used by 10-K 1999
46.5888
46.5888
46.5888
46.5888
46.5888
46.5888
46.5888
46.5888
46.5888
2000
51.5051
51.5051
51.5051
51.5051
51.5051
51.5051
51.5051
51.5051
2001
60.9368
60.9368
60.9368
60.9368
60.9368
60.9368
60.9368
2002
68.18465
68.18465
68.18465
68.18465
68.18465
68.18465
2003
79.05115
79.05115
79.05115
79.05115
79.05115
2004
89.83325
89.83325
89.83325
89.83325
2005
100.3305
100.3305
100.3305
2006
117.4215
117.4215
2007
130.7145
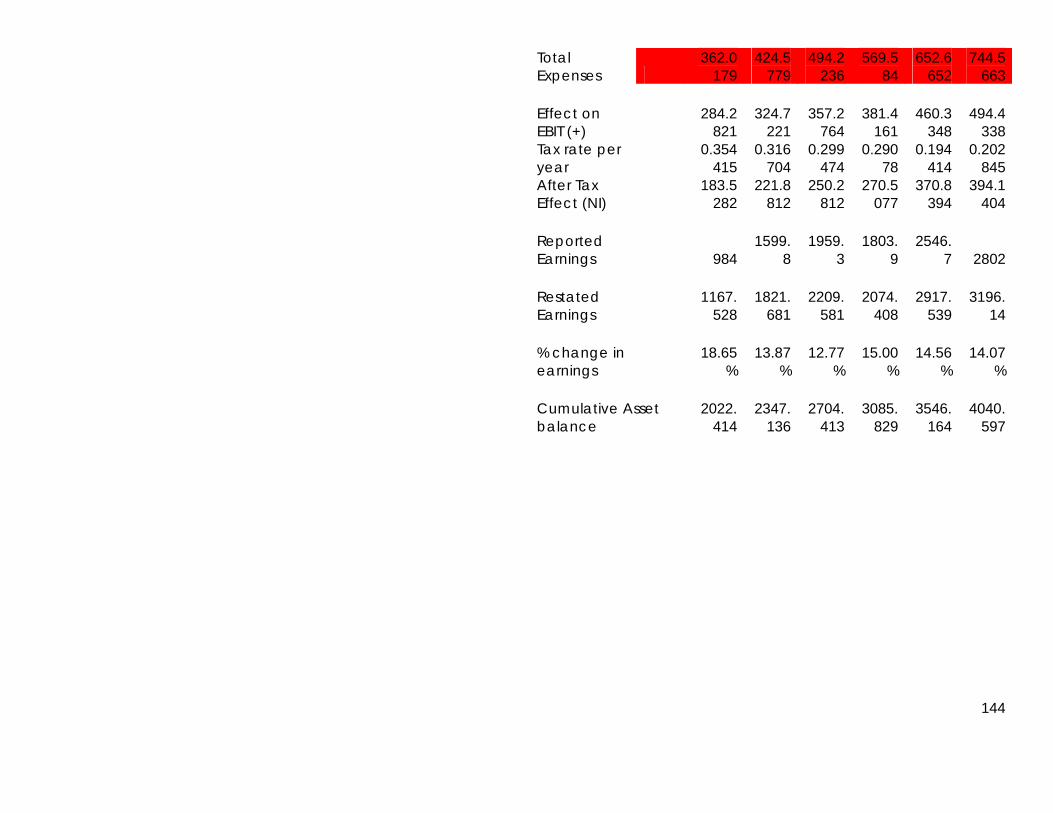
144
Total Expenses
362.0179
424.5779
494.2236
569.584
652.6652
744.5663
Effect on EBIT (+)
284.2821
324.7221
357.2764
381.4161
460.3348
494.4338
Tax rate per year
0.354415
0.316704
0.299474
0.29078
0.194414
0.202845
After Tax Effect (NI)
183.5282
221.8812
250.2812
270.5077
370.8394
394.1404
Reported Earnings 984
1599.8
1959.3
1803.9
2546.7 2802
Restated Earnings
1167.528
1821.681
2209.581
2074.408
2917.539
3196.14
% change in earnings
18.65%
13.87%
12.77%
15.00%
14.56%
14.07%
Cumulative Asset balance
2022.414
2347.136
2704.413
3085.829
3546.164
4040.597
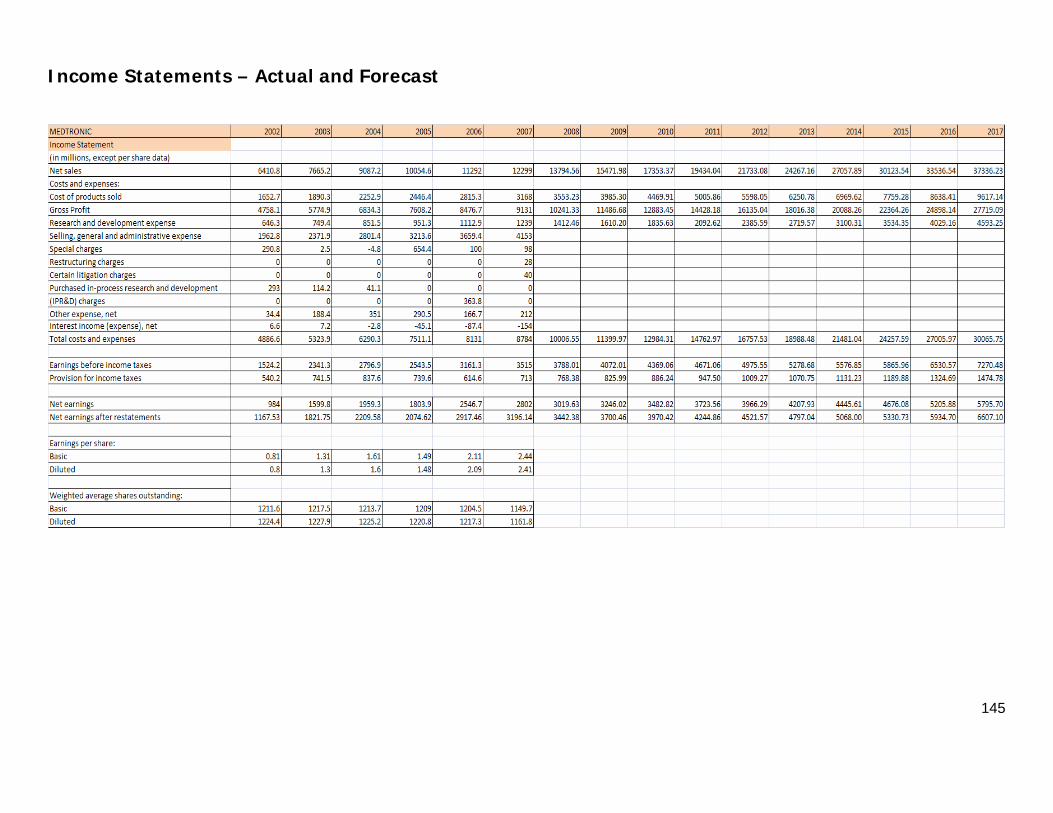
145
Income Statements – Actual and Forecast
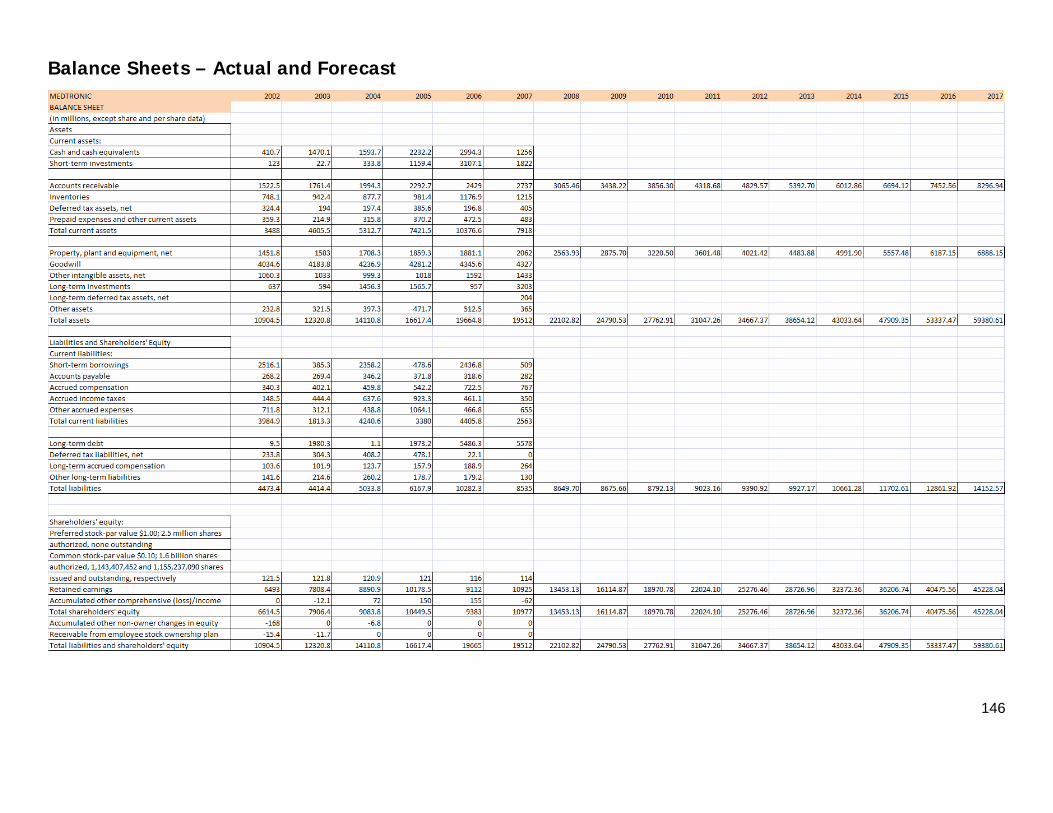
146
Balance Sheets – Actual and Forecast
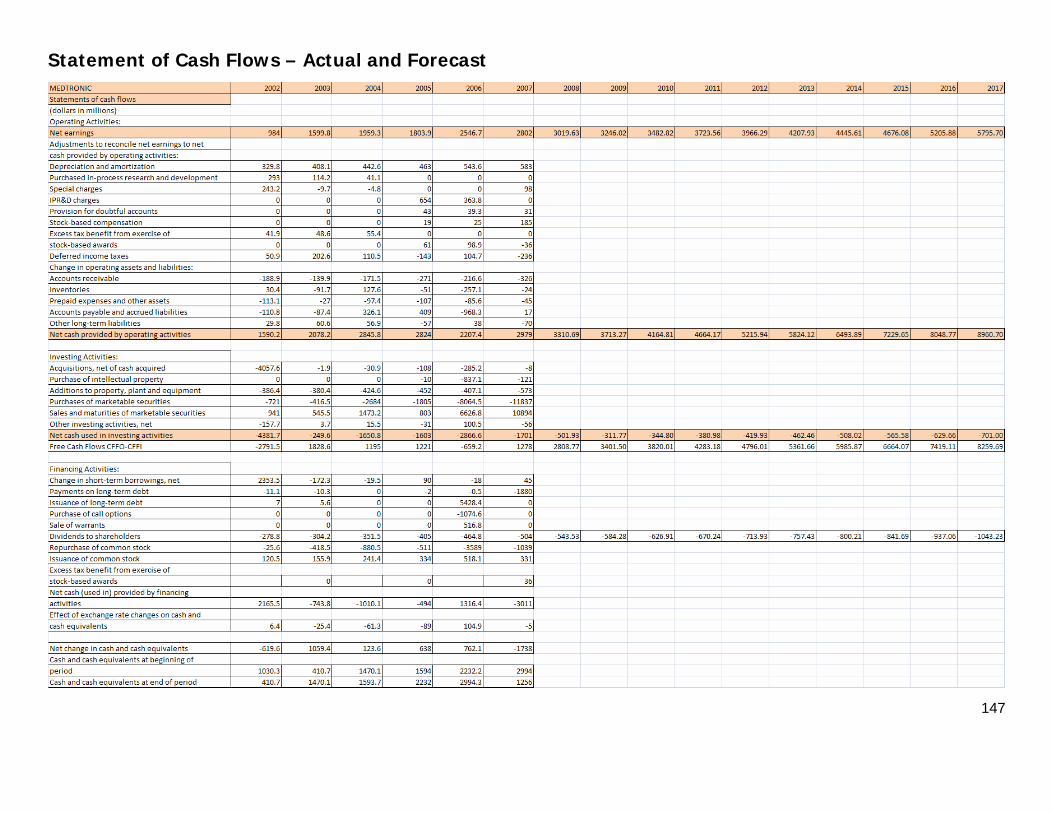
147
Statement of Cash Flows – Actual and Forecast
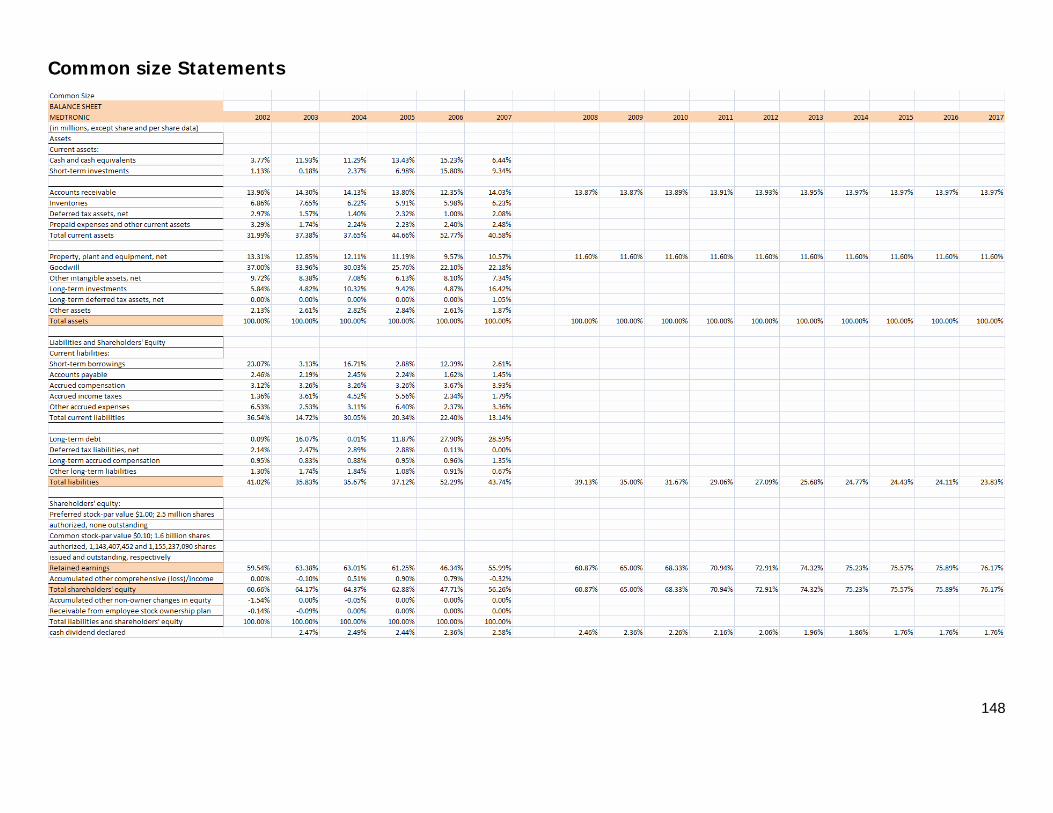
148
Common size Statements
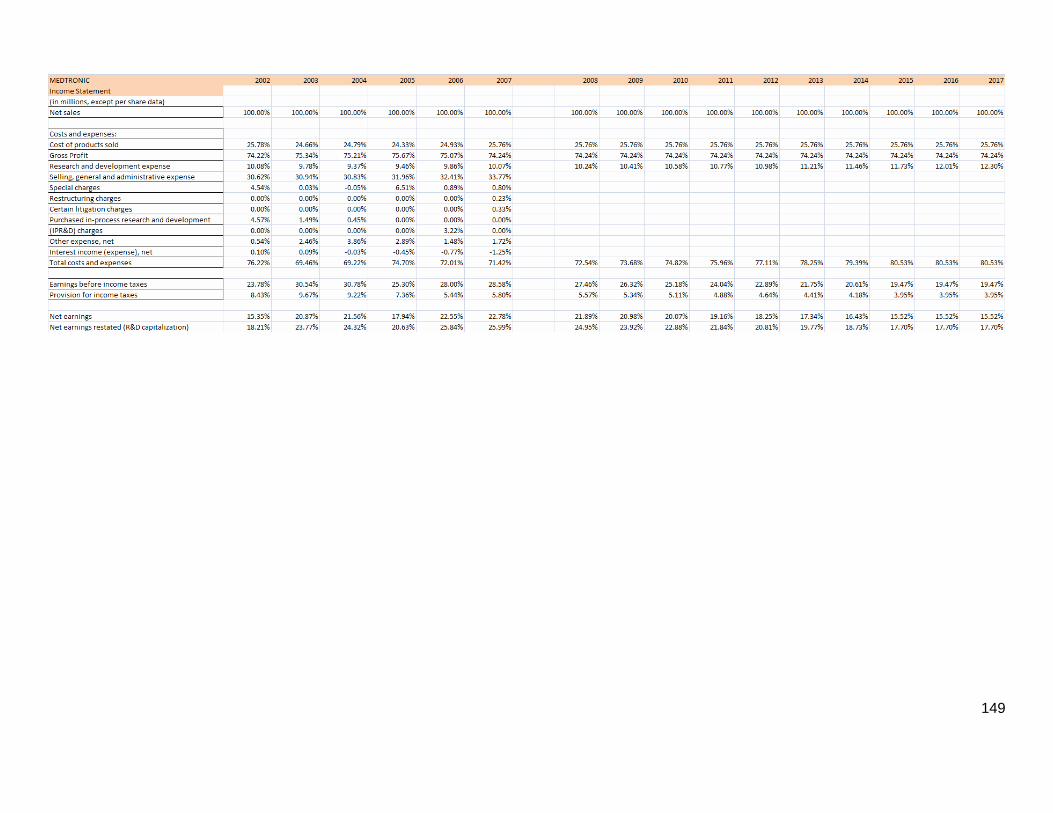
149
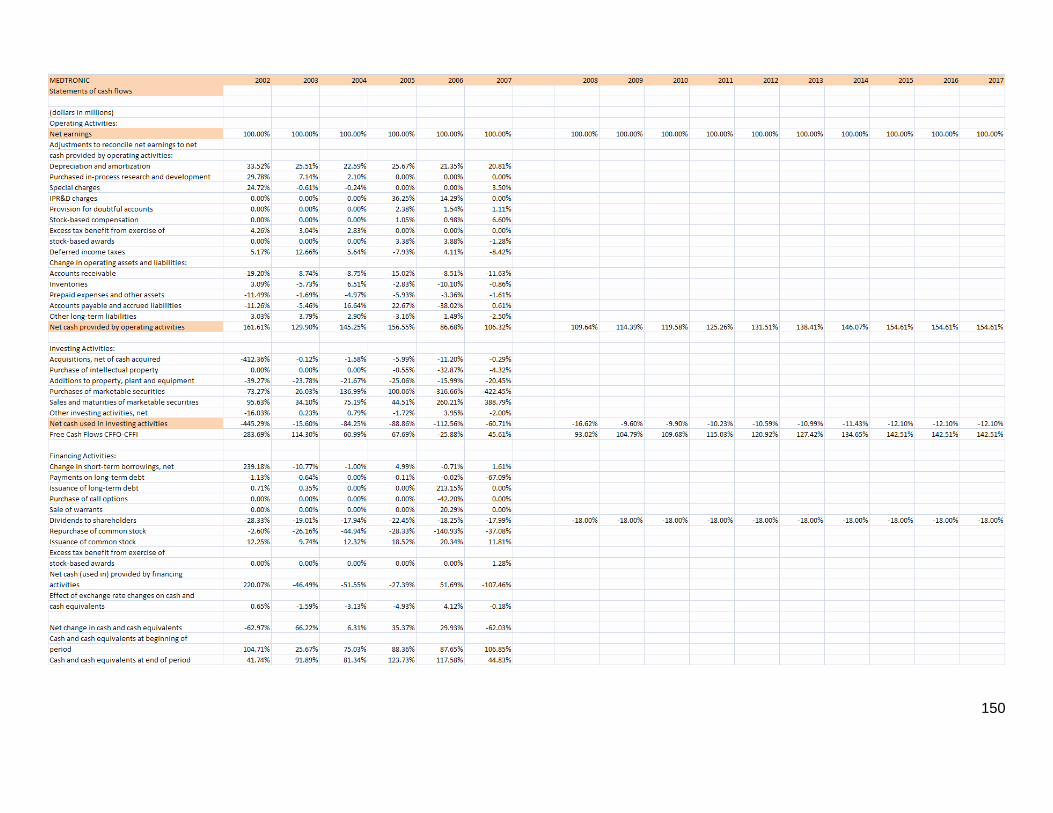
150
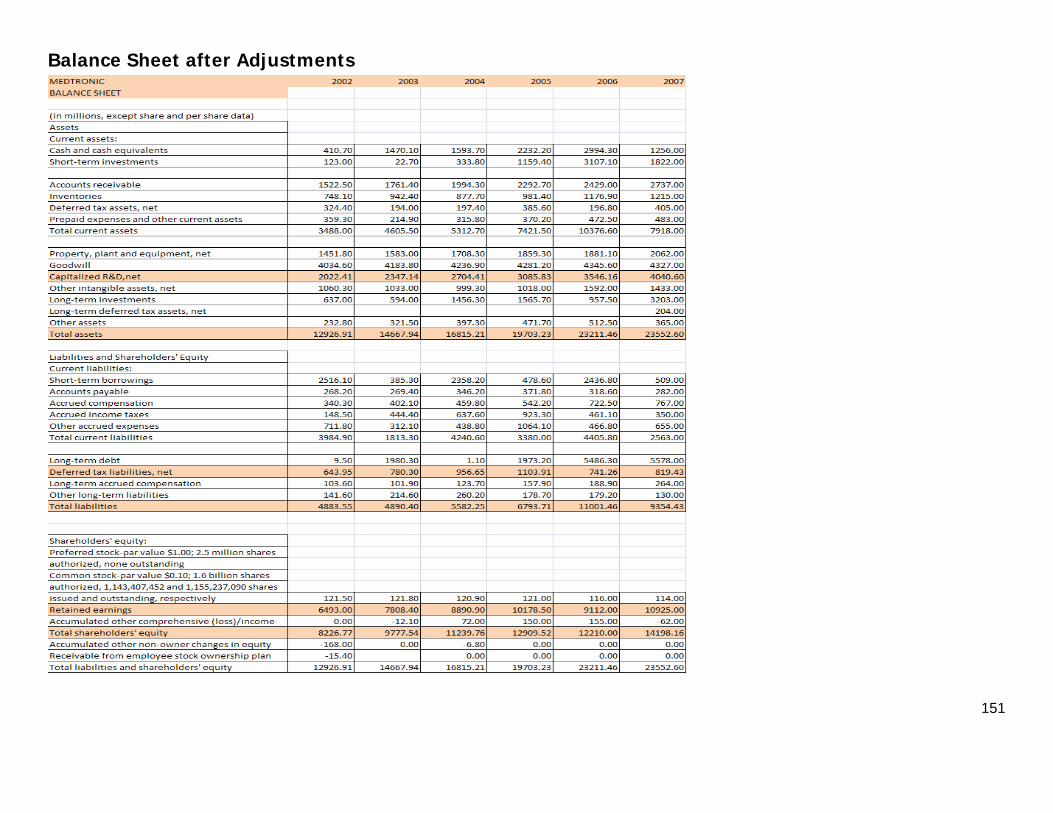
151
Balance Sheet after Adjustments
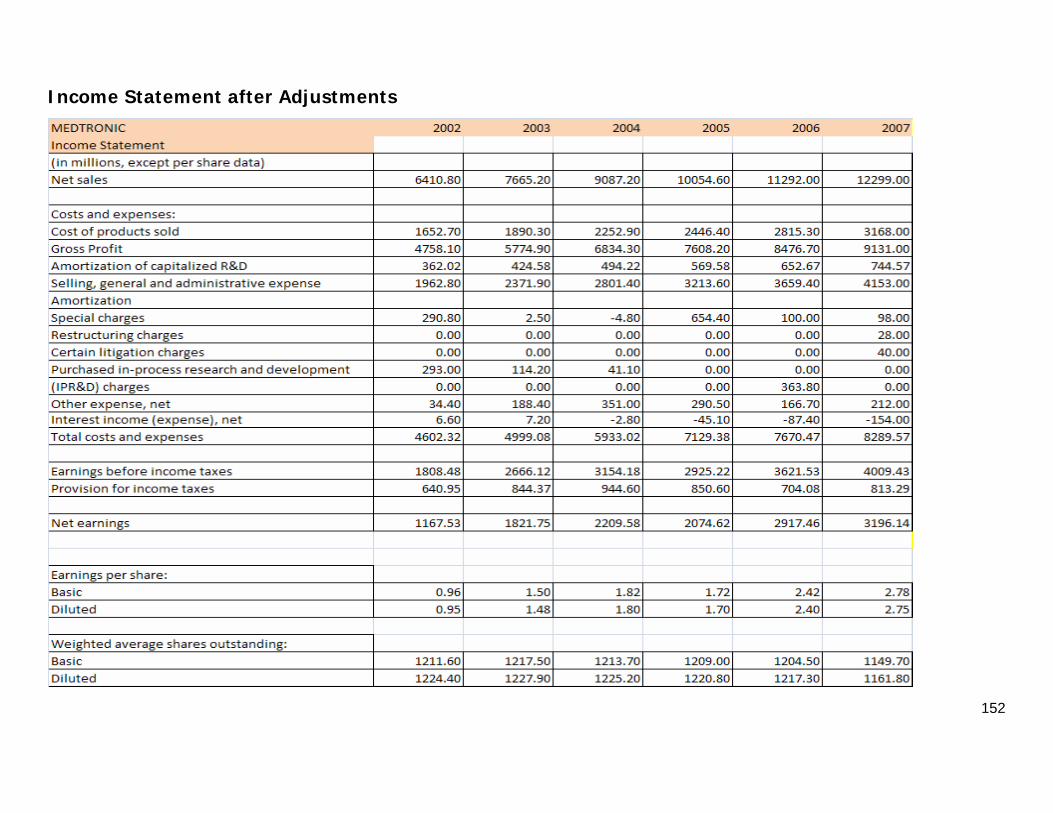
152
Income Statement after Adjustments
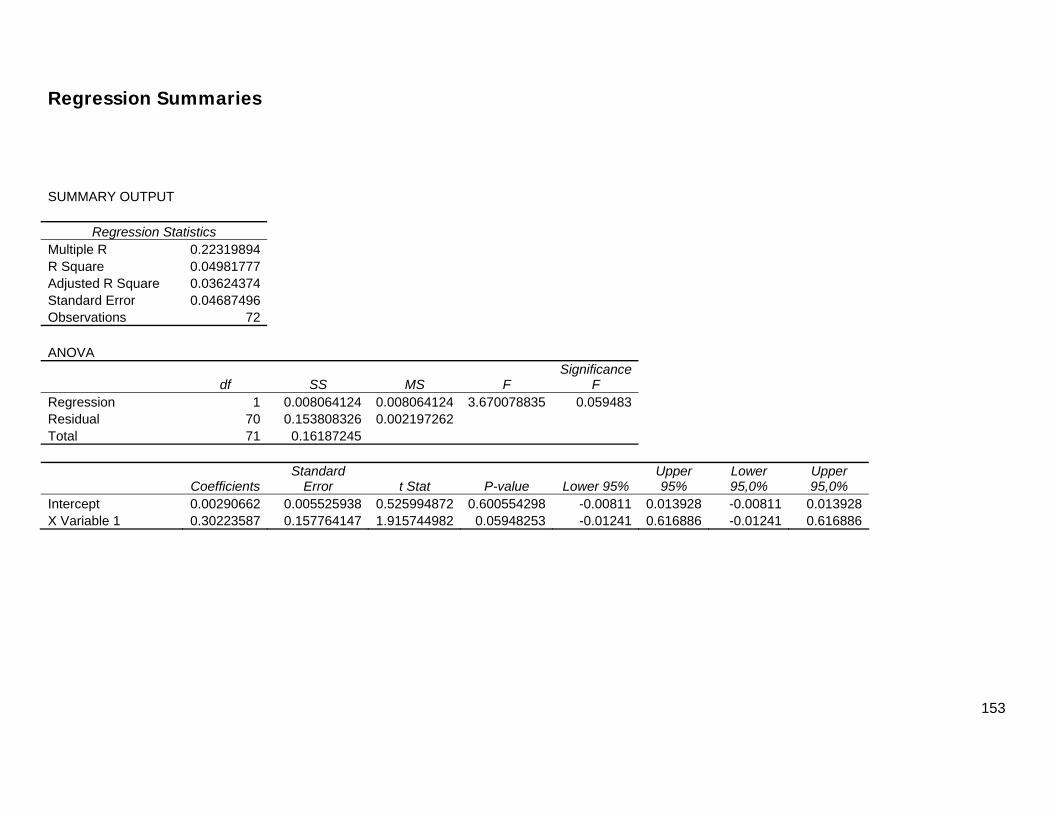
153
Regression Summaries
SUMMARY OUTPUT
Regression Statistics Multiple R 0.22319894 R Square 0.04981777 Adjusted R Square 0.03624374 Standard Error 0.04687496 Observations 72 ANOVA
df SS MS F Significance
F Regression 1 0.008064124 0.008064124 3.670078835 0.059483 Residual 70 0.153808326 0.002197262 Total 71 0.16187245
Coefficients Standard
Error t Stat P-value Lower 95% Upper 95%
Lower 95,0%
Upper 95,0%
Intercept 0.00290662 0.005525938 0.525994872 0.600554298 -0.00811 0.013928 -0.00811 0.013928X Variable 1 0.30223587 0.157764147 1.915744982 0.05948253 -0.01241 0.616886 -0.01241 0.616886
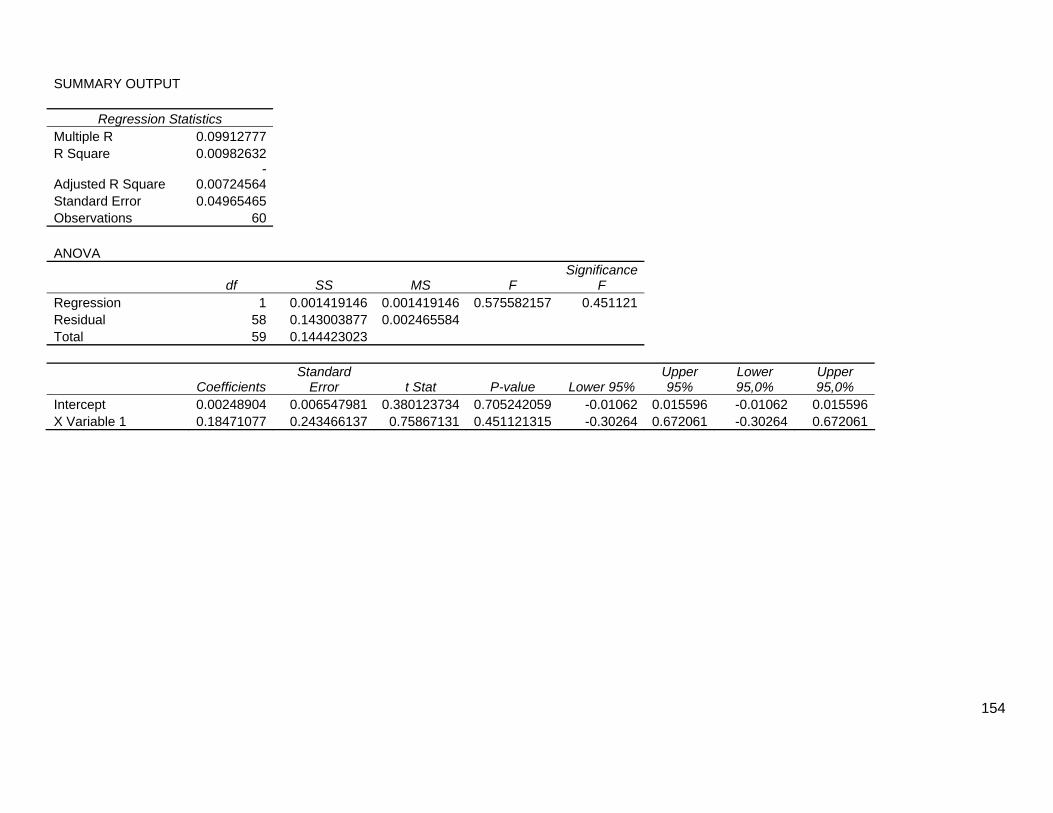
154
SUMMARY OUTPUT
Regression Statistics Multiple R 0.09912777 R Square 0.00982632
Adjusted R Square -
0.00724564 Standard Error 0.04965465 Observations 60 ANOVA
df SS MS F Significance
F Regression 1 0.001419146 0.001419146 0.575582157 0.451121 Residual 58 0.143003877 0.002465584 Total 59 0.144423023
Coefficients Standard
Error t Stat P-value Lower 95% Upper 95%
Lower 95,0%
Upper 95,0%
Intercept 0.00248904 0.006547981 0.380123734 0.705242059 -0.01062 0.015596 -0.01062 0.015596X Variable 1 0.18471077 0.243466137 0.75867131 0.451121315 -0.30264 0.672061 -0.30264 0.672061
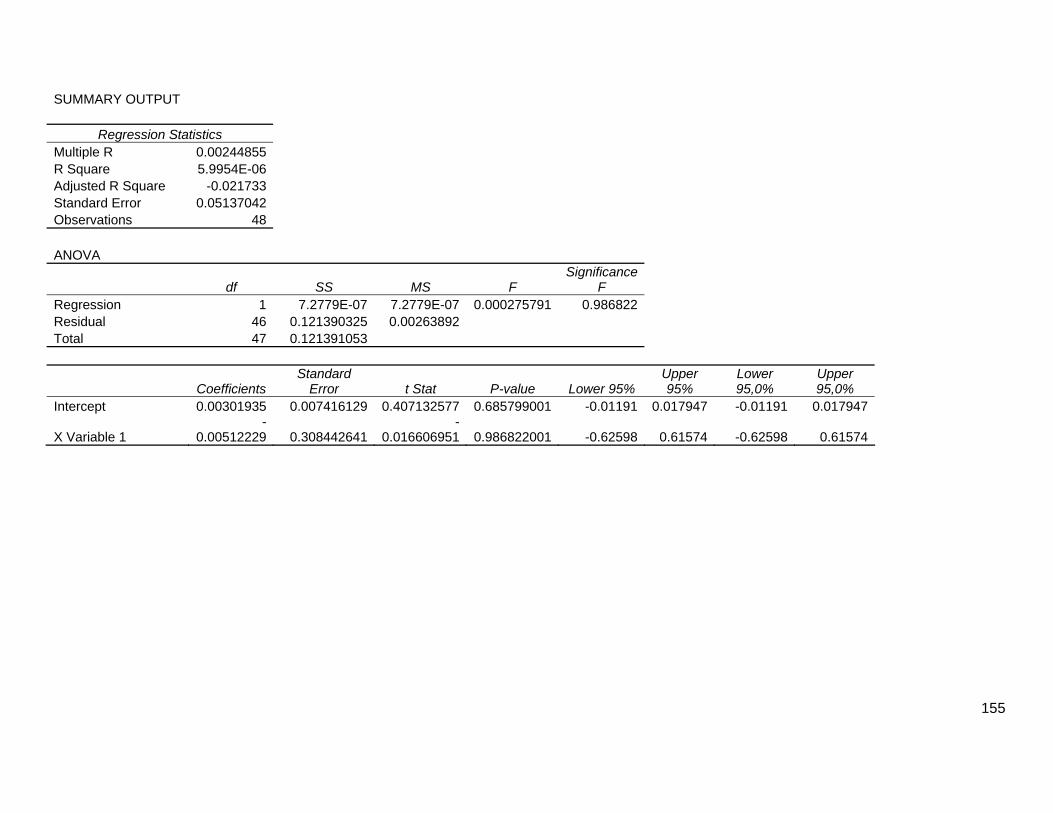
155
SUMMARY OUTPUT
Regression Statistics Multiple R 0.00244855 R Square 5.9954E-06 Adjusted R Square -0.021733 Standard Error 0.05137042 Observations 48 ANOVA
df SS MS F Significance
F Regression 1 7.2779E-07 7.2779E-07 0.000275791 0.986822 Residual 46 0.121390325 0.00263892 Total 47 0.121391053
Coefficients Standard
Error t Stat P-value Lower 95% Upper 95%
Lower 95,0%
Upper 95,0%
Intercept 0.00301935 0.007416129 0.407132577 0.685799001 -0.01191 0.017947 -0.01191 0.017947
X Variable 1 -
0.00512229 0.308442641-
0.016606951 0.986822001 -0.62598 0.61574 -0.62598 0.61574
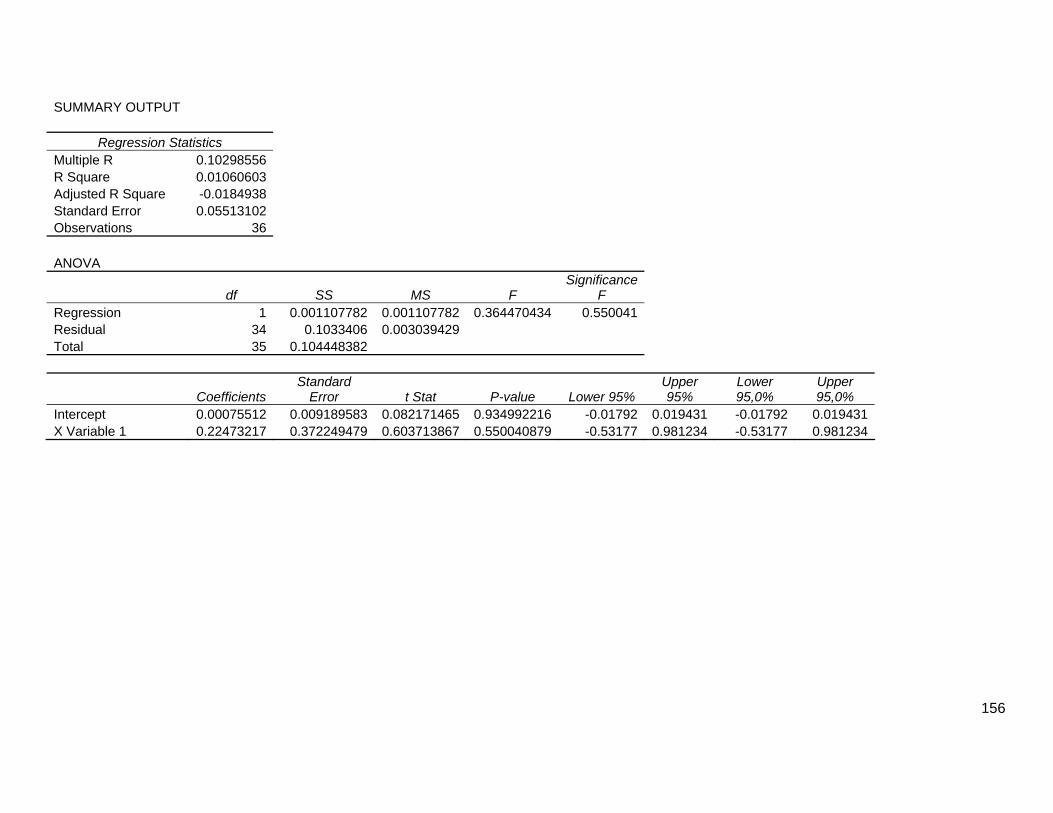
156
SUMMARY OUTPUT
Regression Statistics Multiple R 0.10298556 R Square 0.01060603 Adjusted R Square -0.0184938 Standard Error 0.05513102 Observations 36 ANOVA
df SS MS F Significance
F Regression 1 0.001107782 0.001107782 0.364470434 0.550041 Residual 34 0.1033406 0.003039429 Total 35 0.104448382
Coefficients Standard
Error t Stat P-value Lower 95% Upper 95%
Lower 95,0%
Upper 95,0%
Intercept 0.00075512 0.009189583 0.082171465 0.934992216 -0.01792 0.019431 -0.01792 0.019431X Variable 1 0.22473217 0.372249479 0.603713867 0.550040879 -0.53177 0.981234 -0.53177 0.981234
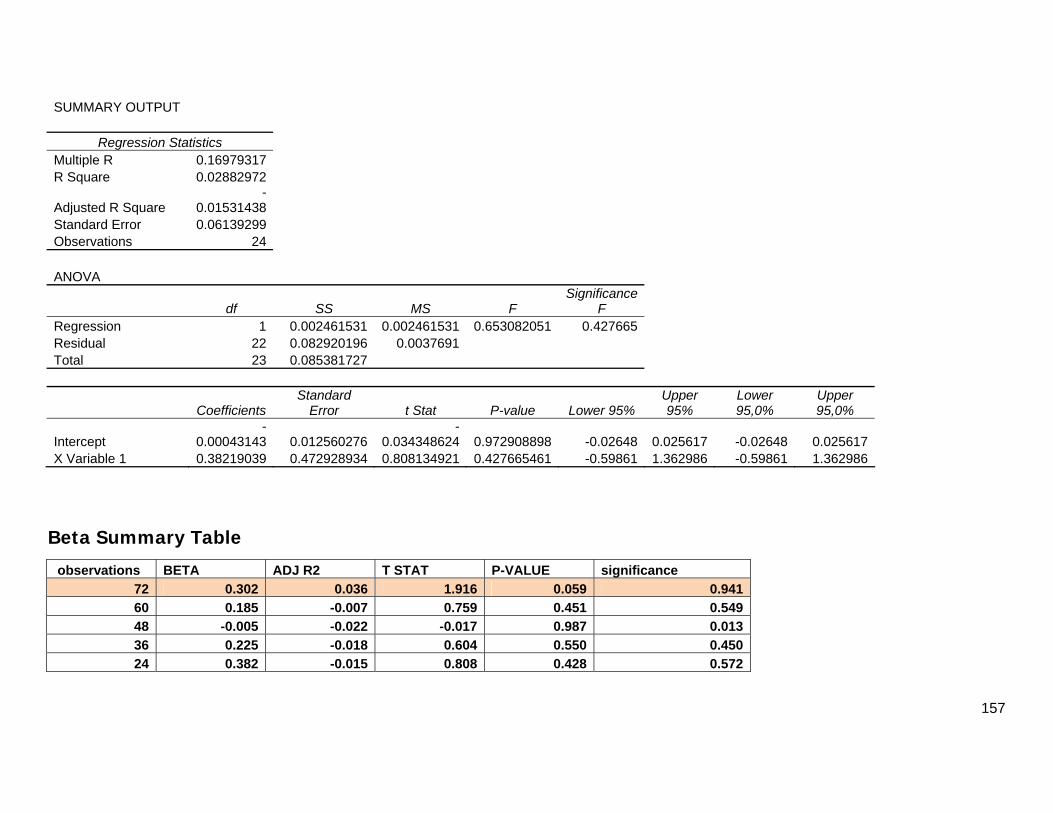
157
SUMMARY OUTPUT
Regression Statistics Multiple R 0.16979317 R Square 0.02882972
Adjusted R Square -
0.01531438 Standard Error 0.06139299 Observations 24 ANOVA
df SS MS F Significance
F Regression 1 0.002461531 0.002461531 0.653082051 0.427665 Residual 22 0.082920196 0.0037691 Total 23 0.085381727
Coefficients Standard
Error t Stat P-value Lower 95% Upper 95%
Lower 95,0%
Upper 95,0%
Intercept -
0.00043143 0.012560276-
0.034348624 0.972908898 -0.02648 0.025617 -0.02648 0.025617X Variable 1 0.38219039 0.472928934 0.808134921 0.427665461 -0.59861 1.362986 -0.59861 1.362986
Beta Summary Table
observations BETA ADJ R2 T STAT P-VALUE significance 72 0.302 0.036 1.916 0.059 0.94160 0.185 -0.007 0.759 0.451 0.54948 -0.005 -0.022 -0.017 0.987 0.01336 0.225 -0.018 0.604 0.550 0.45024 0.382 -0.015 0.808 0.428 0.572
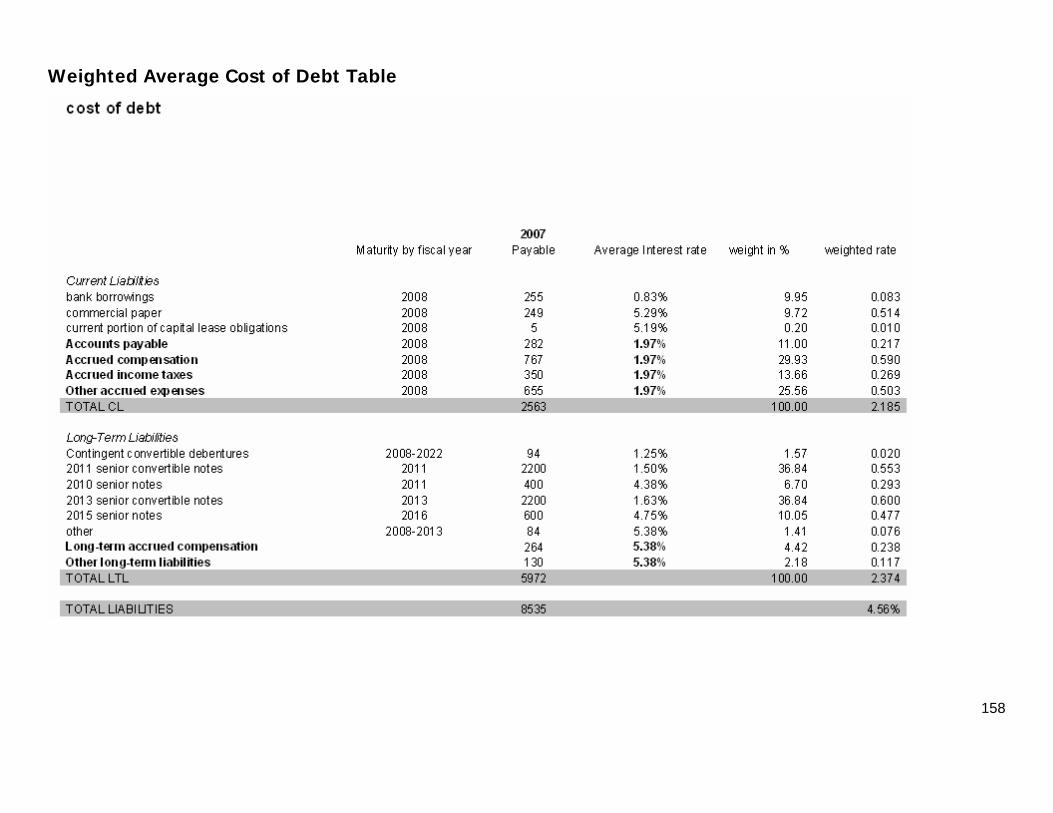
158
Weighted Average Cost of Debt Table
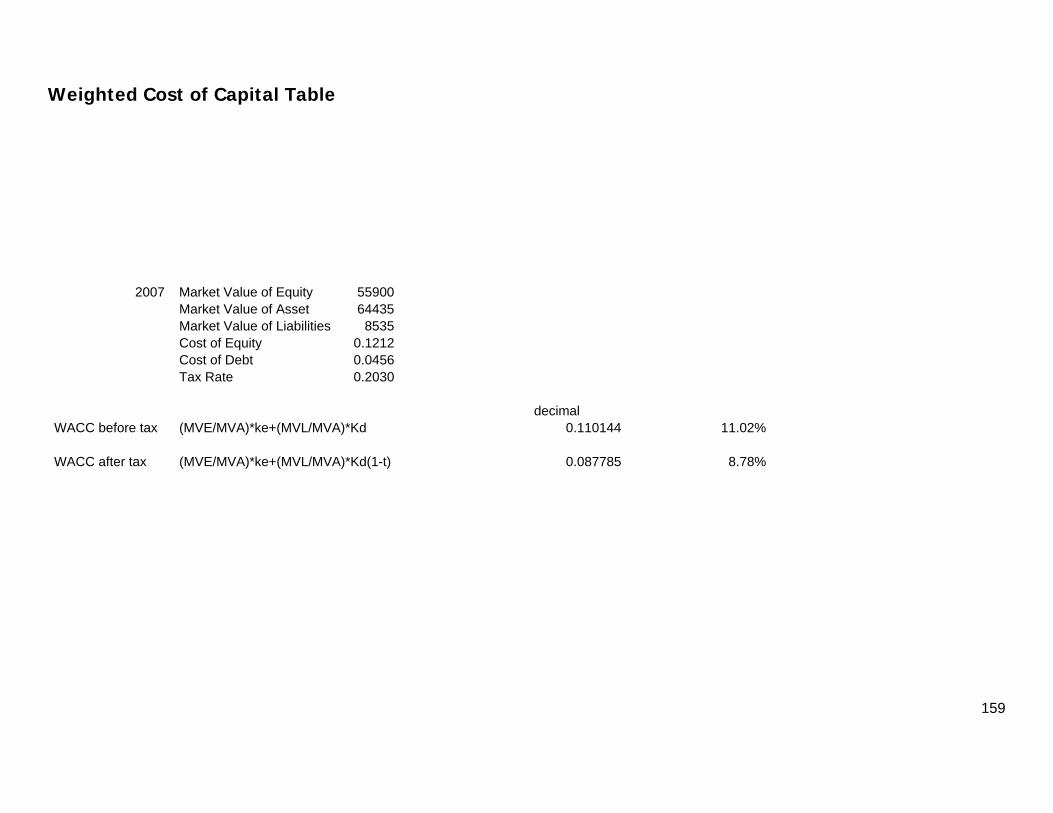
159
Weighted Cost of Capital Table
2007 Market Value of Equity 55900 Market Value of Asset 64435 Market Value of Liabilities 8535 Cost of Equity 0.1212 Cost of Debt 0.0456 Tax Rate 0.2030 decimal WACC before tax (MVE/MVA)*ke+(MVL/MVA)*Kd 0.110144 11.02% WACC after tax (MVE/MVA)*ke+(MVL/MVA)*Kd(1-t) 0.087785 8.78%
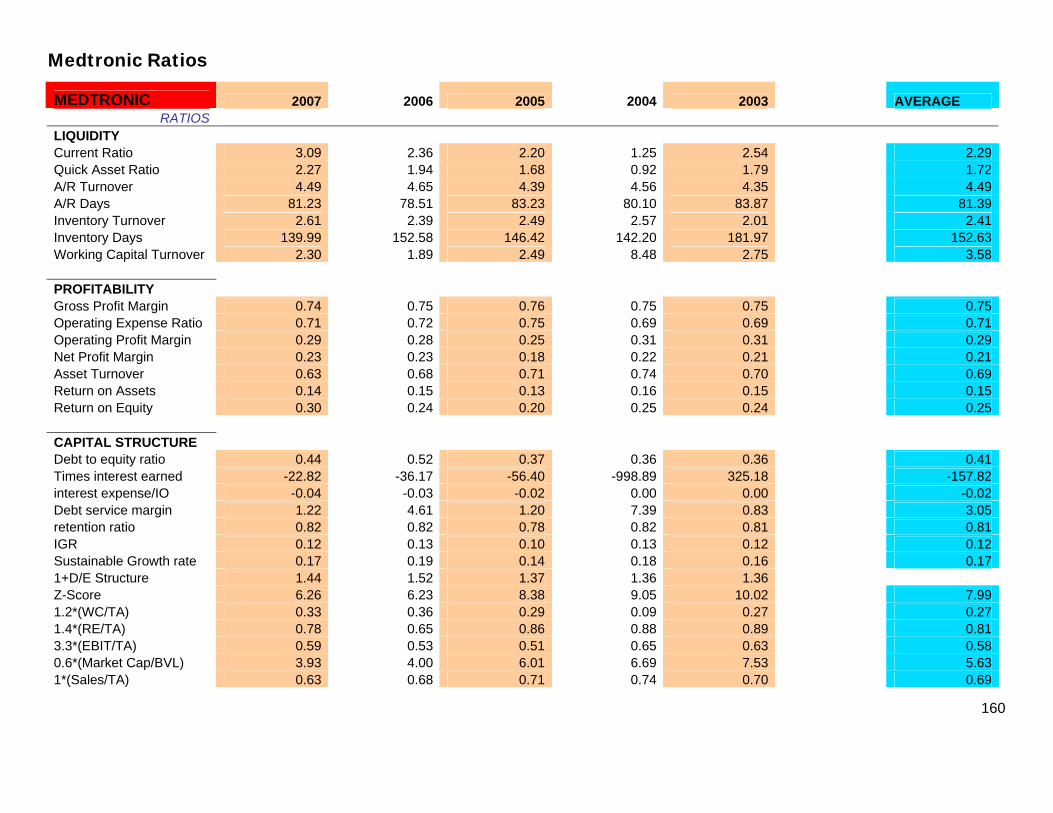
160
Medtronic Ratios
MEDTRONIC 2007 2006 2005 2004 2003 AVERAGE RATIOS
LIQUIDITY Current Ratio 3.09 2.36 2.20 1.25 2.54 2.29 Quick Asset Ratio 2.27 1.94 1.68 0.92 1.79 1.72 A/R Turnover 4.49 4.65 4.39 4.56 4.35 4.49 A/R Days 81.23 78.51 83.23 80.10 83.87 81.39 Inventory Turnover 2.61 2.39 2.49 2.57 2.01 2.41 Inventory Days 139.99 152.58 146.42 142.20 181.97 152.63 Working Capital Turnover 2.30 1.89 2.49 8.48 2.75 3.58 PROFITABILITY Gross Profit Margin 0.74 0.75 0.76 0.75 0.75 0.75 Operating Expense Ratio 0.71 0.72 0.75 0.69 0.69 0.71 Operating Profit Margin 0.29 0.28 0.25 0.31 0.31 0.29 Net Profit Margin 0.23 0.23 0.18 0.22 0.21 0.21 Asset Turnover 0.63 0.68 0.71 0.74 0.70 0.69 Return on Assets 0.14 0.15 0.13 0.16 0.15 0.15 Return on Equity 0.30 0.24 0.20 0.25 0.24 0.25 CAPITAL STRUCTURE Debt to equity ratio 0.44 0.52 0.37 0.36 0.36 0.41 Times interest earned -22.82 -36.17 -56.40 -998.89 325.18 -157.82 interest expense/IO -0.04 -0.03 -0.02 0.00 0.00 -0.02 Debt service margin 1.22 4.61 1.20 7.39 0.83 3.05 retention ratio 0.82 0.82 0.78 0.82 0.81 0.81 IGR 0.12 0.13 0.10 0.13 0.12 0.12 Sustainable Growth rate 0.17 0.19 0.14 0.18 0.16 0.17 1+D/E Structure 1.44 1.52 1.37 1.36 1.36 Z-Score 6.26 6.23 8.38 9.05 10.02 7.99 1.2*(WC/TA) 0.33 0.36 0.29 0.09 0.27 0.27 1.4*(RE/TA) 0.78 0.65 0.86 0.88 0.89 0.81 3.3*(EBIT/TA) 0.59 0.53 0.51 0.65 0.63 0.58 0.6*(Market Cap/BVL) 3.93 4.00 6.01 6.69 7.53 5.63 1*(Sales/TA) 0.63 0.68 0.71 0.74 0.70 0.69
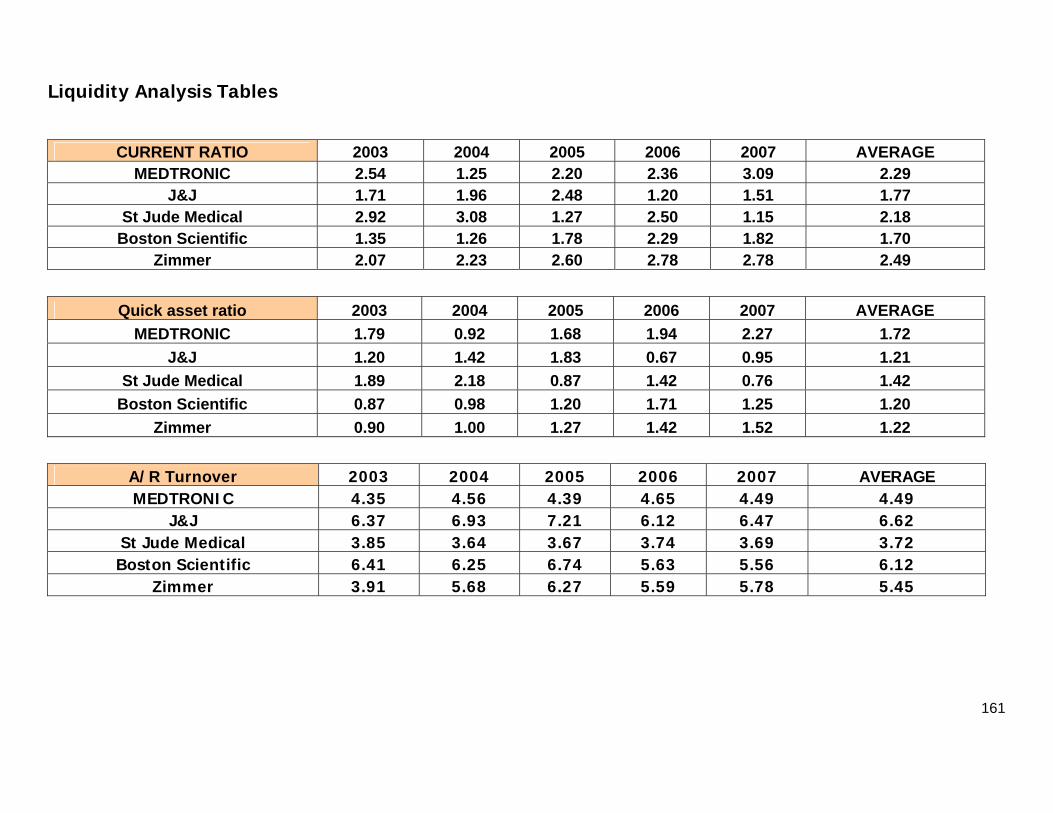
161
Liquidity Analysis Tables
CURRENT RATIO 2003 2004 2005 2006 2007 AVERAGE MEDTRONIC 2.54 1.25 2.20 2.36 3.09 2.29
J&J 1.71 1.96 2.48 1.20 1.51 1.77 St Jude Medical 2.92 3.08 1.27 2.50 1.15 2.18
Boston Scientific 1.35 1.26 1.78 2.29 1.82 1.70 Zimmer 2.07 2.23 2.60 2.78 2.78 2.49
Quick asset ratio 2003 2004 2005 2006 2007 AVERAGE MEDTRONIC 1.79 0.92 1.68 1.94 2.27 1.72
J&J 1.20 1.42 1.83 0.67 0.95 1.21 St Jude Medical 1.89 2.18 0.87 1.42 0.76 1.42
Boston Scientific 0.87 0.98 1.20 1.71 1.25 1.20 Zimmer 0.90 1.00 1.27 1.42 1.52 1.22
A/R Turnover 2003 2004 2005 2006 2007 AVERAGE MEDTRONIC 4.35 4.56 4.39 4.65 4.49 4.49
J&J 6.37 6.93 7.21 6.12 6.47 6.62 St Jude Medical 3.85 3.64 3.67 3.74 3.69 3.72 Boston Scientific 6.41 6.25 6.74 5.63 5.56 6.12
Zimmer 3.91 5.68 6.27 5.59 5.78 5.45
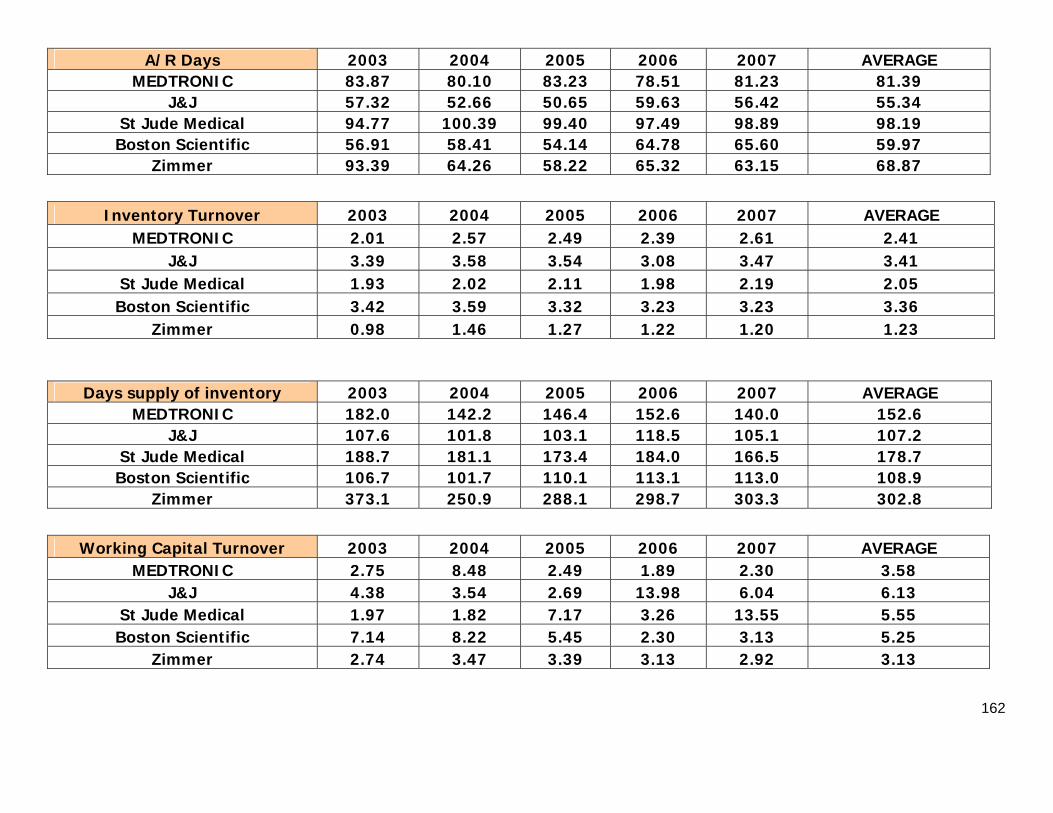
162
A/R Days 2003 2004 2005 2006 2007 AVERAGE MEDTRONIC 83.87 80.10 83.23 78.51 81.23 81.39
J&J 57.32 52.66 50.65 59.63 56.42 55.34 St Jude Medical 94.77 100.39 99.40 97.49 98.89 98.19 Boston Scientific 56.91 58.41 54.14 64.78 65.60 59.97
Zimmer 93.39 64.26 58.22 65.32 63.15 68.87
Inventory Turnover 2003 2004 2005 2006 2007 AVERAGE MEDTRONIC 2.01 2.57 2.49 2.39 2.61 2.41
J&J 3.39 3.58 3.54 3.08 3.47 3.41 St Jude Medical 1.93 2.02 2.11 1.98 2.19 2.05 Boston Scientific 3.42 3.59 3.32 3.23 3.23 3.36
Zimmer 0.98 1.46 1.27 1.22 1.20 1.23
Days supply of inventory 2003 2004 2005 2006 2007 AVERAGE MEDTRONIC 182.0 142.2 146.4 152.6 140.0 152.6
J&J 107.6 101.8 103.1 118.5 105.1 107.2 St Jude Medical 188.7 181.1 173.4 184.0 166.5 178.7 Boston Scientific 106.7 101.7 110.1 113.1 113.0 108.9
Zimmer 373.1 250.9 288.1 298.7 303.3 302.8
Working Capital Turnover 2003 2004 2005 2006 2007 AVERAGE MEDTRONIC 2.75 8.48 2.49 1.89 2.30 3.58
J&J 4.38 3.54 2.69 13.98 6.04 6.13 St Jude Medical 1.97 1.82 7.17 3.26 13.55 5.55 Boston Scientific 7.14 8.22 5.45 2.30 3.13 5.25
Zimmer 2.74 3.47 3.39 3.13 2.92 3.13
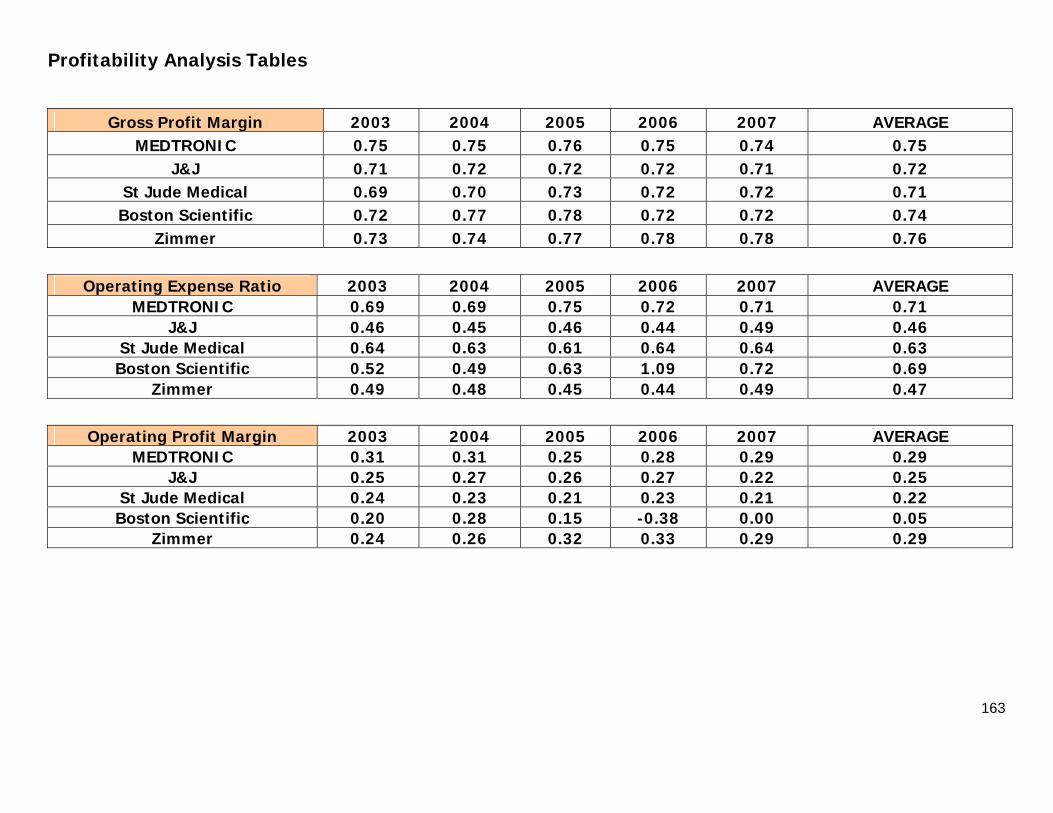
163
Profitability Analysis Tables
Gross Profit Margin 2003 2004 2005 2006 2007 AVERAGE MEDTRONIC 0.75 0.75 0.76 0.75 0.74 0.75
J&J 0.71 0.72 0.72 0.72 0.71 0.72 St Jude Medical 0.69 0.70 0.73 0.72 0.72 0.71 Boston Scientific 0.72 0.77 0.78 0.72 0.72 0.74
Zimmer 0.73 0.74 0.77 0.78 0.78 0.76
Operating Expense Ratio 2003 2004 2005 2006 2007 AVERAGE MEDTRONIC 0.69 0.69 0.75 0.72 0.71 0.71
J&J 0.46 0.45 0.46 0.44 0.49 0.46 St Jude Medical 0.64 0.63 0.61 0.64 0.64 0.63 Boston Scientific 0.52 0.49 0.63 1.09 0.72 0.69
Zimmer 0.49 0.48 0.45 0.44 0.49 0.47
Operating Profit Margin 2003 2004 2005 2006 2007 AVERAGE MEDTRONIC 0.31 0.31 0.25 0.28 0.29 0.29
J&J 0.25 0.27 0.26 0.27 0.22 0.25 St Jude Medical 0.24 0.23 0.21 0.23 0.21 0.22 Boston Scientific 0.20 0.28 0.15 -0.38 0.00 0.05
Zimmer 0.24 0.26 0.32 0.33 0.29 0.29
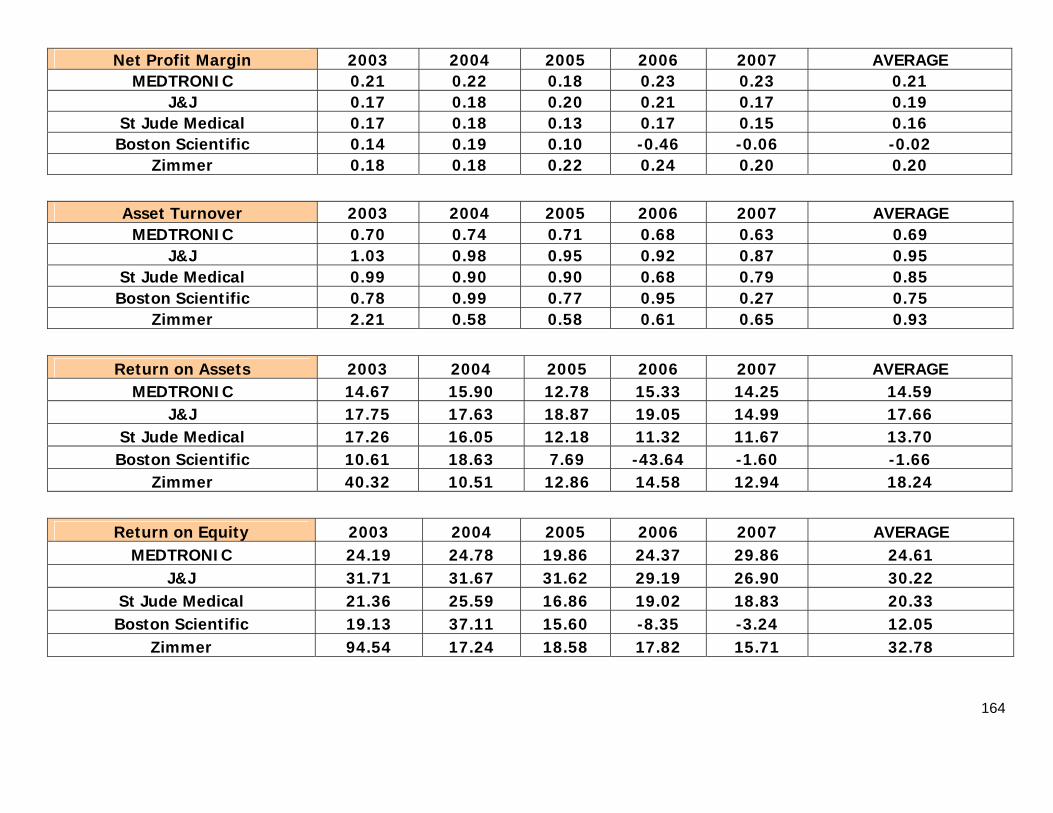
164
Net Profit Margin 2003 2004 2005 2006 2007 AVERAGE MEDTRONIC 0.21 0.22 0.18 0.23 0.23 0.21
J&J 0.17 0.18 0.20 0.21 0.17 0.19 St Jude Medical 0.17 0.18 0.13 0.17 0.15 0.16 Boston Scientific 0.14 0.19 0.10 -0.46 -0.06 -0.02
Zimmer 0.18 0.18 0.22 0.24 0.20 0.20
Asset Turnover 2003 2004 2005 2006 2007 AVERAGE MEDTRONIC 0.70 0.74 0.71 0.68 0.63 0.69
J&J 1.03 0.98 0.95 0.92 0.87 0.95 St Jude Medical 0.99 0.90 0.90 0.68 0.79 0.85 Boston Scientific 0.78 0.99 0.77 0.95 0.27 0.75
Zimmer 2.21 0.58 0.58 0.61 0.65 0.93
Return on Assets 2003 2004 2005 2006 2007 AVERAGE MEDTRONIC 14.67 15.90 12.78 15.33 14.25 14.59
J&J 17.75 17.63 18.87 19.05 14.99 17.66 St Jude Medical 17.26 16.05 12.18 11.32 11.67 13.70 Boston Scientific 10.61 18.63 7.69 -43.64 -1.60 -1.66
Zimmer 40.32 10.51 12.86 14.58 12.94 18.24
Return on Equity 2003 2004 2005 2006 2007 AVERAGE MEDTRONIC 24.19 24.78 19.86 24.37 29.86 24.61
J&J 31.71 31.67 31.62 29.19 26.90 30.22 St Jude Medical 21.36 25.59 16.86 19.02 18.83 20.33 Boston Scientific 19.13 37.11 15.60 -8.35 -3.24 12.05
Zimmer 94.54 17.24 18.58 17.82 15.71 32.78
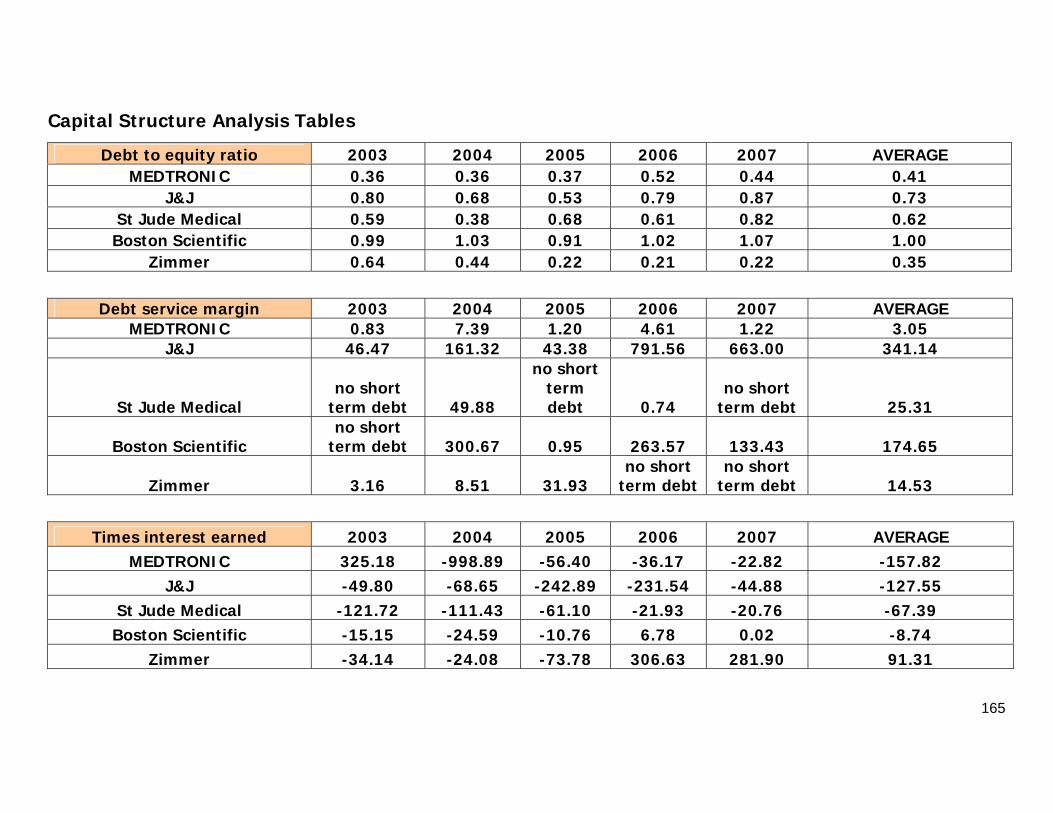
165
Capital Structure Analysis Tables
Debt to equity ratio 2003 2004 2005 2006 2007 AVERAGE MEDTRONIC 0.36 0.36 0.37 0.52 0.44 0.41
J&J 0.80 0.68 0.53 0.79 0.87 0.73 St Jude Medical 0.59 0.38 0.68 0.61 0.82 0.62 Boston Scientific 0.99 1.03 0.91 1.02 1.07 1.00
Zimmer 0.64 0.44 0.22 0.21 0.22 0.35
Debt service margin 2003 2004 2005 2006 2007 AVERAGE MEDTRONIC 0.83 7.39 1.20 4.61 1.22 3.05
J&J 46.47 161.32 43.38 791.56 663.00 341.14
St Jude Medical no short
term debt 49.88
no short term debt 0.74
no short term debt 25.31
Boston Scientific no short
term debt 300.67 0.95 263.57 133.43 174.65
Zimmer 3.16 8.51 31.93 no short
term debtno short
term debt 14.53
Times interest earned 2003 2004 2005 2006 2007 AVERAGE MEDTRONIC 325.18 -998.89 -56.40 -36.17 -22.82 -157.82
J&J -49.80 -68.65 -242.89 -231.54 -44.88 -127.55 St Jude Medical -121.72 -111.43 -61.10 -21.93 -20.76 -67.39 Boston Scientific -15.15 -24.59 -10.76 6.78 0.02 -8.74
Zimmer -34.14 -24.08 -73.78 306.63 281.90 91.31
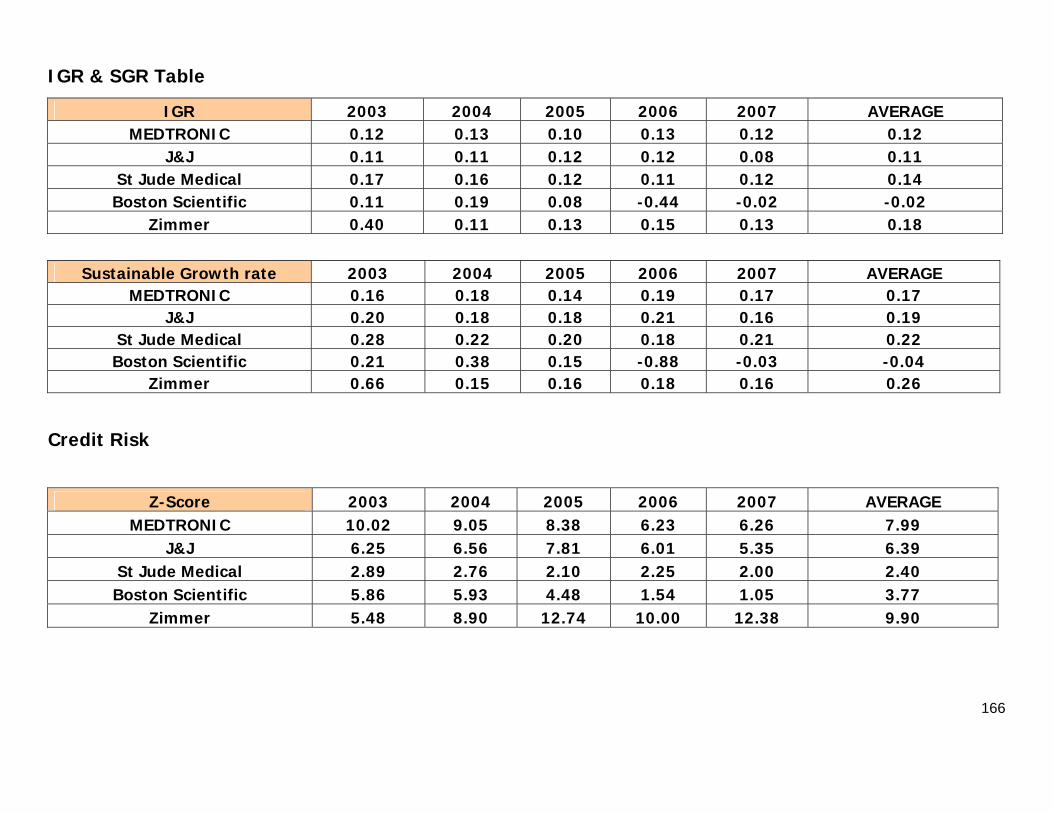
166
IGR & SGR Table
IGR 2003 2004 2005 2006 2007 AVERAGE MEDTRONIC 0.12 0.13 0.10 0.13 0.12 0.12
J&J 0.11 0.11 0.12 0.12 0.08 0.11 St Jude Medical 0.17 0.16 0.12 0.11 0.12 0.14 Boston Scientific 0.11 0.19 0.08 -0.44 -0.02 -0.02
Zimmer 0.40 0.11 0.13 0.15 0.13 0.18
Sustainable Growth rate 2003 2004 2005 2006 2007 AVERAGE MEDTRONIC 0.16 0.18 0.14 0.19 0.17 0.17
J&J 0.20 0.18 0.18 0.21 0.16 0.19 St Jude Medical 0.28 0.22 0.20 0.18 0.21 0.22 Boston Scientific 0.21 0.38 0.15 -0.88 -0.03 -0.04
Zimmer 0.66 0.15 0.16 0.18 0.16 0.26
Credit Risk
Z-Score 2003 2004 2005 2006 2007 AVERAGE MEDTRONIC 10.02 9.05 8.38 6.23 6.26 7.99
J&J 6.25 6.56 7.81 6.01 5.35 6.39 St Jude Medical 2.89 2.76 2.10 2.25 2.00 2.40 Boston Scientific 5.86 5.93 4.48 1.54 1.05 3.77
Zimmer 5.48 8.90 12.74 10.00 12.38 9.90
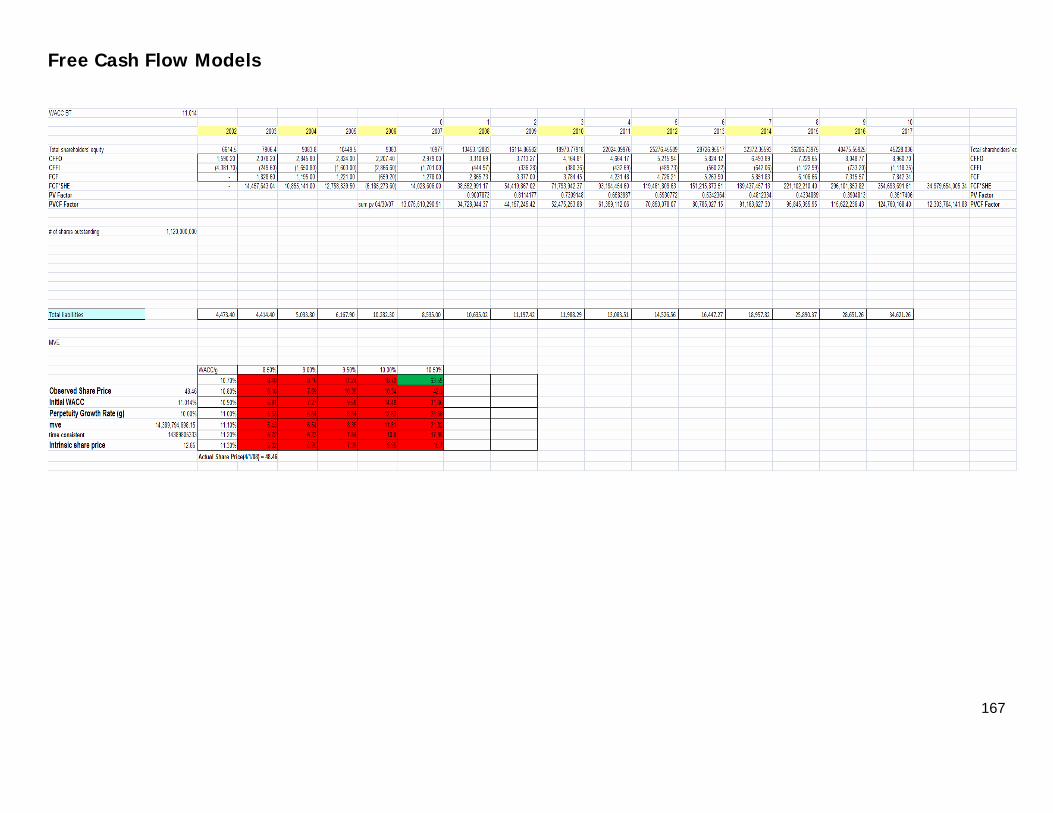
167
Free Cash Flow Models
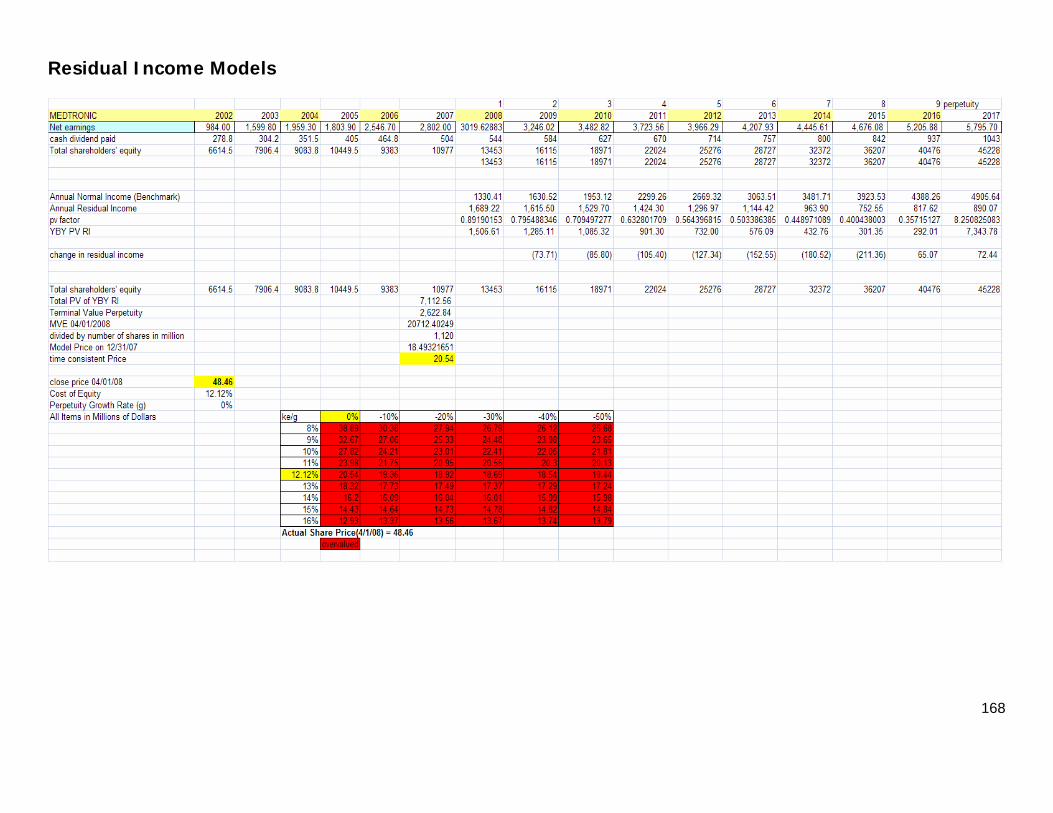
168
Residual Income Models
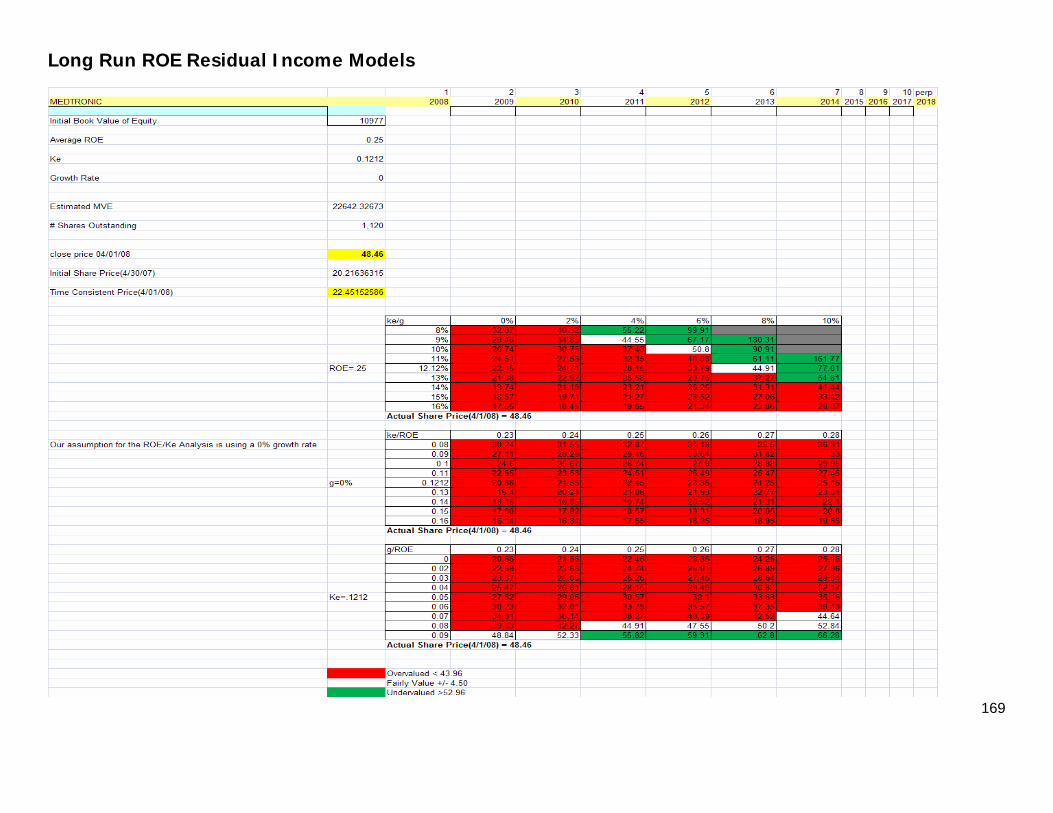
169
Long Run ROE Residual Income Models
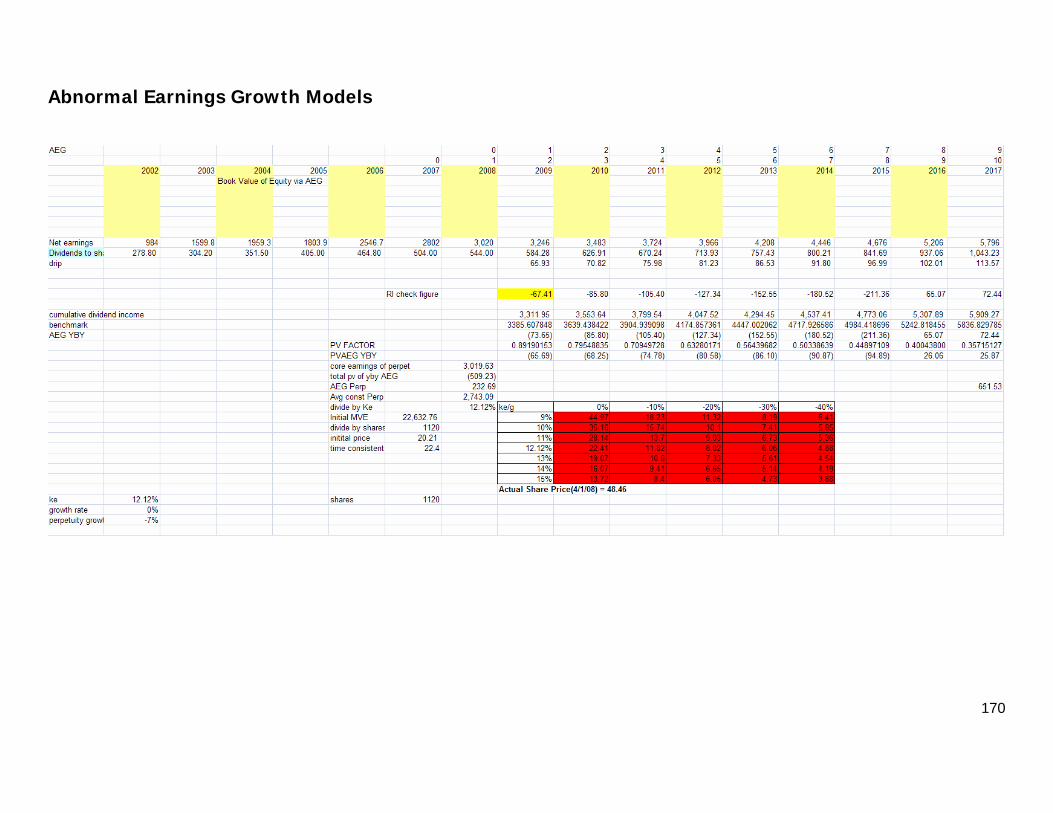
170
Abnormal Earnings Growth Models
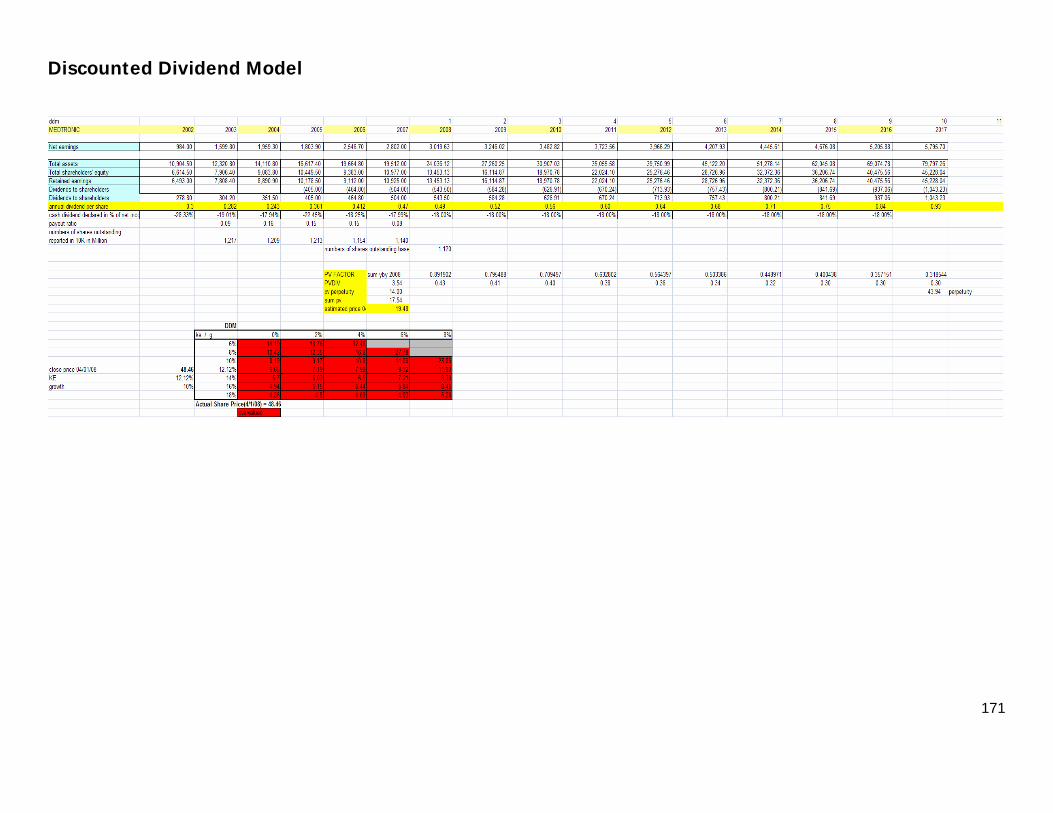
171
Discounted Dividend Model
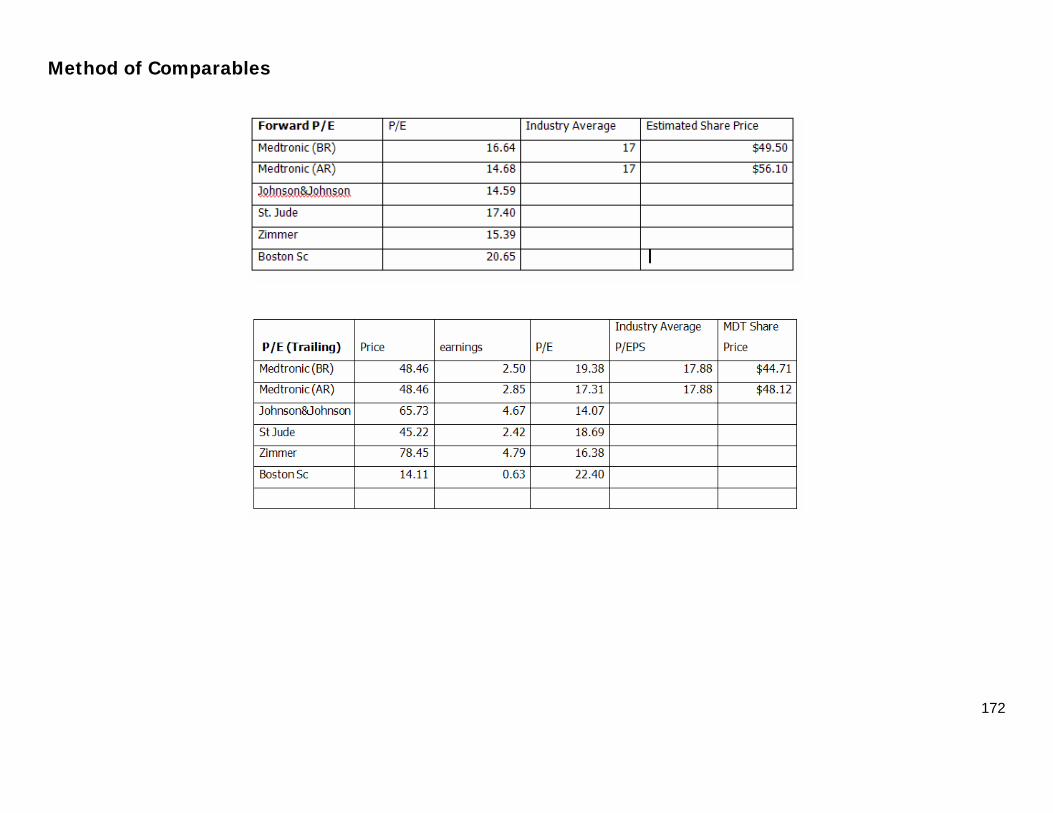
172
Method of Comparables
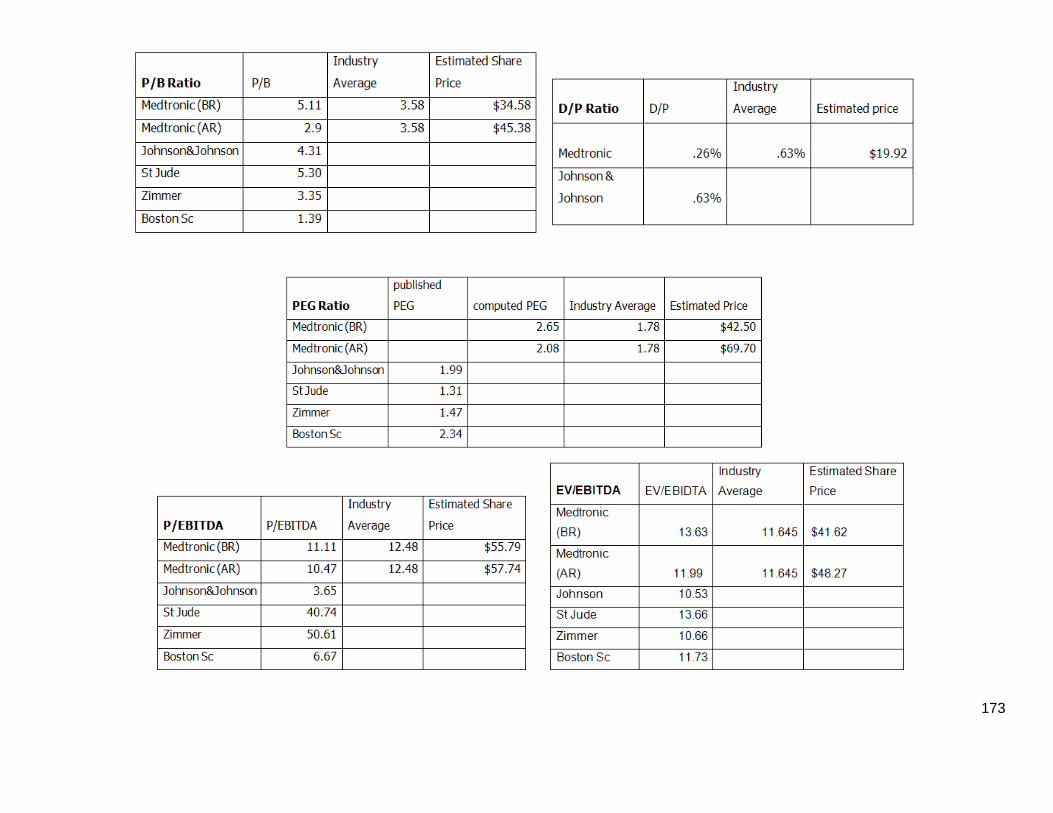
173

174
References
Financial Reports:
Medtronic 2002-2006 10-k
Zimmer Holdings 2002-2007 10-k
St Jude Medical Inc. 2002-2007 10-k
Johnson & Johnson 2002-2007 10-k
Boston Scientific Corp. 2002-2007 10-k
Edwards Lifesciences Corp. 2005-2007 10-k
Medtronic’s Code of Conduct
Websites:
www.investopedia.com
www.medtronic.com
http://biz.yahoo.com
St. Louis Federal Reserve website
Wall Street Journal Website
www.ita.doc.gov
Literature:
Business Analysis & Valuation Palepu and Healy
Intermediate Accounting 12th Edition Donald Kieso, Jerry Weygandt, Terry Warfield.