Embed Size (px)
Citation preview
Medium Term Prospects for EU Dairy Markets under Agenda 2000 and the Midterm Review Proposals – A Quantitative Analysis for the
Spanish Dairy Sector with the CAPRI Modelling System
Christine Wieck, Ignacio Perez, Wolfgang Britz
Institute for Agricultural Policy, Market Research and Economic Sociology, Bonn University
Prepared for AEEA Seminar, March 13-14, Lugo (Spain)
1. Introduction
European Dairy Policy has been subject to reform ever since. Even with challenges as the milk quota
reform still ahead, the Agenda 2000 policy package introduced already new policy instruments as to offset
substantial cuts in market price support. The motives behind the Common Agricultural Policy (CAP)
reform were to foster a more competitive farming industry by lowering intervention prices and bringing
production more closely into line with demand. In the Midterm Review (MTR) of the Agenda 2000, the
EU Commission proposed further CAP changes, which will affect the competitiveness of dairy farms and
industry. Whereas the Agenda 2000 broke with the traditional line in dairy policy through the introduction
of compensation payments for dairy cows, the MTR proposal affects dairy policy mainly in an indirect
way. The main thrust of the MTR proposals is about decoupling support from production decisions by
means of the introduction of a singled decoupled income payment per farm. Hence, all compensation
payments1 regardless if they are attached to area or number of animals, shall be converted in an income
payment allowing for complete farming flexibility and increasing market orientation of each farm. Results
from the analysis of both policy proposals will be presented in the following.
With 14% of total value of agricultural production in 2000, milk production is the most important activity
both in the EU as a whole and for a majority of the Member States. The share of milk in agricultural
output varies however widely between Member States and regions reaching 30-50% in some Spanish
regions such as Galicia or Cantabria. Traditionally, there exists a strong link between the dairy and beef
sector due to dual-purpose breeds and dairy market reform will hence affect beef markets as well.
Worldwide, the EU is both the biggest producer and consumer of milk, with a share of 21% in
production. These facts underline that reforms in the dairy sector impacts on farm income, domestic
consumption and the competitive positions of the EU in agricultural world markets.
The following quantitative analysis based on the CAPRI modelling system compares developments of
production, demand and agricultural income projected for 2009 under the policy set of the MTR proposal
to the results of the reference run shown above, which represents the full implementation of the Agenda
2000 proposal in the year 2009. The analysis for the dairy sector is based on the so called “Option 1” of
the Commissions proposal regarding possible future avenues for the development of the dairy sector
(European Commission 2000). Hence, a continuation of Agenda 2000 for the dairy sector is assumed.
The paper is organised as follows: after this brief introduction, the second section presents the CAPRI
modelling system with which the analysis is conducted. The third part describes policy implementation
and scenario assumptions for both, reference and simulation run. Chapter four presents the results for
dairy and beef markets as well as regional developments in Spain and some conclusions are drawn in
section five.
1 No rule without exceptions: Some payments are not included (durum wheat quality premium, protein crop supplement,
payments for rice and some payments for processors of specific products).
2
2. The CAPRI modelling system
The CAPRI modelling system is designed as a projection and simulation tool for the agricultural sector
based on:
(1) A physical consistency framework, covering balances for agricultural area, young animals and feed
requirements for animals as well as nutrient requirement for crops, realised as constraints in the
regional supply models. The market model ensures that fat and protein comprised in the milk
delivered to dairies is equal to the fat and protein comprised in the processed dairy products.
(2) Economic accounting principles according to the definition of the Economic Accounts for
Agriculture (EAA). The model covers all outputs and inputs included in the national EAAs for the
Member States, with revenues and costs broken down consistently to regions and production
activities.
(3) A detailed policy description. The regional supply models capture all relevant payment schemes with
their respective ceilings as well as set-aside obligations and sales quotas. The market side covers
tariffs, intervention purchases and subsidised exports. The policy of non-EU regions is based on
OECD PSE/CSE data bank.
(4) Behavioural functions and allocation steering are strictly in line with micro-economic theory.
Functional forms are chosen to be globally well behaved, allowing for a consistent welfare analysis.
The model distinguishes a supply and a market module, iteratively coupled. The supply module consists
of aggregate programming models at NUTS II level, working with exogenous prices during each
iteration. After being solved, the regional results of these NUTS II models – crop areas, herd sizes,
input/output coefficients etc. –are aggregated into Member State level models, which are then calibrated to
these results by using techniques borrowed from Positive Mathematical Programming. Young animal
prices are then determined by linking these Member State models into a non-spatial EU model with
market balances for young animals. Afterwards, supply and feed demand functions of the market module
are calibrated to prices and results from the supply module on feed use and production of the current
iteration. The market model is then solved and the resulting producer prices at Member State level drive
the next iteration with the supply models. Equally, in between iterations, premiums for activities are
adjusted if ceilings are overshot according to the results laid down in the Common Market Organisations.
The underlying methodology of supply for yearly crops and animals assumes a two-stage decision
process. In the first stage, producers determine optimal variable input coefficients (nutrient needs for
crops and animals, seed, plant protection, energy, pharmaceutical inputs, etc.) per hectare or head for
given yields which are determined exogenous by trend analysis. Nutrient requirements enter as constraints
in the supply models, whereas all other variable inputs together with their prices define the so-called
accounting costs. The proceeding reflects the calculation of gross margins in farm management. In the
second stage, the profit maximising crop mix and animal numbers are determined simultaneously with
cost minimising feed and fertiliser mix in the supply models. Availability of grass and arable land as well
as sales quotas restrict production possibilities and the crop mix is further on influenced by set-aside
obligations. Animal requirements (energy, protein etc.) are covered by a cost minimised feed mix
combination, whereas fertiliser needs of crops are met by either organic nutrients found in manure or
purchased fertiliser. Fodder (grass, straw, fodder maize, root crops, silage, milk from suckler cows or
mother goat and sheep) is assumed to be non-tradable, and hence animal processes are linked to the crop
production and regional land availability. All other outputs and inputs can be sold and purchased at fixed
prices. Selling of milk cannot exceed the quota and for sugar production an A,B,C quota system is
embedded.

3
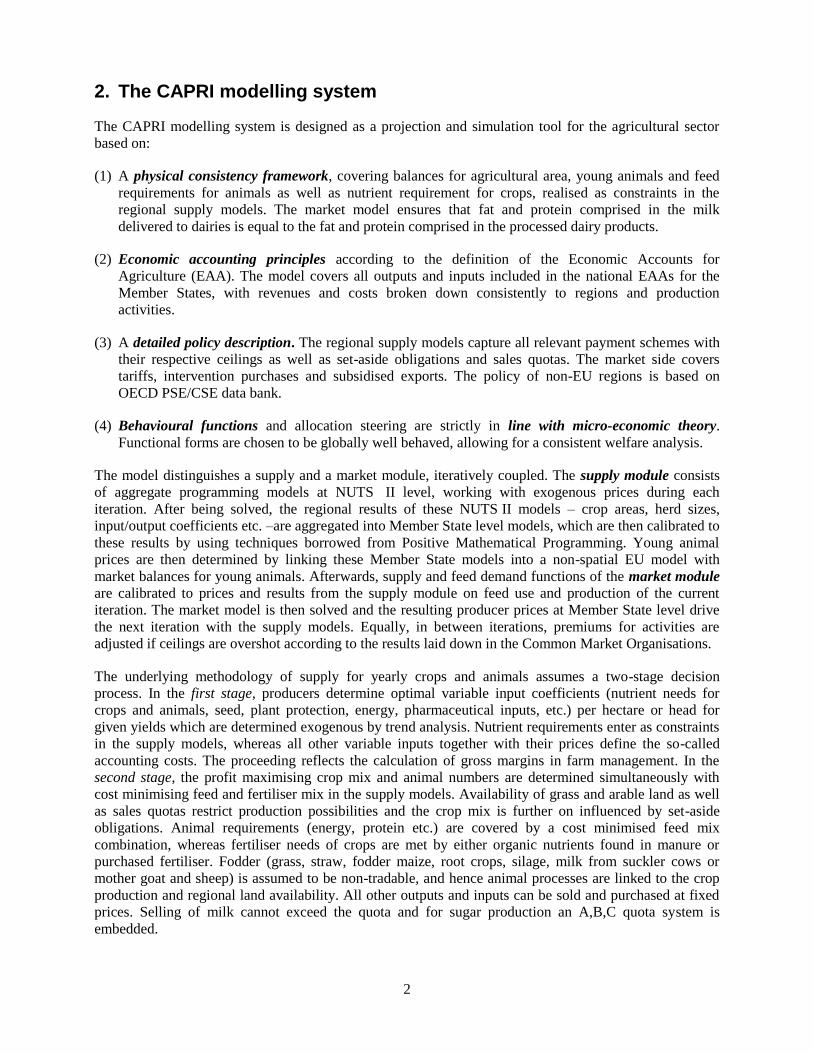
Graph 1. Link of modules in the CAPRI modelling system
Supply
200 Regional
optimisation
models
Perennial
sub-module
Output Markets
Multi-commodity
spatial market model
with 11 regional
aggregates
and all EU MS
Young Animal
Markets
Linked optimisation
models
at Member
State level
Supply
Feed demand
Prices
Aggregation
to Member States
Premium calculator
Calculate
premiums
depending
on CMOs
(ceilings,
base areas ..)
Levels
The use of a mathematical programming approach has the advantage to directly embed compensation
payments, set-aside obligations, voluntary set-aside and sales quotas, as well as to capture important
relations between agricultural production activities. The programming models are calibrated to observed
set-aside hectares, including voluntary set-aside, and non food production on set-aside land is treated as a
separate production activity. Fallow land not falling into set-aside programs reflects the difference
between land reported as idling in national statistics and data from commission services on actual hectares
in set-aside programs. Not at least, environmental indicators as N,P,K balances and output of gases linked
to global warming are implemented in the system.
Output coefficients for the high final weight activities (dairy cows, male and female adult fattening) are
created by increasing average milk and meat yield by 20 %, for the low intensive variants by decreasing
them by 20 %. All intermediate inputs with the exception of feed and young animal are corrected
accordingly. The requirement functions are directly applied to the changed final weights. Input
coefficients for young animals are identical across the variants.
In the case of feeding stuff, a set of requirement functions defines the need of each animal category
depending on, for example, live weight, weight increase per day, milk yield. These requirement function
are mostly derived under experimental conditions and define a technological frontier from which actual
technology on farm level can be expected to deviate, not at least due to for example control and
management costs usually not taken into account in experiments. These requirements must be covered by
feeding an appropriate mix of feeding stuff to each animal herd. As sectoral availability of feeding stuff is
known ex-post, a complex non-linear optimisation program distributes the available feeding stuff
resources to the animals, simultaneously ensuring that the distribution leads to plausible feeding costs. If
necessary, the requirement functions are shifted to account for differences between actual feeding
practises of the farms and the technological frontier defined by the requirement functions.
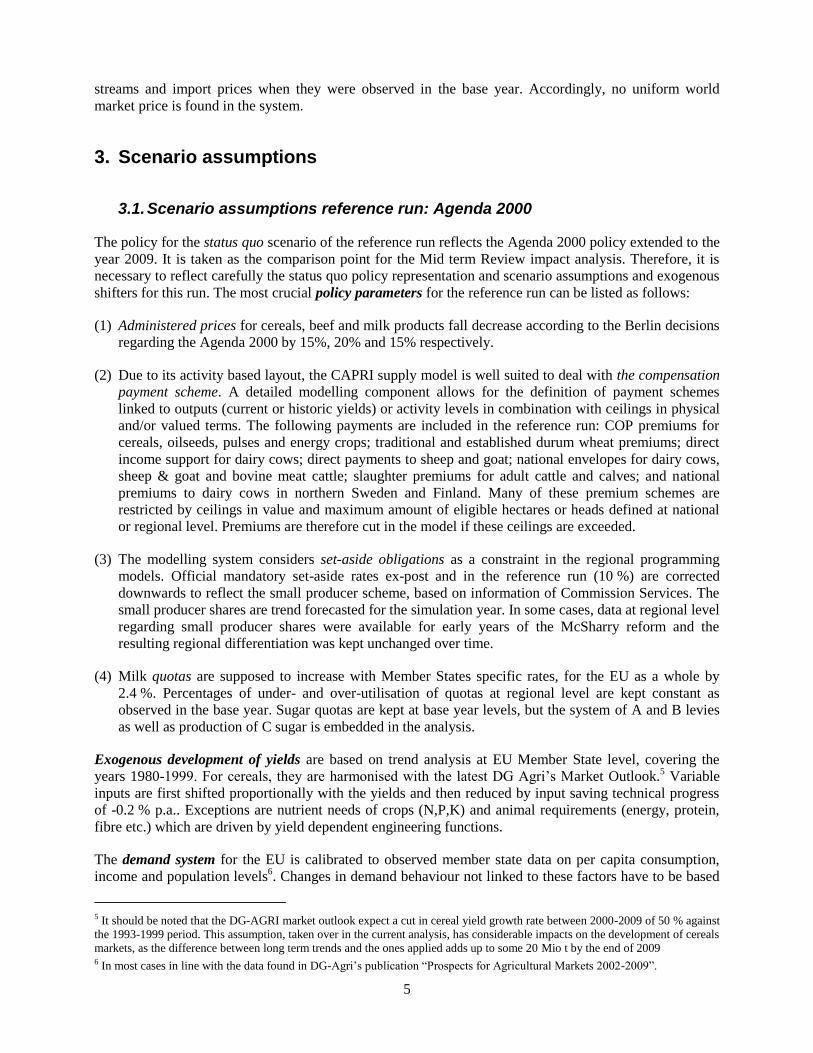
In order to describe the relationships in between cattle production activities and to define the effective
number of animals bred (flow) at regional level, a so-called herd module has been developed. At national
level, data on slaughtering, imports and exports of live animals and meat (CRONOS, COMEXT,
INTRASTAT) as well as herd size statistics (stocks) (CRONOS, REGIO) allow quite well to describe

4
livestock activity levels (e.g. numbers of milk cows, suckler cows, calves raised, calves fatted, heifers
raised, heifers and beef fatted) and their inter-relationships (see Graph 2 above)2.
Graph 2. Modelling of young animal flow in the cattle sector
Beef
Beef
Veal
Raising
female
Calves
Fattening
male
Calves
Breeding
Heifers
Milk Cows
Suckler
Cows
Male adult
cattle
High/Low
Fattening
Heifers
High/Low
Fattening
female
Calves
Raising
male
Calves
Male
Calf
Young
heifer
Young
bull
Young
cow
Female
Calf
The market module breaks down the world into 12 country aggregates3, each aggregate featuring systems
of supply, human consumption, feed and processing functions. The parameters of these functions are
derived from elasticities borrowed from other studies and modelling systems, and calibrated to projected
quantities and prices in the simulation year, where the choice of the functional form (normalised quadratic
for feed and supply, Generalised Leontief Expenditure function for human consumption) and further
restrictions (homogeneity of degree zero in prices, symmetry, correct curvature) ensure regularity.
Accordingly, the demand system allows for the calculation of welfare changes for the consumers. Policy
instruments in the market module include (bi-)lateral tariffs and Producer/Consumer Subsidy Equivalent
price wedges (PSE/CSE). Some important Tariff Rate Quotas (TRQs) as well as explicit modelling of
intervention sales and subsidised exports under WTO commitment restrictions are implemented for the
EU.
Special attention is given to the processing stage of dairy products for the EU Member states. First of all,
balancing equations for fat and protein ensure that processed products use up exactly the amount of fat and
protein comprised in the raw milk. Production of processed dairy products is based on a normalised
quadratic function driven by the difference between the dairy product’s market price and the value of its
fat and protein content. Lastly, prices of raw milk are equal to its fat and protein content valued with fat
and protein prices.4
The Armington assumption drives the composition of demand from domestic sales and the different
import origins depending on price relations and thus determines bilateral trade streams. The model
comprises a two stage Armington system: on the top level, the composition of total demand from imports
and domestic sales is determined, whereas the lower stage determines the import shares from different
origins. Due to the Armington assumption, product markets for different regions are linked by import
2 A detailed description can be found in : Britz, W., Setti, M. Wieck, C. (2002): Improvements of the Dairy and Beef sub-module.,
CAPRI working paper 02-06, available on the project web site. 3 EU, East European Candidate Countries, Mediterranean countries, U.S., Canada, Australia & New Zealand, Free trade
developing countries, High tariff traders (as Japan), India, China, ACP countries, Rest of the World 4 A detailed description can be found in : Britz, W., Wieck, C. (2002): Modelling the processing of dairy products, CAPRI
working paper 02-08, available on the project web site
5
streams and import prices when they were observed in the base year. Accordingly, no uniform world
market price is found in the system.
3. Scenario assumptions
3.1. Scenario assumptions reference run: Agenda 2000
The policy for the status quo scenario of the reference run reflects the Agenda 2000 policy extended to the
year 2009. It is taken as the comparison point for the Mid term Review impact analysis. Therefore, it is
necessary to reflect carefully the status quo policy representation and scenario assumptions and exogenous
shifters for this run. The most crucial policy parameters for the reference run can be listed as follows:
(1) Administered prices for cereals, beef and milk products fall decrease according to the Berlin decisions
regarding the Agenda 2000 by 15%, 20% and 15% respectively.
(2) Due to its activity based layout, the CAPRI supply model is well suited to deal with the compensation
payment scheme. A detailed modelling component allows for the definition of payment schemes
linked to outputs (current or historic yields) or activity levels in combination with ceilings in physical
and/or valued terms. The following payments are included in the reference run: COP premiums for
cereals, oilseeds, pulses and energy crops; traditional and established durum wheat premiums; direct
income support for dairy cows; direct payments to sheep and goat; national envelopes for dairy cows,
sheep & goat and bovine meat cattle; slaughter premiums for adult cattle and calves; and national
premiums to dairy cows in northern Sweden and Finland. Many of these premium schemes are
restricted by ceilings in value and maximum amount of eligible hectares or heads defined at national
or regional level. Premiums are therefore cut in the model if these ceilings are exceeded.
(3) The modelling system considers set-aside obligations as a constraint in the regional programming
models. Official mandatory set-aside rates ex-post and in the reference run (10 %) are corrected
downwards to reflect the small producer scheme, based on information of Commission Services. The
small producer shares are trend forecasted for the simulation year. In some cases, data at regional level
regarding small producer shares were available for early years of the McSharry reform and the
resulting regional differentiation was kept unchanged over time.
(4) Milk quotas are supposed to increase with Member States specific rates, for the EU as a whole by
2.4 %. Percentages of under- and over-utilisation of quotas at regional level are kept constant as
observed in the base year. Sugar quotas are kept at base year levels, but the system of A and B levies
as well as production of C sugar is embedded in the analysis.
Exogenous development of yields are based on trend analysis at EU Member State level, covering the
years 1980-1999. For cereals, they are harmonised with the latest DG Agri’s Market Outlook.5 Variable
inputs are first shifted proportionally with the yields and then reduced by input saving technical progress
of -0.2 % p.a.. Exceptions are nutrient needs of crops (N,P,K) and animal requirements (energy, protein,
fibre etc.) which are driven by yield dependent engineering functions.
The demand system for the EU is calibrated to observed member state data on per capita consumption,
income and population levels6. Changes in demand behaviour not linked to these factors have to be based
5 It should be noted that the DG-AGRI market outlook expect a cut in cereal yield growth rate between 2000-2009 of 50 % against
the 1993-1999 period. This assumption, taken over in the current analysis, has considerable impacts on the development of cereals
markets, as the difference between long term trends and the ones applied adds up to some 20 Mio t by the end of 2009 6 In most cases in line with the data found in DG-Agri’s publication “Prospects for Agricultural Markets 2002-2009”.
6
on assumptions and trend analysis and the baselines of the EU commission and FAPRI. Inflation is set to
1.9 % p.a. and nominal GDP growth for the EU to 2.7 % p.a. and is used as a proxy for consumers’
available income. The assumptions for the EU as a whole are taken over to the individual Member States.
Population growth at Member States level are taken from EUROSTAT.
The price framework in the market part of the model is based on representative long-term time series for
world market prices of major raw and processed agricultural products, which are trend forecasted. These
trends had been compared and partially revised to medium term forecasts by OECD, FAPRI and the EU
Commission. Developments of domestic prices are based on these world market price developments,
border protection and domestic market policies.
Behavioural functions for intervention stocks and subsidised exports in the market model are calibrated
to observed quantities and price relations between domestic, export and administrative prices for a three
year average around 1998.
Data relating to other world regions stem ex post from the WATSIM modelling system, shifted to the
year 2009 based on results of other studies. The resulting data set is adjusted to fulfil consistency
conditions, both in the base and the simulation year. Main data source for the shifters in supply and
demand for non-EU regions is the @2030 framework of FAO’s global perspective unit.
3.2. Scenario assumptions: MTR run
The MTR proposal aims at (1) economic viability, (2) social balance, (3) environmental integration and
animal health and welfare concerns as well as (4) rural development. In order to achieve the goals, the
main thrust of the proposal lies in the decoupling of income support from production decisions. In the
following, the model specification of the MTR proposal will be presented.
(1) In order to calculate the so-called uniform premium, premiums paid under Agenda 2000 were
modified according to the MTR proposal: An increase by 3 €/t of historic yield to 66 €/ton for
‘Grandes Cultures’ reflect a 50 % compensation of the cut in cereals intervention prices. A reduction
of the supplementary payment in durum wheat to 250 €/ha in “traditional areas” bundled with an
abolishment of the supplement in “established areas”. Introduction of an income payment of 102 €/t in
rice (177 €/t – 75 €/t remaining as a crop specific premium)7.
(2) These partially redefined premiums for arable crops, cattle and sheep falling under the new uniform
per farm premium and labelled “decoupled” were applied to the three year average 1998 areas or herd
sizes, and cut if respective ceilings were overshot.
(3) The premiums were “dynamically modulated” until 2009, i.e. six steps of -3 % cuts from the original
level to a final maximal cut of -18 %. As only payments above a certain ceiling – 5.000 € per farm
plus 3.000 € per Annual Working Unit (AWU) exceeding two AWUs –are subject to the modulation,
smaller reduction were applied for groups of payments according to information provided by
Commission Services based on the European Farm Accounting Data Network.
(4) Afterwards, the resulting premium sum at regional level is distributed over eligible hectares and
converted into a regional specific uniform premium per ha in the MTR run. The resulting regional
premium sum was introduced as a ceiling in values at regional level, so that regional premiums per
eligible hectare would be cut if a premium overshot takes place. The following top-ups are added to
the uniform premiums: durum wheat (15 €/t), rice (75 €/t), protein (9.5 €/t) and energy crops
(45 €/ha). According to the proposal, vegetable and fruits are not eligible, and it was assumed that the
7 Support to nuts is not included in the runs, as well as direct payments for dehydrated or sun dried fodder.
7
same is valid for table olives and olives for oils, nurseries, flowers, vineyards and the so-called “other
crops”.
(5) Cereals intervention prices were reduced by 7.5% - the combined effect of a drop by 5% to 95,35 €/t
and the abolishment monthly reports. Further on, rye intervention was abolished and rice intervention
prices reduced to 150 €/ton.
Set-aside obligations are defined as a “continuation of the individual historic set-aside obligation”. That
obligation was calculated at NUTS II level based on the regional crop mix in the base year and on an
obligatory set-aside rate of 10 %, corrected by national or regional small producer shares.
The costs of compulsory farm audits on all relevant material flows and on-farm processes for all farm
receiving more than 5000 € are not included in the study. The error is deemed not important, especially as
financial support covering operation costs is eligible under Rural Development, and the dynamic
modulation will increase budgets available under the second pillar. It can be expected that regional
government will at least partially redirect the budgetary funds into new agri-environmental programs,
especially the proposed “temporary and degressive aid (max 200 €/ha) to farms to help them
implementing statuary standards”.
4. Results
This section discusses the simulation results, both in the reference run as well as in the MTR run for a
number of key items on the EU, as well as at national and regional level. The first part presents medium
term prospects on EU dairy and beef markets and economic impacts of the proposals followed by a
detailed assessment of regional impacts.
4.1. Medium term prospects on dairy and beef markets
4.1.1. Dairy markets
Total raw milk output follows the quota expansion determined by Agenda 2000 of 2.4% to about 125
Mio. t of fresh milk.8 The main factors affecting dairy markets are thus autonomous trends in milk yields –
21.4% in the period 1998 to 2009 - and demand developments for milk products.
On the supply side for processed milk products, different trends can be observed. Whereas cheese
production expands strongly, mainly driven by an increasing demand for cheese by around 13% in the
reference run (or 18.3 kg cheese per capita consumption), supply for butter remains stable and skimmed
milk powder production declines heavily. On the demand side a consumption shift towards fresh and
processed milk products with a lower fat content can be observed. Additionally, the demand shift to
products with lower fat content increase the net exports of butter substantially, as new markets must be
found outside of EU. Net trade of skimmed milk powder decreases drastically, and the EU becomes a net
importer. Net trade of cheese remains stable whereas a strongly increasing share of imports of fresh milk
products can be observed.
8 Note that the figure raw milk presented in table 1 includes the whole milk produced on farm and not only the share of milk
delivered to dairies. Therefore, the simulated increase of 2.5%, higher than the global quota expansion by Agenda 2000, is due to
an increase on farm consumption of milk.
8
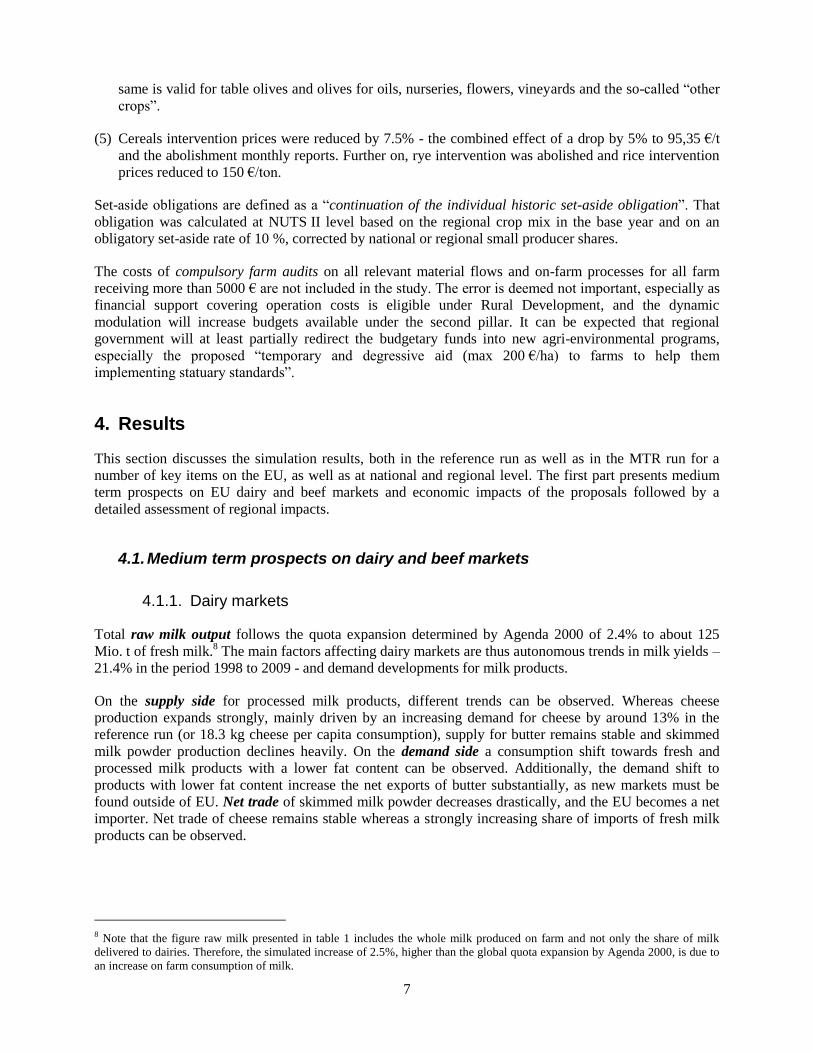
Table 1. Market balance sheet for dairy products on EU level (1000t)
ProductBalances:
125062 0 125062 124998 0 124998
2.56% -0.95% 2.56% -0.05% -46.70% -0.05%1872 0 31 1840 1870 0 30 1840
-0.88% -98.70% 630.69% -2.20% -0.09% -1.10% -5.36% -0.01%
863 0 -144 1007 867 0 -158 1026
-22.19% -99.90% -262.95% 0.53% 0.48% -34.57% -9.88% 1.83%7463 253 7211 7444 243 7202
12.48% -1.42% 13.04% -0.25% -3.96% -0.12%
40053 -35 40088 40009 -53 40062
1.32% -113.04% 2.09% -0.11% -52.74% -0.06%1823 0 8 1815 1821 0 5 1815
-4.22% -98.75% -78.77% -2.61% -0.13% -1.14% -31.05% 0.00%
1370 285 1085 1370 286 1085
3.44% 7.91% 2.33% 0.02% 0.31% -0.05%
873 390 483 874 391 483
-5.75% -14.11% 2.28% 0.09% 0.29% -0.07%
Net trade Demand
European
Union Supply
Inter-
vention Net trade Demand Supply
Base year [1998] Agenda reference run [2009] MTR unchanged dairy policy [2009]
Cheese
1888 2
Raw milk 121941
Inter-
vention
Inter-
vention Net trade DemandSupply
Butter
Concentrated
milk
6635
Fresh milk
products 39532
4 1882
1002
472
256
Skimmed milk
powder 1109 19 89
265
Cream 1904 2 38
1325 264
Whole milk
powder 926 454
0 121941
1061
1864
6379
39267
Furthermore, the decrease of administrative prices by –15% under Agenda 2000 leads to a strong
reduction of intervention purchases for all products as reported in table 1.9 Additionally, subsidised
exports for milk products are reduced both in quantity and in value by –71% and -92%, respectively. The
overall reduction of subsidised exports by around 500.000 t mainly originate from skimmed milk powder.
Under both scenarios, cheese remains the product where most of exports are done with subsidies. The
MTR proposal will not affect substantially the net trade and FEOGA budget for dairy products.10
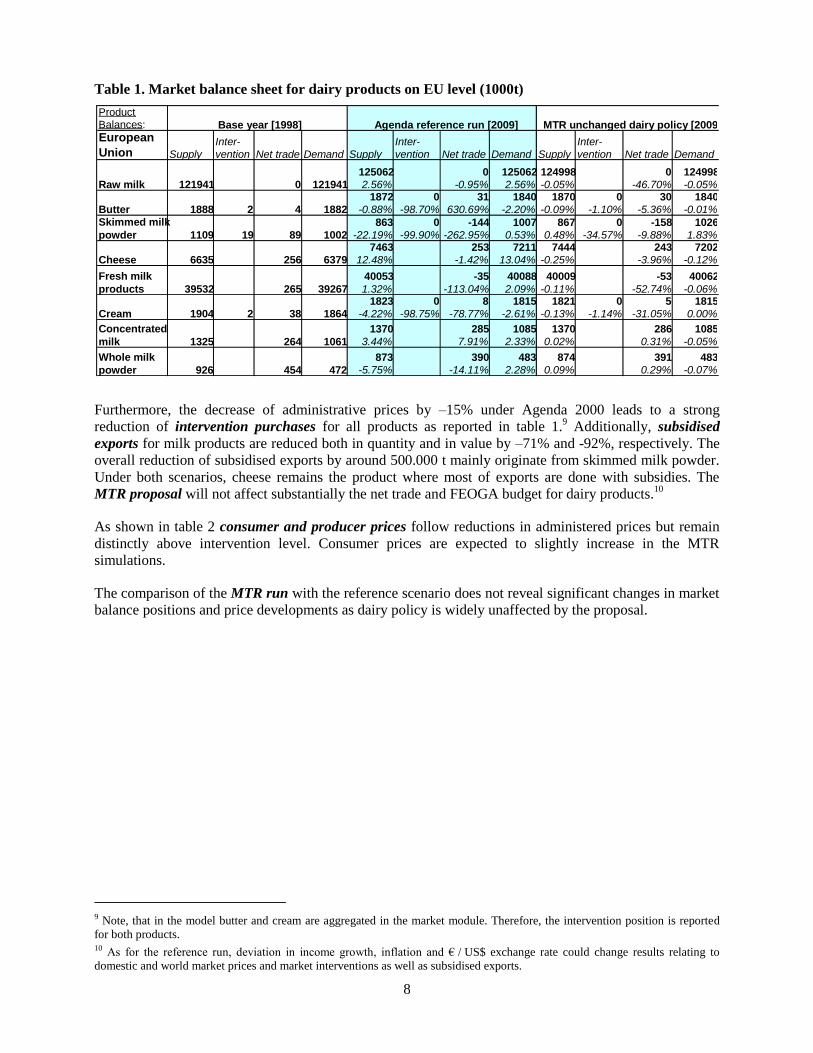
As shown in table 2 consumer and producer prices follow reductions in administered prices but remain
distinctly above intervention level. Consumer prices are expected to slightly increase in the MTR
simulations.
The comparison of the MTR run with the reference scenario does not reveal significant changes in market
balance positions and price developments as dairy policy is widely unaffected by the proposal.
9 Note, that in the model butter and cream are aggregated in the market module. Therefore, the intervention position is reported
for both products. 10 As for the reference run, deviation in income growth, inflation and € / US$ exchange rate could change results relating to
domestic and world market prices and market interventions as well as subsidised exports.
9
Table 2. Price development for dairy products on EU level (€/t)
Prices :
4856 4035 2511 4856 4034 2511
-15.81% -22.92% -15.00% 0.01% -0.02% 0.00%
3103 2526 1572 3127 2218 1572
-3.35% -21.75% -15.00% 0.79% -12.19% 0.00%
7090 6251 3975 7108 6248 3975
-11.98% -20.36% -7.86% 0.25% -0.04% 0.00%
963 884 964 884
-6.26% -20.70% 0.14% -0.01%
3935 2511 3936 2511
-15.19% -15.00% 0.01% 0.00%
2980 2985
-7.22% 0.18%
3853 3859
-6.79% 0.16%
Producer
price
Administrative
price
Whole milk
powder 4134
Concentrated
milk 3212
Cream 4640 2954
Fresh milk
products 1027
3229
1115
7848 4314
Producer
price
European
UnionConsumer
price
Cheese 8055
Butter 5768
1850
Skimmed milk
powder 3210
Consumer
price
5235 2954
MTR unchanged dairy policy [2009]
Producer
price
Administrative
price
Base year [1998] Agenda reference run [2009]
Administrative
price
Consumer
price
Note: Producer prices are calculated on product definition as they are used in the market model, e.g. price for butter represents
the price for the aggregate butter and cream (same holds for ‘Fresh milk products’ which contains in the market model the product
categories: fresh milk products, concentrated milk and whole milk powder). Administrative price for cheese is a weighted mean
of administrative prices for butter and skimmed milk powder multiplied with reported fat and protein content of cheese
production.
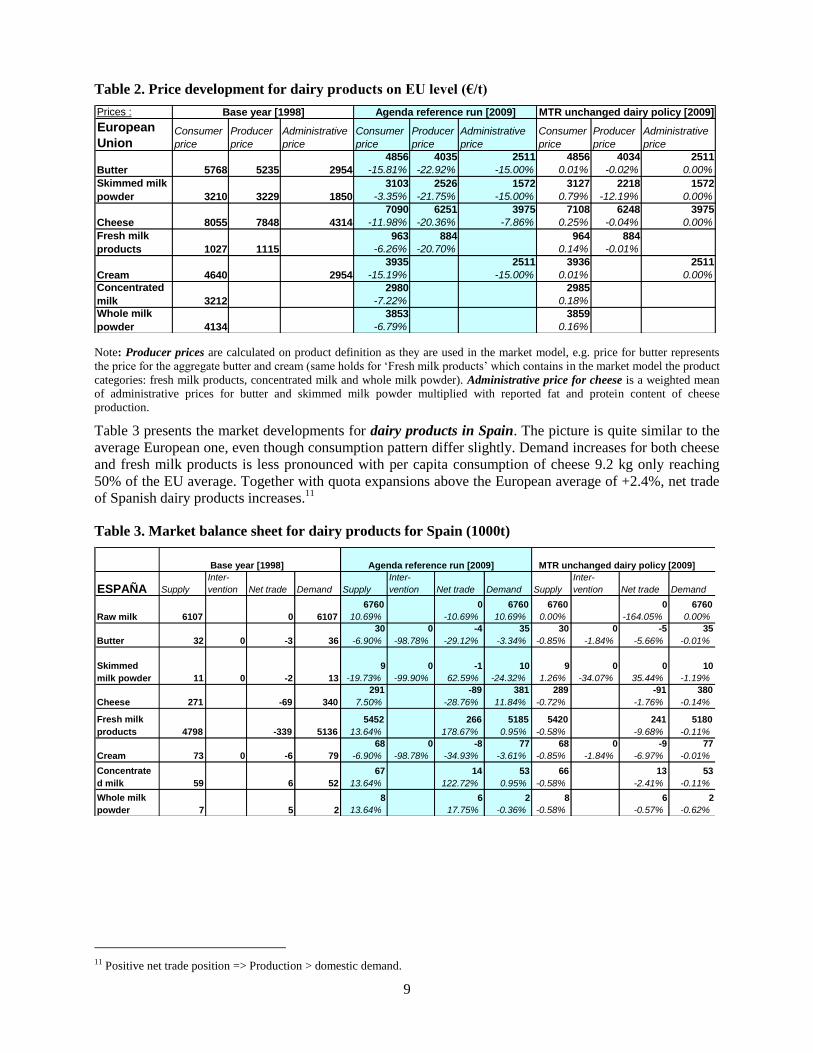
Table 3 presents the market developments for dairy products in Spain. The picture is quite similar to the
average European one, even though consumption pattern differ slightly. Demand increases for both cheese
and fresh milk products is less pronounced with per capita consumption of cheese 9.2 kg only reaching
50% of the EU average. Together with quota expansions above the European average of +2.4%, net trade
of Spanish dairy products increases.11
Table 3. Market balance sheet for dairy products for Spain (1000t)
6760 0 6760 6760 0 6760
10.69% -10.69% 10.69% 0.00% -164.05% 0.00%
30 0 -4 35 30 0 -5 35
-6.90% -98.78% -29.12% -3.34% -0.85% -1.84% -5.66% -0.01%
9 0 -1 10 9 0 0 10
-19.73% -99.90% 62.59% -24.32% 1.26% -34.07% 35.44% -1.19%
291 -89 381 289 -91 380
7.50% -28.76% 11.84% -0.72% -1.76% -0.14%
5452 266 5185 5420 241 5180
13.64% 178.67% 0.95% -0.58% -9.68% -0.11%
68 0 -8 77 68 0 -9 77
-6.90% -98.78% -34.93% -3.61% -0.85% -1.84% -6.97% -0.01%
67 14 53 66 13 53
13.64% 122.72% 0.95% -0.58% -2.41% -0.11%
8 6 2 8 6 2
13.64% 17.75% -0.36% -0.58% -0.57% -0.62%
36
ESPAÑA Supply
Inter-
vention Net trade Demand
Butter 32 0 -3
-2 13
Cheese 271 -69 340
Skimmed
milk powder 11 0
Fresh milk
products 4798 -339 5136
-6 79
Concentrate
d milk 59 6 52
Cream 73 0
Whole milk
powder 7 5 2
Raw milk 6107 0 6107
Agenda reference run [2009]Base year [1998]
Inter-
vention Net trade Demand
Supply Net trade Demand
Inter-
vention
MTR unchanged dairy policy [2009]
Supply
11 Positive net trade position => Production > domestic demand.
10
4.1.2. Beef markets
Due to the close production linkages of dairy and beef activities, simulation impacts for beef and veal will
be briefly presented as well.
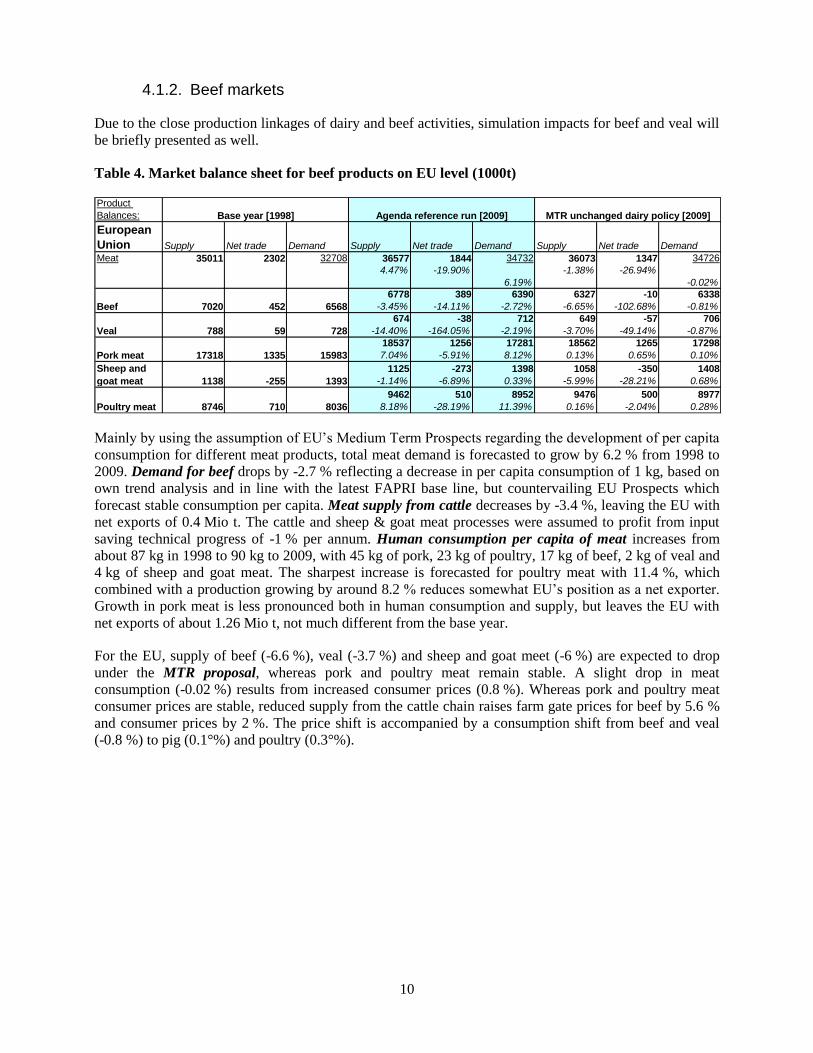
Table 4. Market balance sheet for beef products on EU level (1000t)
Product
Balances:
36577 1844 36073 1347
4.47% -19.90% -1.38% -26.94%
6.19% -0.02%
6778 389 6390 6327 -10 6338
-3.45% -14.11% -2.72% -6.65% -102.68% -0.81%
674 -38 712 649 -57 706
-14.40% -164.05% -2.19% -3.70% -49.14% -0.87%
18537 1256 17281 18562 1265 17298
7.04% -5.91% 8.12% 0.13% 0.65% 0.10%
1125 -273 1398 1058 -350 1408
-1.14% -6.89% 0.33% -5.99% -28.21% 0.68%
9462 510 8952 9476 500 8977
8.18% -28.19% 11.39% 0.16% -2.04% 0.28%
Base year [1998] Agenda reference run [2009] MTR unchanged dairy policy [2009]
710 8036
1335 15983
34726
Net trade DemandSupply
34732
Net trade DemandSupply
Poultry meat 8746
-255 1393
Sheep and
goat meat 1138
Pork meat 17318
59 728Veal 788
Beef 7020 452 6568
Meat 35011 2302 32708
European
Union Supply Net trade Demand
Mainly by using the assumption of EU’s Medium Term Prospects regarding the development of per capita
consumption for different meat products, total meat demand is forecasted to grow by 6.2 % from 1998 to
2009. Demand for beef drops by -2.7 % reflecting a decrease in per capita consumption of 1 kg, based on
own trend analysis and in line with the latest FAPRI base line, but countervailing EU Prospects which
forecast stable consumption per capita. Meat supply from cattle decreases by -3.4 %, leaving the EU with
net exports of 0.4 Mio t. The cattle and sheep & goat meat processes were assumed to profit from input
saving technical progress of -1 % per annum. Human consumption per capita of meat increases from
about 87 kg in 1998 to 90 kg to 2009, with 45 kg of pork, 23 kg of poultry, 17 kg of beef, 2 kg of veal and
4 kg of sheep and goat meat. The sharpest increase is forecasted for poultry meat with 11.4 %, which
combined with a production growing by around 8.2 % reduces somewhat EU’s position as a net exporter.
Growth in pork meat is less pronounced both in human consumption and supply, but leaves the EU with
net exports of about 1.26 Mio t, not much different from the base year.
For the EU, supply of beef (-6.6 %), veal (-3.7 %) and sheep and goat meet (-6 %) are expected to drop
under the MTR proposal, whereas pork and poultry meat remain stable. A slight drop in meat
consumption (-0.02 %) results from increased consumer prices (0.8 %). Whereas pork and poultry meat
consumer prices are stable, reduced supply from the cattle chain raises farm gate prices for beef by 5.6 %
and consumer prices by 2 %. The price shift is accompanied by a consumption shift from beef and veal
(-0.8 %) to pig (0.1°%) and poultry (0.3°%).

11
Table 5. Market balance sheet for beef products in Spain (1000t)
Product
Balances:
4800 192 4752 138
5.07% -11.11% -1.00% -28.03%
5.88% 0.13%
593 55 538 554 19 534
-4.18% 1.81% -4.75% -6.68% -64.80% -0.74%
18 0 18 18 1 18
-13.88% -109.07% -4.78% 3.17% 426.93% -0.74%
2872 226 2647 2877 228 2649
6.99% 5.16% 7.15% 0.17% 1.00% 0.10%
243 5 237 226 -12 237
-1.01% -25.87% -0.27% -6.95% -323.12% 0.03%
1074 -94 1168 1077 -98 1175
7.55% -52.82% 10.16% 0.27% -4.57% 0.61%
MTR unchanged dairy policy [2009]Agenda reference run [2009]Base year [1998]
4614
Net trade DemandSupply
-61 1060
Poultry
meat 999
7 238
Sheep and
goat meat 245
215 2470Pork meat 2685
2 19Veal 20
Beef 619 54 565
Demand
Meat 4569 216 4352
ESPAÑA Supply Net trade Demand
4608
Supply Net trade
The market balance sheet for meat in Spain presents similar trends as the one for the European Union.
Overall supply of meat in the reference run increases slightly less (5%) than the European average. The
expansion is mostly due to increases in pork and beef production. Beef meat supply is expected to
decrease a little bit stronger than for the EU, accompanied by more pronounced drops in demand for beef
and veal. In opposite to dairy products, the MTR proposal will affect the meat supply, whereas demand
remains far more stable due to high marketing margins between producer and consumer prices. Especially
beef production processes are affected by the MTR proposal, mainly by the shift in premium allocation
from a per head basis to a decoupled area payment. Reduced herd sizes, especially for suckler cows,
decrease meat supply and provokes increases in producer price for beef by +5.4%.
4.1.3. Impact on agricultural income, budget and welfare
As discussed above, almost all prices for agricultural outputs are forecasted to fall in real terms in the
reference run for the EU. As seen in table 6, output value from agricultural production at EU level is
forecasted to drop by –7.3 %, whereas input value decreases by –1.3 %, mostly due to falling prices for
feeding stuff. Overall, gross value added at basic prices (agricultural income) reaches 146.7 Billion €, a
decrease in real terms of around –12.2 %. Given long term trends in the agricultural labour force, income
per AWU in agriculture could still increase in real terms. Consumers gain from decreasing consumer
prices in the reference run – a long term trend as cost reductions in agriculture reduce food prices.
Total premium payments decrease by -8.5°% in the MTR run. Agricultural income nevertheless stays
stable, as input drops by some –3.2°% in value whereas output value falls by –1.3°% only as prices
increase. Consumer losses due to slight increasing prices are offset by stronger savings in the FEOGA
budget. Overall, welfare is almost not affected. A more detailed view on the FEOGA budget positions
shows a shift in the compensation payments from cereals and oilseeds to fodder crops on arable land. The
MTR proposal foresees the transfer of budget savings of the modulation from the first to the second pillar
As far as farmers benefit from increased rural development programs, that could offset income losses from
the modulation.

12
Table 6. Welfare analysis for EU and Spain (Mio €)
Base year Reference
run MTR Base year
Reference
runMTR
EU EU EU ESPAÑA ESPAÑA ESPAÑA
31126 2976
1 -6.43% -6.60%
27666 25198 2793 2585
2 -2.78% -8.92% -12.94% -7.46%
308466 304448 35592 35143
3 -7.34% -1.30% -10.72% -1.26%
189132 182997 16321 15859
7 -1.31% -3.24% -4.58% -2.83%
27399 25082 2768 2577
11 5.99% -8.46% -8.23% -6.92%
146733 146533 22039 21861
12=3-7+11 -12.20% -0.14% -14.50% -0.81%
152461 22252
13=1-2+12 152332 0.08% 22432 -0.80%
17104
3017
25777
22568
3186
3209
39864
Equivalent
variation
Feoga
budget
33265
28457
EAA Output 332902
EAA Input 191634
Premiums 25850
Agricultural
income 167118
Total 138661
For Spain the welfare analysis shows a decrease in agricultural income of –14.5% in the reference run
under Agenda policy. This is slightly more than the EU average. In opposite to the EU average,
modifications in the premium scheme lead to a reduction in overall premium payments for Spain
originating from the animal sector. Increasing payments to the beef and cattle in the Spanish meat sector
(+150% compared to only 130% at EU average), mostly due to the newly introduced dairy cow payment
cannot offset the reduced premiums to the sheep & goat sector. This explains, why the FEOGA budget
reduction in the Agenda reference run is so pronounced in Spain. Crop production has to face cuts in area
premium payments which cannot be compensated by the newly introduced cattle and dairy cow premiums,
due to lower production density in the national average. Decreasing consumer prices cannot offset the
welfare effect of decreased agricultural income.
Overall welfare change in the MTR proposal is small hiding a redistribution within the agricultural sector
and a shift of budget positions from the first to the second pillar. As consumers loose slightly more than
the EU average, in opposite to the EU result a small welfare loss can be observed.
The following map shows the changes in premium payments per hectare at NUTS°2 level for the EU from
reference run to MTR proposal. Compared to the foreseen 18°% drop in premiums due to modulation, the
overall cut is smaller as (a) part of the premiums e.g. national envelopes are not included in the
modulation and (b) farm specific ceilings prevent a full cut for included ones. Therefore, especially
regions with high cattle density will be at the lower end of premium reductions.

13
Map 1 Comparison of changes in total premium payments per hectare, MTR against
Agenda 2000
Note: From dark green to light green: between –21°% and -10°%, white around -9°% and from light red to dark red between –
2°% and 26°% income per hectare. Percentage changes with respect to Agenda 2000 reference run.
4.2. Developments in regional production structure in Spain
In this section, developments in the production structure of Spain will be presented. As the CAPRI model
is designed to work on NUTS II level, data and simulation results can be consistently provided on a
detailed regional level. A selection of the available data with special focus on dairy and suckler cow
activities will be reported in this section.
4.2.1. Herd size and regional income for cattle activities
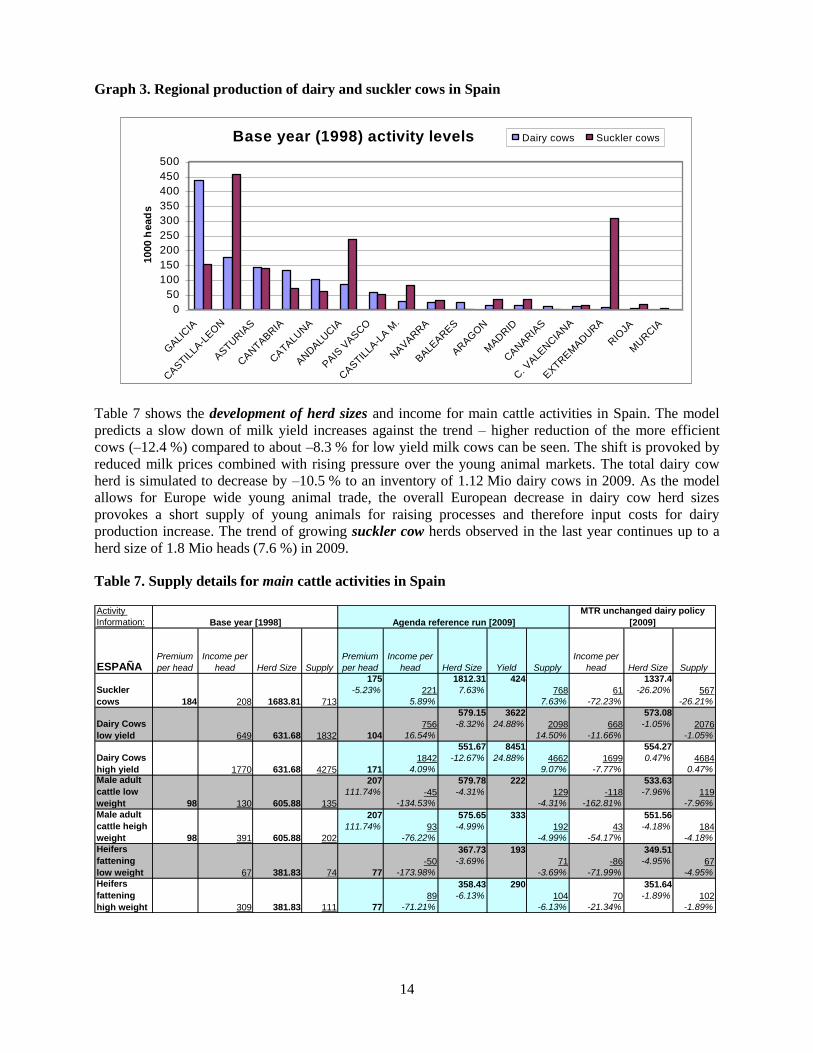
The base period of the model is a three-year-average around 1998. The following graph shows regional
herd sizes for dairy and suckler cow herds. The milk production is focused in northern regions. Galicia is
by far themost important region with twice the number of dairy cows than the next important region
Castilla-Leon. High suckler cow herds are found in Castilla-Leon but also in the center and south of Spain,
namely Extremadura and Andalucia.
14
Graph 3. Regional production of dairy and suckler cows in Spain
Base year (1998) activity levels
0
50
100
150
200
250
300
350
400
450
500
GALI
CIA
CASTIL
LA-L
EO
N
ASTU
RIA
S
CANTA
BRIA
CATA
LUNA
ANDALU
CIA
PAIS
VASCO
CASTIL
LA-L
A M
.
NAVARRA
BALE
ARES
ARAG
ON
MADRID
CANARIA
S
C. V
ALE
NCIA
NA
EXTR
EM
ADURA
RIO
JA
MURCIA
10
00
hea
ds
Dairy cows Suckler cows
Table 7 shows the development of herd sizes and income for main cattle activities in Spain. The model
predicts a slow down of milk yield increases against the trend – higher reduction of the more efficient
cows (–12.4 %) compared to about –8.3 % for low yield milk cows can be seen. The shift is provoked by
reduced milk prices combined with rising pressure over the young animal markets. The total dairy cow
herd is simulated to decrease by –10.5 % to an inventory of 1.12 Mio dairy cows in 2009. As the model
allows for Europe wide young animal trade, the overall European decrease in dairy cow herd sizes
provokes a short supply of young animals for raising processes and therefore input costs for dairy
production increase. The trend of growing suckler cow herds observed in the last year continues up to a
herd size of 1.8 Mio heads (7.6 %) in 2009.
Table 7. Supply details for main cattle activities in Spain
Activity
Information:
175 1812.31 424 1337.4
-5.23% 7.63% -26.20%
5.89% 7.63% -72.23% -26.21%
579.15 3622 573.08
-8.32% 24.88% -1.05%
16.54% 14.50% -11.66% -1.05%
551.67 8451 554.27
-12.67% 24.88% 0.47%
4.09% 9.07% -7.77% 0.47%
207 579.78 222 533.63
111.74% -4.31% -7.96%
-134.53% -4.31% -162.81% -7.96%
207 575.65 333 551.56
111.74% -4.99% -4.18%
-76.22% -4.99% -54.17% -4.18%
367.73 193 349.51
-3.69% -4.95%
-173.98% -3.69% -71.99% -4.95%
358.43 290 351.64
-6.13% -1.89%
-71.21% -6.13% -21.34% -1.89%
SupplyESPAÑAPremium
per head
Income per
head Herd Size Supply
Premium
per head
Income per
head Herd Size Yield
Suckler
cows 184 208 1683.81 713
221 768
631.68 1832
Dairy Cows
low yield 649
Dairy Cows
high yield 1770
4662
104
756 2098
1842
4275
-45
631.68Male adult
cattle low
weight 98 130
171
Heifers
fattening
high weight
129
Male adult
cattle heigh
weight 98 391 605.88 202
605.88 135
93 192
Heifers
fattening
low weight 67 381.83 74
309 381.83 77
89
111
104
77
-50 71
Supply
Income per
head Herd Size
56761
119
1699 4684
668 2076
Base year [1998]
70 102
Agenda reference run [2009]
MTR unchanged dairy policy
[2009]
-86 67
43 184
-118
15
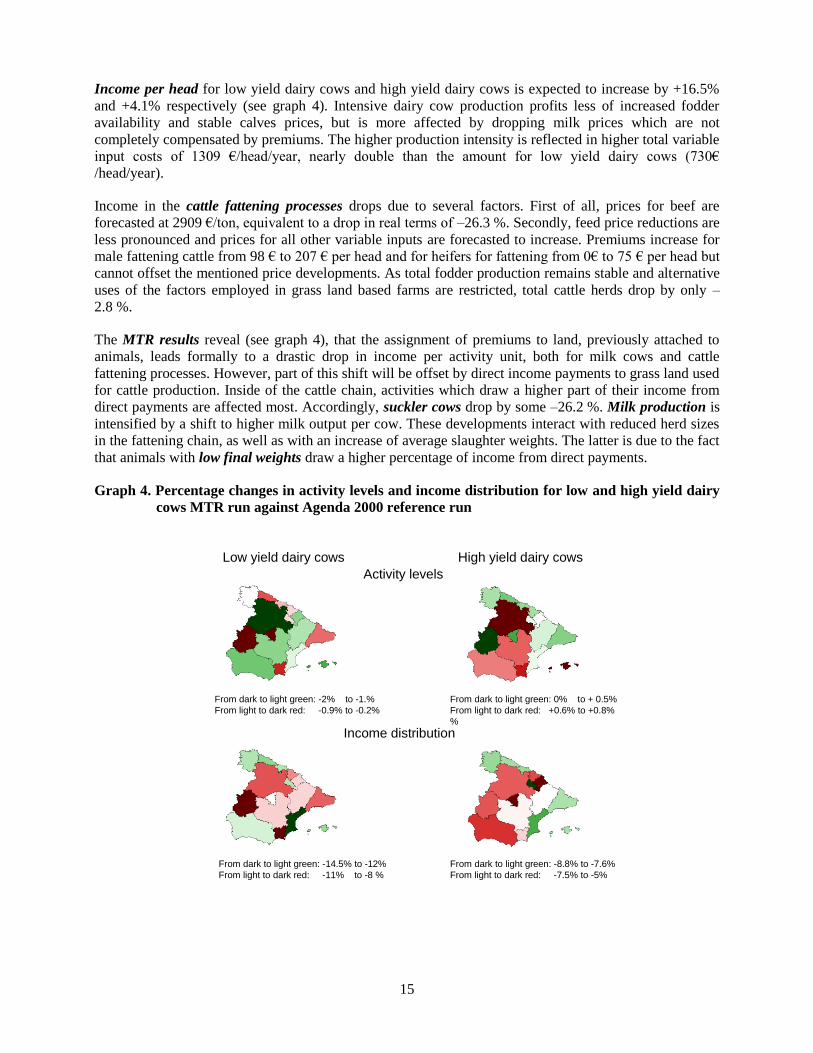
Income per head for low yield dairy cows and high yield dairy cows is expected to increase by +16.5%
and +4.1% respectively (see graph 4). Intensive dairy cow production profits less of increased fodder
availability and stable calves prices, but is more affected by dropping milk prices which are not
completely compensated by premiums. The higher production intensity is reflected in higher total variable
input costs of 1309 €/head/year, nearly double than the amount for low yield dairy cows (730€
/head/year).
Income in the cattle fattening processes drops due to several factors. First of all, prices for beef are
forecasted at 2909 €/ton, equivalent to a drop in real terms of –26.3 %. Secondly, feed price reductions are
less pronounced and prices for all other variable inputs are forecasted to increase. Premiums increase for
male fattening cattle from 98 € to 207 € per head and for heifers for fattening from 0€ to 75 € per head but
cannot offset the mentioned price developments. As total fodder production remains stable and alternative
uses of the factors employed in grass land based farms are restricted, total cattle herds drop by only –
2.8 %.
The MTR results reveal (see graph 4), that the assignment of premiums to land, previously attached to
animals, leads formally to a drastic drop in income per activity unit, both for milk cows and cattle
fattening processes. However, part of this shift will be offset by direct income payments to grass land used
for cattle production. Inside of the cattle chain, activities which draw a higher part of their income from
direct payments are affected most. Accordingly, suckler cows drop by some –26.2 %. Milk production is
intensified by a shift to higher milk output per cow. These developments interact with reduced herd sizes
in the fattening chain, as well as with an increase of average slaughter weights. The latter is due to the fact
that animals with low final weights draw a higher percentage of income from direct payments.
Graph 4. Percentage changes in activity levels and income distribution for low and high yield dairy
cows MTR run against Agenda 2000 reference run
Low yield dairy cows High yield dairy cows
Activity levels
Income distribution
From dark to light green: -2% to -1.%
From light to dark red: -0.9% to -0.2%
From dark to light green: -14.5% to -12%
From light to dark red: -11% to -8 %
From dark to light green: -8.8% to -7.6%
From light to dark red: -7.5% to -5%
From dark to light green: 0% to + 0.5%
From light to dark red: +0.6% to +0.8%
%

16
4.2.2. Trends on young animal markets
The mathematical programming approach on the supply side of the model allows to assess the impacts of
policy or price changes in the cattle chain. When looking at young animal markets, it is important to note,
that the model allows to trade young animals within the EU. As shown in table 8, reduced cow herds in
Spain allow to reduce the number of female and male raised calves (-4.9% and –1.7% respectively) and
heifers (-8%) in the reference run. Reduced meat prices combined with less calves born affect the calves
fattening processes as well, which drop by around -15%.
The reduction in both the beef fattening processes and suckler cows with premiums allocated to grass land
under the MTR proposal reduces the demand for calves in the EU, and therefore the number of raised
calves and heifers drops further.
Table 8. Supply details for young animal activities in Spain
Activity
Information:
354.89 328.91
-8.15% -7.32%
-30.26% -8.15% -31.51% -7.32%
34.51 256 36.41
-16.13% 5.50%
-68.73% -16.11% 40.24% 5.51%
16.31 538 16.44
-11.50% 0.82%
-36.26% -11.50% -0.69% 0.82%
1214.85 1101.93
-1.77% -9.30%
-3.53% -1.77% -15.13% -9.30%
1103.85 1040.93
-4.93% -5.70%
-9.97% -4.93% -9.62% -5.70%
Base year [1998] Agenda reference run [2009]
MTR unchanged dairy policy
[2009]
ESPAÑAPremium
per head
Income per
head Herd Size Supply
Premium
per head
Income per
head Herd Size SupplyHerd Size Yield Supply
Income per
head
Heifers
breeding 381 386.4 386
266 355 182 329
Fattening
male calves 356 41.15 11 25
111 9 156 9
Fattening
female
calves 1086 18.43 10 25
692 9 687 9
Raising
male calves 429 1236.69 1237
414 1215
1161
327 1104
Raising
female
Calves 363 1161.11
296 1041
351 1102
5. Conclusions
Medium term drivers in European dairy markets are the developments of consumption patterns and CAP
instruments. With the quota system unharmed by both the Agenda 2000 package and the MTR proposal,
and quota quantities almost unchanged, price developments for dairy products reflect the interaction
between consumption trends towards low-fat dairy products and cheese, and market interventions
depending on administrative price levels. In the reference run, reflecting the Agenda 2000 package, cuts in
administrative prices for butter and skimmed milk powder let market prices decrease, and producer
income drops despite the introduction of compensation payments.
The MTR proposal from July 2002 certainly leads to a higher market orientation of European farmers.
Due to less coupled premiums, allocation efficiency increases with farming decisions closer linked to
market prices. Additionally, the proposal reduces scope and frequency of market interventions as
intervention prices are further reduced below expected average world market prices. However, a stronger
European currency or temporary imbalances in world markets could still provoke a built up of intervention
stocks. The continuation of the CAP reform path of shifting from price to direct income support further
detaches budget outlays from market developments and stabilises the FEOGA budget as direct support is
bounded to value ceilings.
In the recently published draft of legal texts for the MTR proposals (Commission of the European
Communities 2003) the European Commission suggests the prolongation of the system of dairy reference
quantities until the year 2014/15 combined with a 1% quota increase in the years 2007/8. An additional
asymmetric price cut for skimmed milk powder (-3.5%) and butter (-7%) beyond Agenda 2000 is
17
foreseen, stepwise over five years. Based on the simulation results for the MTR package as defined last
summer, the additional stipulations are not likely to change the picture dramatically. The quota increase
will depress somewhat prices, and hence trigger additional demand. Higher market interventions are
unlikely, as administrative prices are further reduced, so that the FEOGA budget should not be affected.
Producers will gain from increased milk quantities, and loose somewhat from lower prices. If cleverly
managed, the higher quotas could help some farmers to profit from scale effects and speed up structural
adjustments. Increased dairy cow herds will depress calves’ prices, and are likely to reduce the suckler
cow herd.
Even if the model does not feature back- and forward linkages with other sectors of the economy, it should
be noted that both agricultural output in quantities and values as well as input use are reduced under the
MTR proposal affecting rural economic activities linked to agriculture, but counteracted by higher budgets
for rural development under the second pillar resulting from modulation.
6. References
Commission of the European Communities (2002): Mid-Term Review of the Common Agricultural Policy,
Communication from the Commission to the Council and the European Parliament, 10.7.02, COM(2002) 394,
Brussels.
Commission of the European Communities (2002a): Report on Milk Quotas, Commission working document,
SEC(2002) 789 final.
Commission of the European Communities (2003): Proposal for a Council Regulation establishing common rules for
direct support schemes under the common agricultural policy and support schemes for producers of certain
crops, 21.1.2003 COM(2003) 23 final.
European Commission Directorate for Agriculture (2000): The CAP reform: Milk and Milk products, Brussels
European Commission Directorate for Agriculture (2002): Prospects for Agricultural Markets 2002-2009,
Luxembourg: Office for Official Publications of the European Communities.
European Commission Directorate for Agriculture (2000): Agenda 2000 CAP Reform decisions - Impact Analyses,
Luxembourg: Office for Official Publications of the European Communities.
FAPRI (2002): World Agricultural Outlook. Iowa State University – University of Missouri-Columbia
INRA-WAGENINGEN (2002): Study on the impact of future options for the Milk Quota system and the common
market organisation for milk and milk products, INRA Consortium – University of Wageningen.