Embed Size (px)
Citation preview

10/12/2017Mid-Atlantic Water Resources Conference
National Conservation Training Center, W.Va | Oct 12-13, 2017
ENSEMBLE FLOOD INUNDATION FORECASTING: A CASE STUDY IN THE TIDAL DELAWARE RIVERMichael Gomez & Al fonso Mej ia
Civi l and Environmental Engineering
Pennsylvania State Universi ty

Floods are among the deadliest natural disasters but alert systems are ineffective
2
Sources: http://www.nws.noaa.gov/ohd/hurricane/inland_flooding.htmlhttps://www.weather.gov/okx/HurricaneSandy

Operational flood forecasting does not show spatial distribution of floods
3
Numerical Weather
Prediction model
Precipitation and temperature forecast
Hydrological model
Source: http://water.weather.gov/ahps2/hydrograph.php?wfo=phi&gage=tren4

Two types of flood inundation forecasting: Inland and coastal
4
Source: http://water.weather.gov/ahps2/inundation/index.php?gage=tren4 Source: https://tidesandcurrents.noaa.gov/ofs/ofs_animation.shtml?ofsregion=db

There is a gap between inland and coastal operational flood forecasts
5

My objective with this research is
Improve flood inundation forecasting by using ensemble hydrometeorological forecasts and statistical postprocessing with a coupled hydrologic/hydraulic model
6

These are some questions that I address with this research
1. How skillful are medium-range flood forecast maps?
2. Are weather ensembles able to enhance, over deterministic weather predictions, the mapping of flood inundation forecasts?
3. Can statistical postprocessing improve flood inundation forecast maps?
7
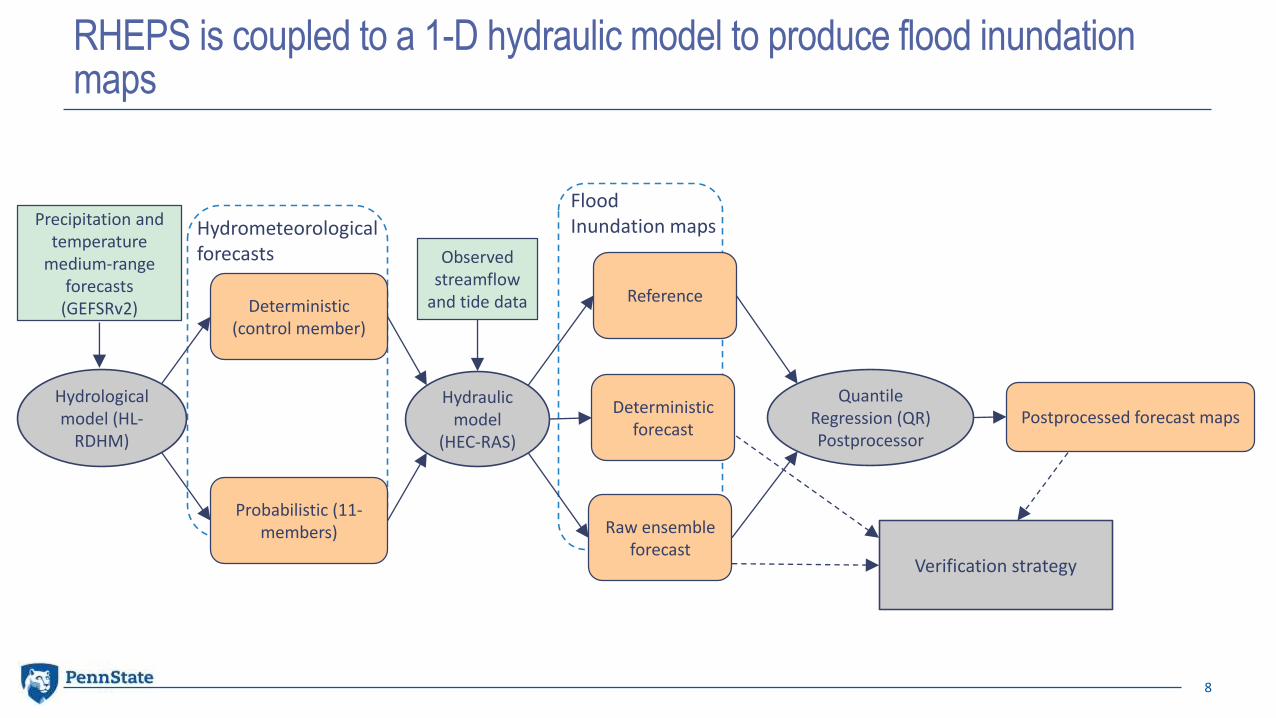
RHEPS is coupled to a 1-D hydraulic model to produce flood inundation maps
Precipitation and temperature
medium-range forecasts
(GEFSRv2)
Hydrological model (HL-
RDHM)
Probabilistic (11-members)
Deterministic (control member)
Observed streamflow
and tide data
Hydraulic model
(HEC-RAS)
Reference
Deterministicforecast
Raw ensemble forecast
Quantile Regression (QR) Postprocessor
Verification strategy
Postprocessed forecast maps
8
Hydrometeorologicalforecasts
Flood Inundation maps

The Delaware River near Philadelphia is the study reach
9
Streamflow gages Tidal gages

A comprehensive verification of the inundation maps is done for a 6-yr period (2008-2013)
Reference Deterministic
Verification strategy• Multiyear• Multiple metrics• Conditional on flow
conditions• Applied at each cross
section
Raw ensemble Postprocessed
10
Flood inundation maps
forecast forecast forecast

HL-RDHM was calibrated and the performance is satisfactory
11

The calibration of the HEC-RAS model is also satisfactory
12

Deterministic flood inundation forecast is skillful at day 7 but highly biased
13

Raw ensemble flood inundation forecast skill improves over deterministic but still highly biased
14

Postprocessing flood inundation forecasts improves error, bias and skill
15
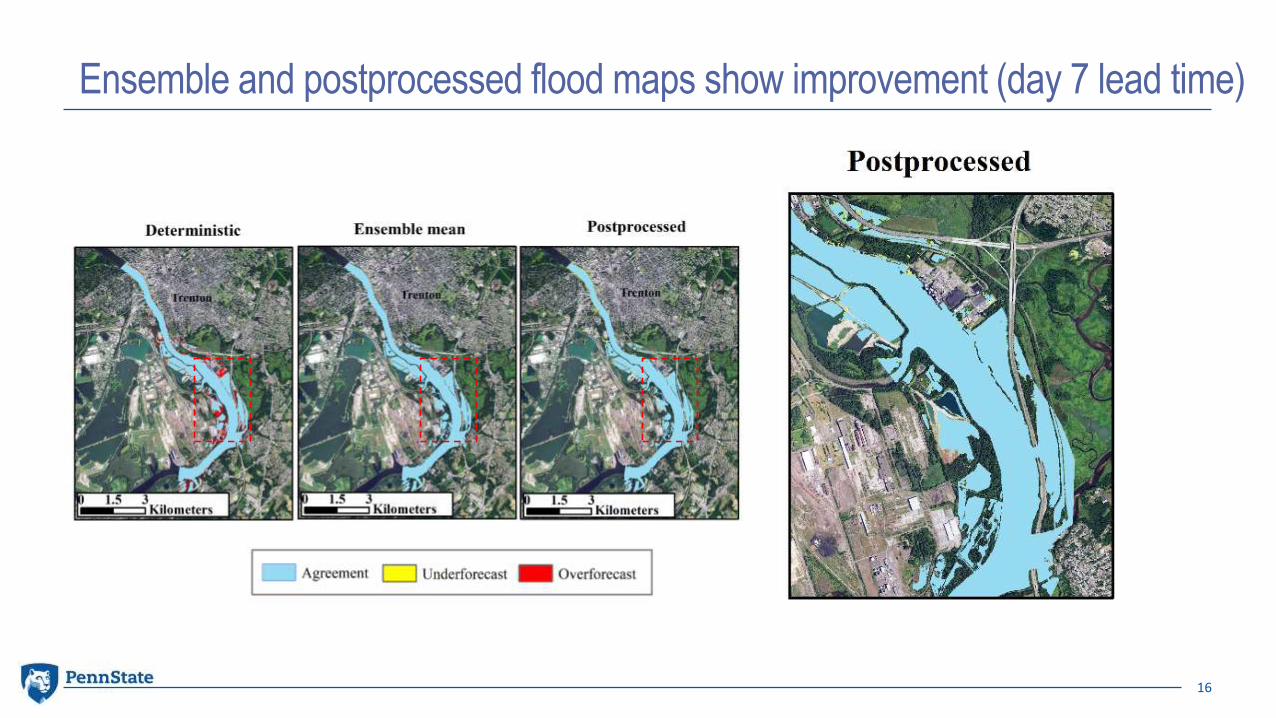
Ensemble and postprocessed flood maps show improvement (day 7 lead time)
16

We conclude that…
• Flood inundation maps produced with GEFSRv2 weather ensemble forecasts show atendency to underforecast high stage events.
• Hydrometeorological forecast uncertainties can introduce high errors to the floodinundation forecasts during high flow conditions in the riverine-estuarine transition zone,especially at the later lead times.
• Flood inundation maps generated with the raw ensemble hydrometeorological forecastsshow more skill and less error than the deterministic flood inundation forecasts.
• Statistical postprocessing can improve the skill and reduce error and bias on floodinundation forecasts.
17

Verification metricsMean Absolute Error (MAE)
The MAE quantifies the absolute average error between the simulated values and their corresponding observations. The MAE is expressed as follows:
where Xi and Yi denote the simulated and observed flow, respectively, at time i.
Root mean square error
The RMSE quantifies the absolute average error between the simulated values and their corresponding observations. Given that the error is squared before averaging the metric is sensitive to larger errors. The RMSE is given by
where Xi and Yi denote the simulated and observed flow, respectively, at time i.
19
1
1MAE
n
i i
i
X Yn
2
1
( )
RMSE
N
i i
i
X Y
n

Verification metrics
20
Percent Bias (PB)
PB measures the average tendency of the simulated values to be larger or smaller than the observed. The PB is given by
where Si and Yi denote the simulated and observed flow, respectively, at time i.
Nash-Sutcliffe Efficiency (NSE)
The NSE is defined as the ratio of the residual variance to the initial variance. It is widely used to measure the accuracy of the simulated flows in comparison to the observed mean. The range of NSE can vary between negative infinity to 1. Any positive value close to 1 indicates a good match between the simulated and observed variable while a negative value indicates that the observed mean is better than the simulated. The NSE is defined as:
where Si, Yi, and are the simulated, observed, and mean observed flow, respectively, at time i.
1
1
( )
PB 100,
N
i i
i
N
i
i
Y S
Y
2
1
2
1
( )
NSE 1
( )
N
i i
i
N
i i
i
S Y
Y Y

Verification metrics
21
Wilmott Skill (WS)
The WS is a widely used metric for measuring the performance of hydrodynamic models, especially in tidal rivers and estuaries. The range of the WS can vary between 0 and 1. A WS value of 1 means a perfect agreement between predictions and observations, and a value of 0 represents no skill. The WS can be expressed as:
where Xi, Yi and denote the simulate, observed and mean observed stage heights, respectively, at time i.
2
1
2
1
WS 1
N
i i
i
N
i i i i
i
Y X
Y X X X

Verification metrics
22
Mean Continuous Ranked Probability Skill Score (CRPSS)
Continuous Ranked Probability Score (CRPS), which is less sensitive to sampling uncertainty, is used to measure the integrated square difference between the cumulative distribution function (cdf) of a forecast, , and the corresponding cdf of the observation, . The CRPS is given by
To evaluate the skill of the main forecast system relative to the reference forecast system, the associated skill score, the mean Continuous Ranked Probability Skill Score (CRPSS), is defined as:
where the CRPS is averaged across n pairs of forecasts and observations to calculate the mean CRPS of the main forecast system ( ) and reference forecast system ( ). The CRPSS ranges from -ꝏ to 1, with negative scores indicating that the system to be evaluated has worse CRPS than the reference forecast system, while positive scores indicate a higher skill for the main forecast system relative to the reference forecast system, with 1 indicating perfect skill.
2
CRPS ( ) ( ) .x yF q F q dq
main
reference
CRPSCRPSS 1 ,
CRPS
( )xF q ( )yF q
mainCRPS referenceCRPS

Statistical postprocessor (QR)
QR is a statistical method for estimating the quantiles of a conditional distribution [7, 8].
Using the training dataset a set of quantile error models are derived for individual lead times:
Where and are regression constants that are determined by minimizing the sum of the residual from the training data set:
23
, , , ,ˆ Qn n n na b
1
, , ,min ,ˆ ,QN
i
n n i n i ii

Statistical postprocessor (QR)
is the weighting function for the τth quantile defined as:
24
Where is the residual, defined as the difference between the observed error and the quantile regression estimated error for a given lead time and quantile . Lastly, to obtain the calibrated forecast, , the following equation is used:
, ,
, ,
, ,
1 0.n i n i
n n i
n i n i
if
if
, ,
ˆ . n nnf Q
*
n
,n i
,nf


![Flood Rapid Assessment Model (F-RAM) Development 2008€¦ · Flood Rapid Assessment Model (F-RAM) Development. 2008. NOVEMBER 2008. ... Flood Damage Analysis [HEC-FIA], Hazard US](https://img.pdfslide.us/doc/110x75/5e9ca1f36d26ba4bac70a8a6/flood-rapid-assessment-model-f-ram-development-2008-flood-rapid-assessment-model.jpg)