Embed Size (px)
Citation preview

© 2013 IEEE
Proceedings of the 10th IEEE International Conference on Power Electronics and Drive Systems (PEDS 2013), Kitakyushu,Japan, April 22-25, 2013
Medium Frequency Transformers for Solid-State-Transformer Applications - Design and ExperimentalVerification
G. Ortiz,M. Leibl,J. W. Kolar,O. Apeldoorn
This material is published in order to provide access to research results of the Power Electronic Systems Laboratory / D-ITET / ETH Zurich. Internal or personal use of this material is permitted. However, permission to reprint/republish this material for advertising or promotional purposes or for creating new collective works for resale or redistribution must be obtained from the copyright holder. By choosing to view this document, you agree to all provisions of the copyright laws protecting it.

Medium Frequency Transformers for Solid-State-Transformer
Applications - Design and Experimental Verification
G. Ortiz*, M. Leibl*, J. W. Kolar* and O. Apeldoorn**
*Power Electronic Systems Laboratory, ETH Zurich
**Power Electronics and Medium Voltage Drives, ABB Switzerland AG
Email: [email protected]
Abstract—Solid-state-transformer technology pushes thespecifications of electric transformers in the high-powermedium-frequency range. This combination results in larger-sized transformers operating at higher frequencies wherebyparasitic phenomenon should be carefully accounted for. Thispaper presents an analytical description of the limiting factorsand the connection between frequency/power rating and theavailable core and copper conductor technology on the powerdensity and efficiency of medium-frequency transformers.Furthermore, two designed transformers for 166 kW/20 kHzbased on two different core materials and cooling systemsare presented. Extensive copper, core and cooling system lossmeasurements on one of these transformers are discussed inorder to analyze the transformers’ behavior from a practicalpoint of view.
I. INTRODUCTION
Electric transformers, either utilized in electric power
systems or within a power electronic-based converter, arefundamental components within modern high-efficient en-
ergy supply chains. Two important specifications of these
transformers are their VA (power) rating and operatingfrequency since, combined with the available magnetic core
materials and copper conductor technology, they strongly
influence the two key features of a transformer: its efficiencyand power-density.
Depending on their VA/frequency ratings, transformers
can be classified into four main groups, as shown in Fig. 1.
For high power levels > 50 kW line frequency, i.e. 50Hzor 60Hz transformers are the predominant choice (e.g. for
distribution applications) due to their simplicity and com-paratively high efficiency. At lower powers < 50 kW, low
frequency 50Hz transformers can be found mainly at the
input of isolated power supplies with low power densityrequirements. Power electronics circuits enable the opera-
tion of transformers at higher frequencies, thus facilitating
the realization of highly-compact and high-efficiency powersupplies, as described in the literature for power levels up to
50 kW [1].
Driven mainly by the growing interests in Smart Grid
technologies and modern traction solutions and enabled byrecent advances in semiconductor devices operated under
soft-switching modulation schemes, systems of higher power
> 50 kW with DC-DC converters operating at Medium Fre-quency (MF) > 1 kHz are currently subject to strong attention
[2]. In particular, the Solid-State-Transformer (SST) concept
combines the desired features of flexible power routing [3](smart-grids) due to the mains and load side active power
circuits and the reduction in size/weight due to the operation
Pow
er [
VA
]
103
104
105
106
101
102
103
104
105
Frequency [Hz]
Distribution
Low power-densitypower supplies
High power-densitypower supplies
Solid-state-transformers
AC
DC
ACDC DC
DC DCAC AC
AC
ACDC
DCACDC
AC50[Hz]
Figure 1: Classification of electric transformers based on theirpower/frequency specifications.
at MF of the isolation transformer (attractive for modern
traction solutions) [4–6].
From the transformer’s perspective, for a given operating
frequency, higher power leads to an increased size. However,the combination of higher frequencies and larger dimensions
results in strong parasitic effects in the core material, copper
conductors and, in some cases, in the cooling system. Ifnot properly accounted for, these effects increase the losses
of the transformer, decreasing its efficiency and ultimately
compromising its reliability. Moreover, for a given efficiency,higher power density leads to higher loss density, thus
efficient transformer cooling concepts become mandatory.
This paper explores by means of Pareto-front analysis the
trade-offs present in the construction of MF transformersstarting from a theoretical analysis of the boundaries in
power density and efficiency imposed by today’s available
core materials and copper conductor technology in Section
II. Practical considerations are included in the optimized
design of two transformer examples realized with different
core materials and cooling concepts, as described in Section
III. Details about the realization of these two transformers
and exhaustive measurement results are presented in Section
IV.
II. LIMITS OF HIGH-POWER MF TRANSFORMERS
Inductive components are ideally designed such that power
density and efficiency are in Pareto optimum. This means
that the power density can not be increased without reducingefficiency. All Pareto optimal pairs of power density and
efficiency compose a line, called the Pareto front. In this
section it is shown, that for a certain transformer design thereis a optimum frequency that maximizes efficiency and power
density. The apparent power S of a transformer is given as:
978-1-4673-1792-4/13/$31.00 ©2013 IEEE 1285
S =ωBJAcAw
4(1)
With the core and winding areas Ac, Aw, the spatial
average of flux density and current density amplitudes B,
J and the frequency ω = 2πf .
The core loss density can be calculated by the original
Steinmetz equation:
pc = k1−βfe kfαBβ (2)
With core filling factor kfe and the Steinmetz parameters
k, α and β of the core material.
The loss density of a litz wire winding results from
the approximation for strand diameters smaller than skindepth [7] and assuming a one dimensional magnetic field
distribution as it would result from homogenously distributed
strands in the core window.
pw =1
kcuσ
(
1 + af2) J2
2(3)
With a = 1
48(πkcuσµwwds)
2, the winding filling factor
kcu, the conductivity σ, the winding width ww and the strand
diameter ds.
It is now assumed, that all geometric dimensions of a
transformer, the strand diameter and the core material aregiven. Further, the transformer is initially operated at a
frequency f0, a flux density B0 and a current density J0.
A variation of f , B and J results in relative changes inapparent power and core and winding loss densities:
S
S0
=fBJ
f0B0J0(4)
pcpc0
=
(
f
f0
)α(
B
B0
)β
(5)
pwpw0
=
(
1 + af2)
J2
(1 + af20) J2
0
(6)
We will now set the relative change in apparent powerequal to each relative change in loss density, i.e. we set S
S0=
pc
pc0and S
S0= pw
pw0. Which means that the efficiency is kept
constant. Each expressions yields the rise in current density:
J
J0=
(
f
f0
)α−1(
B
B0
)β−1
(7)
J
J0=
fB(
1 + af20
)
f0B0 (1 + af2)(8)
From equating (7) and (8) we find the relative change ofthe flux density with frequency:
B
B0
=
(
f
f0
)
2−αβ−2
(
1 + af20
1 + af2
)
1β−2
(9)
And by inserting (9) in (7) or (8) we get the relative change
of the current density with frequency:
J
J0=
(
f
f0
)
β−α
β−2(
1 + af2
0
1 + af2
)
β−1
β−2
(10)
By inserting (9) and (10) in (4), we obtain the relative
change of the apparent power:
S
S0
=
(
f
f0
)
2β−2α
β−2(
1 + af20
1 + af2
)
β
β−2
(11)
Independent of f0, the apparent power always reaches a
maximum at a certain frequency, that only depends on α, βof the core material, the winding conductivity σ, filling factor
kcu, the strand diameter ds and the winding width ww. This
optimum frequency fopt is obtained from differentiating (11)and setting it to zero:
fopt =
√
1
a
(
β
α− 1
)
(12)
Since the efficiency is kept constant and the power density
has a maximum at the frequency fopt, any variation of thefrequency would lead to a sub-optimum design. Therefore
the optimum frequency criterion is a necessary criterion for
Pareto optimality. However, usually the frequency is fixed. Inthis case one can fulfill the optimum frequency criterion by
setting the strand diameter and winding width accordingly.
To set the optimum ratio between current density and fluxdensity for a specific value of apparent power, we start from
the total losses of the transformer:
Pv = VckcBβ + VwkwJ
2 (13)
With the volume of the core Vc, the volume of the winding
Vw , a core loss constant kc = k1−βfe kfα
opt, and a winding loss
constant kw = 1
2kcuσ(1 + af2). By expressing and inserting
the current density from (1), we find the flux density thatminimizes the losses:
B =
(
32kwβω2kc
)1
β+2
S2
β+2
(
Vw
VcA2cA
2w
)1
β+2
(14)
Inserting B in (13), shows, if the product of stranddiameter and winding width is kept constant, that the losses
for a certain volume always show a minimum at certain
aspect ratios of core and winding area (pc = 3.1,pw = 2.6),and at a ratio of core width over winding width (pcw = 1.4).
Using these proportions all geometric dimensions can be
calculated from the total volume Vbox.
In order to obtain a Pareto front, we will now sweep over
the strand diameter from 20µm to 500µm, the frequency
from 8 kHz to 300 kHz and the rated power from 100Wto 10MW. Only the core materials EPCOS N87 and VAC
Vitroperm 500F with their according filling factors are con-
sidered, further a winding filling factor of 20% is assumed.The winding width is set such that the optimum frequency
criterion is satisfied. Using the aforementioned proportions,
the total volume Vbox and the losses are calculated for thefull range of f , ds and S. The effect of frequency, rated
power and cooling system capability on the performance in
1286
Eff
icie
ncy
[%
]
94
95
96
97
98
99
100
100
101
102
103
104
105
Power Density [kW/dm ]3
Eff
icie
ncy
[%
]
94
95
96
97
98
99
100
100
101
102
103
104
105
Power Density [kW/dm ]3
Eff
icie
ncy
[%
]
94
95
96
97
98
99
100
100
101
102
103
104
105
Power Density [kW/dm ]3
Rat
ed P
ow
er [
W]
20 30 40 50 60
Power Density [kW/dm ]3
102
103
104
105
106
107
a)
c)
b)
d)
20 mμ50 mμ100 mμ
500 mμ
8 kHz 40 kHz120 kHz
300 kHz99.5 %
99.85 %
99.95 %
Vitroperm 500F EPCOS N87
8 kHz> 8 kHz
> 40 kHz
> 120 kHz
< 0.1 W/cm2
< 10 W/cm2 < 100 W/cm2
< 1 kW
< 10 kW< 100 kW
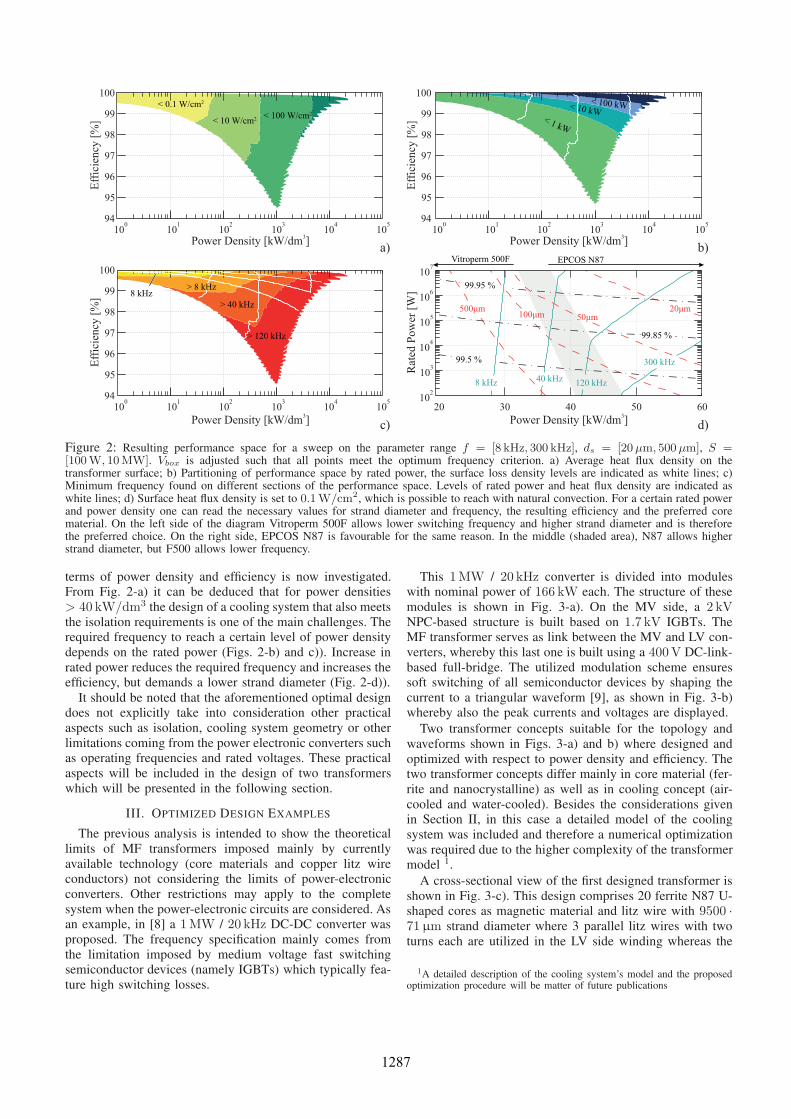
Figure 2: Resulting performance space for a sweep on the parameter range f = [8 kHz, 300 kHz], ds = [20µm, 500µm], S =[100W, 10MW]. Vbox is adjusted such that all points meet the optimum frequency criterion. a) Average heat flux density on thetransformer surface; b) Partitioning of performance space by rated power, the surface loss density levels are indicated as white lines; c)Minimum frequency found on different sections of the performance space. Levels of rated power and heat flux density are indicated aswhite lines; d) Surface heat flux density is set to 0.1W/cm2, which is possible to reach with natural convection. For a certain rated powerand power density one can read the necessary values for strand diameter and frequency, the resulting efficiency and the preferred corematerial. On the left side of the diagram Vitroperm 500F allows lower switching frequency and higher strand diameter and is thereforethe preferred choice. On the right side, EPCOS N87 is favourable for the same reason. In the middle (shaded area), N87 allows higherstrand diameter, but F500 allows lower frequency.
terms of power density and efficiency is now investigated.From Fig. 2-a) it can be deduced that for power densities
> 40 kW/dm3 the design of a cooling system that also meets
the isolation requirements is one of the main challenges. Therequired frequency to reach a certain level of power density
depends on the rated power (Figs. 2-b) and c)). Increase in
rated power reduces the required frequency and increases theefficiency, but demands a lower strand diameter (Fig. 2-d)).
It should be noted that the aforementioned optimal designdoes not explicitly take into consideration other practical
aspects such as isolation, cooling system geometry or other
limitations coming from the power electronic converters suchas operating frequencies and rated voltages. These practical
aspects will be included in the design of two transformers
which will be presented in the following section.
III. OPTIMIZED DESIGN EXAMPLES
The previous analysis is intended to show the theoretical
limits of MF transformers imposed mainly by currently
available technology (core materials and copper litz wireconductors) not considering the limits of power-electronic
converters. Other restrictions may apply to the complete
system when the power-electronic circuits are considered. Asan example, in [8] a 1MW / 20 kHz DC-DC converter was
proposed. The frequency specification mainly comes from
the limitation imposed by medium voltage fast switchingsemiconductor devices (namely IGBTs) which typically fea-
ture high switching losses.
This 1MW / 20 kHz converter is divided into moduleswith nominal power of 166 kW each. The structure of these
modules is shown in Fig. 3-a). On the MV side, a 2 kVNPC-based structure is built based on 1.7 kV IGBTs. TheMF transformer serves as link between the MV and LV con-
verters, whereby this last one is built using a 400V DC-link-
based full-bridge. The utilized modulation scheme ensuressoft switching of all semiconductor devices by shaping the
current to a triangular waveform [9], as shown in Fig. 3-b)whereby also the peak currents and voltages are displayed.
Two transformer concepts suitable for the topology and
waveforms shown in Figs. 3-a) and b) where designed and
optimized with respect to power density and efficiency. Thetwo transformer concepts differ mainly in core material (fer-
rite and nanocrystalline) as well as in cooling concept (air-
cooled and water-cooled). Besides the considerations givenin Section II, in this case a detailed model of the cooling
system was included and therefore a numerical optimization
was required due to the higher complexity of the transformermodel 1.
A cross-sectional view of the first designed transformer is
shown in Fig. 3-c). This design comprises 20 ferrite N87 U-shaped cores as magnetic material and litz wire with 9500 ·71µm strand diameter where 3 parallel litz wires with two
turns each are utilized in the LV side winding whereas the
1A detailed description of the cooling system’s model and the proposedoptimization procedure will be matter of future publications
1287

b) d)
Ls is
uMV,AC uLV,AC
MV Bridge MF Trafo (20kHz) LV Bridge
2kV
400V
TS
t
uLV,AC
NMV=3 NLV=1
333V
400V
333V
400V
1000A peak (ZVS)
is QZCS/ZVS LV
QZCS/ZVS MV
uMV,AC´
a)
c)
f)
e)
20xN87U ferritecores
PTFEIsolation
9500 strands71[[ m]Litz wire
μ
Alum.air-cooledheat-sinks
Air channelfor litz wire
12x Unanocr.cores
Mica-tapeIsolation
9500 strands71[[ m]Litz wire
μ
Alum.water-cooledheat-sinks
Heat-conductingplates
Figure 3: Converter module and designed MF transformers: a) Module structure comprising 3-level NPC bridge on MV side, MFtransformer and LV full-bridge; b) Voltage and current waveforms on the MV transformer. The two optimized transformer concepts arebased on ferrite and nanocrystalline core materials. The winding arrangement and a CAD drawing of the ferrite-based air-cooled transformerare shown in c) and d) respectively. The respective winding window and CAD drawing for the nanocrystalline-based transformer areshown in e) and f) respectively.
MV side winding is built using 6 turns of the same litz wire.The isolation is provided by a PTFE bobbin and the complete
system is cooled by forced convection provided by two front
120mm fans, as shown in Fig. 3-d). In this case, calculatedcore and copper losses are 161W and 230W respectively.
The second constructed transformer is based on nanocrys-talline core material and its winding cross-sectional view
is shown in Fig. 3-e). This transformer utilizes the same
9500 · 71µm litz wire whereby two paralleled conductorswith 2 turns each are used on the LV side whereas a single
wire with 5 turns is utilized on the MV side. The isolation
in this case is based on mica tape as often used in electricalmachines. The cooling system is based on thermal conduc-
tion of heat from winding and core by means of aluminum
parts that are attached to two water-cooled heat sinks. Thecomplete arrangement of the transformer including cores and
cooling system is shown in Fig. 3-f). More details aboutthe construction of the cooling system will be presented in
the next section along with the experimental verification of
the calculated losses, which amount to 222W and 131Wrespectively for the core and copper losses respectively. In
addition, 20W were calculated for the cooling system by
means of FEM simulations.
Extensive measurements have been performed on these
two transformers in order to validate the proposed trans-former concepts as well as the calculated core and copper
losses. These measurements are outlined in detail in the next
section.
IV. EXPERIMENTAL VERIFICATION AND PRACTICAL
CONSIDERATIONS
The finally built MF transformers are shown in Figs. 4-a)
and b) for the ferrite and nanocrystalline-based transformers
respectively. In order to experimentally verify the calculatedvalues for core and copper losses, these transformers were
subject to extensive experimental testing. The focus is placed
on the nanocrystalline-based transformer since a verificationof the losses in the cooling system is required in this case.
A. Current Sharing in Litz Wire Bundles
The utilized litz wire is based on 10 bundles with 950 litz
each. The first test consists of measuring the current in eachof these bundles in the nanocrystalline-based transformer in
order to quantify the impact of the transformer’s size on
the current distribution in these bundles. In all cases thecurrent was fed from MV side with a short circuited LV side
winding, i.e. only the stray inductance of the transformer
limits the conducted current. Also the aluminium coolingsystem was removed in this case. On the MV side a current
of 25A RMS is fed and the current in each litz wire bundle ismeasured with a Rogowski coil while the total losses in the
winding are measured with a Yokogawa WT3000 precision
power analyzer.
For the first test, a termination of the litz wire whichensures same length on all litz wires was adopted. The litz
wire was delivered by the manufacturer with two middle not-
interchanged bundles (in red) surrounded by 8 bundles withinterchanged positions (in blue) as shown in Fig. 5-a). The
measured currents can also be seen in Fig. 5-a) together with
the schematic view of the litz/termination arrangement. Ascan be seen, non-interchanged bundles in the middle of the
litz wire result in negative circulating currents, increasing
the losses in the complete litz wire whereby the AC to DCresistance ratio is RAC/RDC = 3.01.
As a second test, the middle non-interchanged conductors
were disconnected while keeping the remaining 8 bundles.
1288

a)
b)
280 [mm]
167 [mm] 181 [mm]
240 [mm] 510 [mm]
140 [mm]
Figure 4: Final assembled 166 kW/20 kHz transformers: a)Ferrite-based air-cooled; b) Nanocrystalline-based water-cooled.
The current sharing in this case is considerably improved
as can be seen in Fig. 5-b) whereby the AC to DC re-
sistance ratio is reduced to RAC/RDC = 1.95, provingthe importance of a symmetrically built litz wire at this
frequency/dimensions range.For practical reasons, the connection of the litz wire to the
power-electronic switches is realized by spreading the litzwire bundles into copper plates which are later connected
to the power semiconductors. The impact of the asymmetry
introduced by this connection is shown in Fig. 5-c). Nosignificant rise in the AC to DC resistance ratio with respect
to the symmetric termination is observed. In this case, this
ratio has a value of to RAC/RDC = 1.98.In order to force the symmetrization of these currents, the
arrangement of common mode-chokes as shown in Fig. 5-
e) can be placed on the litz wire bundles, resulting in
considerably symmetric currents in each bundle as seen inFig . 5-d). In spite this symmetric current distribution the AC
to DC resistance ratio is RAC/RDC = 1.94, i.e. no consid-
erably improvement in losses was achieved (the losses in thecommon mode chokes were measured resulting in approx.
5mW and are therefore negligible in this measurement).With the winding losses experimentally measured, the total
losses including core and cooling system of the nanocrys-talline transformer presented in Fig. 4-b) will be now shown
in order to obtain the total share of losses in this component.
B. Core Losses
Given the paralleled cores utilized to build the magneticpath in the transformer, potential differences in the air-gaps
of each core-pair could cause asymmetries in the generated
0 75 125100 150 175 200
Curr
ent
[A]
-3
0
3
6
-6
5025Time [ s]μ
a)
Curr
ent
[A]
-3
0
3
6
-6
b)
Curr
ent
[A]
-3
0
3
6
-6
c)C
urr
ent
[A]
-3
0
3
6
-6
d)
Term.
Term.
Term.
Term.
Co
mm
om
M.
Ch
ok
es
12
3
45
6
7
8
9 10
12
3
45
6
7
8
12
3
45
6
7
8
12
3
45
6
7
8
1
2
3
4
5
6
7
8
1
2
3
4
5
6
7
8 e)
Figure 5: Analysis of current sharing litz wire bundles; a) Withmiddle non-interchanged bundles and symmetric termination; b)Without middle non-interchanged bundles and symmetric termina-tion; c) Without middle non-interchanged bundles and unsymmetrictermination; d) Without middle non-interchanged bundles, unsym-metric termination and equalizing common mode chokes (cf. Fig. 5-e); e) Arrangement of common mode chokes to equalize transformercurrents.
core losses in each paralleled core. In this case, without a
defined air gap, differences of up to 70% in core losses weredetected. By introducing an air gap of 0.1µm between the
core pairs, this difference was reduced achieving a decrease
of 12% in the total core losses, which are in this case 353W.The increased losses with respect to calculated values are
mainly explained by the un-modeled losses introduced bythe cut in tape wound cores [10, 11].
C. Losses in Cooling System
In order to quantify the losses in each part of the cooling
system, the increase in losses was measured and therefore the
1289

a) b)
c) d)
e) f)
g)
Copper losses : 346 [W]
Core losses : 380 [W]
Cooling system : 157 [W]
Cooling system
Core losses
Copper losses
Figure 6: Loss contribution of different transformer cooling parts:a) Pure winding losses; b) Internal cooling plates; c) Externalcooling plates; d) Internal heat conducting plates; e) Externalheat conducting plates; f) Top/bottom water-cooled plates; g) Totalcopper/core/cooling system loss sharing.
source for each of these losses was identified. The different
parts of the aluminium cooling system can be seen in Fig. 6
whereby the loss share of each part is:
• Winding, Fig. 6-a) (no cooling system): 353W• Internal cooling plates, Fig. 6-b): 56.97W• External cooling plates, Fig. 6-c): 18.82W• Internal heat conducting plates, Fig. 6-d): 34.28W• External heat conducting plates, Fig. 6-e): 44.30W• Top/bottom water-cooled plates, Fig. 6-f): 2.83W
The overall share of copper, core and cooling system losses
is presented in Fig. 6-g). The total losses in the coolingsystem are considerably higher than estimated with FEM
simulations (20W). This phenomena can be explained by
different stray field distribution in the winding window dueto the effect of the core material lamination and will be
analyzed in further publications.
V. CONCLUSIONS
An analytical expression for the optimum frequency whichensures best use of the available copper and core materials
was proposed. With this expression, the impact of various
design parameters was studied by means of Pareto frontanalysis, whereby a clear gain in power density and efficiency
is seen when the power of the unit is increased. Additionallythe gain in power density attainable with an active cooling
system was presented, leading to the two presented ferrite
and nanocrystalline-based MF transformers. These two trans-formers differ in cooling system design, and ultimately in
power density.
Experimental measurements were carried out in one ofthese designed transformers in order to quantify the effect
of different parasitic effects in the losses of the system. This
analysis confirms the requirement of precise and symmetricfabrication of litz wires and more detailed models which
describe the losses in tape wound cores. Furthermore, higher
losses in the water-cooling aluminium system designedfor the nanocrystalline-based transformer where measured,
which indicate the requirement of accurate models for the
description of magnetic field distribution in these aluminiumparts.
REFERENCES
[1] M. Pavlovsky, S. W. H. De Haan, and J. Ferreira, “Design for BetterThermal Management in High-Power High-Frequency Transformers,”in Industry Applications Conference, 2005, vol. 4, Oct. 2005, pp.2615–2621.
[2] S. Inoue and H. Akagi, “A Bi-Directional Isolated DC/DC converteras a core circuit of the Next-Generation Medium-Voltage PowerConversion System,” in Power Electronics Specialists Conference,2006, June 2006, pp. 1–7.
[3] J. Wang, A. Huang, W. Sung, Y. Liu, and B. Baliga, “Smart GridTechnologies,” Industrial Electronics Magazine, IEEE, vol. 3, no. 2,pp. 16–23, 2009.
[4] D. Dujic, F. Kieferndorf, and F. Canales, “Power Electronics Trans-former Technology For Traction Applications - An Overview,” PCIM2011, 2011.
[5] D. Dujic, A. Mester, and T. Chaudhuri, “Laboratory Scale Prototype ofa Power Electronic Transformer for Traction Applications,” EuropeanConference on Power Electronics and Applications, 2011, vol. 1, 2011.
[6] A. Steimel, “Power-electronic Grid Supply of AC Railway Systems,”in Optimization of Electrical and Electronic Equipment (OPTIM),2012, May 2012, pp. 16–25.
[7] C. Sullivan, “Optimal Choice for Number of Strands in a Litz-WireTransformer Winding,” in Power Electronics Specialists Conference,1997, vol. 1, 1997, pp. 28–35 vol.1.
[8] G. Ortiz, J. Biela, D. Bortis, and J. W. Kolar, “1 Megawatt, 20kHz, Isolated, Bidirectional 12kV to 1.2 kV DC-DC Converter forRenewable Energy Applications,” in IPEC 2010. IEEE, 2010, pp.3212–3219.
[9] G. Ortiz, H. Uemura, D. Bortis, J. Kolar, and O. Apeldoorn, “Modelingof Soft-Switching Losses of IGBTs in High-Power High-EfficiencyDual-Active-Bridge DC/DC converters,” IEEE Transactions on Elec-tron Devices, vol. 60, no. 2, pp. 587–597, Feb. 2012.
[10] B. Cougo, A. Tuysu¨z, J. Muhlethaler, and J. Kolar, “Increase ofTape Wound Core Losses due to Interlamination Short Circuits andOrthogonal Flux Components,” in IECON 2011, Nov. 2011, pp. 1372–1377.
[11] B. Cougo and J. Kolar, “Integration of Leakage Inductance in TapeWound Core Transformers for Dual Active Bridge Converters,” inInternational Conference on Integrated Power Electronics Systems(CIPS), 2012, March 2012, pp. 1–6.
1290