Embed Size (px)
Citation preview
Stronger evidence, better decisions, improved health and welfare
Medicines for cardiovascular disease
© Australian Institute of Health and Welfare 2017 This product, excluding the AIHW logo, Commonwealth Coat of Arms and any material owned by a third party or protected by a trademark, has been released under a Creative Commons BY 3.0 (CC BY 3.0) licence. Excluded material owned by third parties may include, for example, design and layout, images obtained under licence from third parties and signatures. We have made all reasonable efforts to identify and label material owned by third parties.You may distribute, remix and build upon this work. However, you must attribute the AIHW as the copyright holder of the work in compliance with our attribution policy available at <www.aihw.gov.au/copyright/>. The full terms and conditions of this licence are available at <http://creativecommons.org/licenses/by/3.0/au/>.A complete list of the Institute’s publications is available from the Institute’s website <www.aihw.gov.au>.
ISBN 978-1-76054-264-1 (PDF)ISBN 978-1-76054-265-8 (Print)
Suggested citationAustralian Institute of Health and Welfare 2017. Medicines for cardiovascular disease. Cat. no. CVD 80. Canberra: AIHW.
Australian Institute of Health and WelfareBoard Chair DirectorMrs Louise Markus Mr Barry Sandison
Any enquiries relating to copyright or comments on this publication should be directed to: Website and Publishing Unit Australian Institute of Health and Welfare GPO Box 570 Canberra ACT 2601 Tel: (02) 6244 1000 Email: [email protected]
Published by the Australian Institute of Health and Welfare.
The Australian Institute of Health and Welfare is a major national agency whose purpose is to create authoritative and accessible information and statistics that inform decisions and
improve the health and welfare of all Australians.
Please note that there is the potential for minor revisions of data in this report. Please check the online version at <www.aihw.gov.au> for any amendments.
Medicines for cardiovascular disease iii
ContentsAcknowledgments . . . . . . . . . . . . . . . . . . . . . . . . . . . . . . . . . . . . . . . . . . . . . . . . . . . . . . . . . . .iv
Abbreviations . . . . . . . . . . . . . . . . . . . . . . . . . . . . . . . . . . . . . . . . . . . . . . . . . . . . . . . . . . . . . . .iv
Summary . . . . . . . . . . . . . . . . . . . . . . . . . . . . . . . . . . . . . . . . . . . . . . . . . . . . . . . . . . . . . . . . . . . v
1 Introduction . . . . . . . . . . . . . . . . . . . . . . . . . . . . . . . . . . . . . . . . . . . . . . . . . . . . . . . . . . . . . . 1
2 Supply of cardiovascular medicines . . . . . . . . . . . . . . . . . . . . . . . . . . . . . . . . . . . . . . . . . 4
3 GP prescriptions for cardiovascular medicines . . . . . . . . . . . . . . . . . . . . . . . . . . . . . . . 10
4 Use of cardiovascular medicines . . . . . . . . . . . . . . . . . . . . . . . . . . . . . . . . . . . . . . . . . . . 12
5 Expenditure on cardiovascular medicines . . . . . . . . . . . . . . . . . . . . . . . . . . . . . . . . . . . 16
Appendix . . . . . . . . . . . . . . . . . . . . . . . . . . . . . . . . . . . . . . . . . . . . . . . . . . . . . . . . . . . . . . . . . . 18
Methods . . . . . . . . . . . . . . . . . . . . . . . . . . . . . . . . . . . . . . . . . . . . . . . . . . . . . . . . . . . . . . . . 18
Data sources . . . . . . . . . . . . . . . . . . . . . . . . . . . . . . . . . . . . . . . . . . . . . . . . . . . . . . . . . . . . 19
Statistical tables . . . . . . . . . . . . . . . . . . . . . . . . . . . . . . . . . . . . . . . . . . . . . . . . . . . . . . . . . 21
References . . . . . . . . . . . . . . . . . . . . . . . . . . . . . . . . . . . . . . . . . . . . . . . . . . . . . . . . . . . . . . . . 27
List of tables . . . . . . . . . . . . . . . . . . . . . . . . . . . . . . . . . . . . . . . . . . . . . . . . . . . . . . . . . . . . . . . 28
List of figures . . . . . . . . . . . . . . . . . . . . . . . . . . . . . . . . . . . . . . . . . . . . . . . . . . . . . . . . . . . . . . 29
List of boxes . . . . . . . . . . . . . . . . . . . . . . . . . . . . . . . . . . . . . . . . . . . . . . . . . . . . . . . . . . . . . . . 29
Medicines for cardiovascular diseaseiv
AcknowledgmentsThe authors of this report are Michael de Looper, Faith Ng and Chun Oberst of the Cardiovascular, Diabetes and Kidney Unit at the Australian Institute of Health and Welfare.
Valuable guidance and advice was provided by Sushma Mathur, Lynelle Moon, Peter Marlton, Jeanette Tyas and the Cardiovascular Disease Expert Advisory Group whose members are Andrew Tonkin (Chair), Tom Briffa, Derek Chew, Annette Dobson, Mark Nelson and Mandy Thrift.
This project was funded by the Department of Health.
AbbreviationsABS Australian Bureau of Statistics
ACE angiotensin-converting enzyme
AIHW Australian Institute of Health and Welfare
ATC Anatomic Therapeutic Chemical
BEACH Bettering the Evaluation and Care of Health program
DDD defined daily dose
GP general practitioner
PBS Pharmaceutical Benefits Scheme
RPBS Repatriation Pharmaceutical Benefits Scheme
Medicines for cardiovascular disease v
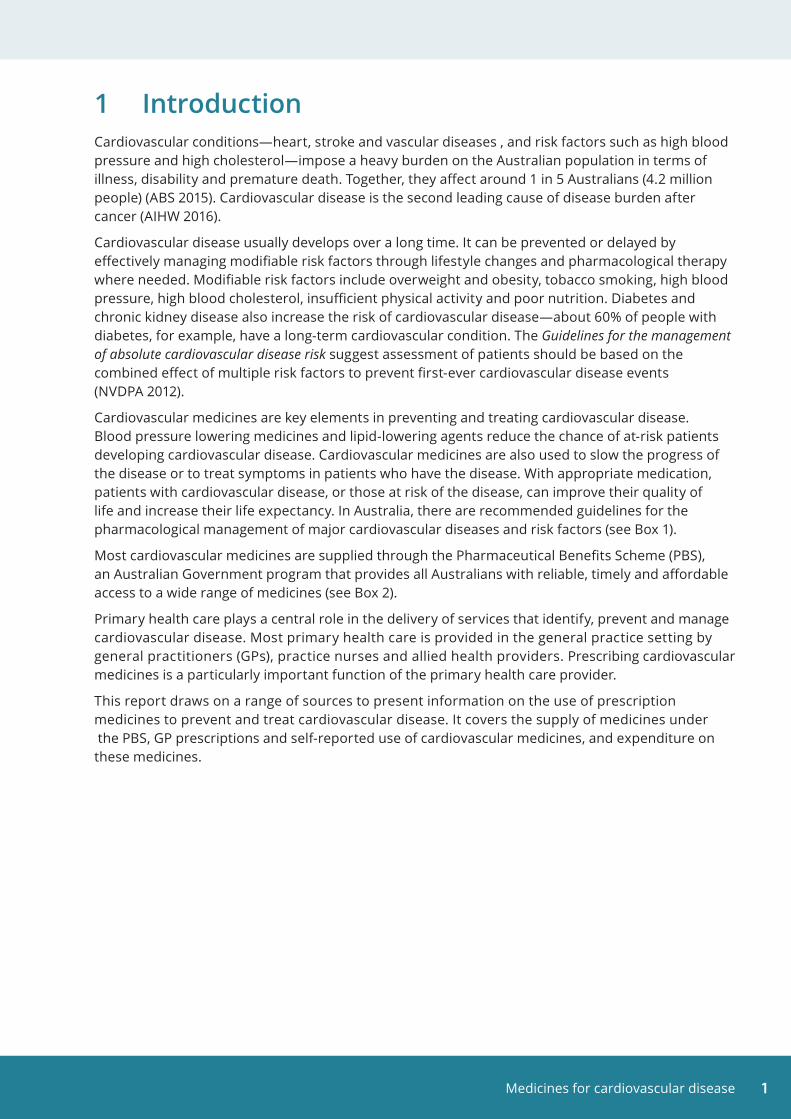
SummaryCardiovascular medicines are key elements in preventing and treating cardiovascular disease. The findings in this report, using data on supply, and general practitioner (GP) prescriptions and use, highlight that cardiovascular medicines are most commonly used to help control levels of blood pressure and blood lipids, such as cholesterol.
Other key findings include those described here:
• Over 100 million Pharmaceutical Benefits Scheme/Repatriation Pharmaceutical Benefits Scheme prescriptions for cardiovascular medicines were dispensed to the Australian community in 2015. These comprised one-third (34%) of the total prescription medicines dispensed.
• Blood pressure lowering medicines (such as perindopril and irbesartan) and blood cholesterol lowering medicines (such as atorvastatin and rosuvastatin) were the most commonly dispensed prescription medicines in Australia in 2015. This pattern was also observed for GP prescription data and medicine use among people with a cardiovascular condition.
• The dispensing of prescription lipid-modifying agents increased by 66% between 2005 and 2015, while calcium channel blockers and renin-angiotensin system agents—both blood pressure lowering agents—increased by 38 and 41%, and antithrombotic medicines by 24%.
• Almost 1 in 5 (18%) of all medications prescribed by GPs in 2015–16 were for the cardiovascular system. Cardiovascular medicines were prescribed at a rate of 9.4 per 100 problems managed. Many of these prescriptions included orders for repeats.
• Almost three-quarters (72%) of the estimated 4.1 million Australians who reported having a cardiovascular condition in 2014–15 had used a cardiovascular system medicine in the previous fortnight.
• Two-thirds (66%) of a study population of concessional beneficiaries aged 65 and over used more than one class of cardiovascular medicine to manage their health condition(s) in 2014–15. One-quarter (23%) received blood pressure lowering, lipid-modifying and antithrombotic medicines.
• Expenditure on cardiovascular medicines was $1.84 billion in 2015–16, with government expenditure comprising 76% of the total.
• Expenditure on cardiovascular system medicines fell by one-third (31%) between 2005–06 and 2015–16, driven by falls in the costs of high-volume medicines such as atorvastatin and rosuvastatin.

Medicines for cardiovascular diseasevi
Medicines for cardiovascular disease 1
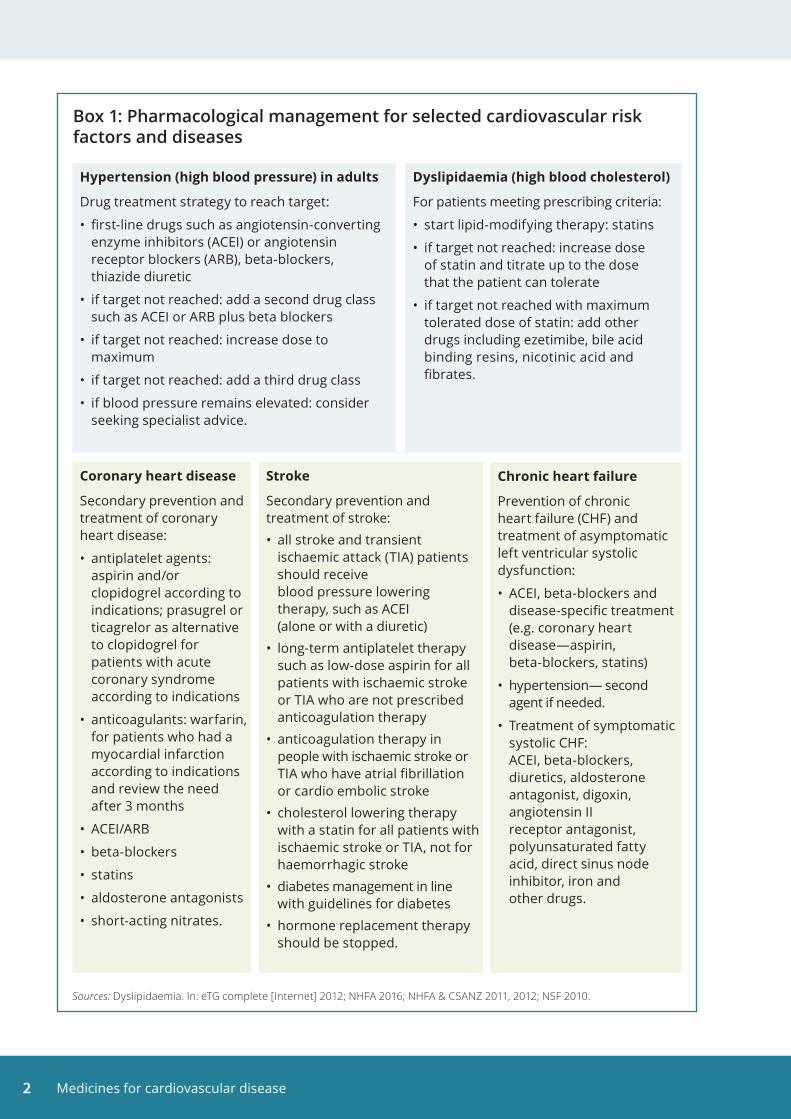
1 Introduction Cardiovascular conditions—heart, stroke and vascular diseases , and risk factors such as high blood pressure and high cholesterol—impose a heavy burden on the Australian population in terms of illness, disability and premature death. Together, they affect around 1 in 5 Australians (4.2 million people) (ABS 2015). Cardiovascular disease is the second leading cause of disease burden after cancer (AIHW 2016).
Cardiovascular disease usually develops over a long time. It can be prevented or delayed by effectively managing modifiable risk factors through lifestyle changes and pharmacological therapy where needed. Modifiable risk factors include overweight and obesity, tobacco smoking, high blood pressure, high blood cholesterol, insufficient physical activity and poor nutrition. Diabetes and chronic kidney disease also increase the risk of cardiovascular disease—about 60% of people with diabetes, for example, have a long-term cardiovascular condition. The Guidelines for the management of absolute cardiovascular disease risk suggest assessment of patients should be based on the combined effect of multiple risk factors to prevent first-ever cardiovascular disease events (NVDPA 2012).
Cardiovascular medicines are key elements in preventing and treating cardiovascular disease. Blood pressure lowering medicines and lipid-lowering agents reduce the chance of at-risk patients developing cardiovascular disease. Cardiovascular medicines are also used to slow the progress of the disease or to treat symptoms in patients who have the disease. With appropriate medication, patients with cardiovascular disease, or those at risk of the disease, can improve their quality of life and increase their life expectancy. In Australia, there are recommended guidelines for the pharmacological management of major cardiovascular diseases and risk factors (see Box 1).
Most cardiovascular medicines are supplied through the Pharmaceutical Benefits Scheme (PBS), an Australian Government program that provides all Australians with reliable, timely and affordable access to a wide range of medicines (see Box 2).
Primary health care plays a central role in the delivery of services that identify, prevent and manage cardiovascular disease. Most primary health care is provided in the general practice setting by general practitioners (GPs), practice nurses and allied health providers. Prescribing cardiovascular medicines is a particularly important function of the primary health care provider.
This report draws on a range of sources to present information on the use of prescription medicines to prevent and treat cardiovascular disease. It covers the supply of medicines under the PBS, GP prescriptions and self-reported use of cardiovascular medicines, and expenditure on these medicines.
Medicines for cardiovascular disease2
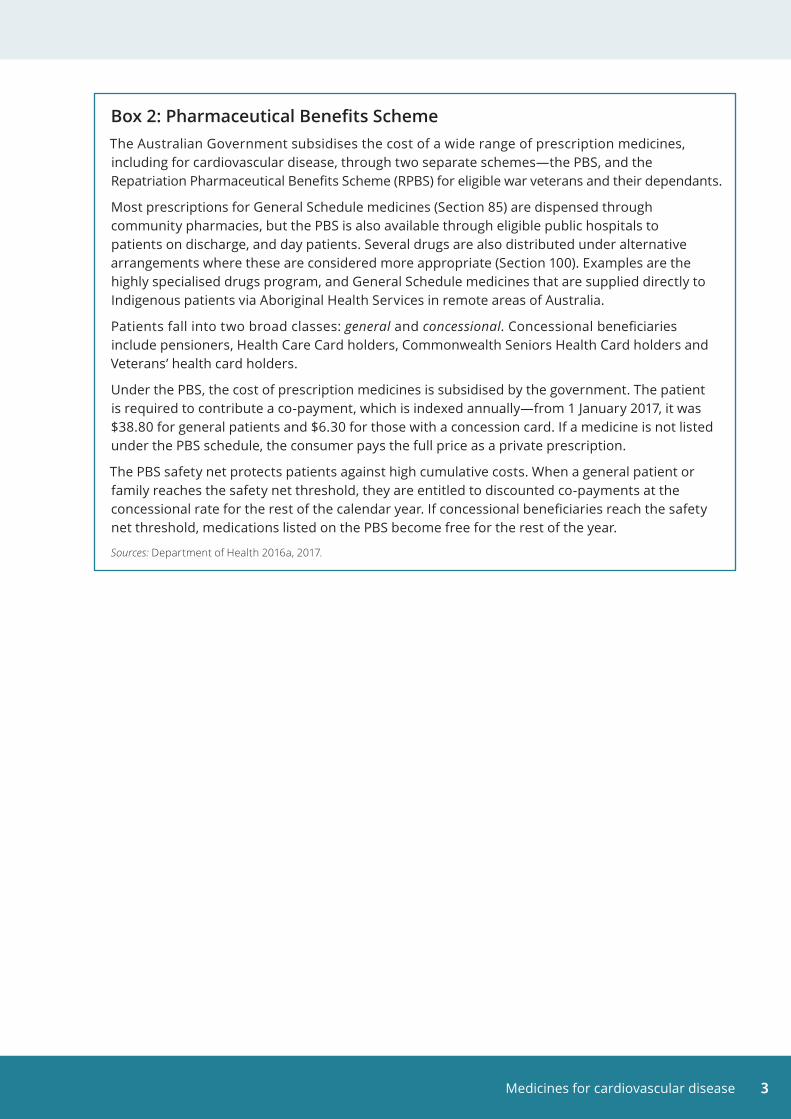
Box 1: Pharmacological management for selected cardiovascular risk factors and diseases
Hypertension (high blood pressure) in adults
Drug treatment strategy to reach target:
• first-line drugs such as angiotensin-converting enzyme inhibitors (ACEI) or angiotensin receptor blockers (ARB), beta-blockers, thiazide diuretic
• if target not reached: add a second drug class such as ACEI or ARB plus beta blockers
• if target not reached: increase dose to maximum
• if target not reached: add a third drug class
• if blood pressure remains elevated: consider seeking specialist advice.
Coronary heart disease
Secondary prevention and treatment of coronary heart disease:
• antiplatelet agents: aspirin and/or clopidogrel according to indications; prasugrel or ticagrelor as alternative to clopidogrel for patients with acute coronary syndrome according to indications
• anticoagulants: warfarin, for patients who had a myocardial infarction according to indications and review the need after 3 months
• ACEI/ARB
• beta-blockers
• statins
• aldosterone antagonists
• short-acting nitrates.
Chronic heart failure
Prevention of chronic heart failure (CHF) and treatment of asymptomatic left ventricular systolic dysfunction:
• ACEI, beta-blockers and disease-specific treatment (e.g. coronary heart disease—aspirin, beta-blockers, statins)
• hypertension— second agent if needed.
• Treatment of symptomatic systolic CHF: ACEI, beta-blockers, diuretics, aldosterone antagonist, digoxin, angiotensin II receptor antagonist, polyunsaturated fatty acid, direct sinus node inhibitor, iron and other drugs.
Stroke
Secondary prevention and treatment of stroke:• all stroke and transient
ischaemic attack (TIA) patients should receive blood pressure lowering therapy, such as ACEI (alone or with a diuretic)
• long-term antiplatelet therapy such as low-dose aspirin for all patients with ischaemic stroke or TIA who are not prescribed anticoagulation therapy
• anticoagulation therapy in people with ischaemic stroke or TIA who have atrial fibrillation or cardio embolic stroke
• cholesterol lowering therapy with a statin for all patients with ischaemic stroke or TIA, not for haemorrhagic stroke
• diabetes management in line with guidelines for diabetes
• hormone replacement therapy should be stopped.
Dyslipidaemia (high blood cholesterol)
For patients meeting prescribing criteria:
• start lipid-modifying therapy: statins
• if target not reached: increase dose of statin and titrate up to the dose that the patient can tolerate
• if target not reached with maximum tolerated dose of statin: add other drugs including ezetimibe, bile acid binding resins, nicotinic acid and fibrates.
Sources: Dyslipidaemia. In: eTG complete [Internet] 2012; NHFA 2016; NHFA & CSANZ 2011, 2012; NSF 2010.
Medicines for cardiovascular disease 3
Box 2: Pharmaceutical Benefits SchemeThe Australian Government subsidises the cost of a wide range of prescription medicines, including for cardiovascular disease, through two separate schemes—the PBS, and the Repatriation Pharmaceutical Benefits Scheme (RPBS) for eligible war veterans and their dependants.
Most prescriptions for General Schedule medicines (Section 85) are dispensed through community pharmacies, but the PBS is also available through eligible public hospitals to patients on discharge, and day patients. Several drugs are also distributed under alternative arrangements where these are considered more appropriate (Section 100). Examples are the highly specialised drugs program, and General Schedule medicines that are supplied directly to Indigenous patients via Aboriginal Health Services in remote areas of Australia.
Patients fall into two broad classes: general and concessional. Concessional beneficiaries include pensioners, Health Care Card holders, Commonwealth Seniors Health Card holders and Veterans’ health card holders.
Under the PBS, the cost of prescription medicines is subsidised by the government. The patient is required to contribute a co-payment, which is indexed annually—from 1 January 2017, it was $38.80 for general patients and $6.30 for those with a concession card. If a medicine is not listed under the PBS schedule, the consumer pays the full price as a private prescription.
The PBS safety net protects patients against high cumulative costs. When a general patient or family reaches the safety net threshold, they are entitled to discounted co-payments at the concessional rate for the rest of the calendar year. If concessional beneficiaries reach the safety net threshold, medications listed on the PBS become free for the rest of the year.
Sources: Department of Health 2016a, 2017.
Medicines for cardiovascular disease4
2 Supply of cardiovascular medicinesA wide range of cardiovascular medicines are made available to the Australian community through the PBS.
This section provides information on the types of cardiovascular medicines, the number of medicines dispensed, and the rate of medicine use measured by the defined daily dose (DDD) unit (see Box 3). The counts include both government-subsidised and non-subsidised (that is, under co-payment) medicines listed on the PBS, and include medicines supplied under sections 85 and 100 and through the RPBS. Over-the-counter medicines, private prescriptions and medicines prescribed to in-patients in public hospitals are not included.
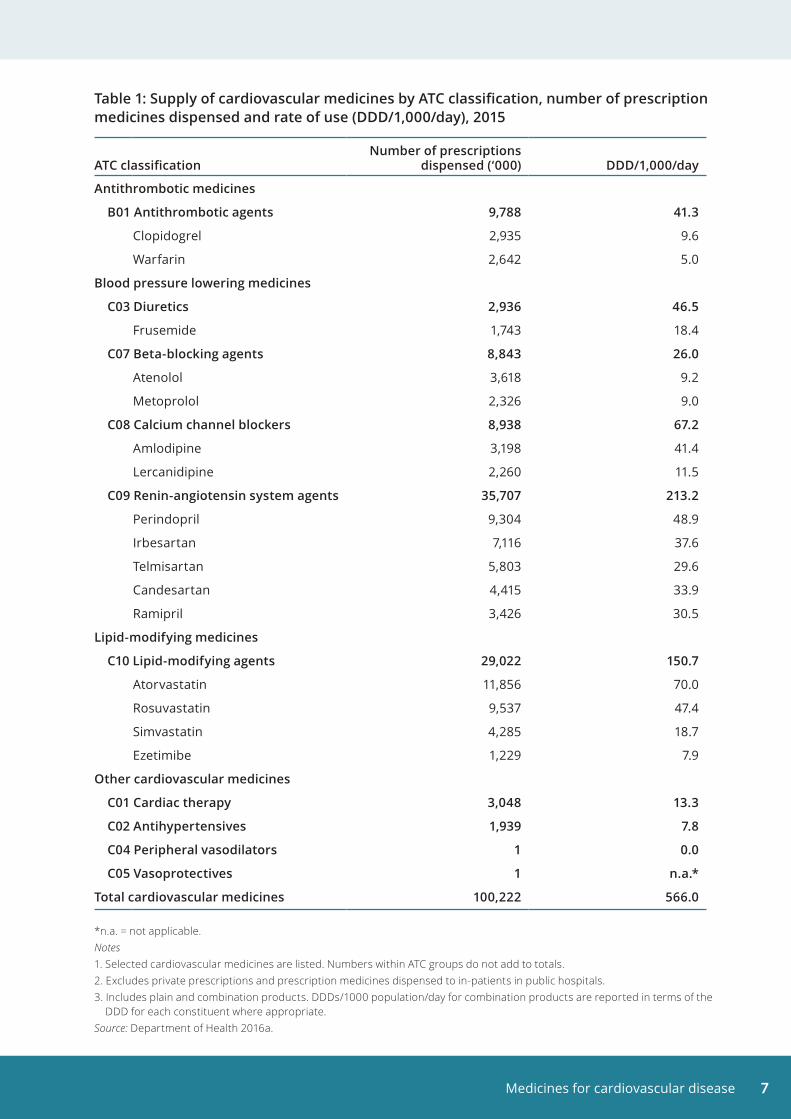
In 2015, over 100 million cardiovascular system medicines were dispensed to the community (Table 1). These comprised one-third (34%) of the total 297 million prescription medicines dispensed. Three (3) in 4 (75% or 75 million) dispensed medicines in Anatomical Therapeutic Chemical (ATC) class C were subsidised by the PBS/RPBS (Appendix Table A1).
Box 3: ATC classification and DDD measurement unitMedicines have been grouped using the ATC classification of medicines. In this report, cardiovascular medicines include medicines from ATC groups C—Cardiovascular system, and B01—Antithrombotic agents.
The rate of medicine use is expressed as the defined daily dose (DDD/1,000 population/day). The DDD is a statistical measure that allows medicines to be compared, regardless of differences in price, preparation and quantity per prescription.
Some preparations have multiple active ingredients. The DDD for combination products is reported in terms of the DDD for each constituent where appropriate.
See Appendix for further information on the ATC classification and the DDD measure.
Antithrombotic medicinesAntithrombotic medicines prevent blood clots forming or dissolve existing blood clots. These medicines help to reduce the risk of heart attack among people with coronary heart disease. They also reduce the risk of further strokes among patients with a history of ischaemic stroke.
In 2015, antithrombotic medicines were prescribed at a rate of 41.3 DDD per 1,000 population per day, increasing from 33.4 in 2005 (Figure 1).
This rate includes prescribed aspirin, which is used to treat cardiovascular conditions because it has antithrombotic effects. Aspirin bought over-the-counter is not included in this rate.
Other commonly prescribed antithrombotic medicines include anticoagulants such as warfarin, rivaroxaban and apixaban, and antiplatelet agents such as clopidogrel, prasugrel, ticagrelor and cangrelor.
Blood pressure lowering medicinesBlood pressure lowering medicines are used to treat high blood pressure. They have been shown to substantially reduce the number of deaths from heart attacks and stroke (Cutler et al. 2007). Combinations of blood pressure lowering drugs are often used, because this increases their effectiveness and allows lower doses of each drug to be used, reducing side effects.
Medicines for cardiovascular disease 5
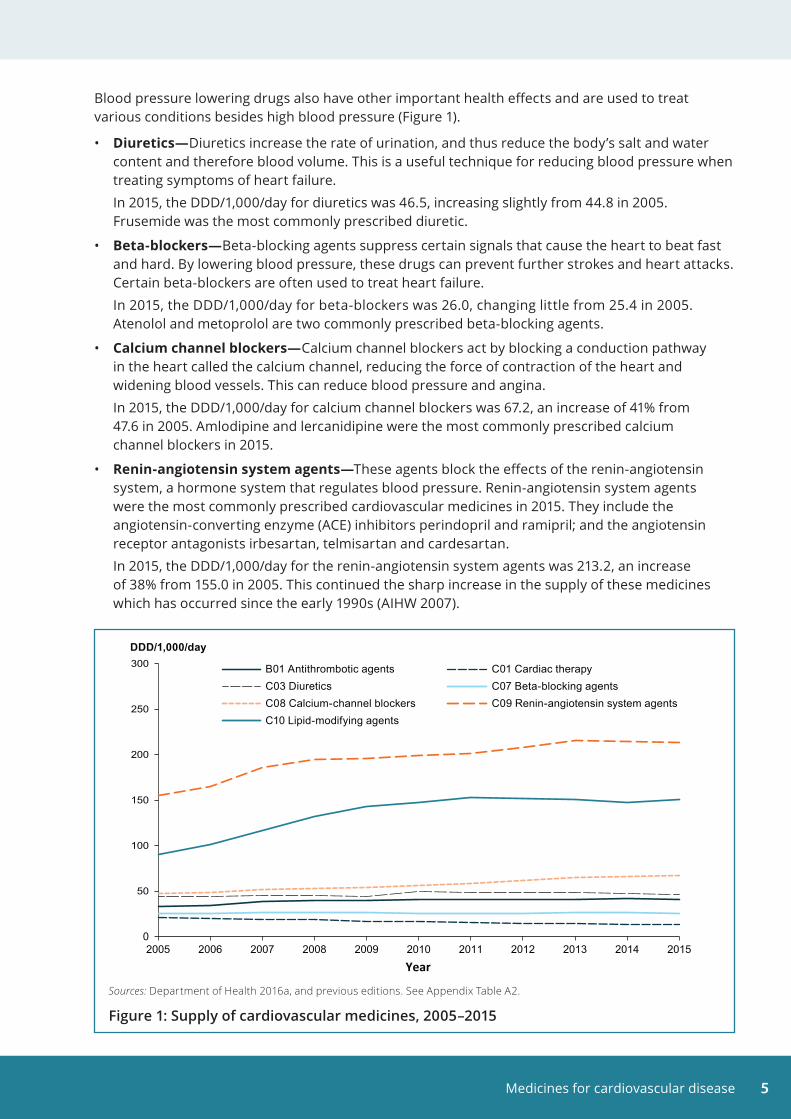
Blood pressure lowering drugs also have other important health effects and are used to treat various conditions besides high blood pressure (Figure 1).
• Diuretics—Diuretics increase the rate of urination, and thus reduce the body’s salt and water content and therefore blood volume. This is a useful technique for reducing blood pressure when treating symptoms of heart failure.
In 2015, the DDD/1,000/day for diuretics was 46.5, increasing slightly from 44.8 in 2005. Frusemide was the most commonly prescribed diuretic.
• Beta-blockers—Beta-blocking agents suppress certain signals that cause the heart to beat fast and hard. By lowering blood pressure, these drugs can prevent further strokes and heart attacks. Certain beta-blockers are often used to treat heart failure.
In 2015, the DDD/1,000/day for beta-blockers was 26.0, changing little from 25.4 in 2005. Atenolol and metoprolol are two commonly prescribed beta-blocking agents.
• Calcium channel blockers—Calcium channel blockers act by blocking a conduction pathway in the heart called the calcium channel, reducing the force of contraction of the heart and widening blood vessels. This can reduce blood pressure and angina.
In 2015, the DDD/1,000/day for calcium channel blockers was 67.2, an increase of 41% from 47.6 in 2005. Amlodipine and lercanidipine were the most commonly prescribed calcium channel blockers in 2015.
• Renin-angiotensin system agents—These agents block the effects of the renin-angiotensin system, a hormone system that regulates blood pressure. Renin-angiotensin system agents were the most commonly prescribed cardiovascular medicines in 2015. They include the angiotensin-converting enzyme (ACE) inhibitors perindopril and ramipril; and the angiotensin receptor antagonists irbesartan, telmisartan and cardesartan.
In 2015, the DDD/1,000/day for the renin-angiotensin system agents was 213.2, an increase of 38% from 155.0 in 2005. This continued the sharp increase in the supply of these medicines which has occurred since the early 1990s (AIHW 2007).
0
50
100
150
200
250
300
2005 2006 2007 2008 2009 2010 2011 2012 2013 2014 2015
DDD/1,000/day
Year
B01 Antithrombotic agents C01 Cardiac therapyC03 Diuretics C07 Beta-blocking agentsC08 Calcium-channel blockers C09 Renin-angiotensin system agentsC10 Lipid-modifying agents
Sources: Department of Health 2016a, and previous editions. See Appendix Table A2.
Figure 1: Supply of cardiovascular medicines, 2005–2015
Medicines for cardiovascular disease6
Lipid-modifying medicinesLipid-modifying medicines control blood cholesterol levels. They are effective in preventing heart attacks and reducing coronary heart disease deaths.
HMG CoA reductase inhibitors (also known as statins), resin binders, nicotinic acid, fibrates and probucol reduce blood LDL cholesterol (‘bad’ cholesterol) and possibly increase HDL cholesterol (‘good’ cholesterol) to varying degrees, with statins being the most effective. They also have varying effects in lowering blood triglycerides. Statins—atorvastatin, rosuvastatin and simvastatin—are the most commonly prescribed lipid-modifying medicines.
In 2015, the DDD/1,000/day for the lipid-modifying agents was 150.7, a 66% increase from 90.7 in 2005 (Figure 1). Use of statins rose by 61% during the period, from 87.0 to 139.7 DDD/1,000/day. Most of this increase occurred between 2005 and 2009, continuing the rise in their use that began in the 1990s (AIHW 2007).
Other cardiovascular system medicines• Cardiac therapy is a therapeutic subgroup of the ATC classification system. The subgroup includes
cardiac glycosides, antiarrhythmics and cardiac stimulants, which are used to regulate the rhythms of the heart. They may also be used to treat angina and heart failure. The subgroup also includes vasodilators, which open the main blood vessels of the body, as well as other cardiac preparations used in treating coronary heart disease. In 2015, the DDD/1,000/day for cardiac therapy medicines was 13.3, a 39% decrease from 21.8 in 2005 (Figure 1).
• Antihypertensives suppress signals to the heart that make it beat harder, or open and relax peripheral arteries. These have largely been replaced by newer medicines to control blood pressure. In 2015, the DDD/1,000/day for antihypertensives was 7.8, a 60% increase from 4.9 in 2005.
• Peripheral vasodilators open blood vessels in outer parts of the body, such as the arms and legs, making it easier for the heart to pump blood and lowering blood pressure. There were around 1,000 PBS medicines dispensed for peripheral vasodilators in 2015.
• Vasoprotectives act to relieve certain conditions of the blood vessels, such as haemorrhoids and varicose veins. There were around 1,000 PBS medicines dispensed for vasoprotectives in 2015.
Medicines for cardiovascular disease 7
Table 1: Supply of cardiovascular medicines by ATC classification, number of prescription medicines dispensed and rate of use (DDD/1,000/day), 2015
ATC classificationNumber of prescriptions
dispensed (‘000) DDD/1,000/day
Antithrombotic medicines
B01 Antithrombotic agents 9,788 41 .3
Clopidogrel 2,935 9.6
Warfarin 2,642 5.0
Blood pressure lowering medicines
C03 Diuretics 2,936 46 .5
Frusemide 1,743 18.4
C07 Beta-blocking agents 8,843 26 .0
Atenolol 3,618 9.2
Metoprolol 2,326 9.0
C08 Calcium channel blockers 8,938 67 .2
Amlodipine 3,198 41.4
Lercanidipine 2,260 11.5
C09 Renin-angiotensin system agents 35,707 213 .2
Perindopril 9,304 48.9
Irbesartan 7,116 37.6
Telmisartan 5,803 29.6
Candesartan 4,415 33.9
Ramipril 3,426 30.5
Lipid-modifying medicines
C10 Lipid-modifying agents 29,022 150 .7
Atorvastatin 11,856 70.0
Rosuvastatin 9,537 47.4
Simvastatin 4,285 18.7
Ezetimibe 1,229 7.9
Other cardiovascular medicines
C01 Cardiac therapy 3,048 13 .3
C02 Antihypertensives 1,939 7 .8
C04 Peripheral vasodilators 1 0 .0
C05 Vasoprotectives 1 n .a .*
Total cardiovascular medicines 100,222 566 .0
*n.a. = not applicable.Notes 1. Selected cardiovascular medicines are listed. Numbers within ATC groups do not add to totals. 2. Excludes private prescriptions and prescription medicines dispensed to in-patients in public hospitals.3. Includes plain and combination products. DDDs/1000 population/day for combination products are reported in terms of the DDD for each constituent where appropriate.Source: Department of Health 2016a.
Medicines for cardiovascular disease8
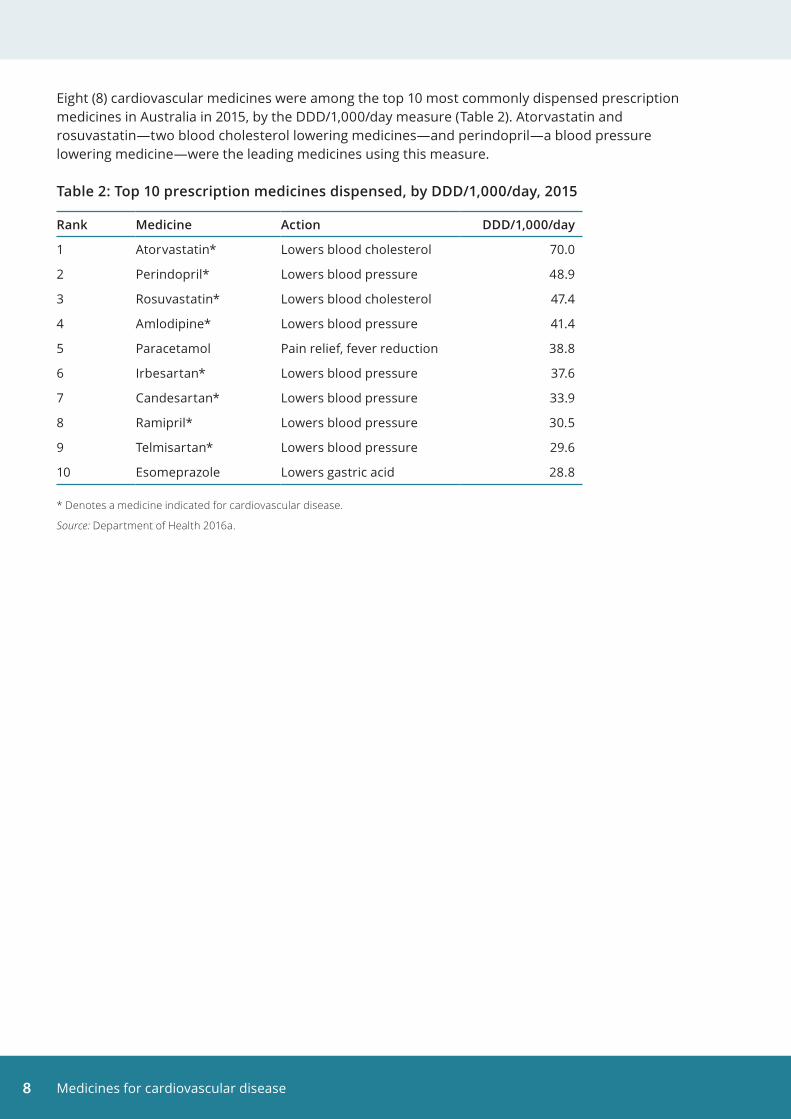
Eight (8) cardiovascular medicines were among the top 10 most commonly dispensed prescription medicines in Australia in 2015, by the DDD/1,000/day measure (Table 2). Atorvastatin and rosuvastatin—two blood cholesterol lowering medicines—and perindopril—a blood pressure lowering medicine—were the leading medicines using this measure.
Table 2: Top 10 prescription medicines dispensed, by DDD/1,000/day, 2015
Rank Medicine Action DDD/1,000/day
1 Atorvastatin* Lowers blood cholesterol 70.0
2 Perindopril* Lowers blood pressure 48.9
3 Rosuvastatin* Lowers blood cholesterol 47.4
4 Amlodipine* Lowers blood pressure 41.4
5 Paracetamol Pain relief, fever reduction 38.8
6 Irbesartan* Lowers blood pressure 37.6
7 Candesartan* Lowers blood pressure 33.9
8 Ramipril* Lowers blood pressure 30.5
9 Telmisartan* Lowers blood pressure 29.6
10 Esomeprazole Lowers gastric acid 28.8
* Denotes a medicine indicated for cardiovascular disease.
Source: Department of Health 2016a.
Medicines for cardiovascular disease 9
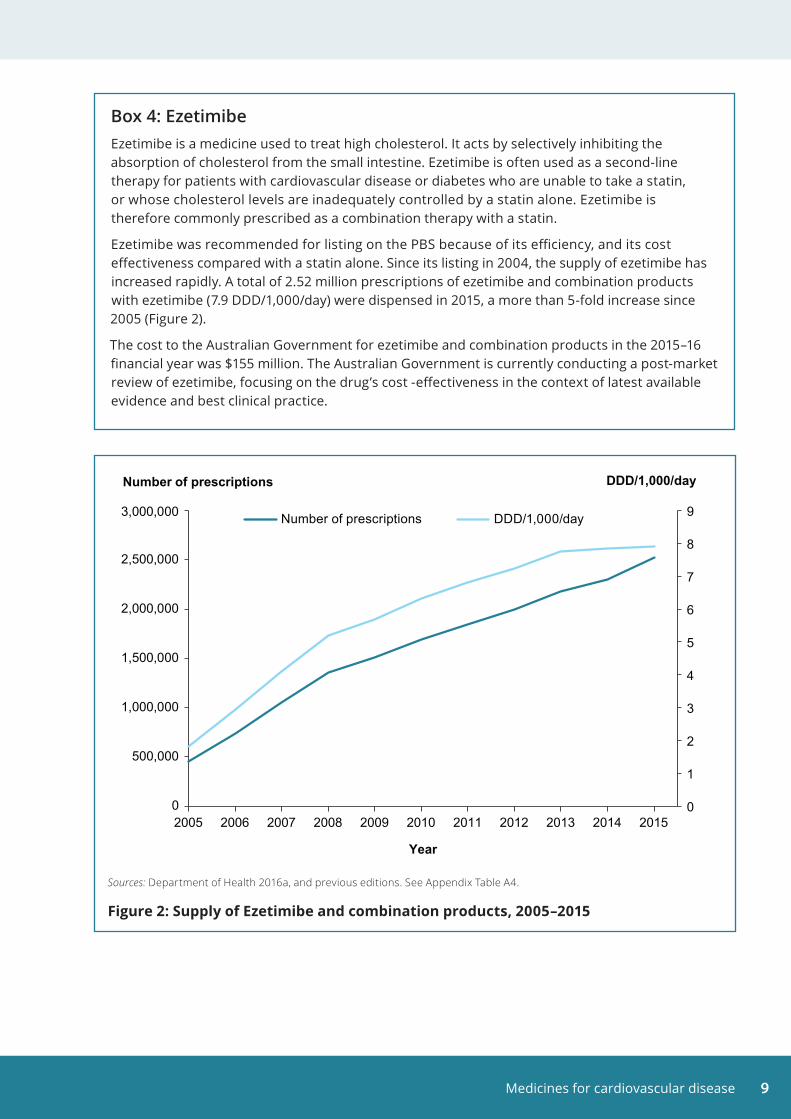
Box 4: EzetimibeEzetimibe is a medicine used to treat high cholesterol. It acts by selectively inhibiting the absorption of cholesterol from the small intestine. Ezetimibe is often used as a second-line therapy for patients with cardiovascular disease or diabetes who are unable to take a statin, or whose cholesterol levels are inadequately controlled by a statin alone. Ezetimibe is therefore commonly prescribed as a combination therapy with a statin.
Ezetimibe was recommended for listing on the PBS because of its efficiency, and its cost effectiveness compared with a statin alone. Since its listing in 2004, the supply of ezetimibe has increased rapidly. A total of 2.52 million prescriptions of ezetimibe and combination products with ezetimibe (7.9 DDD/1,000/day) were dispensed in 2015, a more than 5-fold increase since 2005 (Figure 2).
The cost to the Australian Government for ezetimibe and combination products in the 2015–16 financial year was $155 million. The Australian Government is currently conducting a post-market review of ezetimibe, focusing on the drug’s cost -effectiveness in the context of latest available evidence and best clinical practice.
Sources: Department of Health 2016a, and previous editions. See Appendix Table A4.
Figure 2: Supply of Ezetimibe and combination products, 2005–2015
0
1
2
3
4
5
6
7
8
9
0
500,000
1,000,000
1,500,000
2,000,000
2,500,000
3,000,000
2005 2006 2007 2008 2009 2010 2011 2012 2013 2014 2015
DDD/1,000/day
Year
Number of prescriptions DDD/1,000/day
Number of prescriptions
Medicines for cardiovascular disease10
3 GP prescriptions for cardiovascular medicinesCardiovascular medicines supplied through the PBS are most commonly prescribed by doctors. Approved dentists, optometrists, midwives and nurse practitioners can also prescribe PBS medicines.
Estimates of cardiovascular system medicines prescribed in general practice can be sourced from the surveys of the Bettering the Evaluation and Care of Health (BEACH) program (Britt et al. 2016). The BEACH program collected information from participating GPs on the health problems they managed in their practice and the medicines they either prescribed, advised patients to buy over the counter, or supplied directly to patients (see Appendix).
In 2015–16, an estimated 10% of all problems managed by GPs were those related to the cardiovascular system, with half of these due to hypertension.
Almost 1 in 5 (18%) of all medications prescribed by GPs were for the cardiovascular system. Cardiovascular medicines were prescribed at a rate of 9.4 per 100 problems managed. In line with statistics on supply:
• blood pressure lowering medicines were the most commonly prescribed cardiovascular system medicines (two-thirds of cardiovascular system medicines and 11% of all medicines). Perindopril and irbesartan were the two most commonly prescribed blood pressure lowering medicines, at a rate of 0.7 and 0.4 per 100 problems managed, respectively
• lipid-modifying medicines comprised one-quarter of prescribed cardiovascular system medicines, and 4.2% of all prescribed medications, at a rate of 2.2 per 100 problems managed. Atorvastatin and rosuvastatin were the two most commonly prescribed lipid-modifying medicines, both at a rate of 0.9 per 100 problems managed
• antithrombotic agents accounted for 2.3% of all medications prescribed by GPs, at a rate of 1.2 per 100 problems managed. Warfarin was the most commonly prescribed antithrombotic medication, at a rate of 0.5 per 100 problems managed (Appendix Table A5).
A single prescription can include several repeats—in 2015–16, over one-third (36%) of all prescriptions written by GPs had five repeats. For many of the medications that are used for chronic conditions (such as hypertension), the PBS commonly provides 1 month’s supply and five repeated dispensings (Britt et al. 2016).
Medicines for cardiovascular disease 11
Box 5: ‘Polypills’ to prevent cardiovascular disease A polypill is a medication that combines several drugs acting on different cardiovascular risk factors into one formulation.
Trials have shown that the use of a polypill improved medicine adherence by subjects, when compared with their use of the individual drugs. Polypills also reduce cardiovascular risk factors to the same amount as their individual components, without increasing adverse events (Webster & Patel 2014).
A combination blood pressure lowering and lipid-reducing medication—amlodipine/atorvastatin—is available on the PBS.
Prescriptions dispensed for amlodipine/atorvastatin have increased rapidly since it was listed on the PBS in 2006. Over 1.1 million prescriptions were dispensed for amlodipine/atorvastatin in 2015, a greater than 4-fold increase from 251,000 dispensed scripts in 2007.
In May 2017, the most common fixed-dose combination of this therapy (10 mg amlodipine and 40 mg atorvastatin) had a dispensed price of $15.83, while the dispensed price of these drugs when purchased separately was $26.39. This is because the combined therapy attracted only one dispensing fee and pharmacy cost. Currently, concessional patients—but not general non-safety net patients—receive a government subsidy for amlodipine/atorvastatin. Australian Government expenditure on amlodipine/atorvastatin was $40.6 million in the 2015–16 financial year. The cost-effectiveness of polypills has to be evaluated as, under some circumstances, they can be more expensive than the sum of the individual therapies (Clarke & Avery 2014).
Long-term trials with morbidity and mortality outcomes examining the broad use of cardiovascular polypills for primary prevention are ongoing (Webster & Patel 2014).
Medicines for cardiovascular disease12
4 Use of cardiovascular medicinesCardiovascular medicines supplied to the Australian community are key elements in preventing and treating cardiovascular disease. Patterns of use of these medicines can be assessed through population-based surveys and by analysing PBS administrative data.
Medicine use among people with cardiovascular diseaseThe Australia Bureau of Statistics (ABS) National Health Survey collects information from the Australian population on health conditions, risk factors and a wide range of health actions, including on the use of cardiovascular medicines (see Appendix).
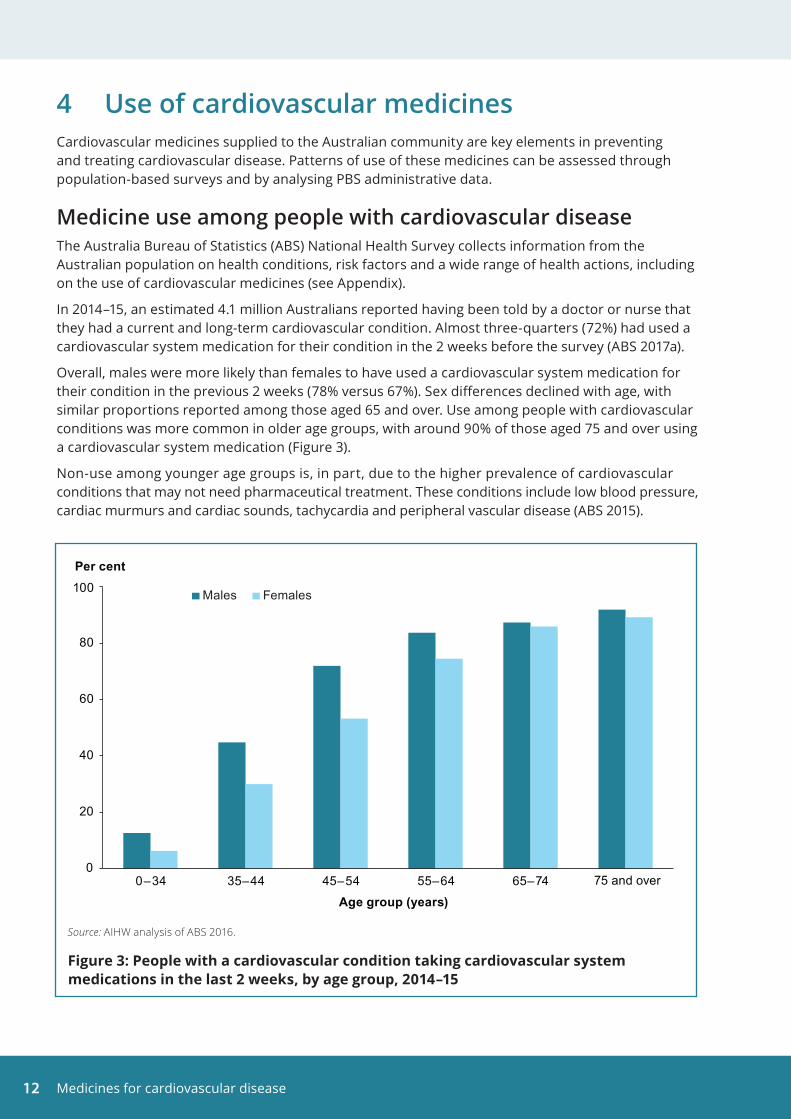
In 2014–15, an estimated 4.1 million Australians reported having been told by a doctor or nurse that they had a current and long-term cardiovascular condition. Almost three-quarters (72%) had used a cardiovascular system medication for their condition in the 2 weeks before the survey (ABS 2017a).
Overall, males were more likely than females to have used a cardiovascular system medication for their condition in the previous 2 weeks (78% versus 67%). Sex differences declined with age, with similar proportions reported among those aged 65 and over. Use among people with cardiovascular conditions was more common in older age groups, with around 90% of those aged 75 and over using a cardiovascular system medication (Figure 3).
Non-use among younger age groups is, in part, due to the higher prevalence of cardiovascular conditions that may not need pharmaceutical treatment. These conditions include low blood pressure, cardiac murmurs and cardiac sounds, tachycardia and peripheral vascular disease (ABS 2015).
Source: AIHW analysis of ABS 2016.
Figure 3: People with a cardiovascular condition taking cardiovascular system medications in the last 2 weeks, by age group, 2014–15
0
20
40
60
80
100
0–34 35–44 45–54 55–64 65–74 75 and over
Per cent
Age group (years)
Males Females
Medicines for cardiovascular disease 13
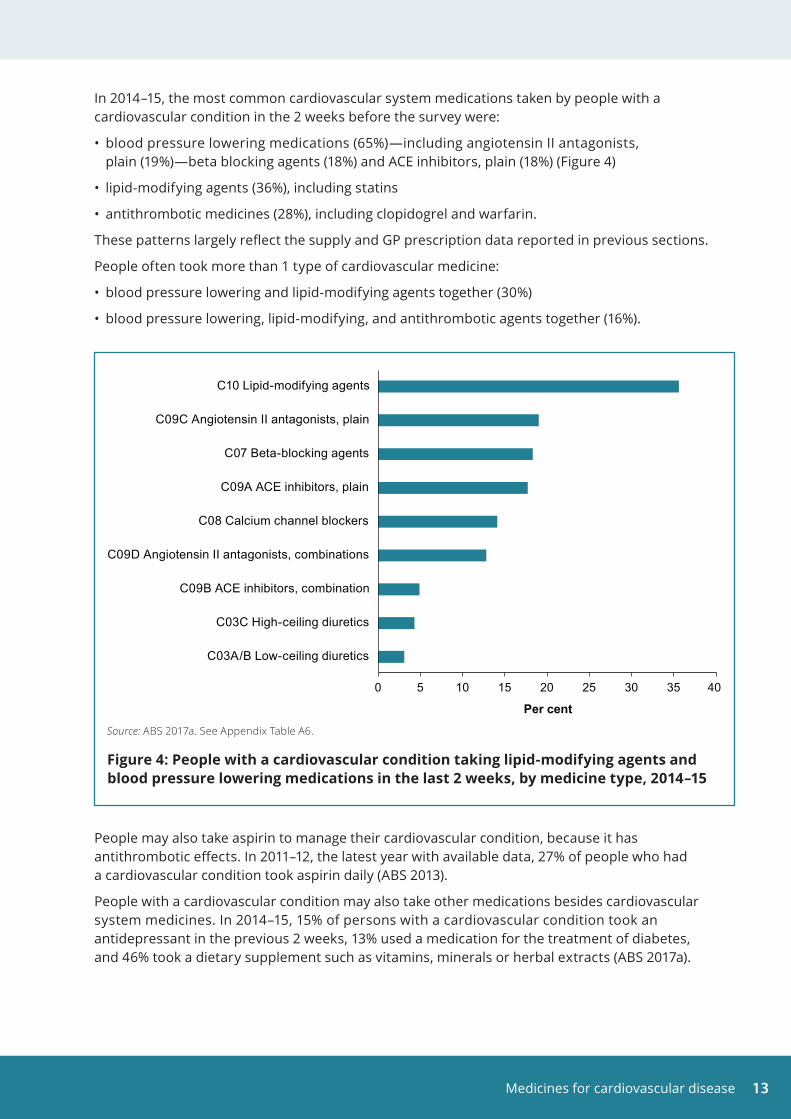
In 2014–15, the most common cardiovascular system medications taken by people with a cardiovascular condition in the 2 weeks before the survey were:
• blood pressure lowering medications (65%)—including angiotensin II antagonists, plain (19%)—beta blocking agents (18%) and ACE inhibitors, plain (18%) (Figure 4)
• lipid-modifying agents (36%), including statins
• antithrombotic medicines (28%), including clopidogrel and warfarin.
These patterns largely reflect the supply and GP prescription data reported in previous sections.
People often took more than 1 type of cardiovascular medicine:
• blood pressure lowering and lipid-modifying agents together (30%)
• blood pressure lowering, lipid-modifying, and antithrombotic agents together (16%).
People may also take aspirin to manage their cardiovascular condition, because it has antithrombotic effects. In 2011–12, the latest year with available data, 27% of people who had a cardiovascular condition took aspirin daily (ABS 2013).
People with a cardiovascular condition may also take other medications besides cardiovascular system medicines. In 2014–15, 15% of persons with a cardiovascular condition took an antidepressant in the previous 2 weeks, 13% used a medication for the treatment of diabetes, and 46% took a dietary supplement such as vitamins, minerals or herbal extracts (ABS 2017a).
Source: ABS 2017a. See Appendix Table A6.
Figure 4: People with a cardiovascular condition taking lipid-modifying agents and blood pressure lowering medications in the last 2 weeks, by medicine type, 2014–15
0 5 10 15 20 25 30 35 40
C03A/B Low-ceiling diuretics
C03C High-ceiling diuretics
C09B ACE inhibitors, combination
C09D Angiotensin II antagonists, combinations
C08 Calcium channel blockers
C09A ACE inhibitors, plain
C07 Beta-blocking agents
C09C Angiotensin II antagonists, plain
C10 Lipid-modifying agents
Per cent
Medicines for cardiovascular disease14
Use of more than one class of cardiovascular system medicineA person with a cardiovascular condition may use several different medicines to manage their condition. To understand this further, an analysis of PBS claims was undertaken to explore the number of classes of cardiovascular system medicines that were supplied to a study population of concessional beneficiaries aged 65 and over during 2014–15. The analysis was restricted to this population due to limitations with PBS data held at the AIHW (see Appendix).
For this analysis, cardiovascular system medicines were attributed to 4 classes—Blood pressure lowering medicines, Lipid-modifying medicines, Antithrombotic medicines, and Other medicines. The ‘Other’ class was made up of less commonly prescribed medicines, including cardiac therapy medicines, antihypertensive and peripheral vasodilators.
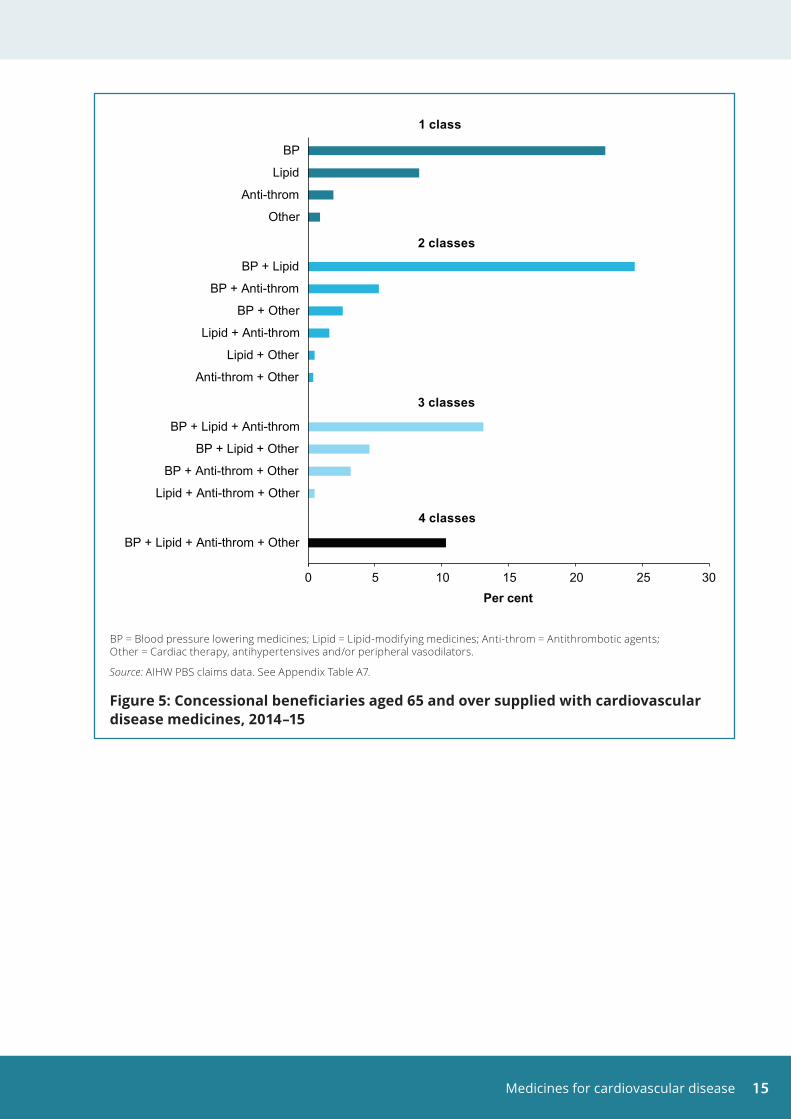
• One-third (33%) of the study population were supplied with 1 class of cardiovascular medicine for their condition during 2014–15 (Figure 5). Most commonly, people were supplied blood pressure lowering medicines alone (22%). Another 8.3% were supplied lipid-modifying medicines alone.
• Medicines from 2 classes were supplied to 35% of the study population. Blood pressure lowering and lipid-modifying medicines were the most common combination (24%). An additional 5% were supplied blood pressure lowering and antithrombotic medicines.
• Medicines from 3 classes were supplied to 21% of the study population. Of these, blood pressure lowering, lipid-modifying and antithrombotic medicines were the most common combination (13%). Another 4.6% were supplied blood pressure lowering and lipid -modifying medicines, and other medicines.
• One (1) in 10 (10%) of the study population were supplied all 4 classes of medicine to treat their cardiovascular condition.
People supplied with medicines from more than 1 class did not necessarily take these medicines concurrently.
Note also that the use of multiple medicines within a class was not assessed. An estimated 50–70% of patients, for example, will not achieve blood pressure targets with a single drug and will require at least two different blood pressure lowering medicines (NHFA 2016).
Medicines for cardiovascular disease 15
BP = Blood pressure lowering medicines; Lipid = Lipid-modifying medicines; Anti-throm = Antithrombotic agents; Other = Cardiac therapy, antihypertensives and/or peripheral vasodilators.
Source: AIHW PBS claims data. See Appendix Table A7.
Figure 5: Concessional beneficiaries aged 65 and over supplied with cardiovascular disease medicines, 2014–15
0 5 10 15 20 25 30
BP + Lipid + Anti-throm + Other
Lipid + Anti-throm + Other
BP + Anti-throm + Other
BP + Lipid + Other
BP + Lipid + Anti-throm
Anti-throm + Other
Lipid + Other
Lipid + Anti-throm
BP + Other
BP + Anti-throm
BP + Lipid
Other
Anti-throm
Lipid
BP
Per cent
1 class
3 classes
4 classes
2 classes
Medicines for cardiovascular disease16
5 Expenditure on cardiovascular medicinesThe PBS provides affordable access to necessary medicines. Australians pay only part of the cost of most prescription medicines, with the rest covered by the PBS. The PBS safety net protects patients against high cumulative costs.
This section presents information on expenditure for cardiovascular system and antithrombotic medicines. It includes expenditure on medicines dispensed to the general population under Section 85 of the PBS. Australian Government expenditure, as well as patient contributions, is included. Expenditure under Section 100 is not included (see Box 2). The data source is the publication Expenditure and prescriptions twelve months to 30 June 2016 (Department of Health 2016b).
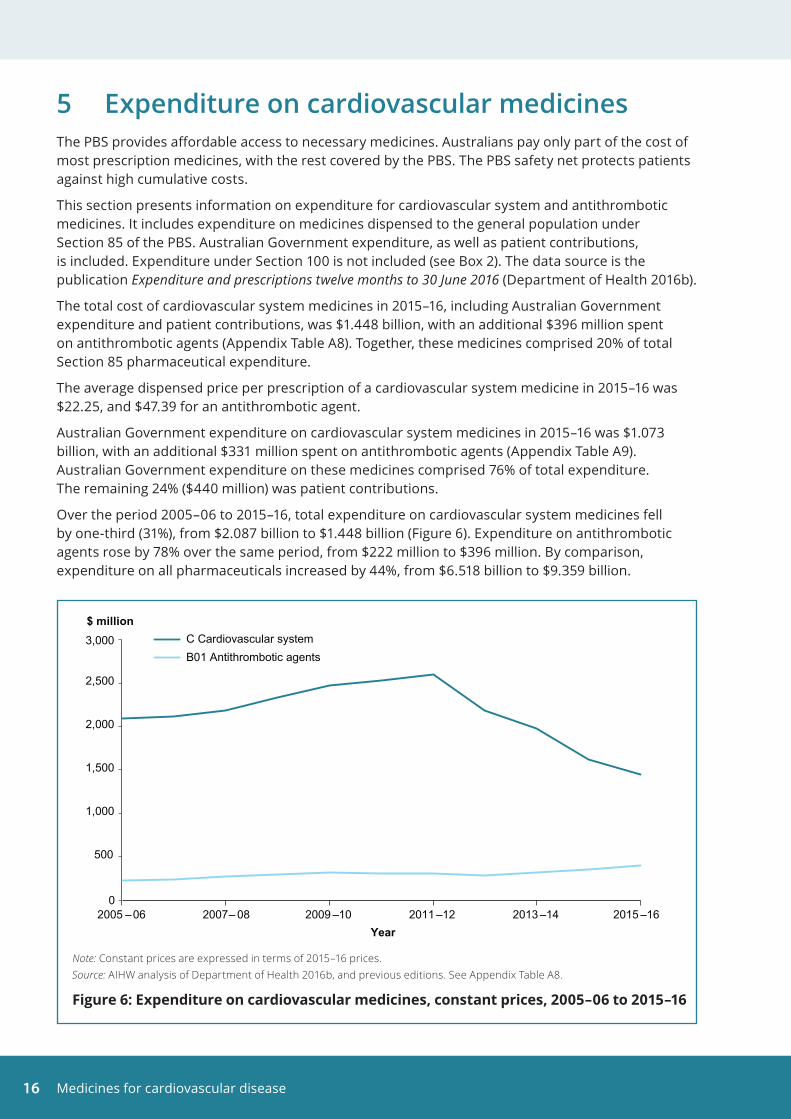
The total cost of cardiovascular system medicines in 2015–16, including Australian Government expenditure and patient contributions, was $1.448 billion, with an additional $396 million spent on antithrombotic agents (Appendix Table A8). Together, these medicines comprised 20% of total Section 85 pharmaceutical expenditure.
The average dispensed price per prescription of a cardiovascular system medicine in 2015–16 was $22.25, and $47.39 for an antithrombotic agent.
Australian Government expenditure on cardiovascular system medicines in 2015–16 was $1.073 billion, with an additional $331 million spent on antithrombotic agents (Appendix Table A9). Australian Government expenditure on these medicines comprised 76% of total expenditure. The remaining 24% ($440 million) was patient contributions.
Over the period 2005–06 to 2015–16, total expenditure on cardiovascular system medicines fell by one-third (31%), from $2.087 billion to $1.448 billion (Figure 6). Expenditure on antithrombotic agents rose by 78% over the same period, from $222 million to $396 million. By comparison, expenditure on all pharmaceuticals increased by 44%, from $6.518 billion to $9.359 billion.
Note: Constant prices are expressed in terms of 2015–16 prices.Source: AIHW analysis of Department of Health 2016b, and previous editions. See Appendix Table A8.
Figure 6: Expenditure on cardiovascular medicines, constant prices, 2005–06 to 2015–16
0
500
1,000
1,500
2,000
2,500
3,000
2005 –06 2007– 08 2009 –10 2011 –12 2013 –14 2015 –16
$ million
Year
C Cardiovascular systemB01 Antithrombotic agents
Medicines for cardiovascular disease 17
The decline in expenditure on cardiovascular system medicines since 2011–12 is largely due to the lower price of some medicines, which has resulted from Price Disclosure changes. Suppliers are required to advise the government about the supply of their brands, and the disclosed information is used to work out the price at which their brands are sold.
A number of high-volume cardiovascular system medicines, such as atorvastatin and rosuvastatin, are currently priced below the general co-payment amount. In 2015, about one -quarter of the volume of these medicines was dispensed as under co-payment prescriptions (Appendix Table A3).
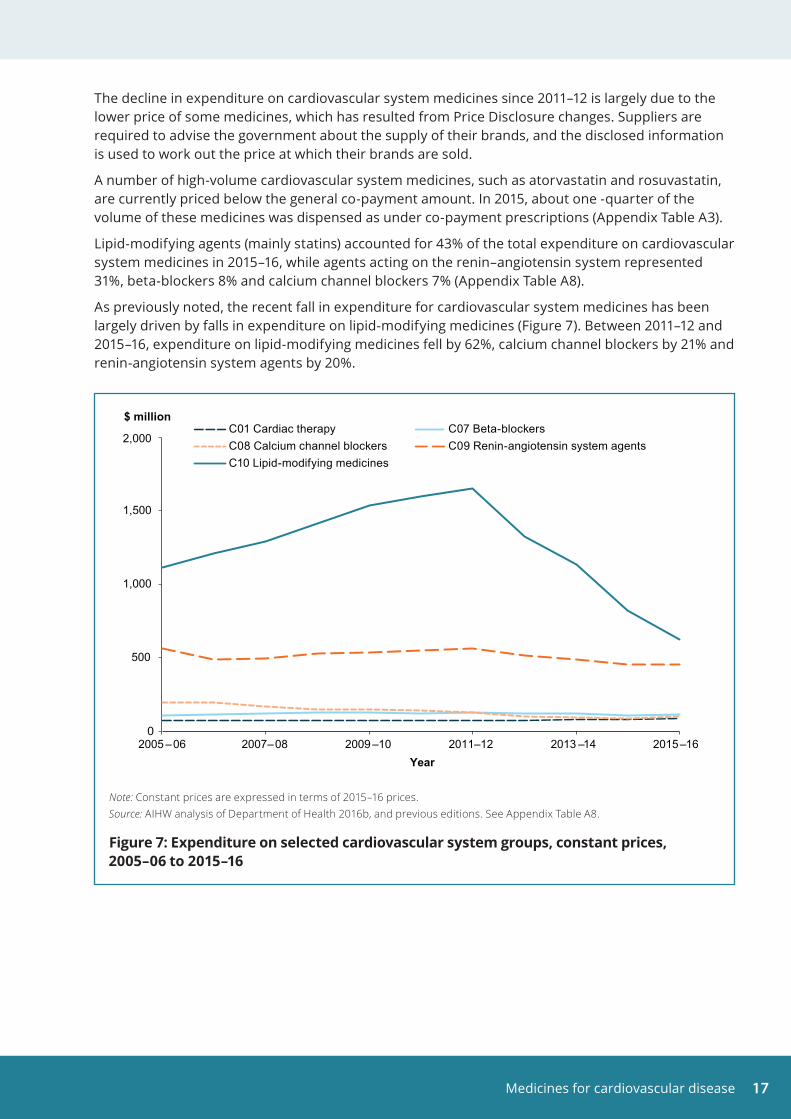
Lipid-modifying agents (mainly statins) accounted for 43% of the total expenditure on cardiovascular system medicines in 2015–16, while agents acting on the renin–angiotensin system represented 31%, beta-blockers 8% and calcium channel blockers 7% (Appendix Table A8).
As previously noted, the recent fall in expenditure for cardiovascular system medicines has been largely driven by falls in expenditure on lipid-modifying medicines (Figure 7). Between 2011–12 and 2015–16, expenditure on lipid-modifying medicines fell by 62%, calcium channel blockers by 21% and renin-angiotensin system agents by 20%.
Note: Constant prices are expressed in terms of 2015–16 prices.Source: AIHW analysis of Department of Health 2016b, and previous editions. See Appendix Table A8.
Figure 7: Expenditure on selected cardiovascular system groups, constant prices, 2005–06 to 2015–16
0
500
1,000
1,500
2,000
2005 –06 2007–08 2009 –10 2011–12 2013 –14 2015–16
$ million
Year
C01 Cardiac therapy C07 Beta-blockersC08 Calcium channel blockers C09 Renin-angiotensin system agentsC10 Lipid-modifying medicines
Medicines for cardiovascular disease18
Appendix
Methods
Anatomical Therapeutic Chemical classificationATC codes are used in this report to classify medicines. The ATC classification of medicines is recommended by the World Health Organization, and is the Australian standard for presenting and comparing drug usage data. The ATC classification groups medicines according to the body organ or system on which they act, and their therapeutic and chemical characteristics. More information on the ATC classification system can be found at <https://www.whocc.no/atc/structure_and_principles/>.
A list of the ATC therapeutic groups included in this report is shown below.
ATC code Description
B Blood and blood forming organs
B01 Antithrombotic agents
C Cardiovascular system
C01 Cardiac therapy
C02 Antihypertensives
C03 Diuretics
C04 Peripheral vasodilators
C05 Vasoprotectives
C07 Beta-blocking agents
C08 Calcium channel blockers
C09 Renin-angiotensin system agents
C10 Lipid-modifying agents
DDD measurement unitMedicine supply in this report is expressed as ‘defined daily dose per 1,000 population per day (DDD/1,000/day)’. This measure is based on an assumed average dose per day of a medicine used for its main indication—the main reason for which the medicine was prescribed—in adults.
The DDD allows medicines to be compared independently of differences in price, preparation and quantity per prescription. It also allows comparison of the use of medicines in different therapeutic groups, between regions and countries, and trends in medicine use over time.
Note that some preparations have multiple active ingredients. The DDD for combination products is reported in terms of the DDD for each constituent where appropriate. For a small number of cardiovascular system medicines, such as vasoprotectives, it is difficult to assign a DDD. The figures presented for these will underestimate their real supply.
Medicines for cardiovascular disease 19
Data sources
ABS National Health Survey 2014–15The 2014-15 National Health Survey is the most recent in a series of Australia-wide health surveys conducted by the ABS. The survey was designed to collect a range of information about the health of Australians, including prevalence of long-term health conditions, use of health services such as consultations with health practitioners, and actions people have recently taken for their health.
The survey was conducted in all states and territories and across urban, rural and remote areas of Australia (excluding very remote areas) from July 2014 to June 2015; it included around 19,000 people in nearly 15,000 private dwellings. Non-private dwellings such as hotels, motels, hospitals, nursing homes and short-stay caravan parks were excluded.
Most data were self-reported by respondents and therefore relied on the respondents’ knowing and providing accurate information. Note that information about health conditions was self-reported, with respondents asked whether they had ever been told by a doctor or nurse that they had a particular health condition.
Respondents were asked for the names or brands of all medications and dietary supplements they had taken in the last 2 weeks. Respondents were encouraged to have all their medications in front of them during the interview to assist in recording the information. Medications were coded, based on their active ingredient(s) and their therapeutic application, to the World Health Organization ATC classification system.
More information on data quality can be found in Health service usage and health related actions, Australia, 2014–15 (ABS 2017a), available at:
<http://www.abs.gov.au/AUSSTATS/[email protected]/Lookup/4364.0.55.002Main+Features12014-15?OpenDocument>
and in the National Health Survey: users’ guide, 2014–15 (ABS 2017b), available at:
<http://www.abs.gov.au/ausstats/[email protected]/Lookup/by%20Subject/4363.0~2014-15~Main%20Features~Use%20of%20medications~49>.
Australian Statistics on MedicinesThe Department of Human Services processes all prescriptions dispensed under the PBS/RPBS, and these are transmitted daily to the Department of Health. These records maintained by Health are used for reporting in Australian Statistics on Medicines, an annual publication produced by the Drug Utilisation Sub-Committee of the Pharmaceutical Benefits Advisory Committee (Department of Health 2016a). This data source has been used to report on supply patterns of medicines in Section 2 ‘Supply of Cardiovascular Medicines’.
Supply is reported on a dispensing basis rather than a prescription basis. A single prescription may include several repeats, enabling multiple dispensings, with the patient paying the co-payment for each dispensing.
From 1 April 2012, the data include under co-payment prescriptions. Before this, estimates of the volume of under co-payment prescriptions were sourced from industry surveys conducted by the Pharmacy Guild of Australia.
The data do not include medicines supplied to in-patients in public hospitals, over-the-counter medicines, private prescriptions from 2012 onwards, or the supply of highly specialised drugs to outpatients through public hospitals before 2014.
Medicines for cardiovascular disease20
Note that although the data represent estimates of the aggregate community supply of prescription medicines in Australia, they may differ from actual usage patterns, as not all medicines supplied are used.
The PBS/RPBS claims data do not include clinical information about the reason for the prescription or the nature or severity of the condition for which the medication was prescribed.
More information about the prescription claims data in Australian Statistics on Medicines can be found at <https://www.pbs.gov.au/info/browse/statistics>.
Bettering the Evaluation and Care of Health programThe BEACH program was a continuous national study of general practice activity in Australia. Each year, a random sample of about 1,000 practising GPs participated, each recording details of 100 patient encounters. This provided details of about 100,000
GP–patient encounters per year, including information on reasons for the encounters, problems managed by the GPs, and the management provided.
The BEACH program began in April 1998 and concluded in June 2016. It was conducted by the Family Medicine Research Centre at the University of Sydney. More information on the BEACH program can be found at <http://sydney.edu.au/medicine/fmrc/beach/>.
Pharmaceutical Benefits Scheme claims data held at the AIHWThe Australian Institute of Health and Welfare (AIHW) holds de-identified unit record level of PBS claims data for the period 1 April 2010 to 30 June 2015, by date of processing. This data source has been used in Section 4 ‘Use of more than one class of cardiovascular system medicine’.
The AIHW’s PBS claims data do not include PBS under co-payment prescriptions, RPBS claims and general schedule medicines supplied to eligible Aboriginal Health Services in remote areas of Australia.
Since under co-payment prescriptions are not included in the AIHW data set, analysis in the section ‘Use of more than one class of cardiovascular system medicine’ (see earlier) was restricted to concession card holders aged 65 and older. As changes in the beneficiary status of pensioners are likely to be minimal, this results in a more homogenous population for analysis.
The supply of multiple cardiovascular medicines among concessional beneficiaries aged 65 and over has been reported for all scripts supplied in the period 1 January 2014 to 30 June 2015. There were 2.4 million people in the study population.
Medicines for cardiovascular disease 21
Statistical tables
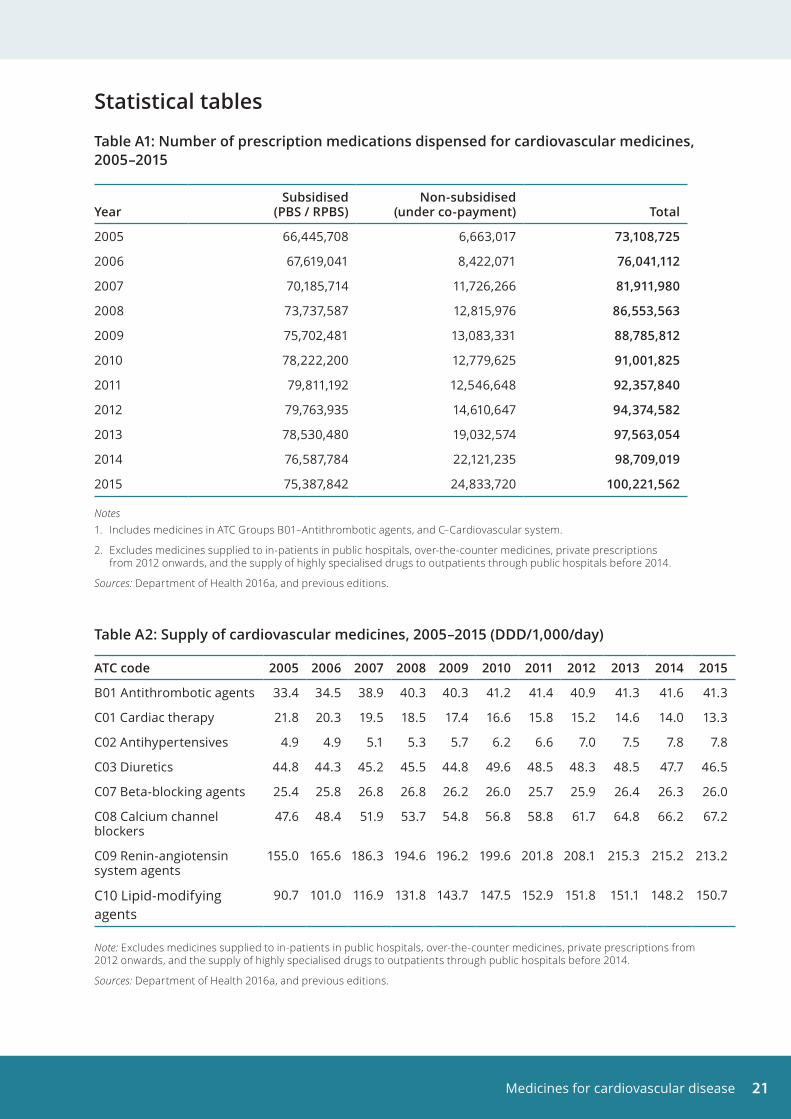
Table A1: Number of prescription medications dispensed for cardiovascular medicines, 2005–2015
YearSubsidised
(PBS / RPBS)Non-subsidised
(under co-payment) Total
2005 66,445,708 6,663,017 73,108,725
2006 67,619,041 8,422,071 76,041,112
2007 70,185,714 11,726,266 81,911,980
2008 73,737,587 12,815,976 86,553,563
2009 75,702,481 13,083,331 88,785,812
2010 78,222,200 12,779,625 91,001,825
2011 79,811,192 12,546,648 92,357,840
2012 79,763,935 14,610,647 94,374,582
2013 78,530,480 19,032,574 97,563,054
2014 76,587,784 22,121,235 98,709,019
2015 75,387,842 24,833,720 100,221,562
Notes1. Includes medicines in ATC Groups B01–Antithrombotic agents, and C–Cardiovascular system.
2. Excludes medicines supplied to in-patients in public hospitals, over-the-counter medicines, private prescriptions from 2012 onwards, and the supply of highly specialised drugs to outpatients through public hospitals before 2014.
Sources: Department of Health 2016a, and previous editions.
Table A2: Supply of cardiovascular medicines, 2005–2015 (DDD/1,000/day)
ATC code 2005 2006 2007 2008 2009 2010 2011 2012 2013 2014 2015
B01 Antithrombotic agents 33.4 34.5 38.9 40.3 40.3 41.2 41.4 40.9 41.3 41.6 41.3
C01 Cardiac therapy 21.8 20.3 19.5 18.5 17.4 16.6 15.8 15.2 14.6 14.0 13.3
C02 Antihypertensives 4.9 4.9 5.1 5.3 5.7 6.2 6.6 7.0 7.5 7.8 7.8
C03 Diuretics 44.8 44.3 45.2 45.5 44.8 49.6 48.5 48.3 48.5 47.7 46.5
C07 Beta-blocking agents 25.4 25.8 26.8 26.8 26.2 26.0 25.7 25.9 26.4 26.3 26.0
C08 Calcium channel blockers
47.6 48.4 51.9 53.7 54.8 56.8 58.8 61.7 64.8 66.2 67.2
C09 Renin-angiotensin system agents
155.0 165.6 186.3 194.6 196.2 199.6 201.8 208.1 215.3 215.2 213.2
C10 Lipid-modifying agents
90.7 101.0 116.9 131.8 143.7 147.5 152.9 151.8 151.1 148.2 150.7
Note: Excludes medicines supplied to in-patients in public hospitals, over-the-counter medicines, private prescriptions from 2012 onwards, and the supply of highly specialised drugs to outpatients through public hospitals before 2014.
Sources: Department of Health 2016a, and previous editions.
Medicines for cardiovascular disease22
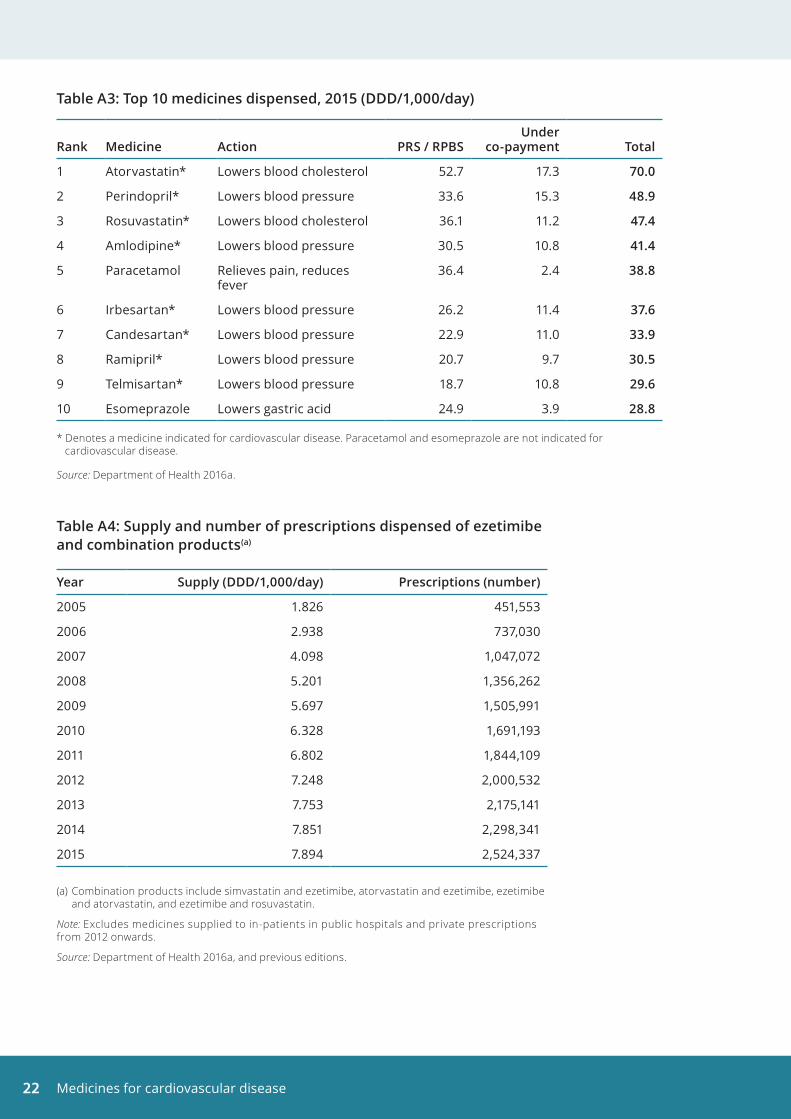
Table A3: Top 10 medicines dispensed, 2015 (DDD/1,000/day)
Rank Medicine Action PRS / RPBSUnder
co-payment Total
1 Atorvastatin* Lowers blood cholesterol 52.7 17.3 70 .0
2 Perindopril* Lowers blood pressure 33.6 15.3 48 .9
3 Rosuvastatin* Lowers blood cholesterol 36.1 11.2 47 .4
4 Amlodipine* Lowers blood pressure 30.5 10.8 41 .4
5 Paracetamol Relieves pain, reduces fever
36.4 2.4 38 .8
6 Irbesartan* Lowers blood pressure 26.2 11.4 37 .6
7 Candesartan* Lowers blood pressure 22.9 11.0 33 .9
8 Ramipril* Lowers blood pressure 20.7 9.7 30 .5
9 Telmisartan* Lowers blood pressure 18.7 10.8 29 .6
10 Esomeprazole Lowers gastric acid 24.9 3.9 28 .8
* Denotes a medicine indicated for cardiovascular disease. Paracetamol and esomeprazole are not indicated for cardiovascular disease.
Source: Department of Health 2016a.
Table A4: Supply and number of prescriptions dispensed of ezetimibe and combination products(a)
Year Supply (DDD/1,000/day) Prescriptions (number)
2005 1.826 451,553
2006 2.938 737,030
2007 4.098 1,047,072
2008 5.201 1,356,262
2009 5.697 1,505,991
2010 6.328 1,691,193
2011 6.802 1,844,109
2012 7.248 2,000,532
2013 7.753 2,175,141
2014 7.851 2,298,341
2015 7.894 2,524,337
(a) Combination products include simvastatin and ezetimibe, atorvastatin and ezetimibe, ezetimibe and atorvastatin, and ezetimibe and rosuvastatin.
Note: Excludes medicines supplied to in-patients in public hospitals and private prescriptions from 2012 onwards.
Source: Department of Health 2016a, and previous editions.
Medicines for cardiovascular disease 23
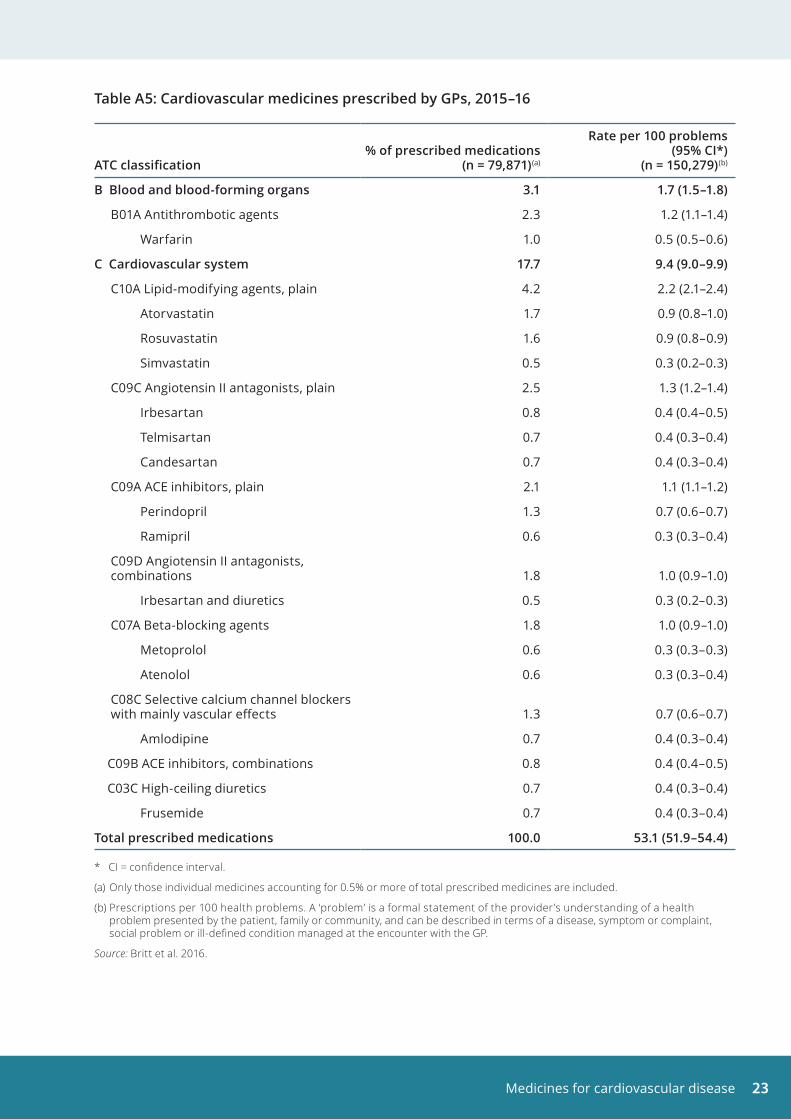
Table A5: Cardiovascular medicines prescribed by GPs, 2015–16
ATC classification% of prescribed medications
(n = 79,871)(a)
Rate per 100 problems (95% CI*)
(n = 150,279)(b)
B Blood and blood-forming organs 3 .1 1 .7 (1 .5–1 .8)
B01A Antithrombotic agents 2.3 1.2 (1.1–1.4)
Warfarin 1.0 0.5 (0.5–0.6)
C Cardiovascular system 17 .7 9 .4 (9 .0–9 .9)
C10A Lipid-modifying agents, plain 4.2 2.2 (2.1–2.4)
Atorvastatin 1.7 0.9 (0.8–1.0)
Rosuvastatin 1.6 0.9 (0.8–0.9)
Simvastatin 0.5 0.3 (0.2–0.3)
C09C Angiotensin II antagonists, plain 2.5 1.3 (1.2–1.4)
Irbesartan 0.8 0.4 (0.4–0.5)
Telmisartan 0.7 0.4 (0.3–0.4)
Candesartan 0.7 0.4 (0.3–0.4)
C09A ACE inhibitors, plain 2.1 1.1 (1.1–1.2)
Perindopril 1.3 0.7 (0.6–0.7)
Ramipril 0.6 0.3 (0.3–0.4)
C09D Angiotensin II antagonists, combinations 1.8 1.0 (0.9–1.0)
Irbesartan and diuretics 0.5 0.3 (0.2–0.3)
C07A Beta-blocking agents 1.8 1.0 (0.9–1.0)
Metoprolol 0.6 0.3 (0.3–0.3)
Atenolol 0.6 0.3 (0.3–0.4)
C08C Selective calcium channel blockers with mainly vascular effects 1.3 0.7 (0.6–0.7)
Amlodipine 0.7 0.4 (0.3–0.4)
C09B ACE inhibitors, combinations 0.8 0.4 (0.4–0.5)
C03C High-ceiling diuretics 0.7 0.4 (0.3–0.4)
Frusemide 0.7 0.4 (0.3–0.4)
Total prescribed medications 100 .0 53 .1 (51 .9–54 .4)
* CI = confidence interval.
(a) Only those individual medicines accounting for 0.5% or more of total prescribed medicines are included.
(b) Prescriptions per 100 health problems. A ‘problem’ is a formal statement of the provider’s understanding of a health problem presented by the patient, family or community, and can be described in terms of a disease, symptom or complaint, social problem or ill-defined condition managed at the encounter with the GP.
Source: Britt et al. 2016.
Medicines for cardiovascular disease24
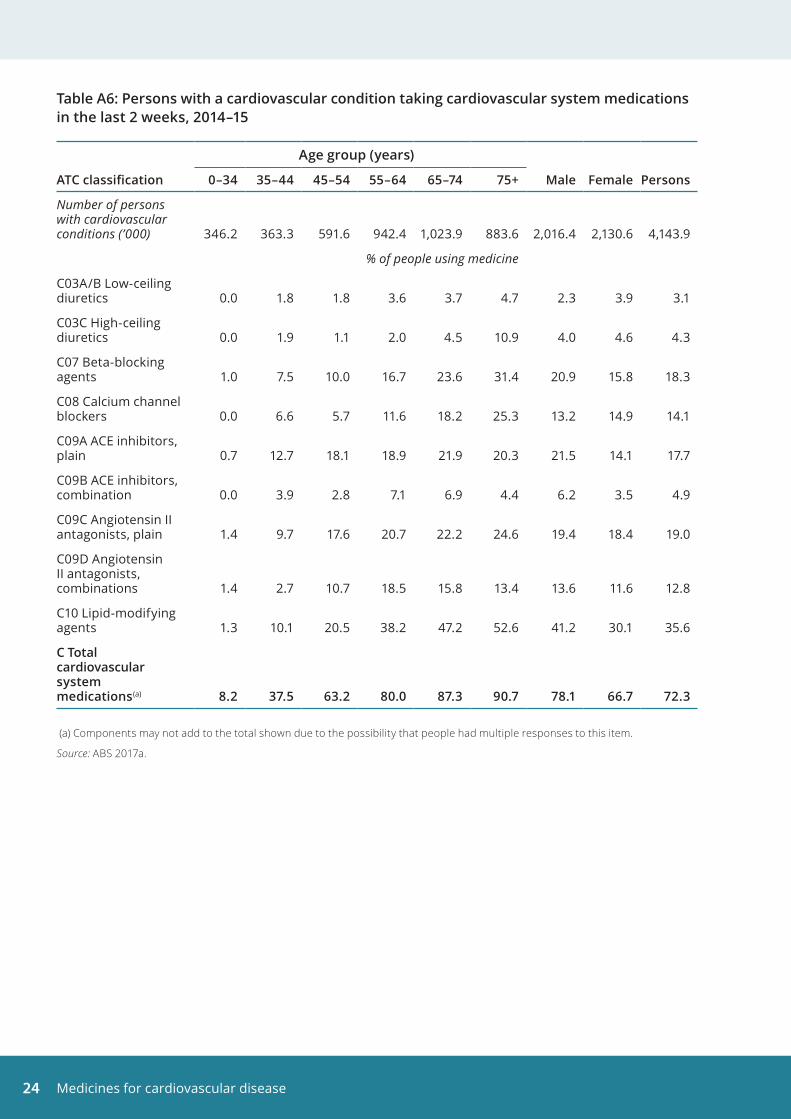
Table A6: Persons with a cardiovascular condition taking cardiovascular system medications in the last 2 weeks, 2014–15
Age group (years)
ATC classification 0–34 35–44 45–54 55–64 65–74 75+ Male Female Persons
Number of persons with cardiovascular conditions (’000) 346.2 363.3 591.6 942.4 1,023.9 883.6 2,016.4 2,130.6 4,143.9
% of people using medicine
C03A/B Low-ceiling diuretics 0.0 1.8 1.8 3.6 3.7 4.7 2.3 3.9 3.1
C03C High-ceiling diuretics 0.0 1.9 1.1 2.0 4.5 10.9 4.0 4.6 4.3
C07 Beta-blocking agents 1.0 7.5 10.0 16.7 23.6 31.4 20.9 15.8 18.3
C08 Calcium channel blockers 0.0 6.6 5.7 11.6 18.2 25.3 13.2 14.9 14.1
C09A ACE inhibitors, plain 0.7 12.7 18.1 18.9 21.9 20.3 21.5 14.1 17.7
C09B ACE inhibitors, combination 0.0 3.9 2.8 7.1 6.9 4.4 6.2 3.5 4.9
C09C Angiotensin II antagonists, plain 1.4 9.7 17.6 20.7 22.2 24.6 19.4 18.4 19.0
C09D Angiotensin II antagonists, combinations 1.4 2.7 10.7 18.5 15.8 13.4 13.6 11.6 12.8
C10 Lipid-modifying agents 1.3 10.1 20.5 38.2 47.2 52.6 41.2 30.1 35.6
C Total cardiovascular system medications(a) 8 .2 37 .5 63 .2 80 .0 87 .3 90 .7 78 .1 66 .7 72 .3
(a) Components may not add to the total shown due to the possibility that people had multiple responses to this item.
Source: ABS 2017a.
Medicines for cardiovascular disease 25
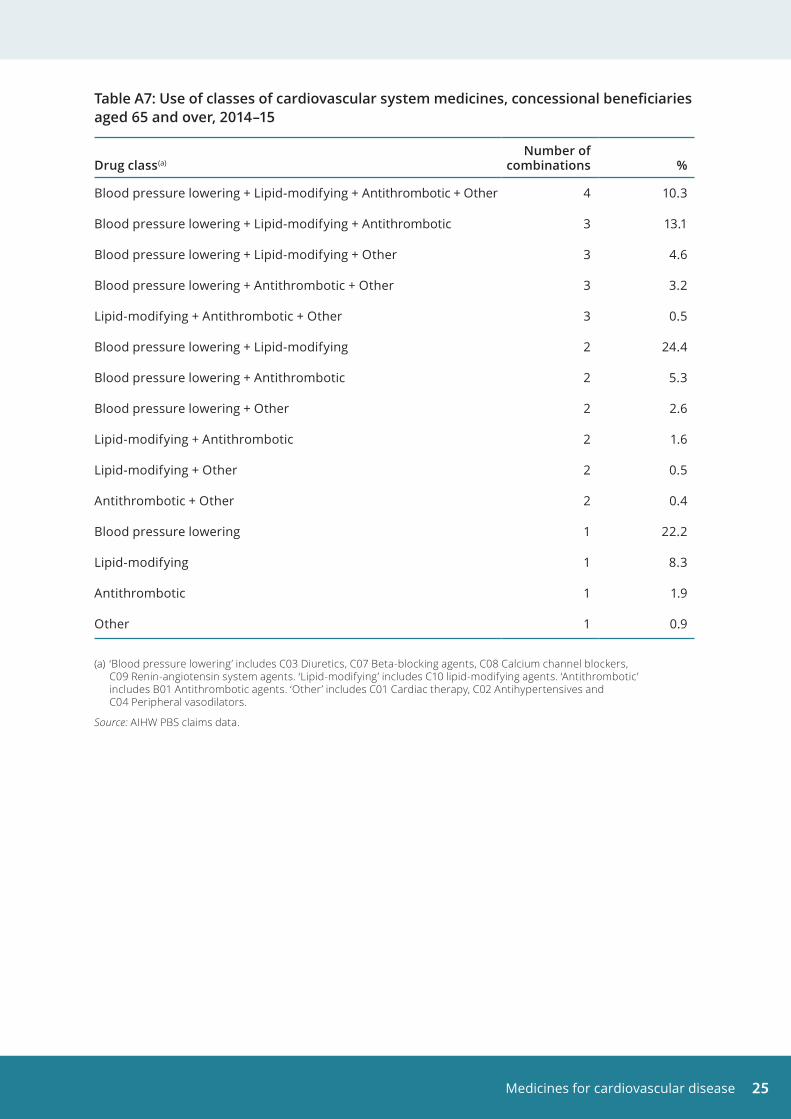
Table A7: Use of classes of cardiovascular system medicines, concessional beneficiaries aged 65 and over, 2014–15
Drug class(a)Number of
combinations %
Blood pressure lowering + Lipid-modifying + Antithrombotic + Other 4 10.3
Blood pressure lowering + Lipid-modifying + Antithrombotic 3 13.1
Blood pressure lowering + Lipid-modifying + Other 3 4.6
Blood pressure lowering + Antithrombotic + Other 3 3.2
Lipid-modifying + Antithrombotic + Other 3 0.5
Blood pressure lowering + Lipid-modifying 2 24.4
Blood pressure lowering + Antithrombotic 2 5.3
Blood pressure lowering + Other 2 2.6
Lipid-modifying + Antithrombotic 2 1.6
Lipid-modifying + Other 2 0.5
Antithrombotic + Other 2 0.4
Blood pressure lowering 1 22.2
Lipid-modifying 1 8.3
Antithrombotic 1 1.9
Other 1 0.9
(a) ‘Blood pressure lowering’ includes C03 Diuretics, C07 Beta-blocking agents, C08 Calcium channel blockers, C09 Renin-angiotensin system agents. ‘Lipid-modifying’ includes C10 lipid-modifying agents. ‘Antithrombotic’ includes B01 Antithrombotic agents. ‘Other’ includes C01 Cardiac therapy, C02 Antihypertensives and C04 Peripheral vasodilators.
Source: AIHW PBS claims data.
Medicines for cardiovascular disease26
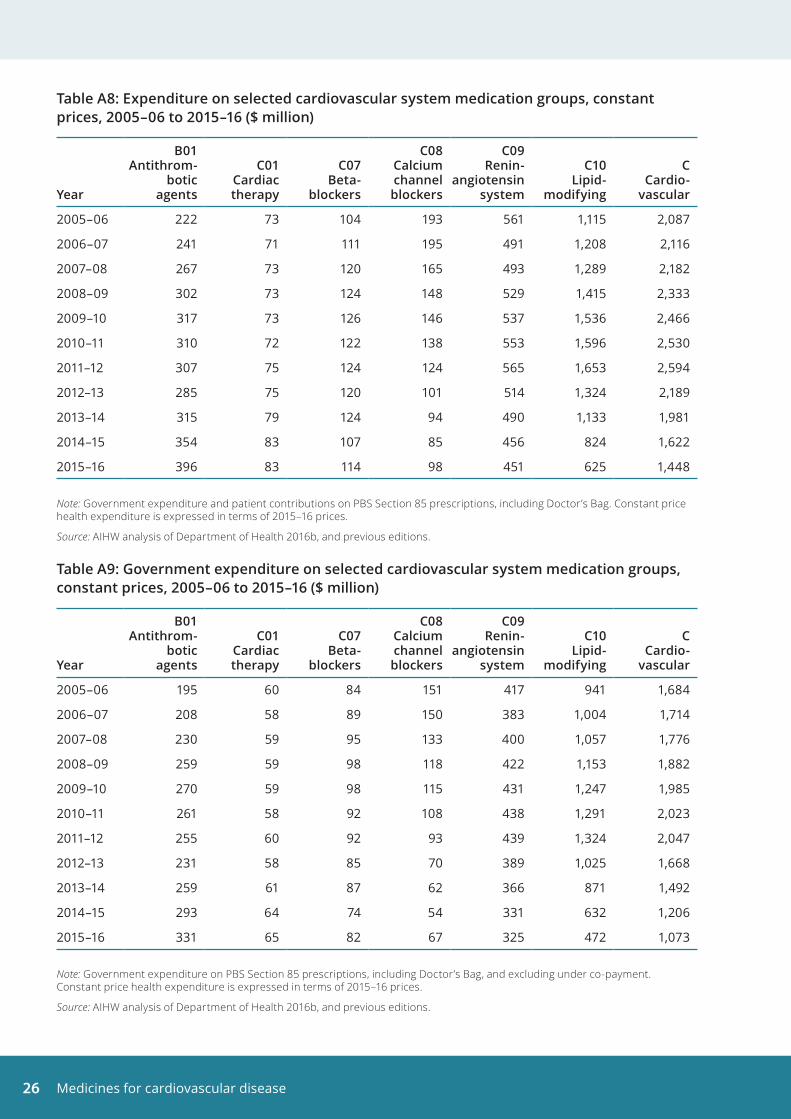
Table A8: Expenditure on selected cardiovascular system medication groups, constant prices, 2005–06 to 2015–16 ($ million)
Year
B01 Antithrom-
botic agents
C01 Cardiac therapy
C07 Beta-
blockers
C08 Calcium channel blockers
C09 Renin-
angiotensin system
C10 Lipid-
modifying
C Cardio-
vascular
2005–06 222 73 104 193 561 1,115 2,087
2006–07 241 71 111 195 491 1,208 2,116
2007–08 267 73 120 165 493 1,289 2,182
2008–09 302 73 124 148 529 1,415 2,333
2009–10 317 73 126 146 537 1,536 2,466
2010–11 310 72 122 138 553 1,596 2,530
2011–12 307 75 124 124 565 1,653 2,594
2012–13 285 75 120 101 514 1,324 2,189
2013–14 315 79 124 94 490 1,133 1,981
2014–15 354 83 107 85 456 824 1,622
2015–16 396 83 114 98 451 625 1,448
Note: Government expenditure and patient contributions on PBS Section 85 prescriptions, including Doctor’s Bag. Constant price health expenditure is expressed in terms of 2015–16 prices.
Source: AIHW analysis of Department of Health 2016b, and previous editions.
Table A9: Government expenditure on selected cardiovascular system medication groups, constant prices, 2005–06 to 2015–16 ($ million)
Year
B01 Antithrom-
botic agents
C01 Cardiac therapy
C07 Beta-
blockers
C08 Calcium channel blockers
C09 Renin-
angiotensin system
C10 Lipid-
modifying
C Cardio-
vascular
2005–06 195 60 84 151 417 941 1,684
2006–07 208 58 89 150 383 1,004 1,714
2007–08 230 59 95 133 400 1,057 1,776
2008–09 259 59 98 118 422 1,153 1,882
2009–10 270 59 98 115 431 1,247 1,985
2010–11 261 58 92 108 438 1,291 2,023
2011–12 255 60 92 93 439 1,324 2,047
2012–13 231 58 85 70 389 1,025 1,668
2013–14 259 61 87 62 366 871 1,492
2014–15 293 64 74 54 331 632 1,206
2015–16 331 65 82 67 325 472 1,073
Note: Government expenditure on PBS Section 85 prescriptions, including Doctor’s Bag, and excluding under co-payment. Constant price health expenditure is expressed in terms of 2015–16 prices.
Source: AIHW analysis of Department of Health 2016b, and previous editions.
Medicines for cardiovascular disease 27
ReferencesABS (Australian Bureau of Statistics) 2013. Australian Health Survey: health service usage and health related actions, 2011–12. ABS cat. no. 4364.0.55.002. Canberra: ABS.
ABS 2015. National Health Survey first results, Australia, 2014–15. ABS cat. no. 4364.0.55.001. Canberra: ABS.
ABS 2016. Microdata: National Health Survey, 2014–15, expanded confidentialised unit record file, Remote Access Data Laboratory (RADL). ABS cat. no. 4324.0.55.001. Findings based on use of ABS microdata.
ABS 2017a. Health service usage and health related actions, Australia, 2014–15. ABS cat. no. 4364.0.55.002. Canberra: ABS.
ABS 2017b. National Health Survey: users’ guide, 2014–15. ABS cat. no. 4363.0. Canberra: ABS.
AIHW (Australian Institute of Health and Welfare) 2007. Medicines for cardiovascular health: are they used appropriately? Cat. no. CVD 36. Canberra: AIHW.
AIHW 2016. Australian Burden of Disease Study: impact and causes of illness and death in Australia 2011. Australian Burden of Disease Study series no. 3. Cat. no. BOD 4. Canberra: AIHW.
Britt H, Miller GC, Henderson J, Bayram C, Harrison C, Valenti L, Pan Y, Chanes J, Pollack AJ, Wong C & Gordon J 2016. General practice activity in Australia 2015–16. General practice series no. 40. Sydney: Sydney University Press.
Clarke PM & Avery AB 2014. Evaluating the costs and benefits of using combination therapies. Medical Journal of Australia 200:1–3.
Cutler D, Long G, Berndt E, Royer J, Fournier A, Sasser A et al. 2007. The value of antihypertensive drugs: a perspective on medical innovation. Health Affairs 26: 97–110.
Department of Health 2016a. Australian statistics on medicines 2015. Canberra: Department of Health. Viewed 8 September 2017 <www.pbs.gov.au/info/browse/statistics#ASM>.
Department of Health 2016b. Expenditure and prescriptions twelve months to 30 June 2016. PBS Information Management Section, Pharmaceutical Policy Branch. Canberra: Department of Health. Viewed 8 September 2017, <https://www.pbs.gov.au/info/browse/statistics>.
Department of Health 2017. Pharmaceutical Benefits. Fees, patient contributions and safety net thresholds. Canberra: Department of Health. Viewed 29 May 2017, <http://www.pbs.gov.au/info/healthpro/explanatory-notes/front/fee>.
Dyslipidaemia. In: eTG complete [Internet] 2012. Melbourne: Therapeutic Guidelines Limited. Viewed 29 June 2017, <https://tgldcdp.tg.org.au/viewTopic?topicfile=dyslipidaemia>.
NHFA (National Heart Foundation of Australia) 2016. Guidelines for the diagnosis and management of hypertension in adults. Melbourne: NHFA.
NHFA and Cardiac Society of Australia and New Zealand (CSANZ) (Chronic Heart Failure Guidelines Expert Writing Panel) 2011. Guidelines for the prevention, detection and management of chronic heart failure in Australia. Updated October 2011. Melbourne: NHFA & CSANZ.
NHFA and CSANZ 2012. Reducing risk in heart disease: an expert guide to clinical practice for secondary prevention of coronary heart disease. Melbourne: NHFA.
NSF (National Stroke Foundation) 2010. Clinical guidelines for stroke management. Melbourne: NSFA.
National Vascular Disease Prevention Alliance (NVDPA) 2012. Guidelines for the management of absolute cardiovascular disease risk. Canberra: NVDPA.
Webster R & Patel A 2014. The ‘polypill’ in the prevention of cardiovascular disease. Australian Prescriber 37:82–6.
Medicines for cardiovascular disease28
List of tablesTable 1: Supply of cardiovascular medicines by ATC classification, number of prescription medicines dispensed and rate of use (DDD/1,000/day), 2015 . . . . . . . . . . . . . . . . . . . . . . . . . 7
Table 2: Top 10 prescription medicines dispensed, by DDD/1,000/day, 2015. . . . . . . . . . . . . . . . . . . . 8
Table A1: Number of prescription medications dispensed for cardiovascular medicines, 2005–2015 . . . . . . . . . . . . . . . . . . . . . . . . . . . . . . . . . . . . . . . . . . . . . . . . . . . . . . . . . . . . . . . . . . . . 21
Table A2: Supply of cardiovascular medicines, 2005–2015 (DDD/1,000/day) . . . . . . . . . . . . . . . . . . . . 21
Table A3: Top 10 medicines dispensed, 2015 (DDD/1,000/day) . . . . . . . . . . . . . . . . . . . . . . . . . . . . . . . . 22
Table A4: Supply and number of prescriptions dispensed of ezetimibe and combination products . . . . . . . . . . . . . . . . . . . . . . . . . . . . . . . . . . . . . . . . . . . . . . . . . . . . . . . . . 22
Table A5: Cardiovascular medicines prescribed by GPs, 2015–16 . . . . . . . . . . . . . . . . . . . . . . . . . . . . . 23
Table A6: Persons with a cardiovascular condition taking cardiovascular system medications in the last 2 weeks, 2014–15 . . . . . . . . . . . . . . . . . . . . . . . . . . . . . . . . . . . . . . . . . 24
Table A7: Use of classes of cardiovascular system medicines, concessional beneficiaries aged 65 and over, 2014–15 . . . . . . . . . . . . . . . . . . . . . . . . . . . . . . . . . . . . . . . . . . . . . . . . . . . . . . 25
Table A8: Expenditure on selected cardiovascular system medication groups, constant prices, 2005–06 to 2015–16 ($ million) . . . . . . . . . . . . . . . . . . . . . . . . . . . . . . . . . . . 26
Table A9: Government expenditure on selected cardiovascular system medication groups, constant prices, 2005–06 to 2015–16 ($ million) . . . . . . . . . . . . . . . . . . . . . . . . . . . . 26
Medicines for cardiovascular disease 29
List of figuresFigure 1: Supply of cardiovascular medicines, 2005–2015 . . . . . . . . . . . . . . . . . . . . . . . . . . . . . . . . . . . . 5
Figure 2: Supply of Ezetimibe and combination products, 2005–2015 . . . . . . . . . . . . . . . . . . . . . . . . . 9
Figure 3: People with a cardiovascular condition taking cardiovascular system medications in the last 2 weeks, by age group, 2014–15 . . . . . . . . . . . . . . . . . . . . . . . . . . . . . . . . . . . . . . . 12
Figure 4: People with a cardiovascular condition taking lipid-modifying agents and blood pressure lowering medications in the last 2 weeks, by medicine type, 2014–15 . . . . . . . . 13
Figure 5: Concessional beneficiaries aged 65 and over supplied with cardiovascular disease medicines, 2014–15 . . . . . . . . . . . . . . . . . . . . . . . . . . . . . . . . . . . . . . . . . . . . . . . . . . . . . . . . . . . 15
Figure 6: Expenditure on cardiovascular medicines, constant prices, 2005–06 to 2015–16 . . . . . . 17
Figure 7: Expenditure on selected cardiovascular system groups, constant prices, 2005–06 to 2015–16 . . . . . . . . . . . . . . . . . . . . . . . . . . . . . . . . . . . . . . . . . . . . . . . . . . . . . . . . . . . 17
List of boxesBox 1: Pharmacological management for selected cardiovascular risk factors and diseases . . . 2
Box 2: Pharmaceutical Benefits Scheme . . . . . . . . . . . . . . . . . . . . . . . . . . . . . . . . . . . . . . . . . . . . . . . . 3
Box 3: ATC classification and DDD measurement unit . . . . . . . . . . . . . . . . . . . . . . . . . . . . . . . . . . . . . 4
Box 4: Ezetimibe . . . . . . . . . . . . . . . . . . . . . . . . . . . . . . . . . . . . . . . . . . . . . . . . . . . . . . . . . . . . . . . . . . . . . 9
Box 5: ‘Polypills’ to prevent cardiovascular disease . . . . . . . . . . . . . . . . . . . . . . . . . . . . . . . . . . . . . . 11
Stronger evidence, better decisions, improved health and welfare
Cardiovascular medicines are key elements in preventing and treating cardiovascular disease . This report uses data on supply, general practitioner (GP) prescriptions, use and expenditure to highlight that cardiovascular medicines are most commonly used to help control levels of blood pressure and blood lipids, such as cholesterol .
aihw .gov .au