Embed Size (px)
Citation preview
Medication Adherence in Chronically Ill Veterans: Copayments, Other Potential Barriers, and Health System Factors to
Potentially Mitigate Cost BurdensJohn E. Zeber, PhD MHA
Co-director, Health Outcomes Core
Center for Applied Health Research
Scott & White Healthcare (Temple, TX)
Investigator, Department of Veterans Affairs
Associate Professor, Texas A&M Health Science Center College of
Medicine, Departments of Medicine & Psychiatry
Medication Adherence in Schizophrenia: Impact of
CopaymentsUniversity of Michigan
Department of Psychiatry
Zeber JE, Grazier KL, Valenstein M, Blow FC, Lantz PM (2007), American Journal of Managed Care, 13(6):335-46
Introduction
40-50% of patients with serious mental illness (SMI) are poorly adherent
Severe ramifications & costs (symptom exacerbation, risk of ER, re-admissions, treatment $$)
Widespread issue: Medicaid, managed care, Medicare, VA, other health systems
Intriguing measurement or definition issues
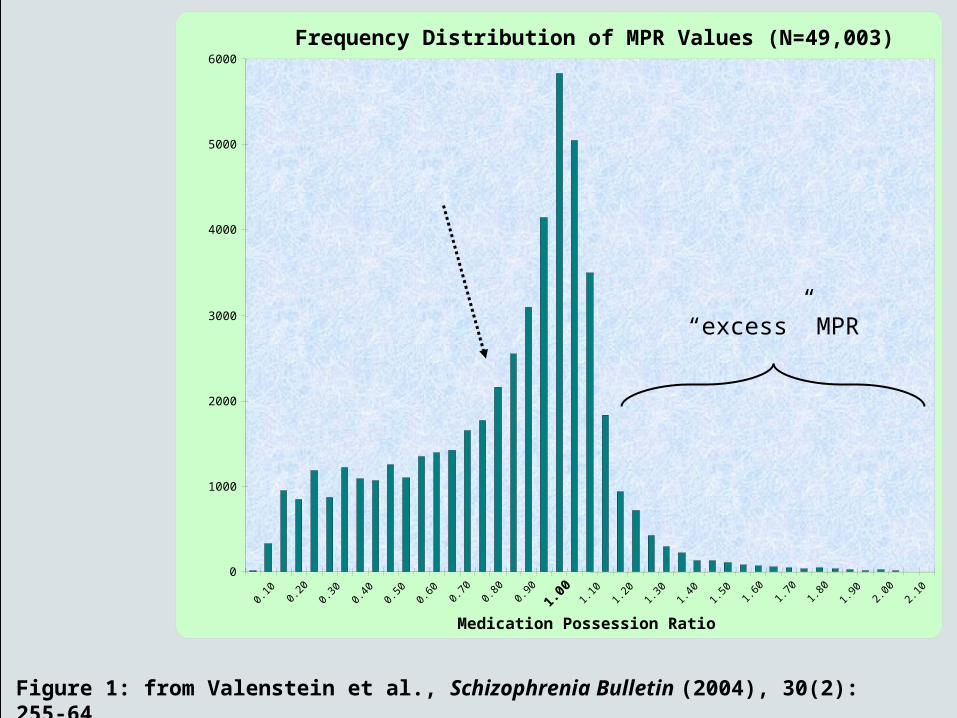
Figure 1: from Valenstein et al., Schizophrenia Bulletin (2004), 30(2): 255-64
Frequency Distribution of MPR Values (N=49,003)
0
1000
2000
3000
4000
5000
6000
0.10 0.
200.
300.
400.
500.
60 0.70
0.80
0.90
1.00 1.
101.
201.
301.
401.
50 1.60
1.70
1.80
1.90 2.
002.
10
Medication Possession Ratio
“excess” MPR
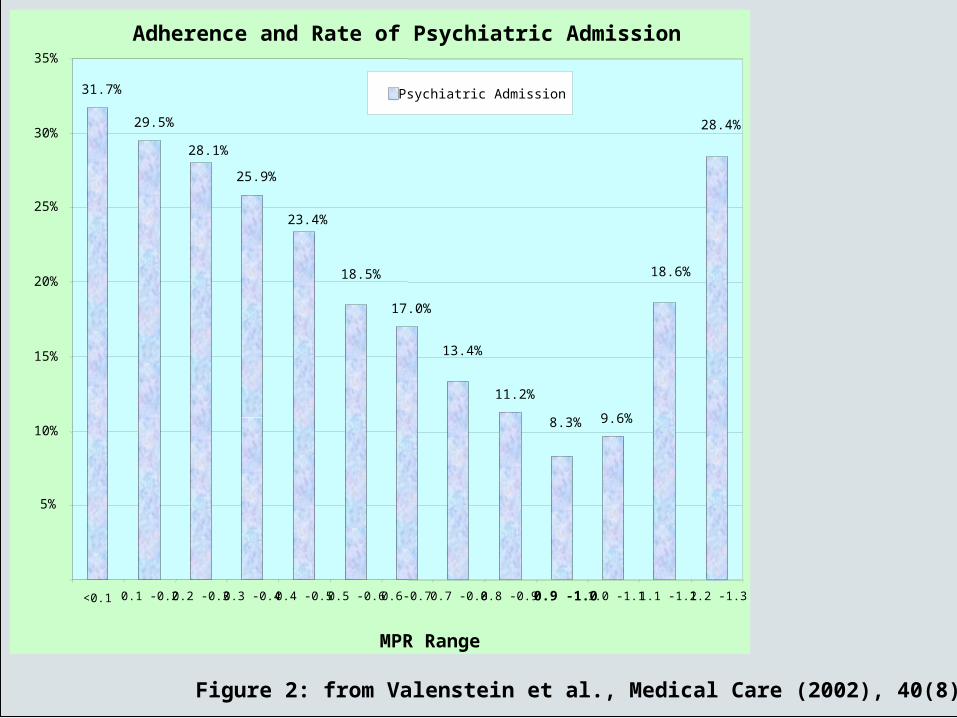
Adherence and Rate of Psychiatric Admission
23.4%
13.4%
18.5%
8.3%
28.4%
18.6%
28.1%
31.7%
29.5%
25.9%
17.0%
11.2%
9.6%
5%
10%
15%
20%
25%
30%
35%
<0.1 0.1 -0.2 0.2 -0.3 0.3 -0.4 0.4 -0.5 0.5 -0.6 0.6-0.7 0.7 -0.8 0.8 -0.9 0.9 -1.0 1.0 -1.1 1.1 -1.2 1.2 -1.3
MPR Range
Psychiatric Admission
Figure 2: from Valenstein et al., Medical Care (2002), 40(8):630-9
Study Background
Rising pharmacy costs (national & VA)
Medication restriction due to cost
Numerous other risk factors (aside from cost)
Variety of medication copayment plans
17-second history of VA copayments
$2 in 1990 $7 in 2002 (now $8 or $9)
Health Services Utilization (outpatient, hospital, ER)
RAND, Group Health (psychiatric), others
Pharmacy Utilization (many studies – few targeting mental health: see Soumerai et al.)
reduced utilization
differential effects of copays / cost-sharing
ethnicity, elderly, sicker patients, lower SES
Effect of Copayments on Utilization
(hint: mostly negative)
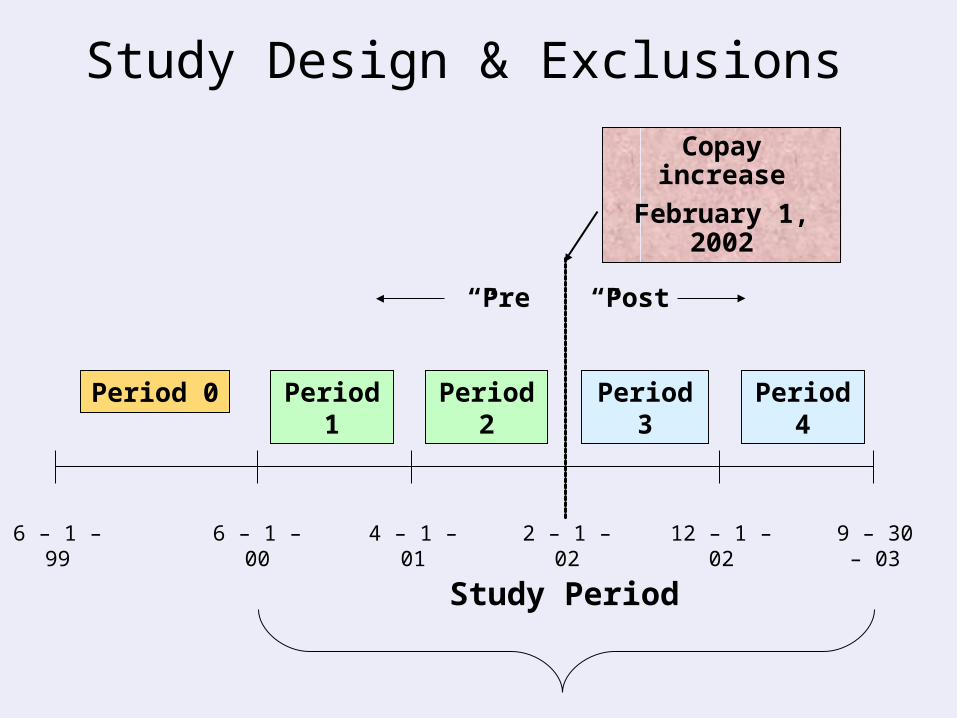
Study Design & Exclusions
Period 0 Period 1 Period 2 Period 3 Period 4
Copay increase
February 1, 2002
6 – 1 – 99 6 – 1 – 00 4 – 1 – 01 2 – 1 – 02 12 – 1 – 02 9 – 30 – 03
Study Period
“Pre” “Post”
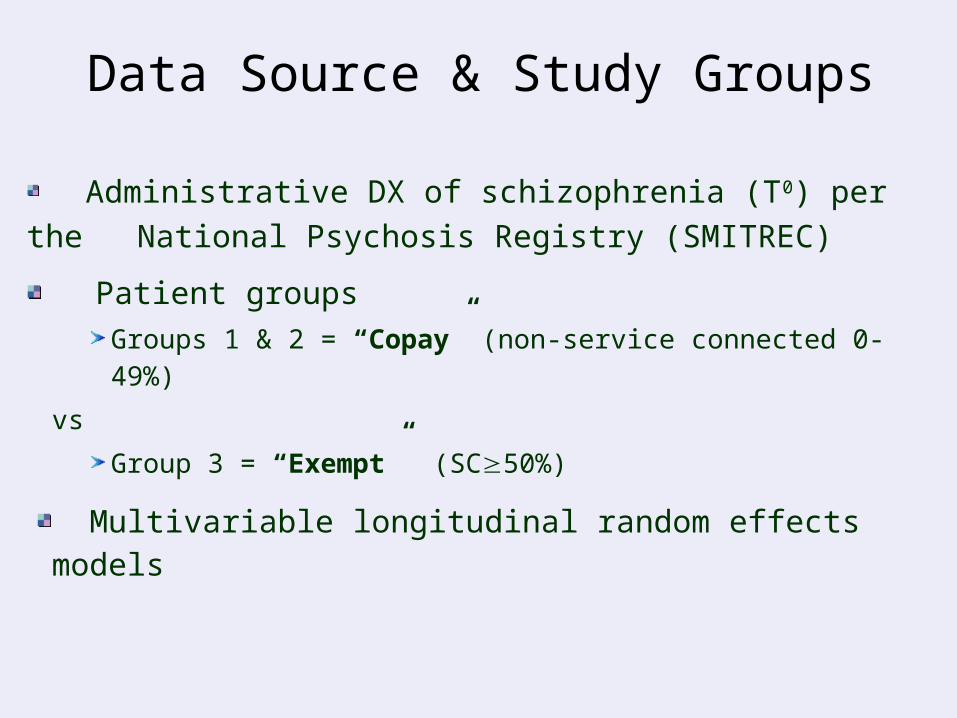
Data Source & Study Groups
Administrative DX of schizophrenia (T0) per the National Psychosis Registry (SMITREC)
Patient groupsGroups 1 & 2 = “Copay” (non-service connected 0-49%)
vs
Group 3 = “Exempt” (SC50%)
Multivariable longitudinal random effects models
Primary Outcomes
Pharmacy utilization (30-day fills)
total, medical, psychiatric
Health Services Utilization
total psychiatric days & total outpatient
visits
Costs from VA perspective
total pharmacy
Results: Descriptive Statistics
final sample = 80,668 ~ 50% “Exempt”
overall means:
age = 52.8; women = 5.3%; minority = 36.8%; # of comorbidites = 1.97
bivariate analysis: (baseline)
Groups 1 & 2 healthier, utilization, less VA tenure
Group 2 somewhat distinct from non-SC Group
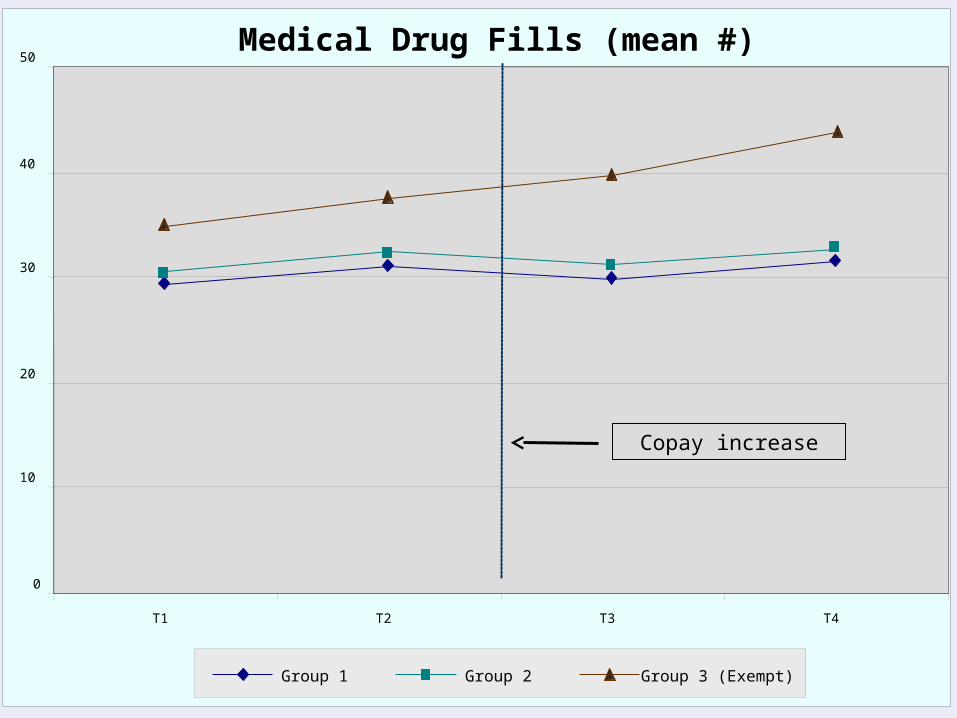
Medical Drug Fills (mean #)
0
10
20
30
40
50
T1 T2 T3 T4
Group 1 Group 2 Group 3 (Exempt)
Copay increase
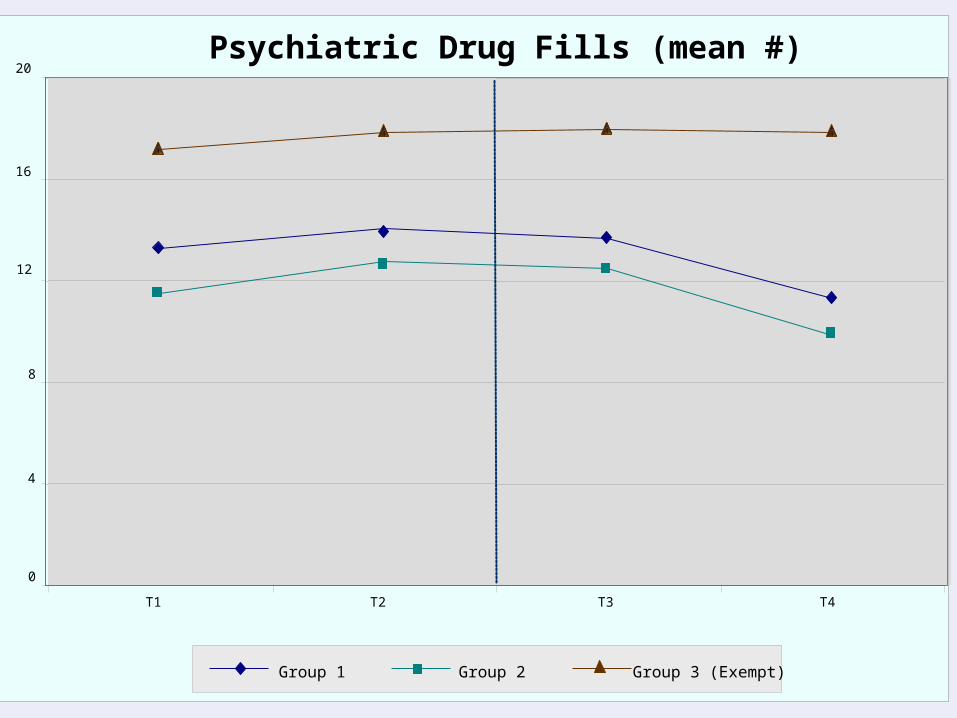
Psychiatric Drug Fills (mean #)
0
4
8
12
16
20
T1 T2 T3 T4
Group 1 Group 2 Group 3 (Exempt)
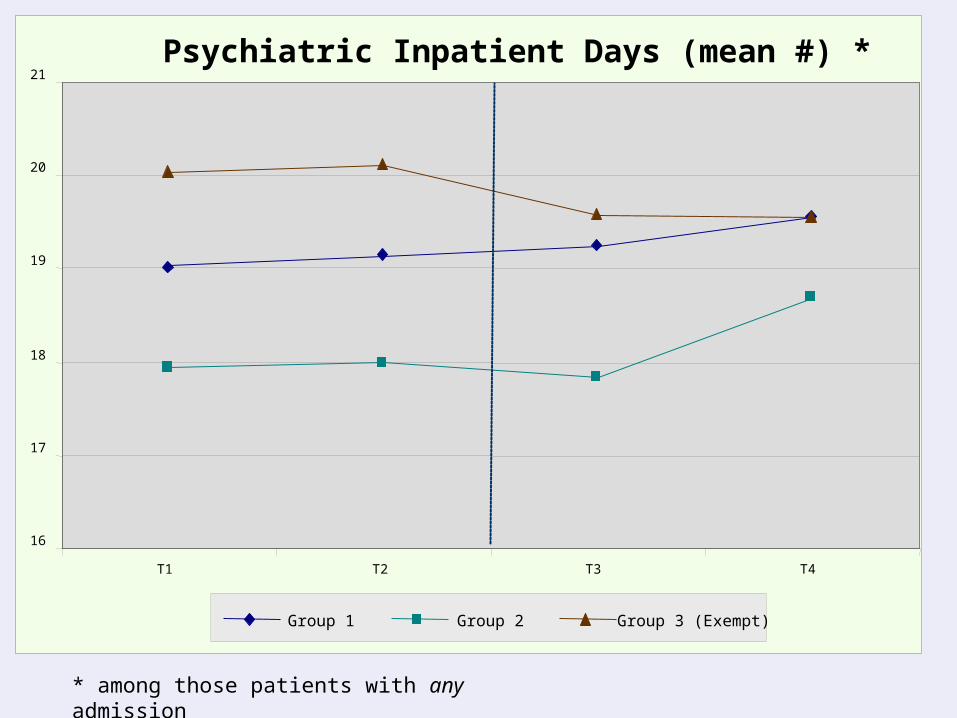
* among those patients with any admission
Psychiatric Inpatient Days (mean #) *
16
17
18
19
20
21
T1 T2 T3 T4
Group 1 Group 2 Group 3 (Exempt)
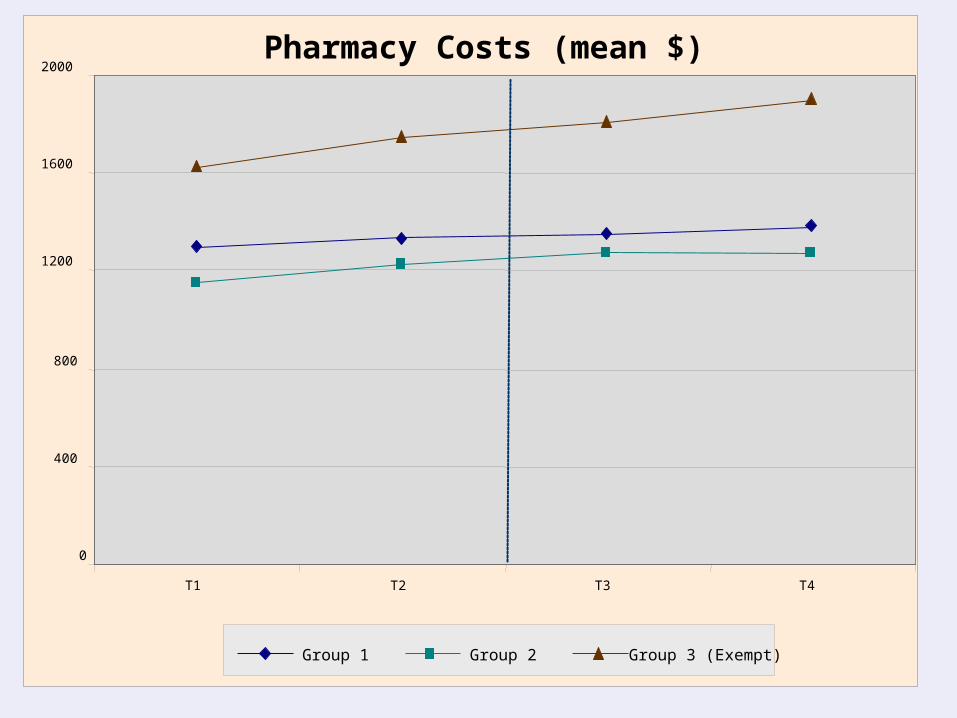
Pharmacy Costs (mean $)
0
400
800
1200
1600
2000
T1 T2 T3 T4
Group 1 Group 2 Group 3 (Exempt)
Discussion Hypotheses & Interpretation of Results
Theoretical Context
Adherence / Utilization: Role of Health Beliefs
Equity Issues & VA mission
VA cost savings, generalizability, limitations
Copayment increase: “Success”?
cost-effectiveness vs. mission vs. philosophy
other cost-sharing options?
Veterans as vulnerable population
unique patients with schizophrenia
other complex medical or psychiatric conditions
Ethnicity, Copayments, and Differential Cost-Related Burdens
Department of Psychiatry
Zeber JE, Copeland LA, Miller AL, Kilbourne AM, Velligan DI. [abstract presented at 2008 ISPOR meeting, Toronto]
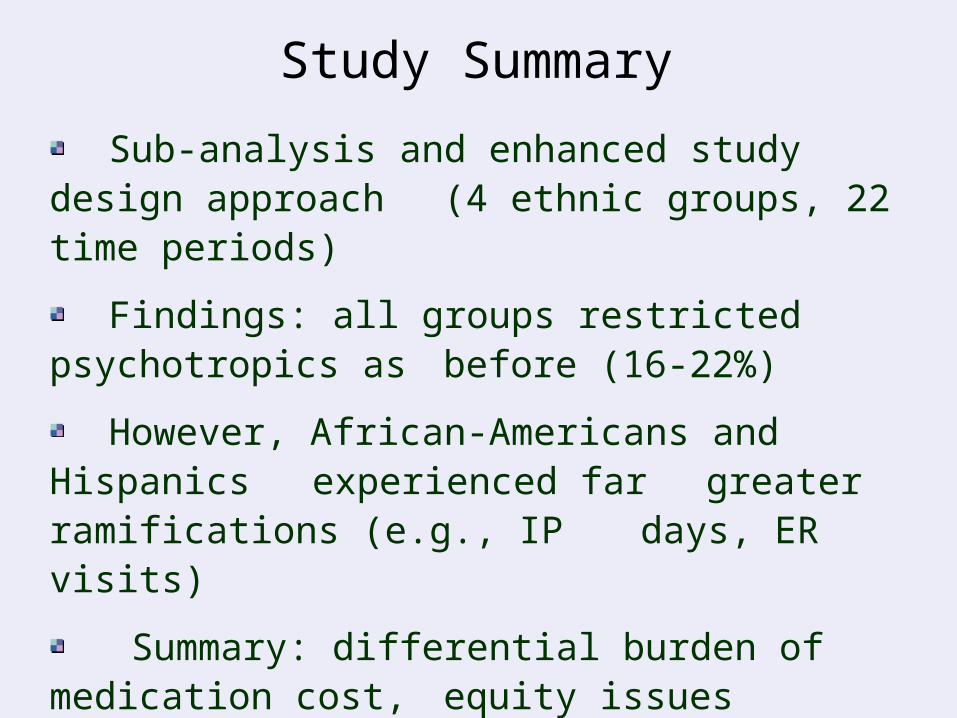
Sub-analysis and enhanced study design approach (4 ethnic groups, 22 time periods)
Findings: all groups restricted psychotropics as before (16-22%)
However, African-Americans and Hispanics experienced far greater ramifications
(e.g., IP days, ER visits)
Summary: differential burden of medication cost, equity issues
Study Summary

A Cost-Benefit Analysis of Changing Pharmacy Benefit
PolicyZeber JE, Leykum L, Valenstein M,
Copeland LA, Miller AL. [abstract to be
presented at the 2009 HSRD meeting and
2011 Mental Health Economic Policy
meeting, Venice, Italy]
Introduction & Objective
little work done in mental health
increasing HSR&D research into the adverse effect of medication copayments
Wang, 2011; Maciejewsky, 2010; Doshi, 2009;
Stroup, 2007
* From the VA’s perspective, what are the
cost-offset policy implications of
copayments, balancing additional
copayment revenue with extra treatment
costs?
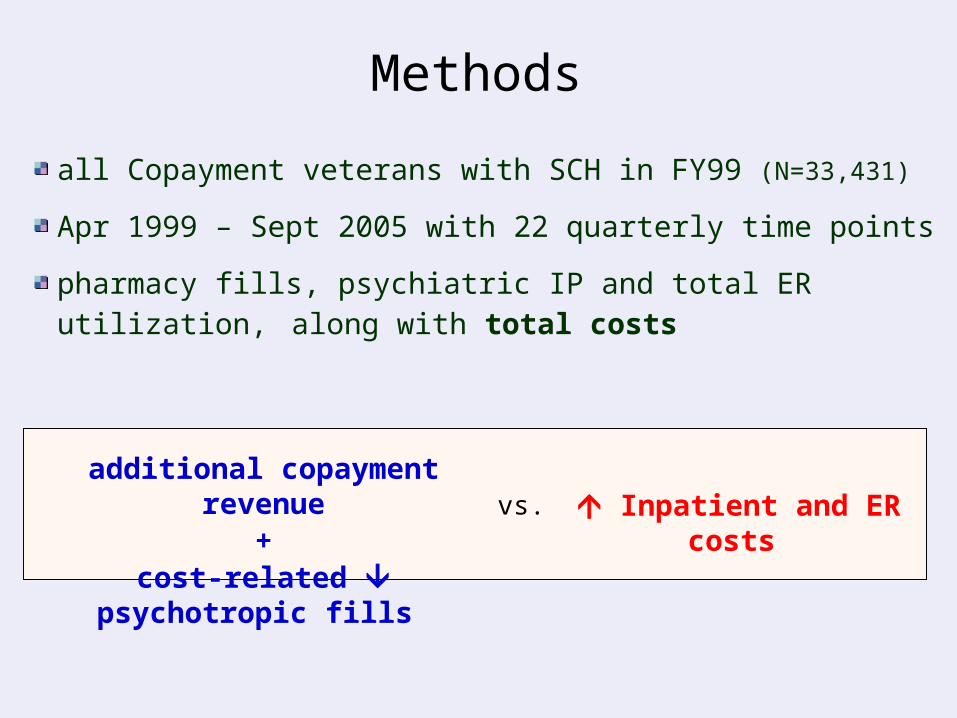
Methods
all Copayment veterans with SCH in FY99 (N=33,431)
Apr 1999 – Sept 2005 with 22 quarterly time points
pharmacy fills, psychiatric IP and total ER utilization, along with total costs
additional copayment revenue+
cost-related psychotropic fills Inpatient and ER costs vs.
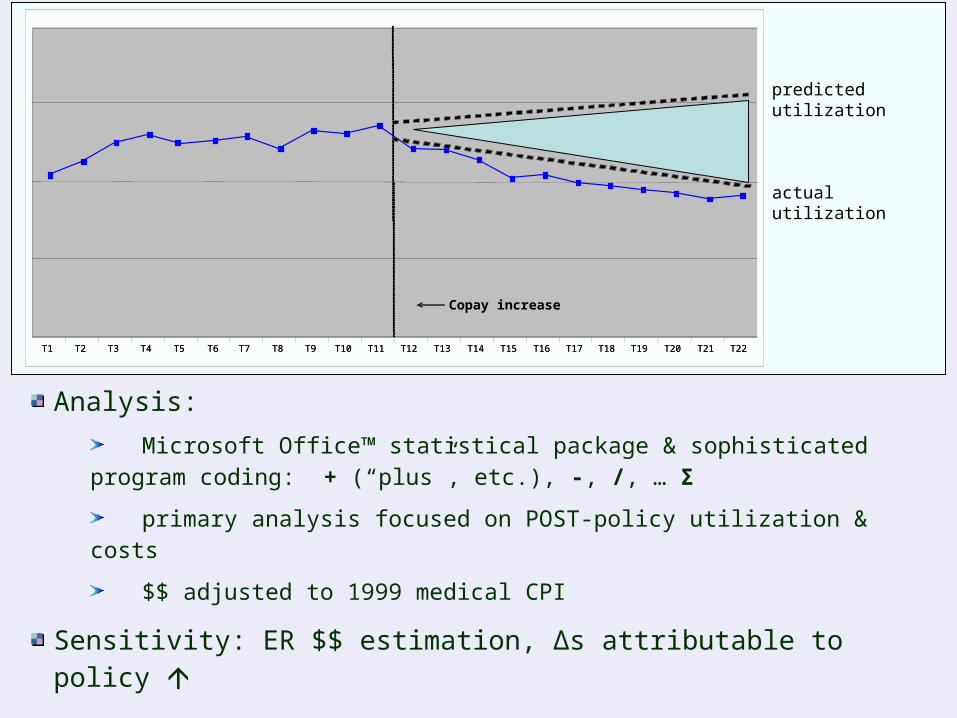
Analysis:
Microsoft Office™ statistical package & sophisticated program coding: + (“plus”, etc.), -, /, … Σ
primary analysis focused on POST-policy utilization & costs
$$ adjusted to 1999 medical CPI
Sensitivity: ER $$ estimation, Δs attributable to policy
T1 T2 T3 T4 T5 T6 T7 T8 T9 T10 T11 T12 T13 T14 T15 T16 T17 T18 T19 T20 T21 T22T1 T2 T3 T4 T5 T6 T7 T8 T9 T10 T11 T12 T13 T14 T15 T16 T17 T18 T19 T20 T21 T22T1 T2 T3 T4 T5 T6 T7 T8 T9 T10 T11 T12 T13 T14 T15 T16 T17 T18 T19 T20 T21 T22
Copay increase
actual utilization
predicted utilization
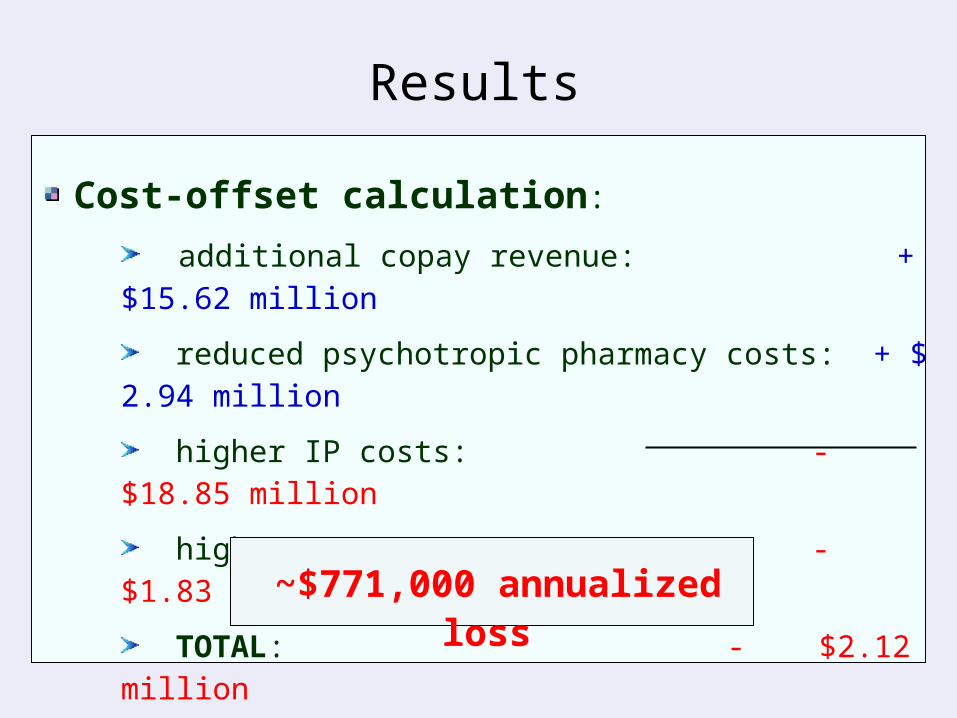
Results
Cost-offset calculation:
additional copay revenue: + $15.62 million
reduced psychotropic pharmacy costs: + $ 2.94 million
higher IP costs: - $18.85 million
higher ER costs: - $1.83 million
TOTAL: - $2.12 million
~$771,000 annualized loss
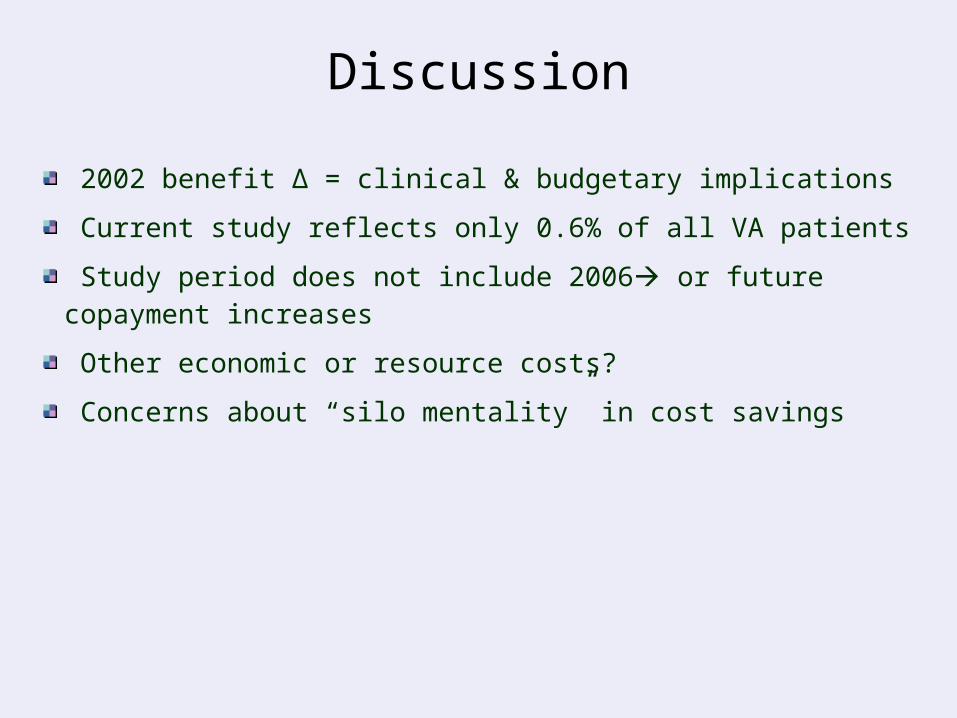
Discussion
2002 benefit Δ = clinical & budgetary implications
Current study reflects only 0.6% of all VA patients
Study period does not include 2006 or future copayment increases
Other economic or resource costs?
Concerns about “silo mentality” in cost savings
Medication Adherence, Ethnicity, and Multiple Psychosocial &
Financial Barriers in Veterans with Bipolar Disorder
Zeber JE, Miller AL, Copeland LA, McCarthy JF, Zivin K, Valenstein M, Greenwald D, Kilbourne AM. Administration & Policy in Mental Health / Mental Health Services Research (2011).
subtitle: “A young(ish) researcher’s slow but
inexorable journey towards self-realization”
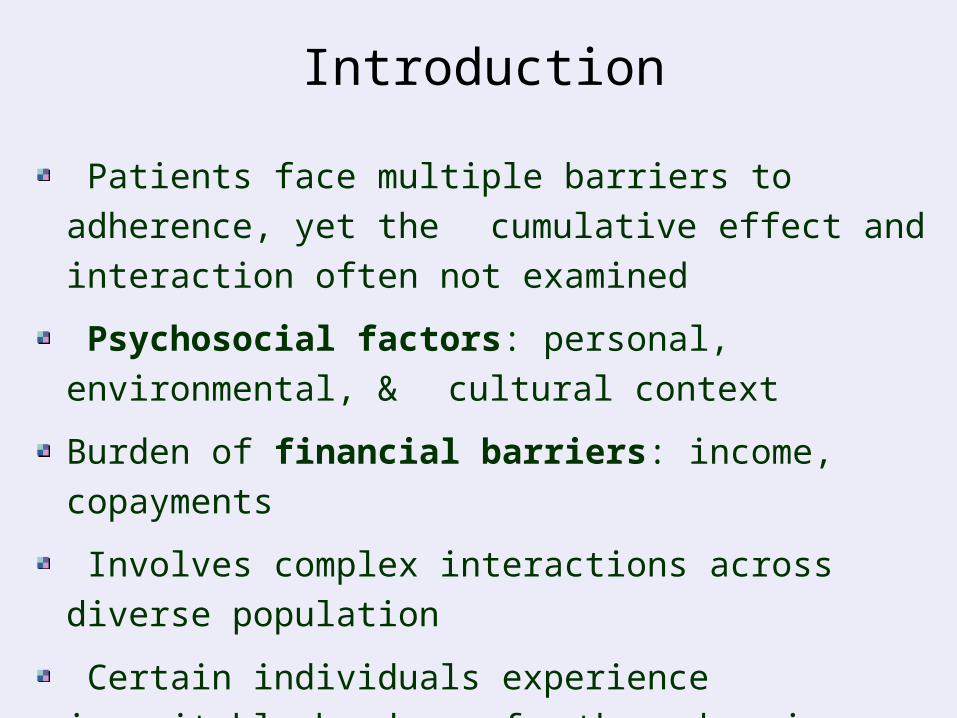
Patients face multiple barriers to adherence, yet the cumulative effect and interaction often not examined
Psychosocial factors: personal, environmental, & cultural context
Burden of financial barriers: income, copayments
Involves complex interactions across diverse population
Certain individuals experience inequitable burdens of these barriers: elderly, multiple conditions, minorities
Introduction
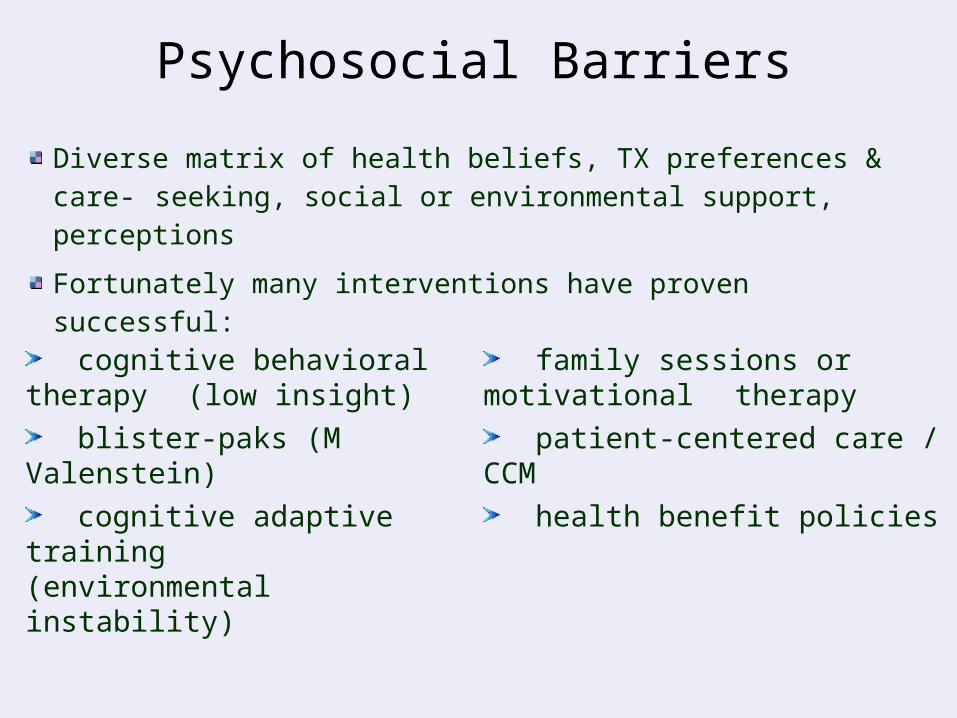
Psychosocial Barriers
Diverse matrix of health beliefs, TX preferences & care-seeking, social or environmental support, perceptions
Fortunately many interventions have proven successful:
cognitive behavioral therapy (low insight)
blister-paks (M Valenstein)
cognitive adaptive training (environmental instability)
family sessions or motivational therapy
patient-centered care / CCM
health benefit policies
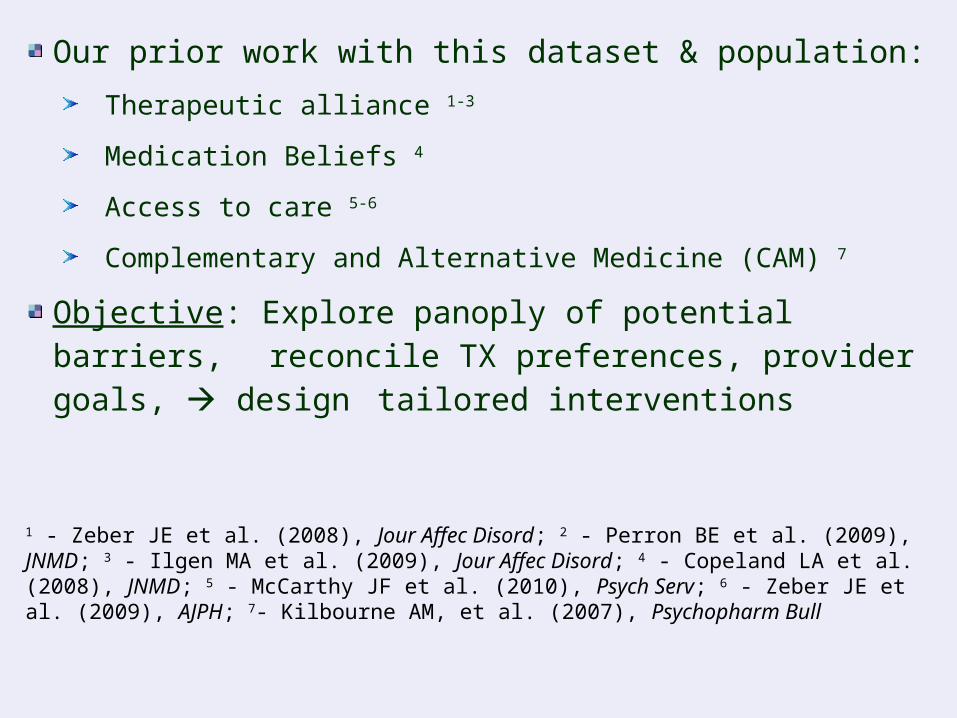
Our prior work with this dataset & population:
Therapeutic alliance 1-3
Medication Beliefs 4
Access to care 5-6
Complementary and Alternative Medicine (CAM) 7
Objective: Explore panoply of potential barriers, reconcile TX preferences, provider goals, design tailored interventions
1 - Zeber JE et al. (2008), Jour Affec Disord; 2 - Perron BE et al. (2009), JNMD; 3 - Ilgen MA et al. (2009), Jour Affec Disord; 4 - Copeland LA et al. (2008), JNMD; 5 - McCarthy JF et al. (2010), Psych Serv; 6 - Zeber JE et al. (2009), AJPH; 7- Kilbourne AM, et al. (2007), Psychopharm Bull
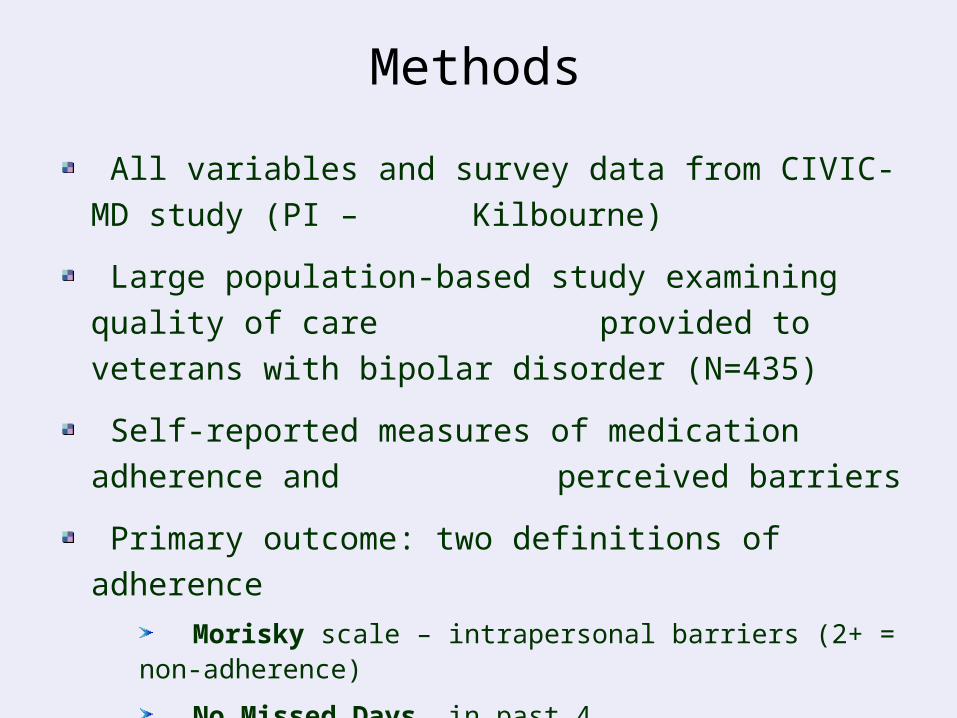
All variables and survey data from CIVIC-MD study (PI – Kilbourne)
Large population-based study examining quality of care provided to veterans with bipolar disorder (N=435)
Self-reported measures of medication adherence and perceived barriers
Primary outcome: two definitions of adherence
Morisky scale – intrapersonal barriers (2+ = non-adherence)
No Missed Days, in past 4
Methods
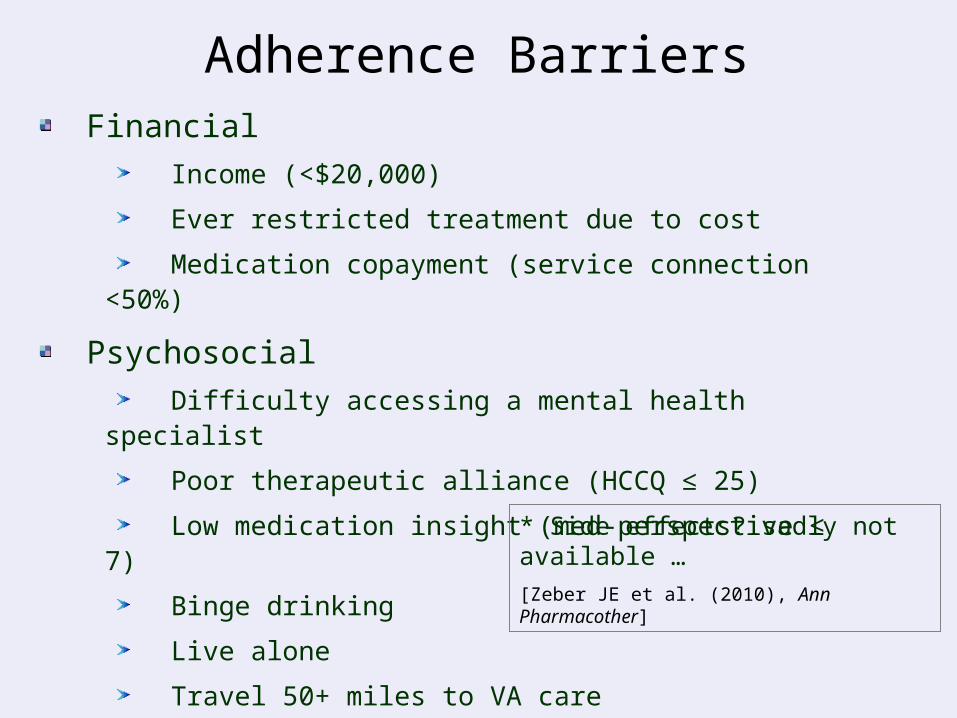
Financial Income (<$20,000)
Ever restricted treatment due to cost
Medication copayment (service connection <50%)
Psychosocial Difficulty accessing a mental health specialist
Poor therapeutic alliance (HCCQ ≤ 25)
Low medication insight (med-perspective ≤ 7)
Binge drinking
Live alone
Travel 50+ miles to VA care
Adherence Barriers
* Side effects? sadly not available …
[Zeber JE et al. (2010), Ann Pharmacother]
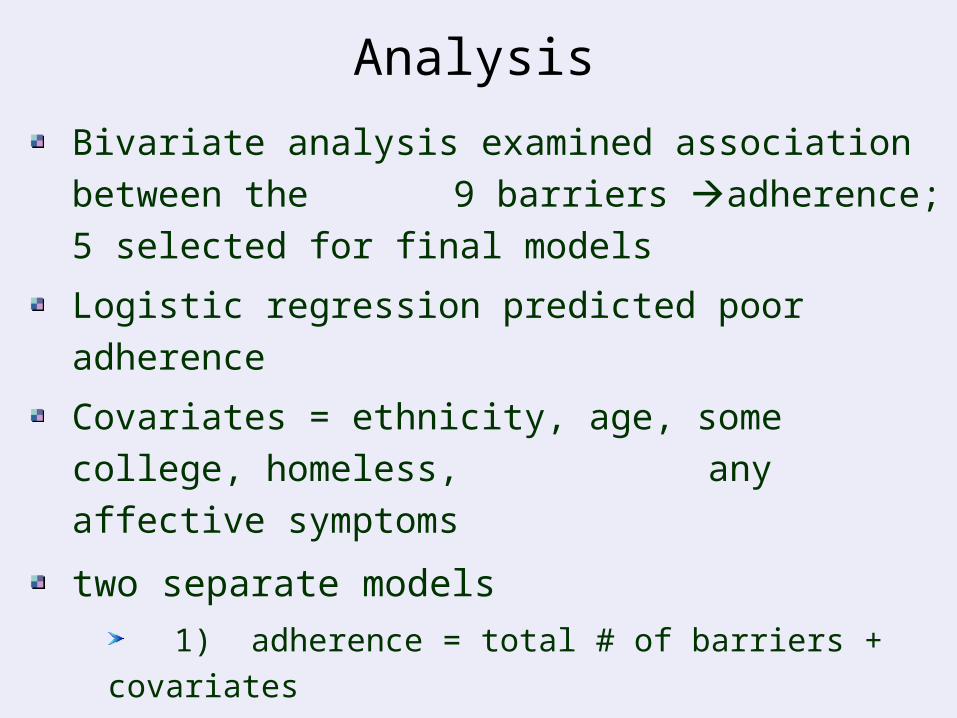
Bivariate analysis examined association between the 9 barriers adherence; 5 selected for final models
Logistic regression predicted poor adherence
Covariates = ethnicity, age, some college, homeless, any affective symptoms
two separate models
1) adherence = total # of barriers + covariates
2) adherence = barrier1 + …barrier5 +
covariates
Analysis
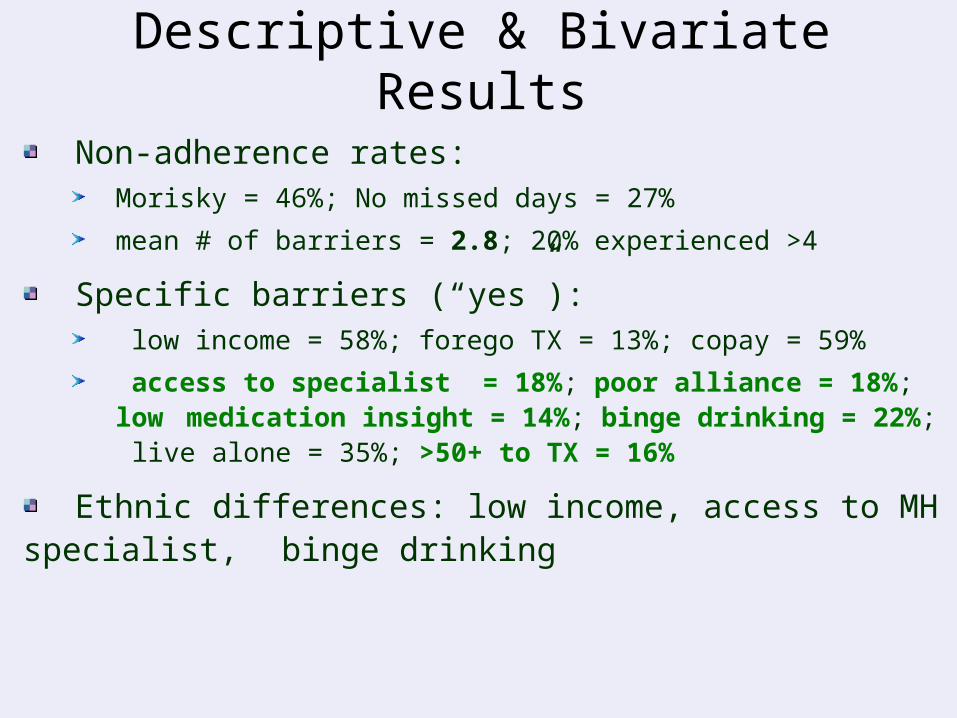
Non-adherence rates:Morisky = 46%; No missed days = 27%
mean # of barriers = 2.8; 20% experienced >4
Specific barriers (“yes”): low income = 58%; forego TX = 13%; copay = 59%
access to specialist = 18%; poor alliance = 18%; low medication insight = 14%; binge drinking = 22%;
live alone = 35%; >50+ to TX = 16%
Ethnic differences: low income, access to MH specialist, binge drinking
Descriptive & Bivariate Results
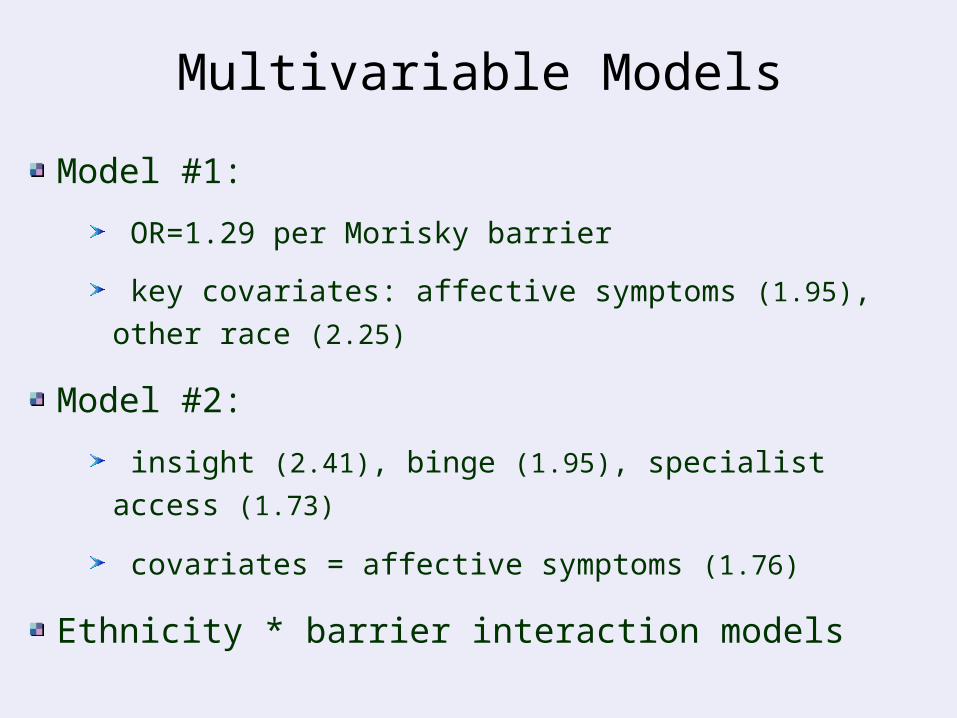
Model #1:
OR=1.29 per Morisky barrier
key covariates: affective symptoms (1.95), other race (2.25)
Model #2:
insight (2.41), binge (1.95), specialist access (1.73)
covariates = affective symptoms (1.76)
Ethnicity * barrier interaction models
Multivariable Models
Discussion
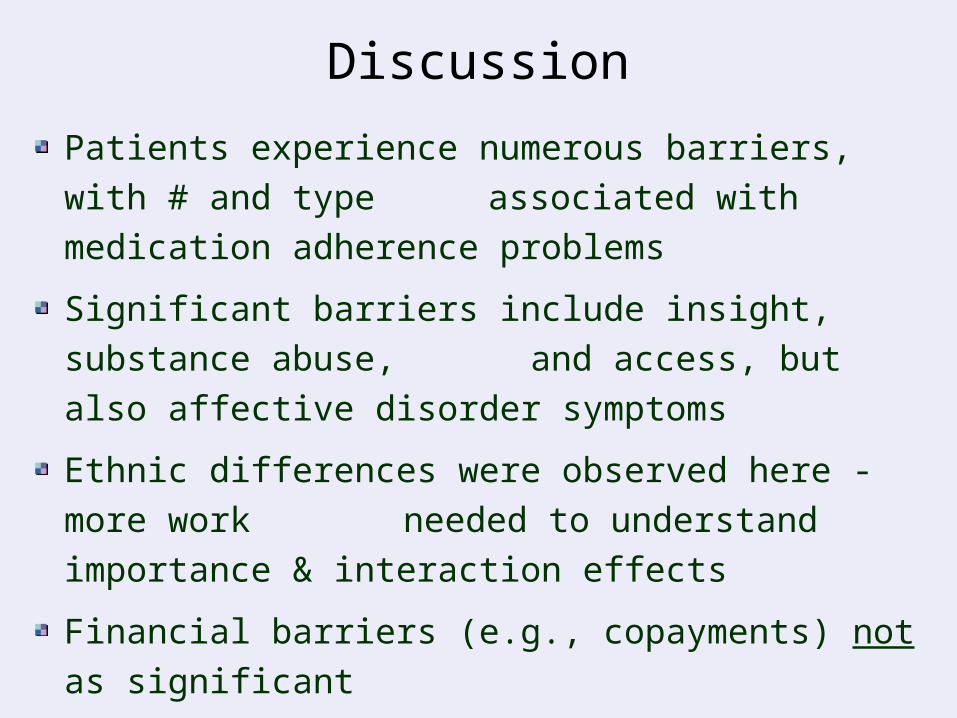
Patients experience numerous barriers, with # and type associated with medication adherence problems
Significant barriers include insight, substance abuse, and access, but also affective disorder symptoms
Ethnic differences were observed here - more work needed to understand importance & interaction effects
Financial barriers (e.g., copayments) not as significant
Results support designing tailored interventions to improve adherence, recognizing patient-level burdens
Medication Adherence in Patients with Chronic Illnesses: The Role of
Provider and Organizational Factors
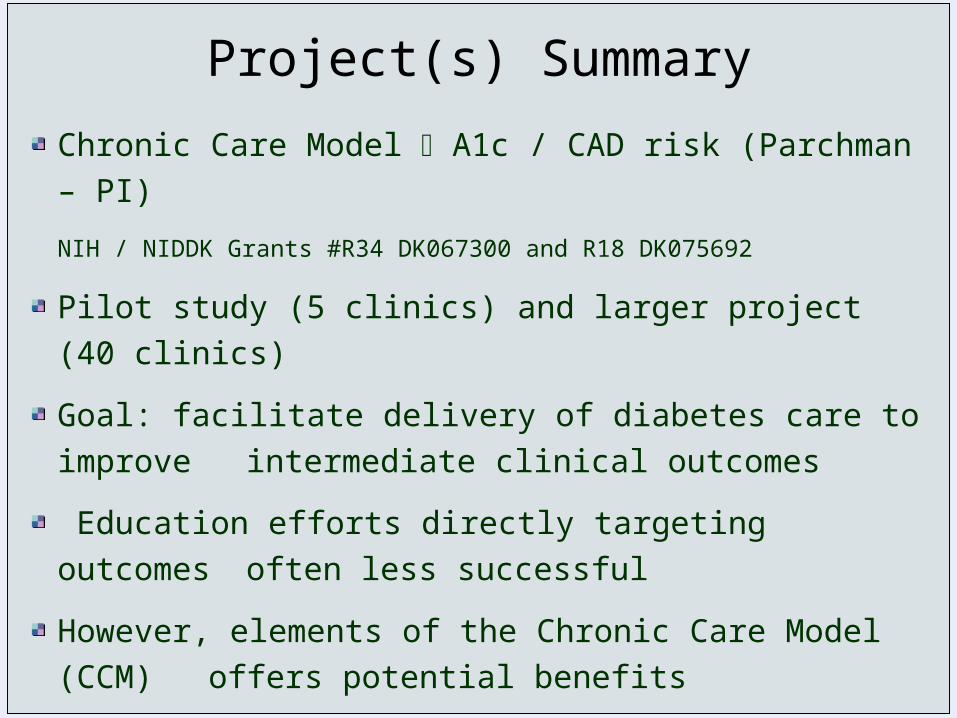
Chronic Care Model A1c / CAD risk (Parchman – PI)
NIH / NIDDK Grants #R34 DK067300 and R18 DK075692
Pilot study (5 clinics) and larger project (40 clinics)
Goal: facilitate delivery of diabetes care to improve intermediate clinical outcomes
Education efforts directly targeting outcomes often less successful
However, elements of the Chronic Care Model (CCM) offers potential benefits
Project(s) Summary
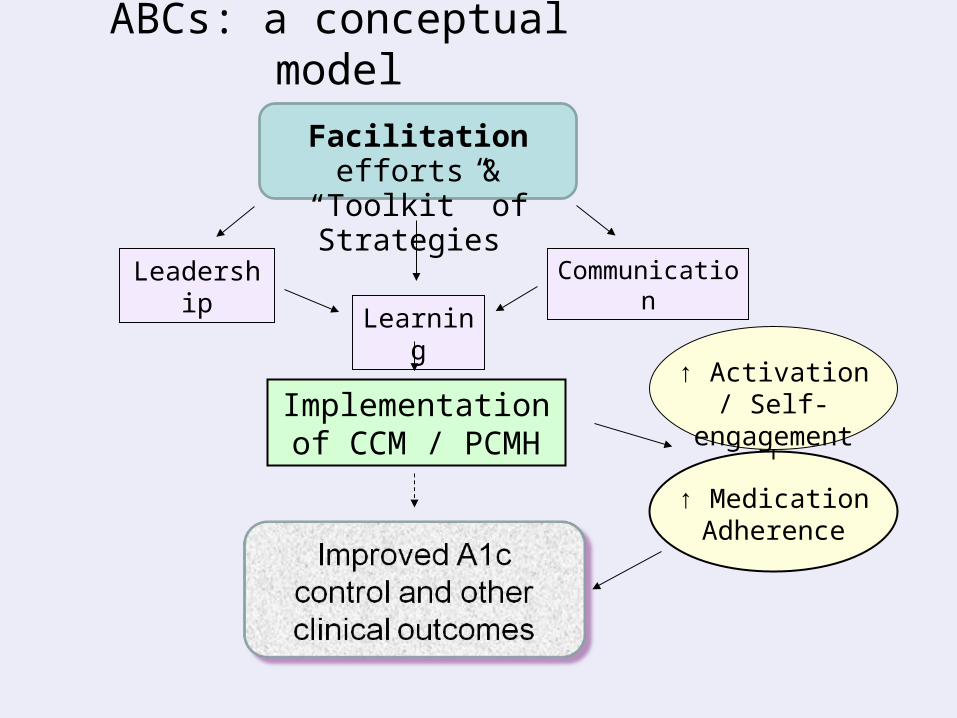
ABCs: a conceptual model
↑ Activation / Self-engagement
Leadership Communication
Learning
Implementation of CCM / PCMH
Facilitation efforts & “Toolkit” of Strategies
↑ Medication Adherence
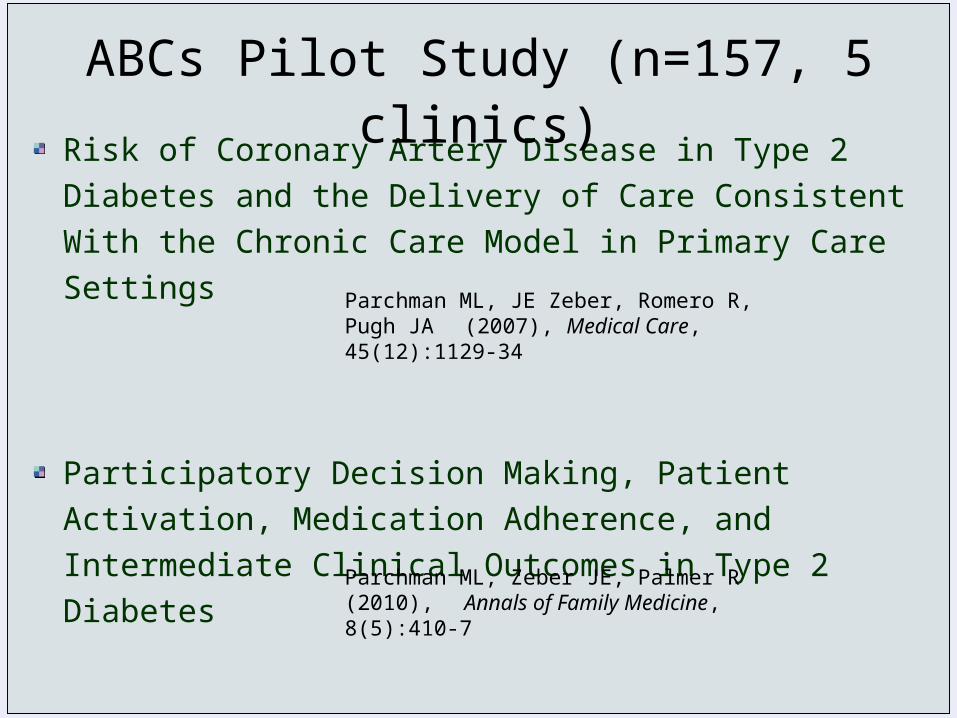
Risk of Coronary Artery Disease in Type 2 Diabetes and the Delivery of Care Consistent With the Chronic Care Model in Primary Care Settings
Participatory Decision Making, Patient Activation, Medication Adherence, and Intermediate Clinical Outcomes in Type 2 Diabetes
ABCs Pilot Study (n=157, 5 clinics)
Parchman ML, JE Zeber, Romero R, Pugh JA (2007), Medical Care, 45(12):1129-34
Parchman ML, Zeber JE, Palmer R (2010), Annals of Family Medicine, 8(5):410-7
Participatory Decision Making, Therapeutic Alliance, Perceived Drug Costs & Clinical Outcomes in Diabetes
Therapeutic Alliance and Adherence
Zeber JE at al. [abstract presented at 2009 HSR&D meeting]
Objective: Examine association between dimensions of the therapeutic alliance, perceived drug costs, and medication adherence
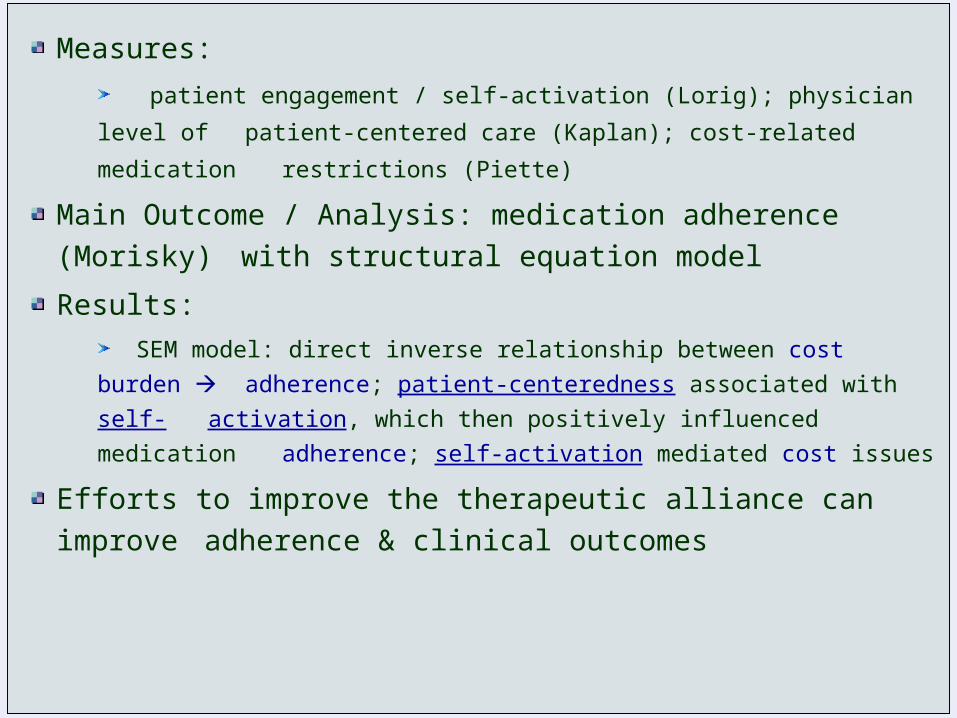
Measures:
patient engagement / self-activation (Lorig); physician level of
patient-centered care (Kaplan); cost-related medication
restrictions (Piette)
Main Outcome / Analysis: medication adherence (Morisky) with structural equation model
Results:
SEM model: direct inverse relationship between cost burden
adherence; patient-centeredness associated with self-
activation, which then positively influenced medication
adherence; self-activation mediated cost issues
Efforts to improve the therapeutic alliance can improve adherence & clinical outcomes
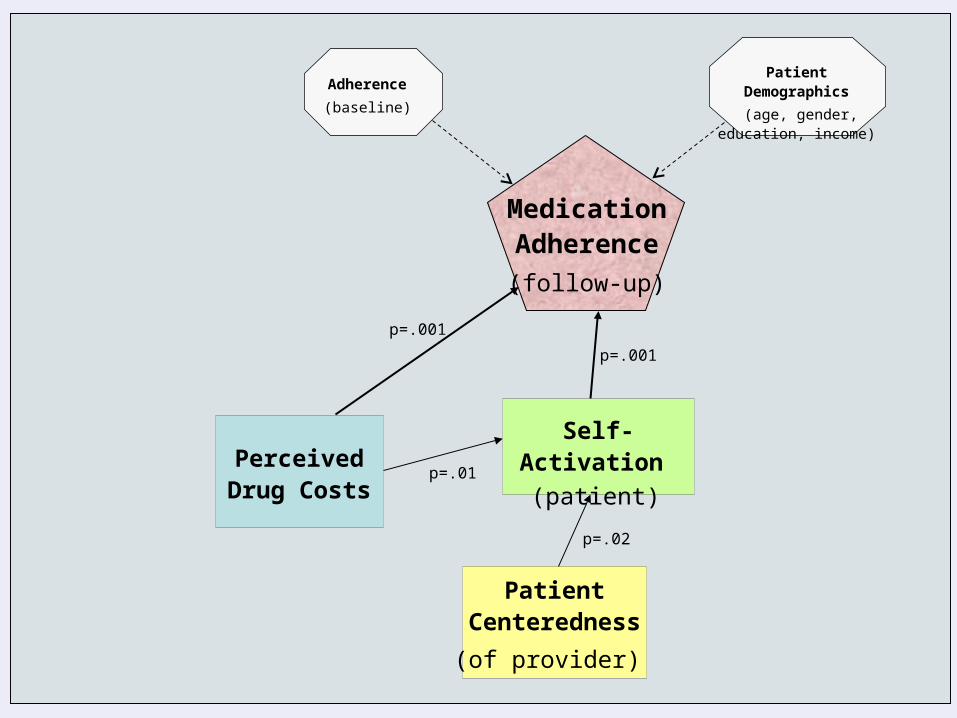
Perceived Drug Costs
Self-Activation
(patient)
Patient Centeredness
(of provider)
Patient Demographics
(age, gender, education, income)
Adherence
(baseline)
Medication Adherence
(follow-up)
p=.001
p=.001
p=.02
p=.01
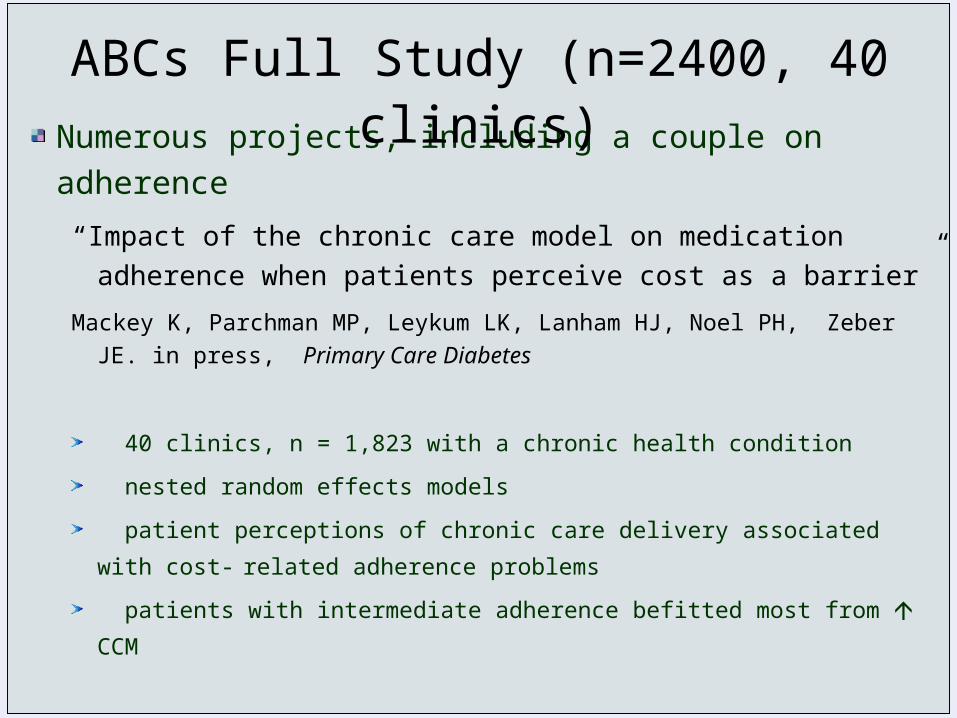
Numerous projects, including a couple on adherence
“Impact of the chronic care model on medication adherence when patients perceive cost as a barrier”
Mackey K, Parchman MP, Leykum LK, Lanham HJ, Noel PH, Zeber JE. in press, Primary Care Diabetes
40 clinics, n = 1,823 with a chronic health condition
nested random effects models
patient perceptions of chronic care delivery associated with
cost-related adherence problems
patients with intermediate adherence befitted most from CCM
ABCs Full Study (n=2400, 40 clinics)
Cost-Related Medication Adherence and Patients’
Experience with the Chronic Care Model
Zeber JE et al. [abstract presented at 2010 Academy Health meeting; manuscript in preparation]
“The communication and
coordination of scattered
fragments of knowledge is
perhaps the basic problem of
any society.” - Thomas
Sowell
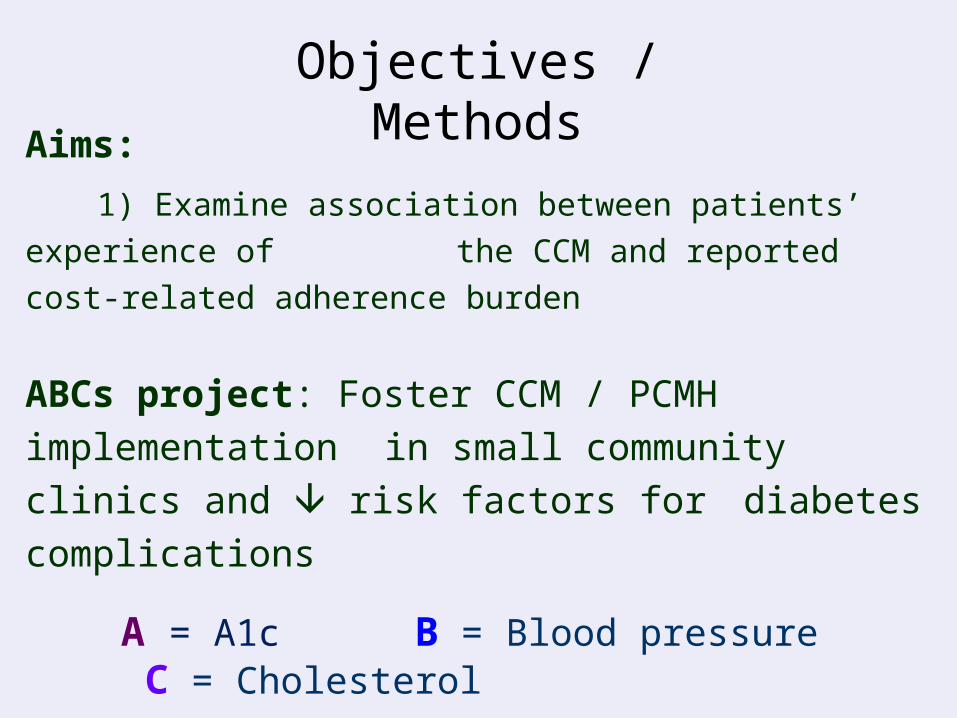
Objectives / MethodsAims:
1) Examine association between patients’
experience of the CCM and reported cost-
related adherence burden
ABCs project: Foster CCM / PCMH implementation in small community clinics and risk factors for diabetes complications
A = A1c B = Blood pressure C = Cholesterol
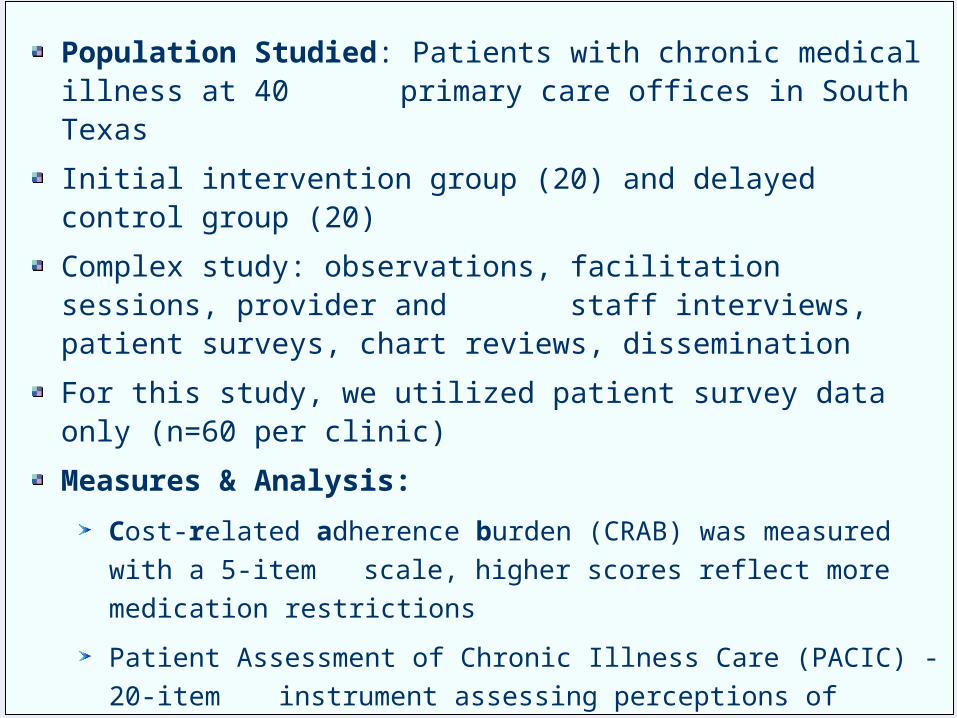
Population Studied: Patients with chronic medical illness at 40 primary care offices in South Texas
Initial intervention group (20) and delayed control group (20)
Complex study: observations, facilitation sessions, provider and staff interviews, patient surveys, chart reviews, dissemination
For this study, we utilized patient survey data only (n=60 per clinic)
Measures & Analysis:
Cost-related adherence burden (CRAB) was measured with a 5-item scale, higher scores reflect more medication restrictions
Patient Assessment of Chronic Illness Care (PACIC) - 20-item instrument assessing perceptions of primary care
treatment; higher values = care more consistent with CCM
Random effects models controlled patient nesting, demographics
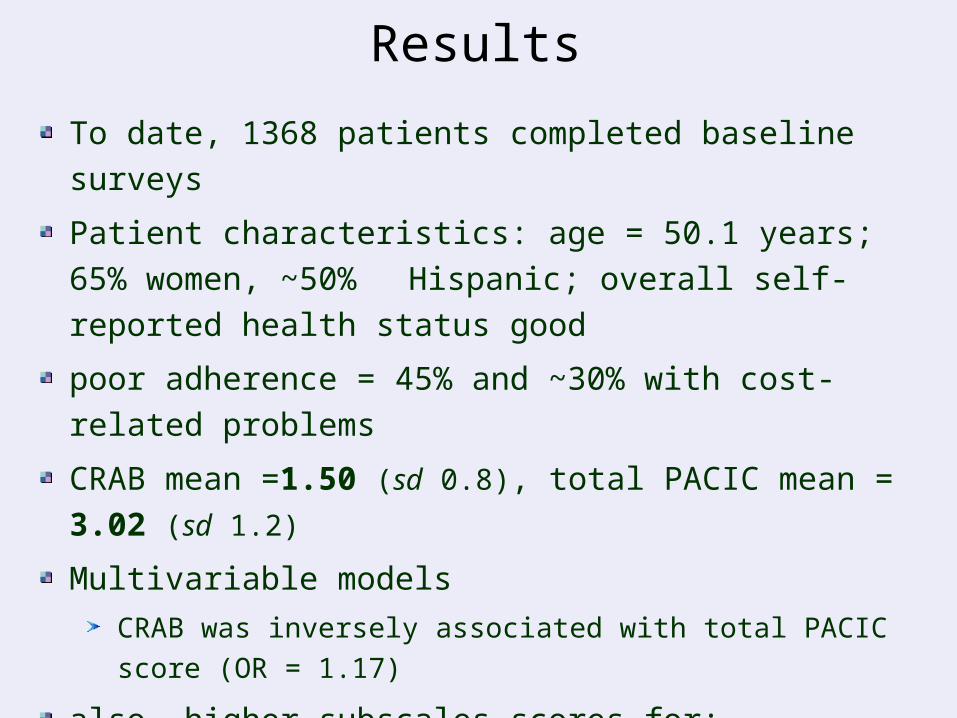
Results
To date, 1368 patients completed baseline surveys
Patient characteristics: age = 50.1 years; 65% women, ~50% Hispanic; overall self-reported health status good
poor adherence = 45% and ~30% with cost-related problems
CRAB mean =1.50 (sd 0.8), total PACIC mean = 3.02 (sd 1.2)
Multivariable models
CRAB was inversely associated with total PACIC score (OR = 1.17)
also, higher subscales scores for:
patient activation (OR = 1.28), problem solving (OR = 1.16), and practice design (OR = 1.26)
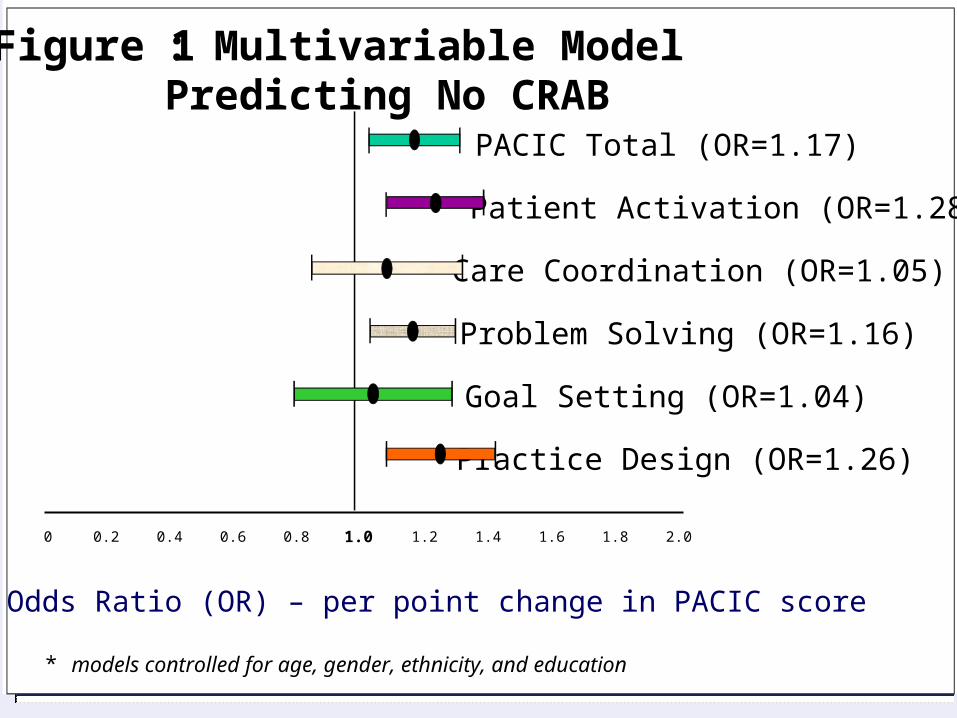
Figure 1: Multivariable Model Predicting No CRAB
Odds Ratio (OR) – per point change in PACIC score
0 0.2 0.4 0.6 0.8 1.0 1.2 1.4 1.6 1.8 2.0
PACIC Total (OR=1.17)
Patient Activation (OR=1.28)
Problem Solving (OR=1.16)
Goal Setting (OR=1.04)
Care Coordination (OR=1.05)
Practice Design (OR=1.26)
* models controlled for age, gender, ethnicity, and education
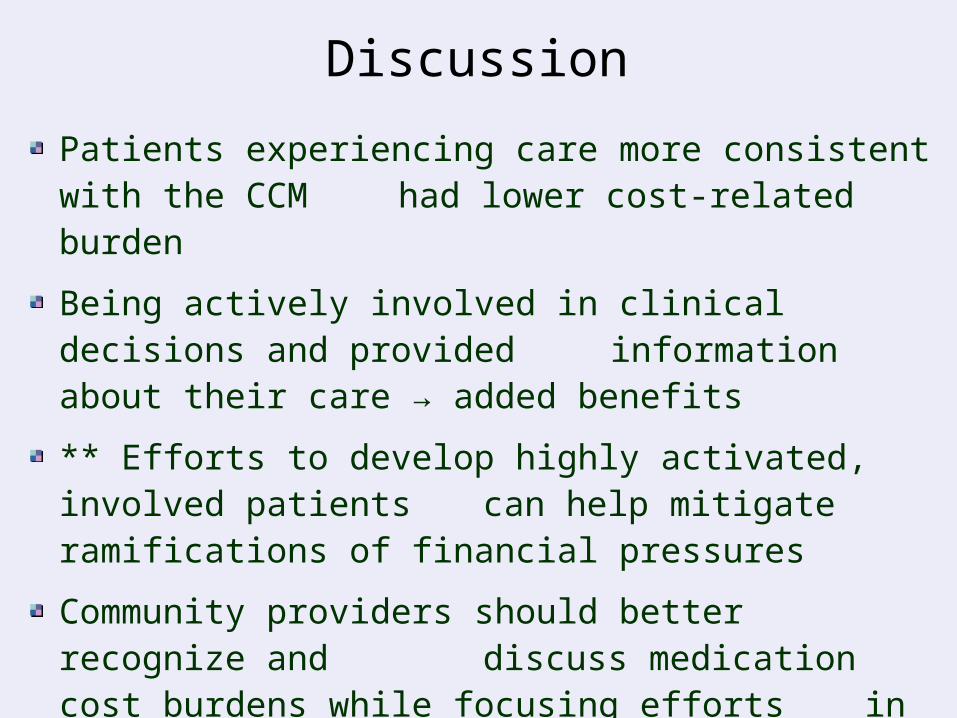
Discussion
Patients experiencing care more consistent with the CCM had lower cost-related burden
Being actively involved in clinical decisions and provided information about their care → added benefits
** Efforts to develop highly activated, involved patients can help mitigate ramifications of financial pressures
Community providers should better recognize and discuss medication cost burdens while focusing efforts in accordance with chronic care treatment delivery
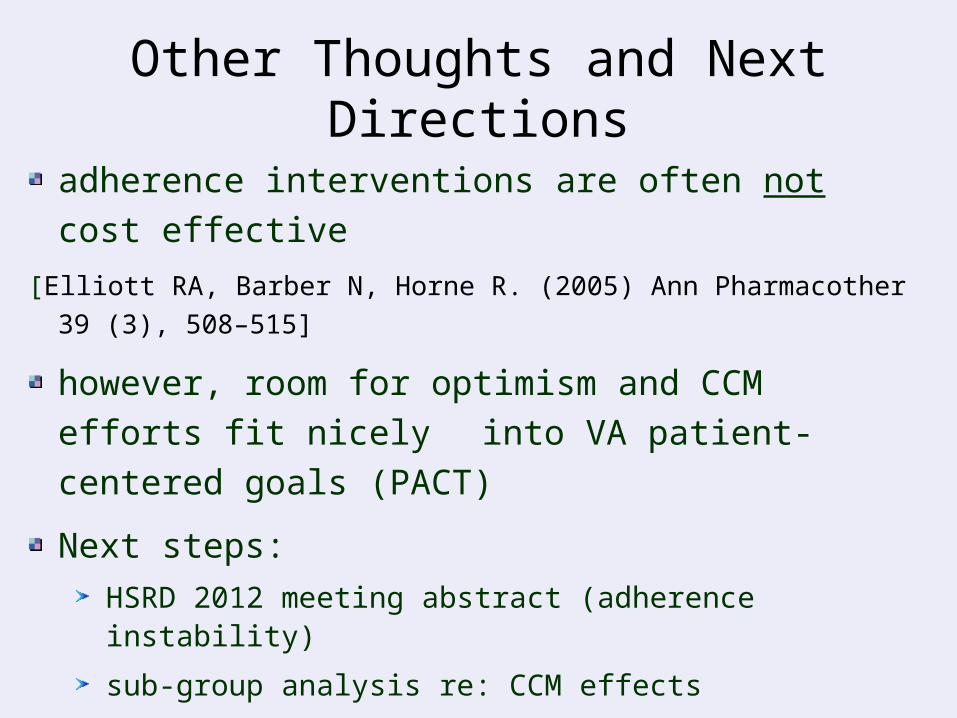
adherence interventions are often not cost effective
[Elliott RA, Barber N, Horne R. (2005) Ann Pharmacother 39 (3), 508–515]
however, room for optimism and CCM efforts fit nicely into VA patient-centered goals (PACT)
Next steps: HSRD 2012 meeting abstract (adherence instability)
sub-group analysis re: CCM effects
merit grant of modern technologies (cell phones)
data from Learn & Relate study (J Pugh – PI)
potential use of HMORN data for cross-system analysis
Other Thoughts and Next Directions
![BURDENS OF PROOF AND QUALIFIED IMMUNITY€¦ · 2012] Burdens of Proof and Qualified Immunity 137 A. Burdens of Proof The first observation that must be made when discussing burdens](https://img.pdfslide.us/doc/110x75/5b408ec47f8b9a2f138d5242/burdens-of-proof-and-qualified-2012-burdens-of-proof-and-qualified-immunity.jpg)