Embed Size (px)
Citation preview
NBER WORKING PAPER SERIES
MEDICARE PART D AND ITS EFFECT ON THE USE OF PRESCRIPTION DRUGS,USE OF OTHER HEALTH CARE SERVICES AND HEALTH OF THE ELDERLY
Robert KaestnerNasreen Khan
Working Paper 16011http://www.nber.org/papers/w16011
NATIONAL BUREAU OF ECONOMIC RESEARCH1050 Massachusetts Avenue
Cambridge, MA 02138May 2010
The views expressed herein are those of the authors and do not necessarily reflect the views of theNational Bureau of Economic Research.
NBER working papers are circulated for discussion and comment purposes. They have not been peer-reviewed or been subject to the review by the NBER Board of Directors that accompanies officialNBER publications.
© 2010 by Robert Kaestner and Nasreen Khan. All rights reserved. Short sections of text, not to exceedtwo paragraphs, may be quoted without explicit permission provided that full credit, including © notice,is given to the source.
Medicare Part D and its Effect on the Use of Prescription Drugs, Use of Other Health CareServices and Health of the ElderlyRobert Kaestner and Nasreen KhanNBER Working Paper No. 16011May 2010, Revised December 2010JEL No. I12,I18,J14
ABSTRACT
We examine the effect of gaining prescription drug insurance as a result of Medicare Part D on useof prescription drugs, use of other medical services, and health for a nationally representative sampleof Medicare beneficiaries. Given the heightened importance of prescription drugs for those with chronicillness, we provide separate estimates for those in poorer health. We find that gaining prescriptiondrug insurance through Medicare Part D was associated with a 70% increase in the number of annualprescriptions, but that obtaining prescription drug insurance is not significantly related to use of otherhealth care services or health, as measured by functional status and self-reported health. Among thosein poorer health, we find that gaining prescription drug insurance was associated with a 60% increasein the number of annual prescriptions, and is not significantly related to use of other services or health.
Robert KaestnerInstitute of Government and Public AffairsUniversity of Illinois815 West Van Buren Street, Suite 525Chicago, IL 60607and [email protected]
Nasreen KhanUniversity of New MexicoAlbuquerque, NM [email protected]
1
Introduction
The Medicare Modernization Act of 2003 (MMA) created a prescription drug benefit—Medicare
Part D—for the elderly. The creation of Medicare Part D was motivated by the relatively large fraction of
elderly without prescription drug coverage, the growing financial burden of prescription drug spending
among the elderly, and the significant and growing clinical importance of prescription drugs. Around the
time of passage of the MMA, approximately one-third of seniors did not have prescription drug insurance
(see Table 1 in text; Khan and Kaestner 2009; Levy and Weir 2009). The lack of prescription drug
coverage resulted in substantial out-of-pocket spending on prescription drugs; among the elderly without
prescription drug insurance, 50% had annual out-of-pocket spending on prescription drugs of $1,200 or
more in 2003 (Safran et al. 2005).1 Considering that median income of the elderly at this time was
approximately $16,000, out-of-pocket spending for prescription drugs represented a significant financial
burden for a non-trivial share of the elderly population.2 The financial burden was particularly large for
those with low-incomes, and elderly persons with chronic diseases for which prescription drugs are
essential to maintaining good health.
The financial uncertainty associated with the use of prescription drugs to treat illness suggests
that Medicare Part D is likely to have had significant benefits for those without prescription drug
insurance prior to Part D. In addition to the financial (insurance) benefits, Medicare Part D may have had
significant health consequences, as the program likely increased access and use of prescription drugs that
can improve health. However, Medicare Part D is a costly program. Part D provided a subsidy to all
Medicare beneficiaries even though approximately two-thirds of Medicare enrollees had prescription drug
benefits prior to creation of Part D and would have likely continued to have such benefits in the absence
of Part D.3 The universal nature of the subsidy significantly raised the cost of providing prescription drug
1 These figures are for those who reported prescription drug use. 2 The $16,000 figure is from EBRI Employee Benefit Research Institute Notes, Volume 28, No. 5, May 2007. http://www.ebri.org/pdf/notespdf/EBRI_Notes_05-2007.pdf, website last accessed May 12, 2010. 3 Insurance market failures related to adverse selection provide a partial rationale for government intervention in the prescription drug insurance market, and is an explanation for why the government effectively mandated participation through the use of stiff financial penalties.
2
insurance to the “newly insured” because for each newly insured person, the government provided a
subsidy to two other persons who already had insurance. Medicare Part D had a net-cost of
approximately $50 billion in 2009, and a recent report from the U.S Department of the Treasury indicated
that Medicare Part D has a projected, net present-value deficit (liability) of $7.2 trillion.4
The size and potential significance of Medicare Part D has generated interest in its effects. The
overarching question is whether the benefits of the program justify the costs. Within this larger question
is a narrower one of particular salience: what did Medicare Part D do for those who did not have, or
would not have had, prescription drug insurance without it? While Part D benefits were extended to all
Medicare enrollees, it was the group of seniors that lacked prescription drug insurance that were a central
concern of policy makers and that motivated the creation of Part D. Evidence at the time suggested that
elderly without prescription drug insurance were particularly likely to forego buying essential
medications, and that this adversely affected their health and increased their use of other medical services
(Soumerai et al. 2006; Piette et al. 2004; Adams et al. 2001).
In this paper, we provide an assessment of the effect of Medicare Part D on the previously
uninsured. We examine the effect of gaining prescription drug insurance as a result of Medicare Part D
on use of prescription drugs, use of other medical services, and health for a nationally representative
sample of Medicare beneficiaries in the years 2000 to 2007. Given the heightened importance of
prescription drugs for those with chronic illness, we provide separate estimates for those in poorer health.
Importantly, our analysis of the effects of prescription drug insurance on the use of health care services
other than prescription drugs will provide evidence on whether prescription drugs, on average, are a
complement or substitute with other types of health care such as inpatient services. This is a question for
which there is limited evidence, but great policy interest. Conventional wisdom maintains that the
provision of prescription drug insurance will result in improved prescription drug adherence and less use
of medical services that may substitute for prescription drugs. Similarly, our analysis of the effect of
4 A Citizen's Guide to the 2009 Financial Report of the U.S. Government, http://www.fms.treas.gov/fr/09frusg/09frusg.pdf, website last accessed March 12, 2010.
3
Medicare Part D and prescription drug insurance on elderly health will add to a sparse literature
concerned with this fundamental issue.
Results are as follows. For the entire sample, we find that gaining prescription drug insurance
through Medicare Part D was associated with approximately a 70% increase in the number of annual
prescriptions, but that obtaining prescription drug insurance is not significantly related to use of outpatient
or inpatient services, functional status and self-reported health, although estimates are sometimes
imprecise and we cannot rule out small beneficial effects. Among those in poorer health, we find that
gaining prescription drug insurance was associated with approximately a 60% increase in the number of
annual prescriptions. For this group too, we find relatively small associations between prescription drug
insurance and outpatient or inpatient services, functional status and self-reported health.
Prescription Drug Insurance, Use of Prescription Drugs and Health Among the Elderly
Previous studies using representative samples of elderly, which are few, have produced a range of
estimates of the effect of prescription drug insurance on prescription drug use.5 Lillard et al. (1999) used
a sample of older persons drawn from the 1990 wave of the Panel Study of Income Dynamics and found
that prescription drug coverage (versus no coverage) increased the probability of any use of prescription
drugs by 12%. Similarly sized estimates were reported by Yang et al. (2006) and Khan and Kaestner
(2009), and both of these studies used a representative sample of Medicare beneficiaries from 1992 to
2000 (or 2001). Yang et al. (2006) reported that prescription drug insurance increased expenditures on
prescription drugs by approximately 7% per year, and Khan and Kaestner (2009) reported that
prescription drug insurance was associated with a 4% to 10% increase in the utilization of prescription
drugs depending on the type and generosity of the coverage. In contrast, Shea et al. (2007) reported that
5 We limit the review to studies that examined a representative sample of elderly and methods that accounted in some way for the non-random choice of prescription drug insurance, and we do not review studies of the effect of prescription drug insurance on elderly persons with specific illnesses (e.g., Stuart et al. 2004; Hsu et al. 2006; Tjia and Briesacher 2008; and Zhang et al. 2009).
4
prescription drug insurance is associated with a 50% increase in the number of prescriptions used among
a sample of Medicare beneficiaries in 1999.
Other studies have focused on the effect of changes in cost sharing for elderly in specific
prescription drug insurance plans. Johnson et al. (1997) and Hsu et al. (2006) examined changes in cost-
sharing for those enrolled in Kaiser-Permanente managed care plans. Johnson et al. (1997) reported that a
$2 (66%) increase in co-payment among members of Kaiser-Permanente Northwest Division (e.g.,
Portland and Seattle) between 1988 and 1990 resulted in an 8% decrease in prescription drug use. Hsu et
al. (2006) examined the impact of benefit caps on prescription drug use among elderly enrolled in Kaiser-
Permanente Northern California Division, and found that caps lowered expenditures on prescription drugs
by 31%. Chandra et al. (2007) examined employees in the California Public Employees Retirement
System and found that a doubling of co-payment from approximately $7 to $14 reduced drug utilization
by 6% for PPO participants and 20% for HMO participants, although the latter patients had a lower
baseline co-payment.
Recently, a few studies examined the effect of Medicare Part D on prescription drug use of all
elderly. Lichtenberg and Sun (2007) and Yin et al. (2008) used a difference-in-difference approach
limited to persons who purchased prescription drugs at Walgreens; Lichtenberg and Sun (2007) compared
the elderly to non-elderly and Yin et al. (2008) compared the elderly to the near-elderly (ages 60 to 63).
The results of these studies indicated that Medicare Part D was associated with between 5.9% (Yin et al.
2008) and 12.8% (Lichtenberg and Sun 2007) increase in prescription drug use of elderly. Madden et al.
(2008) examined pre- to post-Medicare Part D changes in cost-related medication non-adherence (CRN)
using a sample of Medicare enrollees from the Medicare Current Beneficiary Surveys of 2004 to 2006.
They reported that there was a significant decrease in CRN between 2004 and 2006 with a larger decrease
between 2005 and 2006 (22%) than between 2004 and 2005 (9%).
Note that these three studies did not examine the effect of prescription drug insurance (versus no
insurance) on use of prescription drugs, but were limited to an analysis of the effect of being eligible for,
or enrolled in, Medicare Part D. Because approximately two-thirds of the elderly and an even greater
5
number of the non-elderly had prescription drug insurance prior to Part D, these analyses imply much
larger effects on drug use of moving from uninsured to insured. For example, if we assume that 20% of
the elderly moved from uninsured to insured as a result of Part D (see Zhang et al., 2009 who cite this
figure and Table 1 in the text), then the results of these studies suggest that the effect of gaining insurance
is the following: an increase in prescription drug use of 30% for Yin et al. (2008); an increase in
prescription drug use of 65% for Lichtenberg and Sun (2007); and a decrease in CRN of 110% for
Madden et al. (2008).6
The only study we are aware of that examined the effect of Medicare Part D on the uninsured is
Zhang et al. (2009) who examined the impact of Part D among elderly enrolled in a Medicare Advantage
plan in Pennsylvania. These authors found that moving from uninsured to insured was associated with a
74% increase in drug spending. Note that the estimates of the effect of prescription drug insurance in this
study, and effects implied by the results in Lichtenberg and Sun (2007), Yin et al. (2008) and Madden et
al. (2008) are much larger than those found in earlier, pre-Part D studies (except for Shea et al. 2007).
While the magnitude of the effect of prescription drug insurance on use of prescription drugs may
be uncertain, few would argue with the general conclusion drawn from results reported in the past
literature that prescription drug insurance is associated with an increase in use of prescription drugs.
More uncertain is the effect of prescription drug use on the use of other health care services and health.
Presumably, the goal of Medicare Part D is to provide elderly greater financial access to prescription
drugs that are necessary to improve health. The evidence on this point is limited, and the results from
previous study are inconsistent (Goldman et al. 2007). Briesacher et al. (2005), Soumerai et al. (1991)
and Johnson et al. (1997) did not find any effect of prescription drug insurance, or a change in
prescription co-payment, on hospitalization. Chandra et al. (2007) reported that an increase in co-
payments for physician visits and prescription drugs increased the probability of hospitalization by 6%.
6 Interestingly, there is a large difference in the implied effect of gaining prescription drug between Yin et al. (2008) and Lichtenberg and Sun (2007) even though they used the same data. Clearly, estimates are sensitive to the choice of comparison group (non-elderly or near-elderly). We limit our analysis to elderly.
6
Yang et al. (2006) found that prescription drug coverage decreased mortality slightly. Hsu et al. (2006)
found that, among the elderly enrollees of Kaiser-Permanente Northern California Division, capping
prescription drug benefits increased the probability of having glycated hemoglobin ≥8% by 23 percent.
Khan et al. (2008) found that prescription drug insurance had no effect on self reported health or
functional status of Medicare beneficiaries on average, but had some beneficial effect for chronically ill
population. Finally, Zhang et al. (2009) using a sample of Medicare Advantage enrollees in Pennsylvania
reported that gaining prescription drug use was associated with a 7% decline in medical (non-pharmacy)
spending.7
This brief review of the literature has revealed the following. First, while there is consistent
evidence that prescription drug insurance is associated with an increase in prescription drug use, the
magnitude of the association remains in doubt because previous studies have produced a surprisingly
wide range of estimates even for purportedly representative samples of elderly persons in similar time
periods. Second, there are relatively few studies of the effect of prescription drug insurance on use of
other medical services for representative samples of elderly, which is something noted by Goldman et al.
(2007) in their often cited review article. Studies that have examined narrower samples such as those
from a specific insurance plan have not produced a consistent set of findings. Third, there are even fewer
studies that examined the effect of prescription drug insurance on health of a general population of
elderly. This is a notable gap because it is not clear that prescription drug use will improve health even if
it increases use of prescription drugs. The increased use of prescription drugs induced by insurance may
be of marginal value, and may be associated with changes in behavior (e.g., diet and exercise) that offset
the benefits of greater use. Moreover, evidence form clinical trials that link prescription drug use to
improved health are almost always conducted on relatively small and unrepresentative samples that make
generalizing the findings from these studies tenuous. Finally, there has been only one assessment of the
7 The change in total medical spending was positive: $41 increase in monthly pharmacy and a $33 decrease in
monthly medical spending (Zhang et al. 2009).
7
effect of Medicare Part D on the previously uninsured, and this study was limited to persons enrolled in a
Medicare Advantage plan of a large Pennsylvania insurer (Zhang et al. 2009).
Overall, the previous literature concerned with the effect of prescription drug insurance on the use
of prescription drugs, use of other medical services and health of the elderly is limited. Here, we begin to
address this shortfall of evidence by examining the effect of prescription drug insurance using the
plausibly exogenous change in prescription drug insurance engendered by Medicare Part D. We exploit
the natural experiment of Medicare Part D to obtain quasi-experimental estimates of the effect of
prescription drug insurance on prescription drug use, use of other medical services and health for a
representative sample of elderly from the Medicare Current Beneficiary Survey (MCBS) from years 2000
to 2007.
Empirical Strategy
We exploited the natural experiment afforded by Medicare Part D, which was fully implemented
in 2006, to estimate the effect of prescription drug insurance on use of prescription drugs, use of other
medical services and health of the elderly. We used pooled, cross-sectional time-series data from the
MCBS and multivariate regression methods in the context of an instrumental variables research design to
obtain estimates of interest.
The outcomes of interest are prescription drug use, outpatient visits, inpatient visits, and health, as
measured by functional status (Activities of Daily Living, Instrumental Activities of Daily Living) and
self-reported health. Algebraically, using prescription drug use as an example, the regression model used
in our analysis is the following:
(1)
2007,2006,2004,...,2000
,...,1
2007
20011
t
Ni
vXYEARINSUREDPRES ititt
ttitit
8
In equation (1), the number of prescription drugs used by person i in year t ( itPRES ) depends on
prescription drug insurance (INSURED), year effects ( tYEAR ), and other measured demographic and
socioeconomic factors ( itX ) such as age, race, marital status and income. Note that we do not use data
from 2005 because in 2005, prescription drug discount cards were available to Medicare beneficiaries, but
we are unable to accurately identify who did or did not have a (subsidized) discount card. In addition, for
some of the outcomes of interest, we have data only through 2006.8
The empirical challenge associated with equation (1) is that prescription drug insurance is not
randomly chosen and those with prescription drug insurance may differ by measured and unmeasured
characteristics from those without prescription drug insurance. For example, those with prescription drug
insurance may be sicker and/or more risk averse than those without insurance, and both of these factors
would likely affect prescription drug use. To address this problem, we use instrumental variables. We
use variation in prescription drug insurance caused by the implementation of Medicare Part D to obtain
estimates of the effect of prescription drug insurance on outcomes. Specifically, we estimate the
following:
(2) ititt
ttk
kitkitit vXYEARINNUREDUINSPRES
2007
2001
4
221
ˆˆ
(3) ititt k
tkitktt
ttk
kitkit vXYEARINNUYEARINNUINSURED
2007
2001
4
2
2007
2001
4
2)*ˆ(ˆ
Equation (2) is identical to equation (1) with two exceptions. Instead of actual prescription drug
insurance, we use predicted prescription drug insurance in equation (2). Second, there is an additional
variable in equation (2), kitINNU ˆ , which is the predicted likelihood of being uninsured prior to Medicare
Part D. This variable is constructed from observable characteristics (i.e., itX ) and it is measured as a set
of dummy variables that indicate the quartile (k=1,2,3,4) of the distribution of the probability of being
8 Information on prescription drug use comes from the MCBS Cost and Use data set, and the 2007 information is not yet available. Therefore, the analysis of prescription drug use, we limit the analysis to the years 2000 to 2006. Similarly, the analysis of hospitalization and outpatient visits are limited to the years 2000 to 2006.
9
uninsured prior to Part D that a elderly person belongs to. Detailed description of kitINNU ˆ is provided
below. As we describe below, we predict the probability of being uninsured using combinations
(interactions) of variables in the itX vector, and because we do not include all these combinations in
equation (1), we can estimate the main effect associated with the predicted probability of being uninsured
( itINNU ˆ ). Including the predicted probability of being uninsured ( itINNU ˆ ) in the primary model
(second stage—equaton 2) is a parsimonious way to control for any non-linear combinations of the
itX variables that have been excluded.
Equation (3) is the model that we use to predict prescription drug insurance that is part of the
instrumental variables procedure. The instruments are the interactions between the predicted likelihood
of being uninsured prior to Part D and year dummy variables ( tkit YEARINNU *ˆ ). Equation (3) is based
on a difference-in-differences research design; the treatment and comparison groups are identified by the
predicted likelihood of being uninsured prior to Medicare Part D. Those who are more likely to be
uninsured prior to Medicare Part D will be more likely to gain prescription insurance as a result of Part D.
Those in bottom quartile (reference category) have the lowest probability of being uninsured prior to
Medicare Part D and are the least likely to be affected by Medicare Part D. Those in the top quartile are
the most likely to be uninsured prior to Medicare Part D and are most likely to gain prescription drug
insurance as a result of Medicare Part D. In addition to using quartiles of the probability of being
uninsured prior to Medicare Part D, we estimate a model that uses a quadratic specification for the
probability of being uninsured prior to Medicare Part D. This latter model is somewhat more restrictive
than the quartile specification, but we note here that results do not differ across specifications and we
report both sets of results below.
The identifying assumption of the instrumental variables approach is that, in the absence of
Medicare Part D, changes in prescription drug use and other outcomes are the same for the treatment and
comparison groups. While we cannot test this assumption definitively, we can provide some evidence of
the validity of this assumption. Specifically, with respect to equation (3), we test whether the coefficients
10
on the interaction effects in years prior to 2006 (i.e., prior to Medicare Part D) are statistically significant.
These interaction effects measure whether changes in prescription drug insurance are the same for the
treatment and comparison group in years prior to Medicare Part D. We report the statistical tests related
to this assumption below, but note here that we are unable to reject the null hypothesis that the pre-2006
interactions are jointly zero, which is evidence supportive of our research design. On the other hand,
coefficients on the interaction terms between the predicted probability of being uninsured and the post-
2005 year dummy variables are expected to be non-zero. We report these results below, but note here that
this is indeed the case. The first stage correlation is very strong. Similar tests can be carried out with
reference to equation (2). In this case, such tests are standard over identification tests associated with
instrumental variables. We report the results of these below, but note here that we cannot reject the over
identification restrictions in almost all cases.
It is important to note that the instrumental variables approach illustrated by equations (2) and (3)
yields estimates of effects of prescription drug use on outcomes that are applicable to those who were
affected by Medicare Part D (local average treatment effect-LATE). Our analysis of the probability of
being uninsured prior to Medicare Part D, which we describe more fully below, indicates that age,
education, income, race and region are all significant predictors of being uninsured. For example, those
aged 65 to 69 have a predicted (marginal) probability of being uninsured of 0.29 whereas those aged 80 to
85 have a predicted probability of 0.37. White persons have a predicted probability of being uninsured of
0.32 and black persons have a predicted probability of being uninsured of 0.38. Those with a Bachelors
degree have a predicted probability of being uninsured of 0.25 as compared to those with less than a high
school degree who have a predicted probability of being uninsured of 0.41. Finally, as expected, there is
a sharp gradient in the probability of being uninsured with income. Those in the lowest income category
have a probability of being uninsured of 0.51 and those in the top income category have a probability of
being uninsured of 0.23. In sum, those without prescription drug insurance prior to Medicare Part D tend
to low-educated, low-income, black, older and more likely to come from some regions (e.g., east and west
11
south central) than others. Thus, our estimates of the effect of prescription drug coverage due to
Medicare Part D pertain to persons with these characteristics.
Beyond the LATE nature of our approach, we also recognize the possibility that the IV approach
is not strictly valid if there were general equilibrium effects associated with Medicare Part D, for
example, if prices of prescription drugs change.9 To the extent that prices of prescription drugs changed
post-Part D, IV estimates will include both the effect of insurance and effect of price changes. Thus, the
benefit of, and response to, gaining prescription drug insurance is less than if no price reduction had
occurred. However, since the price effect also affected those who always had insurance, the general price
decline will affect both groups and part of this effect will be differenced out of estimates. We note that all
analyses of Medicare Part D including the intention to treat analyses of Lichtenberg and Sun (2007) and
Yin et al. (2008) are subject to the same caveat.
In addition, there is the possibility that some elderly with prior prescription drug insurance switch
plans (i.e., generosity) as a result of Medicare Part D. However, evidence presented in Levy and Weir
(2009) suggest little such switching. Using data from the Health and Retirement Survey, Levy and Weir
(2009) showed that was there was little “crowd out” of private, employer-sponsored insurance as a result
of the creation of Medicare Part D. The incentives in Medicare Part D for employers to maintain
prescription drug benefits appeared to be effective. We find similar results in our data (not reported). At
a minimum, IV estimates will be measuring the effect of gaining coverage among those previously
uninsured and the effect of any, arguably minor, change in generosity among those with prescription drug
insurance.
To construct the predicted likelihood of being uninsured prior to Medicare Part D, we used the
following regression model:
9 Duggan and Scott (2010) concluded that Medicare Part D reduced prices of prescription drugs by between 13% and 20%.
12
(4)
2003,2002,2001,2000
,...,1
2003
2001
t
Ni
eXYEARUNIN ititt
ttit
In equation (4), the probability that person i in year t is uninsured prior to Medicare Part D—we used the
years 2000 to 20003—depends on year effects and demographic and socioeconomic factors ( itX ). We
used a more complicated specification than that described in equation (4). Specifically, we included
several interactions between the demographic and socioeconomic variables.10 We constructed the
predicted probability of being uninsured using the parameter estimates from equation (4) except for the
estimates associated with year effects (i.e., we used the year 2000 mean level of uninsured). The
predicted probability of being uninsured is equal to:
(5) ˆˆˆitit XINNU .
Thus, our measure of the predicted likelihood of being uninsured prior to Medicare Part D is just a linear
combination of (exogenous) demographic and socioeconomic characteristics. However, because we used
a more complex function of the observable variables to predict the probability of being uninsured, we can
include the predicted probability of being uninsured in equation (2)—it is not a perfect linear combination
of the vector of variables included in that model. Including the predicted variable in the regression, as we
do, is also a parsimonious way to control for these more complex interactions between the socioeconomic
and demographic factors.
Data
Data for the analysis comes from the Medicare Current Beneficiary Survey (MCBS) from the
years 2000 to 2007. We omit the year 2005 because of the availability, and significant use, of drug
10 The model to predict uninsured included the following: age, education, marital status, race, income, rural status, region, current smoker, and former smoker, age by gender, marital status by gender, education by gender, marital status by race, income by race, rural status by race, current and former smoker by education, region by race, and region by education.
13
discount cards that were provided automatically to some Medicare enrollees (e.g., Medigap policy
holders) and were available by purchase to others (Thomas et al. 2005). The MCBS data do not allow us
to accurately identify whether a respondent had a drug discount card, and so we omit this year for
analysis.11 The MCBS is the only nationally representative survey that exclusively focuses on Medicare
enrollees (aged 65 years and above, and disabled). Individuals are drawn using stratified random
sampling from an enrollment list of persons entitled to Medicare on January 1st of that year. The
stratified sampling ensures that the sample is representative of all geographical areas and age groups.
Each year, a supplemental sample is added to account for attrition, maintain an average sample size of
12,000 individuals, and to ensure that the sample remains representative of the current Medicare
population. We use a sample of non-institutionalized persons 65 to 85 years of age who have complete
year information. We omit people who died during the year, and who were ever on Medicaid, not living
in the community, or had end stage renal disease. The latter group is quite dissimilar to other
respondents. 12 We also use a sub-sample of relatively sicker individuals, which we refer to as the
chronically ill or poor health sample. These are persons who reported three or more chronic illnesses
(e.g., hypertension, asthma, arthritis).
Each sampled individual is interviewed face-to-face three times per year for four years. After
four years, the individual is retired from the survey and a new panel is added.13 Data is released in two
file formats, Access to Care and Cost and Use. Cost and Use provides detailed description of the
respondent’s insurance status including prescription insurance, health status, medication utilization, other
health care utilization, and demographic and socioeconomic characteristics. Access to Care provides the
same information except the utilization data. We used the Cost and Use files from 2000-2006 and Access
to Care file for year 2007. These are the latest available data.
11 The discount card program first became available on June 1, 2004 and was in operation for the full year of 2005. 12 Reports by Kaiser Family Foundation and GAO suggest that there were transition issues for the Medicaid population (see http://www.kff.org/medicaid/upload/7454.pdf, website last accessed May 13, 2010). For this, and because Medicaid population is very different, we exclude these individuals from the analysis. 13 Sample sizes are not large enough to exploit successfully the longitudinal data, particularly because of the necessity to omit 2005.
14
A particular strength of the MCBS is the validity checks performed by CMS. Respondents are
asked to show receipts, bills, drug vials, and any related paperwork to document prescription drug use and
drug insurance. The use of Computer Assisted Personal Interview program and prescription bills, vials,
and bottles enhances the accuracy of the collected information during the interview process. After the
interview, CMS uses the administrative claims database and other algorithms to clean, supplement, and
validate the data. These validity checks have greatly reduced missing information and improved accuracy
of the survey (Eppig and Chulis 1997).
MCBS respondents report up to five sources of non-Medicare insurance and prescription drug
coverage. The respondent reported the start and stop dates of the insurance and whether this source of
insurance provided prescription drug coverage. Based on this information, we assigned a person to
insured or uninsured category for each month in the survey. If they had prescription drug insurance for at
least six months in a year, we assign them to the insured category, although there is relatively little
switching from insured to uninsured.14
As noted, we examine several dependent variables. Prescription drug use is measured by the self-
reported, annual total number of prescription drugs dispensed.15 Outpatient visits is the annual total
number of outpatient visits. In addition to the total number of visits, we construct two dichotomous
measures indicating 3 or more visits or 6 or more visits. Hospitalization is a binary variable indicating
hospitalization in the last year. We also use self reported measures of health such as general health status,
activities of daily living (ADL), and instrumental activities of daily living (IADL). General health status
(excellent/very good/good/fair/poor) measures self reported health compared to individuals in the same
age group. We also define good health as those with excellent or very good self-reported health and poor
health as those with fair or poor self-rated health. ADL is composite score indicating problems in eating,
dressing, bathing, walking, transferring into and out of a chair, and using the toilet. IADL represents
14 The Access to Care file does not provide such detailed monthly information on prescription drug insurance. Therefore, for 2007 we assigned them to the insured or uninsured group using self reported insurance status. The two different data sources yield slightly different definitions for prescription drug coverage, however, these differences are small. 15 The number of prescriptions is not normalized by supply (e.g., 30-day).
15
problems in making meals, using the phone, going shopping, managing money, and doing light and heavy
housework. The scores on the ADL and IADL can range from 0 to 6. In some analyses we transform
ADL and IADL into dichotomous variables indicating that the person has a 2 or more functional
limitations, and we also combine ADL and IADL.
Regression analyses also include controls for demographic and socioeconomic characteristics
including age, sex, race, education, urban residence, census region of residence, income, marital status,
and smoking status. These variables are included in the models as categorical variables.
Results
Medicare Part D and Prescription Drug Insurance Coverage
We begin the presentation of results by demonstrating, as others have, that Medicare Part D had
significant effects on prescription drug insurance, and that its effect was concentrated among those with a
high predicted likelihood of being uninsured prior to 2006 when Medicare Part D was fully implemented
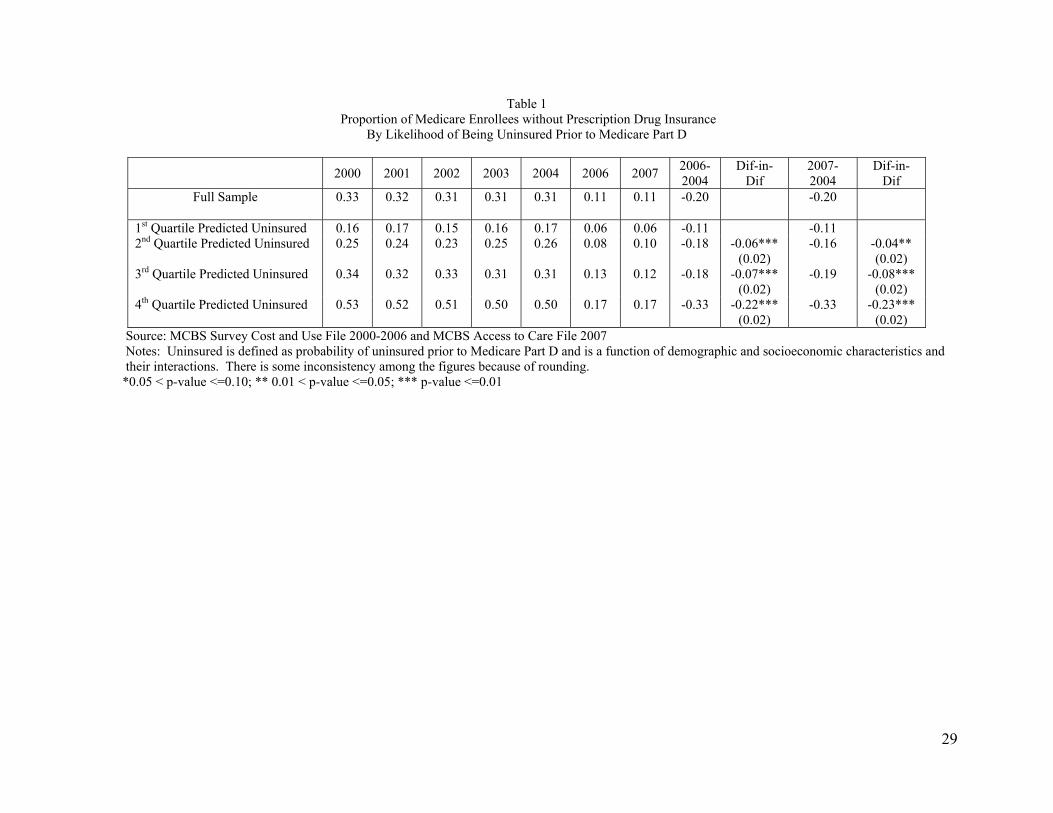
(Levy and Weir 2009). Table 1 presents the mean rate of uninsured by year for the full sample and by
quartile of the probability of being uninsured prior to Part D. The figures in Table 1 indicate a steep
decline in the rate of uninsured between 2004 and 2007. Prior to 2006, there is relatively little trend in the
rate of uninsured. More importantly, there are significant differences in the changes in the proportion
uninsured for those more or less likely to be uninsured prior to Medicare Part D. Among those in the
bottom quartile of the distribution of the probability of being uninsured prior to Part D, the change in the
proportion uninsured between 2004 and 2006 (2007) was -11 percentage points. Among those in the top
quartile of this distribution, the change in the proportion uninsured between 2004 and 2006 (2007) was -
33 percentage points. For the entire sample, the proportion uninsured declined by approximately 20
percentage points between 2004 and 2006. Similar changes occur between 2004 and 2007. Finally,
although we do not show it, we found little change in the type of prescription drug insurance, which is
similar to Levy and Weir (2009). This is important because it supports the assumption of our empirical
16
approach, which assumes that Medicare Part D did not significantly affect those with prescription drug
insurance prior to Part D.
We calculate difference-in-difference (DD) estimates of the effect of Medicare Part D on
prescription drug insurance in Table 1 for the change in prescription drug insurance between 2004 and
2006 and between 2004 and 2007. The comparison group is those in the first quartile of the probability of
being uninsured—i.e., those least likely to be uninsured prior to Part D. The DD estimates associated
with the 4th minus 1st quartiles are -22 percentage points for 2004 to 2006 and -23 percentage points for
2004 to 2007. Both are statistically significant.
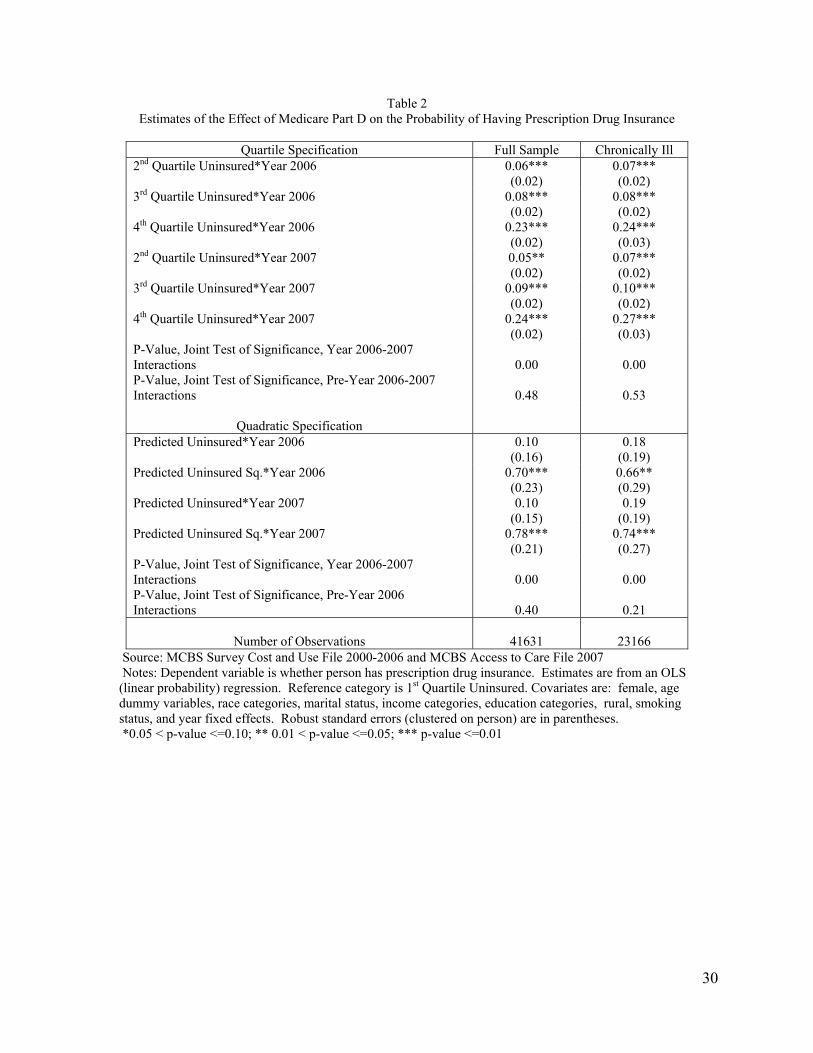
The descriptive information in Table 1 is consistent with results from a regression model
predicting prescription drug insurance coverage. Table 2 presents selected estimates of equation (3),
which is reproduced here for clarity:
(5) ititt k
tkitktt
ttk
kitkit vXYEARINNUYEARINNUINSURED
2007
2001
4
2
2007
2001
4
2
)*ˆ(ˆ
Estimates were obtained by Ordinary Least Squares (OLS) regression methods, and we present separate
estimates for the entire sample and those in poorer health, which we define as those with three or more
chronic illnesses. We refer to the latter group as the “chronically ill” sample. Standard errors are
constructed allowing for non-independence within person (i.e., clustered on the individual).
For the complete sample, estimates in the left panel of Table 2 have a clearly identifiable pattern.
The more likely a person was of being uninsured prior to Part D, as measured by the quartiles of the
distribution of being uninsured, the more likely they were to gain prescription drug insurance subsequent
to Medicare Part D (2006 and 2007). For example, estimates associated with being in the top quartile of
the distribution of the probability of being uninsured are 0.23 in 2006 and 0.24 in 2007. Relative to those
in the bottom quartile of the probability of being uninsured, those in the top quartile were approximately
23 percentage points more likely to gain prescription drug insurance subsequent to Part D. Note also, that
these estimates are almost exactly equal to those reported in Table 1 in the columns labeled “Dif-in-Dif.”
Adjusting for covariates has little effect on estimates. A point to note about Table 2 is that the strong
17
correlation between the interaction terms in 2006 and 2007 demonstrate that the IV approach we employ
is reasonable in terms of the correlation between the instrument (essentially the 2006 and 2007
interactions) and prescription drug insurance coverage. In the bottom panel, we report the results when
the probability of being uninsured is specified using a quadratic form. These estimates are consistent with
estimates using the quartile specification. Changes in prescription drug insurance are increasing
significantly in the probability of being uninsured.
Estimates (not shown) associated with the interactions between the quartiles of the probability of
being uninsured and the year dummy variables prior to 2006 are not statistically significant and small in
magnitude. In Table 2, we report the p-value associated with the test that the pre-2006 interactions
between the quartiles of the predicted probability of being uninsured and year dummy variables are
jointly zero. The p-value for this test for the complete sample is 0.48 (and 0.40 for quadratic
specification), and for the chronically ill sample 0.53 (0.21 for quadratic specification). This result
provides support for the overall research design, which is based on the Medicare Part D natural
experiment and the assumption that pre- to post-Medicare Part D, those in different quartiles of the
distribution of the probability of being uninsured would have similar trends in outcomes.
For the chronically ill sample, estimates (right panel of Table 2) indicate a similar experience as
that for the full sample. The more likely a chronically ill person was of being uninsured prior to Medicare
Part D the more likely they were to gain prescription drug insurance subsequent to Part D. Estimates
associated with being in the top quartile are 0.24 in 2006 and 0.27 in 2007.
Notably, our results are very similar to the descriptive results reported by Levy and Weir (2009)
in their analysis of data from the Health and Retirement Survey. To improve the comparison between our
study and Levy and Weir (2009), we re-estimated equation (3) using a continuous index of the probability
of being uninsured. The coefficient on the interaction between this index and the 2006 and 2007 year
dummy variables was approximately 0.6, which indicates a take-up rate of Medicare Part D of
approximately 60%, which is exactly the figure reported by Levy and Weir (2009).
Medicare Part D, Prescription Drug Insurance and Use of Prescription Drugs
18
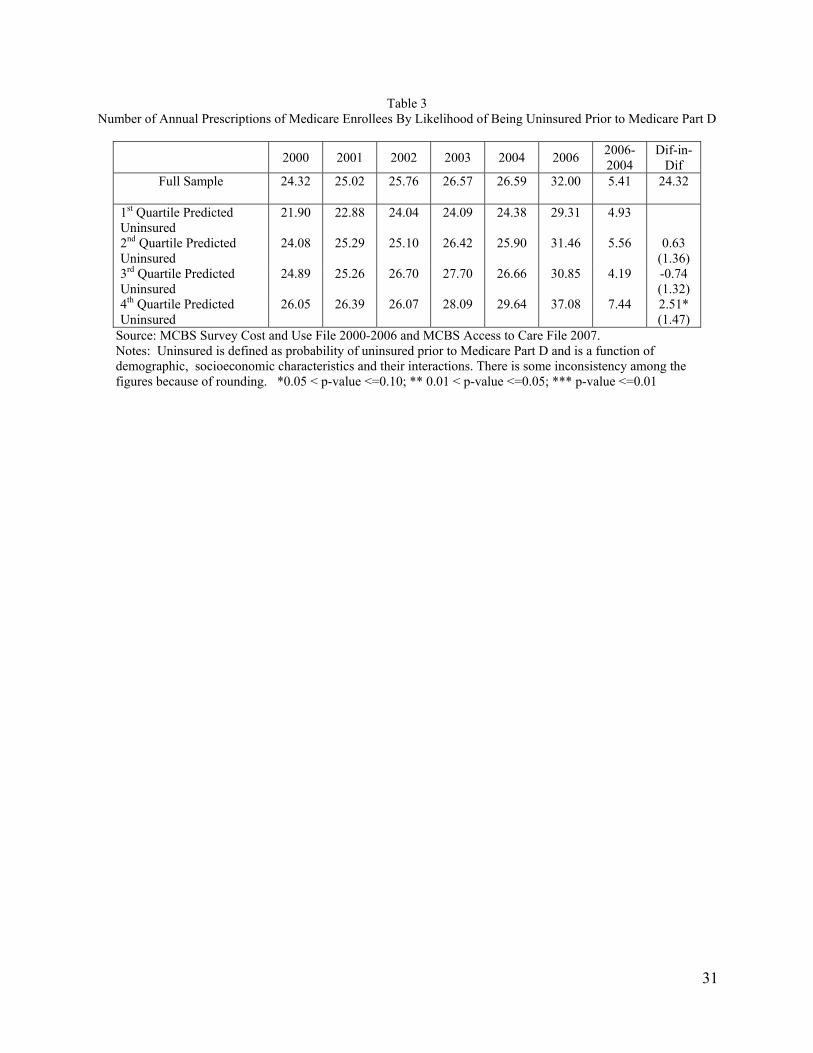
Table 3 reports the average number of annual prescriptions by year and by quartile of the
probability of being uninsured. For this outcome, we have data only through 2006. During the pre-
Medicare Part D period, we observe a slightly rising number of annual prescriptions, but between 2004
and 2006 there is a significant increase in the use of prescription drugs. Notably the change in
prescription drug use between 2004 and 2006 is largest for those most likely to be uninsured prior to
2006, and is increasing by quartile except for quartile 3. Difference-in-difference estimates are also
presented in Table 3. These estimates are consistent with the hypothesis that those who were most likely
to gain prescription drug insurance experienced the largest increases in prescription drug use, although
estimates are not statistically significant except for the 4th versus 1st quartile comparison.
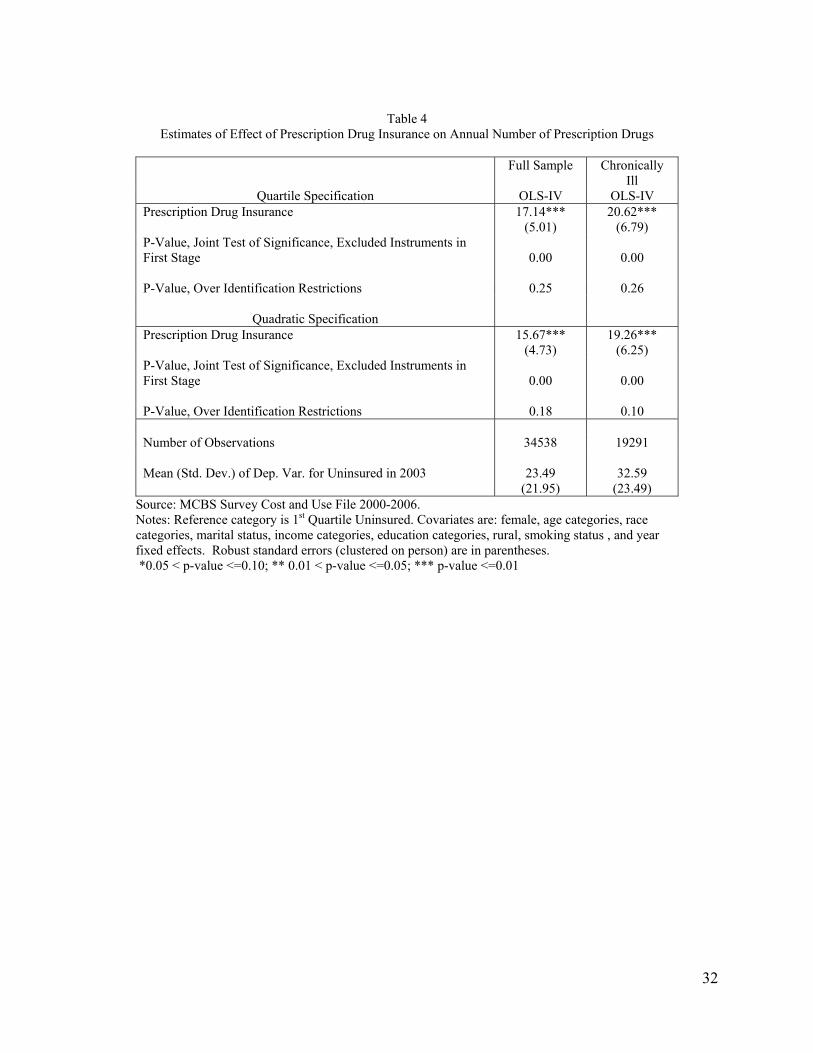
In Table 4, we present instrumental variables estimates of the effect of prescription drug
insurance on annual use of prescription drugs for the entire sample (first column) and the sample of
chronically ill (second column).16 The top panel of Table 4 reports the instrumental variables estimates
obtained using the quartile specification for the instruments (i.e., probability of being uninsured prior to
Part D). For the full sample, the estimate of the effect of prescription drug insurance is 17.14 and for the
sample of chronically ill the estimate is 20.62. Both estimates are highly significant. These effects are
large; obtaining prescription drug insurance through Medicare Part D is associated with an increase in the
number of annual prescription drugs of approximately 70% relative to the mean (75% relative to a
standard deviation) for the full sample and 60% of the mean (90% relative to a standard deviation) for
chronically ill persons. The magnitude of these estimates is similar to those reported in other studies
related to Medicare Part D; for example, Zhang et al. (2009) found that moving from uninsured to insured
was associated with a 74% increase in drug spending for Medicare Advantage enrollees in Pennsylvania.
The bottom panel of Table 4 reports instrumental variables estimates obtained using a quadratic
specification of the instruments. Estimates are similar to those already reported; among the full sample
16 We assessed whether the skewed nature of the distribution of prescription drug use affected estimates by estimating a non-instrumental variables version of equation (2) by OLS and Poisson (robust methods to construct standard errors). Estimates from the two methods were virtually identical suggesting that the skewed nature of distribution was not affecting estimates.
19
prescription drug insurance is associated with a 15.67 increase in prescriptions and among the chronically
ill, prescription drug insurance is associated with a 19.26 prescription increase.
Results from tests assessing the validity of the instrumental variables approach are also presented
in Table 4. We have already demonstrated that there is a very strong first stage correlation between the
probability of being uninsured prior to Part D and the probability of gaining prescription drug insurance
as a result of Medicare Part D, and p-values listed in Table 4 pertaining to this issue reflect this fact.
More interesting are the tests of over identification. For the full sample, we cannot reject the over
identification restrictions and p-values associated with these test are 0.25 (quartile specification) and 0.18
(quadratic specification). For the chronically ill sample, the p-values associated with the over
identification tests are 0.26 (quartile) and 0.10 (quadratic). Overall, these results suggest that the
instrumental variables approach is valid.
Medicare Part D, Prescription Drug Insurance and Use of Other Services
A prominent hypothesis related to prescription drug insurance is that the financial access to
prescription drugs afforded by insurance results in greater and more appropriate (e.g., better adherence)
use of prescription drugs, and that this increase in use has positive spillovers on the use of other services,
for example, less use of inpatient services (Chandra et al. 2007; Zhang et al. 2009). Here, we examine
whether prescription drug insurance is associated with a change in the probability of being hospitalized in
the last year and the number of outpatient physician visits. For these outcomes, we only have data
through 2006, as the 2007 data are not yet available.
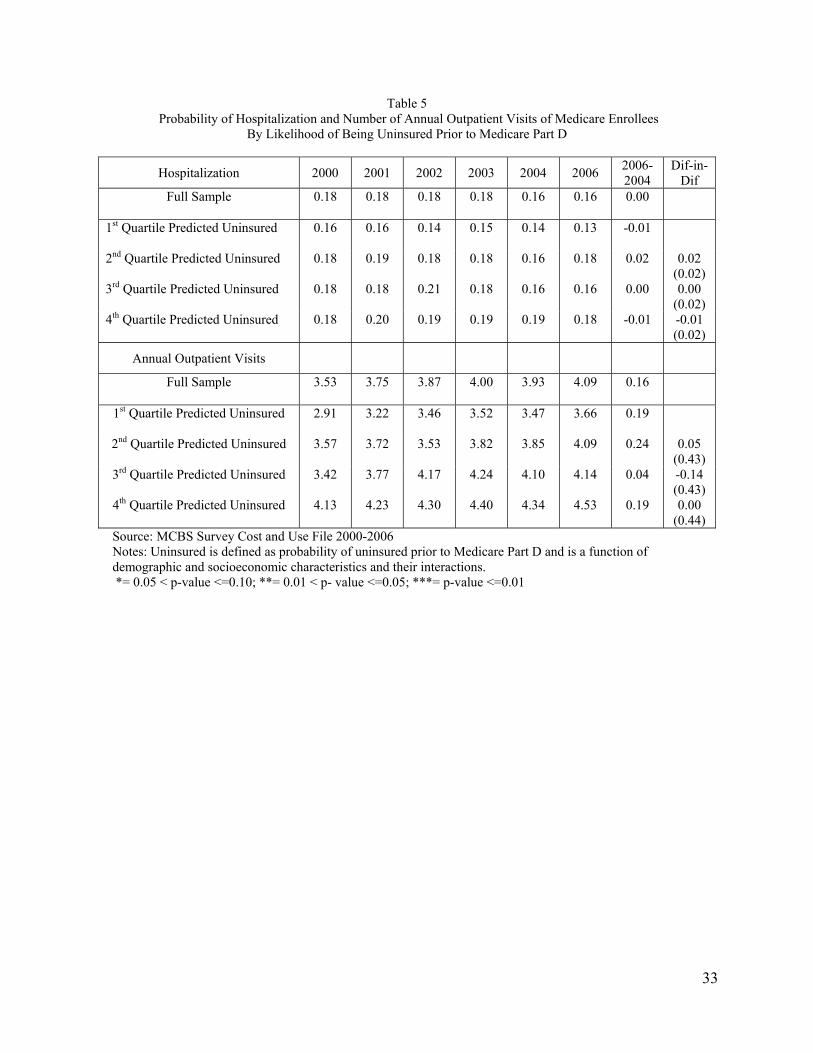
Table 5 presents descriptive information. In the case of hospitalization, the figures in Table 5
suggest little change, if anything a slight decrease in the probability of hospitalization between 2000 and
2006, and difference-in-difference estimates are zero or close to zero. For outpatient visits, there is a
slight increase in the number of visits over time and those more likely to be uninsured report more visits
than those less likely to be uninsured (in every year). However, the change in outpatient visits between
2004 and 2006 is similar to the change in visits between earlier years. Difference-in-difference estimates
are small and not statistically significant.
20
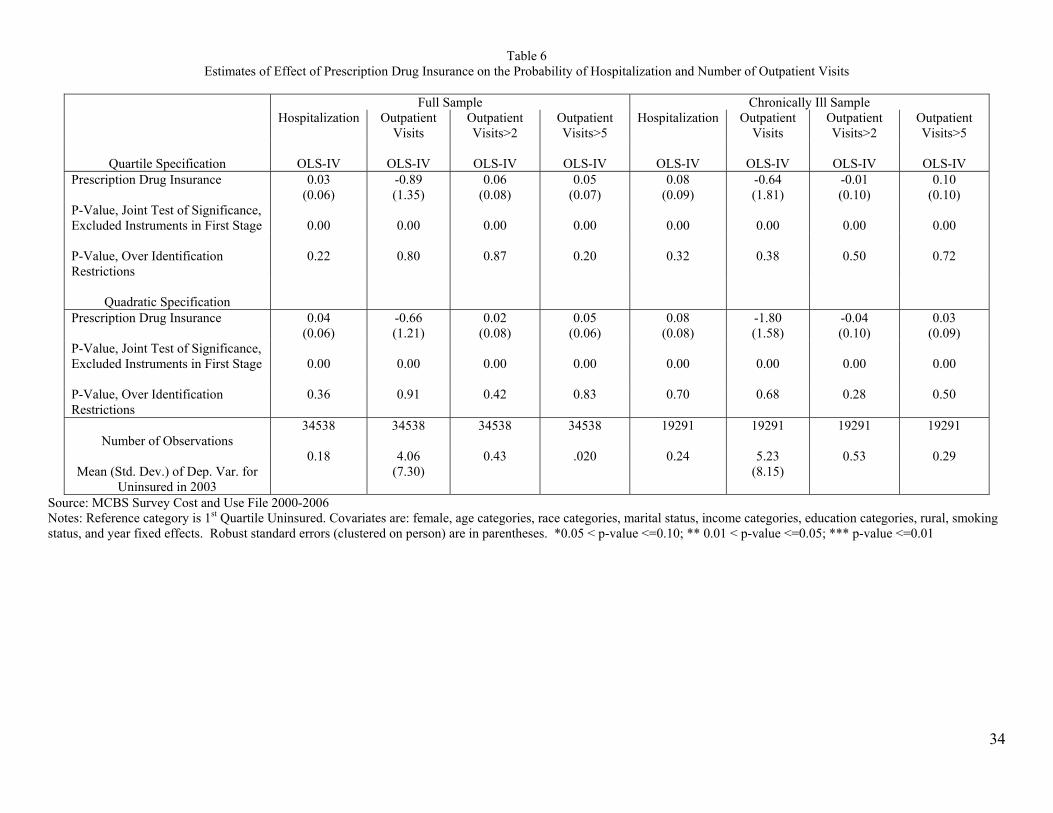
Table 6 presents instrumental variables estimates of the effect of prescription drug insurance on
the probability of hospitalization and the use of outpatient services.17 Before discussing estimates, we
note that p-values associated with first stage results are highly significant, as expected, and that p-values
associated with tests of over identification restrictions indicate that we cannot reject the exclusion
restrictions in all cases.
For the full sample, estimates of the effect of prescription drug insurance on the probability of
hospitalization are positive and not statistically significant. The magnitudes of estimate are modest;
prescription drug insurance is associated with a three to four percentage point increase in the probability
of hospitalization, which relative to the mean represents a 15 to 20 percent effect size. Our inability to
reject an effect size of this magnitude suggests that we lack sufficient statistical power to detect reliably
small to modest effects. It is clear from the size of the standard errors, that in the case of hospitalization
we have insufficient statistical power to detect reasonably sized effects.
We measured outpatient visits in three ways: total number of visits; whether a person had 3 or
more visits; and whether a person had 6 or more visits. For the full sample, estimates of the effect of
prescription drug insurance on outpatient visits are not statistically significant and of modest magnitudes.
For example, prescription drug insurance is associated with a 0.66 to 0.89 decrease in the number of
outpatient visits; relative to the standard deviation of outpatient visits these effects sizes are
approximately 10 percent. For this outcome too, we have limited statistical power although not as limited
as in the case of hospitalization. Standard errors of estimates indicate that we could not reject effect sizes
smaller than 2.5 outpatient visits, or approximately one-third of a standard deviation. Estimates
associated with the other measures of outpatient visits (>2 or >5 visits) are approximately of the same
relative (to mean) magnitudes and are not statistically significant.
Instrumental variables estimates of the effect of prescription drug insurance on the probability of
hospitalization for chronically ill persons is 0.08, or approximately 33% of the mean, and not statistically
17 In the case of outpatient visits, we also assessed whether estimates were sensitive to the estimation method (i.e., Poisson versus OLS) using the same approach as described in footnote 14.
21
significant. With respect to outpatient visits, estimates of the effect of prescription drug insurance on the
number of outpatient visits are -0.64 and -1.80 and not statistically significant. These effect sizes are
modest; 7 and 20 percent of a standard deviation respectively. Here too, the statistical power of the
analysis is limited with standard errors indicating that we cannot reject reliably effects sizes of less than
one-third of a standard deviation.
Medicare Part D, Prescription Drug Insurance and Self-rated Health
Arguably, the most important goal of subsidizing prescription drug insurance as in Medicare Part
D is to provide the financial ability to purchase prescription drugs that maintain, or slow the deterioration,
of the health of elderly persons. As noted there are few studies of this issue. We examine the association
between prescription drug insurance and several measures of self-reported health created from three
underlying variables: self-rated general health status, the number of activities of daily living limitations
(ADL); and the number of instrumental activities of daily living limitations (IADL). ADL and IADL
range from zero to six. For all measures of health, we have data that extend through 2007.
Table 7 presents descriptive information for ADLs, IADLs and general health status by year and
quartile of the probability of being uninsured. Overall, there seems to be a slight improvement in
functional status and general health over the 2000 to 2004 period. There is also evidence that those more
likely to be uninsured prior to Part D have worse health than those less likely to be uninsured (in each
year). Changes in functional status and general health between 2004 and 2006 and 2004 and 2007 are
small—always less than 10% of a standard deviation (approximately 1.1) and not very different from
year-to-year changes in earlier periods. Consistent with these facts, difference-in-difference estimates are
small and not statistically significant with two exceptions. The 3rd minus 1st quartile difference-in-
difference estimate with respect to IADLs and the 2006-2004 difference indicates that those more likely
to obtain prescription drug insurance through Medicare Part D experienced a relative improvement in
functional status (-0.11 DD estimate). The other significant estimate is the 4th minus 1st quartile for the
2007-2004 difference in general health status, which is positive indicating worsening health. Overall, the
22
descriptive evidence in Table 7 suggests little association between gaining prescription drug insurance
and health.
Tables 8 and 9 presents estimates of the effect of prescription drug insurance on functional status
(Table 8) and general health (Table 9). Tests associated with the validity of the instrumental variables
approach are overwhelmingly supportive. First stage correlations between the instruments and
prescription drug insurance are strong. Moreover, tests of over identification restrictions usually indicate
that we cannot reject the restrictions. The exception is self-reported general health for the full sample; in
this case over identification tests reject the null hypothesis.
Estimates in Table 8 and 9 are never statistically significant. With respect to functional status all
estimates, for both the full and chronically ill samples, are positive, which points toward worsening
functional status, and relatively small—10 to 15 percent of mean of dichotomous outcomes and of the
standard deviation for other outcomes (ADL, IADL, ADL+IADL). However, we note that we have
limited ability to detect small effects, as magnitudes of standard errors imply that we cannot reject
reliably effect sizes smaller than one-third of a standard deviation (or of the mean). Estimates in Table 9
are also relatively small, not statistically significant, and mixed in terms of sign of the association
(relative to beneficial outcomes). The similar caveat with respect to statistical power applies to these
estimates.
Conclusions
The growing clinical and financial importance of prescription drugs motivated the creation of a
prescription drug benefit for elderly under Medicare Part D. While Medicare Part D is for all seniors, it
was those who lacked prescription drug insurance prior to Part D that was of central concern to
policymakers. In this paper, we assessed the effects of Medicare Part D on this group who tend to be low-
educated, low-income, black and older than the average elderly person. Specifically, we obtained
estimates of the association between prescription drug insurance provided by Medicare Part D (versus no
coverage) on the use of prescription drugs, use of outpatient and inpatient services, and health, as
23
measured by functional status and general health ratings. We also quantified the change in prescription
drug insurance coverage that resulted from Medicare Part D.
To obtain the estimates of interest, we exploited the natural experiment afforded by Medicare Part
D and the fact that most elderly had prescription drug insurance prior to Medicare Part D. This enabled
us to compare changes in outcomes between those more or less likely to gain prescription drug insurance
as a result of Medicare Part D. We then used these differential responses to Medicare Part D to identify
the effect of prescription drug insurance on outcomes. We provided substantial evidence that this
empirical approach was valid.
We found that prescription drug insurance is associated with a significant increase in the use of
prescription drugs. Estimates suggest that gaining prescription drug coverage through Medicare Part D
was associated with approximately a 70% (relative to mean) increase in the use of prescription drugs for
the general population of elderly, and a 60% (relative to mean) increase in the use of prescription drugs
for those in poorer health (chronically ill sample). In absolute terms, prescription drug insurance was
associated with a larger increase in prescription drug use among those in poorer health. Our estimates are
in line with the only other study that we are aware of that examined this same question; Zhang et al.
(2009) reported that gaining prescription drug insurance through Medicare Part D was associated with a
74% increase in spending on prescription drugs for enrollees in a Medicare Advantage plan in
Pennsylvania.
It is not surprising to find that prescription drug insurance is associated with an increase in
prescription drug use, although the magnitude of the increase may be somewhat surprising. Arguably the
more interesting questions are whether this relatively large increase in prescription drug use associated
with gaining prescription drug insurance was associated with changes in the use of other health care
services and changes in health. To investigate this issue we examined the association between
prescription drug insurance and the use of outpatient services, hospitalization, functional health and
general health status for the general population of elderly and for those who reported several chronic
illnesses.
24
Overall, we found little evidence that prescription drug insurance was strongly associated with
outpatient services, hospitalization, functional status and general health. Estimates of associations
between prescription drug insurance and these outcomes were usually small—10 to 15 percent of the
mean or of a standard deviation—and not statistically significant. In addition, in most cases, signs of
estimates of the effect of prescription drug insurance were not consistent with a decrease use in inpatient
and outpatient services, or of an improvement in health, as suggested by conventional wisdom. Indeed, in
the case of functional status (ADL and IADL), every estimate was positive suggesting that prescription
drug insurance was associated with worsening functional health. Similarly, it was always the case that
prescription drug insurance was associated with a higher probability of being admitted to the hospital, and
most estimates indicate that prescription drug insurance was associated with an increase in the probability
of having a relatively large number of outpatient visits. However, for most outcomes, we lacked the
statistical power to detect reliably effect sizes less than 33 percent of a standard deviation or of the mean.
Thus, we cannot reject that prescription drug insurance was associated with improvements in health or
decreases in the use of inpatient services of approximately 15 to 20 percent of mean, but we can reject
larger, beneficial effects for these outcomes.
We can compare the change in spending on prescription drugs implied by our estimates with
potential changes in non-pharmacy medical spending using estimates of the effect of prescription drug
insurance on the use of other services and health. Estimates suggest that use of prescription drugs
increased by approximately 60% for those who gained coverage as a result of Medicare Part D. We
assume that gaining prescription drug coverage was associated with a similar increase in spending on
prescription drugs. According to the Centers for Medicare and Medicaid Services (CMS), average
spending on prescription drugs among elderly was $1600 per person in 2004.18 We assume that spending
on prescription drugs for those without insurance was 70% of average spending, which is consistent with
the pre-Medicare Part D ratio of prescription drug use of the uninsured to the average of the sample.
18 See http://www.cms.gov/NationalHealthExpendData/downloads/2004-age-tables.pdf, last accessed August 5, 2010.
25
Using these assumptions, we estimate that spending on prescription drugs increased by approximately
$670 per person per year as a result of gaining prescription drug coverage through Medicare Part D.19
Data from CMS also indicate that average spending on hospital and physician services was $8400 per
person in 2004. If we assume that those without prescription drug insurance spent the same amount on
these services as the average, and that prescription drug insurance improved health and reduced spending
on these services by 20%, which is the largest potential improvements that our estimates imply for
outcomes we measured, then spending on these services would decrease by approximately $1200. If we
assume a 10% improvement instead of 20%, then spending on these services would decrease by
approximately $600. In sum, our estimates suggest that the increase in prescription drug spending as a
result of Part D would most likely result in a net increase in total spending on health care. The upshot of
this discussion is that while our estimates are relatively imprecise, they are suggestive that the increase
use of prescription drugs associated with gaining prescription drug insurance as a result of Medicare Part
D is not likely to produce a net gain, although estimates do not rule out that possibility.
Our results are similar to those reported in Zhang et al. (2009) who conducted an analysis of the
effects of Medicare Part D and prescription drug insurance for a sample of Medicare Advantage enrollees
in Pennsylvania, and reported that prescription drug insurance was associated with a reduction in non-
pharmacy spending. However, Zhang et al. (2009) reported that prescription drug insurance was still
associated with an increase in total spending, as the increase in spending on prescription drugs was
greater than the decrease in other types of spending. This finding is consistent with the most likely
scenario based on our findings. Moreover, the lower spending on non-pharmacy services reported by
Zhang et al. (2009) was only in the second year of Medicare Part D. Finally, the reduction in non-
pharmacy spending was quite small—7 percent—and consistent with our calculations above that suggest
that gaining prescription drug insurance as a result of Medicare Part D is most likely associated with an
increase in total spending on health care.
19 The $670 (actually $672) is obtained by multiplying $1600 by 0.7 (uninsured spending) multiplied by 0.6 increase in use as a result of gaining coverage [$672=($1600*0.7)*0.6].
26
The findings from our study raise questions as to the value of the large increase in prescription
drug use that was associated with prescription drug coverage gained through Medicare Part D. Taken at
face value (i.e., using point estimates), these results suggest that much of the additional use of prescription
drugs that results from gaining prescription drug insurance is relatively low value in terms of offsetting
benefits from less use of other services and better health. While we acknowledge the limitations of our
health measures and the limited statistical power of our analyses, the absence of any strong evidence
(again point estimates) that health improved as a result of gaining prescription drug coverage should at a
minimum, motivate much more study of the issue. It is an issue of central importance to assessing the
efficacy of Medicare Part D and there is insufficient exiting evidence to inform policy.
27
References
Adams AS, Soumerai SB, Ross-Degnan D. “The case for a Medicare drug coverage benefit: a critical
review of the empirical evidence.” Annu Rev Public Health 2001;22: 49-61. Briesacher, B. A., B. Stuart, X. Ren, J. A. Doshi, and M. V. Wrobel. 2005. “Medicare beneficiaries and
the impact of gaining prescription drug coverage on inpatient and physician spending.” Health
Serv Res 40(5 Pt 1): 1279-96.
Chandra, A., J. Gruber, and R. McKnight. 2007. “Patient cost – sharing, hospitalization offsets, and the
design of optimal health insurance for the elderly.” National Bureau of Economic Research
working Paper 12972.
Duggan, M. and F.S. Scott. 2010. “The Effect of Medicare Part D on Pharmaceutical Prices and
Utilization.” American Economic Review 100(1):590-607.
Eppig, F. J. and G. S. Chulis. 1997. “Matching MCBS (Medicare Current Beneficiary Survey) and
Medicare data: the best of both worlds.” Health Care Financ Rev 18(3): 211-29.
Goldman, D. P., G. F. Joyce, and Y. Zheng. 2007. “Prescription drug cost sharing: associations with
medication and medical utilization and spending and health.” JAMA 298(1): 61-9.
Hsu, J., M. Price, J. Huang, R. Brand, V. Fung, R. Hui, B. Fireman, J. P. Newhouse, and J. V. Selby.
2006. “Unintended consequences of caps on Medicare drug benefits.” N Engl J Med 354(22):
2349-59.
Johnson, R. E., M. J. Goodman, M. C. Hornbrook, and M. B. Eldredge. 1997. “The effect of increased
prescription drug cost-sharing on medical care utilization and expenses of elderly health
maintenance organization members.” Med Care 35(11): 1119-31.
Khan, N. and R. Kaestner. 2009. “Effect of prescription drug coverage on the elderly's use of prescription
drugs.” Inquiry 46(1): 33-45.
Levy H, Weir DR. 2009. “Take-up of Medicare Part D: results from the Health and Retirement Study.” J
Gerontol B Psychol Sci Soc Sci Dec 24. Lichtenberg, F. R. and S. X. Sun. 2007. “The impact of Medicare Part D on prescription drug use by the
elderly.” Health Aff (Millwood) 26(6): 1735-44.
Lillard, L. A., J. Rogowski, and R. Kington. 1999. “Insurance coverage for prescription drugs: effects on
use and expenditures in the Medicare population.” Med Care 37(9): 926-36.
Madden JM, Graves AJ, Zhang F, Adams AS, Briesacher BA, Ross-Degnan D, Gurwitz JH, Pierre-
Jacques M, Safran DG, Adler GS, Soumerai SB. 2008. “Cost-related medication nonadherence
and spending on basic needs following implementation of Medicare Part D.” JAMA Apr
23;299(16): 1922-8.
28
Piette, J. D., M. Heisler, and T. H. Wagner. 2004. “Problems paying out-of-pocket medication costs
among older adults with diabetes.” Diabetes Care 27(2): 384-91.
Safran DG, Neuman P, Schoen C, Kitchman MS, Wilson IB, Cooper B, Li A, Chang H, Rogers WH.
2005. “Prescription drug coverage and seniors: findings from a 2003 national survey.” Health Aff
Jan-Jun;Suppl Web Exclusives:W5-152-W5-166. Shea, D. G., J. V. Terza, B. C. Stuart, and B. Briesacher. 2007. “Estimating the effects of prescription
drug coverage for Medicare beneficiaries.” Health Serv Res 42(3 Pt 1): 933-49.
Soumerai, S. B., D. Ross-Degnan, J. Avorn, T. McLaughlin, and I. Choodnovskiy. 1991. “Effects of
Medicaid drug-payment limits on admission to hospitals and nursing homes.” N Engl J Med
325(15): 1072-7.
Yang, Z., D. B. Gilleskie, and E. C. Norton. 2004. “Prescription drugs, medical care, and health
outcomes: a model of elderly health dynamics.” National Bureau of Economic Research working
paper 10964.
Yin, W., A. Basu, J. X. Zhang, A. Rabbani, D. O. Meltzer, and G. C. Alexander. 2008. “The effect of the
Medicare Part D prescription benefit on drug utilization and expenditures.” Ann Intern Med
148(3): 169-77.
Zhang, Y., J. M. Donohue, J. P. Newhouse, and J. R. Lave. 2009. “The effects of the coverage gap on
drug spending: a closer look at Medicare Part D.” Health Aff (Millwood) 28(2): w317-25.
29
Table 1 Proportion of Medicare Enrollees without Prescription Drug Insurance
By Likelihood of Being Uninsured Prior to Medicare Part D
2000 2001 2002 2003 2004 2006 2007
2006-2004
Dif-in-Dif
2007-2004
Dif-in-Dif
Full Sample 0.33 0.32 0.31 0.31 0.31 0.11 0.11 -0.20 -0.20
1st Quartile Predicted Uninsured 0.16 0.17 0.15 0.16 0.17 0.06 0.06 -0.11 -0.11 2nd Quartile Predicted Uninsured 0.25 0.24 0.23 0.25 0.26 0.08 0.10 -0.18 -0.06***
(0.02) -0.16 -0.04**
(0.02) 3rd Quartile Predicted Uninsured 0.34 0.32 0.33 0.31 0.31 0.13 0.12 -0.18 -0.07***
(0.02) -0.19 -0.08***
(0.02) 4th Quartile Predicted Uninsured 0.53 0.52 0.51 0.50 0.50 0.17 0.17 -0.33 -0.22***
(0.02) -0.33 -0.23***
(0.02) Source: MCBS Survey Cost and Use File 2000-2006 and MCBS Access to Care File 2007 Notes: Uninsured is defined as probability of uninsured prior to Medicare Part D and is a function of demographic and socioeconomic characteristics and their interactions. There is some inconsistency among the figures because of rounding. *0.05 < p-value <=0.10; ** 0.01 < p-value <=0.05; *** p-value <=0.01
30
Table 2 Estimates of the Effect of Medicare Part D on the Probability of Having Prescription Drug Insurance
Quartile Specification Full Sample Chronically Ill
2nd Quartile Uninsured*Year 2006 0.06*** (0.02)
0.07*** (0.02)
3rd Quartile Uninsured*Year 2006 0.08*** (0.02)
0.08*** (0.02)
4th Quartile Uninsured*Year 2006 0.23*** (0.02)
0.24*** (0.03)
2nd Quartile Uninsured*Year 2007 0.05** (0.02)
0.07*** (0.02)
3rd Quartile Uninsured*Year 2007 0.09*** (0.02)
0.10*** (0.02)
4th Quartile Uninsured*Year 2007 0.24*** (0.02)
0.27*** (0.03)
P-Value, Joint Test of Significance, Year 2006-2007 Interactions
0.00
0.00
P-Value, Joint Test of Significance, Pre-Year 2006-2007 Interactions
0.48
0.53
Quadratic Specification
Predicted Uninsured*Year 2006 0.10 (0.16)
0.18 (0.19)
Predicted Uninsured Sq.*Year 2006 0.70*** (0.23)
0.66** (0.29)
Predicted Uninsured*Year 2007 0.10 (0.15)
0.19 (0.19)
Predicted Uninsured Sq.*Year 2007 0.78*** (0.21)
0.74*** (0.27)
P-Value, Joint Test of Significance, Year 2006-2007 Interactions
0.00
0.00
P-Value, Joint Test of Significance, Pre-Year 2006 Interactions
0.40
0.21
Number of Observations
41631
23166
Source: MCBS Survey Cost and Use File 2000-2006 and MCBS Access to Care File 2007 Notes: Dependent variable is whether person has prescription drug insurance. Estimates are from an OLS (linear probability) regression. Reference category is 1st Quartile Uninsured. Covariates are: female, age dummy variables, race categories, marital status, income categories, education categories, rural, smoking status, and year fixed effects. Robust standard errors (clustered on person) are in parentheses. *0.05 < p-value <=0.10; ** 0.01 < p-value <=0.05; *** p-value <=0.01
31
Table 3 Number of Annual Prescriptions of Medicare Enrollees By Likelihood of Being Uninsured Prior to Medicare Part D
2000 2001 2002 2003 2004 2006 2006-2004
Dif-in-Dif
Full Sample 24.32 25.02 25.76 26.57 26.59 32.00 5.41 24.32
1st Quartile Predicted Uninsured
21.90 22.88 24.04 24.09 24.38 29.31 4.93
2nd Quartile Predicted Uninsured
24.08 25.29 25.10 26.42 25.90 31.46 5.56 0.63 (1.36)
3rd Quartile Predicted Uninsured
24.89 25.26 26.70 27.70 26.66 30.85 4.19 -0.74 (1.32)
4th Quartile Predicted Uninsured
26.05 26.39 26.07 28.09 29.64 37.08 7.44 2.51* (1.47)
Source: MCBS Survey Cost and Use File 2000-2006 and MCBS Access to Care File 2007. Notes: Uninsured is defined as probability of uninsured prior to Medicare Part D and is a function of demographic, socioeconomic characteristics and their interactions. There is some inconsistency among the figures because of rounding. *0.05 < p-value <=0.10; ** 0.01 < p-value <=0.05; *** p-value <=0.01
32
Table 4
Estimates of Effect of Prescription Drug Insurance on Annual Number of Prescription Drugs
Full Sample Chronically Ill
Quartile Specification OLS-IV OLS-IV Prescription Drug Insurance 17.14***
(5.01) 20.62***
(6.79) P-Value, Joint Test of Significance, Excluded Instruments in First Stage
0.00
0.00
P-Value, Over Identification Restrictions 0.25 0.26
Quadratic Specification Prescription Drug Insurance 15.67***
(4.73) 19.26***
(6.25) P-Value, Joint Test of Significance, Excluded Instruments in First Stage
0.00
0.00
P-Value, Over Identification Restrictions 0.18 0.10 Number of Observations 34538 19291 Mean (Std. Dev.) of Dep. Var. for Uninsured in 2003
23.49
(21.95)
32.59
(23.49) Source: MCBS Survey Cost and Use File 2000-2006. Notes: Reference category is 1st Quartile Uninsured. Covariates are: female, age categories, race categories, marital status, income categories, education categories, rural, smoking status , and year fixed effects. Robust standard errors (clustered on person) are in parentheses. *0.05 < p-value <=0.10; ** 0.01 < p-value <=0.05; *** p-value <=0.01
33
Table 5 Probability of Hospitalization and Number of Annual Outpatient Visits of Medicare Enrollees
By Likelihood of Being Uninsured Prior to Medicare Part D
Hospitalization 2000 2001 2002 2003 2004 2006 2006-2004
Dif-in-Dif
Full Sample 0.18 0.18 0.18 0.18 0.16 0.16 0.00
1st Quartile Predicted Uninsured 0.16 0.16 0.14 0.15 0.14 0.13 -0.01
2nd Quartile Predicted Uninsured 0.18 0.19 0.18 0.18 0.16 0.18 0.02 0.02 (0.02)
3rd Quartile Predicted Uninsured 0.18 0.18 0.21 0.18 0.16 0.16 0.00 0.00 (0.02)
4th Quartile Predicted Uninsured 0.18 0.20 0.19 0.19 0.19 0.18 -0.01 -0.01 (0.02)
Annual Outpatient Visits
Full Sample 3.53 3.75 3.87 4.00 3.93 4.09 0.16
1st Quartile Predicted Uninsured 2.91 3.22 3.46 3.52 3.47 3.66 0.19
2nd Quartile Predicted Uninsured 3.57 3.72 3.53 3.82 3.85 4.09 0.24 0.05 (0.43)
3rd Quartile Predicted Uninsured 3.42 3.77 4.17 4.24 4.10 4.14 0.04 -0.14 (0.43)
4th Quartile Predicted Uninsured 4.13 4.23 4.30 4.40 4.34 4.53 0.19 0.00 (0.44)
Source: MCBS Survey Cost and Use File 2000-2006 Notes: Uninsured is defined as probability of uninsured prior to Medicare Part D and is a function of demographic and socioeconomic characteristics and their interactions. *= 0.05 < p-value <=0.10; **= 0.01 < p- value <=0.05; ***= p-value <=0.01
34
Table 6 Estimates of Effect of Prescription Drug Insurance on the Probability of Hospitalization and Number of Outpatient Visits
Full Sample Chronically Ill Sample Hospitalization Outpatient
Visits Outpatient Visits>2
Outpatient Visits>5
Hospitalization Outpatient Visits
Outpatient Visits>2
Outpatient Visits>5
Quartile Specification
OLS-IV
OLS-IV
OLS-IV
OLS-IV
OLS-IV
OLS-IV
OLS-IV
OLS-IV
Prescription Drug Insurance 0.03 (0.06)
-0.89 (1.35)
0.06 (0.08)
0.05 (0.07)
0.08 (0.09)
-0.64 (1.81)
-0.01 (0.10)
0.10 (0.10)
P-Value, Joint Test of Significance, Excluded Instruments in First Stage
0.00
0.00
0.00
0.00
0.00
0.00
0.00
0.00
P-Value, Over Identification Restrictions
0.22 0.80 0.87 0.20 0.32 0.38 0.50 0.72
Quadratic Specification
Prescription Drug Insurance 0.04 (0.06)
-0.66 (1.21)
0.02 (0.08)
0.05 (0.06)
0.08 (0.08)
-1.80 (1.58)
-0.04 (0.10)
0.03 (0.09)
P-Value, Joint Test of Significance, Excluded Instruments in First Stage
0.00
0.00
0.00
0.00
0.00
0.00
0.00
0.00
P-Value, Over Identification Restrictions
0.36 0.91 0.42 0.83 0.70 0.68 0.28 0.50
Number of Observations
34538 34538 34538 34538 19291 19291 19291 19291
Mean (Std. Dev.) of Dep. Var. for
Uninsured in 2003
0.18
4.06 (7.30)
0.43
.020
0.24
5.23 (8.15)
0.53
0.29
Source: MCBS Survey Cost and Use File 2000-2006 Notes: Reference category is 1st Quartile Uninsured. Covariates are: female, age categories, race categories, marital status, income categories, education categories, rural, smoking status, and year fixed effects. Robust standard errors (clustered on person) are in parentheses. *0.05 < p-value <=0.10; ** 0.01 < p-value <=0.05; *** p-value <=0.01
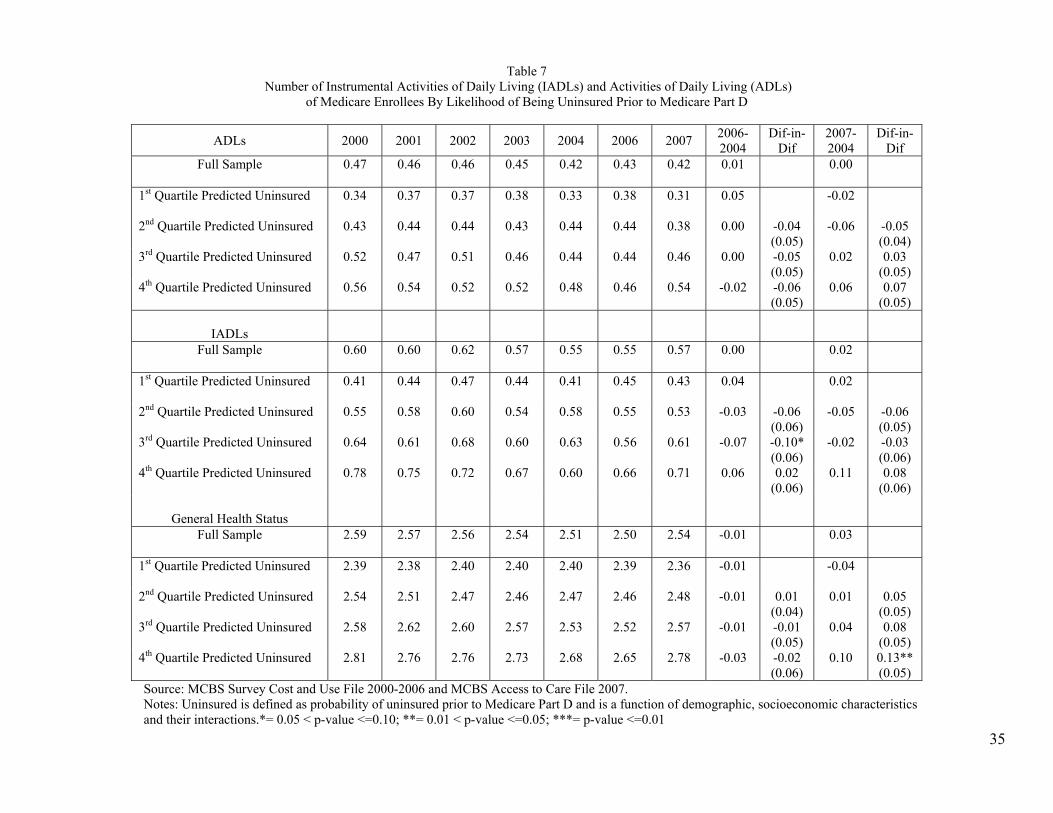
35
Table 7
Number of Instrumental Activities of Daily Living (IADLs) and Activities of Daily Living (ADLs) of Medicare Enrollees By Likelihood of Being Uninsured Prior to Medicare Part D
ADLs 2000 2001 2002 2003 2004 2006 2007 2006-2004
Dif-in-Dif
2007-2004
Dif-in-Dif
Full Sample 0.47 0.46 0.46 0.45 0.42 0.43 0.42 0.01 0.00
1st Quartile Predicted Uninsured 0.34 0.37 0.37 0.38 0.33 0.38 0.31 0.05
-0.02
2nd Quartile Predicted Uninsured 0.43 0.44 0.44 0.43 0.44 0.44 0.38 0.00 -0.04 (0.05)
-0.06 -0.05 (0.04)
3rd Quartile Predicted Uninsured 0.52 0.47 0.51 0.46 0.44 0.44 0.46 0.00 -0.05 (0.05)
0.02 0.03 (0.05)
4th Quartile Predicted Uninsured 0.56 0.54 0.52 0.52 0.48 0.46 0.54 -0.02 -0.06 (0.05)
0.06 0.07 (0.05)
IADLs
Full Sample 0.60 0.60 0.62 0.57 0.55 0.55 0.57 0.00 0.02
1st Quartile Predicted Uninsured 0.41 0.44 0.47 0.44 0.41 0.45 0.43 0.04
0.02
2nd Quartile Predicted Uninsured 0.55 0.58 0.60 0.54 0.58 0.55 0.53 -0.03 -0.06 (0.06)
-0.05 -0.06 (0.05)
3rd Quartile Predicted Uninsured 0.64 0.61 0.68 0.60 0.63 0.56 0.61 -0.07 -0.10* (0.06)
-0.02 -0.03 (0.06)
4th Quartile Predicted Uninsured 0.78 0.75 0.72 0.67 0.60 0.66 0.71 0.06 0.02 (0.06)
0.11 0.08 (0.06)
General Health Status
Full Sample 2.59 2.57 2.56 2.54 2.51 2.50 2.54 -0.01 0.03
1st Quartile Predicted Uninsured 2.39 2.38 2.40 2.40 2.40 2.39 2.36 -0.01
-0.04
2nd Quartile Predicted Uninsured 2.54 2.51 2.47 2.46 2.47 2.46 2.48 -0.01 0.01 (0.04)
0.01 0.05 (0.05)
3rd Quartile Predicted Uninsured 2.58 2.62 2.60 2.57 2.53 2.52 2.57 -0.01 -0.01 (0.05)
0.04 0.08 (0.05)
4th Quartile Predicted Uninsured 2.81 2.76 2.76 2.73 2.68 2.65 2.78 -0.03 -0.02 (0.06)
0.10 0.13** (0.05)
Source: MCBS Survey Cost and Use File 2000-2006 and MCBS Access to Care File 2007. Notes: Uninsured is defined as probability of uninsured prior to Medicare Part D and is a function of demographic, socioeconomic characteristics and their interactions.*= 0.05 < p-value <=0.10; **= 0.01 < p-value <=0.05; ***= p-value <=0.01
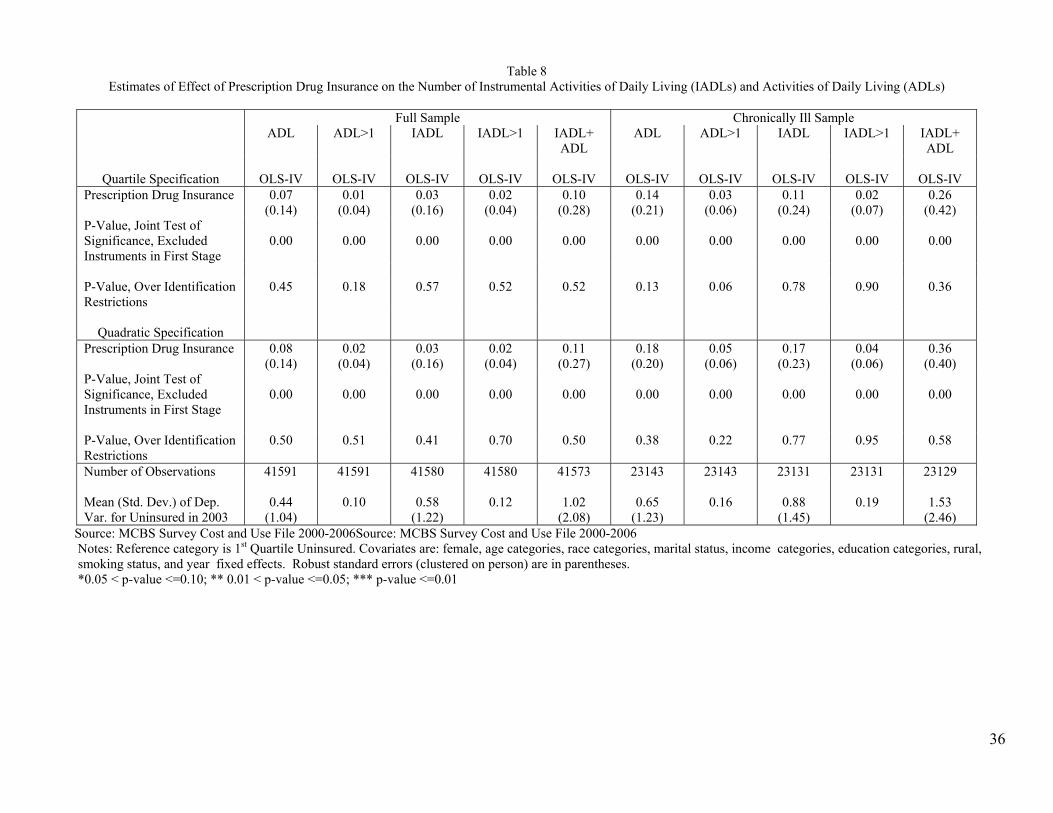
36
Table 8
Estimates of Effect of Prescription Drug Insurance on the Number of Instrumental Activities of Daily Living (IADLs) and Activities of Daily Living (ADLs)
Full Sample Chronically Ill Sample ADL ADL>1 IADL IADL>1 IADL+
ADL ADL ADL>1 IADL IADL>1 IADL+
ADL
Quartile Specification
OLS-IV
OLS-IV
OLS-IV
OLS-IV
OLS-IV
OLS-IV
OLS-IV
OLS-IV
OLS-IV
OLS-IV Prescription Drug Insurance 0.07
(0.14) 0.01
(0.04) 0.03
(0.16) 0.02
(0.04) 0.10
(0.28) 0.14
(0.21) 0.03
(0.06) 0.11
(0.24) 0.02
(0.07) 0.26
(0.42) P-Value, Joint Test of Significance, Excluded Instruments in First Stage
0.00
0.00
0.00
0.00
0.00
0.00
0.00
0.00
0.00
0.00
P-Value, Over Identification Restrictions
0.45 0.18 0.57 0.52 0.52 0.13 0.06 0.78 0.90 0.36
Quadratic Specification
Prescription Drug Insurance 0.08 (0.14)
0.02 (0.04)
0.03 (0.16)
0.02 (0.04)
0.11 (0.27)
0.18 (0.20)
0.05 (0.06)
0.17 (0.23)
0.04 (0.06)
0.36 (0.40)
P-Value, Joint Test of Significance, Excluded Instruments in First Stage
0.00
0.00
0.00
0.00
0.00
0.00
0.00
0.00
0.00
0.00
P-Value, Over Identification Restrictions
0.50 0.51 0.41 0.70 0.50 0.38 0.22 0.77 0.95 0.58
Number of Observations 41591 41591 41580 41580 41573 23143 23143 23131 23131 23129 Mean (Std. Dev.) of Dep. Var. for Uninsured in 2003
0.44
(1.04)
0.10
0.58
(1.22)
0.12
1.02
(2.08)
0.65
(1.23)
0.16
0.88
(1.45)
0.19
1.53
(2.46) Source: MCBS Survey Cost and Use File 2000-2006Source: MCBS Survey Cost and Use File 2000-2006 Notes: Reference category is 1st Quartile Uninsured. Covariates are: female, age categories, race categories, marital status, income categories, education categories, rural, smoking status, and year fixed effects. Robust standard errors (clustered on person) are in parentheses. *0.05 < p-value <=0.10; ** 0.01 < p-value <=0.05; *** p-value <=0.01
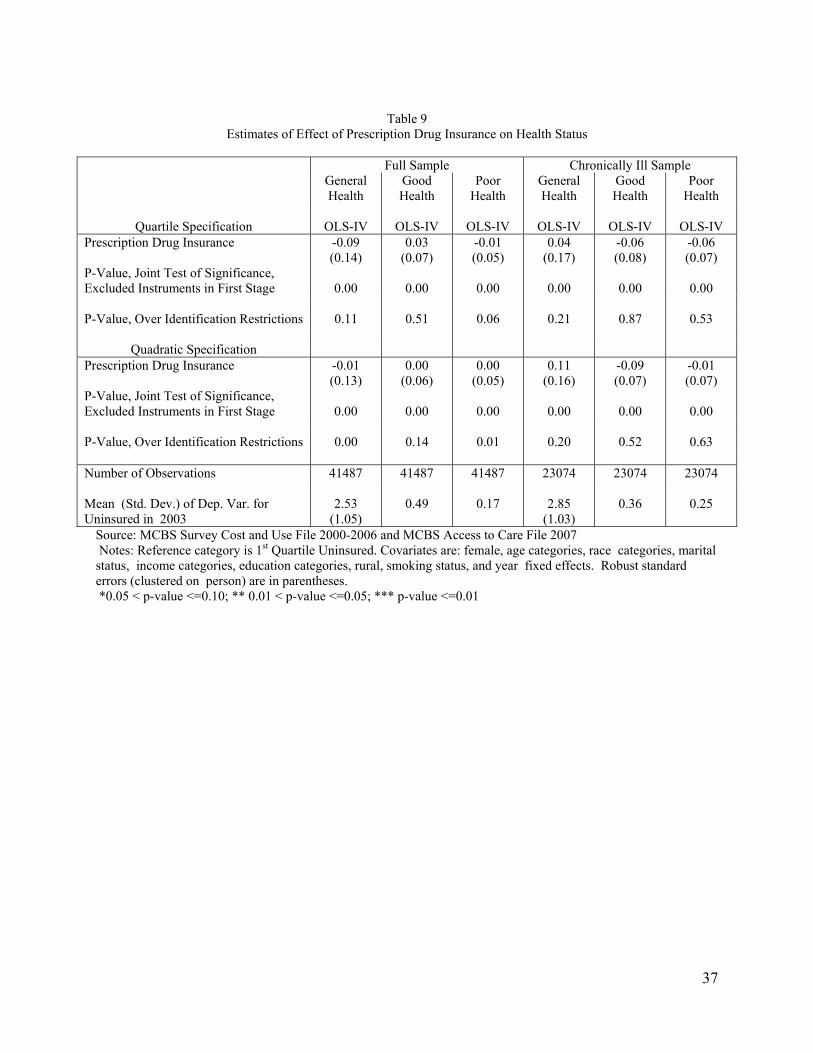
37
Table 9
Estimates of Effect of Prescription Drug Insurance on Health Status
Full Sample Chronically Ill Sample General
Health Good Health
Poor Health
General Health
Good Health
Poor Health
Quartile Specification
OLS-IV
OLS-IV
OLS-IV
OLS-IV
OLS-IV
OLS-IV
Prescription Drug Insurance -0.09 (0.14)
0.03 (0.07)
-0.01 (0.05)
0.04 (0.17)
-0.06 (0.08)
-0.06 (0.07)
P-Value, Joint Test of Significance, Excluded Instruments in First Stage
0.00
0.00
0.00
0.00
0.00
0.00
P-Value, Over Identification Restrictions 0.11 0.51 0.06 0.21 0.87 0.53
Quadratic Specification Prescription Drug Insurance -0.01
(0.13) 0.00
(0.06) 0.00
(0.05) 0.11
(0.16) -0.09 (0.07)
-0.01 (0.07)
P-Value, Joint Test of Significance, Excluded Instruments in First Stage
0.00
0.00
0.00
0.00
0.00
0.00
P-Value, Over Identification Restrictions 0.00 0.14 0.01 0.20 0.52 0.63 Number of Observations 41487 41487 41487 23074 23074 23074 Mean (Std. Dev.) of Dep. Var. for Uninsured in 2003
2.53
(1.05)
0.49
0.17
2.85
(1.03)
0.36
0.25
Source: MCBS Survey Cost and Use File 2000-2006 and MCBS Access to Care File 2007 Notes: Reference category is 1st Quartile Uninsured. Covariates are: female, age categories, race categories, marital status, income categories, education categories, rural, smoking status, and year fixed effects. Robust standard errors (clustered on person) are in parentheses. *0.05 < p-value <=0.10; ** 0.01 < p-value <=0.05; *** p-value <=0.01