Embed Size (px)
DESCRIPTION
Medical Malpractice Update. CASE 2004 Fall Meeting. Medical Malpractice Update. Topics change in players financial results reforms. Medical Malpractice Update. Medical Malpractice Update. Medical Malpractice Update. Still fairly spread out MLMIC, the largest, at 10% drops off quickly - PowerPoint PPT Presentation
Citation preview
September 23, 2004
James D. Hurley, ACAS, MAAA
© 2004 Towers Perrin
Medical Malpractice Update
CASE 2004 Fall Meeting
© 2004 Towers Perrin 2S:\People\hurlj\Presentations\040923 CASE 2004 Fall Meeting.ppt
Topics change in players financial results reforms
Medical Malpractice Update
© 2004 Towers Perrin 3S:\People\hurlj\Presentations\040923 CASE 2004 Fall Meeting.ppt
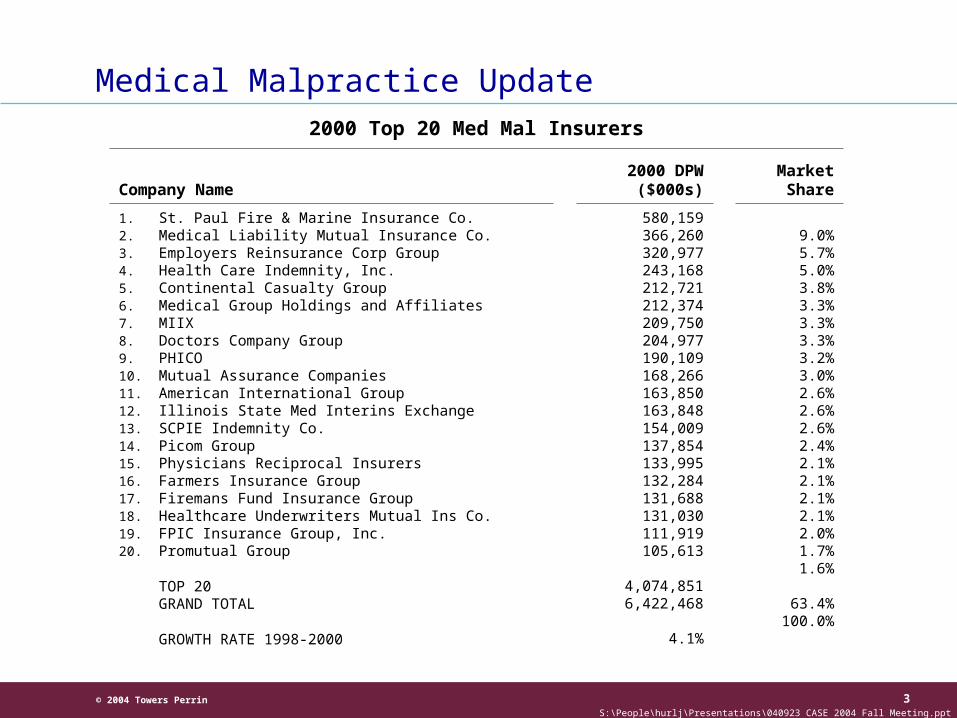
2000 Top 20 Med Mal Insurers
Company Name2000 DPW
($000s)Market Share
1. St. Paul Fire & Marine Insurance Co.2. Medical Liability Mutual Insurance Co.3. Employers Reinsurance Corp Group4. Health Care Indemnity, Inc.5. Continental Casualty Group6. Medical Group Holdings and Affiliates7. MIIX8. Doctors Company Group9. PHICO10. Mutual Assurance Companies11. American International Group12. Illinois State Med Interins Exchange13. SCPIE Indemnity Co.14. Picom Group15. Physicians Reciprocal Insurers16. Farmers Insurance Group17. Firemans Fund Insurance Group18. Healthcare Underwriters Mutual Ins Co.19. FPIC Insurance Group, Inc.20. Promutual Group
21. TOP 2022. GRAND TOTAL
23. GROWTH RATE 1998-2000
580,159366,260320,977243,168212,721212,374209,750204,977190,109168,266163,850163,848154,009137,854133,995132,284131,688131,030111,919105,613
4,074,8516,422,468
4.1%
9.0%5.7%5.0%3.8%3.3%3.3%3.3%3.2%3.0%2.6%2.6%2.6%2.4%2.1%2.1%2.1%2.1%2.0%1.7%1.6%
63.4%100.0%
Medical Malpractice Update
© 2004 Towers Perrin 4S:\People\hurlj\Presentations\040923 CASE 2004 Fall Meeting.ppt
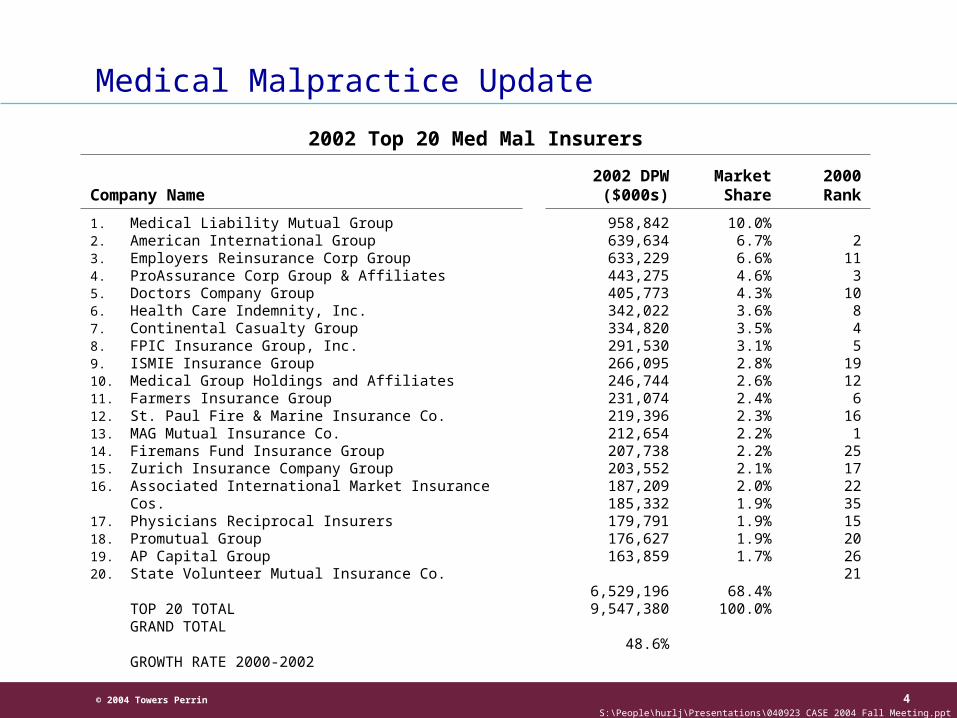
2002 Top 20 Med Mal Insurers
Company Name2002 DPW
($000s)Market Share
2000 Rank
1. Medical Liability Mutual Group2. American International Group3. Employers Reinsurance Corp Group4. ProAssurance Corp Group & Affiliates5. Doctors Company Group6. Health Care Indemnity, Inc.7. Continental Casualty Group8. FPIC Insurance Group, Inc.9. ISMIE Insurance Group10. Medical Group Holdings and Affiliates11. Farmers Insurance Group12. St. Paul Fire & Marine Insurance Co.13. MAG Mutual Insurance Co.14. Firemans Fund Insurance Group15. Zurich Insurance Company Group16. Associated International Market Insurance Cos.17. Physicians Reciprocal Insurers18. Promutual Group19. AP Capital Group20. State Volunteer Mutual Insurance Co.
21. TOP 20 TOTAL22. GRAND TOTAL
23. GROWTH RATE 2000-2002
958,842639,634633,229443,275405,773342,022334,820291,530266,095246,744231,074219,396212,654207,738203,552187,209185,332179,791176,627163,859
6,529,1969,547,380
48.6%
10.0%6.7%6.6%4.6%4.3%3.6%3.5%3.1%2.8%2.6%2.4%2.3%2.2%2.2%2.1%2.0%1.9%1.9%1.9%1.7%
68.4%100.0%
211
310
845
1912
616
12517223515202621
Medical Malpractice Update

© 2004 Towers Perrin 5S:\People\hurlj\Presentations\040923 CASE 2004 Fall Meeting.ppt
Still fairly spread out MLMIC, the largest, at 10% drops off quickly
Huge turnover... St. Paul, MIIX, Phico, SCPIE, ROA, Farmer’s over $1 Billion in premium moves some commercials step-up
Many new formations most are state specific (or even ‘group’ specific) getting into the game tougher
Medical Malpractice Update
© 2004 Towers Perrin 6S:\People\hurlj\Presentations\040923 CASE 2004 Fall Meeting.ppt
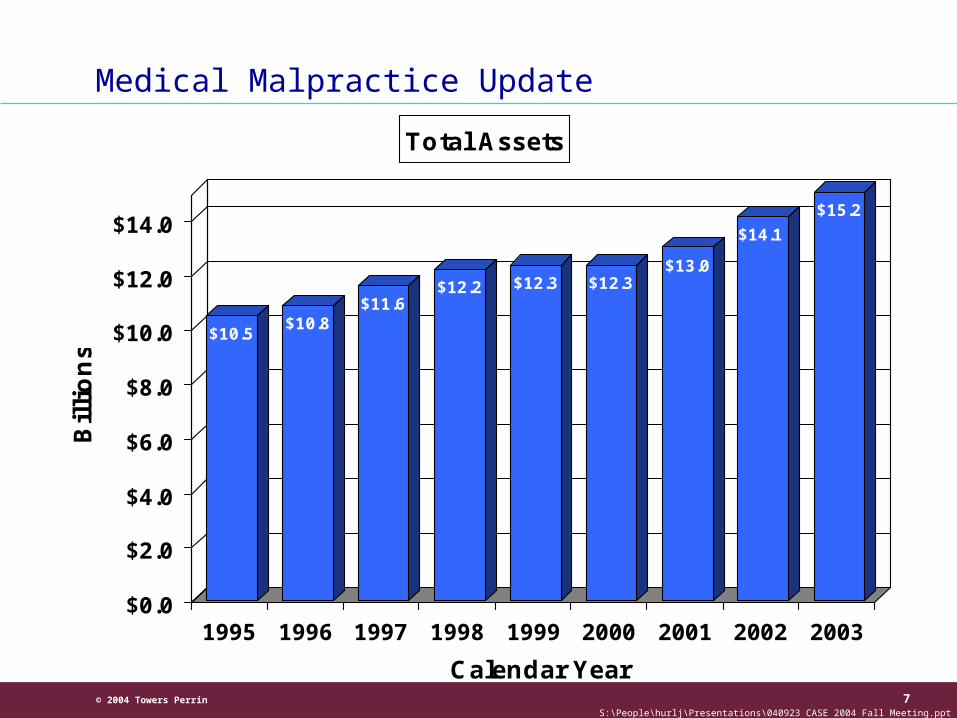
Financial Results – survey (ex. MLMIC) balance sheet income statement Schedule P
Medical Malpractice Update
© 2004 Towers Perrin 7S:\People\hurlj\Presentations\040923 CASE 2004 Fall Meeting.ppt
$10.5$10.8
$11.6$12.2 $12.3 $12.3
$13.0
$14.1
$15.2
$0.0
$2.0
$4.0
$6.0
$8.0
$10.0
$12.0
$14.0
Bil
lio
ns
1995 1996 1997 1998 1999 2000 2001 2002 2003
Calendar Year
Total Assets
Medical Malpractice Update
© 2004 Towers Perrin 8S:\People\hurlj\Presentations\040923 CASE 2004 Fall Meeting.ppt
0.0%
10.0%
20.0%
30.0%
40.0%
50.0%
60.0%
70.0%
80.0%
90.0%
100.0%
1995 1996 1997 1998 1999 2000 2001 2002 2003
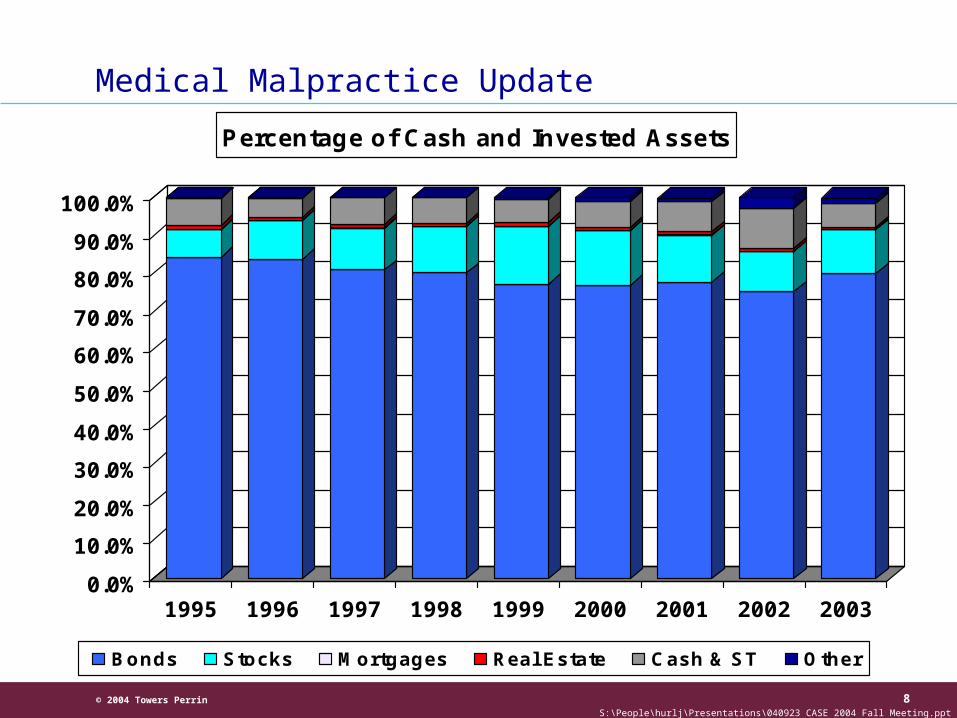
Percentage of Cash and Invested Assets
Bonds Stocks M ortgages Real Estate Cash & ST Other
Medical Malpractice Update
© 2004 Towers Perrin 9S:\People\hurlj\Presentations\040923 CASE 2004 Fall Meeting.ppt
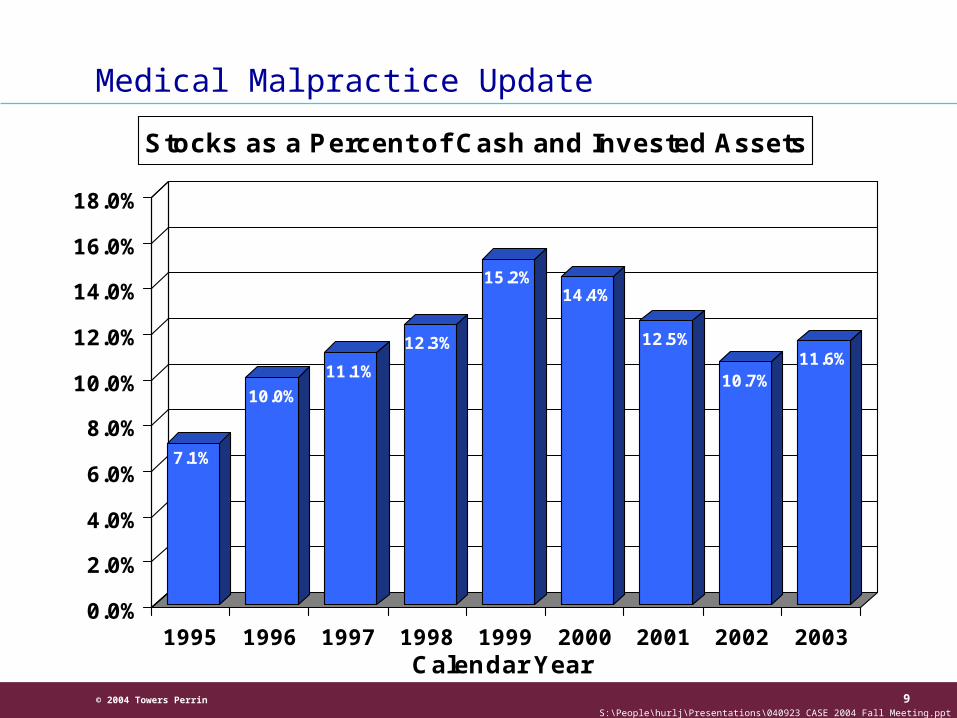
7.1%
10.0%
11.1%
12.3%
15.2%14.4%
12.5%
10.7%11.6%
0.0%
2.0%
4.0%
6.0%
8.0%
10.0%
12.0%
14.0%
16.0%
18.0%
1995 1996 1997 1998 1999 2000 2001 2002 2003Calendar Year
Stocks as a Percent of Cash and Invested Assets
Medical Malpractice Update

© 2004 Towers Perrin 10S:\People\hurlj\Presentations\040923 CASE 2004 Fall Meeting.ppt
15%
97%
112%
17%
92%
109%
19%
92%
111%
21%
92%
114%
22%
91%
113%
22%
98%
120%
22%
113%
134%
18%
111%
129%
17%
105%
122%
0%
20%
40%
60%
80%
100%
120%
140%
1995 1996 1997 1998 1999 2000 2001 2002 2003
Calendar Year
Comparison of Loss, Underwriting Expense & Combined Ratios
Underwriting Expense Loss Combined
Medical Malpractice Update
© 2004 Towers Perrin 11S:\People\hurlj\Presentations\040923 CASE 2004 Fall Meeting.ppt
97%
108%
92%
101%
92%
106%
92%
118%
91%
115%
98%
122%
113%
128%
111%110%105%
100%
0%
20%
40%
60%
80%
100%
120%
140%
1995 1996 1997 1998 1999 2000 2001 2002 2003
Calendar Year
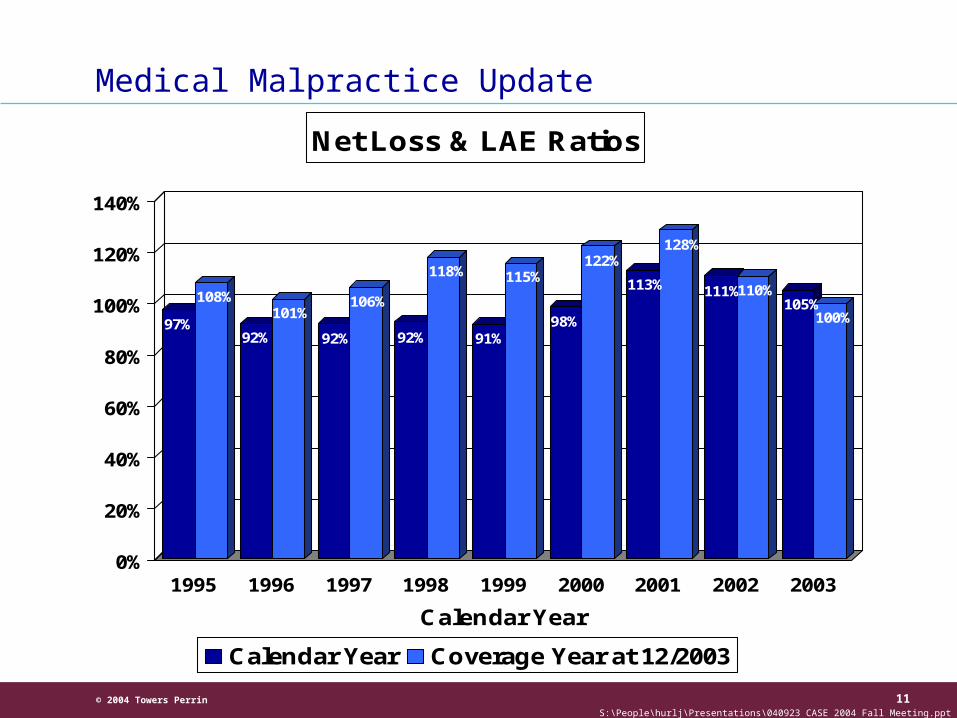
Net Loss & LAE Ratios
Calendar Year Coverage Year at 12/2003
Medical Malpractice Update
© 2004 Towers Perrin 12S:\People\hurlj\Presentations\040923 CASE 2004 Fall Meeting.ppt
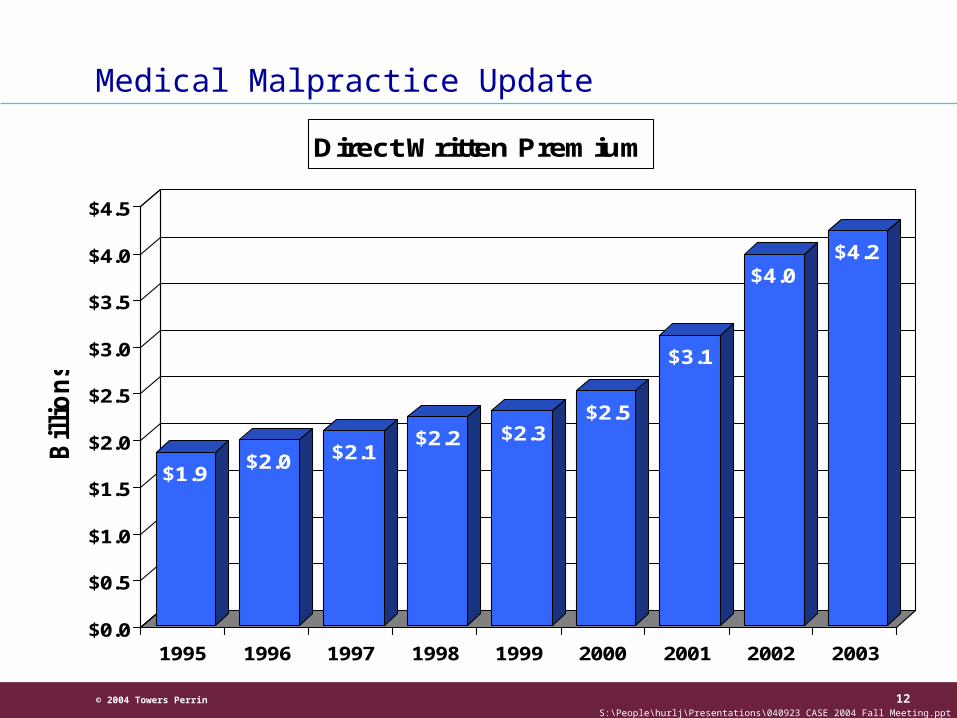
$1.9$2.0 $2.1
$2.2 $2.3$2.5
$3.1
$4.0$4.2
$0.0
$0.5
$1.0
$1.5
$2.0
$2.5
$3.0
$3.5
$4.0
$4.5
Bil
lio
ns
1995 1996 1997 1998 1999 2000 2001 2002 2003
Direct Written Premium
Medical Malpractice Update
© 2004 Towers Perrin 13S:\People\hurlj\Presentations\040923 CASE 2004 Fall Meeting.ppt
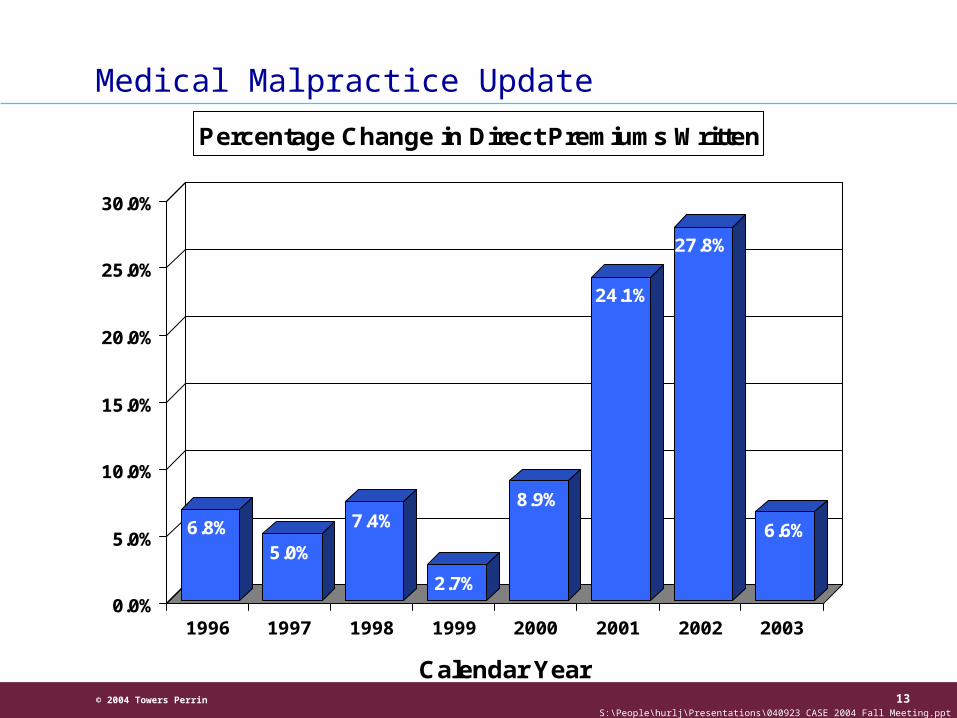
6.8%5.0%
7.4%
2.7%
8.9%
24.1%
27.8%
6.6%
0.0%
5.0%
10.0%
15.0%
20.0%
25.0%
30.0%
1996 1997 1998 1999 2000 2001 2002 2003
Calendar Year
Percentage Change in Direct Premiums Written
Medical Malpractice Update
© 2004 Towers Perrin 14S:\People\hurlj\Presentations\040923 CASE 2004 Fall Meeting.ppt
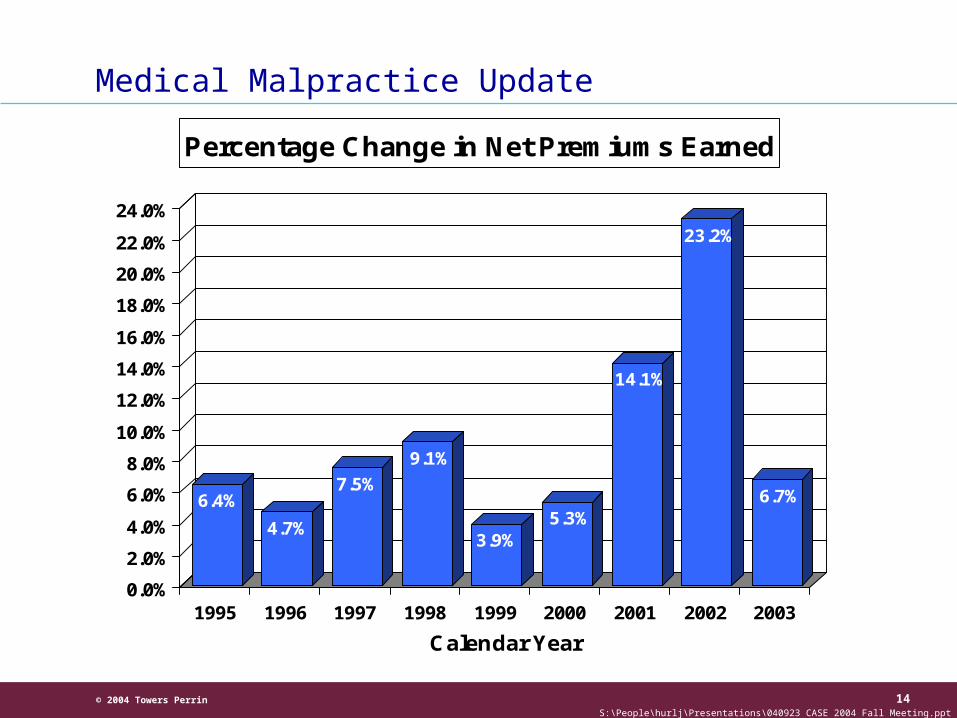
6.4%
4.7%
7.5%
9.1%
3.9%5.3%
14.1%
23.2%
6.7%
0.0%
2.0%
4.0%
6.0%
8.0%
10.0%
12.0%
14.0%
16.0%
18.0%
20.0%
22.0%
24.0%
1995 1996 1997 1998 1999 2000 2001 2002 2003
Calendar Year
Percentage Change in Net Premiums Earned
Medical Malpractice Update
© 2004 Towers Perrin 15S:\People\hurlj\Presentations\040923 CASE 2004 Fall Meeting.ppt
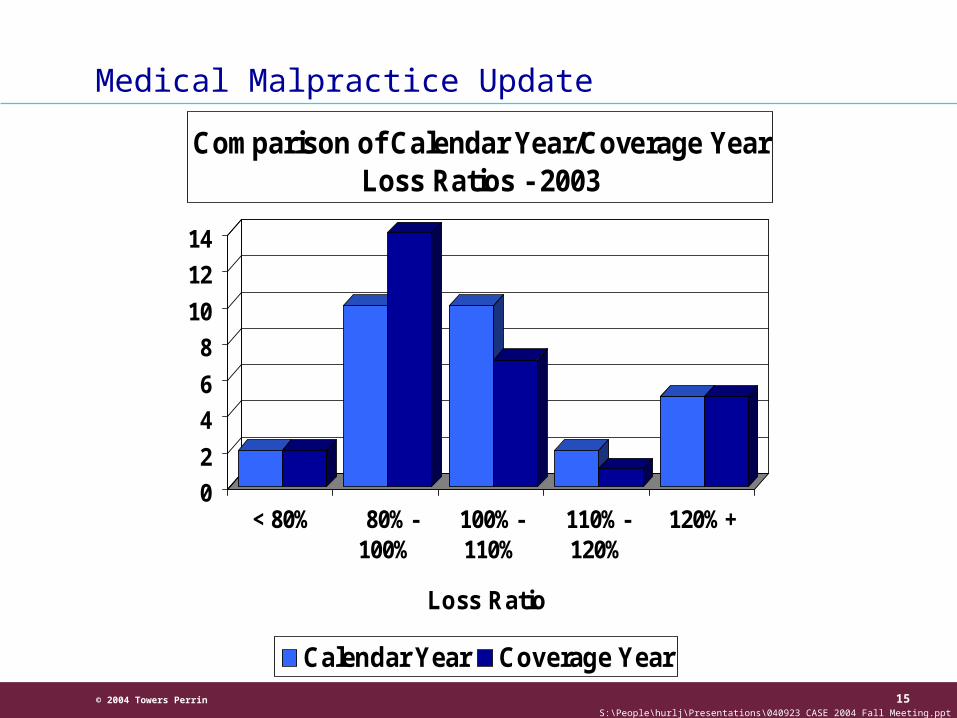
0
2
4
6
8
10
12
14
< 80% 80%-100%
100%-110%
110%-120%
120%+
Loss Ratio
Comparison of Calendar Year/Coverage Year Loss Ratios - 2003
Calendar Year Coverage Year
Medical Malpractice Update
© 2004 Towers Perrin 16S:\People\hurlj\Presentations\040923 CASE 2004 Fall Meeting.ppt
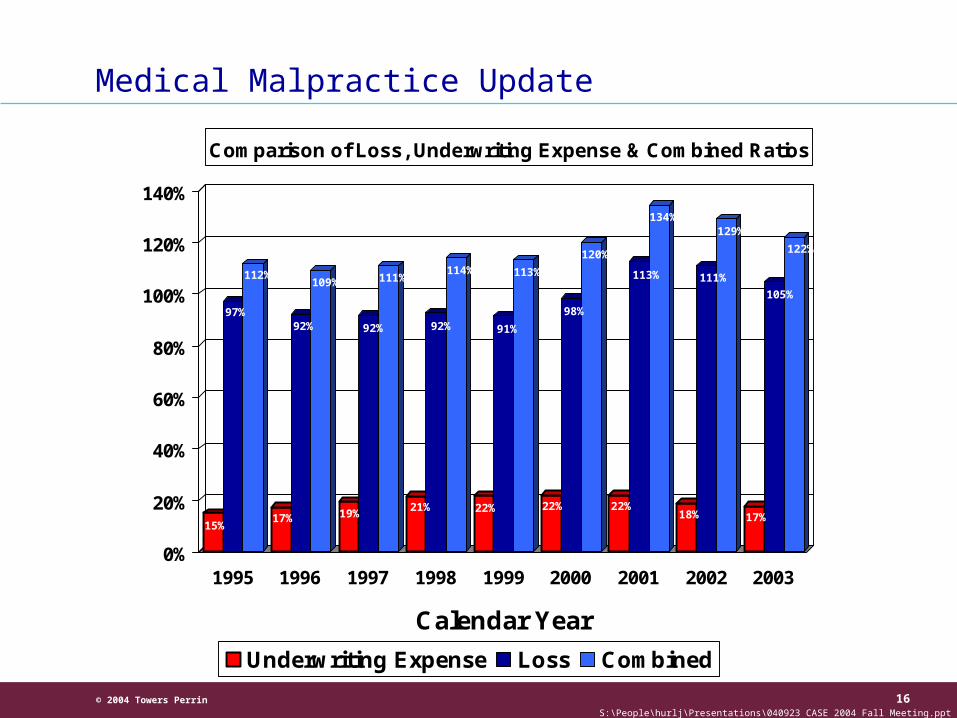
15%
97%
112%
17%
92%
109%
19%
92%
111%
21%
92%
114%
22%
91%
113%
22%
98%
120%
22%
113%
134%
18%
111%
129%
17%
105%
122%
0%
20%
40%
60%
80%
100%
120%
140%
1995 1996 1997 1998 1999 2000 2001 2002 2003
Calendar Year
Comparison of Loss, Underwriting Expense & Combined Ratios
Underwriting Expense Loss Combined
Medical Malpractice Update
© 2004 Towers Perrin 17S:\People\hurlj\Presentations\040923 CASE 2004 Fall Meeting.ppt
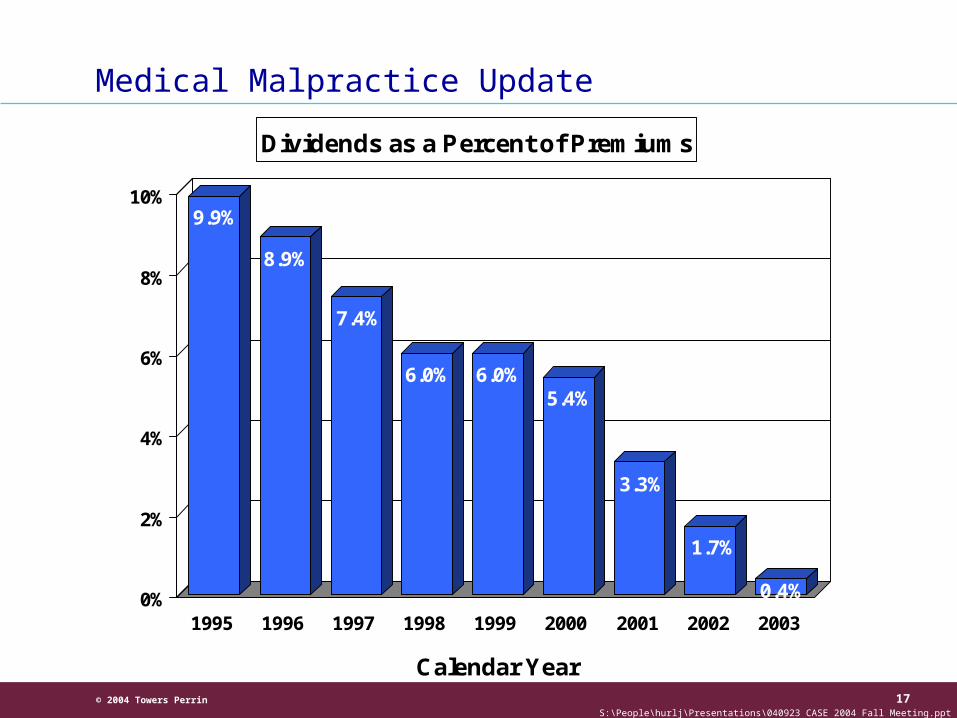
9.9%
8.9%
7.4%
6.0% 6.0%5.4%
3.3%
1.7%
0.4%0%
2%
4%
6%
8%
10%
1995 1996 1997 1998 1999 2000 2001 2002 2003
Calendar Year
Dividends as a Percent of Premiums
Medical Malpractice Update
© 2004 Towers Perrin 18S:\People\hurlj\Presentations\040923 CASE 2004 Fall Meeting.ppt
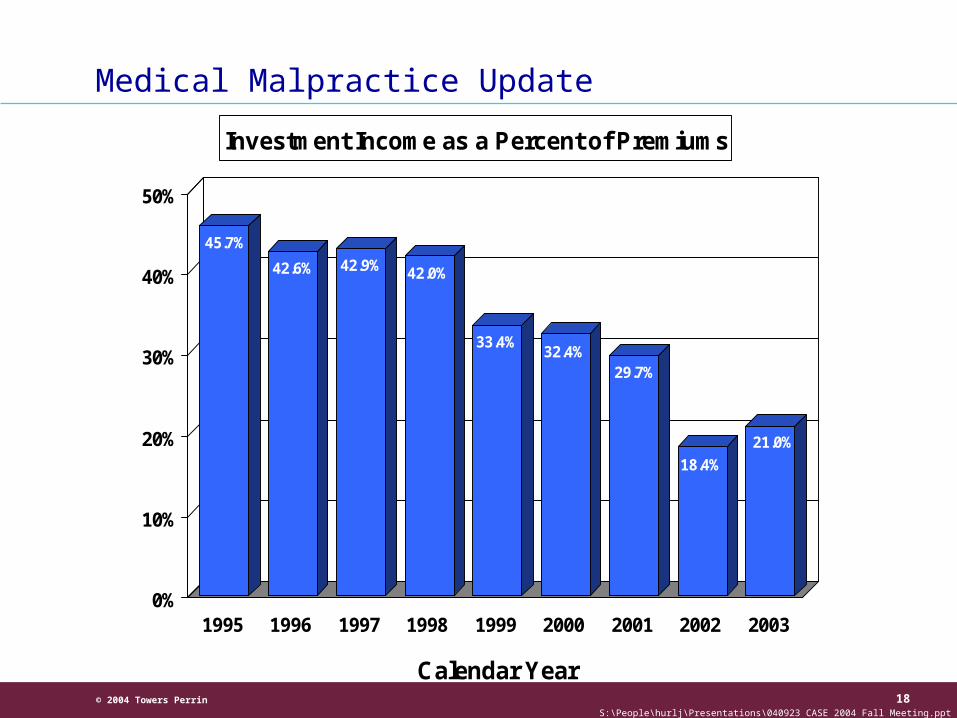
45.7%
42.6% 42.9% 42.0%
33.4%32.4%
29.7%
18.4%
21.0%
0%
10%
20%
30%
40%
50%
1995 1996 1997 1998 1999 2000 2001 2002 2003
Calendar Year
Investment Income as a Percent of Premiums
Medical Malpractice Update
© 2004 Towers Perrin 19S:\People\hurlj\Presentations\040923 CASE 2004 Fall Meeting.ppt
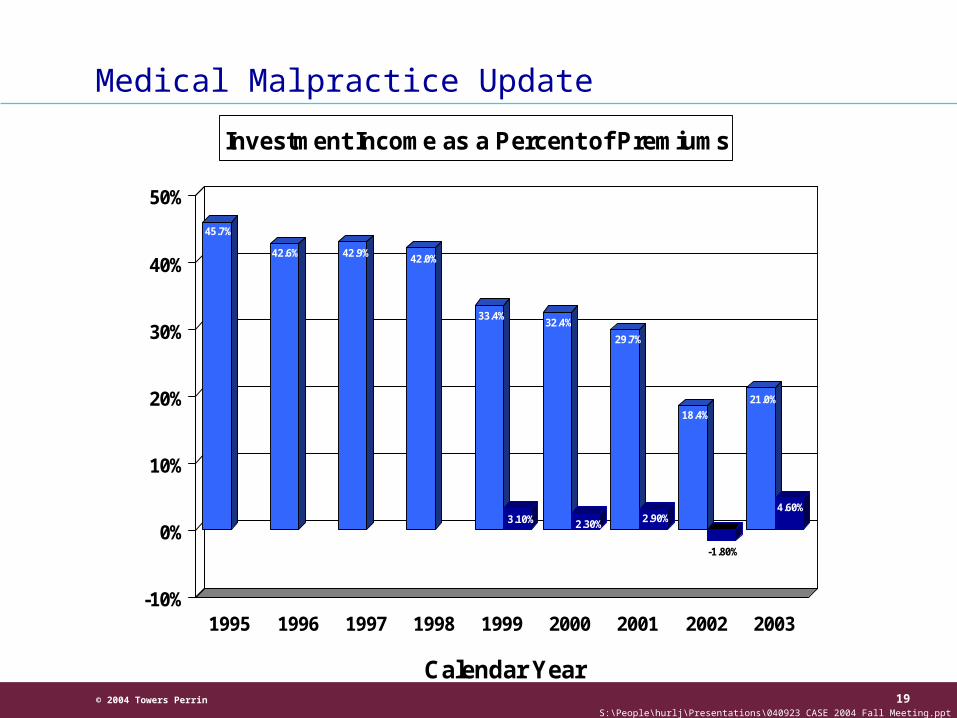
45.7%
42.6% 42.9% 42.0%
33.4%
3.10%
32.4%
2.30%
29.7%
2.90%
18.4%
-1.80%
21.0%
4.60%
-10%
0%
10%
20%
30%
40%
50%
1995 1996 1997 1998 1999 2000 2001 2002 2003
Calendar Year
Investment Income as a Percent of Premiums
Medical Malpractice Update
© 2004 Towers Perrin 20S:\People\hurlj\Presentations\040923 CASE 2004 Fall Meeting.ppt
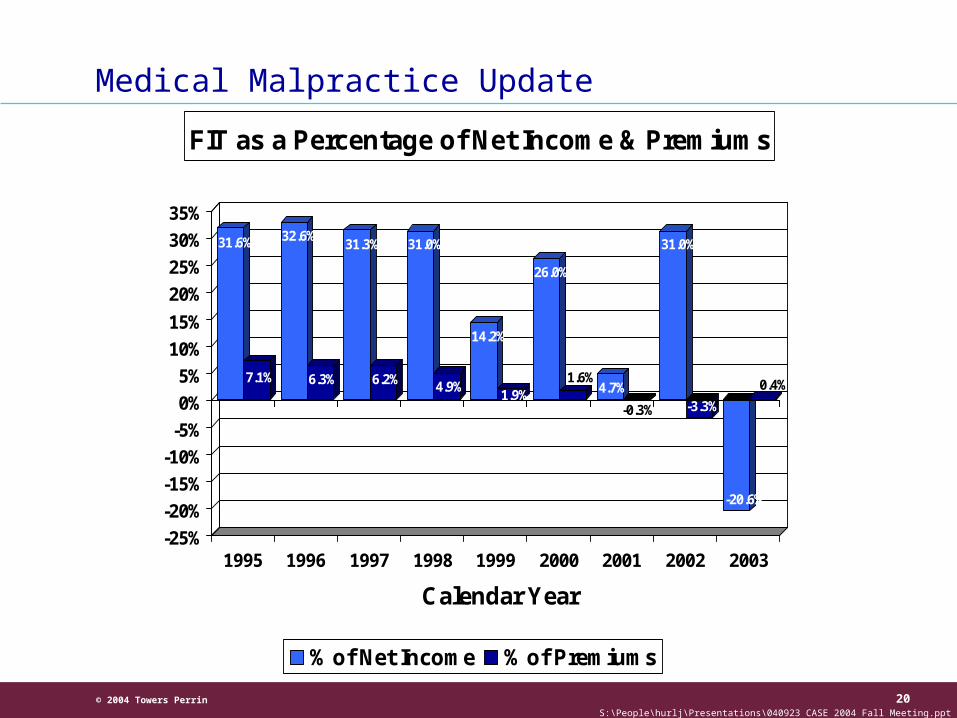
31.6%
7.1%
32.6%
6.3%
31.3%
6.2%
31.0%
4.9%
14.2%
1.9%
26.0%
1.6%4.7%
-0.3%
31.0%
-3.3%
-20.6%
0.4%
-25%
-20%
-15%
-10%
-5%
0%
5%
10%
15%
20%
25%
30%
35%
1995 1996 1997 1998 1999 2000 2001 2002 2003
Calendar Year
FIT as a Percentage of Net Income & Premiums
% of Net Income % of Premiums
Medical Malpractice Update
© 2004 Towers Perrin 21S:\People\hurlj\Presentations\040923 CASE 2004 Fall Meeting.ppt
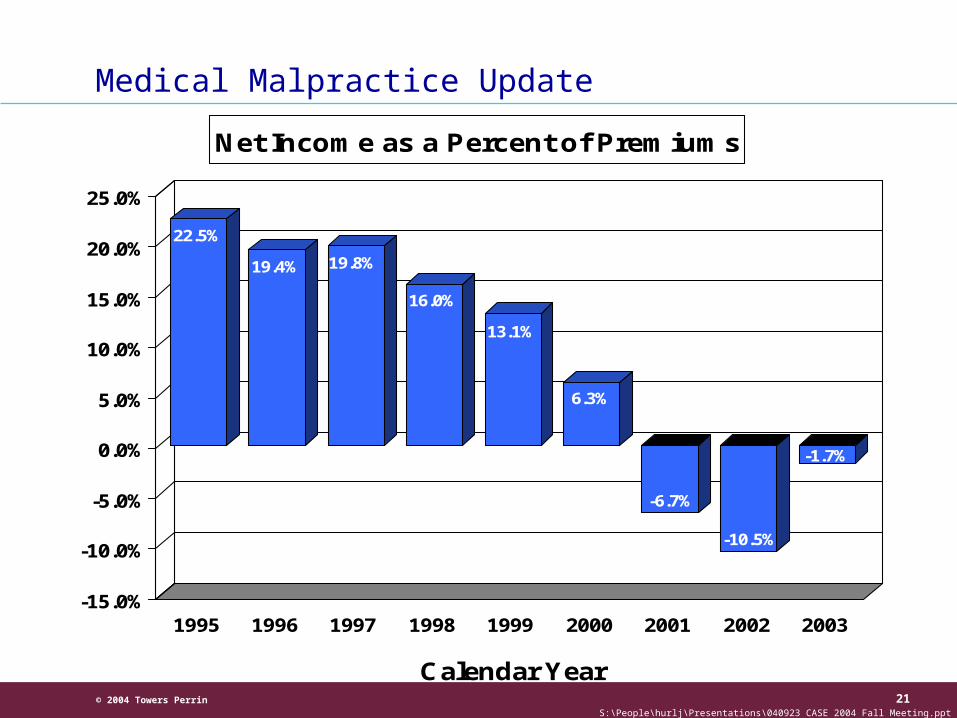
22.5%
19.4% 19.8%
16.0%
13.1%
6.3%
-6.7%
-10.5%
-1.7%
-15.0%
-10.0%
-5.0%
0.0%
5.0%
10.0%
15.0%
20.0%
25.0%
1995 1996 1997 1998 1999 2000 2001 2002 2003
Calendar Year
Net Income as a Percent of Premiums
Medical Malpractice Update
© 2004 Towers Perrin 22S:\People\hurlj\Presentations\040923 CASE 2004 Fall Meeting.ppt
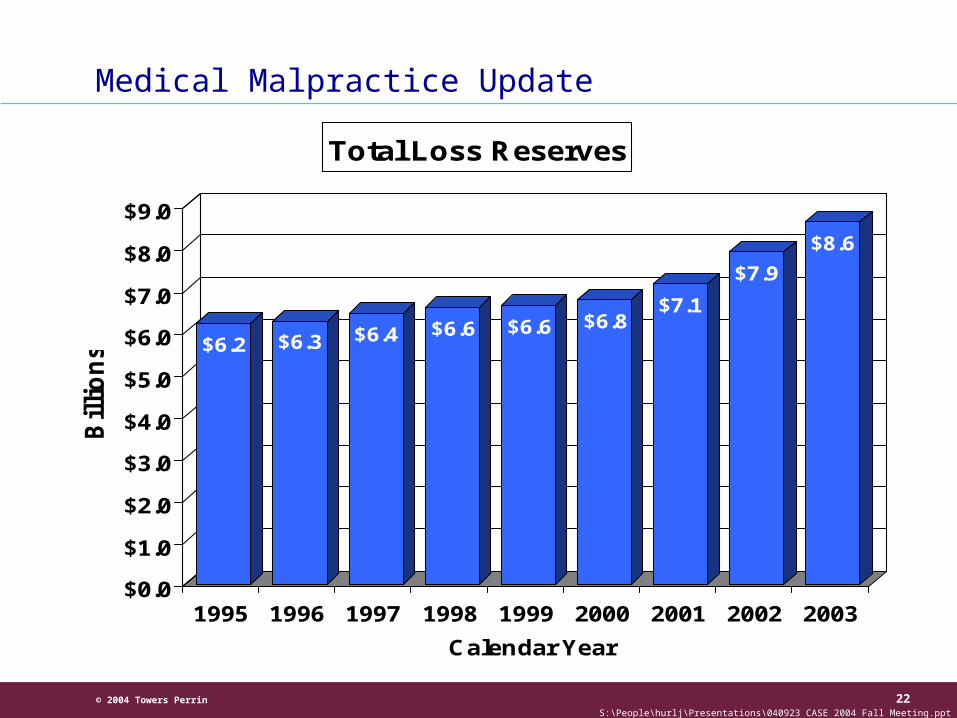
$6.2 $6.3 $6.4 $6.6 $6.6 $6.8$7.1
$7.9
$8.6
$0.0
$1.0
$2.0
$3.0
$4.0
$5.0
$6.0
$7.0
$8.0
$9.0
Bil
lio
ns
1995 1996 1997 1998 1999 2000 2001 2002 2003
Calendar Year
Total Loss Reserves
Medical Malpractice Update
© 2004 Towers Perrin 23S:\People\hurlj\Presentations\040923 CASE 2004 Fall Meeting.ppt
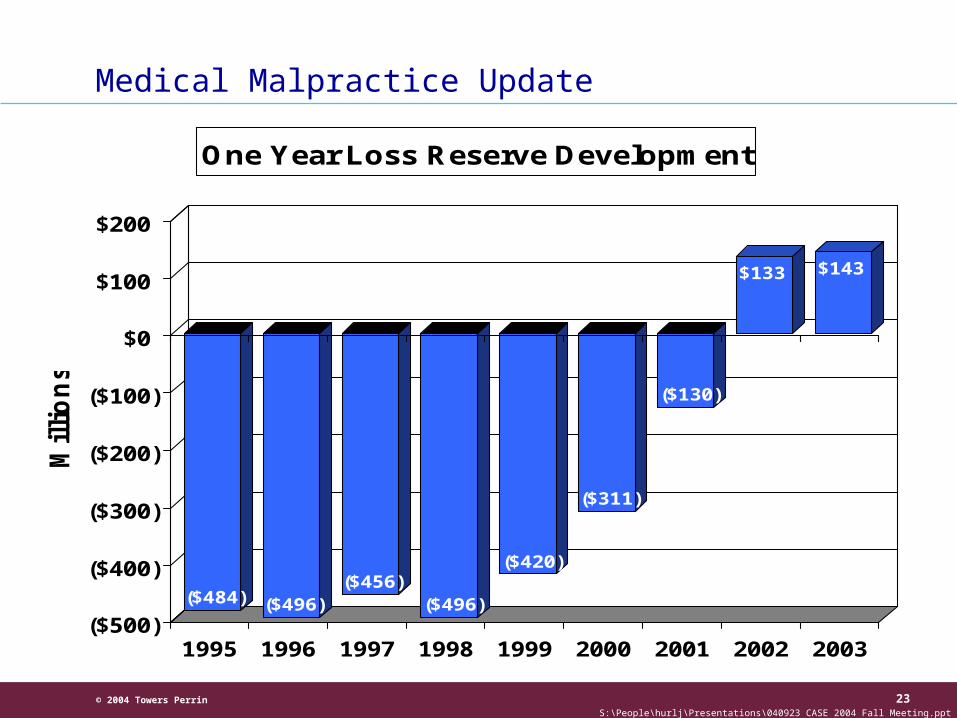
($484) ($496)($456)
($496)
($420)
($311)
($130)
$133 $143
($500)
($400)
($300)
($200)
($100)
$0
$100
$200
Millio
ns
1995 1996 1997 1998 1999 2000 2001 2002 2003
One Year Loss Reserve Development
Medical Malpractice Update
© 2004 Towers Perrin 24S:\People\hurlj\Presentations\040923 CASE 2004 Fall Meeting.ppt
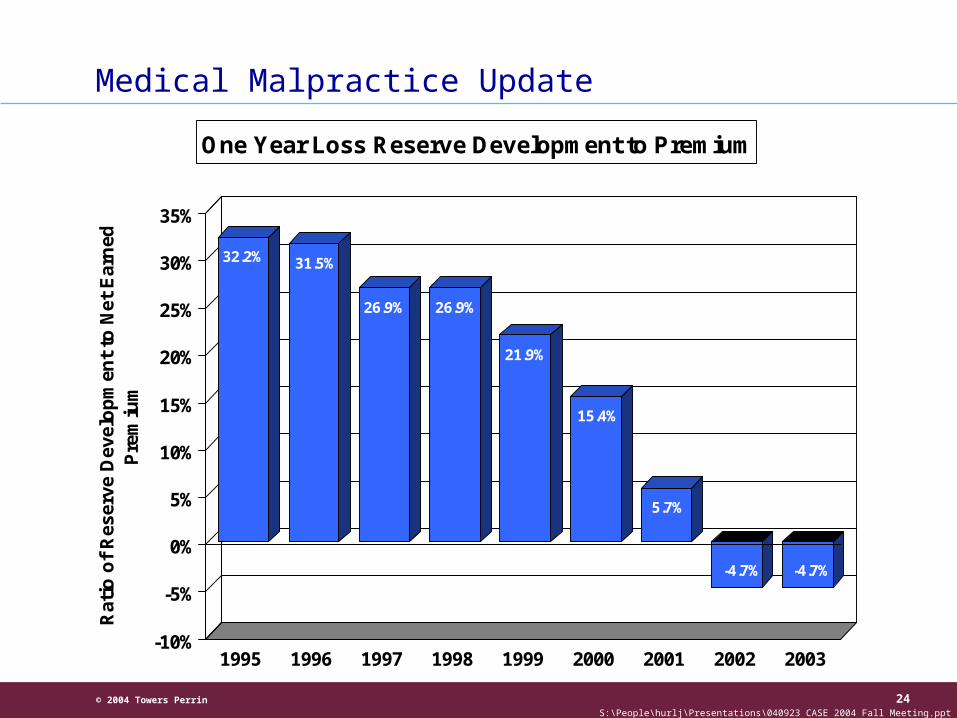
32.2% 31.5%
26.9% 26.9%
21.9%
15.4%
5.7%
-4.7% -4.7%
-10%
-5%
0%
5%
10%
15%
20%
25%
30%
35%
Rat
io o
f R
eser
ve D
evel
op
men
t to
Net
Ear
ned
P
rem
ium
1995 1996 1997 1998 1999 2000 2001 2002 2003
One Year Loss Reserve Development to Premium
Medical Malpractice Update
© 2004 Towers Perrin 25S:\People\hurlj\Presentations\040923 CASE 2004 Fall Meeting.ppt
Medical Malpractice Update
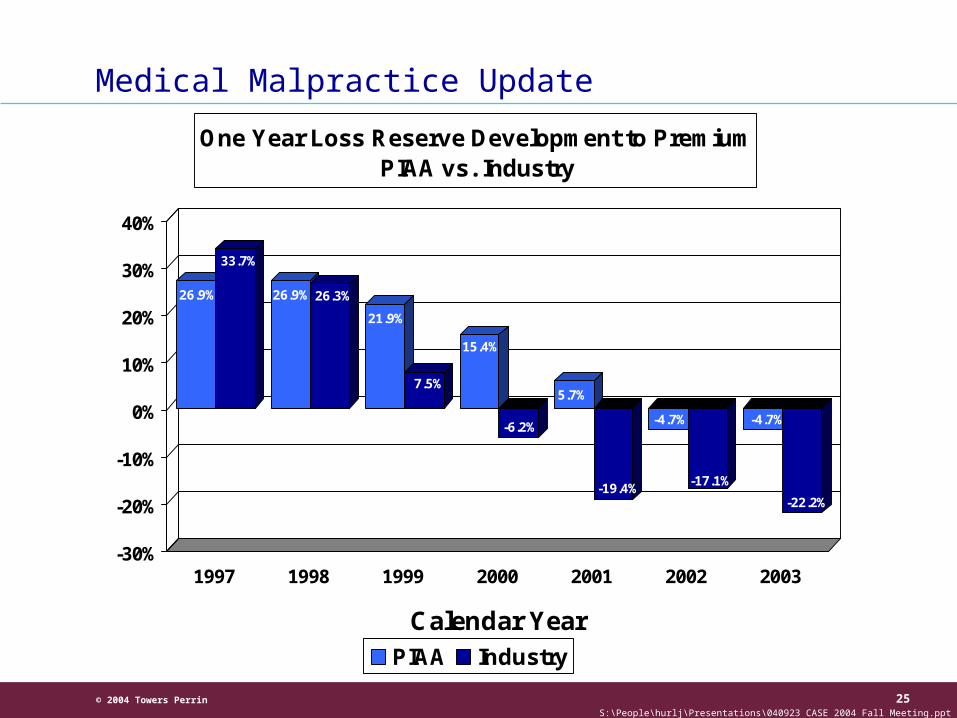
26.9%
33.7%
26.9% 26.3%
21.9%
7.5%
15.4%
-6.2%
5.7%
-19.4%
-4.7%
-17.1%
-4.7%
-22.2%
-30%
-20%
-10%
0%
10%
20%
30%
40%
1997 1998 1999 2000 2001 2002 2003
Calendar Year
One Year Loss Reserve Development to PremiumPIAA vs. Industry
PIAA Industry
© 2004 Towers Perrin 26S:\People\hurlj\Presentations\040923 CASE 2004 Fall Meeting.ppt
Medical Malpractice Update
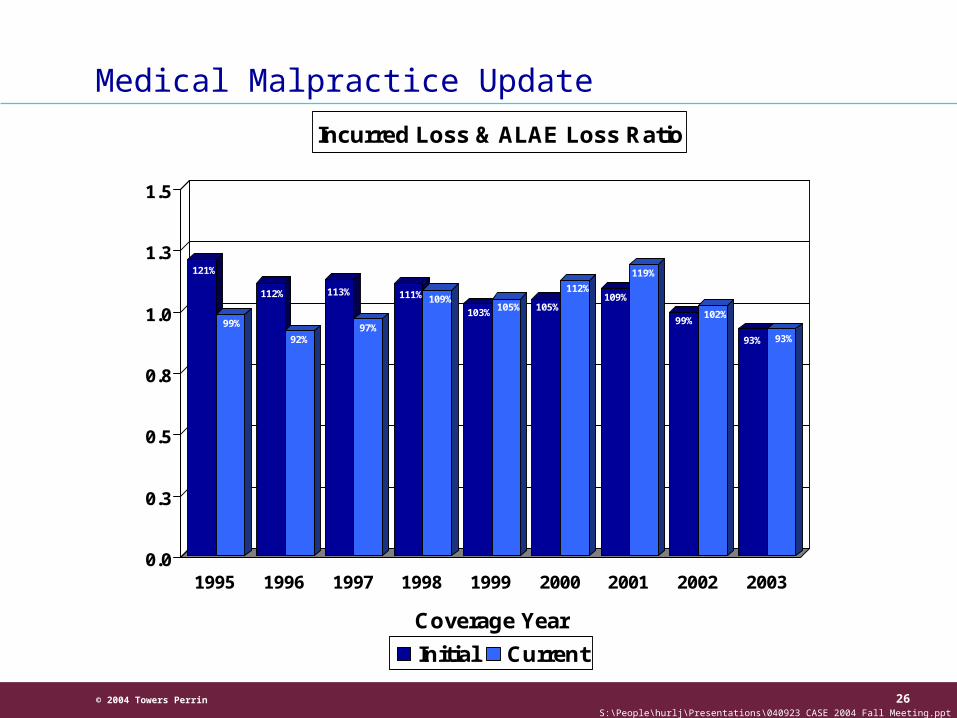
121%
99%
112%
92%
113%
97%
111% 109%103% 105% 105%
112%109%
119%
99%102%
93% 93%
0.0
0.3
0.5
0.8
1.0
1.3
1.5
1995 1996 1997 1998 1999 2000 2001 2002 2003
Coverage Year
Incurred Loss & ALAE Loss Ratio
Initial Current
© 2004 Towers Perrin 27S:\People\hurlj\Presentations\040923 CASE 2004 Fall Meeting.ppt
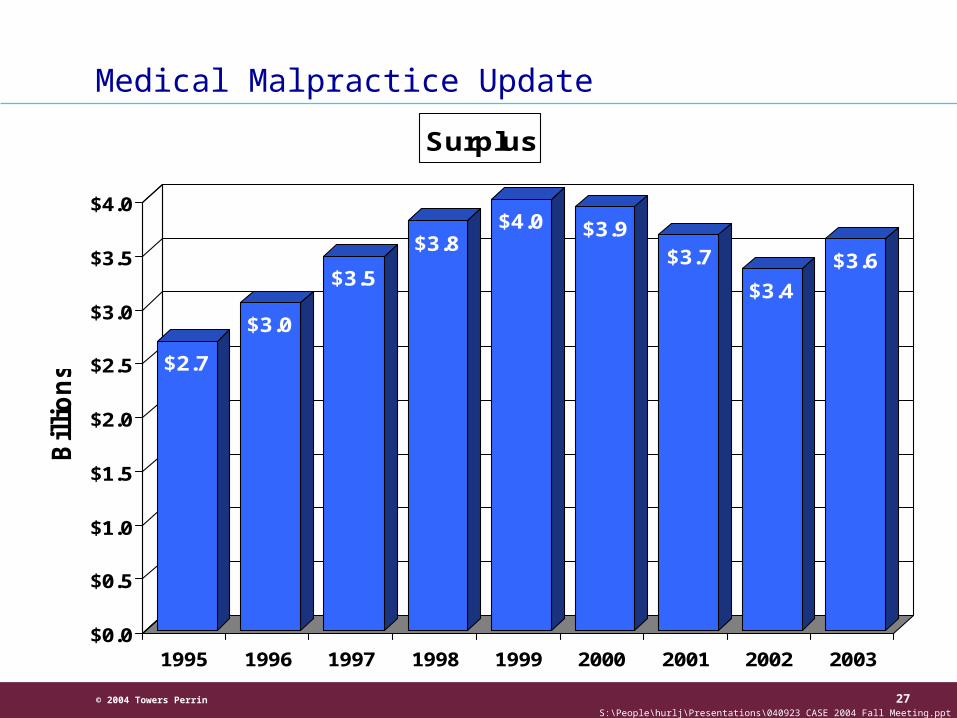
$2.7
$3.0
$3.5
$3.8$4.0 $3.9
$3.7
$3.4
$3.6
$0.0
$0.5
$1.0
$1.5
$2.0
$2.5
$3.0
$3.5
$4.0
Bil
lio
ns
1995 1996 1997 1998 1999 2000 2001 2002 2003
Surplus
Medical Malpractice Update
© 2004 Towers Perrin 28S:\People\hurlj\Presentations\040923 CASE 2004 Fall Meeting.ppt
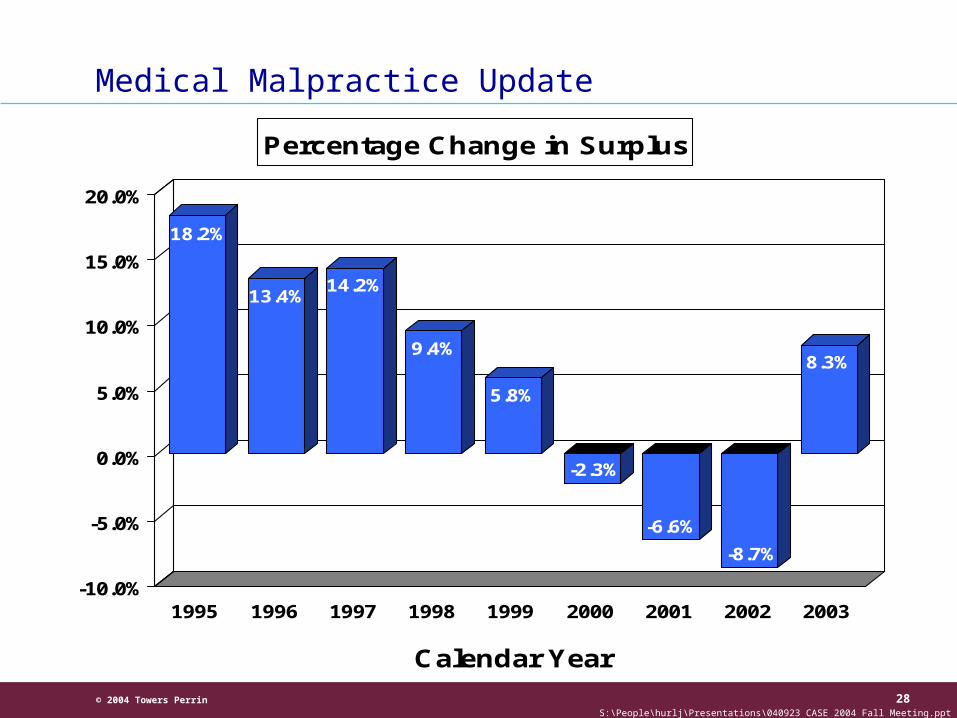
18.2%
13.4%14.2%
9.4%
5.8%
-2.3%
-6.6%
-8.7%
8.3%
-10.0%
-5.0%
0.0%
5.0%
10.0%
15.0%
20.0%
1995 1996 1997 1998 1999 2000 2001 2002 2003
Calendar Year
Percentage Change in Surplus
Medical Malpractice Update
© 2004 Towers Perrin 29S:\People\hurlj\Presentations\040923 CASE 2004 Fall Meeting.ppt
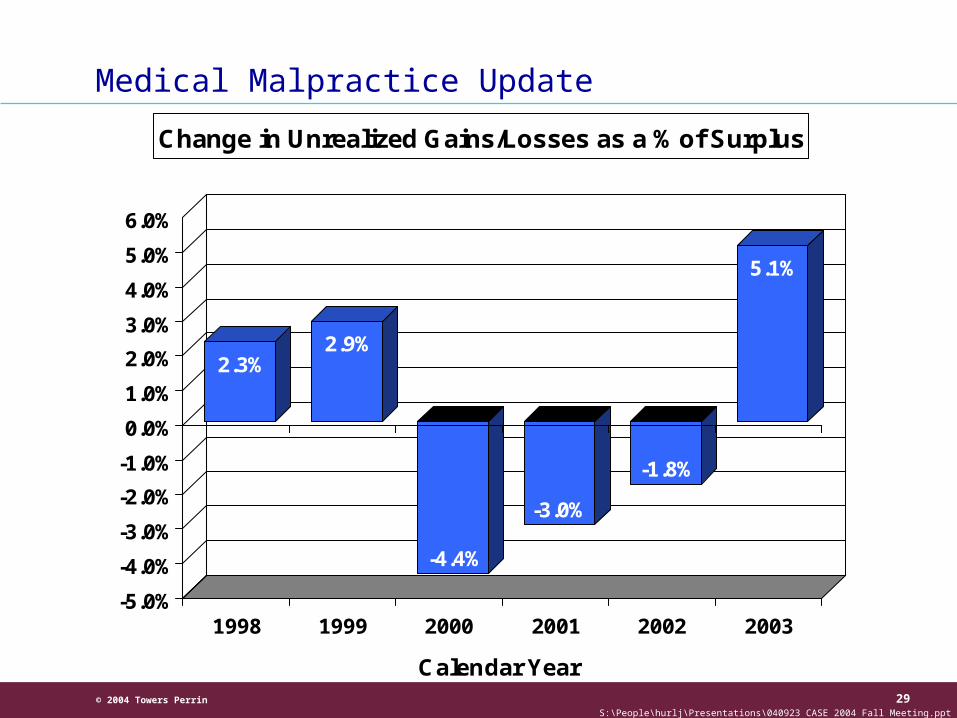
2.3%2.9%
-4.4%
-3.0%
-1.8%
5.1%
-5.0%
-4.0%
-3.0%
-2.0%
-1.0%
0.0%
1.0%
2.0%
3.0%
4.0%
5.0%
6.0%
1998 1999 2000 2001 2002 2003
Calendar Year
Change in Unrealized Gains/Losses as a % of Surplus
Medical Malpractice Update
© 2004 Towers Perrin 30S:\People\hurlj\Presentations\040923 CASE 2004 Fall Meeting.ppt
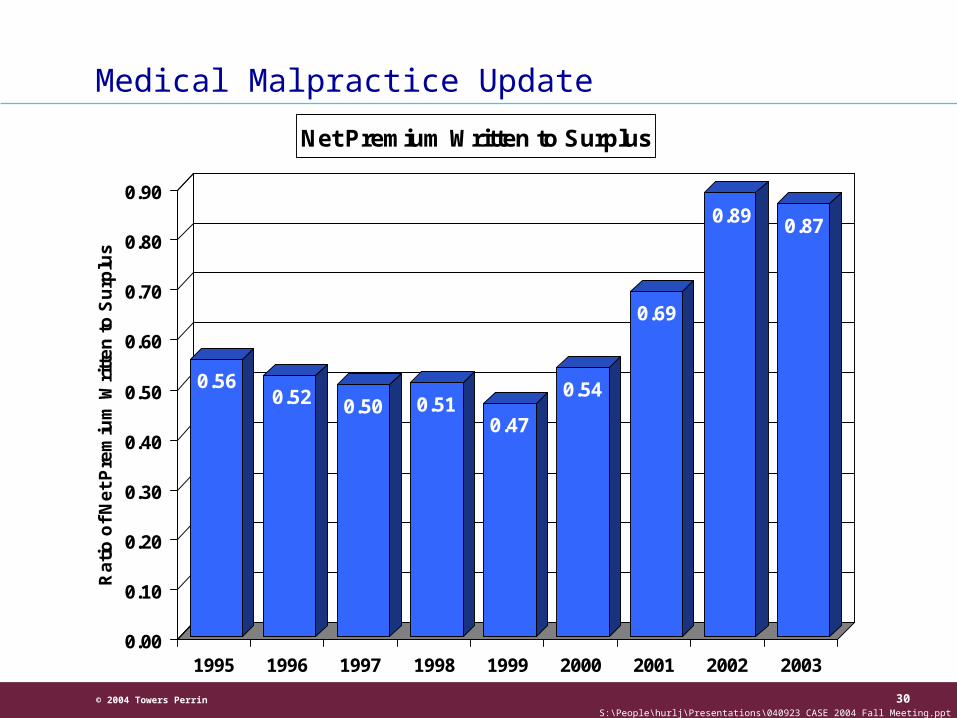
0.560.52 0.50 0.51
0.47
0.54
0.69
0.89 0.87
0.00
0.10
0.20
0.30
0.40
0.50
0.60
0.70
0.80
0.90
Ra
tio
of
Ne
t P
rem
ium
Wri
tte
n t
o S
urp
lus
1995 1996 1997 1998 1999 2000 2001 2002 2003
Net Premium Written to Surplus
Medical Malpractice Update
© 2004 Towers Perrin 31S:\People\hurlj\Presentations\040923 CASE 2004 Fall Meeting.ppt
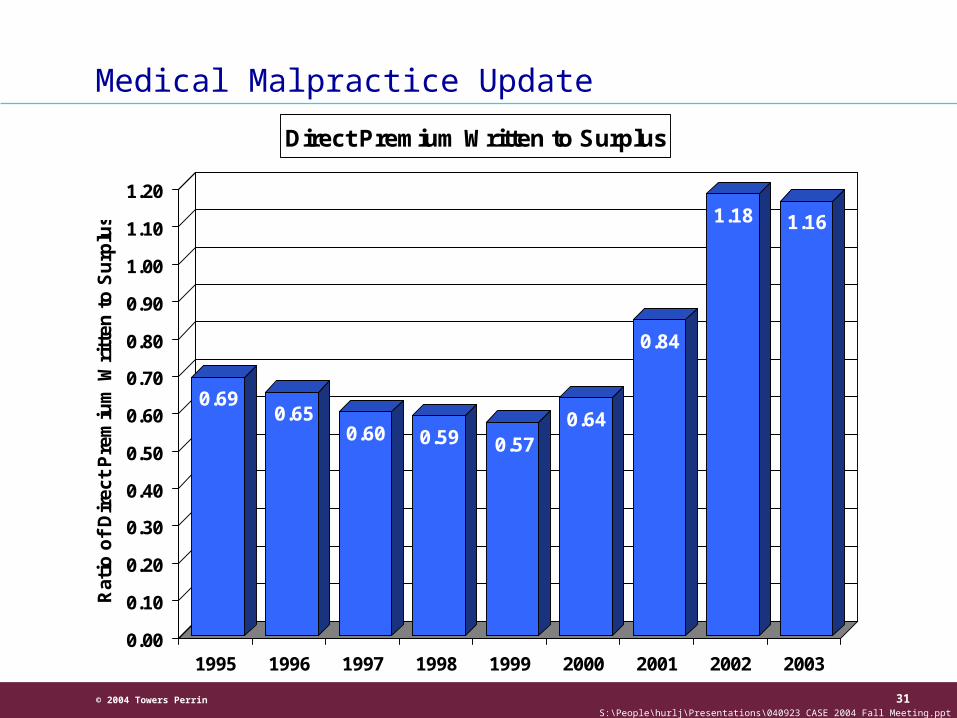
0.690.65
0.60 0.59 0.570.64
0.84
1.18 1.16
0.00
0.10
0.20
0.30
0.40
0.50
0.60
0.70
0.80
0.90
1.00
1.10
1.20
Rat
io o
f D
irec
t P
rem
ium
Wri
tten
to
Su
rplu
s
1995 1996 1997 1998 1999 2000 2001 2002 2003
Direct Premium Written to Surplus
Medical Malpractice Update
© 2004 Towers Perrin 32S:\People\hurlj\Presentations\040923 CASE 2004 Fall Meeting.ppt
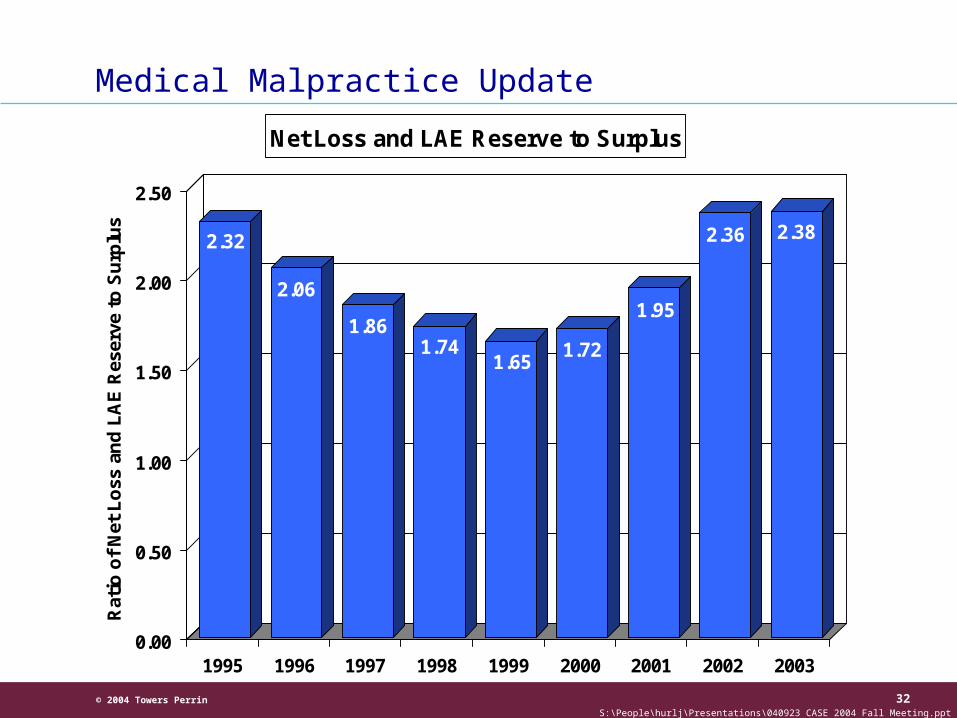
2.32
2.06
1.861.74
1.651.72
1.95
2.36 2.38
0.00
0.50
1.00
1.50
2.00
2.50
Rat
io o
f N
et L
oss
an
d L
AE
Res
erve
to
Su
rplu
s
1995 1996 1997 1998 1999 2000 2001 2002 2003
Net Loss and LAE Reserve to Surplus
Medical Malpractice Update

© 2004 Towers Perrin 33S:\People\hurlj\Presentations\040923 CASE 2004 Fall Meeting.ppt
0
2
4
6
0
23
8
01
8
12
1
4
12
18
1
5
11
19
0
5
10
15
20
1999 2000 2001 2002 2003
Coverage Year
RBC Results
≤ 200% ≤ 300% ≤ 400% ≤ 500%
Medical Malpractice Update
© 2004 Towers Perrin 34S:\People\hurlj\Presentations\040923 CASE 2004 Fall Meeting.ppt
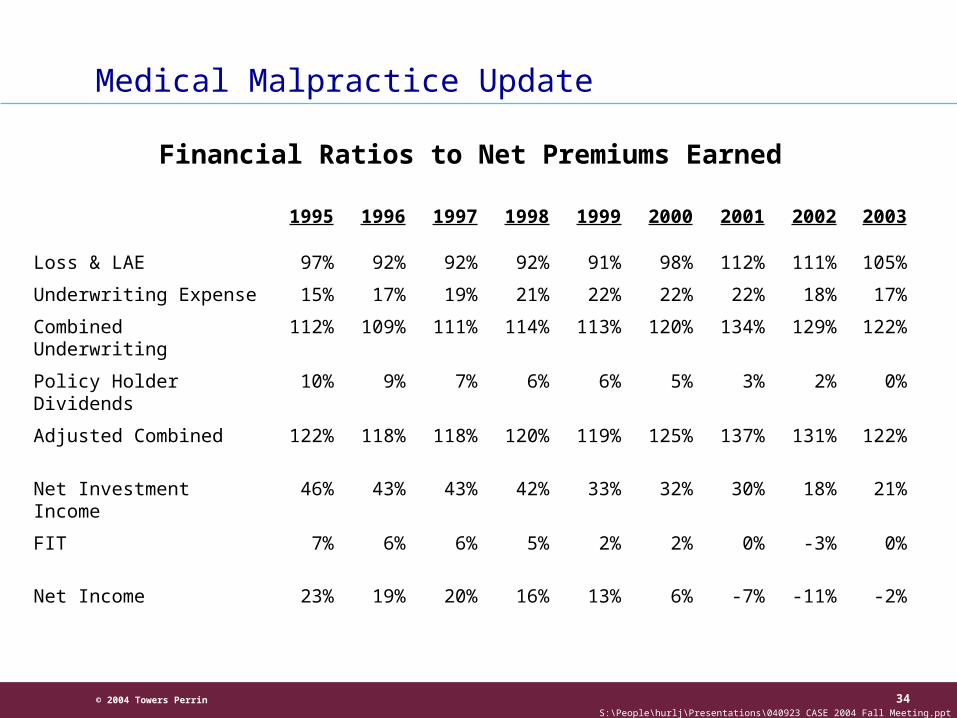
Financial Ratios to Net Premiums Earned
1995 1996 1997 1998 1999 2000 2001 2002 2003
Loss & LAE 97% 92% 92% 92% 91% 98% 112% 111% 105%
Underwriting Expense 15% 17% 19% 21% 22% 22% 22% 18% 17%
Combined Underwriting 112% 109% 111% 114% 113% 120% 134% 129% 122%
Policy Holder Dividends 10% 9% 7% 6% 6% 5% 3% 2% 0%
Adjusted Combined 122% 118% 118% 120% 119% 125% 137% 131% 122%
Net Investment Income 46% 43% 43% 42% 33% 32% 30% 18% 21%
FIT 7% 6% 6% 5% 2% 2% 0% -3% 0%
Net Income 23% 19% 20% 16% 13% 6% -7% -11% -2%
Medical Malpractice Update
© 2004 Towers Perrin 35S:\People\hurlj\Presentations\040923 CASE 2004 Fall Meeting.ppt
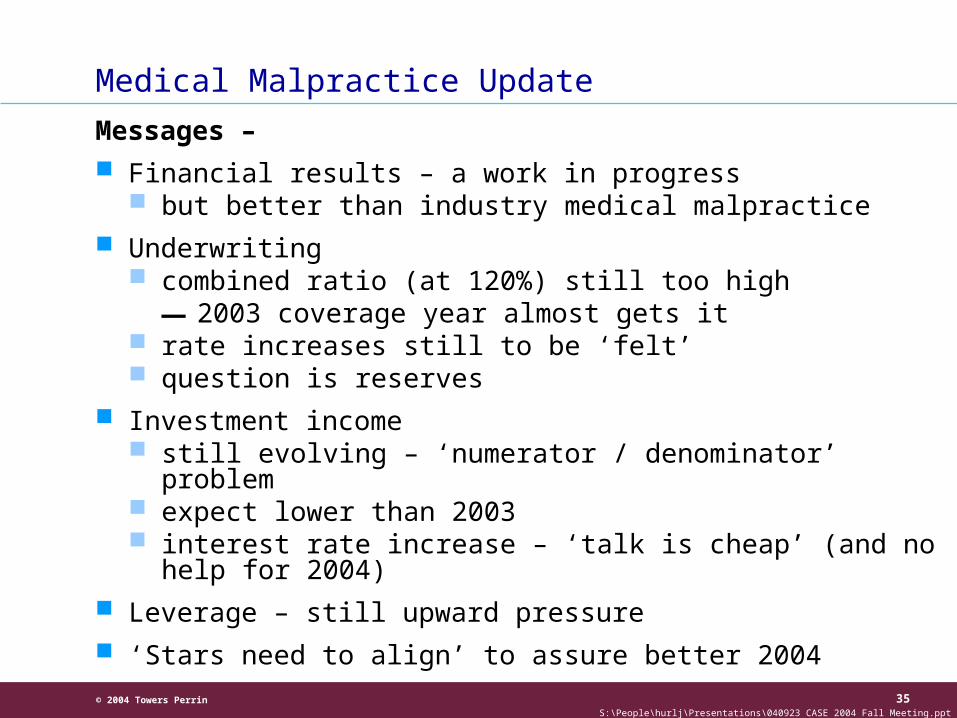
Messages – Financial results – a work in progress
but better than industry medical malpractice Underwriting
combined ratio (at 120%) still too high—2003 coverage year almost gets it
rate increases still to be ‘felt’ question is reserves
Investment income still evolving – ‘numerator / denominator’ problem expect lower than 2003 interest rate increase – ‘talk is cheap’ (and no help for 2004)
Leverage – still upward pressure ‘Stars need to align’ to assure better 2004
Medical Malpractice Update
© 2004 Towers Perrin 36S:\People\hurlj\Presentations\040923 CASE 2004 Fall Meeting.ppt
Medical Malpractice Update
Reforms tort reform
—HR5 / MICRA / other states
—will it work?
—will it be upheld?
© 2004 Towers Perrin 37S:\People\hurlj\Presentations\040923 CASE 2004 Fall Meeting.ppt
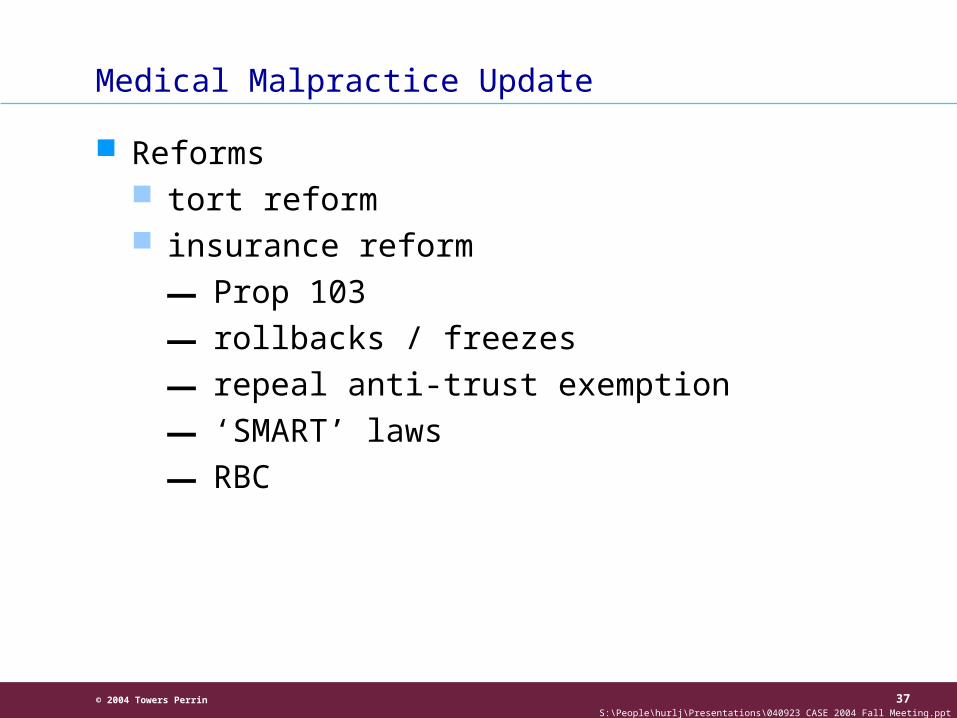
Medical Malpractice Update
Reforms tort reform insurance reform
—Prop 103
—rollbacks / freezes
—repeal anti-trust exemption
—‘SMART’ laws
—RBC
© 2004 Towers Perrin 38S:\People\hurlj\Presentations\040923 CASE 2004 Fall Meeting.ppt
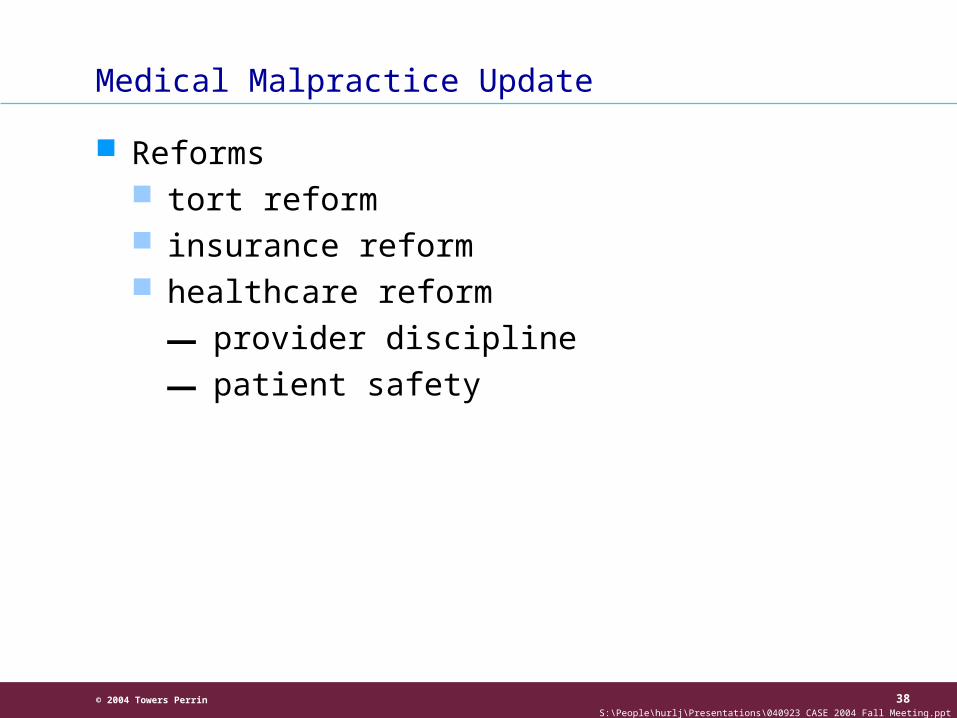
Medical Malpractice Update
Reforms tort reform insurance reform healthcare reform
—provider discipline
—patient safety
© 2004 Towers Perrin 39S:\People\hurlj\Presentations\040923 CASE 2004 Fall Meeting.ppt
Medical Malpractice Update

© 2004 Towers Perrin 40S:\People\hurlj\Presentations\040923 CASE 2004 Fall Meeting.ppt
Questions?
Medical Malpractice Update