Embed Size (px)
Citation preview
Medical Image Analysis UsingS4 Classes/Methods
An Update
Brandon WhitcherGlaxoSmithKline Clinical Imaging Centre
Hammersmith Hosptial, London
08 March 2011
Outline for Tonight
• Imaging biomarkers for oncology
• Magnetic resonance imaging (MRI)
• Dynamic contrast-enhanced MRI
• R package dcemriS4 with dependencies
• Live Demo!
Imaging Biomarkers for Oncology
Imaging Biomarkers for Oncology
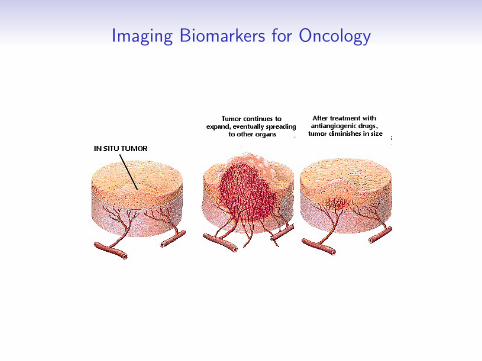
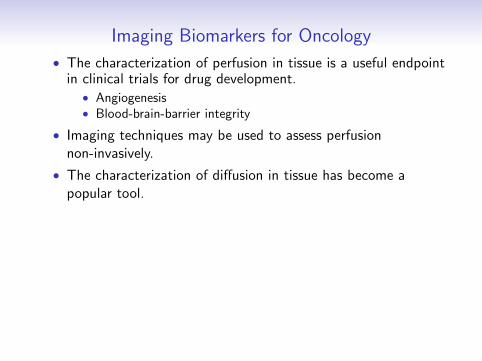
• The characterization of perfusion in tissue is a useful endpointin clinical trials for drug development.
• Angiogenesis• Blood-brain-barrier integrity
• Imaging techniques may be used to assess perfusionnon-invasively.
• The characterization of diffusion in tissue has become apopular tool.
Magnetic Resonance Imaging
Magnetic Resonance Imaging
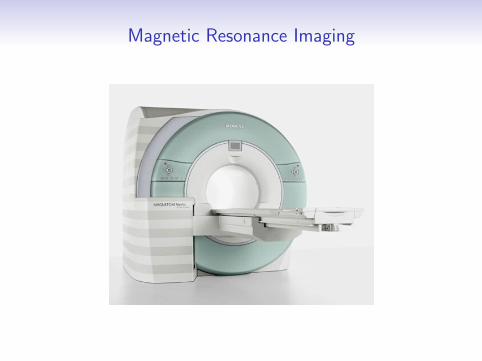
• A constant, homogeneous magnetic field (the B0 field) is usedto polarize spins.
• The exposure of nuclei to a radio frequency (RF) pulse (theB1 field) at the Larmor frequency causes the nuclei in thelower energy state to jump to the higher energy state.
• Macroscopic level: this causes net magnetization to spiral awayfrom the B0 field.
• After time, the magnetization vector becomes perpendicular tothe main B0 field.
• MR imaging is based on the relaxation that takes place afterthe RF pulse has stopped.
• It is repeated for many different levels of phase encoding tobuild up a matrix in k-space.
• A 2D Fourier transform is performed, resulting in a single slicefrom an MRI acquisition.
Dynamic Contrast-Enhanced MRI
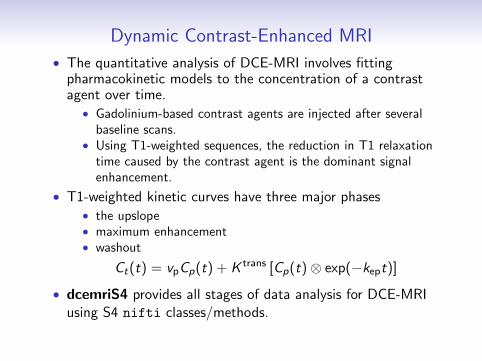
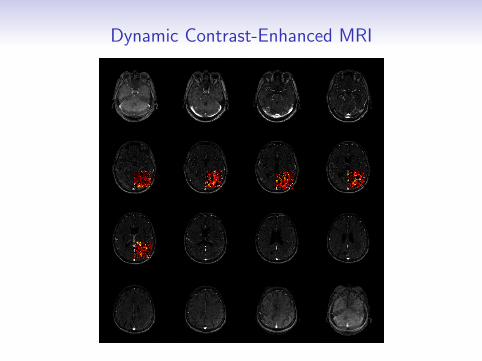
Dynamic Contrast-Enhanced MRI
• The quantitative analysis of DCE-MRI involves fittingpharmacokinetic models to the concentration of a contrastagent over time.
• Gadolinium-based contrast agents are injected after severalbaseline scans.
• Using T1-weighted sequences, the reduction in T1 relaxationtime caused by the contrast agent is the dominant signalenhancement.
• T1-weighted kinetic curves have three major phases• the upslope• maximum enhancement• washout
Ct(t) = vpCp(t) + K trans [Cp(t) ⊗ exp(−kept)]
• dcemriS4 provides all stages of data analysis for DCE-MRIusing S4 nifti classes/methods.
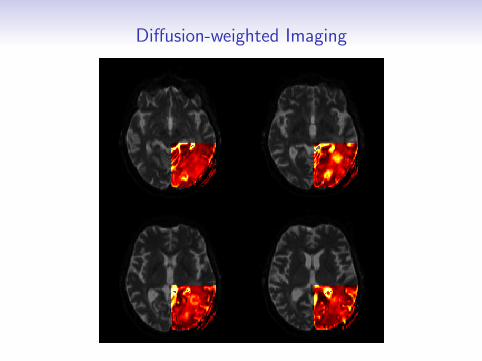
Diffusion-weighted Imaging
R Package dcemriS4
• Title: A Package for Medical Image Analysis(S4 implementation)
• Description: A collection of routines and documentation thatallows one to perform voxel-wise quantitative analysis ofdynamic contrast-enhanced or diffusion-weighted MRI data.
• Depends: R (>= 2.6.0), grDevices, graphics, methods,oro.nifti, utils
• Suggests: bitops, minpack.lm, multicore, splines, XML
• License: BSD
• URL: http://www.dcemri.org/
Live demo!
Thank-you for your attention!