Embed Size (px)
Citation preview

Medical Epidemiology
Statistical Reporting and Interpretation:
Confidence Intervals, Precision and Power Analysis in Therapeutic Evaluations

Statistical Reporting and Interpretation: Confidence Intervals, Precision and Power Analysis in Therapeutic Evaluations
Statistical hypothesis testing– classical model: fixed – current scientific practice
• p-values• consumer’s choice
Confidence intervals– review of concept– relation to hypothesis tests
Statistical power in application– review of concept– determinants of statistical power– application in study design– application in study interpretation– relation to confidence intervals– the way it was: negative clinical studies

Statistical hypothesis testing:classical model with fixed
OUTCOMES OF MICROBIAL DIAGNOSTIC TESTS
TEST OUTCOME
ORGANISM NEGATIVE POSITIVE
ABSENT
CORRECT DECISION
PROBABILITY =
1 -
SPECIFICITY
FALSE POSITIVE
PROBABILITY =
FALSE POSITIVE RATE
PRESENT
FALSE NEGATIVE
PROBABILITY =
FALSE NEGATIVE RATE
CORRECT DECISION
PROBABILITY =
1 -
SENSITIVITY

Statistical hypothesis testing:classical model with fixed
OUTCOMES OF BIOPSY FOR CANCER
PATHOLOGY REPORT
CANCER NEGATIVE POSITIVE
ABSENT
CORRECTDECISION
PROBABILITY =
1 -
SPECIFICITY
FALSE POSITIVE
PROBABILITY =
FALSE POSITIVERATE
PRESENT FALSE NEGATIVE
PROBABILITY=
FALSE NEGATIVERATE
CORRECTDECISION
PROBABILITY =
1 -
SENSITIVITY

Statistical hypothesis testing:classical model with fixed
OUTCOMES OF STATISTICAL HYPOTHESIS TESTS
Study conclusion TRUTH
There is no difference (neg
study)
There is an association,
difference, the drug works etc
There is no difference
CORRECT DECISION
PROBABILITY=1-
"TYPE I" ERROR
PROBABILITY=
There is a difference, association, the drug works etc
"TYPE II" ERROR
PROBABILITY=
CORRECT DECISION
PROBABILITY=1-
= PROBABILITY OF TYPE I ERROR = "SIGNIFICANCE LEVEL"
= PROBABILITY OF TYPE II ERROR
1- = "STATISTICAL POWER"
Statistical hypothesis testing:classical model with fixed
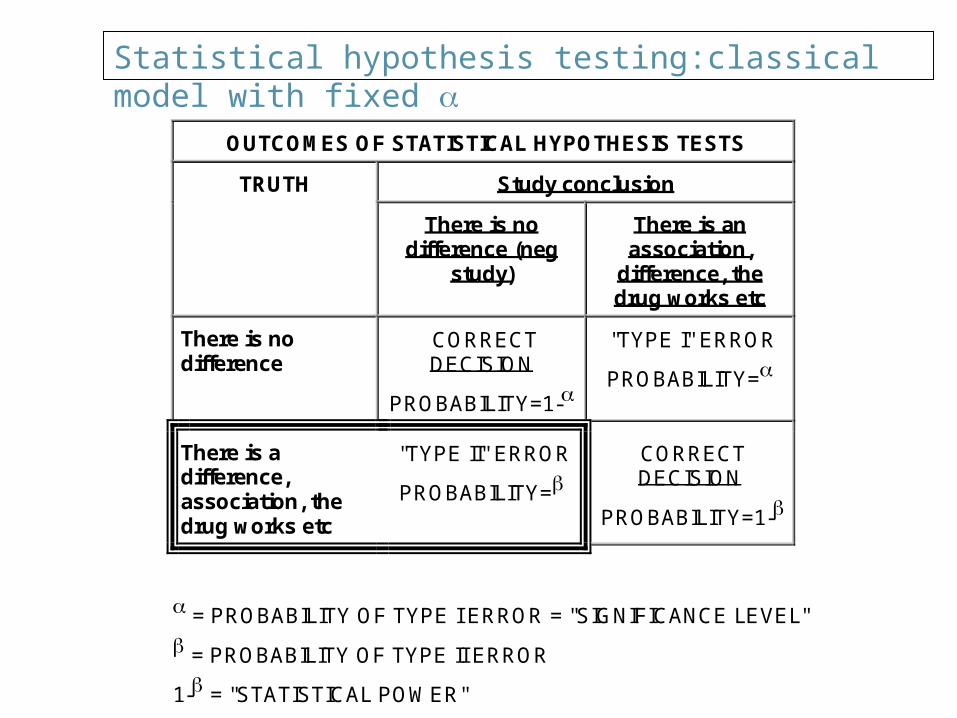
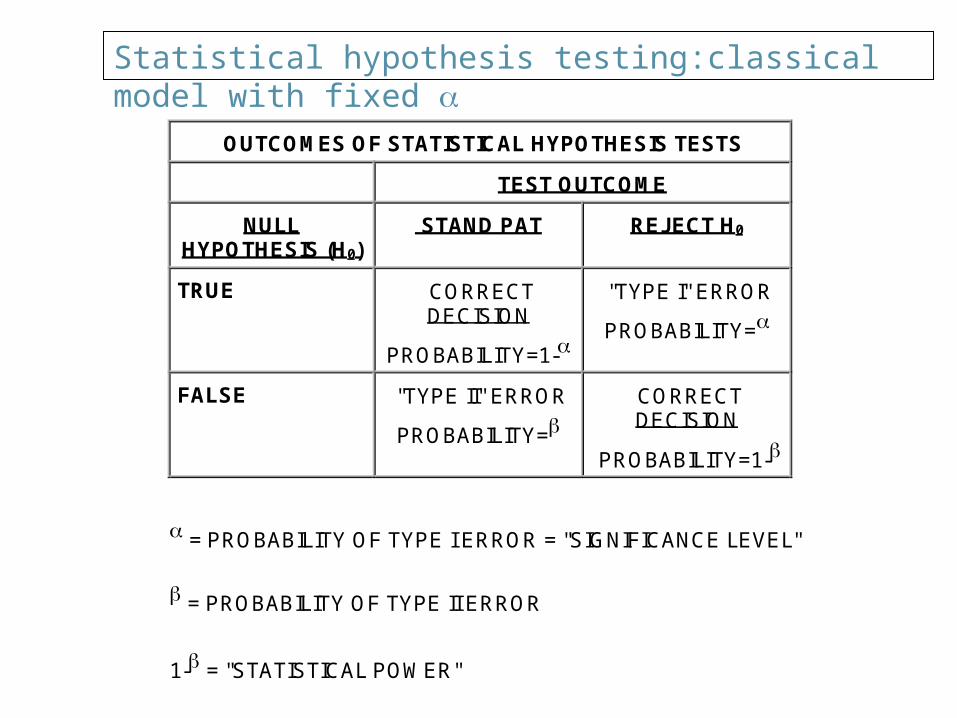
OUTCOMES OF STATISTICAL HYPOTHESIS TESTS
TEST OUTCOME
NULLHYPOTHESIS (H0)
STAND PAT REJECT H0
TRUE CORRECTDECISION
PROBABILITY=1-
"TYPE I" ERROR
PROBABILITY=
FALSE "TYPE II" ERROR
PROBABILITY= CORRECTDECISION
PROBABILITY=1-
= PROBABILITY OF TYPE I ERROR = "SIGNIFICANCE LEVEL"
= PROBABILITY OF TYPE II ERROR
1- = "STATISTICAL POWER"

Statistician
Only answers questions about probability And only about events subject to probability

Q and A
Q. Is this a normal deck of cards? A. That is not a probability. Q. What is the probability that this is a normal deck? A. That is not subject to probability. It is either a
normal deck or it’s not. Q. What is the probability of pulling 7 hearts out of 8
cards? A. That depends. If the deck is made mostly of hearts
then that probability would be very high.

Q and A
Q. One last try.
If this is a normal deck of cards, what would be the chance of pulling 7 hearts out of 8?
or a more extreme event (8 out of 8)? A. 1 in a thousand. Q. Then this is not a normal deck? A. You said so, not me.

Statistical hypothesis testing in current scientific practice: p-values
The p-value is just the chance, assuming H0 is true, of a statistic being "weirder," that is, more discrepant from H0, than the value we actually observe.
Examples
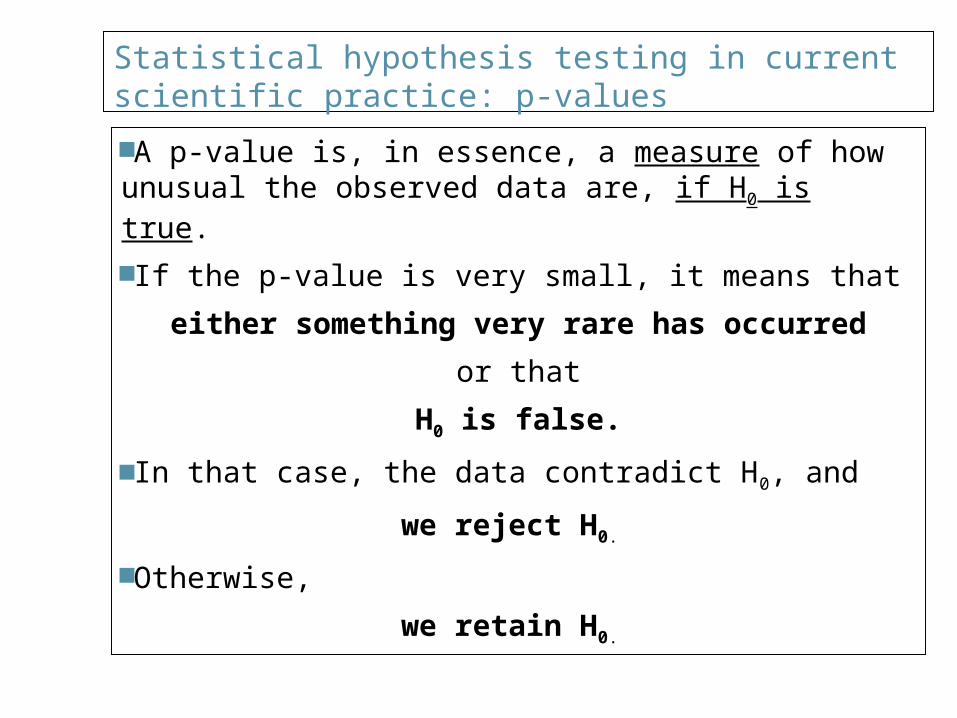
Statistical hypothesis testing in current scientific practice: p-values
A p-value is, in essence, a measure of how unusual the observed data are, if H0 is true.
If the p-value is very small, it means that
either something very rare has occurred
or that
H0 is false.
In that case, the data contradict H0, and
we reject H0.
Otherwise,
we retain H0.

Statistical hypothesis testing in current scientific practice: p-values
The most straightforward scientific interpretation of the p-value is as a measure of compatibility between the hypothesis H0 and the observed data.
A high p-value means that the data look just like what the hypothesis would lead one to expect, given the size of the research study. A low p-value means that the data are somewhat surprising if H0 is true.
High p-value Null hypothesis supported
Low p-value Null hypothesis contradicted

Statistical hypothesis testing in current scientific practice: p-values
Thus, when we determine the p-value, we know that
– any test with p-value would reject H0, and
– any test with p-value > would retain H0.

18
Confidence Intervals

If the Mean Diastolic BP Is 80 mmHg
A random sample of 20 people will often have a mean diastolic BP close to 80.
How often and how close? 95% of the time it will be between 70 and 90 (width 20 mmHg). If you have a random sample of 20 people and their mean
diastolic BP is 69 that would be unusual. Because that would happen less than 5% of the time. That mean BP would have a p-value less than 0.05. You would wonder if this sample really came from the same
population (the population with a mean BP of 80).


We Want to Find Out If This Drug Lowers BP We take a random sample of 20 people and give
them the drug. We measure their BP and find out that it is 65. IF THE DRUG DOES NOT WORK, this would be
very unusual (p-value less than 0.05). So we conclude that the drug works. We conclude that this sample is from a different
population (not a sample from the population with a mean BP of 80).

So What Population Do They Come From?
We are pretty sure that that population has a mean BP close to 65.
How sure and how close? We are 95% sure that it is somewhere
between 55 and 75 (width 20mmHg). Why same width?

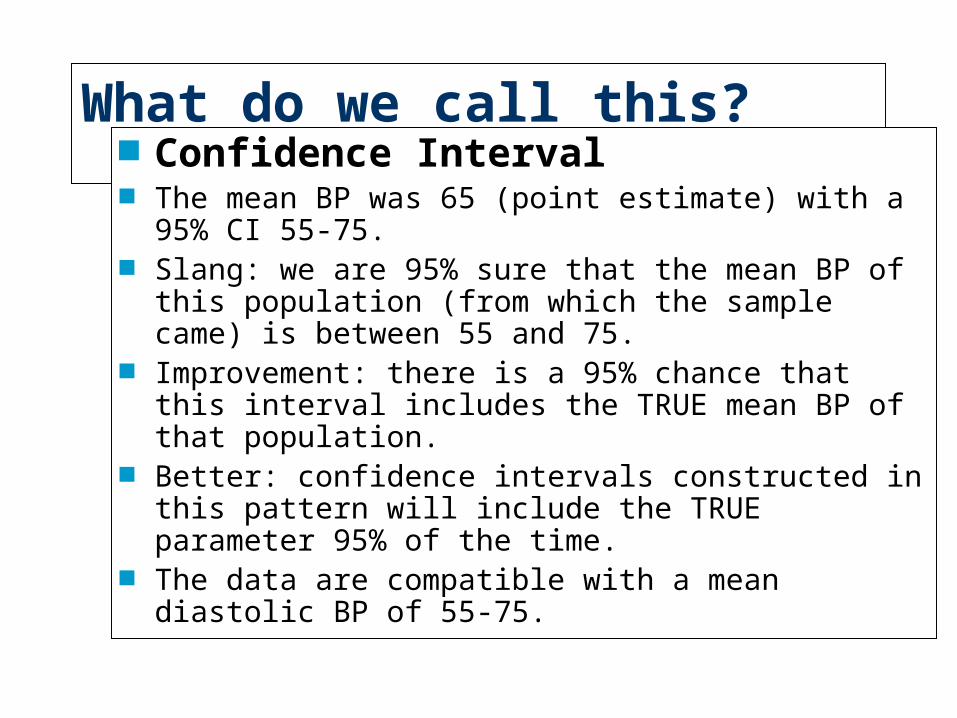
What do we call this? Confidence Interval The mean BP was 65 (point estimate) with a 95% CI
55-75. Slang: we are 95% sure that the mean BP of this
population (from which the sample came) is between 55 and 75.
Improvement: there is a 95% chance that this interval includes the TRUE mean BP of that population.
Better: confidence intervals constructed in this pattern will include the TRUE parameter 95% of the time.
The data are compatible with a mean diastolic BP of 55-75.


For RR

Confidence Interval
Any results that show a mean BP less than 70 will have a confidence interval that does not include 80.
All these results have a p-value less than 0.05,AND have a 95% CI that does not include 80.
RR Any RR that has a p-value less than 0.05 will have
a 95% CI that does not include the value 1.0
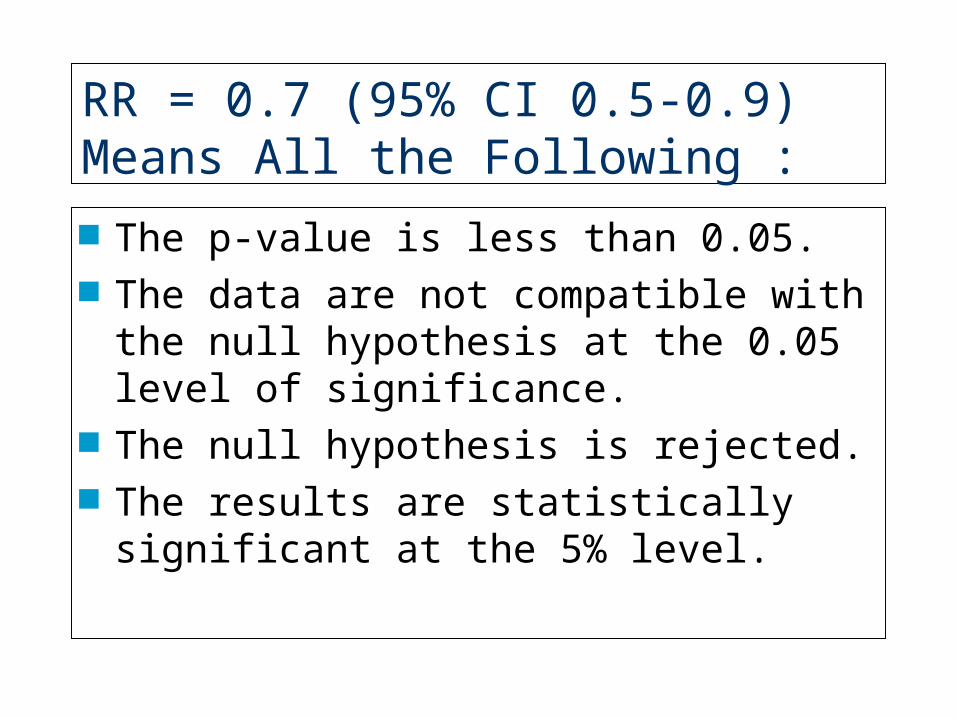
RR = 0.7 (95% CI 0.5-0.9) Means All the Following :
The p-value is less than 0.05. The data are not compatible with the
null hypothesis at the 0.05 level of significance.
The null hypothesis is rejected. The results are statistically significant at
the 5% level.

RR = 0.9 (95% CI 0.7-1.1) Means All the Following : The CI includes the value 1.0 The CI includes the possibility of NO EFFECT
(i.e. Null) The data are compatible with the null
hypothesis at the 0.05 level of significance. The null hypothesis is not rejected. The results are not statistically significant at
the 5% level. The p-value is more than 0.05.

Precautionary statement
Confidence intervals are not equal on both sides of the point estimate of RR.
RR 0.6 ( CI is not 0.3-0.9) Why? The are equal on log scale. RR 1.0 (CI 0.5-2.0).

Confidence Intervals
The 99% CI is wider than the 95% CI. If the 95% CI includes the null value (1 for RR, 0 for
AR), then the 99% CI will definitely include it. If the results are significant at the 1% level then they
are also significant at the 2%, 5% etc. If the results are significant at the 5% level they might
not be significant at the 1% level. If the 95% CI for RR does not include 1.0, the 99%
might.

Confidence Intervals: Examples (Fictitious)
The OR relating any history of cigarette smoking to development of lung cancer is between 8.0 and 13.3, with 95% confidence.
We are 80% confident that the mean reduction in DBP achieved by Drug X in patients with severe hypertension is between 15 and 22 mmHg.
We are 60% confident that the reduction in stroke mortality achieved by TPA administered within 3 hours of symptom onset is between 10 and 19%.
The probability that the interval 10 to 25 includes the true RR of invasive cervical cancer associated with absence of annual Pap smears is 70%.

34
Statistical Power

Statistical power: review of concept
The probability of rejecting H0, when H0 is false.
Power = (1-), where is the Type II error probability of the test.

Statistical power: review of concept
statistical power is not a single number characterizing a test, but depends upon the amount by which the null hypothesis is violated. Thus, power is
An increasing function of the effect size.

Statistical power: review of concept
Therefore, since the true power depends upon the true effect, which we don't know
we can never calculate the true power. However, we may make practical, effective
use of the concept of statistical power in two ways.
– Study planning, to determine feasibility and aspects of protocol
– Study analysis, to clarify the meaning of results that are not statistically significant.

Statistical power: determinants
study design (e.g., matched or unmatched sample selection) and parameter of interest
Baseline probability
effect size (strength of true relationship)
standard of evidence required ()
sample size
level of biological variability
level of measurement error
method of statistical analysis

Sample size estimates for a case-control study of OC use and MI among women. (Assuming proportion of OC among controls is 10%, power = 80%, two sided p-value = 0.05.
Postulated relative risk Required sample size in each group
3.0 59
2.0 196
1.3 1769

Power estimates for a case-control study of OC use and MI among women with 100 cases and 100 controls (Assuming proportion of OC among controls is 10%, two sided p-value = 0.05.
Postulated relative risk Power
3.0 0.95
2.0 0.52
1.3 0.1

Statistical power in study design Before conducting a study, if we set the power we can estimate
sample size
We do this by
– Estimating baseline probability
– determining an effect size that’s quite important to detect.
– choosing a probability high enough to be confident of detecting such an effect size (usually 80-90%).
– choosing a standard of evidence
– estimating biological and measurement variability from existing relevant literature and/or preliminary studies.
– choosing a tentative, usually simplified, statistical analysis plan.

Statistical power in study design Before conducting a study, we can attempt to predict its power
for detecting clinical important effects. (Or if we set the power we estimate sample size).
We do this by
– Estimating baseline probability
– determining an effect size that’s quite important to detect.
– choosing a standard of evidence
– estimating biological and measurement variability from existing relevant literature and/or preliminary studies.
– *specifying a realistic sample size.
– choosing a tentative, usually simplified, statistical analysis plan.

That’s Why
Power analysis
Is same as Sample size estimation

A Drug to Lower Mortality in Acute MI. What effect size is meaningful? Any reduction even as little as 10% would be important
to find. What power do you need? If there is such an effect I would like to be 80%
confident that I will find it. (If the effect is larger, then the power is even higher).
What is the baseline mortality? That is mortality without the drug, i.e. mortality in comparison group?
The cumulative incidence of death during follow up would be 20%.

A Drug to Lower Mortality in Acute MI. What alpha will you use?
The usual 5%. (if I use 1% I will need more patients). What statistics will you use?
Chi square. If the data were quantitative I would ask about
variance, SD etc.

Power Analysis = Sample Size Estimation You need 2000 patients in each group. I can only recruit 1000 in each group. Then your power is only 40%. Unless you change….. What power do I have to detect a 30% reduction? We can calculate, BUT…

Statistical power in study design
If predicted power is too small, we can alter the design of the study to give ourselves a better chance of finding what we are looking for, e.g., by
– studying a higher risk population where the effect size is likely to be larger.
– studying a more homogeneous population, to reduce biological variability.
– improving the way we measure critical variables, to reduce measurement error.
– lengthening the study.
– matching on potential confounders.
– relaxing our standard of evidence (i.e. increasing ).
– planning a more detailed and efficient statistical analysis
– increasing the sample size***

Statistical Power in Study DesignExample: a Simple Clinical Trial
Power Of Clinical Trials Comparing Two Treatments UsingDifference Of Proportions Tests, By , Sample Size, AndMagnitude Of Treatment Effect
n=60 per group n=120 per group
10%vs.
30%
10%vs.
20%
10%vs.
30%
10%vs.
20%
.05 (5%) 72% 25% 96% 51%Level
.01 (1%) 47% 10% 88% 28%

Interpretation
A study has 80% power to detect 25% reduction in mortality at the 5% level of significance.
This means If the drug does in fact reduce mortality by 25%, a
study like this will find a statistically significant difference 80% of the time ( of every 100 studies 80 will have results with p-value <0.05 )

Statistical power in study interpretation
When a study has been completed that produces –an observed effect of clinical interest, but –is not statistically significant, hence is explainable by chance
We can estimate the power that the study actually had for achieving statistical significance in the face of a clinically meaningful real effect.
For instance, if the effect observed were precisely accurate, or if other clinically important violations of H0 were true.

Statistical power in study interpretation
Sometimes, by performing such calculations, we find the power was so low that the study had little chance in the first place to detect important effects!
In that case, the statistically non-significant result also lacks scientific significance.
The study is essentially a bust, and was, to some extent, doomed to be so from before it began,
unless either– the true effect being investigated was much larger than
necessary to have clinical significance
or,– by some great stroke of luck, against all odds, a moderate
clinical effect had been detected
just by chance.

Statistical power in study interpretation
This situation is analogous to running a diagnostic test with a poorly chosen cut-point, so that the test is negative on almost everyone, whether they have the disease or not.
The specificity is high, but the sensitivity is so low that the negative predictive value is very low. In this case, a negative result of the diagnostic test is not informative: you just can’t rely upon it.
The same is true of the negative result of a study with low statistical power: you just can’t rely upon it.
That is why statistical power is now included as a funding criterion by the most effective funding agencies, and affects the chance of publishing a negative study in the best research journals.

Negative versus positive study
In a negative study we need to know the power (or CI). We don’t care about p-value. (We know it is >0.05).
In a positive study we need to know the p-value (or CI). We don’t care about power.(would be like telling someone who won the lottery how stupid it was to play because his odds were 1:million) ( However we may wonder why the study was started with such low power)

Absolute Difference in Risk

Relative Risk ReductionIn 71 NEJM negative clinical trials, could the data exclude a50% reduction in the undesired outcome by the experimentaltherapy?
Power # No (%) # Yes (%) # Total
<90% 34 (68%) 16 (32%) 50
90% 0 (0%) 21 (100%) 21
Total 34 (48%) 37 (52%) 71
From Freiman JA, Chalmers TC, Smith H, Kuebler R (1978) "The Importance Of Beta, The Type II Error And Sample Size In The Design And Interpretation Of The Randomized Control Trial: Survey Of 71 "Negative" Trials." N Engl J Med 299:690-694.

Relative Risk ReductionIn 71 NEJM negative clinical trials, could the data exclude a25% reduction in the undesired outcome by the experimentaltherapy?
Power # No (%) # Yes (%) # Total
<90% 57 (85%) 10 (15%) 67
90% 0 (0%) 4 (100%) 4
Total 57 (80%) 14 (20%) 71
From Freiman JA, Chalmers TC, Smith H, Kuebler R (1978) "The Importance Of Beta, The Type II Error And Sample Size In The Design And Interpretation Of The Randomized Control Trial: Survey Of 71 "Negative" Trials." N Engl J Med 299:690-694.

Statistical power in study interpretation
Two remedies– increase statistical power of clinical studies (motivated
by NIH inducement, imperfectly implemented) study design (e.g., matched or unmatched sample selection)
and parameter of interest
– effect size (strength of true relationship)
– standard of evidence required ()
– sample size
– level of biological variability
– level of measurement error
– method of statistical analysis
– draw clinical inferences from collections of inconclusive studies (metaanalytic methods developed to accomplish this systematically)

Statistical power in study interpretation: take-home points
A research study with very low statistical power may be unethical, as subjects are placed at inconvenience and possible risk with very little chance that useful information will be produced. Many such studies have been and continue to be done in medicine.
"Negative" studies with low statistical power are not really negative, especially when the observed results are clinically encouraging. Such studies are simply inconclusive.
Sometimes studies with less than desirable power must be done, because larger studies aren’t possible or affordable. Clear, dispassionate judgement is called for to decide if such studies are worthwhile. Innovations in study design, technology, or data analytic techniques can help, but sometimes not.
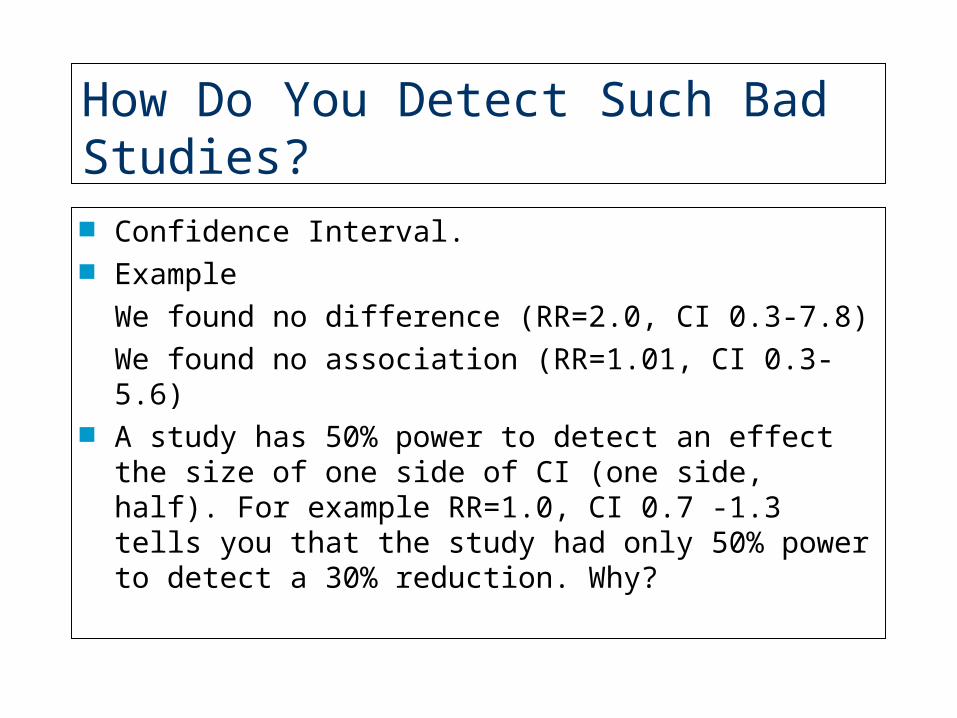
How Do You Detect Such Bad Studies? Confidence Interval. Example
We found no difference (RR=2.0, CI 0.3-7.8)
We found no association (RR=1.01, CI 0.3-5.6) A study has 50% power to detect an effect the size of
one side of CI (one side, half). For example RR=1.0, CI 0.7 -1.3 tells you that the study had only 50% power to detect a 30% reduction. Why?

Why?
If the true effect is a RR of 0.7 (i.e. a 30% reduction), your study should find a RR of about 0.7. 50% of the time it will be a little more than 0.7 and 50% of the time it will be a little less than 0.7.
If the confidence interval is 0.3 in width, then whenever your study turns out a RR >0.7 (50% of the time) your confidence interval will include RR of 1 and you will not be able to reject the null hypothesis (i.e. you will not be able to prove the difference)
So you only have a 50% chance of proving the existence of that 30% reduction.


Aminophylline and COPD


Aminophylline and COPD
Rice and colleagues (Ann Intern Med. 1987) state:
“ There is only a 5% chance that aminophylline causes a mean improvement of 115 mL in the FEV1”.
On the morning of day 2 the FVC for the aminophylline group was 2490 mL and that for the placebo group was 1515 mL.

Aminophylline and COPD
The aminophylline group showed a 4.3-fold increase in the dyspnea index compared with 2.8-fold increase for placebo.
If these differences were compared and not found to be statistically significant, this is obviously due to the small number of patients.
That the number of patients is inadequate can be readily shown by the fact that the difference in side effects (7.7% in the placebo group and 46.7% in the aminophylline group) did not reach statistical significance.