Embed Size (px)
Citation preview

___________________________________________________________________________
2007/SOM1/MAG/WKSP/004
Medical Device Remanufacturing
Submitted by: GE
Workshop on Remanufacturing
Canberra, Australia21 January 2007

1 /GE /
Medical Device Remanufacturing
Joe ShrawderGeneral Manager
Diagnostic ImagingPerformance Technologies
January 21, 2007
GE Healthcare
Lost Opportunity
Improving global equity in health care access

2 /GE /
3 /GE Title or job number /
1/25/2007
Healthcare in Developing Regions TodayX-ray Example
X-Ray Table Tube Stand
Exposed cable Film Processing
4 /GE Title or job number /
1/25/2007
Underserved Populations
• World population: 6 billion people
• >1.2 billion live on less than $1 a day. Two billion more people are only marginally better off.
• Development and globalization is driving higher expectations for healthcare access and quality

3 /GE /
5 /GE Title or job number /
1/25/2007
Significant inequity in health care exists …
3805
3281
2096 2042
608440 384 314
2039 1950
53 98 29
010
0020
0030
0040
00
Fran
ce
Germ
any
Italy UK
Arge
ntin
a
Chile
Mex
ico
Braz
il
Aust
ralia
Japa
n
Chin
a
Thai
land
Viet
nam
Per Capita Health Care Expenditure, 2006 Est.
($US)
Source: Espicom
6 /GE Title or job number /
1/25/2007
Synthetic drug sales in China shows the concentration of healthcare spending in a small number of urban areas
City US $ Mill. Mkt ShareBeijing 969.00 9%Shanghai 837.00 7.80%Guangzhou 472.00 4.40%Hangzhou 268.00 2.50%Wuhan 216.00 2.01%Nanjing 208.00 1.93%Chengdu 201.00 1.87%Shenyang 199.00 1.85%Chongqing 185.00 1.72%Tianjin 181.00 1.68%Jinan 166.00 1.54%Xian 161.00 1.50%Harbin 150.00 1.39%Zhengzhou 141.00 1.31%Qingdao 111.00 1.03%Dalian 102.00 0.95%Top 16 Cities 4,567.00 42.48%
City US $ Mill. Mkt ShareBeijing 969.00 9%Shanghai 837.00 7.80%Guangzhou 472.00 4.40%Hangzhou 268.00 2.50%Wuhan 216.00 2.01%Nanjing 208.00 1.93%Chengdu 201.00 1.87%Shenyang 199.00 1.85%Chongqing 185.00 1.72%Tianjin 181.00 1.68%Jinan 166.00 1.54%Xian 161.00 1.50%Harbin 150.00 1.39%Zhengzhou 141.00 1.31%Qingdao 111.00 1.03%Dalian 102.00 0.95%Top 16 Cities 4,567.00 42.48%
Source: IMS data 2004
Also within developing markets …

4 /GE /
7 /GE Title or job number /
1/25/2007
China example … large areas of unmet need as diagnosis & treatment rates remain lowThe combination of poor healthcare access and limited healthcare insurance
conspire to restrict diagnosis and treatment of chronic conditions.
6.3
20.017
0.4 1.2 2.4
0.0
5.0
10.0
15.0
20.0
25.0
COPD Peptic ulcer disease Hypertension
Mill
ions
of p
eopl
e
Prevalence in top 110 cities People diagnosed and treated in top 110 cities
6% diagnosis & treatment rate
6% diagnosis & treatment rate
6% diagnosis & treatment rate
6% diagnosis & treatment rate
14% diagnosis & treatment rate
14% diagnosis & treatment rate
Source: China Ministry of Health Information Center; 2003 National Healthcare Development Statistics Report, Boston Consulting Group, Synovate research.
Population base approximately 230 million
Population base approximately 230 million
8 /GE Title or job number /
1/25/2007Source: Ministry of Health 2005 National Statistics Digest
Vast majority of advanced medical devices concentrated in urban centers

5 /GE /
9 /GE Title or job number /
1/25/2007
Privatization and insufficient government funding have led hospitals to significantly increase fees charged to patients
Average medical expenses paid by inpatients
880 1422 2046507979
1678
280
683
938
010002000300040005000
1995 2000 2005
Med
ical
cos
ts in
RM
B
Other charges (room fee etc.)Drug charges per inpatientExamination & treatment charges per inpatient
Average medical expenses paid by outpatients
26 50 66917
3819
23
5
0306090
120150
1995 2000 2005Med
ical
cos
ts in
RM
B
Other charges (room fee etc.)Drug charges per outpatientExamination & treatment charges per outpatient
180% increase in average inpatient expenses over past 10 years
180% increase in average inpatient expenses over past 10 years
218% increase in average outpatient expenses over past 10 years
218% increase in average outpatient expenses over past 10 years
Source: Ministry of Health 2005 National Statistics Digest
10 /GE Title or job number /
1/25/2007
Revenue generated per patient very different between hospital types which exacerbates other funding disparities
Average medical expense paid inpatients in 2005
5090 4186 2375 1058
47973573
1994781
428
1084
2112
2764
0
3000
6000
9000
12000
15000
MOH Hospitals Provincial Hospitals City Hospitals County Hospitals
Med
ical
cos
ts in
RM
B
Other charges (room fee etc.)Drug charges per inpatientExamination & treatment charges per inpatient
Average medical expense by outpatients in 2005
137 102 69 41
6253
3928
38
2315
49
0
50
100
150
200
250
MOH Hospitals Provincial Hospitals City Hospitals County Hospitals
Med
ical
cos
ts in
RM
B
Other charges (room fee etc.)Drug charges per outpatientExamination & treatment charges per outpatient
Source: Ministry of Health 2005 National Statistics Digest
6 /GE /
11 /GE Title or job number /
1/25/2007
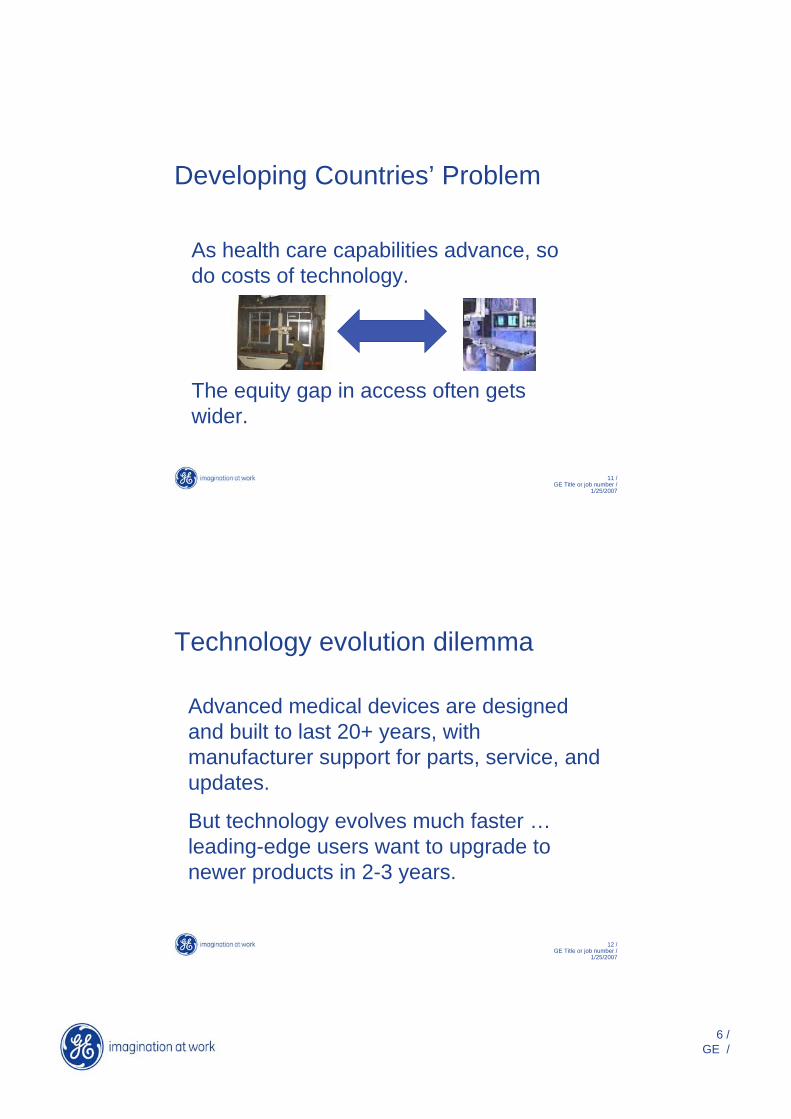
Developing Countries’ Problem
As health care capabilities advance, so do costs of technology.
The equity gap in access often gets wider.
12 /GE Title or job number /
1/25/2007
Technology evolution dilemma
Advanced medical devices are designed and built to last 20+ years, with manufacturer support for parts, service, and updates.
But technology evolves much faster …leading-edge users want to upgrade to newer products in 2-3 years.

7 /GE /
13 /GE Title or job number /
1/25/2007
Remanufacturing solution
• Technology buyers return young devices for trade-in credit and buy “new”
• Equipment makers produce lower cost remanufactured devices for value buyers
14 /GE Title or job number /
1/25/2007
Customer upgrades to newer system …
Trade-in used system
Remanufacture & sale to Value Customer
Original System
Trade-in Payment Allows Existing Customers to Upgrade
Returned system remanufactured and re-certified to current new specification
Backed by full service support and new warranty
20-50% Less than new pricing
Ecologically FriendlyReduce, Re-Use, Recycle
Expanding Healthcare AffordabilityRemanufacturing supports technology upgrade and value buyer needs

8 /GE /
15 /GE Title or job number /
1/25/2007
Quality is Key … Safety is #1 priority
• Remanufactured medical devices fall under FDA supervision … as-is used systems do not
• Manufacturers guarantee same quality, warranty, performance as new
GE Factory Remanufacturing Process1. Inspection and Selection
• Only certain systems in good condition
2. De-Installation
• GE de-installation team to protect condition
3. Cleaning, Disinfection, Data Removal
4. Consumable/Damaged Part Replacement
5. System update/upgrade installation
6. Quality and Safety Test, Calibration, Certification
• Same as new … following FDA requirements
7. Shipping and GE Installation – same as new
8. Full GE Warranty – same as new
Standard process to ensure quality and safety … as Good as New

9 /GE /
Why Remanufacture Medical Devices?Save Money
Advanced technology at reduced cost
Save ResourcesReduce energy and natural resource usageMinimize disposal and pollution burden
SAVE LIVESAccess to life saving technology
Remanufacturing for safe, affordable healthcare
18 /GE Title or job number /
1/25/2007
Quality = Safety, Reliability, EfficiencyA Comparison of AlternativesValue Added New OEM Remanufacture As-Is UsedPrice DiscountManufacturer’sWarrantyAssured Parts andService availableQuality/SafetyPatient Data SecureTest to OEM StandardsUpdate/Upgrade toLatest technologyOEM commitment
Critical Elements for Medical Devices

10 /GE /
Remanufacturing Summary
Value price with High Quality meets healthcare needs in developed and developing countriesRefurbishing is Eco-FriendlyQuality should be regulated “same as new”Patient Safety must not be compromisedThis is critical life-saving technology
Need non-discriminatory trade treatment … “same as new”… with identical quality and safety requirements
20 /GE Title or job number /
1/25/2007
Used medical device risksIssue “Used” Remanufactured
No warranty provided Yes No
Spare parts unavailable Yes No
Untrustworthy seller Yes No
Condition hard to ascertain Yes No
Safety alerts/recalls unavailable Yes No
Technologically obsolete Yes No
Potentially unsafe/unreliable Yes No
Remanufactured devices are backed by original manufacturer and are FDA-compliant

11 /GE /
21 /GE Title or job number /
1/25/2007
Market acceptance and adoption
OEM-remanufactured diagnostic imaging device penetration____
USA >10%
EU 5-8%
Latin America 10-12%
22 /GE Title or job number /
1/25/2007
Saving Lives in Developing CountriesGE Remanufactured Imaging System Installations 2004-2005Systems Installed Patients
MR CT XRay Treated
India 42 48 3 190,000
Brazil 18 36 8 140,000
Philippines 2 9 4 40,000Fulfilling a Critical Public and Human
Need
12 /GE /
23 /GE Title or job number /
1/25/2007
Regulation in major remanufactured medical device markets
USA: Devices and remanufacturers
must be FDA-registered
EU: Devices must be CE-marked andmeet same requirements as newdevices
24 /GE Title or job number /
1/25/2007
Some countries that prohibit remanufactured medical devices
China: Imports prohibited from 1998, Domestic trade regulation unclear
Thailand: Imports prohibitedDomestic resales permitted
Viet Nam: Imports restricted
Egypt: Imports prohibited

13 /GE /
25 /GE Title or job number /
1/25/2007
History of used medical device bans
• FDA hasn’t actively supervised as-is used trade … 3000+ independent dealers
• Unethical dealers often look to salvage value from unusable or unsafe devices
• Some countries seek to protect domestic device industry
26 /GE Title or job number /
1/25/2007
Impact of restrictions on access to lower-cost remanufactured devices

14 /GE /
27 /GE Title or job number /
1/25/2007
Consequences of remanufacturing prohibitions
• Ethical suppliers are blocked
• Non-compliant 3rd parties circumvent rules
• Patients face daunting quality and safety risk
• Access denied to hundreds of millions
28 /GE Title or job number /
1/25/2007
Solution
Devices remanufactured by the original manufacturer should be treated “same as
new”, with identical requirements, in all trade policy

15 /GE /
29 /GE Title or job number /
1/25/2007
THANK YOU


![Asia Pacific Youth to Business (Y2B) Forum Proposal [for Asia Pacific]](https://img.pdfslide.us/doc/110x75/568c4db71a28ab4916a50cbd/asia-pacific-youth-to-business-y2b-forum-proposal-for-asia-pacific.jpg)