Embed Size (px)
Citation preview

Medical cost trend:Behind the numbers 2019
June 2018
www.pwc.com/us/medicalcosttrends

Medical cost trend: Behind the numbers 2019
Contents
The heart of the matter 1
Medical cost trend in 2019 3
Putting trend in perspective 4
Factors affecting 2019 medical cost trend 8
New combinations 22
What this means for your business 24
About this research and HRI 31
Acknowledgments 32

Medical cost trend: Behind the numbers 2019 PwC | 1
The heart of the matter
Employer medical cost trend has plateaued. While the predictability is a welcome change from the wild swings and peak double-digit trends in the 2000s, steady as she goes is not good enough. Medical costs continue to grow as a percent of total employee compensation, making even the current trend unsustainable.
PwC’s Health Research Institute (HRI) projects a 6 percent medical cost trend in 2019, consistent with the 5.5-7 percent range of the previous five years. But employers continue to struggle to contain their employee coverage costs. Medical costs continue to grow, yet the workforce’s health and performance aren’t improving. Average labor productivity growth of 1.1 percent over the last 10 years falls far below the 2.3 percent average of the last seven decades.1 Efforts by employers to cut utilization have mostly run their course. Employers and consumers are plagued by high prices that continue to grow because of new, expensive medical services and drugs, and other factors, such as consolidation.
HRI’s analysis measures anticipated medical cost trend in the employer-based market, which covers about half of non-elderly Americans.2 Changes to government health insurance, including Medicare, Medicaid and plans sold on the public exchanges created by the Affordable Care Act (ACA), are not within this analysis’ scope.
HRI’s research points to three factors inflating medical cost trend in 2019.• Care anywhere and everywhere. Responding to increased consumer pressure,
employers and health plans are improving convenience by giving consumers more ways to get care. The long-term goal is to decrease spending, but in the short term, more access points can raise utilization.
• Provider megamergers. The provider landscape will grow more concentrated after several recently announced mega-deals are completed. Prices tend to rise when two health systems merge and the consolidated entity gains market share and negotiating power.
• Physician consolidation and employment. More doctors are practicing as employees of hospitals, health systems and medical groups. These organizations tend to charge higher prices than independent doctors.
Medical cost trend: Behind the numbers 2019 PwC | 2
Three factors are tempering the spending increases.• Flu impact. The 2017-18 flu season was the worst in several years, increasing care
utilization and driving up medical cost trend. The 2018-19 flu season likely will be closer to average, slightly dampening the disease’s effect on trend in 2019.
• Care advocacy. Employers and health plans are offering consumers new services that engage and guide the consumer to better quality and lower-cost care.
• High-performance networks. These limited-provider networks emphasize high-quality care and customer satisfaction alongside cost savings. Some employers are using their buying power to negotiate directly with providers to create this type of network.
Some forces affect medical cost trend year after year. These include economywide drivers such as demographics, social factors, lifestyle choices and general economic growth. They also include healthcare-specific drivers such as medical technology and innovation, government actions, payment model changes and drug spending growth, including generics’ offsetting effects. General economic conditions are strong and show signs of continuing to improve, putting upward pressure on trend beyond 2019.
Deal activity picked up steam in the second half of 2017 and into 2018 with the announcement of major combinations such as CVS Health-Aetna, Cigna Corp.-Express Scripts Holding Co. and Optum-DaVita Medical Group. Organizations not usually considered healthcare companies also are dipping their toes into the healthcare industry, such as Amazon, JPMorgan Chase & Co. and Berkshire Hathaway Inc. These disruptive deals have created a lot of excitement because of their scale and the organizations involved. But these combinations’ future effects on medical cost trend aren’t known.
Industry trends and efforts by employers and health plans have driven medical cost trend down from double digits in 2007 to 5.5-7 percent a year for the last five years.3 But trend seems stuck at that growth rate. To drive it down even more, employers and health plans likely will have to tackle prices—and not just drug prices, which have been a focal point in the last few years.
“It’s not like you can point the finger at one bad guy,” said Niall Brennan, president and CEO of the Washington D.C.-based Health Care Cost Institute, in a conversation with HRI. “There appear to be multiple offenders in different segments of the industry.”
Addressing prices will require employers and insurers to collaborate with employees, providers, pharmaceutical companies, pharmacy benefit managers, community health resources, retail pharmacies and new entrants to the industry. It will mean sharpening focus on three areas: justifying the price of products or services by demonstrating their value, getting comfortable working with third parties advocating on patients’ behalf, and targeting investments that improve the customer experience.

Medical cost trend: Behind the numbers 2019 PwC | 3
What is medical cost trend? Medical cost trend is the projected percentage increase in the cost to treat patients from one year to the next, assuming that benefits remain the same. While it can be defined in several ways, this report estimates the projected increase in per capita costs of medical services and prescription medicine that affect commercial insurers’ large group plans and large, self-insured businesses. Insurance companies use the projection to calculate health plan premiums for the coming year. For example, a 10 percent trend means that a plan that costs $10,000 per employee this year would cost $11,000 next year. The cost trend, or growth rate, is influenced primarily by:
• Changes in the price of medical products and services and prescription medicine, known as unit cost inflation
• Changes in the number or intensity of services used, or changes in per capita utilization
Medical cost trend in 2019
HRI projects medical cost trend to be 6 percent in 2019 (see Figure 1). Health insurance companies use medical cost trend to help set premiums by estimating what the same health plan this year will cost the following year. The net growth rate in 2019, after accounting for benefit design changes such as higher co-pays and narrow provider networks, is expected to be 5.5 percent.
For this research, HRI interviewed industry executives, health policy experts and health plan actuaries whose companies cover more than 75 million employer-sponsored members. HRI also analyzed results from PwC’s 2018 Health and Well-being Touchstone Survey of more than 900 employers from 37 industries, an HRI national consumer survey of 1,500 US adults and an HRI national clinician survey of 1,000 physicians, physician assistants and nurse practitioners. This projection is based on HRI’s analysis of medical and drug costs in the employer insurance market, which covers more than 150 million individuals.4
2019201820172016201520142013201220112010200920082007
6.0%6.2% 6.0%*
5.5%*
6.8%6.5%
7.5%
8.5%9.0%9.0%9.2%
9.9%
11.9%
Medical cost trend fell for seven years before stabilizing around 6 percent
*HRI recalibrated its estimates for 2017 and 2018 down from those reported in the Medical cost trend: Behind the numbers 2018 report. Source: PwC Health Research Institute medical cost trends 2007–20195
Figure 1
Medical cost trend:Behind the numbers 2019
June 2018
www.pwc.com/usmedicalcosttrends
Medical cost trend: Behind the numbers 2019 PwC | 4
Putting trend in perspective
HRI analyzed three macroeconomic trends to give perspective, better understand the 2019 outlook, and suggest what may affect medical cost trend beyond 2019.
A look back at health spending since 1960
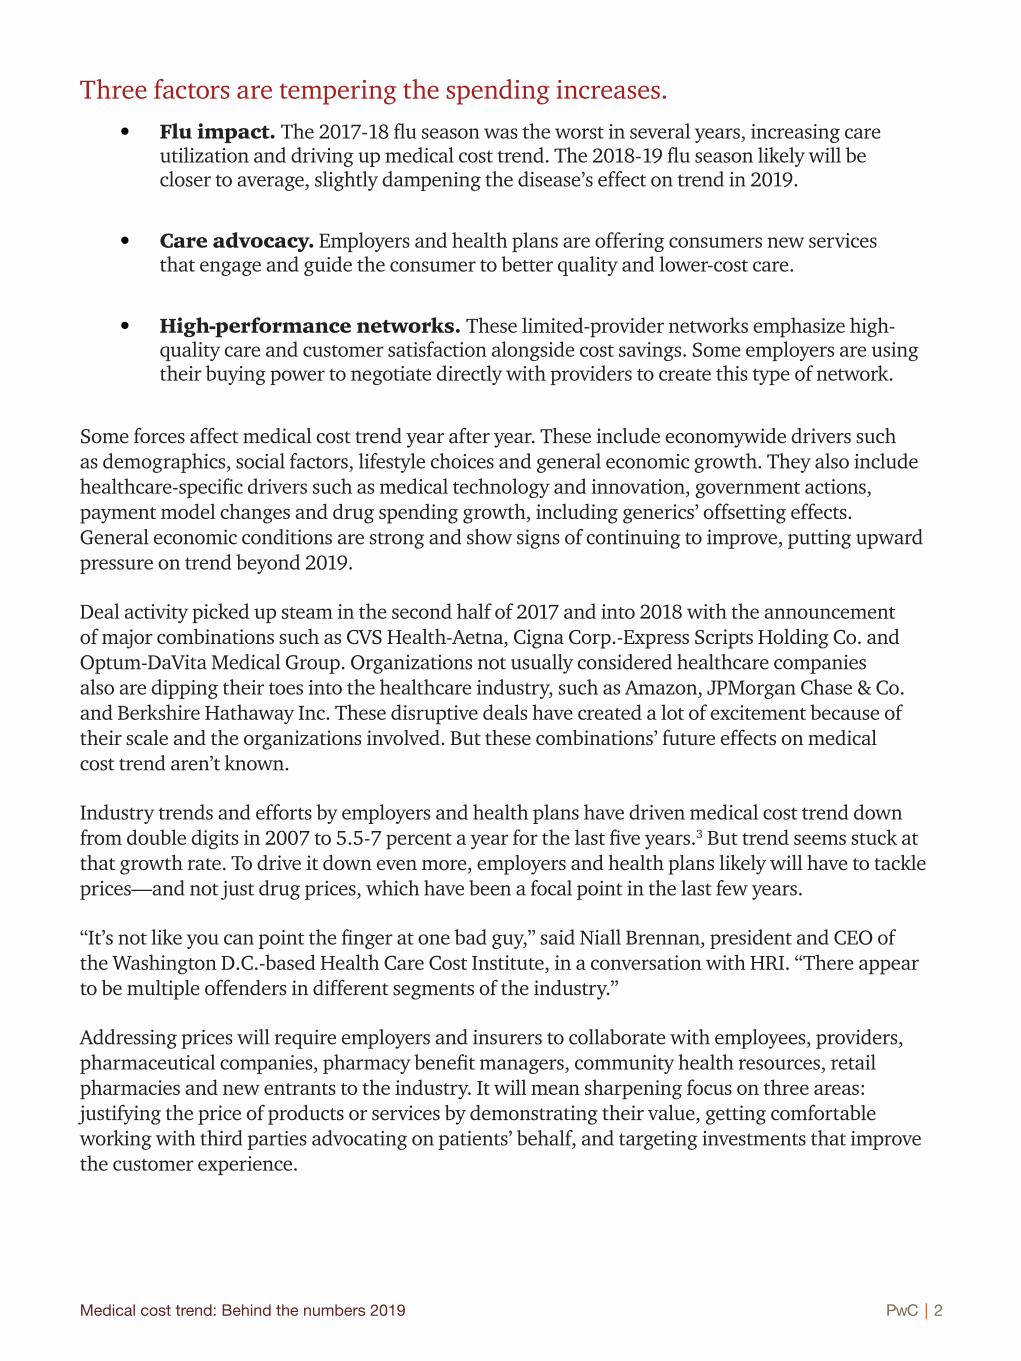
Employer medical cost trend has held steady in recent years while private health insurance spending growth has stabilized. The double-digit peaks and ensuing lower single-digit troughs have not been seen in over a decade (see Figure 2). Private health insurance spending is a measure of health spending growth for the private health insurance market, about 90 percent of which consists of employer health spending.6 It takes into account benefit design changes and network changes. Medical cost trend in this report is a forecast number that doesn’t include these changes.
Looking at private health insurance spending growth over the last 55 years, adjusted for inflation, a clear cycle emerges. Private health insurance spending growth swung up and down in cycles, maxing out at or above 10 percent and bottoming out below 4 percent. In the last decade private health insurance growth has fluctuated, but it has been hovering around 3 percent.
2016
2011
2006
2001
1996
1991
1986
1981
1976
1971
1966
1961
Note: Data have been adjusted for inflation.Source: PwC Health Research Institute analysis of CMS national health expenditure data and Bureau of Labor Statistics data7
Health spending growth has stabilized in the last decade
Growth in national health expenditures and private health insurance spending, 1961–2016
Figure 2
-2%
3%
8%
13%
18%
Trend line — Total spending from private health insuranceTrend line — National health expenditures
Total spending from private health
insurance
National health expenditures
3.8%
3.0%
10.2%
6.0%Per
cent
gro
wth

Medical cost trend: Behind the numbers 2019 PwC | 5
A number of factors likely stabilized this cycle for now. Better data systems have significantly reduced information lags that may have led to previous underwriting cycles. Growth in managed care organizations that tend to better manage costs and trend may also have had an effect. An increase in the number of employers opting to self-insure, and the movement to high deductible health plans in the last decade may have dampened utilization. Last, the arrival of the ACA-required minimum medical loss ratio (MLR) in 2011 may have smoothed out large fluctuations in health spending. The MLR standards in place since 2011 require fully insured large group plans to spend 85 percent of premium dollars collected on medical care (including prescription medicine) and healthcare quality improvement expenses, leaving 15 percent of premiums for administrative costs and profit margins.8
While the cycle may have dissipated and the trend may be more consistent, healthcare continues to grow as a share of the US economy and of total employee compensation, which includes both hourly and salaried pay and benefits (see Figure 3). National health spending has grown from an average of under 6 percent of gross domestic product (GDP) in the 1960s to a projected average of nearly 18 percent for the decade ending in 2020. Similarly, employer health spending has grown from 6 percent of total wages in 1988 to more than 12 percent in 2018. This has been fueled by two trends. First, healthcare prices have grown faster than other economywide prices, in large part because of ever-increasing, expensive new services and drugs.9 Second, healthcare utilization has been driven by new technologies and procedures, new prescription medicines, an aging population, and historically misaligned incentives that compensate providers based on volume.
The Centers for Medicare and Medicaid Services (CMS) estimate that this growth will continue, with national health spending projected to be 20 percent of the economy by 2026.10
Healthcare expenditures as shares of GDP and wages have doubled since the 1980sFigure 3
National health expenditures as a share of GDP Employer health spending as a share of wages
18%
16%
14%
12%
10%
8%
6%
4%
2%
0%
2001–20101991–20001981–19901971–19801961–1970 2011–2019
Note: Employer health spending data are available starting in 1988, so they're not included in this figure before the 1980s.Source: PwC Health Research Institute analysis of CMS national health expenditure data and Bureau of Economic Analysis data11

Medical cost trend: Behind the numbers 2019 PwC | 6
Environment for healthcare spending growth over the next few years
Growth in healthcare spending tends to be highly correlated with growth in disposable personal income but with a lag of several years. Recent growth in disposable personal income is expected to affect healthcare spending growth over the next few years (see Figure 4). In 2015 and 2016, consumers experienced a dramatic drop in their disposable personal income’s growth. The effects of this are expected to influence growth in 2019 in the form of a dampening effect on healthcare spending. Fueled by tax cuts and lower unemployment rates, growth in consumers’ disposable personal income has risen since 2016 and is expected to peak above 5 percent in 2018. Increases in disposable personal income have historically led to healthcare spending increases via increased utilization. The most substantial healthcare spending changes resulting from this phenomenon tend to occur with a lag of two to three years, according to CMS’ Office of the Actuary.12 The growth in disposable personal income in 2017 and 2018 is expected to put upward pressure on healthcare spending in 2020.
Growth in disposable personal income, adjusted for inflation, is on the rise and projected to peak in 2018; the largest impacts will be seen in increased healthcare spending in 2020 and 2021
Figure 4
Source: PwC Health Research Institute analysis of Congressional Budget Office data13
Percent annual growth in disposable income
2028
2027
2026
2025
2024
2023
2022
2021
2020
2019
2018
2017
2016
2015
2014
2013
Actualgrowth
Projectedgrowth
5.3%
0.2%
0%
-2%
-4%
2%
4%
6%

Medical cost trend: Behind the numbers 2019 PwC | 7
Prices—specifically, drug prices—remain a focal point
Consumers, lawmakers and others are intensifying their focus on healthcare prices. Prices for prescription medicines have received much attention. Lawmakers increasingly are asking drug manufacturers to justify prices and price increases. Along with others, legislators also are pressuring pharmacy benefit managers (PBMs) about their role in the system. In its research, HRI found that lawmakers, health insurers and employers are looking for PBMs to provide increased transparency regarding their discounting processes and to demonstrate the value they add.
One of the Trump administration’s main strategies to address drug prices is to increase competition by increasing the number of generics on the market. The number of generic drug approvals has been steadily rising since 2013, hitting a record number of 937 approvals in federal government fiscal year 2017 (see Figure 5). Food and Drug Administration (FDA) Commissioner Scott Gottlieb aims to streamline the regulatory requirements for generic drug manufacturers and ultimately make the approval process for new medicines more efficient. “The FDA’s generic drug team already has made substantial investment in process improvements that are yielding faster assessment and approval times, translating to direct benefits for consumers through more approvals of lower-cost drug options,” Gottlieb said in a statement released by the FDA in January 2018.14 Increased competition may lead to lower drug prices and may dampen future medical cost trend.
Generic drug approvals are steadily rising at the FDAFigure 5
Jun
201
7
Feb
201
7
Oct
201
6
Jun
201
6
Feb
201
6
Oct
201
5
Jun
201
5
Feb
201
5
Oct
201
4
Jun
201
4
Feb
201
4
Oct
201
3
60
40
20
0
80
100
120
FY17
937FY16
835FY15
612FY14
500
Tota
l ful
l and
tent
ativ
e ge
neric
app
rova
ls b
y m
onth
Note: Approvals calculated based on federal government fiscal year running Oct. 1- Sept. 30.Source: PwC Health Research Institute analysis of FDA generic drug approvals

Medical cost trend: Behind the numbers 2019 PwC | 8
Factors affecting 2019 medical cost trend
Medical cost trend’s usual suspects
While the primary inflators and deflators of medical cost trend presented in this report highlight new and emerging issues for 2019, an analysis of historical medical cost trend reveals forces that repeatedly influence medical cost trend (see Figure 6).
Healthcare-specific drivers:
Medical technology and innovation: New health technologies can improve outcomes and patient satisfaction but tend to cost more than existing ones.
Drug spending: Specialty drugs and gene therapies typically apply to a small segment of the population but at a high cost that can impact employer spending.
Government regulation: In 2019, the industry may experience more uninsured and underinsured individuals due to the elimination of the individual mandate penalty, efforts to expand the use of non-ACA compliant health plans, and state Medicaid work requirements.
Payment models: Health plans have seen improved quality and cost outcomes from value-based payment arrangements and will continue to push for them.
Economywide drivers:
Demographics: As baby boomers age, they have more health needs and higher healthcare costs.
Social factors and lifestyle: Unaddressed social factors of health such as economic stability and education can impact utilization patterns and care decisions, while poor wellness and prevention habits are drivers of poor health.
General inflation: As economywide input prices go up, so do healthcare prices.
Source: PwC Health Research Institute analysis
Figure 6 Recurring forces affecting medical cost trend in 2019

Medical cost trend: Behind the numbers 2019 PwC | 9
Inflator #1: Care anywhere and everywhere
Consumers have more ways to obtain care than ever—including, for example, grocery store retail clinics and video chats with clinicians via smartphone. Access to traditional care settings also is increasing, with the number of urgent care establishments nationwide estimated to grow 32 percent from 2014 to 2019.15 This is great for convenience, a key healthcare experience feature valued across consumer segments, according to a 2018 HRI report on customer experience.16 But this “care anywhere and everywhere” trend also is driving utilization, making it an inflator for 2019.
“In transportation there is this idea that anytime you make it easier for people to use the transportation system, you increase congestion,” said Micah Weinberg, president of the Economic Institute of the Bay Area Economic Council, a San Francisco-based center for economic and policy research, in an interview with HRI. “A similar analogy applies to healthcare; anytime you make it easier to access the healthcare system, you increase utilization.”
To meet the demand for convenience, employers offer different types of healthcare touch points to their employees. Some, such as wellness programs, aren’t direct medical care but are “low touch” and can lead to follow-on medical care (see Figure 7). For example, the majority of employers surveyed offer health risk questionnaires and biometric screenings to their employees—both of which can identify health concerns and prompt further care.17 Other employer offerings are “high touch” and involve direct visits with primary care providers.
Employers increasingly are offering add-on, high-touch points of care such as executive health exams and on-site health clinics, while low-touch points are offered broadly by employers
Figure 7
*Data on health coaches offered in 2018 are unavailable because Touchstone 2018 did not ask this question.Source: PwC Health Research Institute analysis of PwC Health and Well-being Touchstone survey for 2014, 2016 and 201818
20%
0%
40%
80%
60%
2016
2014
2018
2016
2014
2018
2016
2014
2018
2016
2014
2018
2016
2014
2018
2016
2014
2018
Executive health exam
Health coach*
Weight management
Biometric screening
Health risk questionnaire
Low touch High touch
On-site health clinic
Percentage of employers offering

Medical cost trend: Behind the numbers 2019 PwC | 10
New high-touch points of care—from retail clinics to video visits to urgent care in the home— have popped up over the past few years. In 2018, 38 percent of employers offered executive health exams to their employees—a high-touch benefit that is usually separate from the employee’s health insurance benefits and in addition to the free, annual preventive care visit covered under the health insurance benefit—up from only 24 percent in 2014.19
Many consumers are seeking out care in settings outside of the traditional doctor’s office; of those surveyed with employer-based insurance, 60 percent said they have received care in an urgent care center, 25 percent in a retail health clinic and 11 percent by video visit.20 At the same time, consumers with employer-based insurance are increasingly willing to receive care in settings outside of the traditional doctor’s office (see Figure 8).
“The increased availability of care may be driving higher utilization, but the question is whether that utilization is occurring in alternative, lower-cost settings that are supplanting a higher-cost visit in the next couple of years,” said Mary Grealy, president of the Healthcare Leadership Council, a coalition of executives from all disciplines in American healthcare based in Washington, D.C., in an interview with HRI.
While the short-term result of increased access may be increased utilization, payers and employers hope that access will reduce costs in the long term by detecting and treating health concerns early and shifting care from higher-cost environments to those that cost less. Achieving appropriate utilization will require employers, payers and providers to strike a balance between access and convenience to avoid delaying care or creating unnecessary demand.
Consumers are seeking care outside of the traditional doctor’s officeFigure 8
Source: PwC Health Research Institute consumer survey, summer 2016 and winter 2018
Send a digital photo of a rash or skin problem to a dermatologist
for an opinion
Have a live visit with a physician via smartphone
Have stitches or staples removed at a clinic in a retail store or
pharmacy
Percent of consumers indicating they are likely to choose the following care options for themselves if they cost less than the traditional options
42%
49% 2018
201644%
45% 2018
201651%
56% 2018
2016

Medical cost trend: Behind the numbers 2019 PwC | 11
Inflator #2: Provider megamergers
HRI estimates that by 2019, 93 percent of most metropolitan hospital markets will be considered highly concentrated (see Figure 9).21 In the short term, this trend likely will lead to higher prices for medical services in these markets as providers have more negotiating power with payers and increased expenses from integration. This will likely inflate medical cost trend for 2019. But over the long term, economies of scale and efficiencies may be achieved.
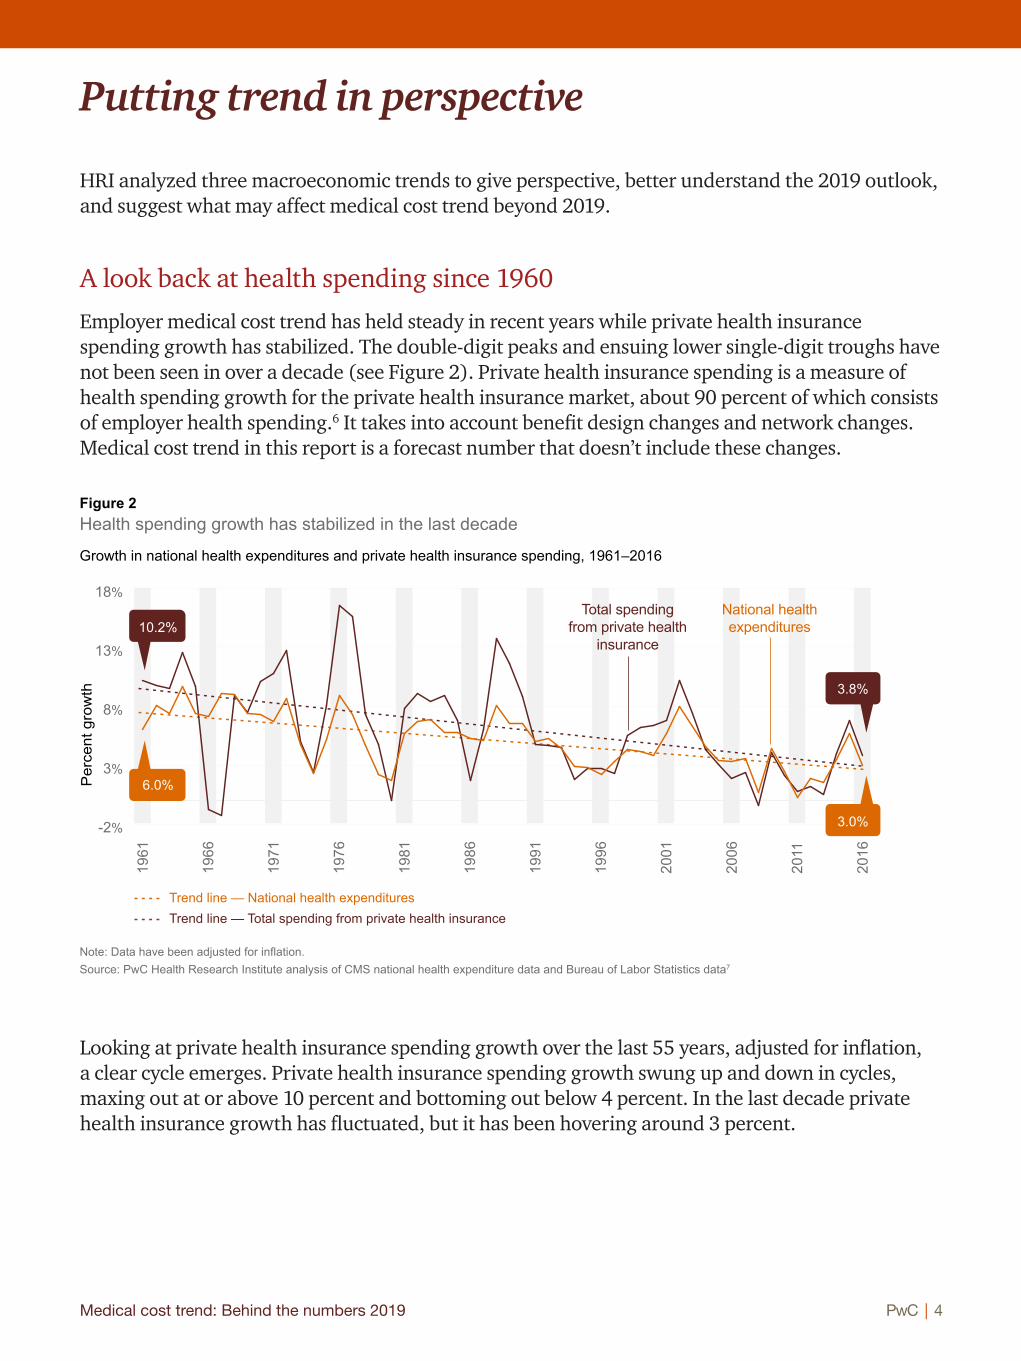
In 2017, the number of announced hospital and health system deals increased nearly 13 percent from 2016, the highest number of transactions since 2000. Of 115 health system and hospital mergers announced in 2017, 10 were mega-deals involving sellers with net annual revenues of at least $1 billion (see Figure 10).23 The intent of these deals is to achieve scale to invest in the infrastructure and programs necessary to drive quality, convenience and customer satisfaction, and ultimately deliver value to consumers, employers and health insurers. The short-term result is often higher prices.
HRI projects 93 percent of most metropolitan hospital markets will be highly concentrated by 2019Figure 9
Source: PwC Health Research Institute analysis of the Herfindahl-Hirschman Index for hospital markets22
60%
50%
70%
90%
80%
100%
2012
2006
1990
2019
65%
77%
84%
93%
Market concentration Projected
Medical cost trend: Behind the numbers 2019 PwC | 12
“There has been little to no action taken to stop providers from concentrating or taking price increases,” said Sherry Glied, dean of New York University Wagner Graduate School of Public Service, in a recent interview with HRI. “If inflation ramps up and consolidation continues, expect to see strong upward pressure on prices.”
As the market becomes more concentrated, medical prices may rise in two main ways. First, overnight price increases may occur when the acquiring organization has higher reimbursement rates. Second, “You’re going to increase prices because you’ll have more leverage to negotiate higher prices going forward,” said Thomas Getzen, former executive director of the International Health Economics Association, in an interview with HRI. “It’s just that simple.”
Recent deals between providers are massive in size and geographic coverageFigure 10
Note: States where one of the pre-merger entities does business have been shaded to show the geographic span of these large deals. States with more than one color have entities associated with more than one merger.Source: Largest hospital and health system deals announced in 2017 and early 2018. See endnotes 24-46.
$5B
Based in: ChicagoSt. Louis
150 care sites2,600 care sites
Completed
8 care locations53 care locations6 care locations127 care locations3 care locations
Advocate Health Care / Aurora Health Care
Based in: Completed
$28.4B
$11B
Based in:
Pending
Completed
Based in: Mass. Hospitals:
Presence Health / Ascension
Downers Grove, Ill.Milwaukee
3 million patients1.2 million patients
Dignity Health / Catholic Health Initiatives
$25.2B
San FranciscoEnglewood, Colo.
9,200 hospital beds13,000 hospital beds
$3.9BGreenville Health System / Palmetto Health
Based in: Greenville, S.C.Columbia, S.C.
15 hospitals7 hospitals
Beth Israel DeaconessLahey HealthNew England BaptistMount AuburnAnna Jaques
BostonBurlington, Mass.BostonCambridge, Mass.Newburyport, Mass.
Pending

Medical cost trend: Behind the numbers 2019 PwC | 13
Movement to a more consolidated provider landscape is expected to continue, with 72 percent of provider executives surveyed by HRI noting that reorganization is important to their organization’s success over the next five years.47 Provider leaders also noted that they are considering merging with or acquiring additional facilities within the next five years (see Figure 11).
Many provider executives are considering merging with or acquiring different types of care facilities within the next five years
Figure 11
Source: PwC Health Research Institute provider executive survey, 2017
Outpatient facilities
Retail clinics
Home health care agencies
Acute rehabilitation hospitals
Community hospital/health systems
Hospice agencies
Not-for-profit hospital/health systems
Academic medical centers
Skilled nursing facilities
For-profit hospital/health systems
60%50%40%30%20%10%0% 70%

Medical cost trend: Behind the numbers 2019 PwC | 14
Inflator #3: Physician consolidation and employment
As physicians consolidate, prices can rise. Physicians are increasingly practicing in larger, concentrated groups because of acquisitions by other physician groups, hospitals and health systems.48 According to some estimates, physician consolidation alone resulted in an 8 percent increase in physician fees from 1988 to 2008.49 Though an 8 percent increase over 20 years may not seem like much, it doesn’t take inflation or other factors into account. One would expect consolidation to result in greater scale, improved efficiency and ultimately lower prices over time, but though scale and efficiency may have improved, prices haven’t yet come down.
“The last five to 10 years of physician practice acquisitions and vertical consolidation has made it hard for employers to negotiate,” said David Lansky, president and CEO of the Pacific Business Group on Health, a California-based employer association, in an interview with HRI. Physicians working in highly concentrated markets charge 14 to 30 percent more than their counterparts working in less concentrated markets.50 One might expect prices to come down as physicians consolidate and have more scale. HRI research found that purchased practices often take on the parent company’s rate structure, which is usually higher.
The two main factors driving price increases in acquisitions are the use of the larger (often acquiring) entity’s billing practices and fee schedule, and decreased efficiency among doctors employed by the health system as opposed to being independent. Practices purchased by a hospital or health system often bill a separate facility fee on top of the professional fee for a clinic visit. The most recent Medicare Payment Advisory Committee (MedPAC) Report to Congress highlights how these fees affect prices. MedPAC reports that in 2017, the total Medicare payment for the most common office visit when performed in a hospital outpatient setting was $158, over $100 of which was attributable to the facility fee. The $158 is more than twice the price of the same visit when performed in a physician office setting for $74.51
A recent Merritt Hawkins study found that employed physicians see an average of 20 patients per day compared with 23 seen by their independent counterparts.52 The aim of this trend is for physicians to spend more time caring for patients and coordinating their care across the health ecosystem, thus creating more value. However, if this trend continues, more doctors will be needed to serve current patient levels. An imbalance between physician supply and demand could push up physician compensation and, ultimately, the price of services.

Medical cost trend: Behind the numbers 2019 PwC | 15
The percentage of physicians employed by hospitals grew to 42 in 2016 from 26 in 2012.53 While this shift has been occurring for several years among primary care physicians and certain specialties—such as cardiology—it’s now more widespread. A recent HRI survey shows medical and surgical specialists’ interest in employment by a hospital, health system or medical group is on par with that of primary care physicians’; those specialties largely remained unconsolidated until recently.54 This increase may be driven largely by physicians who are early in their medical careers (see Figure 12). As older physicians retire, new ones who prefer to be employed will replace them.
Physicians in the first 10 years of their careers have higher levels of interest in being employed than their counterparts who have been practicing for more than 10 years
Figure 12
Source: PwC Health Research Institute clinician survey, 2018
Physicians indicating interest in employment by each of the following
More than 10 years of experience 10 years of experience or less
74%
58%
Multi-specialty group
82%75%
Single specialty group
79%
64%
Hospital or health system

Medical cost trend: Behind the numbers 2019 PwC | 16
Deflator #1: Flu impact
The 2017-18 influenza season was the worst in several years. Hospitalizations, mortality and prevalence were up across the country. A bad flu season can significantly affect medical cost trend in one year but be a deflator in the next when flu cases return to the mean.
“A bad guy for 2018 with rebound expected in 2019 is the severe flu season,” said Brian Renshaw, vice president and CFO of clinical solutions at Anthem Inc., based in Indianapolis, in an interview with HRI. He believes the 2017-18 flu season may add up to 20 basis points to the medical cost trend in 2018. A rebound effect is expected in 2019.
HRI found that flu spending as a percentage of total healthcare spending in 2018 rose significantly (see Figure 13). Considering historical trends, the 2018-19 flu season is expected to be milder than the last season. Assuming the 2018-19 flu season returns to the average, HRI expects a decrease in flu costs as a percentage of total spending in 2019 (see Figure 13).
0.6%0.5%0.4%0.3%0.2%0.1%0.0%
0.7%
0.9%0.8%
1.0%
On the heels of a severe flu season, lower utilization and expenditures may deflate trend by 22 basis pointsFigure 13
*2019 predicted % of total spending is based on predicted flu-related mortality rates.
Source: PwC Health Research Institute analysis of Centers for Disease Control and Prevention data, Medical Expenditure Panel Survey data, and Healthcare Cost and Utilization Project data55
Flu
spen
ding
as
a %
of t
otal
hea
lthca
re s
pend
ing
2019
2017
2018
2016
2015
2014
2013
2012
2011
2010
2009
2008
2007
2006
Actual % of total spending Predicted (% of total spending based on flu-related mortality rates)
Trend (% of total spending based on average flu-related mortality rates)
0.96%
0.74%*

Medical cost trend: Behind the numbers 2019 PwC | 17
Primary care physicians surveyed by HRI said they experienced increased patient visits, hours, and instances of prescribing medications over the phone during the last flu season (see Figure 14). “Due to unexpected high volume, the demand for appointments outstripped our capacity many days this flu season,” said Dr. Phil Mitchell, medical director for DispatchHealth, a Denver-based mobile urgent care service, in a conversation with HRI. “Patients deemed to be less acute were advised to see their primary care provider or given an appointment with Dispatch the next day.”
Seventy-eight percent of primary care physicians saw an increase in appointments over the past six months related to the flu
Figure 14
Source: PwC Health Research Institute clinician survey, 2018
Ways primary care physicians managed the increase in appointments
Directed patients to urgent care if they could not see the patient
Extended their clinic hours/days
Provided care to patients over the phone
Directed patients to the emergency room if they could not see the patient
Prescribed flu medication
over the phone
Increased clinician staffing
51% 49% 41% 36% 36% 30%

Medical cost trend: Behind the numbers 2019 PwC | 18
Deflator #2: Care advocacy
Employers and health plans are offering care advocacy services to help employees manage their high deductible health plans (HDHPs), creating a dampening effect on medical cost trend for 2019. Seventy-two percent of employers surveyed by PwC offered health advocacy services to their employees in 2018; in 2016, that percentage was 57 percent (see Figure 15).
“It’s the end of the cost-shifting story and the beginning of figuring out how to help employees become better healthcare consumers through real-time navigation assistance,” said Michael Thompson, president and CEO of the National Alliance of Healthcare Purchaser Coalitions, based in Washington, D.C., in an interview with HRI.
Employers have increasingly relied on HDHPs to keep medical costs under control. But though HDHPs may reduce utilization, they also may deter necessary care for early diagnosis or management of chronic conditions. With the healthcare system’s ever-expanding number of care options, limited price transparency and complexity, consumers often struggle to navigate the system and make the best use of their benefits. Patient advocacy services have existed for several decades but were primarily offered as an exclusive, concierge-type service available to only a select few. This is changing as employers and health plans see such services’ value for their employees and members. The services give patients personalized help on interacting with the system.
Health Care Services Corporation (HCSC), a not-for-profit health insurance company based in Chicago that operates Blue Cross Blue Shield plans in five states, has started a program for large, self-funded employers that supplies live advocates to help consumers estimate and compare costs, analyze treatment options and identify the most cost-effective treatment plans.56 Third party health advocacy firms such as Accolade Inc., based in Plymouth Meeting, Pa., and Quantum Health Inc., based in Columbus, Ohio, offer treatment decision support, transparency tools, provider coordination, help with integrated behavioral health needs, and even logistical help, such as transportation support.
+11% +14%
Employers increasingly are offering health advocacy programsFigure 15
Source: PwC Health and Well-being Touchstone surveys, 2016-2018
63%72%
57%
Percent growth
2016 2017 2018

Medical cost trend: Behind the numbers 2019 PwC | 19
Advocates collect important nonclinical data, such as socioeconomic factors, that help them influence care decisions, such as steering patients toward cost-effective primary care visits and preventive services. The aim is to decrease utilization of ER visits and inpatient stays when they’re avoidable. For example, Carolyn Young, chief actuary at Accolade, told HRI that when a member calls for help in finding a specialist, an Accolade health assistant will find out why the member wants to see a specialist, determine whether a primary care visit will suffice, conduct the search for the proper provider, help prepare the member for the appointment and, depending on the circumstance, follow up with the member after the appointment.
Employers who use these advocacy programs, such as King of Prussia, Pa.-based AmeriGas Partners L.P., a national retail propane marketer, have reported reductions in hospital admissions and average lengths of hospital stays, and cost savings in employee medical claims.57 Accolade says it has been able to achieve less than 1 percent medical cost trend for its customers annualized over the last three years.58 As health advocacy programs demonstrate their value through improved outcomes, increased employee satisfaction and significant cost savings, employers are doubling down on them as the next way to manage rising healthcare costs.
Use of these programs, which are increasingly available to consumers, is critical to affecting overall cost trend. “The biggest challenge for employers with advocacy services is engagement—how do employers encourage employees to take advantage of this resource?” said Brian Marcotte, president and CEO of the National Business Group on Health, in an interview with HRI. “Once they are engaged, health advocacy services do a good job of helping employees understand their benefits and treatment options, navigate the health system and steer to more efficient, quality providers. But most people don’t touch the healthcare system often. When they do, they forget the health advocates are there to help.”
Providers are optimistic these organizations can help patients improve outcomes, improve the patient experience, and decrease costs by improving efficiency, according to a recent HRI survey (see Figure 16).
By improving coordination with health advocacy and navigation firms, physicians expect to see the greatest impact to their organizations in the following areas
Figure 16
Note: Physicians were asked to select the top two areas of greatest impact. Source: PwC Health Research Institute clinician survey, 2018
38%26%
26%
25%
22%
42%
8%
Improved patient experience
Decreased costs from increased care efficiency
Decreased readmissions to hospital
Decreased admissions to hospital
Decreased inpatient length of stay
Decreased post-acute care length of stay
Improved quality outcomes (e.g., increased drug adherence, disease management)

Medical cost trend: Behind the numbers 2019 PwC | 20
Deflator #3: The high-performance network
Employers are looking to high-performance networks after years of selling employees on HDHPs. Employees’ increased interest in plans other than HDHPs and their willingness to select a plan with a limited choice of doctors or hospitals make high-performance networks, which trade lower costs for a limited provider network, a deflator for 2019.
In a recent HRI survey, 64 percent of respondents with employer-based coverage who are enrolled in an HDHP said they would select a non-HDHP next year, even if it meant paying a higher premium.59 Forty-four percent of consumers with employer-based insurance surveyed by HRI said they would select a health plan with a limited choice of doctors or hospitals under certain circumstances, such as lower monthly premiums, lower deductibles and access to quality providers.60
Employers increasingly are implementing or considering performance-based networks created and maintained by a health plan or are contracting directly with providers or accountable care organizations (ACOs). Employers that say they have implemented a performance-based network increased by 267 percent since 2014, while those saying they have implemented direct contracting increased by 80 percent (see Figure 17). Consumers are interested. Of those 44 percent surveyed by HRI who are willing to limit their provider choice, nearly all said they would do so if the providers were high quality.
More employers have implemented high-performance networks compared with four years agoFigure 17
Source: PwC Touchstone Health and Well-being surveys, 2014 and 201861
Performance-based networks Direct contracting with providers or ACOs
20182014
Implemented
Considering
20182014
Implemented
Considering
Percent growth in implemented
+80%+267%Percent growth in implemented
9%
23%
21%
5%11%
3%
34%
34%

Medical cost trend: Behind the numbers 2019 PwC | 21
Blue Shield of California has seen early success with its ACO product, Trio HMO, and plans to grow its footprint in the California large group market from 200,000 members in 2018 to 700,000 by 2020.62 Part of Trio HMO’s success may be due to Blue Shield’s contracting with well-known providers, such as San Francisco-based Dignity Health.63
“Historically the narrow network has been a cost play,” said Amy Yao, senior vice president and chief actuary of Blue Shield of California, in an interview with HRI. “Employers are interested in bending the trend but also care about quality. Our ACO products are not narrow network products—they do not target the lowest-cost providers out of the gate. Instead, we focus on those providers who have the will and skill to care for patients in a way that bends the trend. There are early signs this is working; our ACO medical cost trend is coming in a couple of percentage points lower than our non-ACO trend.”
Many providers are positioning for high-performance networks. Sixty-three percent of provider executives surveyed by HRI in 2017 said they plan for their organization to be included in a narrow network plan in the next five years, and 59 percent said they will engage in direct-to-employer contracting in the next five years.64 Providers’ capacity to engage in high-performance networks should continue to expand as hospitals and health systems consolidate and physicians increasingly are employed by hospitals and health systems.
The Walt Disney Co., based in Burbank, Calif., pursued a direct contracting strategy with Orlando Health and Florida Hospital, launching two new high-performance network plans for Orlando, Fla.-based employees in January 2018.65
“Direct partnerships are a way to improve the customer experience,” said Barbara Wachsman, recently retired director of strategy and engagement, enterprise benefits at The Walt Disney Co. and former chair of the Pacific Business Group on Health, in an interview with HRI. “An important factor in the Disney deal was to improve the experience employees have with their providers. Additionally, being able to interact directly with the provider on behalf of employees is extremely valuable.”

Medical cost trend: Behind the numbers 2019 PwC | 22
Some of the largest deals include CVS Health proposing to buy Aetna for $69 billion and Cigna Corp. seeking to buy Express Scripts Holding Co. for $67 billion.66 Some companies that haven’t been involved in healthcare also are trying to enter the space. The joint venture of Amazon, JPMorgan Chase & Co. and Berkshire Hathaway Inc.—heavily covered by the media—is looking to reduce the three companies’ employee healthcare costs.67 In 2017, 967 deals were reported, representing a 146 percent increase in total deal value over 2016.68
A recent HRI report found four archetypes emerging in these deals: vertical integrators trying to own more of the supply chain, employers seeking to control their healthcare costs, technology companies seeking a foothold in healthcare, and retailers trying to gain market share by providing some healthcare services.69 Traditional health companies, new entrants and innovators are trying to vertically integrate, form partnerships, or otherwise enter or transform the healthcare sector.
“Previously, a good deal of venture capital was flowing into pharmaceuticals and medical devices,” said Opoku Archampong, actuarial director at Danville, Pa.-based Geisinger Health Plan, in an interview with HRI. “Today, increasingly more money is being invested in companies with machine learning and AI approaches aimed at reducing healthcare costs.”
These new entities want to combine forces for larger scale and bring in other industries’ experience to reduce healthcare spending growth. If successful, these new combinations could be powerful drivers toward a more integrated healthcare system and improved customer experience. Or they might garner enough negotiating power to control expenses but may drive up employers’ costs. These market movements signal change for middlemen entities such as pharmacy benefit managers, many of which are becoming integrated into larger entities. Outcomes remain to be seen, as some proposed deals haven’t yet been approved by regulators and others are in early stages.
Today, increasingly more money is being invested in companies with machine learning and AI approaches aimed at reducing healthcare costs.
—Opoku Archampong, actuarial director at Geisinger Health Plan
“”
The healthcare market has seen significant deal activity in the last year.
New combinations
Medical cost trend: Behind the numbers 2019 PwC | 23
Even with the capabilities and scale these new combinations may achieve, barriers to improving cost trend remain. Integration is difficult, and it could be several years before any efficiencies or other benefits become apparent. And though scale can help by increasing negotiating power, even the populations of large national employers are relatively small compared with private insurers and government purchasers such as Medicare and Medicaid, the latter two of which had 59 million and 72 million enrollees as of January 2018, respectively.70
“If the intent of these partnerships is to create another employer purchasing coalition, I can see the potential for incremental savings but not transformational change,” said Brian Marcotte, president and CEO of the National Business Group on Health, in an interview with HRI. “What is intriguing about the Amazon, Berkshire Hathaway and JPMorgan venture is the opportunity to leverage Amazon’s customer focus, tech savvy and consumer trust to transcend the challenges of the fragmented healthcare ecosystem to deliver a better consumer experience. Amazon is already in so many homes and is the “go to” site for online shopping; something that has become routine or natural for many consumers. One of the problems with healthcare is that consumers don’t touch the health system with enough frequency or routine to ever become sophisticated consumers. If you can integrate healthcare into the Amazon experience, you have a vehicle to engage consumers on an ongoing basis.”
Any meaningful changes to the existing healthcare system will take significant time and require capturing and integrating data, developing new capabilities and hiring new staff. So it’s too early to measure these potential healthcare system disruptors’ impact. They may have a deeper understanding of consumer experience and behavioral data than traditional healthcare companies do. The disruptors aim to bring best practices from other industries to create a more streamlined patient experience and better outcomes. Whether they also can achieve cost savings will depend first on their ability to successfully integrate, and then on whether they can effect lower prices.
One of the problems with healthcare is that consumers don’t touch the health system with enough frequency or routine to ever become sophisticated consumers. If you can integrate healthcare into the Amazon experience, you have a vehicle to engage consumers on an ongoing basis.
“
”—Brian Marcotte, president and CEO of the National Business Group on Health
Medical cost trend: Behind the numbers 2019 PwC | 24
What this means for your business
It’s the prices—so demonstrating value is critical
Healthcare providers, drug companies and payers should develop plans to address the ongoing and intensifying focus on prices from consumers, lawmakers and the media. This could mean developing more affordable options, embracing true price transparency or demonstrating the provided service’s value.
• Providers — Reimbursement and innovation are changing how and where care is delivered and expectations for value. To remain competitive, providers need to demonstrate value to patients by delivering consistent outcomes in the right care setting at a predictable price. They should show the cost savings associated with receiving care in a lower cost setting alongside the comparative benefits of receiving care in a more expensive setting. They should evaluate whether to build, acquire or partner to create retail, home and virtual care capabilities that offer easy access to different levels of care.
• Pharmaceutical and life sciences companies — Drug companies should not rely solely on outcomes data for optimal formulary placement and, ultimately, revenue. Quality of life data can influence decision-making regarding treatments that create value beyond the therapeutic benefit, such as the patient’s experience with a treatment. Services such as clinical decision-making tools that reduce waste in identifying the most likely effective treatment can be differentiators and revenue drivers. These value-added services, which also include companion diagnostics, can help patients get the best, most personalized treatment as early as possible.71
• Payers and employers — Employers should consider offering employees a value plan option with a limited network. This “value option” should emphasize cost savings and value by focusing on quality and customer satisfaction. Health insurers can position these plans to deliver value by giving consumers pricing transparency tools and negotiating value-based contracts such as outcomes-based payment or risk-sharing arrangements with providers and pharmaceutical and life science companies.72

Medical cost trend: Behind the numbers 2019 PwC | 25
Make room for advocates—consumers and employers want their own representation
Employers are adding health advocacy to health and wellness benefits to help their employees get the most out of their benefits. Health advocates help patients evaluate treatment options to make the best medically appropriate and financial decisions.
• Providers — Health advocates can coordinate care for patients across specialties and services. Their efforts may help providers achieve outcomes measures required by value-based contracting. It also may help them address the social determinants of health such as transportation issues and food insecurity by connecting patients to community resources.73 Health advocates also may serve as referral sources.
• Pharmaceutical and life sciences companies — Health advocates encourage patients to select the most cost-effective treatment options with the greatest proven outcomes and fewest side effects, something all consumer segments value highly, according to a recent HRI report on customer experience.74 As care advocates become more common, pharma companies may find demand for outcomes-based pricing, differentiated patient experiences and real-world evidence growing too. Health advocates’ growing influence also may place additional pressure on pricing if they steer patients to lower-cost but still highly effective options, such as generics and biosimilars.
• Payers and employers — Health plans and employers may use health advocates to enhance existing disease management and care management programs.75 Employees are often unaware of health advocacy offerings, so employers should consider investing in improved, targeted communications. This is especially true for employees with chronic conditions.

Medical cost trend: Behind the numbers 2019 PwC | 26
Consolidation is not enough—creating a better customer experience will be essential
The feeding frenzy of consolidation over the past decade has changed the healthcare landscape. Health systems are getting larger. But consolidating to protect and increase market share and negotiating power won’t guarantee success; understanding the consumer’s point of view is critical. Companies that are armed with knowledge about the populations they serve can target investments strategically.
• Providers — Health systems often increase prices after a merger. Providers should be prepared to justify the higher prices to the consumer by immediately demonstrating the additional value, perhaps through coordinating care better, making it easier to access or making some other quality improvements. After a merger, providers should make maintaining or improving customer experience a high priority when planning their integration.
• Pharmaceutical and life sciences companies — Provider consolidation changes the way pharmaceutical companies promote their products. It requires a different type of sales force and a shift in sales tactics. Instead of sending representatives to speak with individual doctors, they should send someone with a PharmD and MBA who is prepared to meet with the provider’s formulary committee to discuss clinical and financial considerations that go beyond the standard safety and efficacy information. Because they have fewer chances to speak directly with prescribers and influence health systems’ drug formularies—and because providers are shouldering more financial risk on treatment outcomes—some pharmaceutical companies are forming collaborations to demonstrate their drugs’ value.76
• Payers and employers — Payers and employers should focus on the fallout of provider consolidation and should proactively renegotiate contracts. This is especially true when hospitals and health systems acquire physician groups. After an acquisition, consumers may face surprising and steep price increases for the same services performed by the same provider in the same physical setting. Payers and employers can get ahead of this by negotiating rates that are only a slight increase above what they were before the acquisition. They also can consider contractually writing off facility charges billed for certain services performed in a hospital outpatient setting that can be performed in a physician’s office.
Medical cost trend: Behind the numbers 2019 PwC | 27
Notes
1 Shawn Sprague, “Below trend: the U.S. productivity slowdown since the Great Recession,” U.S. Bureau of Labor Statistics, January 2017, https://www.bls.gov/opub/btn/volume-6/pdf/below-trend-the-us-productivity-slowdown-since-the-great-recession.pdf
2 Kaiser Family Foundation, “2017 Employer Health Benefits Survey,” Sept. 19, 2017, https://www.kff.org/report-section/ehbs-2017-summary-of-findings/
3 PwC Health Research Institute medical cost trends 2007-2019
4 Congressional Budget Office, “Federal subsidies for health insurance coverage for people under age 65: 2016 to 2026,” March 2016, https://www.cbo.gov/sites/default/files/114th-congress-2015-2016/reports/51385-healthinsurancebaselineonecol.pdf
5 PwC Health Research Institute revised its estimates for 2017 and 2018 down 0.5 percentage points each from 6 and 6.5 percent, respectively, in the “Medical cost trend: Behind the numbers 2018” report. This revision was based on health plan interviews conducted by HRI that indicated medical cost trend will likely be lower in these two years than HRI projected.
6 PwC Health Research Institute analysis of national health expenditure data from CMS
7 PwC Health Research Institute used Bureau of Labor Statistics consumer price index data to adjust the national health expenditure data and private health insurance spending data for inflation.
8 Centers for Medicare & Medicaid Services, The Center for Consumer Information & Insurance Oversight, “Medical Loss Ratio: Getting Your Money’s Worth on Health Insurance,” Dec. 2, 2011, https://www.cms.gov/CCIIO/Resources/Fact-Sheets-and-FAQs/mlrfinalrule.html
9 Altarum Center for Value in Health Care, “Health Sector Economic Indicators, Insights from Monthly National Indices through December 2018, Price Brief,” Exhibit 5, Feb. 12, 2018, https://altarum.org/sites/default/files/uploaded-related-files/SHSS-Price-Brief_February_2018_0.pdf
10 Centers for Medicare and Medicaid Services, “CMS Office of the Actuary releases 2017-2026 Projections of National Health Expenditures,” Feb. 14, 2018, https://www.cms.gov/Newsroom/MediaReleaseDatabase/Press-releases/2018-Press-releases-items/2018-02-14.html
11 The average of each time period is presented in the graphic. Total wages include hourly and salary pay and employee benefits. Also, the most recently available projections for national health expenditures and employer health spending published by CMS in February 2018 and used in this figure didn’t incorporate the effects of the Tax Cuts and Jobs Act passed on Dec. 22, 2017.
12 PwC Health Research Institute interview with CMS Office of the Actuary on Feb. 27, 2018
13 Congressional Budget Office, “The Budget and Economic Outlook: 2018 to 2028,” April 9, 2018, https://www.cbo.gov/publication/53651. The projections of disposable personal income used in this figure do incorporate the effects of the Tax Cuts and Jobs Act passed on Dec. 22, 2017.
14 FDA, “Statement from FDA Commissioner Scott Gottlieb, M.D. on new steps to facilitate efficient generic drug review to enhance competition, promote access and lower drug prices,” Jan. 3, 2018, https://www.fda.gov/NewsEvents/Newsroom/PressAnnouncements/ucm591184.htm
15 IBISWorld, “IBISWorld Industry Report OD5458: Urgent Care Centers in the US,” February 2017
16 PwC Health Research Institute, “Customer Experience in the New Health Economy: The data cure,” February 2018, https://www.pwc.com/us/en/health-industries/health-research-institute/customer-experience.html
17 PwC Health Research Institute analysis of PwC Health and Well-being Touchstone Survey for 2018
18 Biometric screening was redefined in 2017, data above reflect recalculated numbers for 2014 and 2016 based on the new definition.
19 PwC Health Research Institute analysis of PwC Health and Well-being Touchstone survey for 2014 and 2018
20 PwC Health Research Institute consumer survey, winter 2018

Medical cost trend: Behind the numbers 2019 PwC | 28
21 The MedPAC Herfindahl-Hirschman Index (HHI) analysis looked at metropolitan statistical areas (MSAs) with populations of less than 3 million as of the 1990 census. The report says it doesn’t look at MSAs with more than 3 million people because those areas likely have multiple hospital markets whose HHI would likely be mismeasured. Three hundred thirty-eight out of 355 MSAs had populations under 3 million in 1990, according to that year’s U.S. Census, https://www.census.gov/population/censusdata/90den_ma.txt
22 PwC Health Research Institute analysis of the Herfindahl-Hirschman Index for hospital markets with a score of greater than 2,500 from the Medicare Payment Advisory Commission, “Report to the Congress: Medicare and the Health Care Delivery System, Chapter 10: Provider consolidation: The role of Medicare policy,” June 2017, http://www.medpac.gov/docs/default-source/reports/jun17_ch10.pdf?sfvrsn=0. Note that the MedPAC report included three data points for market concentration as follows: 1990 (65%), 2006 (77%) and 2012 (84%). HRI projected 2019 by calculating the compound annual growth rate for the three MedPAC provided data points and projecting it forward.
23 Kaufman Hall, “2017 in Review: The Year M&A Shook the Healthcare Landscape,” 2018, https://www.kaufmanhall.com/sites/default/files/2017-in-Review_The-Year-that-Shook-Healthcare.pdf. Note that merger discussions have ceased for one of the deals (Carolinas HealthCare System and UNC Health Care).
24 Ibid.
25 Advocate Aurora Health, “Advocate Aurora Health to Become Top-10 Health System,” March 22, 2018, https://www.advocateaurorahealth.org/news-center/top-10-health-system
26 Aurora Health Care, “Unaudited Consolidated Financial Statements and Other Information For the Year Ended December 31, 2016,” May 19, 2017, https://www.aurorahealthcare.org/-/media/aurorahealthcareorg/documents/annual-report/2016-annual-financial-information-and-operating-data.pdf?la=en&hash=4593BF27C11F17D10ADDD6216EDFC532E7B9F78D
27 Presence Health, “Presence Health, Ascension Reach Agreement for Presence to Join Amita Health,” Feb. 15, 2018, http://www.presencehealth.org/body.cfm?id=1985&action=detail&ref=93
28 Ascension, “Sites of Care,” https://ascension.org/Our-Work/Healthcare/Sites-of-Care
29 Ascension, “Consolidated Ascension Financial Statements (Q4, 2017),” Sept. 22, 2017, https://ascension.org/About/Community-and-Investor-Relations
30 Ascension, “Facts and Stats,” April 2018, https://ascension.org/About/Facts-and-Stats
31 Ascension, “Contact Information,” https://ascension.org/About/Contact-Information
32 Ascension, “Presence Health is now part of Ascension and AMITA Health,” March 2, 2018, https://ascension.org/News/News-Articles/2018/03/02/16/42/Presence-Health-is-now-part-of-Ascension-and-AMITA-Health
33 Dignity Health, “Dignity Health and Catholic Health Initiatives to Combine to Form New Catholic Health System Focused on Creating Healthier Communities,” Dec. 7, 2017, https://www.dignityhealth.org/about-us/press-center/press-releases/dignity-health-and-catholic-health-initiatives-announcement
34 Dignity Health, “United States Hospitals, Clinics & Care Centers,” https://locations.dignityhealth.org/
35 Dun & Bradstreet Inc., “Company Profile,” Accessed June 1, 2018, http://www.hoovers.com/company-information/cs/company-profile.dignity_health.07c9a61459ce6023.html
36 Catholic Health Initiatives, “2017 CHI Annual Report,” June 30, 2017, http://viewer.e-digitaledition.com/i/915390-annual-report-2017/0?
37 Catholic Health Initiatives, “CHI St. Luke’s Health, Baylor College of Medicine (BCM) & Texas Heart Institute (THI) Collaboration: About the Organizations,” June 11, 2013, https://www.catholichealthinitiatives.org/en/media/news/chi-st-lukes-health-baylor-college-medicine-texas-heart-institute-collaboration.html
38 Beth Israel Deaconess System, “About BIDMC,” 2018, https://www.bidmc.org/about-bidmc/beth-israel-deaconess-system
39 Lahey Health, “Our Locations,” 2017, http://www.laheyhealth.org/what-we-offer/our-locations

Medical cost trend: Behind the numbers 2019 PwC | 29
40 New England Baptist Hospital, “Locations and Directions,” 2018, https://www.nebh.org/becoming-a-patient/locations-and-directions/
41 Mount Auburn Hospital, “Locations,” 2018, https://www.mountauburnhospital.org/locations/
42 Anna Jaques Hospital, “Directions and Parking,” https://www.ajh.org/patients-and-visitors/directions-parking
43 Priyanka Dayal McCluskey, “State health officials endorse Beth Israel-Lahey merger,” Boston Globe, March 6, 2018, https://www.bostonglobe.com/business/2018/03/06/state-health-officials-endorse-beth-israel-lahey-merger/4EI2WzpvLliGiy4keBBJLM/story.html
44 Greenville Health System, “Fast Facts,” 2018, https://www.ghs.org/newsroom/annual-report/2016-annual-report/fast-facts/
45 Palmetto Health, “Fiscal Year 2017 Statistical Profile,” Sept. 30, 2017, https://www.palmettohealth.org/document-library/documents/2017-statistical-profile
46 Palmetto Health, “Greenville Health System and Palmetto Health finalize partnership to form new health company,” Nov. 21, 2017, https://www.palmettohealth.org/patients-guests/news/greenville-health-system-and-palmetto-health
47 PwC Health Research Institute provider executive survey, 2017
48 Merritt Hawkins, “2016 Survey of America’s Physicians: Practice Patterns and Perspectives,” September 2016, https://www.merritthawkins.com/uploadedFiles/Physicians%20Foundation%202016%20Survey%20of%20Americas%20Physicians.pdf
49 Abe Dunn and Adam Hale Shapiro, “Do Physicians Possess Market Power?” The Journal of Law and Economics 2014, 57:1, 159-193
50 Ibid.
51 Medicare Payment Advisory Committee, “Report to the Congress: Medicare Payment Policy,” March 2018, http://www.medpac.gov/docs/default-source/reports/mar18_medpac_entirereport_sec_rev_0518.pdf?sfvrsn=0
52 Merritt Hawkins, “2016 Survey of America’s Physicians: Practice Patterns and Perspectives,” September 2016, https://www.merritthawkins.com/uploadedFiles/Physicians%20Foundation%202016%20Survey%20of%20Americas%20Physicians.pdf
53 Physicians Advocacy Institute, “Updated Physician Practice Acquisition Study: National and Regional Changes in Physician Employment 2012-2016,” March 2018, http://www.physiciansadvocacyinstitute.org/Portals/0/assets/docs/2016-PAI-Physician-Employment-Study-Final.pdf?ver=2018-03-14-082640-777
54 PwC Health Research Institute clinician survey, 2018, and PwC Health Research Institute interview with Travis Singleton, executive vice president, Merritt Hawkins, an AMN Healthcare company, on April 10, 2018
55 PwC Health Research Institute analysis of About Underlying Cause of Death, 1999-2016, from Centers for Disease Control and Prevention, https://wonder.cdc.gov/ucd-icd10.html; Inpatient and Emergency Department Expenditures from Healthcare Cost and Utilization Project, https://www.hcup-us.ahrq.gov/; and Total Medical Expenditures from Medical Expenditure Panel Survey, https://meps.ahrq.gov. PwC created a regression analysis using flu-related mortality rates as the independent variable to project spending on flu as a percentage of total medical expenditures for years where spending data were not available (2015 and beyond). Data are by calendar year rather than flu season based on how data are reported by Medical Expenditure Panel Survey. Weekly data from Centers for Disease Control and Prevention were aggregated by calendar year for purposes of this analysis. PwC Health Research Institute’s analysis found that health spending related to the flu is increasing over time independent of the flu mortality rates in each year. This upward drift in spending on the flu may be due to better identification and reporting of flu cases or more aggressive treatment of flu. The forecast of flu spending as a percentage of total healthcare spending presented in this report takes this factor into account as well as the flu mortality rates.
56 Health Care Services Corp., “Health Care Services Corporation Introduces Member Rewards to Encourage Consumer Engagement with Health Care Decisions,” Dec. 12, 2016, http://www.hcsc.com/news_article?lid=izmmt7wi

Medical cost trend: Behind the numbers 2019 PwC | 30
57 Interview with Samantha Steinwinder, vice president, corporate marketing; Rob Cavanaugh, president; and Carolyn Young, chief actuary, Accolade Health, on April 16, 2018
58 Ibid.
59 PwC Health Research Institute consumer survey, winter 2018
60 Ibid.
61 Performance-based networks are those in which providers are rewarded based on improvement in members’ health rather than the volume of services provided. Direct contracting with providers is a mechanism for creating a performance-based network.
62 PwC Health Research Institute Interview with Amy Yao, chief actuary of Blue Cross Blue Shield of California, on March 1, 2018
63 Blue Shield of California, “Trio HMO: Network and Service Area,” Accessed May 9, 2018, https://www.blueshieldca.com/sites/aco/network-service-area/home.sp
64 PwC Health Research Institute provider executive survey, 2017
65 Naseem S. Miller, “Disney partnering with Orlando Health, Florida Hospital to offer HMO plans,” Orlando Sentinel, Feb. 2, 2018, http://www.orlandosentinel.com/health/os-disney-oh-fh-insurance-20180202-story.html
66 PwC Health Research Institute, “The New Health Economy in the age of disruption: Novel combinations attempt to remake the health system,” April 2018, https://www.pwc.com/us/en/health-industries/health-research-institute/new-health-combinations.html
67 Nick Wingfield, Katie Thomas, Reed Abelson, “Amazon, Berkshire Hathaway and JPMorgan Team Up to Try to Disrupt Health Care,” New York Times, Jan. 30, 2018, https://www.nytimes.com/2018/01/30/technology/amazon-berkshire-hathaway-jpmorgan-health-care.html
68 PwC Deals: US Health Services Deals Insights Year-end 2017, https://www.pwc.com/us/en/health-industries/publications/pdf/pwc-health-services-deals-insights-year-end-2017.pdf
69 PwC Health Research Institute, “The New Health Economy in the age of disruption: Novel combinations attempt to remake the health system,” April 2018, https://www.pwc.com/us/en/health-industries/health-research-institute/new-health-combinations.html
70 Centers for Medicare and Medicaid Services, CMS Fast Facts, January 2018, https://www.cms.gov/fastfacts/
71 PwC Health Research Institute, “Customer Experience in the New Health Economy: The data cure,” February 2018, https://www.pwc.com/us/en/health-industries/health-research-institute/customer-experience.html
72 PwC Health Research Institute, “Launching into value: Pharma’s quest to align drug prices with outcomes,” September 2017, https://www.pwc.com/us/en/health-industries/health-research-institute/publications/value-based-drug-pricing.html
73 PwC Health Research Institute, “Top health industry issues of 2018: A year of resilience amid uncertainty,” December 2017, https://www.pwc.com/us/en/health-industries/top-health-industry-issues.html
74 PwC Health Research Institute, “Customer experience in the New Health Economy: The data cure,” February 2018, https://www.pwc.com/us/en/health-industries/health-research-institute/customer-experience.html
75 PwC Health Research Institute, “Health insurer of the future: Consumers’ advocate, providers’ partner,” March 2017, https://www.pwc.com/us/en/health-industries/health-research-institute/publications/health-insurer-of-the-future.html
76 PwC Health Research Institute, “Making collaborations work: Pharma companies invest in new relationships with health systems,” November 2016, https://www.pwc.com/us/en/health-industries/health-research-institute/publications/making-collaborations-work.html

Medical cost trend: Behind the numbers 2019 PwC | 31
About this research
Each year, PwC’s Health Research Institute (HRI) projects the growth of private medical costs in the coming year and identifies the leading trend drivers. Health insurance companies use medical cost trend to help set premiums by estimating what the same health plan this year will cost next year. In turn, employers use the information to make adjustments in benefit plan design to help offset cost increases. The report identifies and explains what it refers to as “inflators” and “deflators” to describe why and how the healthcare spending growth rate is affected.
This forward-looking report is based on the best available information through May 2018. HRI conducted interviews in February, March and April 2018 with 16 health plan executives (whose companies cover more than 130 million people) about their estimates for 2019 and the factors driving those trends.
Also included are findings from PwC’s 2018 Health and Well-being Touchstone survey of more than 900 employers from 37 industries, PwC’s national consumer survey of more than 1,500 US adults and PwC’s national clinician survey of 1,000 clinicians (physicians, physician assistants and nurse practitioners). HRI also examined government data sources, journal articles and conference proceedings in determining the 2019 growth rate.
Behind the Numbers 2019 is HRI’s thirteenth report in this series.
About the PwC Health Research Institute
PwC’s HRI provides new intelligence, perspectives and analysis on trends affecting all health-related industries. HRI helps executive decision-makers navigate change through primary research and collaborative exchange. Our views are shaped by a network of professionals with executive and day-to-day experience in the health industry. HRI research is independent and not sponsored by businesses, government or other institutions.
About the PwC network
At PwC, our purpose is to build trust in society and solve important problems. We’re a network of firms in 158 countries with more than 236,000 people who are committed to delivering quality in assurance, advisory and tax services. Find out more and tell us what matters to you by visiting us at www.pwc.com.
Medical cost trend: Behind the numbers 2019 PwC | 32
Acknowledgments
Opoku Archampong Actuarial Director Geisinger Health Plan
Carl Bailey Vice President and Chief Actuary Florida Blue
Dave Berry Vice President, Actuarial Services Highmark Health
Niall Brennan President and CEO Health Care Cost Institute
Sam Calabrese Actuarial Analyst Geisinger Health Plan
William Cashion Senior Vice President and Chief Actuary Highmark Health
Rob Cavanaugh President Accolade Health
Gigi Cuckler Economist, National Health Statistics Group Office of the Actuary Centers for Medicare and Medicaid Services
Mick Diede Chief Actuary Kaiser Foundation Health Plan
Paul Fronstin Director, Health Research and Education Program Employee Benefit Research Institute
Thomas Getzen Former Executive Director International Health Economics Association
Sherry Glied Dean, Wagner Graduate School of Public Service NYU
Mary R. Grealy President Healthcare Leadership Council
Kevin Grozio Senior Vice President and CFO Fallon Community Health Plan
Jim Hall Department Vice President and Actuary Health Care Services Corp.
Kris Hall Director, Healthcare Trend Analysis and Forecasting Excellus BlueCross BlueShield
Mike Hartjes Vice President, Actuarial and Analytic Services Humana
Andrea Hess Actuarial Director Geisinger Health Plan
Paul Hughes-Cromwick Co-director, Sustainable Health Spending Strategies Altarum Institute
Sean Keehan Economist, National Health Statistics Group Office of the Actuary Centers for Medicare and Medicaid Services
Justin Knight Vice President and Chief Actuary Medical Mutual of Ohio
Jim Kohan Senior Vice President and Chief Actuary Excellus BlueCross BlueShield
David Lansky President and CEO Pacific Business Group on Health
Rhonda Lessard Vice President, Medical Economics Aetna
Doug Lynch Senior Vice President and Chief Actuary Health Care Services Corp.

Medical cost trend: Behind the numbers 2019 PwC | 33
Sarah MacDerment Actuarial Director Geisinger Health Plan
Brian Mackintosh Chief Actuary Neighborhood Health Plan
Greg Malone Actuarial Senior Director Cigna
Brian Marcotte President and CEO National Business Group on Health
Dr. Phil Mitchell Medical Director DispatchHealth
Gregg Nevola Vice President, Total Rewards Northwell Health
Vanessa Olson Senior Vice President and Chief Actuary Humana
John Poisal Deputy Director, National Health Statistics Group Office of the Actuary Centers for Medicare and Medicaid Services
Dan Rachfalski Senior Vice President and Chief Actuary Harvard Pilgrim Health Care
Brian Renshaw Vice President and CFO of Clinical Solutions Anthem
Everard Riley Associate Actuary Geisinger Health Plan
Charles Roehrig Founding Director, Center for Sustainable Health Spending, Institute Fellow Altarum Institute
Bill Sarniak Vice President and Chief Actuary Highmark Inc.
Travis Singleton Executive Vice President Merritt Hawkins, an AMN Healthcare company
Andrea Sisko Economist, National Health Statistics Group Office of the Actuary Centers for Medicare and Medicaid Services
John Sivori President and Chief Operating Officer Envolve Pharmacy Solutions
Samantha Steinwinder Vice President, Corporate Marketing Accolade Health
John Stenson Vice President, Actuarial, Underwriting, and Medical Economics Aetna
Michael Thompson President and CEO National Alliance of Healthcare Purchaser Coalitions
Ani Turner Co-director, Sustainable Health Spending Strategies Altarum Institute
Cori Uccello Senior Health Fellow American Academy of Actuaries
Barbara Wachsman Former Chair Pacific Business Group on Health
Micah Weinberg President Bay Area Council Economic Institute
Christian Wolfe Actuary Medicare and Medicaid Cost Estimates Group Office of the Actuary Centers for Medicare and Medicaid Services
Amy Yao Senior Vice President and Chief Actuary Blue Shield of California
Carolyn Young Chief Actuary Accolade Health

Medical cost trend: Behind the numbers 2019 PwC | 34
Kelly Barnes Partner US Health Industries and Global Health Industries Consulting Leader [email protected]
Benjamin Isgur Health Research Institute Leader [email protected]
Sarah Haflett Director [email protected]
Trine Tsouderos Director [email protected]
Benjamin Comer Senior Manager [email protected]
Alexander Gaffney Senior Manager [email protected]
Jason Ranville Senior Manager [email protected]
Ingrid Stiver Senior Manager [email protected]
Elyse Keating Research Analyst [email protected]
Dee Dee Xia Research Analyst [email protected]
PwC Health Research Institute

Medical cost trend: Behind the numbers 2019 PwC | 35
Advisory team
Additional contributors
Joe Badalamenti Partner [email protected]
Igor Belokrinitsky Principal [email protected]
Peter Claude Partner [email protected]
Dr. Kulleni Gebreyes Principal [email protected]
Barbara Gniewek Principal [email protected]
Rick Judy Principal [email protected]
Jinn-Feng Lin Principal [email protected]
James McNeil Principal [email protected]
Mark St George Principal [email protected]
Paul Veronneau Principal [email protected]
Amy Bergner
Francis Cizmar
Laura Dally
Colleen Donato
Jeffrey Dreiblatt
Karen LaChiana
Eric Michaels
Jamie Mumford
Parwen Parhat
Jack Rodgers
Hindy Shaman
John Stell
Christopher Tepler
Penny Timmerman
Nicole Ulrick
Victoria Waranauckas

Kelly Barnes Partner, US Health Industries and Global Health Industries Consulting Leader [email protected] 214 754 5172
Rick Judy Principal [email protected] 415 498 5218
Benjamin Isgur Health Research Institute Leader [email protected] 214 754 5091
© 2018 PwC. All rights reserved. PwC refers to the US member firm or one of its subsidiaries or affiliates, and may sometimes refer to the PwC network. Each member firm is a separate legal entity. Please see www.pwc.com/structure for further details. This content is for general information purposes only, and should not be used as a substitute for consultation with professional advisors. 444453-2018
To have deeper conversations about how this subject may affect your business, please contact:
www.pwc.com/us/medicalcosttrends www.pwc.com/us/healthindustries www.pwc.com/hri twitter.com/PwCHealth