Embed Size (px)
Citation preview
Medical and Societal Impacts Medical and Societal Impacts of Obesity and Overweight of Obesity and Overweight
November 3November 3rdrd 20032003
Ihsan Azzam, MD, MPH Ihsan Azzam, MD, MPH Bureau of Community Health Bureau of Community Health Nevada State Health DivisionNevada State Health Division
EXHIBIT _F___ Committee Name OBESITY Document consists of 14 pages.
Entire document provided.1 Due to size limitations, pages ________________ provided. A copy of the complete document is available through the Research Library (775/684-6827) or e-mail [email protected]).
Meeting Date__11-03-03________________
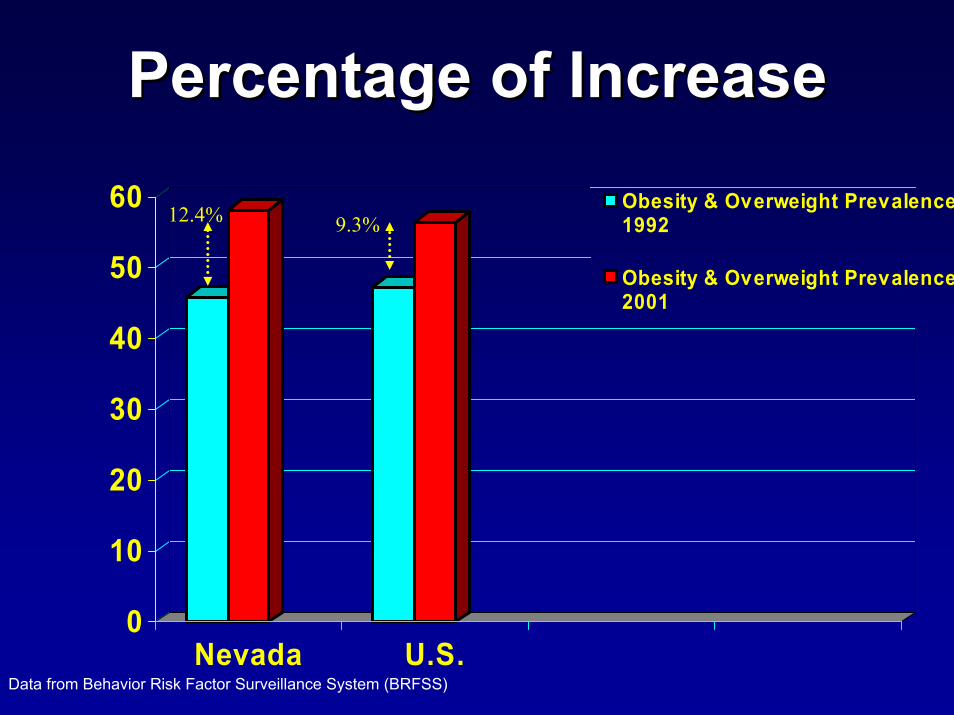
Percentage of Increase Percentage of Increase
0
10
20
30
40
50
60
Nevada U.S.
Obesity & Overweight Prevalence1992
Obesity & Overweight Prevalence2001
12.4% 9.3%
Data from Behavior Risk Factor Surveillance System (BRFSS)
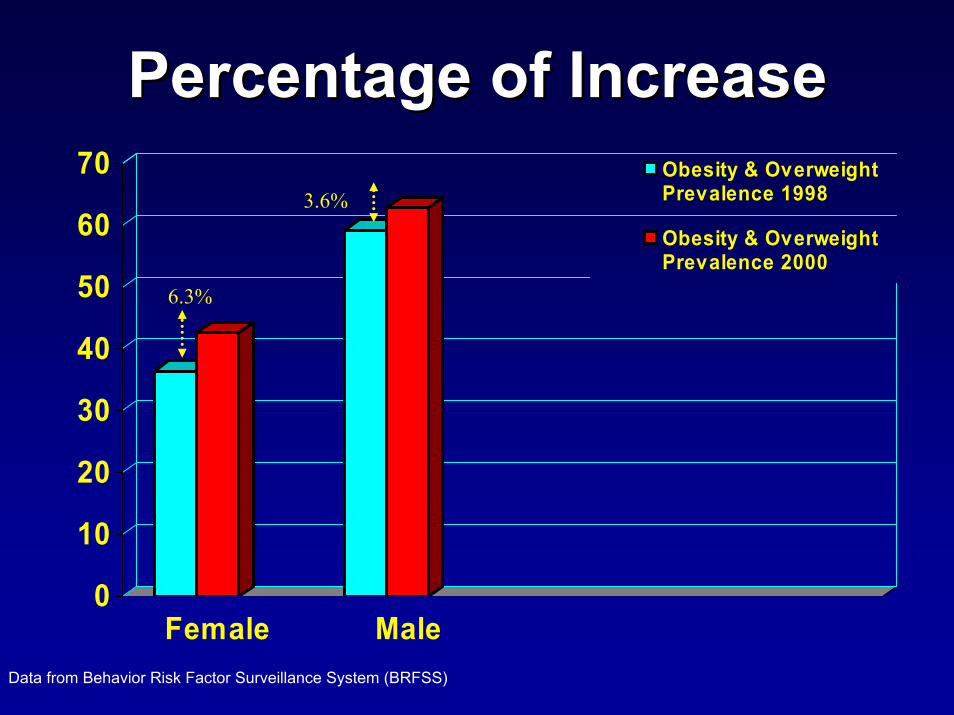
Percentage of Increase Percentage of Increase
0
10
20
30
40
50
60
70
Female Male
Obesity & OverweightPrevalence 1998
Obesity & OverweightPrevalence 2000
6.3%
3.6%
Data from Behavior Risk Factor Surveillance System (BRFSS)
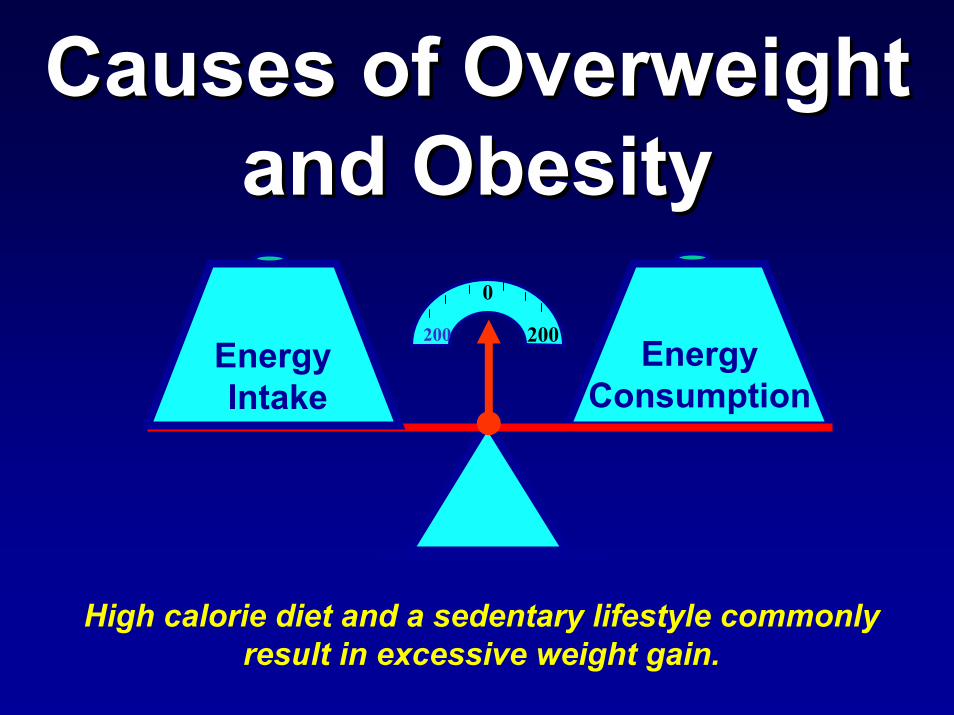
Causes of Overweight Causes of Overweight and Obesityand Obesity
Energy Consumption
200 200
0
Energy Intake
High calorie diet and a sedentary lifestyle commonly result in excessive weight gain.
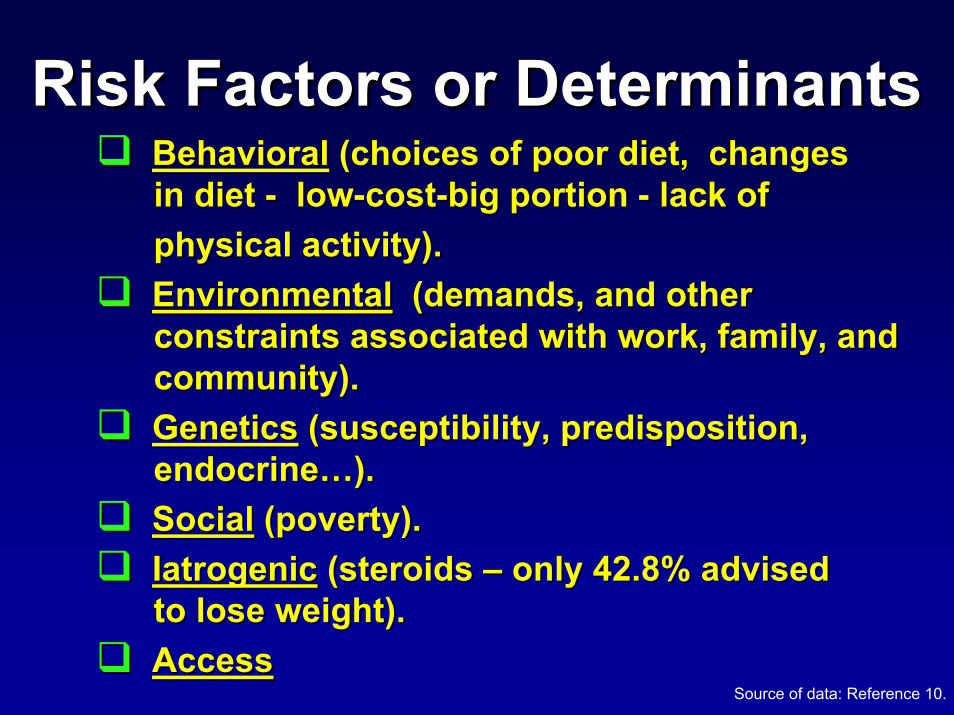
BehavioralBehavioral (choices of poor diet, changes (choices of poor diet, changes in diet in diet -- lowlow--costcost--big portion big portion -- lack of lack of physical activity).physical activity).EnvironmentalEnvironmental ((demands, and other demands, and other constraints associated with work, family, and constraints associated with work, family, and community).community).GeneticsGenetics (susceptibility, predisposition, (susceptibility, predisposition, endocrineendocrine……).).SocialSocial (poverty). (poverty). IatrogenicIatrogenic (steroids (steroids –– only 42.8% advised only 42.8% advised to lose weight).to lose weight).Access
Risk Factors or DeterminantsRisk Factors or Determinants
AccessSource of data: Reference 10.
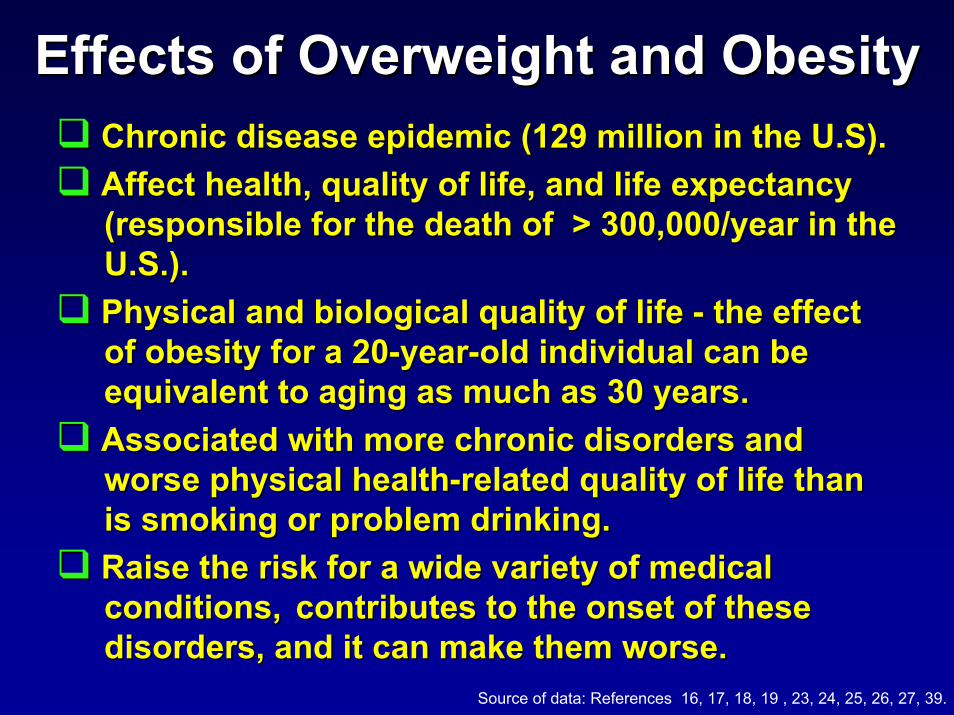
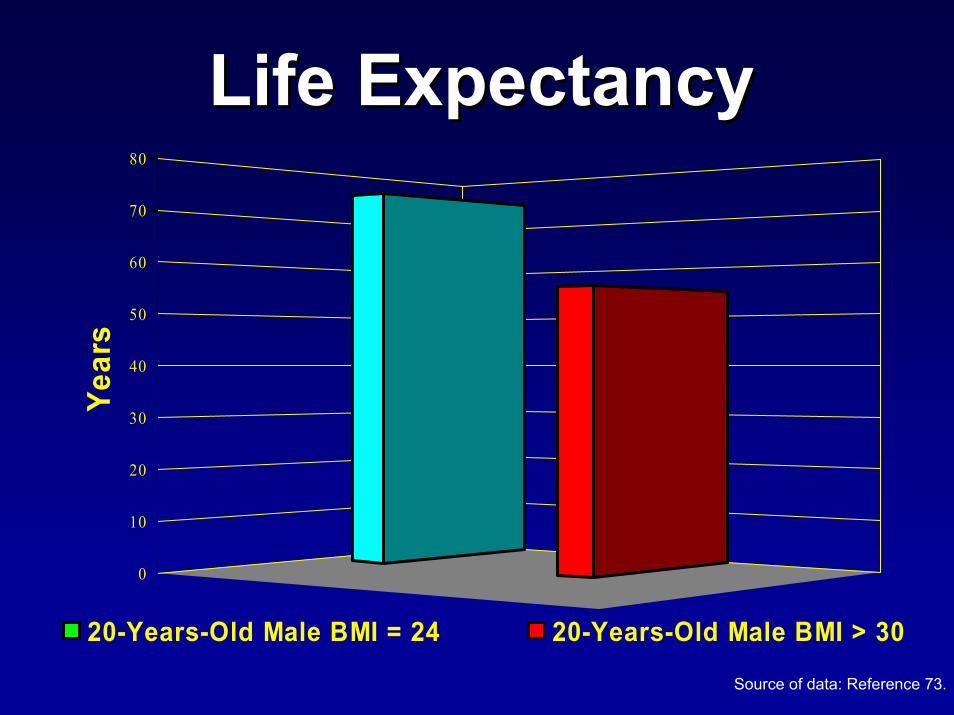
Effects of Overweight and ObesityEffects of Overweight and ObesityChronic disease epidemic (129 million in the U.S).Chronic disease epidemic (129 million in the U.S).Affect health, quality of life, and life expectancyAffect health, quality of life, and life expectancy(responsible for the death of > 300,000/year in the (responsible for the death of > 300,000/year in the U.S.).U.S.).Physical and biological quality of life Physical and biological quality of life -- the effect the effect of obesity for a 20of obesity for a 20--yearyear--old individual can be old individual can be equivalent to aging as much as 30 years.equivalent to aging as much as 30 years.Associated with more chronic disorders and Associated with more chronic disorders and worse physical healthworse physical health--related quality of life than related quality of life than is smoking or problem drinking.is smoking or problem drinking.Raise the risk for a wide variety of medical Raise the risk for a wide variety of medical conditions, conditions, contributes to the onset of these contributes to the onset of these disorders, and it can make them worse.disorders, and it can make them worse.
Source of data: References 16, 17, 18, 19 , 23, 24, 25, 26, 27, 39.
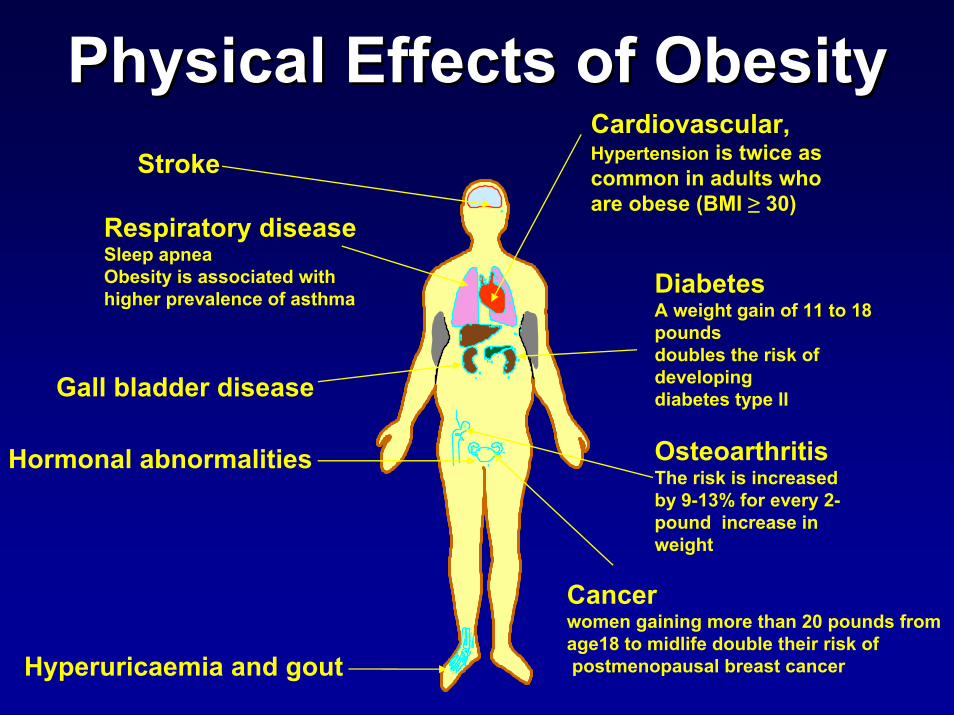
PhysicalPhysical Effects of ObesityEffects of ObesityCardiovascular, Hypertension is twice as common in adults who are obese (BMI ≥ 30)
Respiratory diseaseSleep apneaObesity is associated with higher prevalence of asthma
Hyperuricaemia and gout
Stroke
Diabetes A weight gain of 11 to 18 pounds doubles the risk of developing diabetes type II
Osteoarthritis The risk is increased by 9-13% for every 2-pound increase in weight
Cancer women gaining more than 20 pounds from age18 to midlife double their risk ofpostmenopausal breast cancer
Gall bladder disease
Hormonal abnormalities
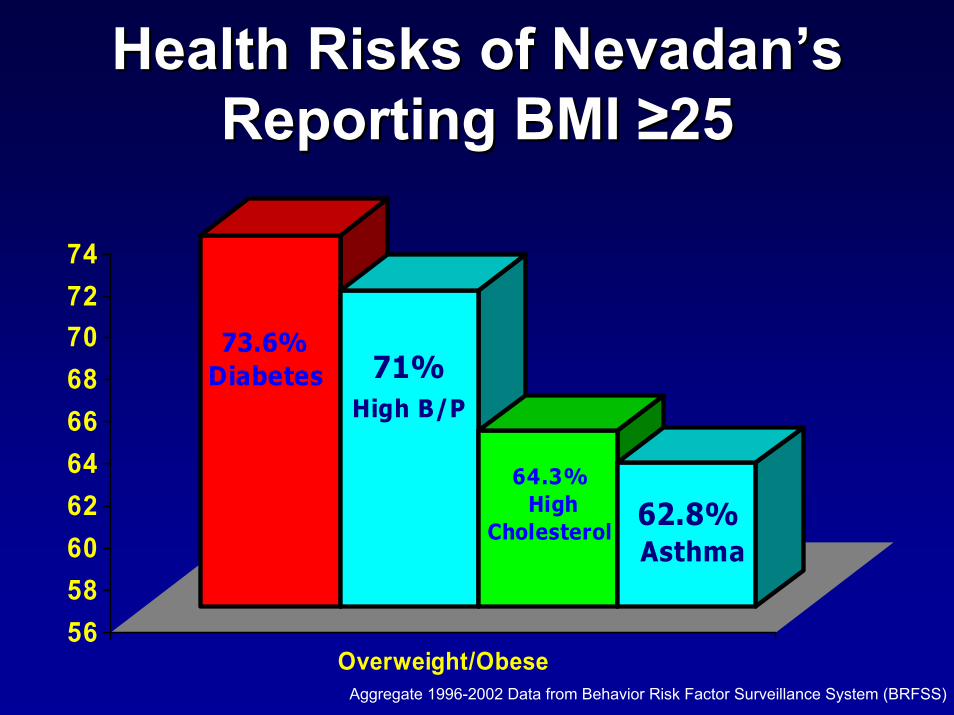
Health Risks of Nevadan’s Health Risks of Nevadan’s Reporting Reporting BMI BMI ≥25≥25
73.6%Diabetes 71%
High B/P
64.3% High
Cholesterol62.8%Asthma
56586062646668707274
Overweight/ObeseAggregate 1996-2002 Data from Behavior Risk Factor Surveillance System (BRFSS)
0
10
20
30
40
50
60
70
80
Year
s
20-Years-Old Male BMI = 24 20-Years-Old Male BMI > 30
Life Expectancy Life Expectancy
Source of data: Reference 73.
To Assess and Estimate the Fiscal To Assess and Estimate the Fiscal Impact of Obesity We Conducted: Impact of Obesity We Conducted:
An extensive search of published literature. An extensive search of published literature. Consultations with experts from CDC, the Consultations with experts from CDC, the Council of Chronic Disease Directors (CDD) Council of Chronic Disease Directors (CDD) and the Council for State and Territorial Chronic and the Council for State and Territorial Chronic Disease Epidemiologist (STCDE).Disease Epidemiologist (STCDE).Extensive data collection.Extensive data collection.Appraisal of the quality evidence in terms of Appraisal of the quality evidence in terms of relevance.relevance.In total, nearly 104 papers have been In total, nearly 104 papers have been reviewed.reviewed.
Levels of evidenceLevels of evidenceThis is a “review of reviews” and This is a “review of reviews” and not a systematic assessment of not a systematic assessment of complete data sets.complete data sets.The following work is based on The following work is based on systematic reviews, meta analyses systematic reviews, meta analyses and syntheses.and syntheses.Where there were no systematic Where there were no systematic reviews for a particular area, wereviews for a particular area, weused high quality literature reviews. used high quality literature reviews.
Estimates differed according to:Estimates differed according to:ScopeScope
An individual personAn individual person
A particular company or health planA particular company or health plan
The Nation as a wholeThe Nation as a whole
Timeliness of the dataTimeliness of the data
Methods used to derive the estimatesMethods used to derive the estimatesHow obesity is definedHow obesity is defined
How the prevalence of obesity is determinedHow the prevalence of obesity is determined
What associated disorders are includedWhat associated disorders are included
The degree to which these disorders and obesity are The degree to which these disorders and obesity are
considered to be associatedconsidered to be associated
How costs are defined, and the assumptions used in How costs are defined, and the assumptions used in
calculatingcalculating
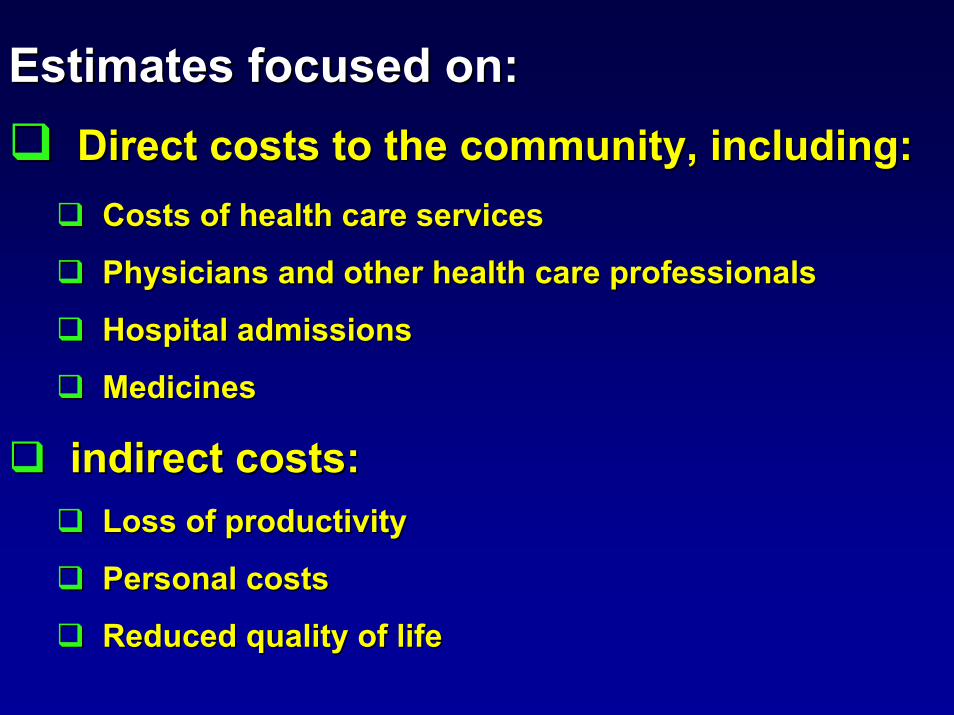
Estimates focused on: Estimates focused on: Direct costs to the community, including:Direct costs to the community, including:
Costs of health care servicesCosts of health care services
Physicians and other health care professionals Physicians and other health care professionals
Hospital admissionsHospital admissions
MedicinesMedicines
indirect costs:indirect costs:Loss of productivity Loss of productivity
Personal costsPersonal costs
Reduced quality of lifeReduced quality of life
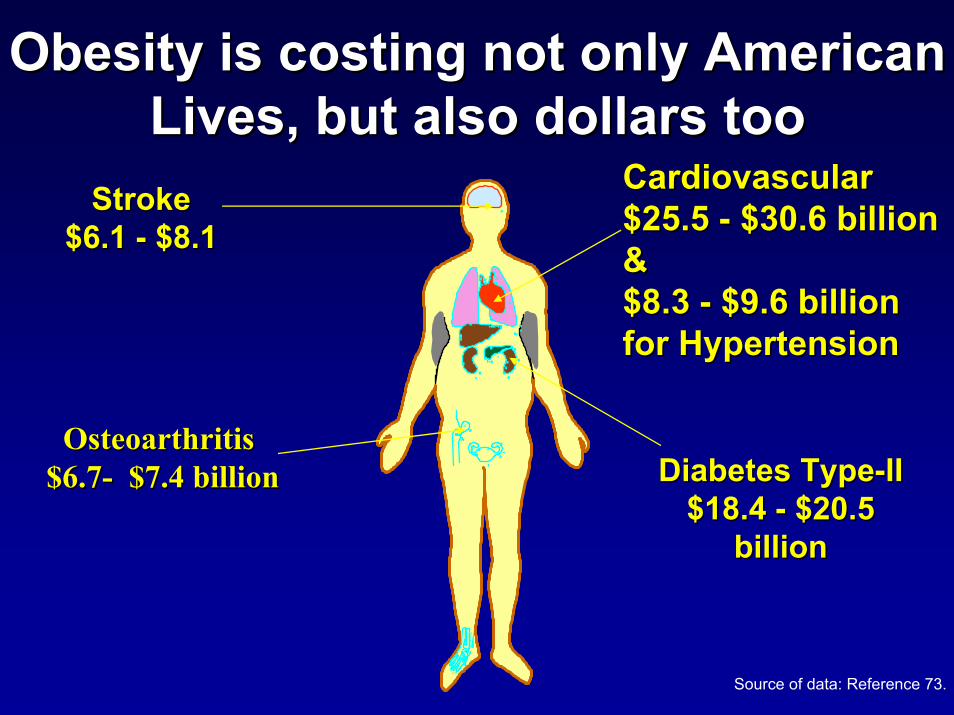
Obesity is costing not only American Obesity is costing not only American Lives, but also dollars tooLives, but also dollars too
Cardiovascular Cardiovascular $25.5 $25.5 -- $30.6 billion $30.6 billion & & $8.3 $8.3 -- $9.6 billion $9.6 billion for Hypertensionfor Hypertension
StrokeStroke$6.1 $6.1 -- $8.1 $8.1
Osteoarthritis Osteoarthritis $6.7 $6.7 -- $7.4 billion Diabetes TypeDiabetes Type--II II
$18.4 $18.4 -- $20.5 $20.5 billion
$7.4 billion
billion
Source of data: Reference 73.
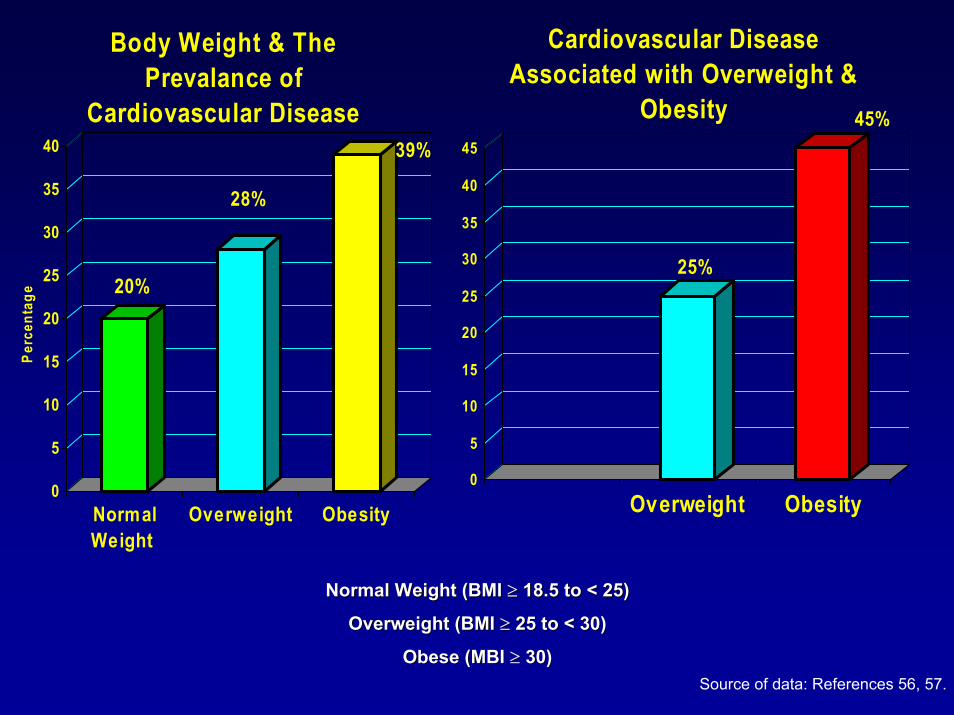
20%
28%
39%
0
5
10
15
20
25
30
35
40
Perc
enta
ge
NormalWeight
Overweight Obesity
Body Weight & The Prevalance of
Cardiovascular Disease
25%
45%
0
5
10
15
20
25
30
35
40
45
Overweight Obesity
Cardiovascular Disease Associated with Overweight &
Obesity
Normal Weight (BMI Normal Weight (BMI ≥≥ 18.5 to < 25)18.5 to < 25)
Overweight (BMI Overweight (BMI ≥≥ 25 to < 30)25 to < 30)
Obese (MBI Obese (MBI ≥≥ 30)30)Source of data: References 56, 57.
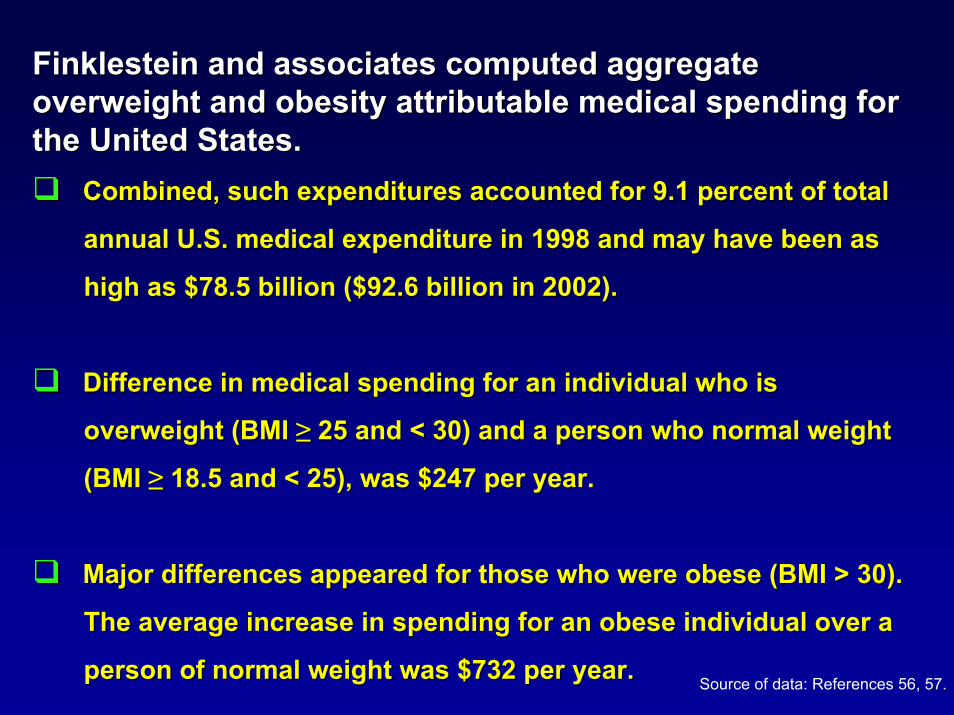
Finklestein and associates computed aggregate Finklestein and associates computed aggregate overweight and obesity attributable medical spending for overweight and obesity attributable medical spending for the United States.the United States.
Combined, such expenditures accounted for 9.1 percent of total Combined, such expenditures accounted for 9.1 percent of total
annual U.S. medical expenditure in 1998 and may have beenannual U.S. medical expenditure in 1998 and may have been as as
high as $78.5 billion ($92.6 billion in 2002). high as $78.5 billion ($92.6 billion in 2002).
Difference in medical spending for an individual who is Difference in medical spending for an individual who is
overweight (BMI overweight (BMI ≥≥ 25 and < 30) and a person who normal weight25 and < 30) and a person who normal weight
(BMI (BMI ≥≥ 18.5 and < 25), was $247 per year. 18.5 and < 25), was $247 per year.
Major differences appeared for those who were obese (BMI > 30Major differences appeared for those who were obese (BMI > 30).).
The average increase in spending for an obese individual The average increase in spending for an obese individual over a over a
person of normal weight was $732 per year.person of normal weight was $732 per year. Source of data: References 56, 57.
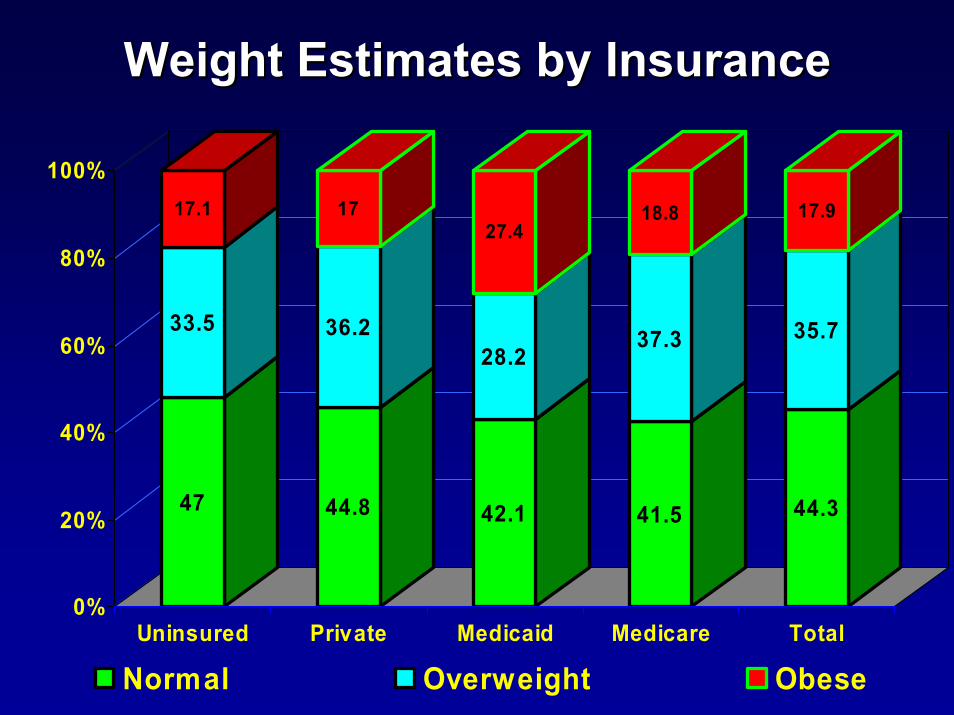
Weight Estimates by Insurance Weight Estimates by Insurance
47
33.5
17.1
44.8
36.2
17
42.1
28.2
27.4
41.5
37.3
18.8
44.3
35.7
17.9
0%
20%
40%
60%
80%
100%
Uninsured Private Medicaid Medicare Total
Normal Overweight Obese
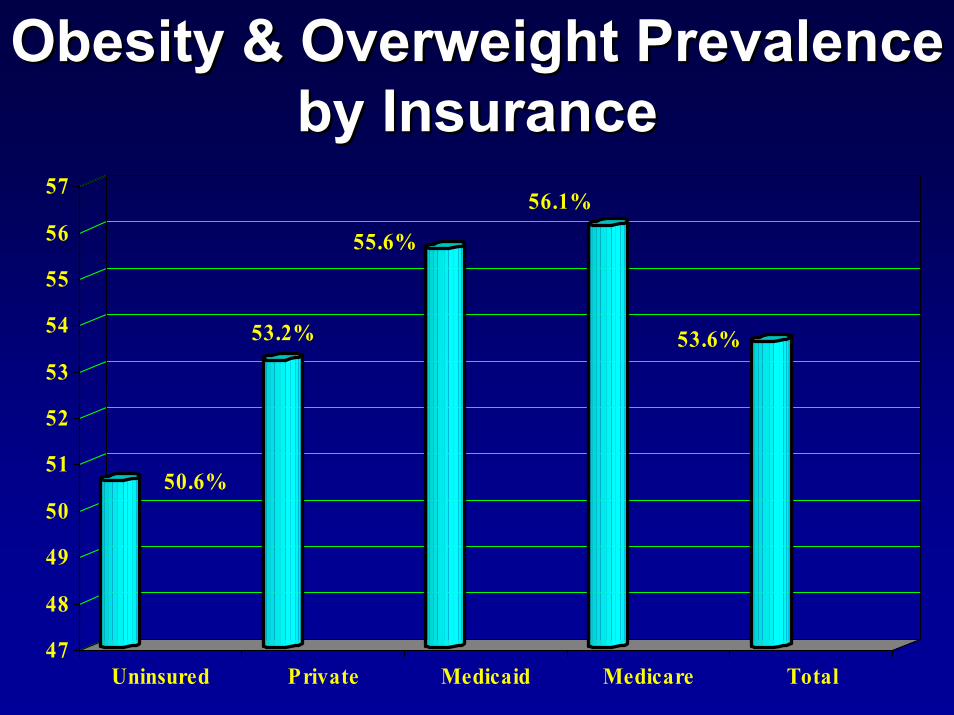
Obesity & Overweight Prevalence Obesity & Overweight Prevalence by Insurance by Insurance
50.6%
53.2%
55.6%
56.1%
53.6%
47
48
49
50
51
52
53
54
55
56
57
Uninsured Private Medicaid Medicare Total
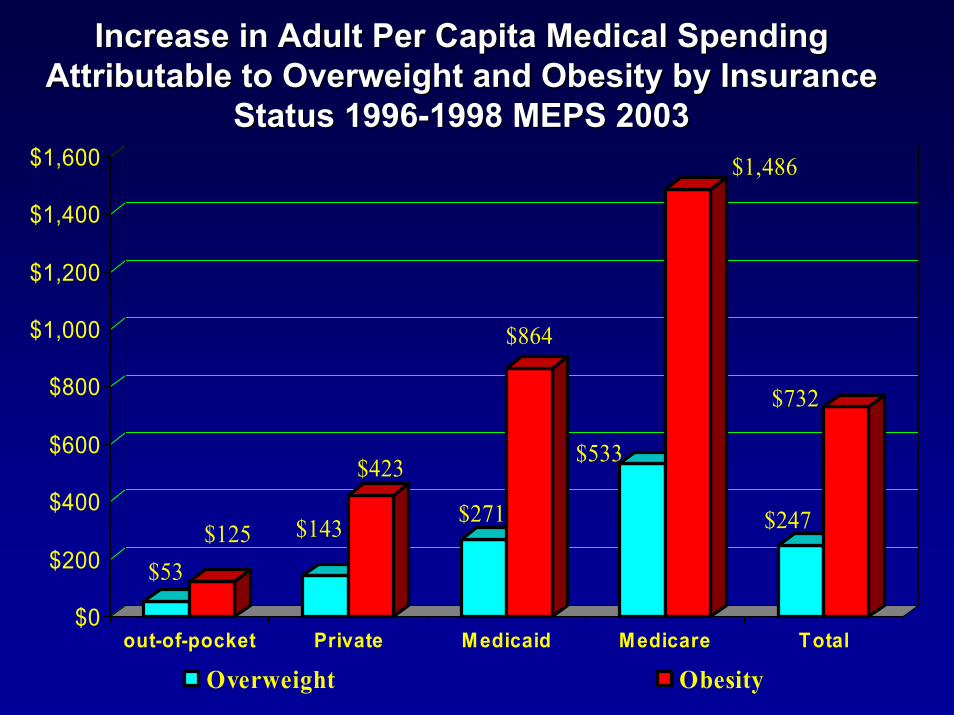
Increase in Adult Per Capita Medical Spending Increase in Adult Per Capita Medical Spending Attributable to Overweight and Obesity by Insurance Attributable to Overweight and Obesity by Insurance
Status 1996Status 1996--1998 MEPS 20031998 MEPS 2003
$53$125 $143
$423
$271
$864
$533
$1,486
$247
$732
$0
$200
$400
$600
$800
$1,000
$1,200
$1,400
$1,600
out-of-pocket Private Medicaid Medicare Total
Overweight Obesity
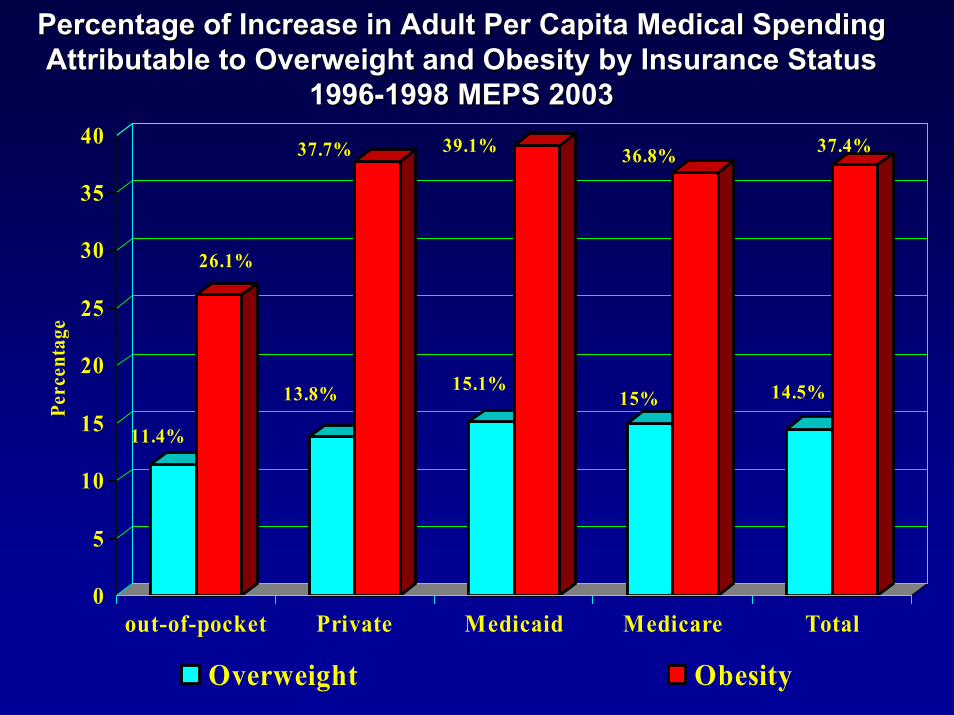
Percentage of Increase in Adult Per Capita Medical Spending Percentage of Increase in Adult Per Capita Medical Spending Attributable to Overweight and Obesity by Insurance Status Attributable to Overweight and Obesity by Insurance Status
19961996--1998 MEPS 20031998 MEPS 2003
11.4%
26.1%
13.8%
37.7%
15.1%
39.1%
15%
36.8%
14.5%
37.4%
0
5
10
15
20
25
30
35
40
Perc
enta
ge
out-of-pocket Private Medicaid Medicare Total
Overweight Obesity
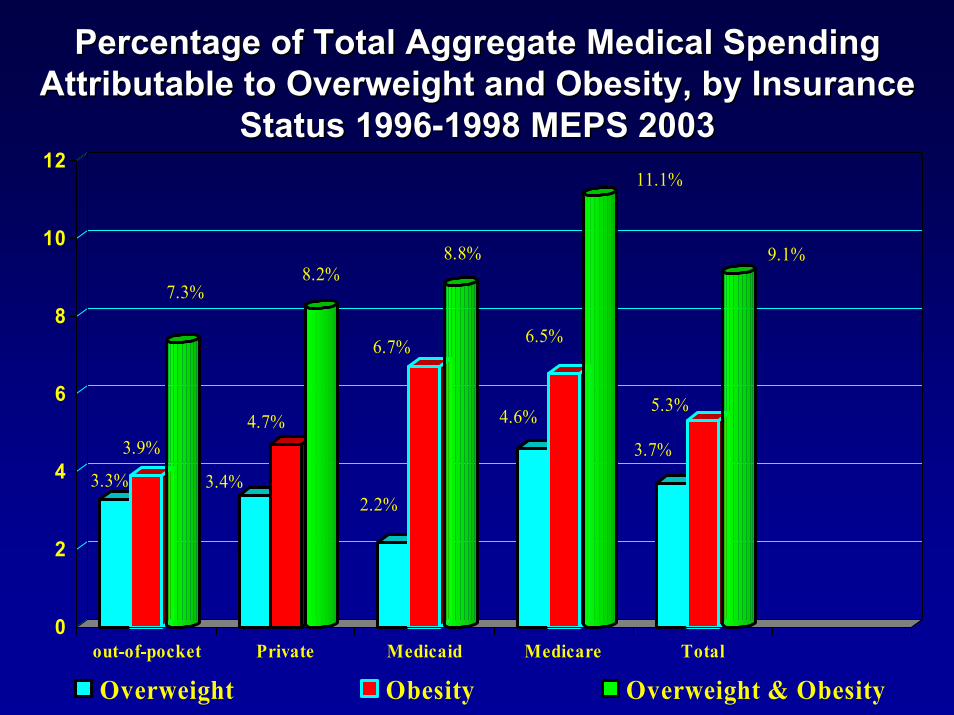
Percentage of Total Aggregate Medical Spending Percentage of Total Aggregate Medical Spending Attributable to Overweight and Obesity, by Insurance Attributable to Overweight and Obesity, by Insurance
Status 1996Status 1996--1998 MEPS 20031998 MEPS 2003
3.3%
3.9%
7.3%
3.4%
4.7%
8.2%
2.2%
6.7%
8.8%
4.6%
6.5%
11.1%
3.7%
5.3%
9.1%
0
2
4
6
8
10
12
out-of-pocket Private Medicaid Medicare Total
Overweight Obesity Overweight & Obesity
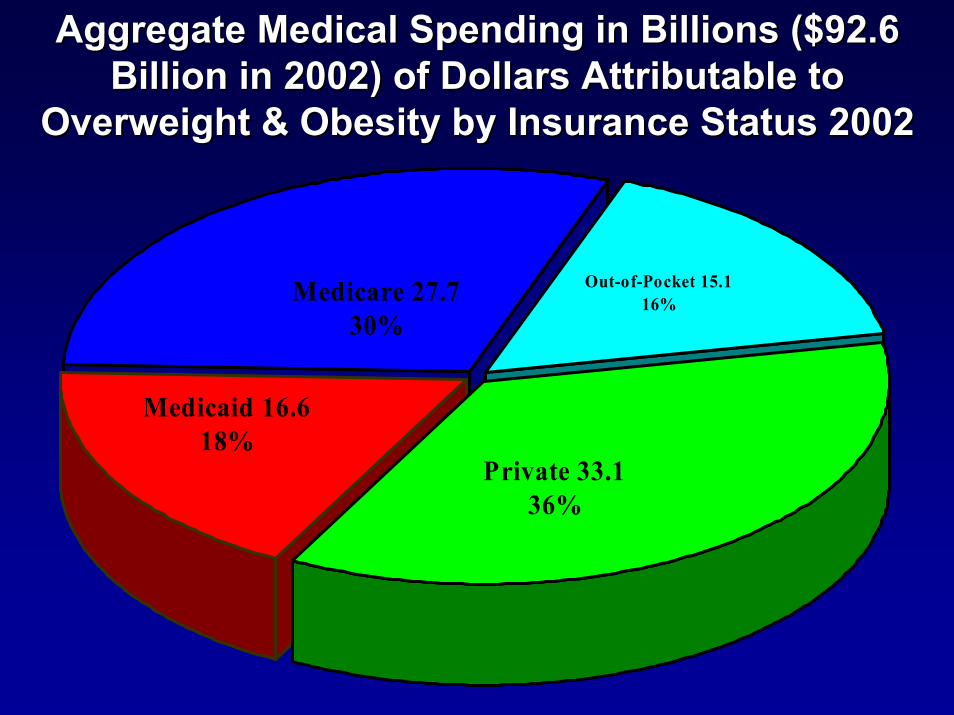
Aggregate Medical Spending in Billions ($92.6 Aggregate Medical Spending in Billions ($92.6 Billion in 2002) of Dollars Attributable to Billion in 2002) of Dollars Attributable to
Overweight & Obesity by Insurance Status 2002 Overweight & Obesity by Insurance Status 2002
Medicare 27.730%
Medicaid 16.6 18%
Private 33.136%
Out-of-Pocket 15.116%
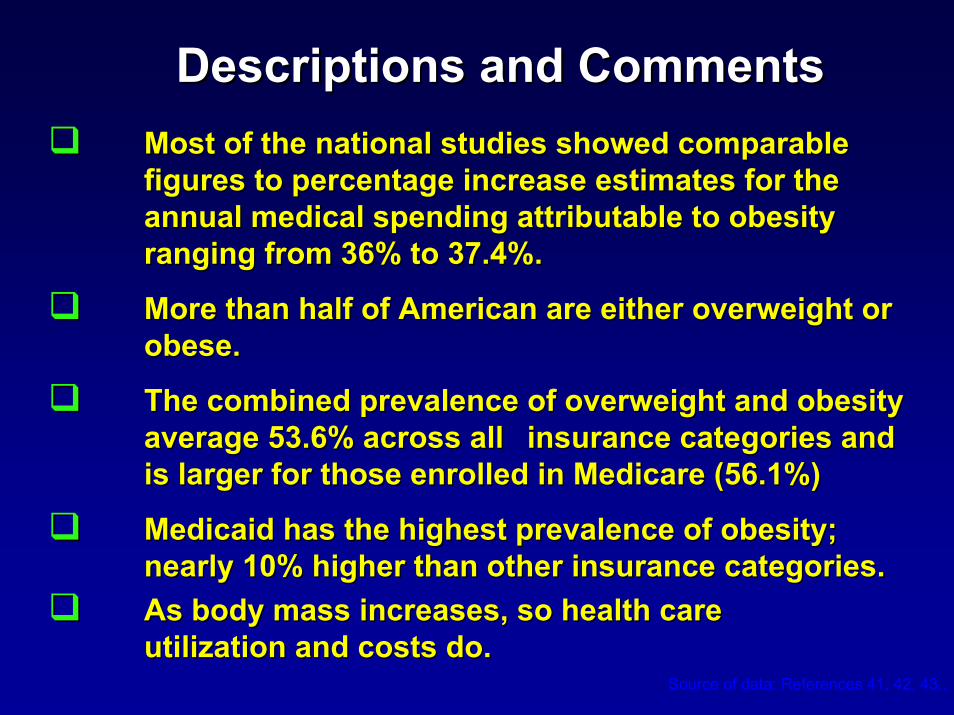
Descriptions and Comments Descriptions and Comments Most of the national studies showed comparable Most of the national studies showed comparable figures to percentage increase estimates for the figures to percentage increase estimates for the annual medical spending attributable to obesity annual medical spending attributable to obesity ranging from 36% to 37.4%.ranging from 36% to 37.4%.
More than half of American are either overweight or More than half of American are either overweight or obese.obese.
The combined prevalence of overweight and obesity The combined prevalence of overweight and obesity average 53.6% across all average 53.6% across all insurance categories and insurance categories and is larger for those enrolled in Medicare (56.1%)is larger for those enrolled in Medicare (56.1%)
Medicaid has the highest prevalence of obesity; Medicaid has the highest prevalence of obesity; nearly 10% higher than other insurance categories. nearly 10% higher than other insurance categories. As body mass increases, so health care As body mass increases, so health care utilization and costs do.utilization and costs do.
Source of data: References 41, 42, 43..
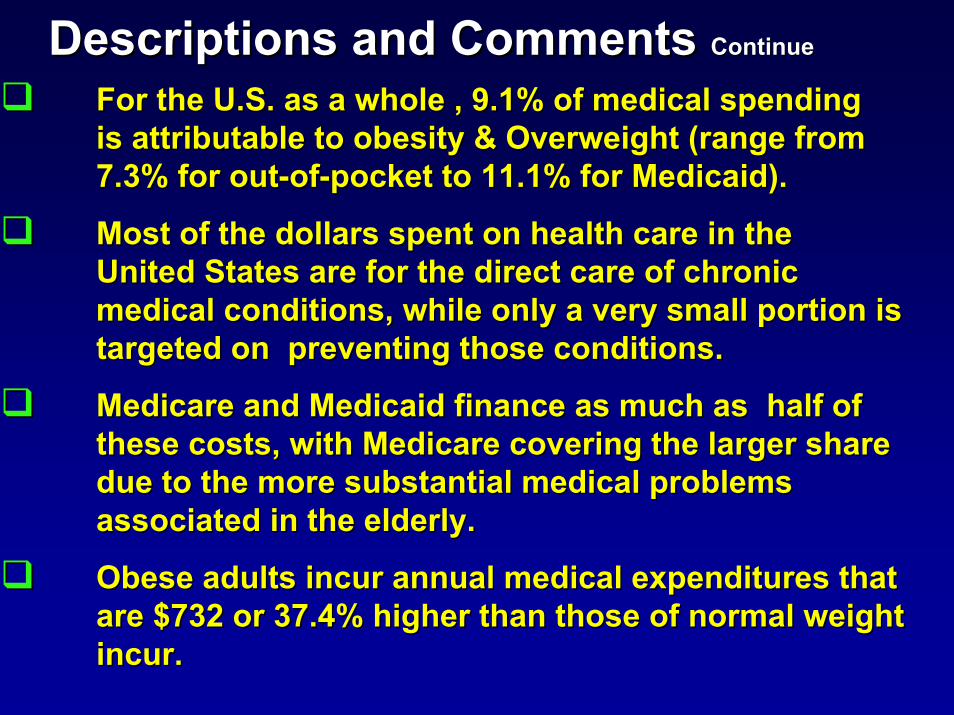
Descriptions and Comments Descriptions and Comments Continue Continue
For the U.S. as a whole , 9.1% of medical spending For the U.S. as a whole , 9.1% of medical spending is attributable to obesity & Overweight (range from is attributable to obesity & Overweight (range from 7.3% for out7.3% for out--ofof--pocket to 11.1% for Medicaid).pocket to 11.1% for Medicaid).
Most of the dollars spent on health care in the Most of the dollars spent on health care in the United States are for the direct care of chronic United States are for the direct care of chronic medical conditions, while only a very small portion is medical conditions, while only a very small portion is targeted on targeted on preventing those conditions.preventing those conditions.
Medicare and Medicaid finance as much as Medicare and Medicaid finance as much as half of half of these costs, with Medicare covering the larger share these costs, with Medicare covering the larger share due to the more substantial medical problems due to the more substantial medical problems associated in the elderly.associated in the elderly.
Obese adults incur annual medical expenditures that Obese adults incur annual medical expenditures that are $732 or 37.4% higher than those of normal weight are $732 or 37.4% higher than those of normal weight incur.incur.
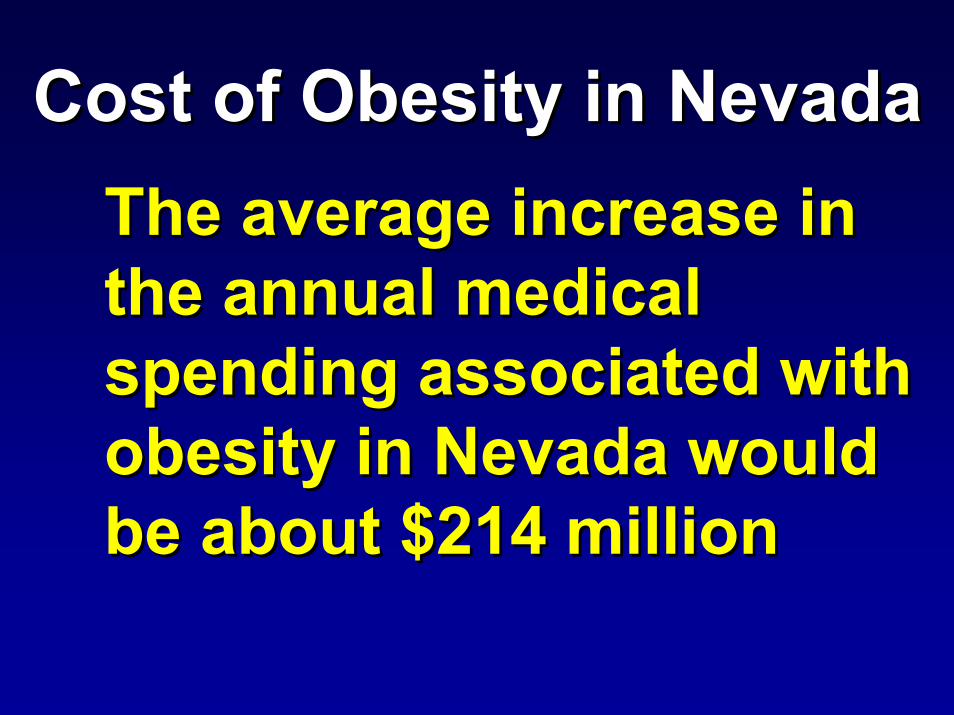
Cost of Obesity in Nevada Cost of Obesity in Nevada The average increase in The average increase in the annual medical the annual medical spending associated with spending associated with obesity in Nevada would obesity in Nevada would be about $214 million be about $214 million
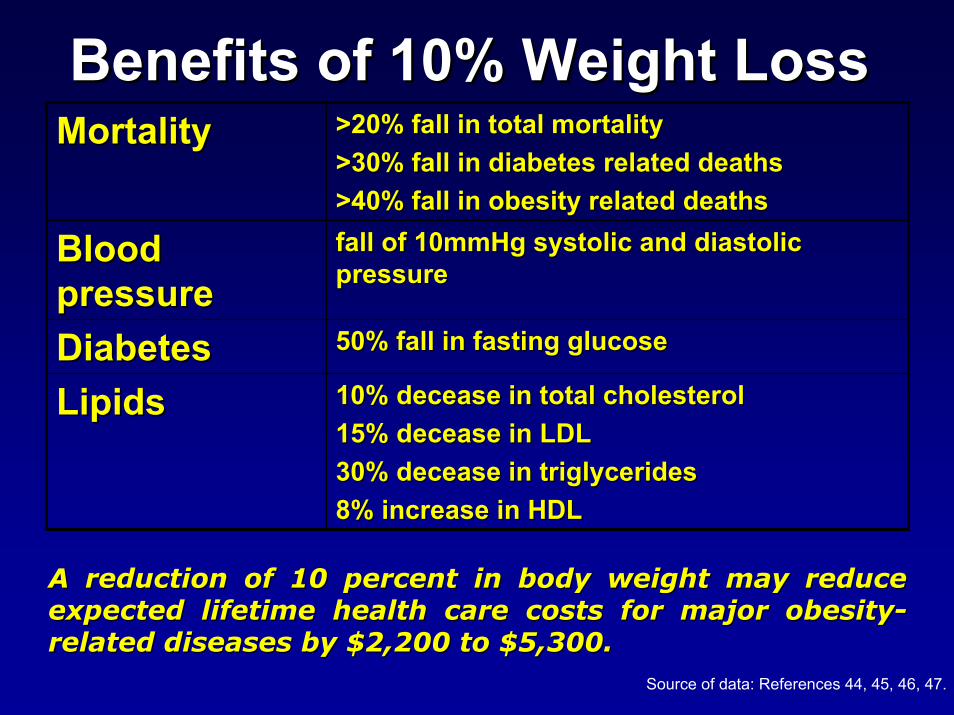
Benefits of 10% Weight LossBenefits of 10% Weight Loss
10% decease in total cholesterol10% decease in total cholesterol15% decease in LDL15% decease in LDL30% decease in triglycerides30% decease in triglycerides8% increase in HDL8% increase in HDL
LipidsLipids50% fall in fasting glucose50% fall in fasting glucoseDiabetesDiabetes
fall of 10mmHg systolic and diastolic fall of 10mmHg systolic and diastolic pressurepressure
Blood Blood pressurepressure
>20% fall in total mortality>20% fall in total mortality>30% fall in diabetes related deaths>30% fall in diabetes related deaths>40% fall in obesity related deaths>40% fall in obesity related deaths
MortalityMortality
A reduction of 10 percent in body weight may reduce A reduction of 10 percent in body weight may reduce expected lifetime health care costs for major obesityexpected lifetime health care costs for major obesity--related diseases by $2,200 to $5,300. related diseases by $2,200 to $5,300.
Source of data: References 44, 45, 46, 47.
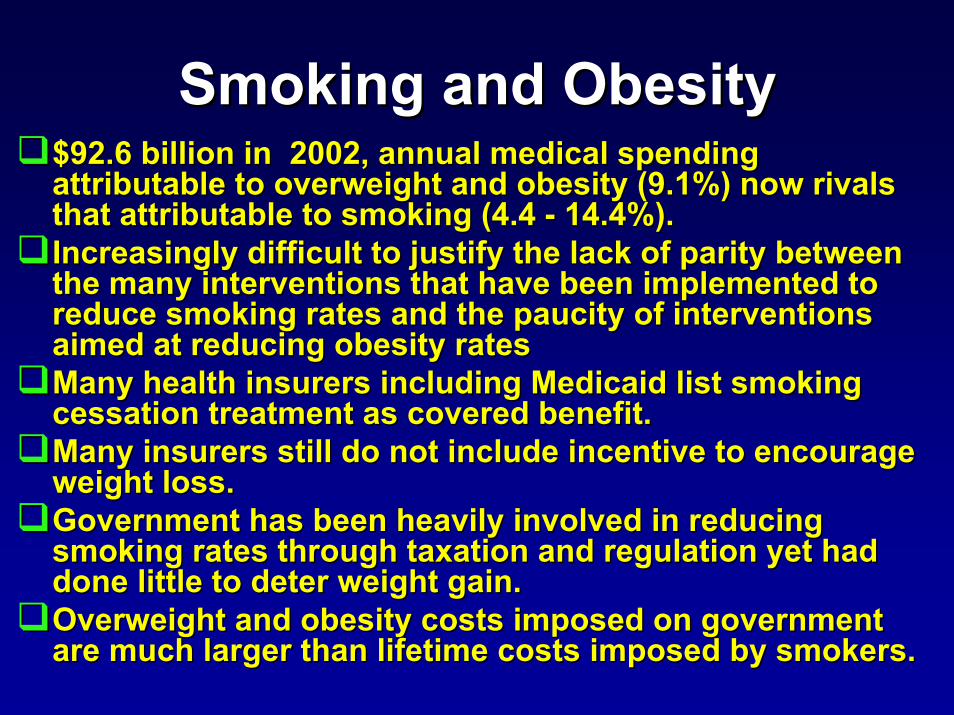
Smoking and Obesity Smoking and Obesity $92.6 billion in 2002, annual medical spending $92.6 billion in 2002, annual medical spending attributable to overweight and obesity (9.1%) now rivals attributable to overweight and obesity (9.1%) now rivals that attributable to smoking (4.4 that attributable to smoking (4.4 -- 14.4%).14.4%).Increasingly difficult to justify the lack of parity between Increasingly difficult to justify the lack of parity between the many interventions that have been implemented to the many interventions that have been implemented to reduce smoking rates and the paucity of interventions reduce smoking rates and the paucity of interventions aimed at reducing obesity ratesaimed at reducing obesity ratesMany health insurers including Medicaid list smoking Many health insurers including Medicaid list smoking cessation treatment as covered benefit.cessation treatment as covered benefit.Many insurers still do not include incentive to encourage Many insurers still do not include incentive to encourage weight loss.weight loss.Government has been heavily involved in reducing Government has been heavily involved in reducing smoking rates through taxation and regulation yet had smoking rates through taxation and regulation yet had done little to deter weight gain.done little to deter weight gain.Overweight and obesity costs imposed on government Overweight and obesity costs imposed on government are much larger than lifetime costs imposed by smokers.are much larger than lifetime costs imposed by smokers.
““So many of our health problems So many of our health problems can be avoided through diet, can be avoided through diet,
exercise and making sure we take exercise and making sure we take care of ourselves. By promoting care of ourselves. By promoting
healthy lifestyles, we can improve healthy lifestyles, we can improve the quality of life for all the quality of life for all
Americans, and reduce health care Americans, and reduce health care costs dramaticallycosts dramatically." ." Tommy G. Tommy G.
Thompson, Secretary of the U.S. Thompson, Secretary of the U.S. Department of Health and Human Department of Health and Human
Services (DHHS). Services (DHHS).